tensile testing of metals proficiency testing program
TRANSCRIPT

REPORT NO. 1250
Tensile Testing of Metals
Proficiency Testing Program
Round 14
June 2021
ACKNOWLEDGMENTS
PTA wishes to gratefully acknowledge the technical assistance provided for this program by Mr S Sameem, ARL Laboratory Services Pty Ltd. Also our thanks go to ARL Laboratory Services Pty Ltd, for the supply and homogeneity testing of the samples. - © Copyright Proficiency Testing Australia 2021
PO Box 7507 Silverwater NSW 2128 AUSTRALIA
SD 2.12.19
CONTENTS
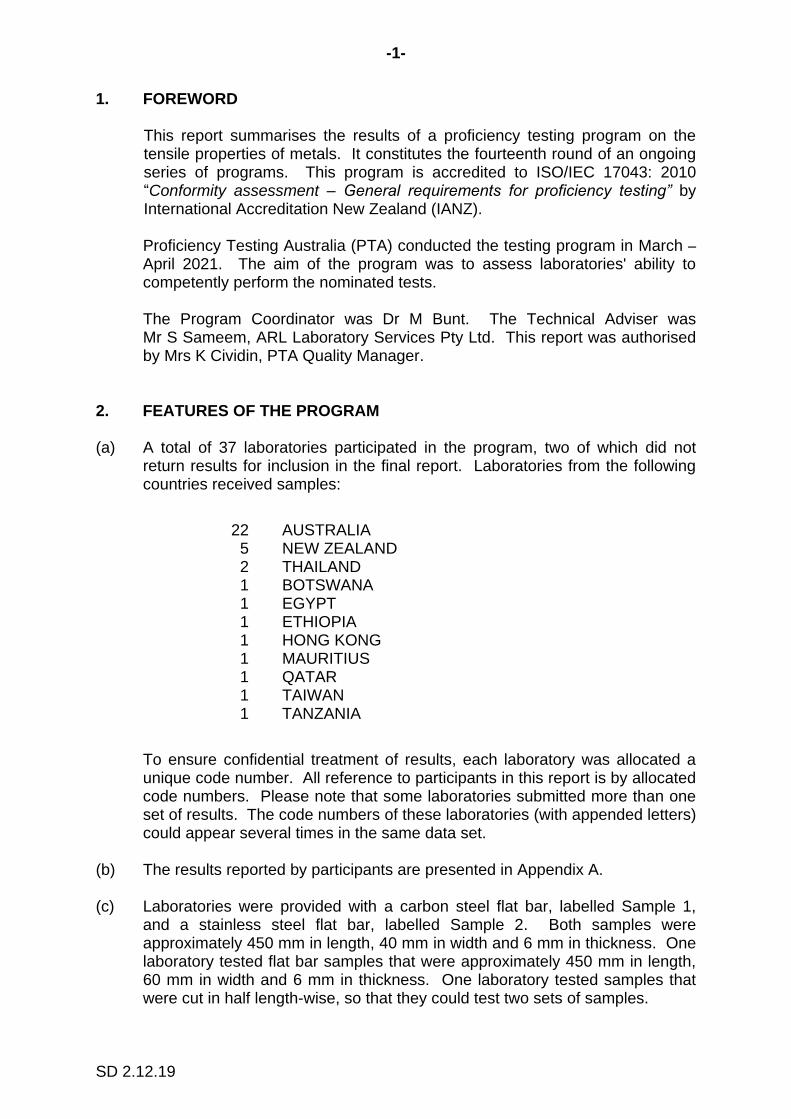
1. FOREWORD 1
2. FEATURES OF THE PROGRAM 1
3. FORMAT OF THE APPENDICES 2
4. DESIGN OF THE PROGRAM 3
5. OUTLIER RESULTS 4
Table A: Summary Statistics for All Tests 4
Table B: Summary of Statistical Outliers 5
6. PTA AND TECHNICAL ADVISER'S COMMENTS 5
7. REFERENCES 14 APPENDICES
APPENDIX A
Summary of Results
0.2% Proof Stress A1.1
Lower Yield A2.1
Upper Yield A3.1
Tensile Strength A4.1
Percentage Elongation after Fracture A5.1
Method Information and Other Reported Results A6.1
APPENDIX B
Homogeneity Testing B1.1
APPENDIX C
Instructions to Participants C1.1
Results Sheet C2.1
-1-
SD 2.12.19
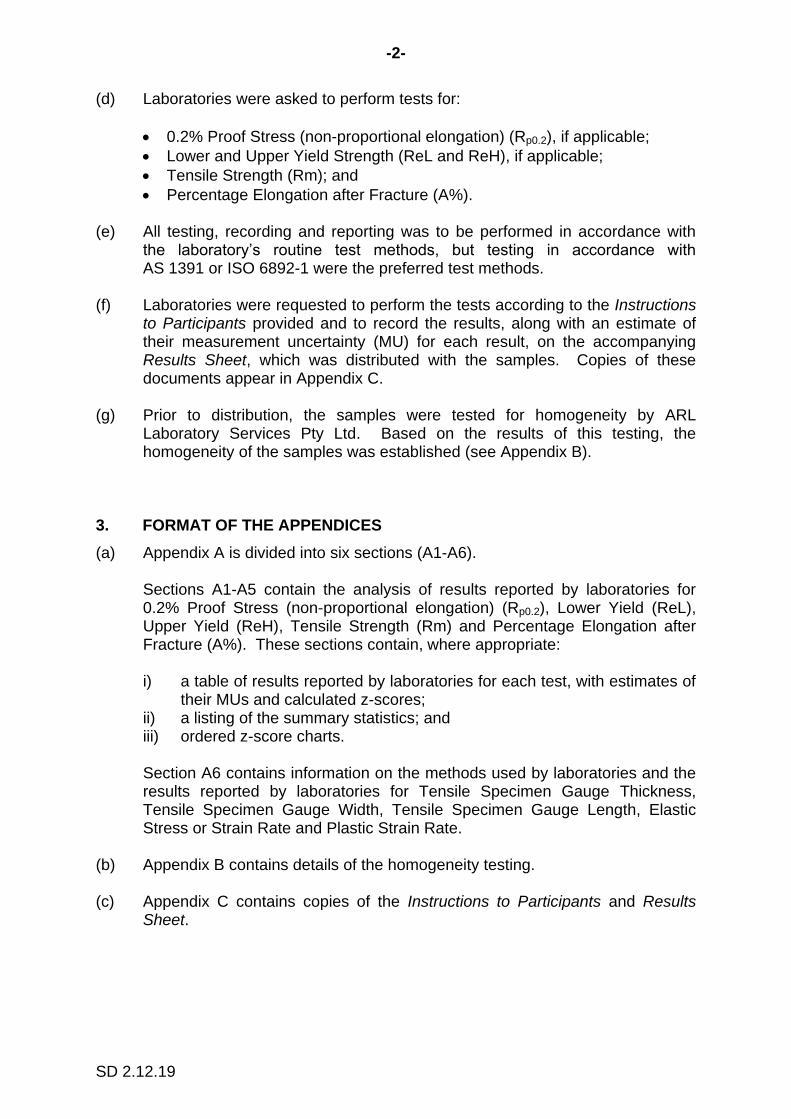
1. FOREWORD This report summarises the results of a proficiency testing program on the
tensile properties of metals. It constitutes the fourteenth round of an ongoing series of programs. This program is accredited to ISO/IEC 17043: 2010 “Conformity assessment – General requirements for proficiency testing” by International Accreditation New Zealand (IANZ).
Proficiency Testing Australia (PTA) conducted the testing program in March –
April 2021. The aim of the program was to assess laboratories' ability to competently perform the nominated tests.
The Program Coordinator was Dr M Bunt. The Technical Adviser was
Mr S Sameem, ARL Laboratory Services Pty Ltd. This report was authorised by Mrs K Cividin, PTA Quality Manager.
2. FEATURES OF THE PROGRAM (a) A total of 37 laboratories participated in the program, two of which did not
return results for inclusion in the final report. Laboratories from the following countries received samples:
22 AUSTRALIA 5 NEW ZEALAND 2 THAILAND 1 BOTSWANA 1 EGYPT 1 ETHIOPIA 1 HONG KONG 1 MAURITIUS 1 QATAR 1 TAIWAN 1 TANZANIA
To ensure confidential treatment of results, each laboratory was allocated a unique code number. All reference to participants in this report is by allocated code numbers. Please note that some laboratories submitted more than one set of results. The code numbers of these laboratories (with appended letters) could appear several times in the same data set.
(b) The results reported by participants are presented in Appendix A.
(c) Laboratories were provided with a carbon steel flat bar, labelled Sample 1, and a stainless steel flat bar, labelled Sample 2. Both samples were approximately 450 mm in length, 40 mm in width and 6 mm in thickness. One laboratory tested flat bar samples that were approximately 450 mm in length, 60 mm in width and 6 mm in thickness. One laboratory tested samples that were cut in half length-wise, so that they could test two sets of samples.
-2-
SD 2.12.19
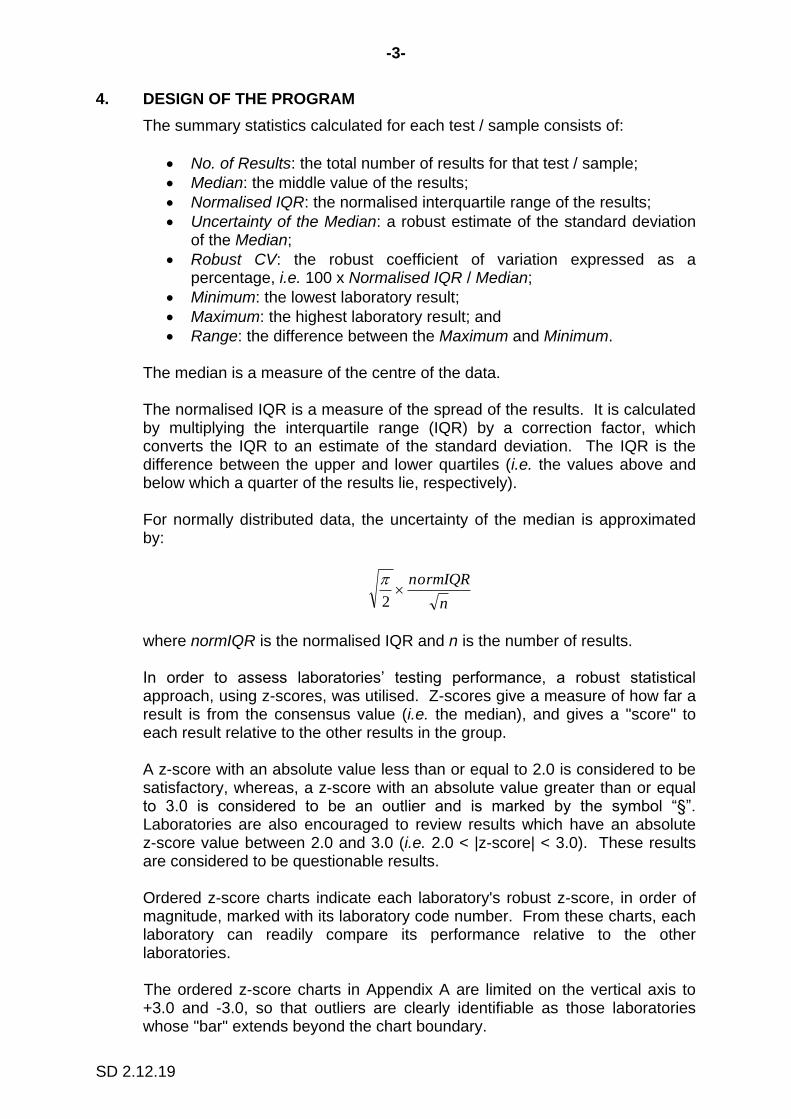
(d) Laboratories were asked to perform tests for:
0.2% Proof Stress (non-proportional elongation) (Rp0.2), if applicable;
Lower and Upper Yield Strength (ReL and ReH), if applicable;
Tensile Strength (Rm); and
Percentage Elongation after Fracture (A%).
(e) All testing, recording and reporting was to be performed in accordance with the laboratory’s routine test methods, but testing in accordance with AS 1391 or ISO 6892-1 were the preferred test methods.
(f) Laboratories were requested to perform the tests according to the Instructions to Participants provided and to record the results, along with an estimate of their measurement uncertainty (MU) for each result, on the accompanying Results Sheet, which was distributed with the samples. Copies of these documents appear in Appendix C.
(g) Prior to distribution, the samples were tested for homogeneity by ARL
Laboratory Services Pty Ltd. Based on the results of this testing, the homogeneity of the samples was established (see Appendix B).
3. FORMAT OF THE APPENDICES (a) Appendix A is divided into six sections (A1-A6).
Sections A1-A5 contain the analysis of results reported by laboratories for 0.2% Proof Stress (non-proportional elongation) (Rp0.2), Lower Yield (ReL), Upper Yield (ReH), Tensile Strength (Rm) and Percentage Elongation after Fracture (A%). These sections contain, where appropriate: i) a table of results reported by laboratories for each test, with estimates of
their MUs and calculated z-scores; ii) a listing of the summary statistics; and iii) ordered z-score charts.
Section A6 contains information on the methods used by laboratories and the results reported by laboratories for Tensile Specimen Gauge Thickness, Tensile Specimen Gauge Width, Tensile Specimen Gauge Length, Elastic Stress or Strain Rate and Plastic Strain Rate.
(b) Appendix B contains details of the homogeneity testing. (c) Appendix C contains copies of the Instructions to Participants and Results
Sheet.
-3-
SD 2.12.19
4. DESIGN OF THE PROGRAM
The summary statistics calculated for each test / sample consists of:
No. of Results: the total number of results for that test / sample;
Median: the middle value of the results;
Normalised IQR: the normalised interquartile range of the results;
Uncertainty of the Median: a robust estimate of the standard deviation of the Median;
Robust CV: the robust coefficient of variation expressed as a percentage, i.e. 100 x Normalised IQR / Median;
Minimum: the lowest laboratory result;
Maximum: the highest laboratory result; and
Range: the difference between the Maximum and Minimum. The median is a measure of the centre of the data. The normalised IQR is a measure of the spread of the results. It is calculated by multiplying the interquartile range (IQR) by a correction factor, which converts the IQR to an estimate of the standard deviation. The IQR is the difference between the upper and lower quartiles (i.e. the values above and below which a quarter of the results lie, respectively). For normally distributed data, the uncertainty of the median is approximated by:
n
normIQR
2
where normIQR is the normalised IQR and n is the number of results. In order to assess laboratories’ testing performance, a robust statistical approach, using z-scores, was utilised. Z-scores give a measure of how far a result is from the consensus value (i.e. the median), and gives a "score" to each result relative to the other results in the group. A z-score with an absolute value less than or equal to 2.0 is considered to be satisfactory, whereas, a z-score with an absolute value greater than or equal to 3.0 is considered to be an outlier and is marked by the symbol “§”. Laboratories are also encouraged to review results which have an absolute z-score value between 2.0 and 3.0 (i.e. 2.0 < |z-score| < 3.0). These results are considered to be questionable results. Ordered z-score charts indicate each laboratory's robust z-score, in order of magnitude, marked with its laboratory code number. From these charts, each laboratory can readily compare its performance relative to the other laboratories. The ordered z-score charts in Appendix A are limited on the vertical axis to +3.0 and -3.0, so that outliers are clearly identifiable as those laboratories whose "bar" extends beyond the chart boundary.
-4-
SD 2.12.19
For further details on the calculation and interpretation of robust z-scores and ordered z-score charts, please see the Guide to Proficiency Testing Australia (2019).
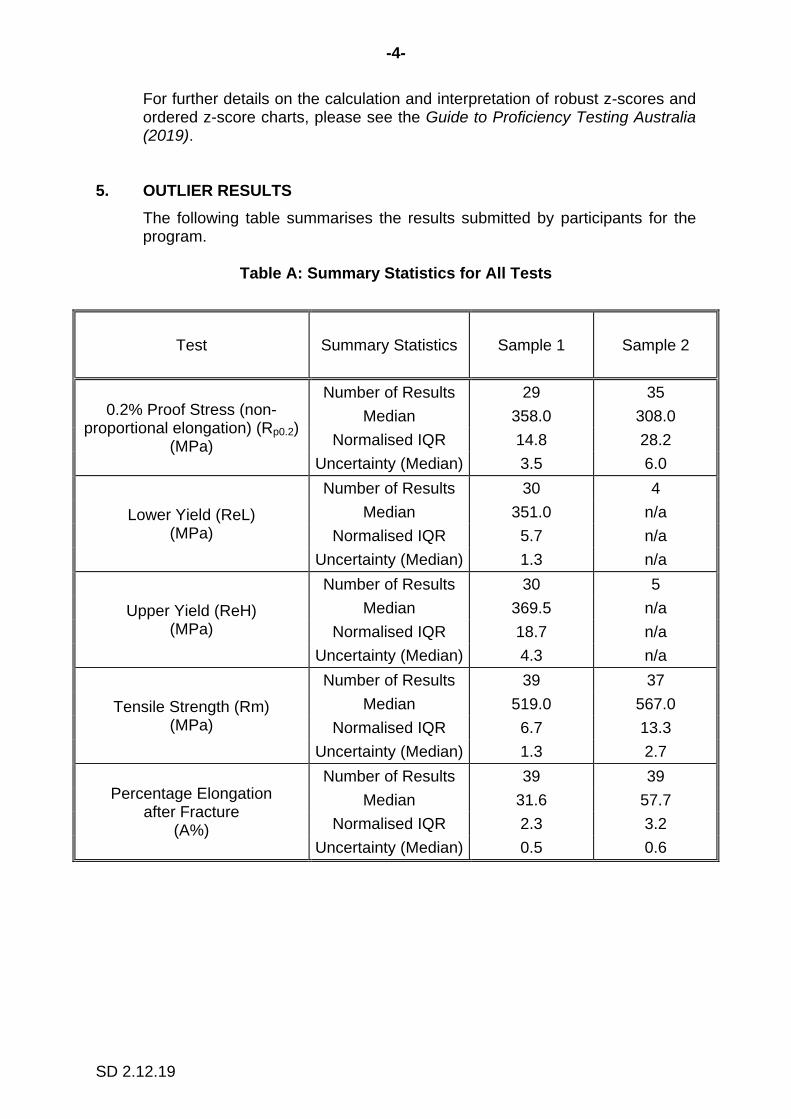
5. OUTLIER RESULTS
The following table summarises the results submitted by participants for the program.
Table A: Summary Statistics for All Tests
Test Summary Statistics Sample 1 Sample 2
0.2% Proof Stress (non-proportional elongation) (Rp0.2)
(MPa)
Number of Results 29 35
Median 358.0 308.0
Normalised IQR 14.8 28.2
Uncertainty (Median) 3.5 6.0
Lower Yield (ReL) (MPa)
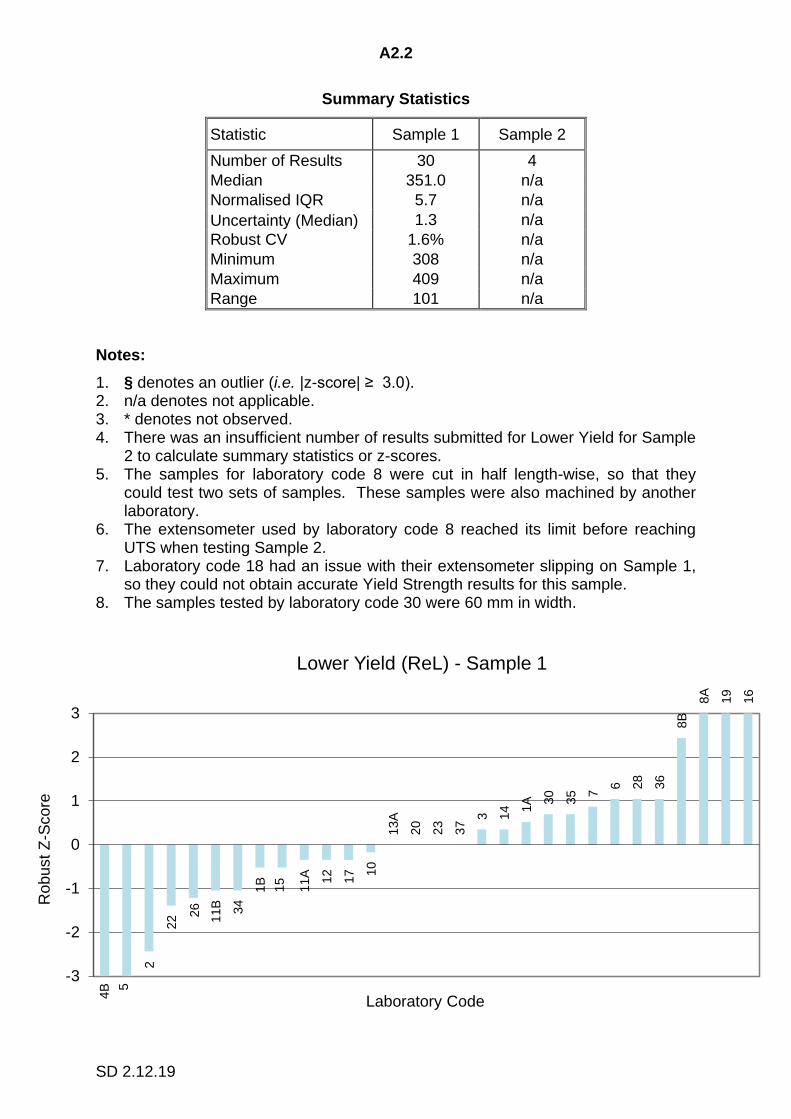
Number of Results 30 4
Median 351.0 n/a
Normalised IQR 5.7 n/a
Uncertainty (Median) 1.3 n/a
Upper Yield (ReH) (MPa)
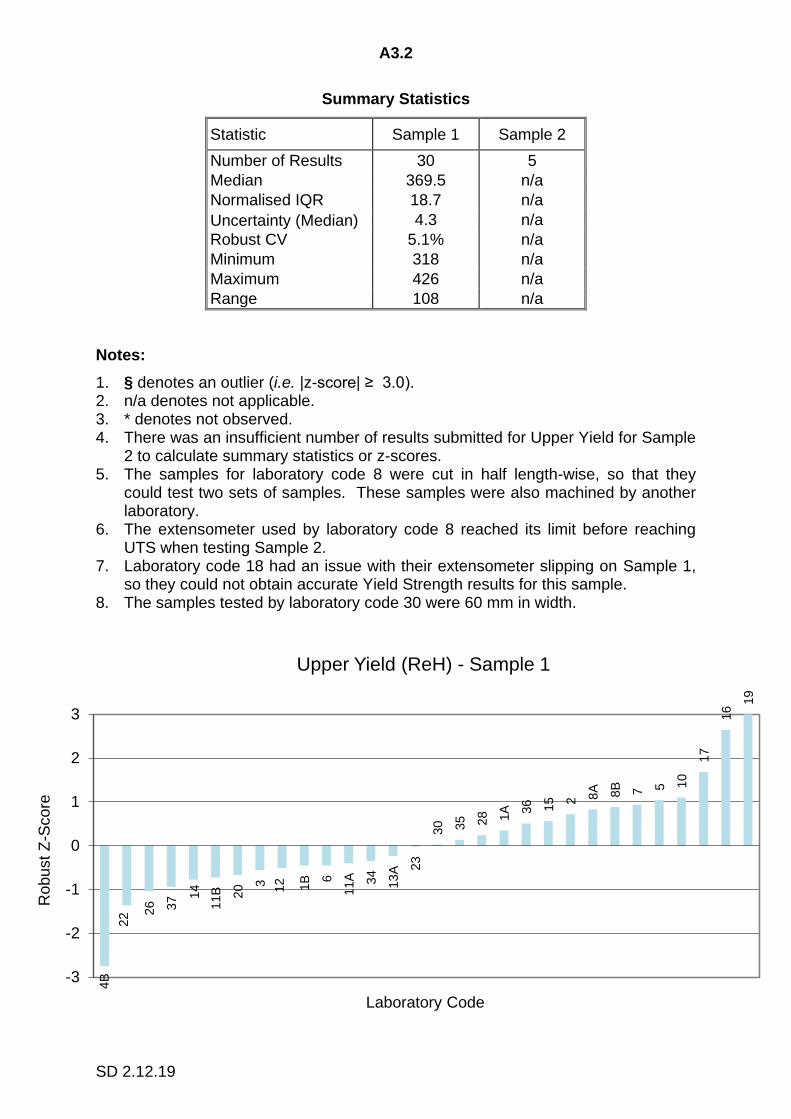
Number of Results 30 5
Median 369.5 n/a
Normalised IQR 18.7 n/a
Uncertainty (Median) 4.3 n/a
Tensile Strength (Rm) (MPa)
Number of Results 39 37
Median 519.0 567.0
Normalised IQR 6.7 13.3
Uncertainty (Median) 1.3 2.7
Percentage Elongation after Fracture
(A%)
Number of Results 39 39
Median 31.6 57.7
Normalised IQR 2.3 3.2
Uncertainty (Median) 0.5 0.6
-5-
SD 2.12.19
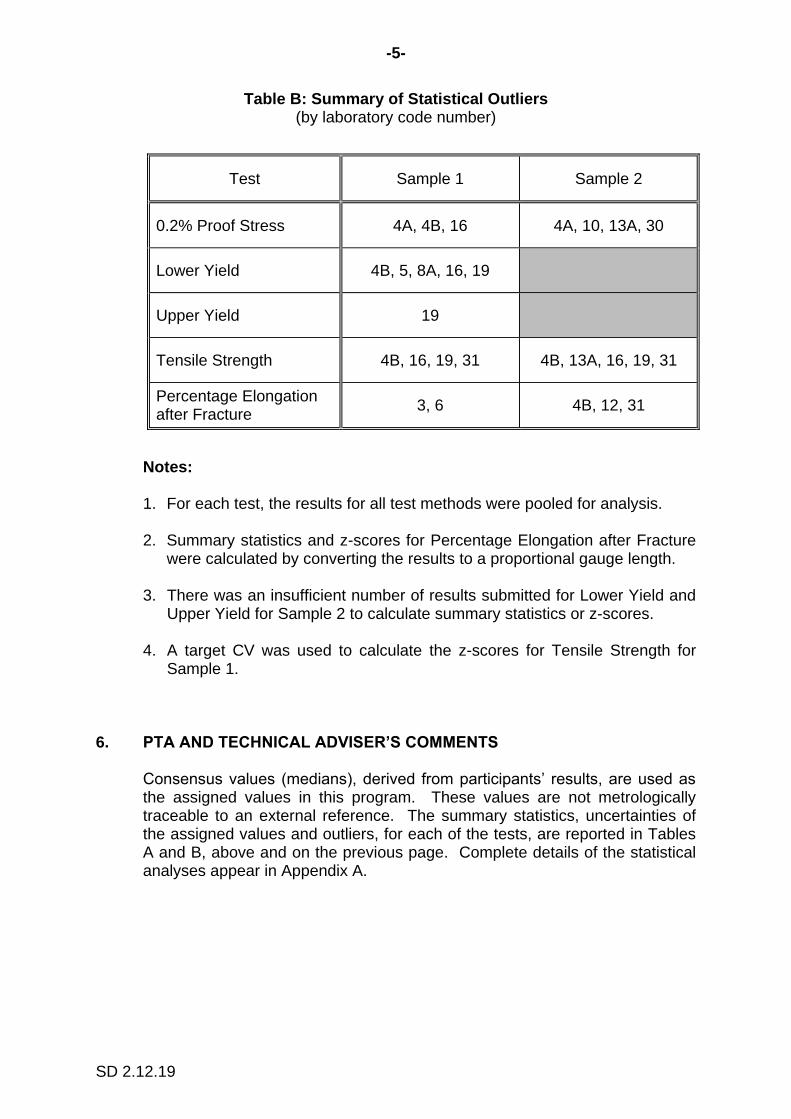
Table B: Summary of Statistical Outliers (by laboratory code number)
Test Sample 1 Sample 2
0.2% Proof Stress 4A, 4B, 16 4A, 10, 13A, 30
Lower Yield 4B, 5, 8A, 16, 19
Upper Yield 19
Tensile Strength 4B, 16, 19, 31 4B, 13A, 16, 19, 31
Percentage Elongation after Fracture
3, 6 4B, 12, 31
Notes: 1. For each test, the results for all test methods were pooled for analysis.
2. Summary statistics and z-scores for Percentage Elongation after Fracture
were calculated by converting the results to a proportional gauge length. 3. There was an insufficient number of results submitted for Lower Yield and
Upper Yield for Sample 2 to calculate summary statistics or z-scores. 4. A target CV was used to calculate the z-scores for Tensile Strength for
Sample 1.
6. PTA AND TECHNICAL ADVISER’S COMMENTS
Consensus values (medians), derived from participants’ results, are used as the assigned values in this program. These values are not metrologically traceable to an external reference. The summary statistics, uncertainties of the assigned values and outliers, for each of the tests, are reported in Tables A and B, above and on the previous page. Complete details of the statistical analyses appear in Appendix A.
-6-
SD 2.12.19
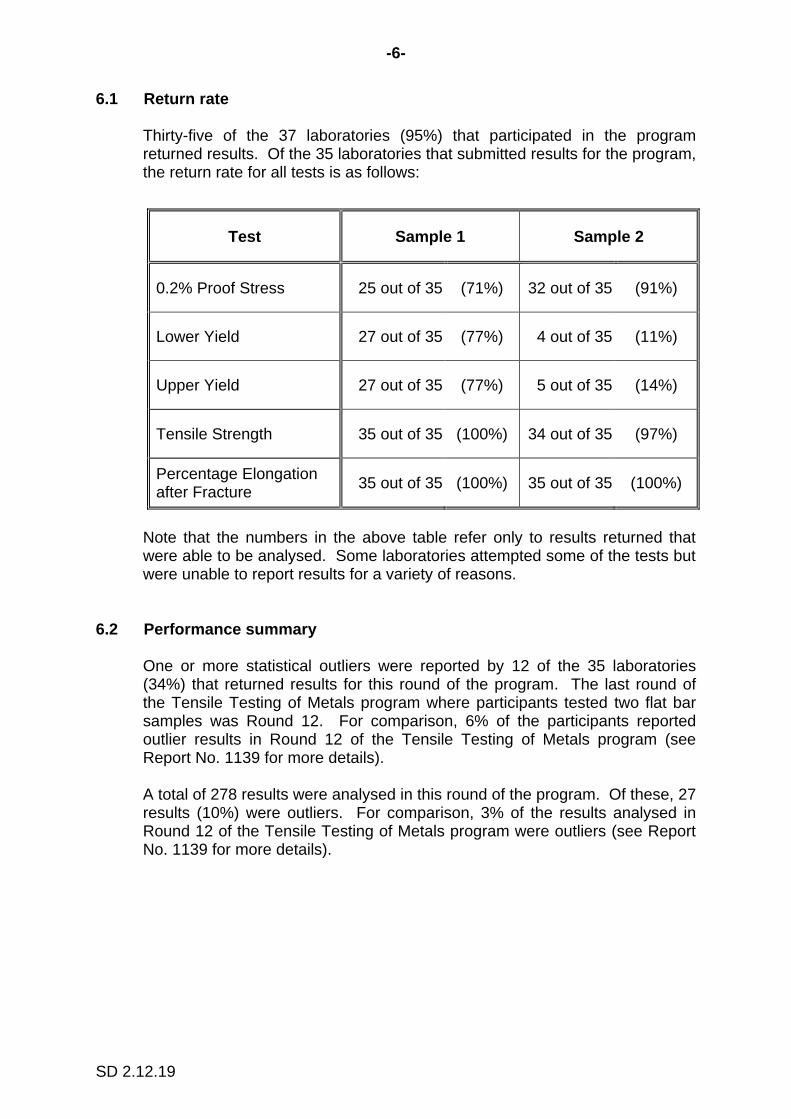
6.1 Return rate
Thirty-five of the 37 laboratories (95%) that participated in the program returned results. Of the 35 laboratories that submitted results for the program, the return rate for all tests is as follows:
Test Sample 1 Sample 2
0.2% Proof Stress 25 out of 35 (71%) 32 out of 35 (91%)
Lower Yield 27 out of 35 (77%) 4 out of 35 (11%)
Upper Yield 27 out of 35 (77%) 5 out of 35 (14%)
Tensile Strength 35 out of 35 (100%) 34 out of 35 (97%)
Percentage Elongation after Fracture
35 out of 35 (100%) 35 out of 35 (100%)
Note that the numbers in the above table refer only to results returned that were able to be analysed. Some laboratories attempted some of the tests but were unable to report results for a variety of reasons.
6.2 Performance summary
One or more statistical outliers were reported by 12 of the 35 laboratories (34%) that returned results for this round of the program. The last round of the Tensile Testing of Metals program where participants tested two flat bar samples was Round 12. For comparison, 6% of the participants reported outlier results in Round 12 of the Tensile Testing of Metals program (see Report No. 1139 for more details). A total of 278 results were analysed in this round of the program. Of these, 27 results (10%) were outliers. For comparison, 3% of the results analysed in Round 12 of the Tensile Testing of Metals program were outliers (see Report No. 1139 for more details).
-7-
SD 2.12.19
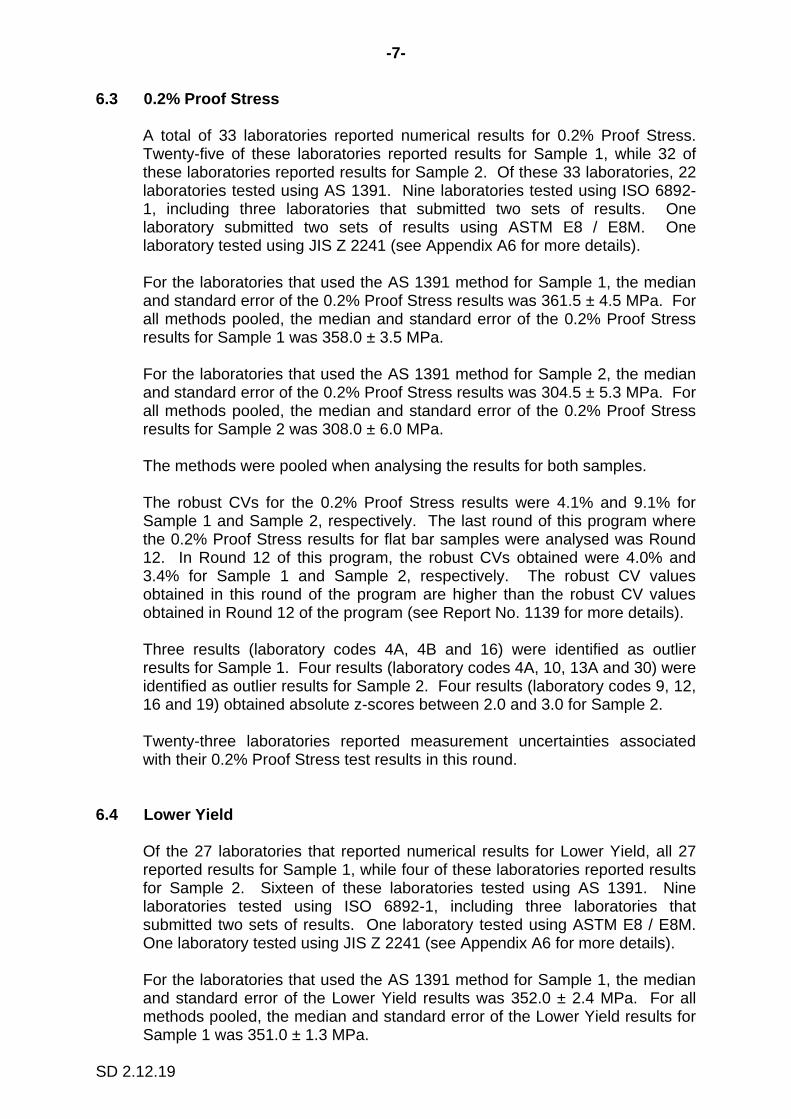
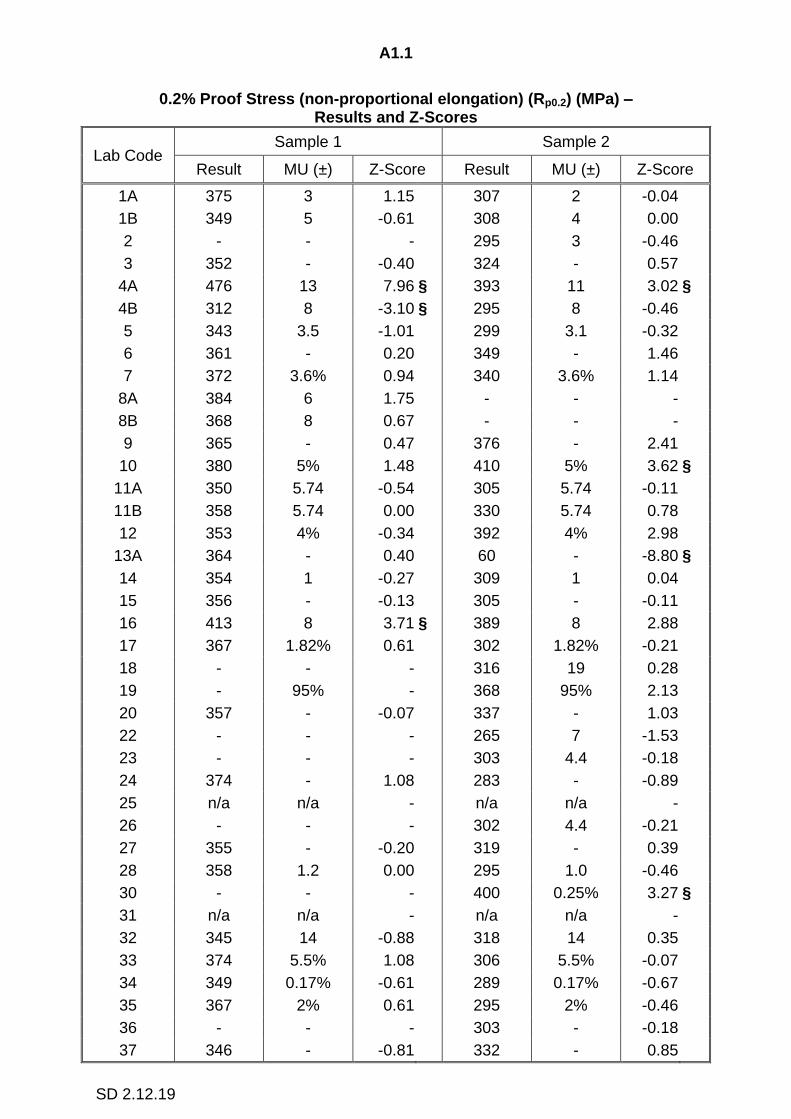
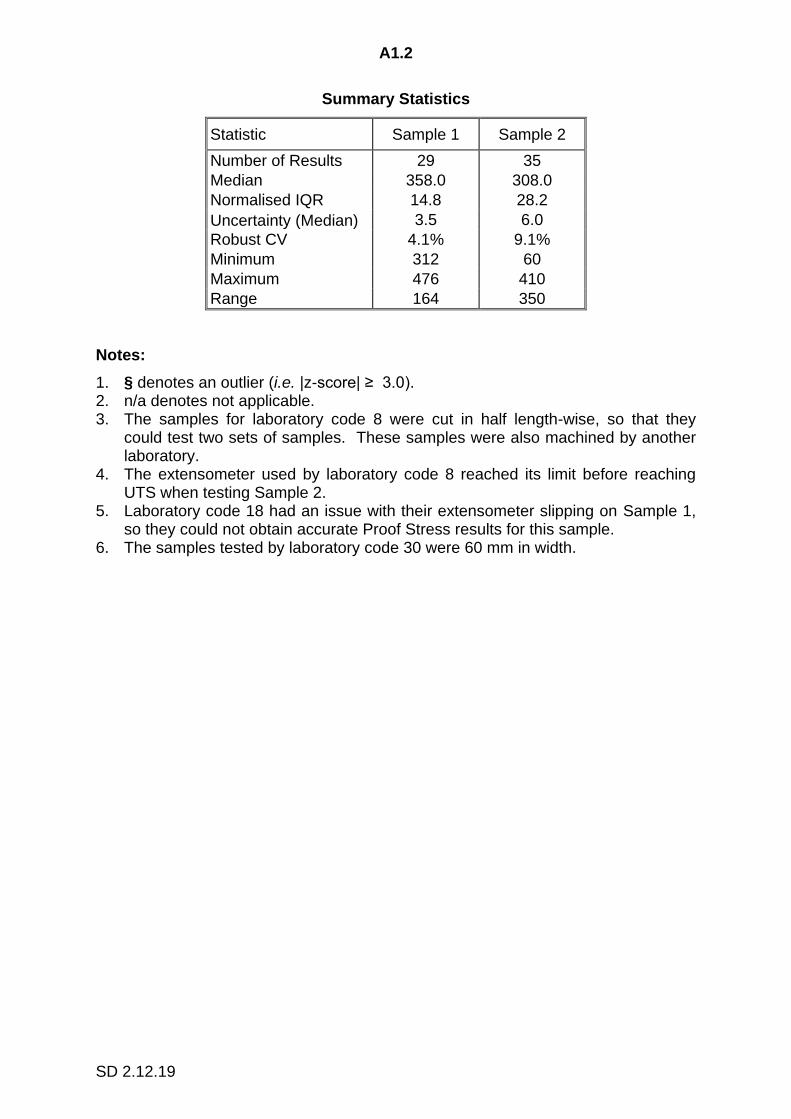
6.3 0.2% Proof Stress
A total of 33 laboratories reported numerical results for 0.2% Proof Stress. Twenty-five of these laboratories reported results for Sample 1, while 32 of these laboratories reported results for Sample 2. Of these 33 laboratories, 22 laboratories tested using AS 1391. Nine laboratories tested using ISO 6892-1, including three laboratories that submitted two sets of results. One laboratory submitted two sets of results using ASTM E8 / E8M. One laboratory tested using JIS Z 2241 (see Appendix A6 for more details). For the laboratories that used the AS 1391 method for Sample 1, the median and standard error of the 0.2% Proof Stress results was 361.5 ± 4.5 MPa. For all methods pooled, the median and standard error of the 0.2% Proof Stress results for Sample 1 was 358.0 ± 3.5 MPa. For the laboratories that used the AS 1391 method for Sample 2, the median and standard error of the 0.2% Proof Stress results was 304.5 ± 5.3 MPa. For all methods pooled, the median and standard error of the 0.2% Proof Stress results for Sample 2 was 308.0 ± 6.0 MPa. The methods were pooled when analysing the results for both samples. The robust CVs for the 0.2% Proof Stress results were 4.1% and 9.1% for Sample 1 and Sample 2, respectively. The last round of this program where the 0.2% Proof Stress results for flat bar samples were analysed was Round 12. In Round 12 of this program, the robust CVs obtained were 4.0% and 3.4% for Sample 1 and Sample 2, respectively. The robust CV values obtained in this round of the program are higher than the robust CV values obtained in Round 12 of the program (see Report No. 1139 for more details). Three results (laboratory codes 4A, 4B and 16) were identified as outlier results for Sample 1. Four results (laboratory codes 4A, 10, 13A and 30) were identified as outlier results for Sample 2. Four results (laboratory codes 9, 12, 16 and 19) obtained absolute z-scores between 2.0 and 3.0 for Sample 2. Twenty-three laboratories reported measurement uncertainties associated with their 0.2% Proof Stress test results in this round.
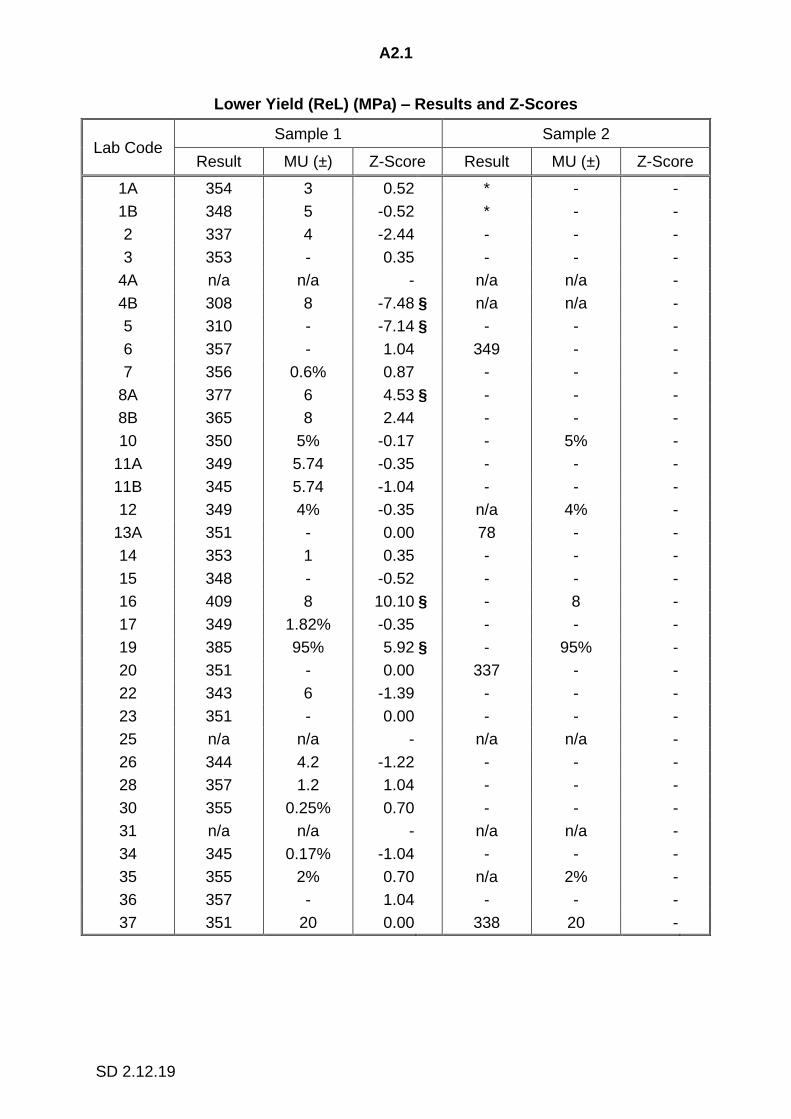
6.4 Lower Yield
Of the 27 laboratories that reported numerical results for Lower Yield, all 27 reported results for Sample 1, while four of these laboratories reported results for Sample 2. Sixteen of these laboratories tested using AS 1391. Nine laboratories tested using ISO 6892-1, including three laboratories that submitted two sets of results. One laboratory tested using ASTM E8 / E8M. One laboratory tested using JIS Z 2241 (see Appendix A6 for more details). For the laboratories that used the AS 1391 method for Sample 1, the median and standard error of the Lower Yield results was 352.0 ± 2.4 MPa. For all methods pooled, the median and standard error of the Lower Yield results for Sample 1 was 351.0 ± 1.3 MPa.
-8-
SD 2.12.19
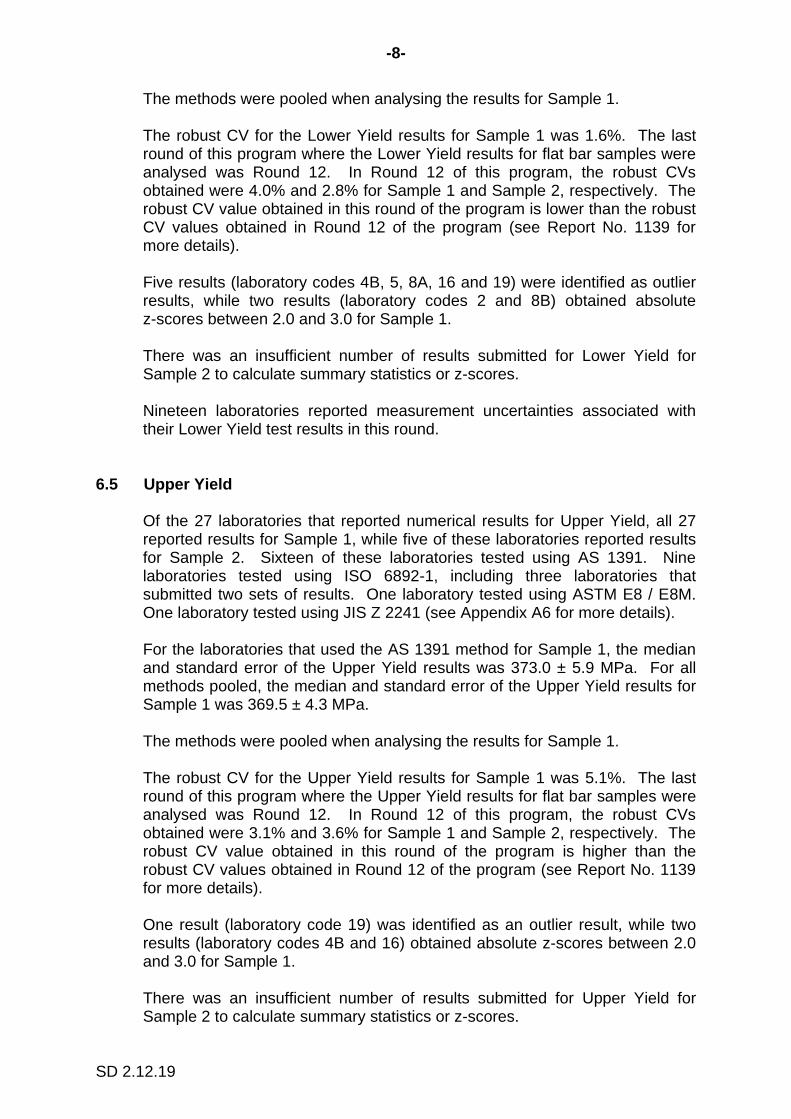
The methods were pooled when analysing the results for Sample 1. The robust CV for the Lower Yield results for Sample 1 was 1.6%. The last round of this program where the Lower Yield results for flat bar samples were analysed was Round 12. In Round 12 of this program, the robust CVs obtained were 4.0% and 2.8% for Sample 1 and Sample 2, respectively. The robust CV value obtained in this round of the program is lower than the robust CV values obtained in Round 12 of the program (see Report No. 1139 for more details). Five results (laboratory codes 4B, 5, 8A, 16 and 19) were identified as outlier results, while two results (laboratory codes 2 and 8B) obtained absolute z-scores between 2.0 and 3.0 for Sample 1. There was an insufficient number of results submitted for Lower Yield for Sample 2 to calculate summary statistics or z-scores. Nineteen laboratories reported measurement uncertainties associated with their Lower Yield test results in this round.
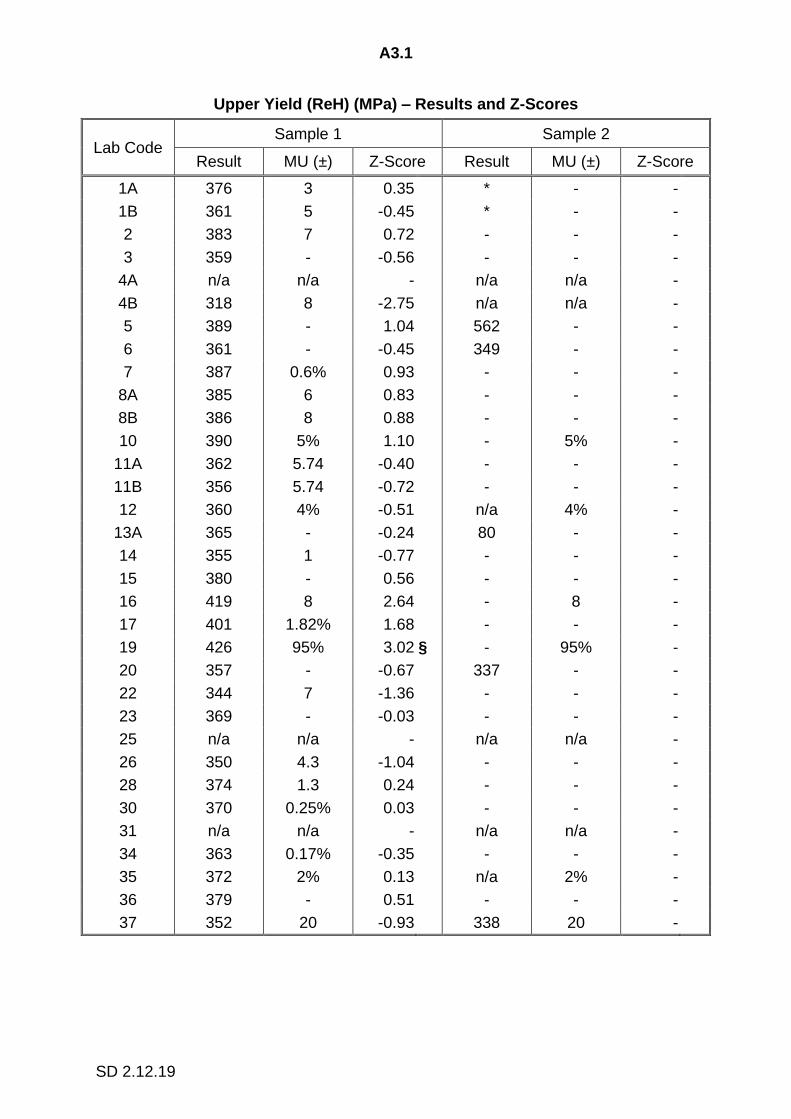
6.5 Upper Yield
Of the 27 laboratories that reported numerical results for Upper Yield, all 27 reported results for Sample 1, while five of these laboratories reported results for Sample 2. Sixteen of these laboratories tested using AS 1391. Nine laboratories tested using ISO 6892-1, including three laboratories that submitted two sets of results. One laboratory tested using ASTM E8 / E8M. One laboratory tested using JIS Z 2241 (see Appendix A6 for more details). For the laboratories that used the AS 1391 method for Sample 1, the median and standard error of the Upper Yield results was 373.0 ± 5.9 MPa. For all methods pooled, the median and standard error of the Upper Yield results for Sample 1 was 369.5 ± 4.3 MPa. The methods were pooled when analysing the results for Sample 1. The robust CV for the Upper Yield results for Sample 1 was 5.1%. The last round of this program where the Upper Yield results for flat bar samples were analysed was Round 12. In Round 12 of this program, the robust CVs obtained were 3.1% and 3.6% for Sample 1 and Sample 2, respectively. The robust CV value obtained in this round of the program is higher than the robust CV values obtained in Round 12 of the program (see Report No. 1139 for more details). One result (laboratory code 19) was identified as an outlier result, while two results (laboratory codes 4B and 16) obtained absolute z-scores between 2.0 and 3.0 for Sample 1. There was an insufficient number of results submitted for Upper Yield for Sample 2 to calculate summary statistics or z-scores.
-9-
SD 2.12.19
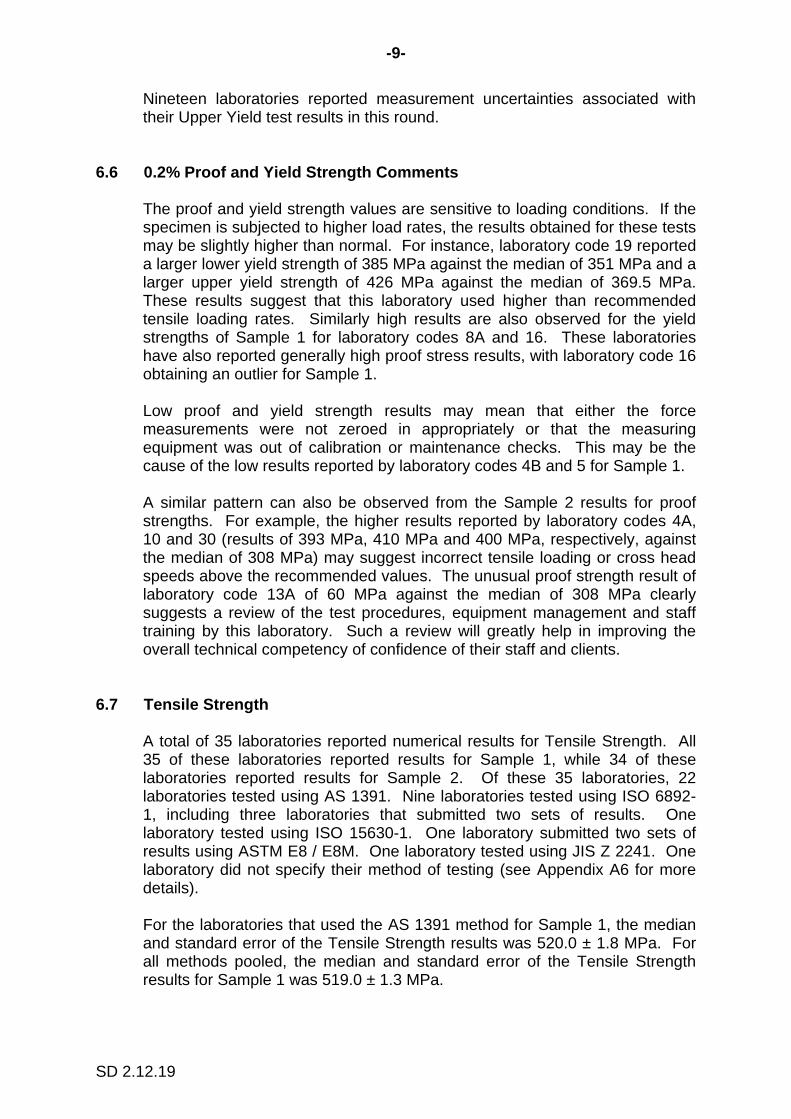
Nineteen laboratories reported measurement uncertainties associated with their Upper Yield test results in this round.
6.6 0.2% Proof and Yield Strength Comments
The proof and yield strength values are sensitive to loading conditions. If the specimen is subjected to higher load rates, the results obtained for these tests may be slightly higher than normal. For instance, laboratory code 19 reported a larger lower yield strength of 385 MPa against the median of 351 MPa and a larger upper yield strength of 426 MPa against the median of 369.5 MPa. These results suggest that this laboratory used higher than recommended tensile loading rates. Similarly high results are also observed for the yield strengths of Sample 1 for laboratory codes 8A and 16. These laboratories have also reported generally high proof stress results, with laboratory code 16 obtaining an outlier for Sample 1. Low proof and yield strength results may mean that either the force measurements were not zeroed in appropriately or that the measuring equipment was out of calibration or maintenance checks. This may be the cause of the low results reported by laboratory codes 4B and 5 for Sample 1. A similar pattern can also be observed from the Sample 2 results for proof strengths. For example, the higher results reported by laboratory codes 4A, 10 and 30 (results of 393 MPa, 410 MPa and 400 MPa, respectively, against the median of 308 MPa) may suggest incorrect tensile loading or cross head speeds above the recommended values. The unusual proof strength result of laboratory code 13A of 60 MPa against the median of 308 MPa clearly suggests a review of the test procedures, equipment management and staff training by this laboratory. Such a review will greatly help in improving the overall technical competency of confidence of their staff and clients.
6.7 Tensile Strength
A total of 35 laboratories reported numerical results for Tensile Strength. All 35 of these laboratories reported results for Sample 1, while 34 of these laboratories reported results for Sample 2. Of these 35 laboratories, 22 laboratories tested using AS 1391. Nine laboratories tested using ISO 6892-1, including three laboratories that submitted two sets of results. One laboratory tested using ISO 15630-1. One laboratory submitted two sets of results using ASTM E8 / E8M. One laboratory tested using JIS Z 2241. One laboratory did not specify their method of testing (see Appendix A6 for more details). For the laboratories that used the AS 1391 method for Sample 1, the median and standard error of the Tensile Strength results was 520.0 ± 1.8 MPa. For all methods pooled, the median and standard error of the Tensile Strength results for Sample 1 was 519.0 ± 1.3 MPa.
-10-
SD 2.12.19
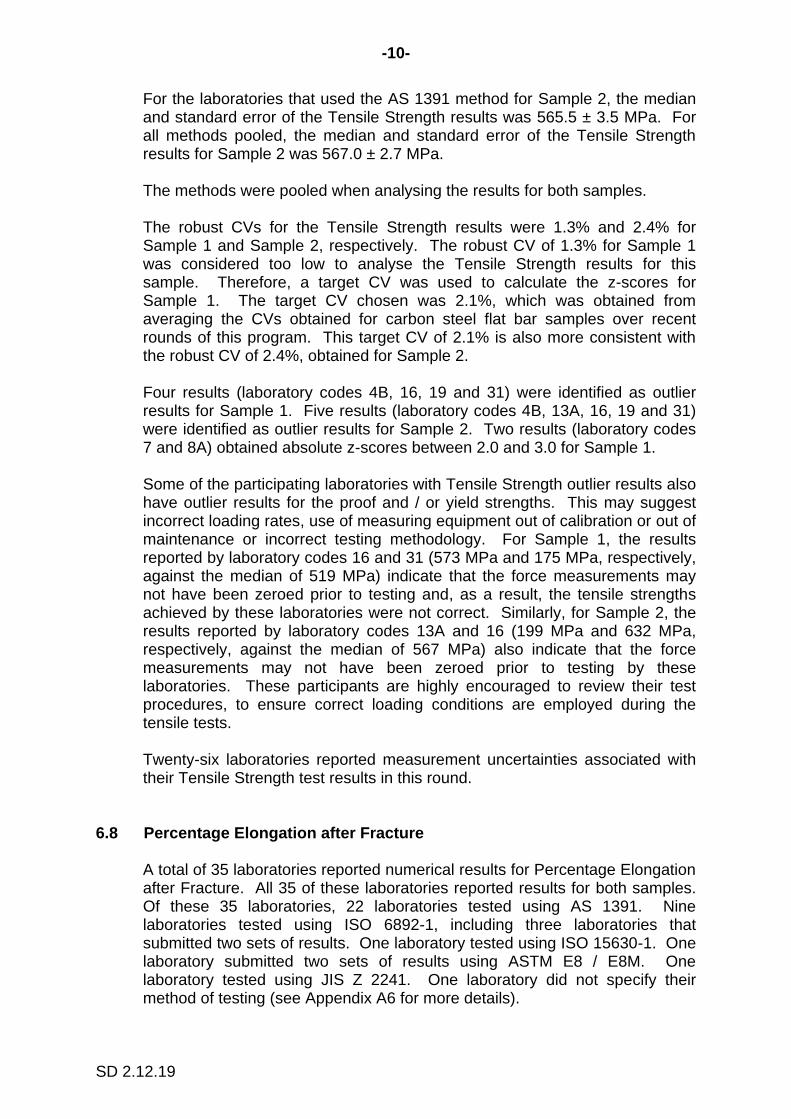
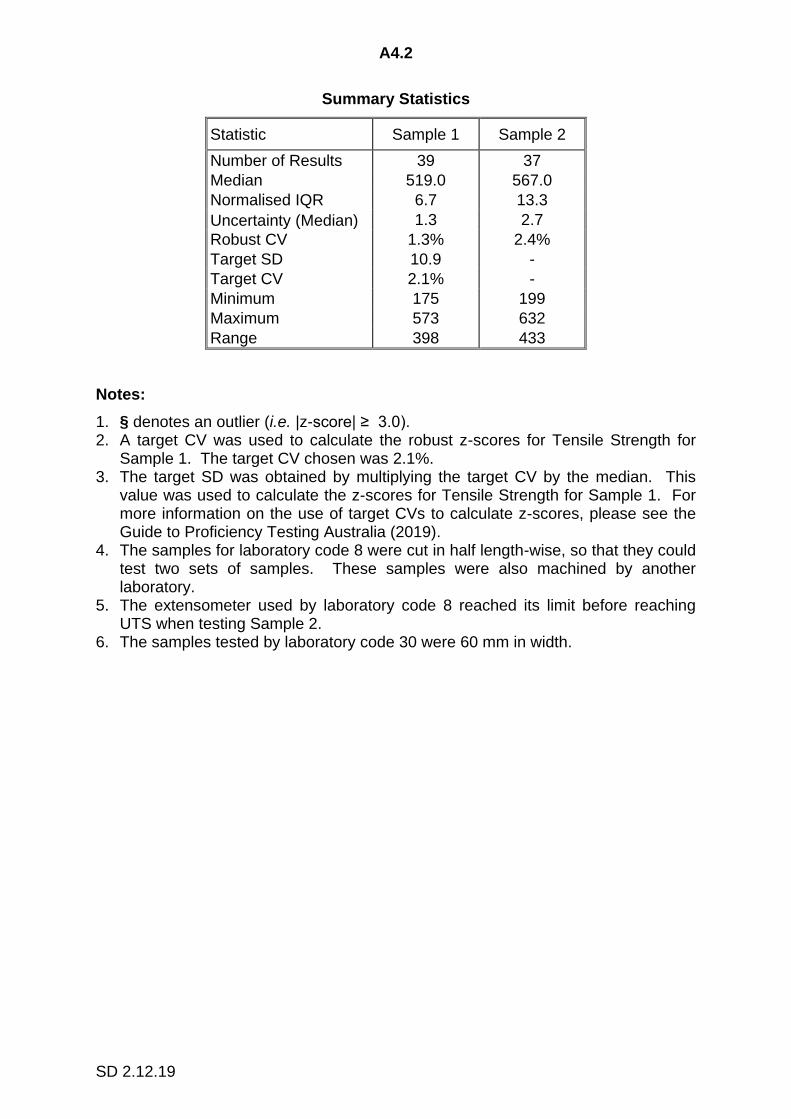
For the laboratories that used the AS 1391 method for Sample 2, the median and standard error of the Tensile Strength results was 565.5 ± 3.5 MPa. For all methods pooled, the median and standard error of the Tensile Strength results for Sample 2 was 567.0 ± 2.7 MPa. The methods were pooled when analysing the results for both samples. The robust CVs for the Tensile Strength results were 1.3% and 2.4% for Sample 1 and Sample 2, respectively. The robust CV of 1.3% for Sample 1 was considered too low to analyse the Tensile Strength results for this sample. Therefore, a target CV was used to calculate the z-scores for Sample 1. The target CV chosen was 2.1%, which was obtained from averaging the CVs obtained for carbon steel flat bar samples over recent rounds of this program. This target CV of 2.1% is also more consistent with the robust CV of 2.4%, obtained for Sample 2. Four results (laboratory codes 4B, 16, 19 and 31) were identified as outlier results for Sample 1. Five results (laboratory codes 4B, 13A, 16, 19 and 31) were identified as outlier results for Sample 2. Two results (laboratory codes 7 and 8A) obtained absolute z-scores between 2.0 and 3.0 for Sample 1. Some of the participating laboratories with Tensile Strength outlier results also have outlier results for the proof and / or yield strengths. This may suggest incorrect loading rates, use of measuring equipment out of calibration or out of maintenance or incorrect testing methodology. For Sample 1, the results reported by laboratory codes 16 and 31 (573 MPa and 175 MPa, respectively, against the median of 519 MPa) indicate that the force measurements may not have been zeroed prior to testing and, as a result, the tensile strengths achieved by these laboratories were not correct. Similarly, for Sample 2, the results reported by laboratory codes 13A and 16 (199 MPa and 632 MPa, respectively, against the median of 567 MPa) also indicate that the force measurements may not have been zeroed prior to testing by these laboratories. These participants are highly encouraged to review their test procedures, to ensure correct loading conditions are employed during the tensile tests. Twenty-six laboratories reported measurement uncertainties associated with their Tensile Strength test results in this round.
6.8 Percentage Elongation after Fracture
A total of 35 laboratories reported numerical results for Percentage Elongation after Fracture. All 35 of these laboratories reported results for both samples. Of these 35 laboratories, 22 laboratories tested using AS 1391. Nine laboratories tested using ISO 6892-1, including three laboratories that submitted two sets of results. One laboratory tested using ISO 15630-1. One laboratory submitted two sets of results using ASTM E8 / E8M. One laboratory tested using JIS Z 2241. One laboratory did not specify their method of testing (see Appendix A6 for more details).
-11-
SD 2.12.19
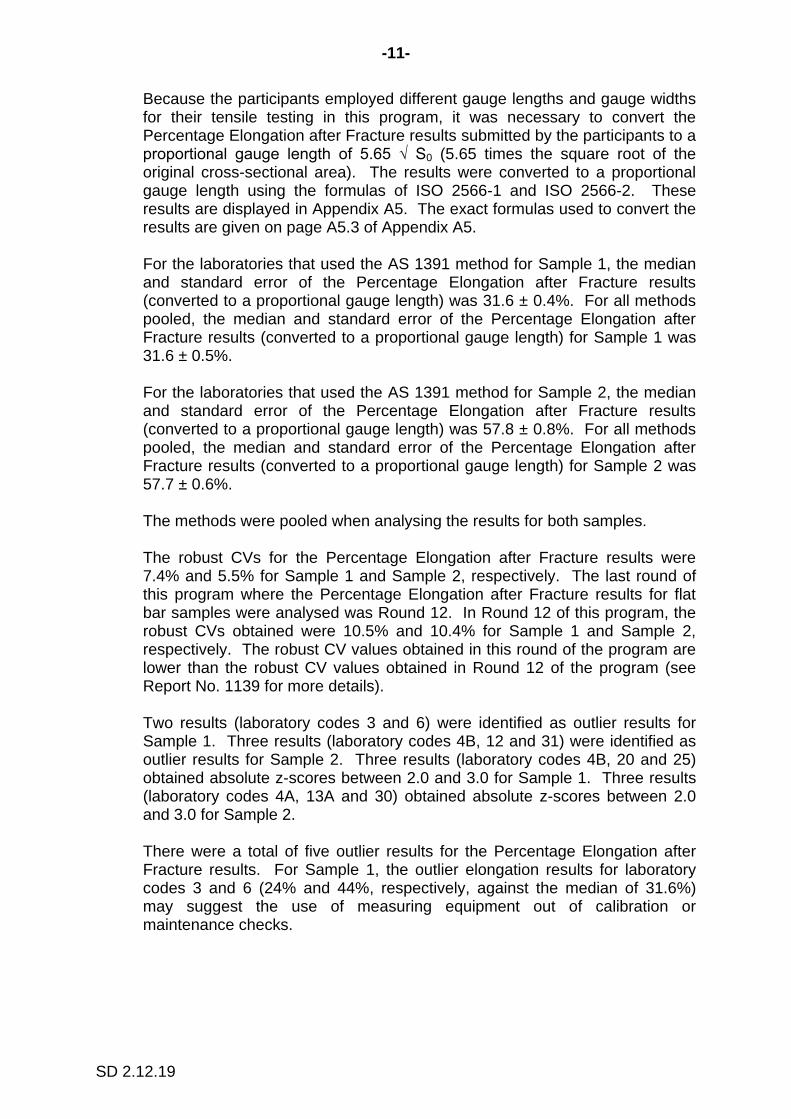
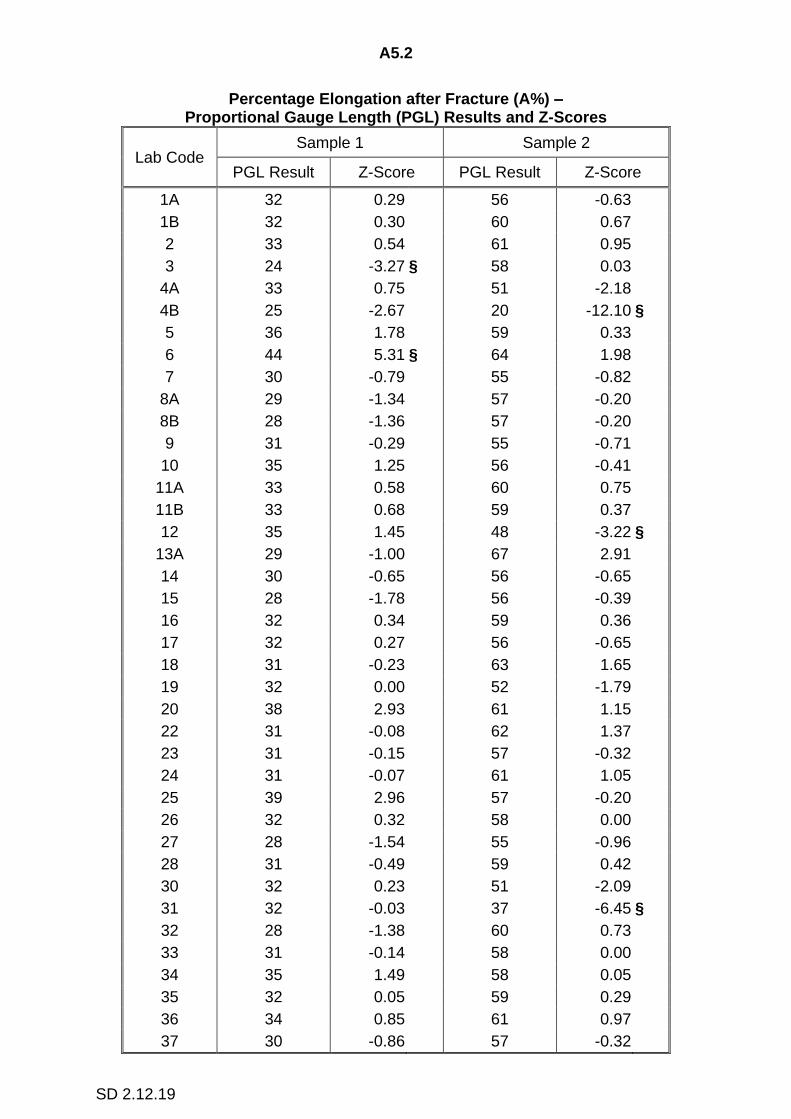
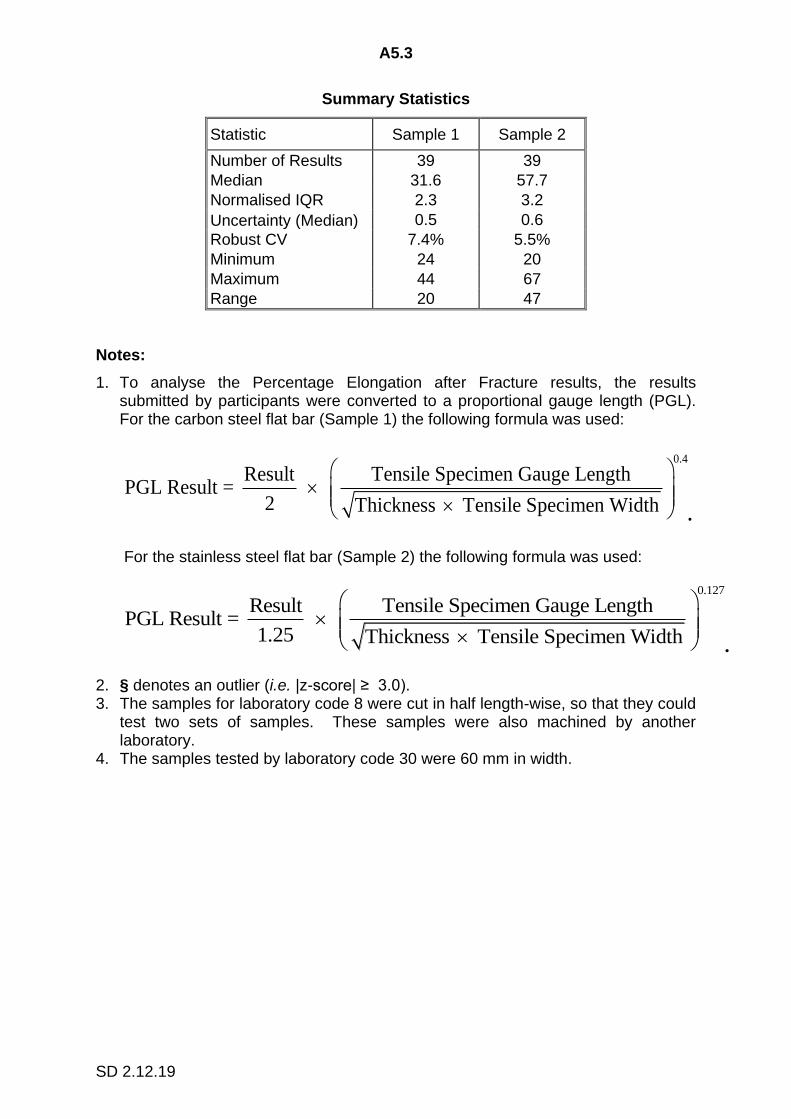
Because the participants employed different gauge lengths and gauge widths for their tensile testing in this program, it was necessary to convert the Percentage Elongation after Fracture results submitted by the participants to a proportional gauge length of 5.65 √ S0 (5.65 times the square root of the original cross-sectional area). The results were converted to a proportional gauge length using the formulas of ISO 2566-1 and ISO 2566-2. These results are displayed in Appendix A5. The exact formulas used to convert the results are given on page A5.3 of Appendix A5. For the laboratories that used the AS 1391 method for Sample 1, the median and standard error of the Percentage Elongation after Fracture results (converted to a proportional gauge length) was 31.6 ± 0.4%. For all methods pooled, the median and standard error of the Percentage Elongation after Fracture results (converted to a proportional gauge length) for Sample 1 was 31.6 ± 0.5%. For the laboratories that used the AS 1391 method for Sample 2, the median and standard error of the Percentage Elongation after Fracture results (converted to a proportional gauge length) was 57.8 ± 0.8%. For all methods pooled, the median and standard error of the Percentage Elongation after Fracture results (converted to a proportional gauge length) for Sample 2 was 57.7 ± 0.6%. The methods were pooled when analysing the results for both samples. The robust CVs for the Percentage Elongation after Fracture results were 7.4% and 5.5% for Sample 1 and Sample 2, respectively. The last round of this program where the Percentage Elongation after Fracture results for flat bar samples were analysed was Round 12. In Round 12 of this program, the robust CVs obtained were 10.5% and 10.4% for Sample 1 and Sample 2, respectively. The robust CV values obtained in this round of the program are lower than the robust CV values obtained in Round 12 of the program (see Report No. 1139 for more details). Two results (laboratory codes 3 and 6) were identified as outlier results for Sample 1. Three results (laboratory codes 4B, 12 and 31) were identified as outlier results for Sample 2. Three results (laboratory codes 4B, 20 and 25) obtained absolute z-scores between 2.0 and 3.0 for Sample 1. Three results (laboratory codes 4A, 13A and 30) obtained absolute z-scores between 2.0 and 3.0 for Sample 2. There were a total of five outlier results for the Percentage Elongation after Fracture results. For Sample 1, the outlier elongation results for laboratory codes 3 and 6 (24% and 44%, respectively, against the median of 31.6%) may suggest the use of measuring equipment out of calibration or maintenance checks.
-12-
SD 2.12.19
The low percentage elongation results for Sample 2 reported by laboratory codes 4B, 12 and 31 (20%, 48%, 37%, respectively, against the median of 57.7%) suggest the gauge marks may have not been marked or measured correctly. These low results could also be because of higher than recommended tensile loading rates, especially past the proof / yield points. All participating laboratories are encouraged to develop and maintain a robust equipment management system to ensure obtained test results have accuracy, reliability, and validity. Twenty-five laboratories reported measurement uncertainties associated with their Percentage Elongation after Fracture test results in this round.
6.9 Measurement Uncertainty The majority of participants in this round (70% – 74%) reported estimates of the measurement uncertainty associated with their results. The number and percentage of laboratories that reported estimates of their measurement uncertainty for each test is as follows:
0.2% Proof Stress 23 out of 33 70%
Lower Yield 19 out of 27 70%
Upper Yield 19 out of 27 70%
Tensile Strength 26 out of 35 74%
Percentage Elongation after Fracture 25 out of 35 71%
Any laboratories that reported a measurement uncertainty less than two times the uncertainty of the median may have underestimated their measurement uncertainty. Any laboratories that reported a measurement uncertainty greater than three times the normalised IQR may have overestimated their measurement uncertainty. All the participants are highly encouraged to report and use measurement uncertainty, so that the program analysis can provide a better outlook of the overall performance for this program. A number of methods are described in AS 1391 Annex K, “Estimation of the uncertainty of measurement”, that could be used to assist laboratories in estimating their measurement uncertainty.

-13-
SD 2.12.19
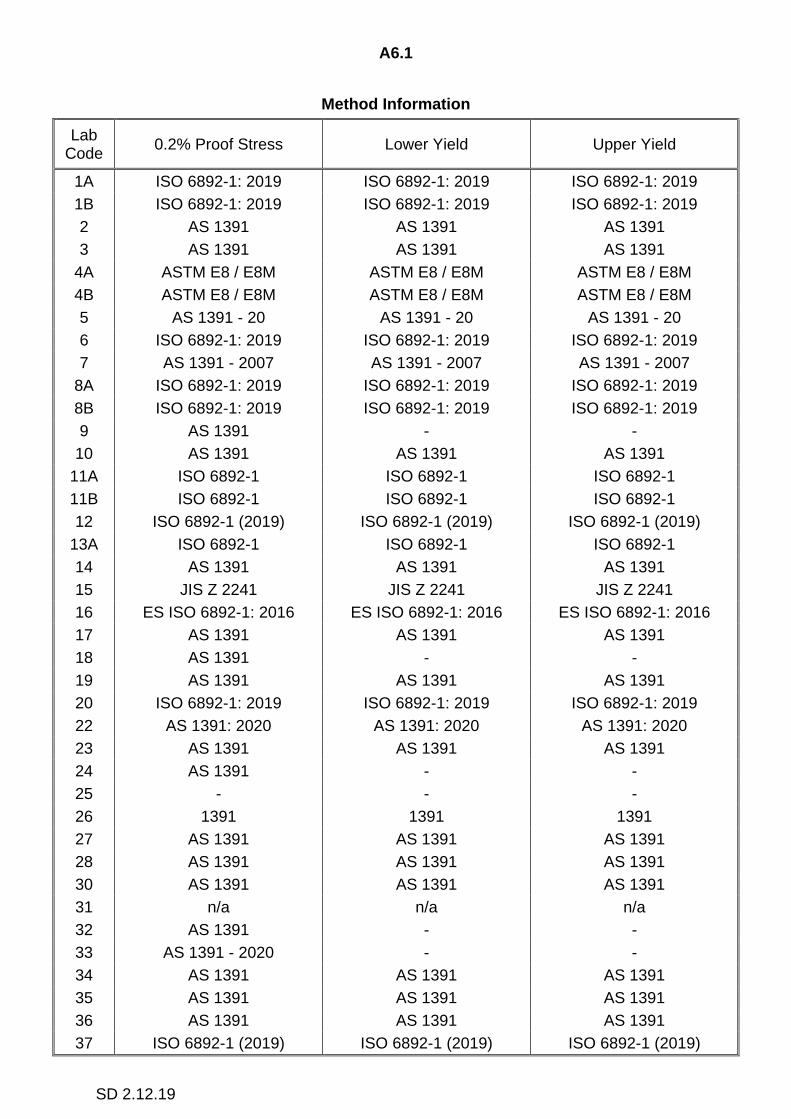
6.10 Other Reported Results
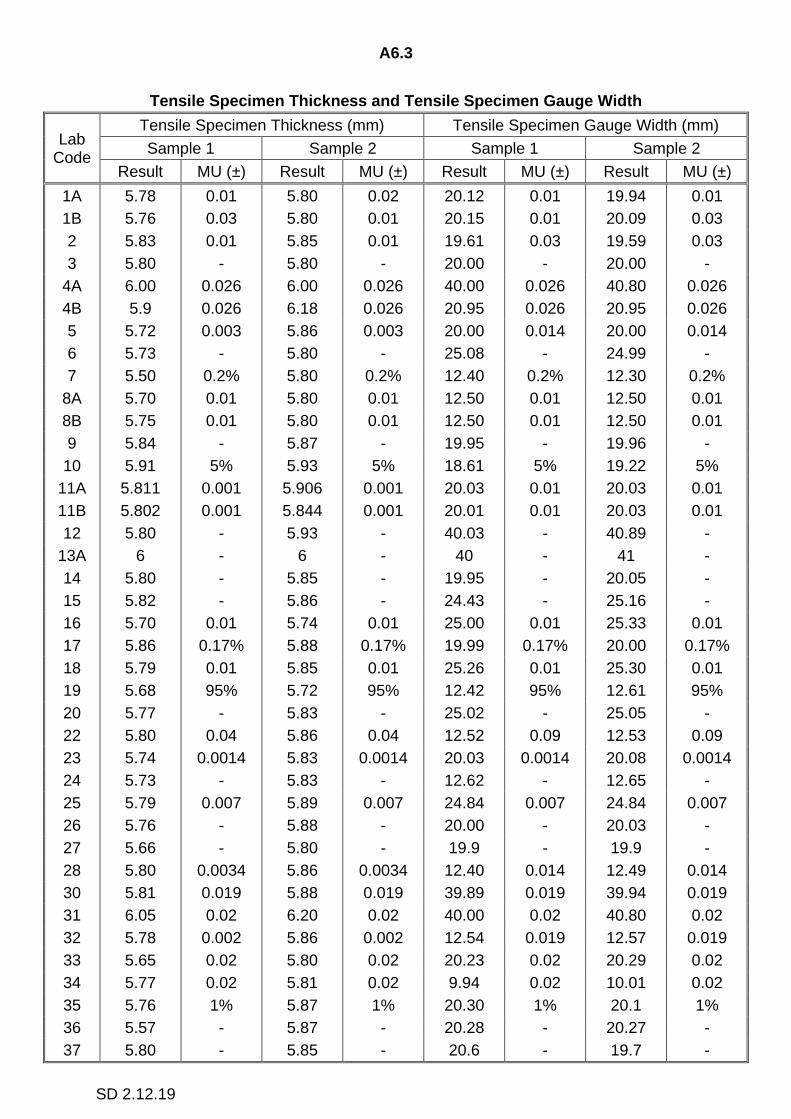
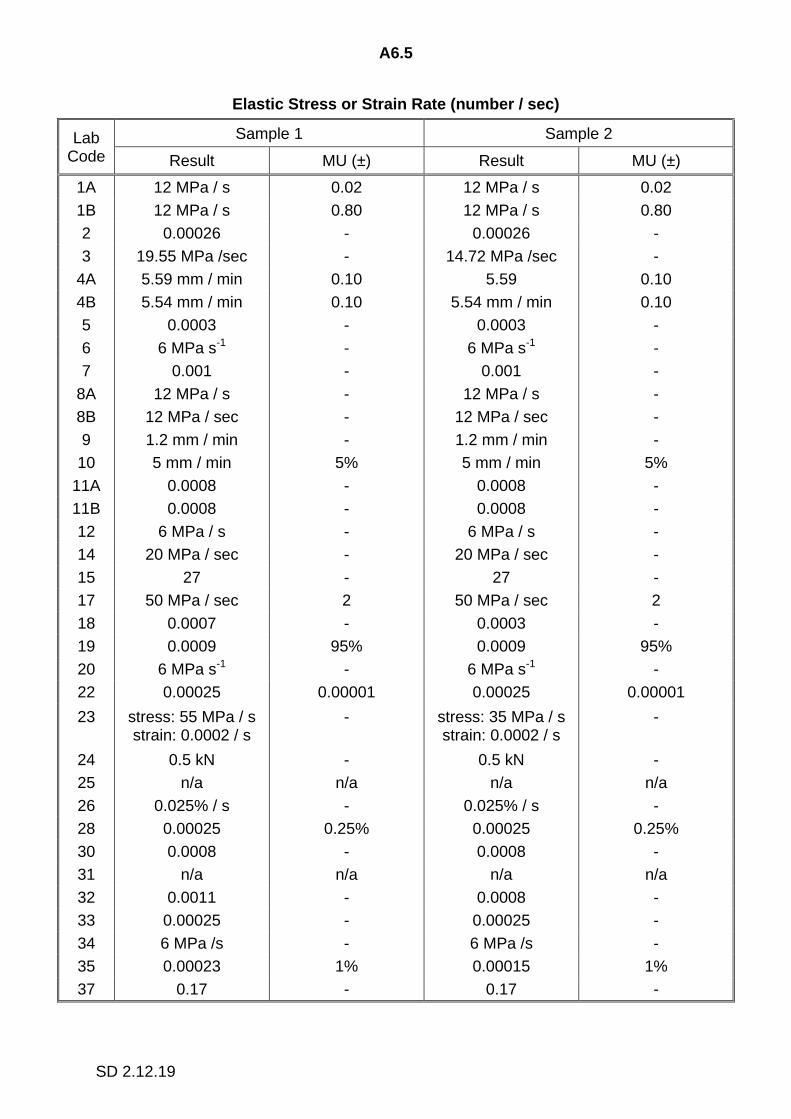
In addition to reporting results for 0.2% Proof Stress, Lower Yield, Upper Yield, Tensile Strength and Percentage Elongation after Fracture, participants were also asked to report the Tensile Specimen Thickness, Tensile Specimen Gauge Width, Tensile Specimen Gauge Length, Elastic Stress or Strain Rate and Plastic Strain Rate. The details reported by each of the participants are displayed in Appendix A6. It is highly recommended that all of the participants report all of this necessary information, in order to better analyse the test results. The Tensile Specimen Thickness, Tensile Specimen Gauge Width and Tensile Specimen Gauge Length are required in order to convert the Percentage Elongation after Fracture results to a proportional gauge length, while the loading rates (both stress and strain rates) can be reviewed for any abnormal test results. The loading rates are particularly important when comparing test results for elongation and yield strength, as the loading rates can affect these properties.
6.11 General Comments The aim of this round of the program was to determine the capabilities and proficiency of the participating laboratories in comparing and understanding the role of specimen geometry and material type on the tensile properties of the materials. The overall performance of the participating laboratories in this round of the program was unexpected. There was a total of 27 outlier tensile results from the 35 laboratories that returned results, as compared to 15 outlier tensile results from 22 participating laboratories in the previous round of the program. Participating in proficiency testing programs is very important for laboratories, as it can assist them tremendously in identifying any weaknesses in their systems that may be present and it allows them to improve their overall technical competency and proficiency. All the participating laboratories that reported results that have an absolute z-score of more than 2.0 are highly encouraged to use these proficiency testing programs to evaluate their testing methods, loading conditions, preparation procedures, equipment management and training details. It is expected of each participant to analyse their own proficiency testing results and evaluate any trends.
-14-
SD 2.12.19
7. REFERENCES
1. Guide to Proficiency Testing Australia (2019). (This document is located on the PTA website at www.pta.asn.au under Programs / Documents).
2. ISO/IEC 17043: 2010 Conformity assessment – General requirements for proficiency testing.
3. AS 1391 (2020) – Metallic materials – Tensile testing at ambient
temperature.
4. ISO 6892-1 (2019) – Metallic materials – Tensile testing – Part 1: Method of test at room temperature.
5. ISO 2566-1 (1984) – Steel – Conversion of elongation values – Part 1:
Carbon and low alloy steels. 6. ISO 2566-2 (1984) – Steel – Conversion of elongation values – Part 2:
Austenitic steels.
7. ISO 15630-1 (2019) – Steel For The Reinforcement and Prestressing of Concrete – Test Methods – Part 1: Reinforcing Bars, Rods and Wire.
8. ASTM E8 / E8M-16a – Standard Test Methods for Tension Testing of Metallic Materials.
9. JIS Z 2241 (2011) – Metallic materials – Tensile testing – Method of test at room temperature. .
.
SD 2.12.19
APPENDIX A
Summary of Results
SD 2.12.19
Section A1
0.2% Proof Stress
A1.1
SD 2.12.19
0.2% Proof Stress (non-proportional elongation) (Rp0.2) (MPa) – Results and Z-Scores
Lab Code Sample 1 Sample 2
Result MU (±) Z-Score Result MU (±) Z-Score
1A 375 3 1.15 307 2 -0.04
1B 349 5 -0.61 308 4 0.00
2 - - - 295 3 -0.46
3 352 - -0.40 324 - 0.57
4A 476 13 7.96 § 393 11 3.02 §
4B 312 8 -3.10 § 295 8 -0.46
5 343 3.5 -1.01 299 3.1 -0.32
6 361 - 0.20 349 - 1.46
7 372 3.6% 0.94 340 3.6% 1.14
8A 384 6 1.75 - - -
8B 368 8 0.67 - - -
9 365 - 0.47 376 - 2.41
10 380 5% 1.48 410 5% 3.62 §
11A 350 5.74 -0.54 305 5.74 -0.11
11B 358 5.74 0.00 330 5.74 0.78
12 353 4% -0.34 392 4% 2.98
13A 364 - 0.40 60 - -8.80 §
14 354 1 -0.27 309 1 0.04
15 356 - -0.13 305 - -0.11
16 413 8 3.71 § 389 8 2.88
17 367 1.82% 0.61 302 1.82% -0.21
18 - - - 316 19 0.28
19 - 95% - 368 95% 2.13
20 357 - -0.07 337 - 1.03
22 - - - 265 7 -1.53
23 - - - 303 4.4 -0.18
24 374 - 1.08 283 - -0.89
25 n/a n/a - n/a n/a -
26 - - - 302 4.4 -0.21
27 355 - -0.20 319 - 0.39
28 358 1.2 0.00 295 1.0 -0.46
30 - - - 400 0.25% 3.27 §
31 n/a n/a - n/a n/a -
32 345 14 -0.88 318 14 0.35
33 374 5.5% 1.08 306 5.5% -0.07
34 349 0.17% -0.61 289 0.17% -0.67
35 367 2% 0.61 295 2% -0.46
36 - - - 303 - -0.18
37 346 - -0.81 332 - 0.85
A1.2
SD 2.12.19
Summary Statistics
Statistic Sample 1 Sample 2
Number of Results 29 35
Median 358.0 308.0
Normalised IQR 14.8 28.2
Uncertainty (Median) 3.5 6.0
Robust CV 4.1% 9.1%
Minimum 312 60
Maximum 476 410
Range 164 350
Notes:
1. § denotes an outlier (i.e. |z-score| ≥ 3.0). 2. n/a denotes not applicable. 3. The samples for laboratory code 8 were cut in half length-wise, so that they
could test two sets of samples. These samples were also machined by another laboratory.
4. The extensometer used by laboratory code 8 reached its limit before reaching UTS when testing Sample 2.
5. Laboratory code 18 had an issue with their extensometer slipping on Sample 1, so they could not obtain accurate Proof Stress results for this sample.
6. The samples tested by laboratory code 30 were 60 mm in width.

A1.3
SD 2.12.19
4B
5 32 37 1
B
34
11A
3 12 14 27 15 20
11B
28 6
13A
9
17
35 8B 7 2
4
33 1A
10 8
A
16
4A
-3
-2
-1
0
1
2
3
Robust
Z-S
core
Laboratory Code
0.2% Proof Stress (non-proportional elongation) (Rp0.2) - Sample 113A
22
24 3
4 2
4B 28
35 5 17
26 23
36
11A 15 33
1A
1B 14 1
8 32 27 3
11B
37 2
0 7
6
19 9
16 12
4A 30
10
-3
-2
-1
0
1
2
3
Robust
Z-S
core
Laboratory Code
0.2% Proof Stress (non-proportional elongation) (Rp0.2) - Sample 2
SD 2.12.19
Section A2
Lower Yield
A2.1
SD 2.12.19
Lower Yield (ReL) (MPa) – Results and Z-Scores
Lab Code Sample 1 Sample 2
Result MU (±) Z-Score Result MU (±) Z-Score
1A 354 3 0.52 * - -
1B 348 5 -0.52 * - -
2 337 4 -2.44 - - -
3 353 - 0.35 - - -
4A n/a n/a - n/a n/a -
4B 308 8 -7.48 § n/a n/a -
5 310 - -7.14 § - - -
6 357 - 1.04 349 - -
7 356 0.6% 0.87 - - -
8A 377 6 4.53 § - - -
8B 365 8 2.44 - - -
10 350 5% -0.17 - 5% -
11A 349 5.74 -0.35 - - -
11B 345 5.74 -1.04 - - -
12 349 4% -0.35 n/a 4% -
13A 351 - 0.00 78 - -
14 353 1 0.35 - - -
15 348 - -0.52 - - -
16 409 8 10.10 § - 8 -
17 349 1.82% -0.35 - - -
19 385 95% 5.92 § - 95% -
20 351 - 0.00 337 - -
22 343 6 -1.39 - - -
23 351 - 0.00 - - -
25 n/a n/a - n/a n/a -
26 344 4.2 -1.22 - - -
28 357 1.2 1.04 - - -
30 355 0.25% 0.70 - - -
31 n/a n/a - n/a n/a -
34 345 0.17% -1.04 - - -
35 355 2% 0.70 n/a 2% -
36 357 - 1.04 - - -
37 351 20 0.00 338 20 -
A2.2
SD 2.12.19
Summary Statistics
Statistic Sample 1 Sample 2
Number of Results 30 4
Median 351.0 n/a
Normalised IQR 5.7 n/a
Uncertainty (Median) 1.3 n/a
Robust CV 1.6% n/a
Minimum 308 n/a
Maximum 409 n/a
Range 101 n/a
Notes:
1. § denotes an outlier (i.e. |z-score| ≥ 3.0). 2. n/a denotes not applicable. 3. * denotes not observed. 4. There was an insufficient number of results submitted for Lower Yield for Sample
2 to calculate summary statistics or z-scores. 5. The samples for laboratory code 8 were cut in half length-wise, so that they
could test two sets of samples. These samples were also machined by another laboratory.
6. The extensometer used by laboratory code 8 reached its limit before reaching UTS when testing Sample 2.
7. Laboratory code 18 had an issue with their extensometer slipping on Sample 1, so they could not obtain accurate Yield Strength results for this sample.
8. The samples tested by laboratory code 30 were 60 mm in width.
4B 5
2
22 2
6
11B 34
1B
15
11A 12
17 1
0
13A
20
23
37
3 14 1
A 30
35 7
6 28
36
8B
8A
19
16
-3
-2
-1
0
1
2
3
Robust
Z-S
core
Laboratory Code
Lower Yield (ReL) - Sample 1

SD 2.12.19
Section A3
Upper Yield
A3.1
SD 2.12.19
Upper Yield (ReH) (MPa) – Results and Z-Scores
Lab Code Sample 1 Sample 2
Result MU (±) Z-Score Result MU (±) Z-Score
1A 376 3 0.35 * - -
1B 361 5 -0.45 * - -
2 383 7 0.72 - - -
3 359 - -0.56 - - -
4A n/a n/a - n/a n/a -
4B 318 8 -2.75 n/a n/a -
5 389 - 1.04 562 - -
6 361 - -0.45 349 - -
7 387 0.6% 0.93 - - -
8A 385 6 0.83 - - -
8B 386 8 0.88 - - -
10 390 5% 1.10 - 5% -
11A 362 5.74 -0.40 - - -
11B 356 5.74 -0.72 - - -
12 360 4% -0.51 n/a 4% -
13A 365 - -0.24 80 - -
14 355 1 -0.77 - - -
15 380 - 0.56 - - -
16 419 8 2.64 - 8 -
17 401 1.82% 1.68 - - -
19 426 95% 3.02 § - 95% -
20 357 - -0.67 337 - -
22 344 7 -1.36 - - -
23 369 - -0.03 - - -
25 n/a n/a - n/a n/a -
26 350 4.3 -1.04 - - -
28 374 1.3 0.24 - - -
30 370 0.25% 0.03 - - -
31 n/a n/a - n/a n/a -
34 363 0.17% -0.35 - - -
35 372 2% 0.13 n/a 2% -
36 379 - 0.51 - - -
37 352 20 -0.93 338 20 -
A3.2
SD 2.12.19
Summary Statistics
Statistic Sample 1 Sample 2
Number of Results 30 5
Median 369.5 n/a
Normalised IQR 18.7 n/a
Uncertainty (Median) 4.3 n/a
Robust CV 5.1% n/a
Minimum 318 n/a
Maximum 426 n/a
Range 108 n/a
Notes:
1. § denotes an outlier (i.e. |z-score| ≥ 3.0). 2. n/a denotes not applicable. 3. * denotes not observed. 4. There was an insufficient number of results submitted for Upper Yield for Sample
2 to calculate summary statistics or z-scores. 5. The samples for laboratory code 8 were cut in half length-wise, so that they
could test two sets of samples. These samples were also machined by another laboratory.
6. The extensometer used by laboratory code 8 reached its limit before reaching UTS when testing Sample 2.
7. Laboratory code 18 had an issue with their extensometer slipping on Sample 1, so they could not obtain accurate Yield Strength results for this sample.
8. The samples tested by laboratory code 30 were 60 mm in width.
4B
22 2
6 37 1
4
11B 20 3 12 1B 6
11A 34
13A 2
3
30 35 28 1A 36 15 2 8
A 8B 7 5 1
0
17
16
19
-3
-2
-1
0
1
2
3
Robust
Z-S
core
Laboratory Code
Upper Yield (ReH) - Sample 1
SD 2.12.19
Section A4
Tensile Strength

A4.1
SD 2.12.19
Tensile Strength (Rm) (MPa) – Results and Z-Scores
Lab Code Sample 1 Sample 2
Result MU (±) Z-Score Result MU (±) Z-Score
1A 525 3 0.55 570 3 0.22
1B 524 3 0.46 583 3 1.20
2 517 4 -0.18 564 4 -0.22
3 518 - -0.09 576 - 0.67
4A 512 5 -0.64 573 6 0.45
4B 469 6 -4.59 § 527 7 -3.00 §
5 524 6.5 0.46 563 6.9 -0.30
6 517 - -0.18 569 - 0.15
7 542 0.6% 2.11 580 0.6% 0.97
8A 545 7 2.39 - - -
8B 528 8 0.83 - - -
9 519 - 0.00 571 - 0.30
10 520 5% 0.09 580 5% 0.97
11A 519 4.53 0.00 557 4.53 -0.75
11B 520 4.53 0.09 574 4.53 0.52
12 518 4% -0.09 586 4% 1.42
13A 501 - -1.65 199 - -27.58 §
14 513 1.4 -0.55 565 1.5 -0.15
15 515 - -0.37 567 - 0.00
16 573 0.14 4.95 § 632 0.14 4.87 §
17 517 1.82% -0.18 560 1.82% -0.52
18 503 15 -1.47 562 15 -0.37
19 568 95% 4.50 § 616 95% 3.67 §
20 512 - -0.64 561 - -0.45
22 520 10 0.09 570 11 0.22
23 526 6.5 0.64 574 7.1 0.52
24 540 - 1.93 588 - 1.57
25 524 4 0.46 564 4 -0.22
26 515 6.4 -0.37 563 6.9 -0.30
27 521 - 0.18 560 - -0.52
28 514 1.5 -0.46 555 1.7 -0.90
30 523 0.25% 0.37 589 0.25% 1.65
31 175 7.0 -31.56 § 521 20.8 -3.45 §
32 516 12 -0.28 566 12 -0.07
33 535 2.4% 1.47 591 2.4% 1.80
34 519 0.17% 0.00 579 0.17% 0.90
35 516 2% -0.28 559 2% -0.60
36 528 - 0.83 561 - -0.45
37 519 21 0.00 566 21 -0.07
A4.2
SD 2.12.19
Summary Statistics
Statistic Sample 1 Sample 2
Number of Results 39 37
Median 519.0 567.0
Normalised IQR 6.7 13.3
Uncertainty (Median) 1.3 2.7
Robust CV 1.3% 2.4%
Target SD 10.9 -
Target CV 2.1% -
Minimum 175 199
Maximum 573 632
Range 398 433
Notes:
1. § denotes an outlier (i.e. |z-score| ≥ 3.0). 2. A target CV was used to calculate the robust z-scores for Tensile Strength for
Sample 1. The target CV chosen was 2.1%. 3. The target SD was obtained by multiplying the target CV by the median. This
value was used to calculate the z-scores for Tensile Strength for Sample 1. For more information on the use of target CVs to calculate z-scores, please see the Guide to Proficiency Testing Australia (2019).
4. The samples for laboratory code 8 were cut in half length-wise, so that they could test two sets of samples. These samples were also machined by another laboratory.
5. The extensometer used by laboratory code 8 reached its limit before reaching UTS when testing Sample 2.
6. The samples tested by laboratory code 30 were 60 mm in width.

A4.3
SD 2.12.19
31
4B
13A 1
8
4A
20 14 28 15
26 32
35 2 6
17 3
12
9 11A
34
37 10
11B
22 27 3
0 1B
5 25 1A 23 8
B
36
33
24 7
8A
19
16
-3
-2
-1
0
1
2
3
Robust
Z-S
core
Laboratory Code
Tensile Strength (Rm) - Sample 113A 31
4B
28
11A 3
5 17
27
20
36 18 5 2
6 2
25 14 32
37
15 6 1
A
22 9
4A 11B
23 3
34 7 10 1B 1
2 24 30 33
19
16
-3
-2
-1
0
1
2
3
Robust
Z-S
core
Laboratory Code
Tensile Strength (Rm) - Sample 2
SD 2.12.19
Section A5
Percentage Elongation after Fracture

A5.1
SD 2.12.19
Percentage Elongation after Fracture (A%) – Results and Proportional Gauge Length (PGL) Results
Lab Code Sample 1 Sample 2
Result MU (±) PGL Result Result MU (±) PGL Result
1A 29 1 32 54 1 56
1B 29 1 32 58 1 60
2 33 1 33 61 1 61
3 24 - 24 58 - 58
4A 24 0.042 33 46 0.038 51
4B 16 0.043 25 17 0.043 20
5 32 2.1 36 57 2.5 59
6 26 - 44 53 - 64
7 29 1% 30 55 1% 55
8A 28 0.02% 29 57 0.02% 57
8B 28 0.02% 28 57 0.02% 57
9 27.8 - 31 53.8 - 55
10 37 5% 35 58 5% 56
11A 29.6 1.2% 33 58.3 1.2% 60
11B 29.8 1.2% 33 57.1 1.2% 59
12 25 - 35 43 - 48
13A 29 - 29 67 - 67
14 27 0.5 30 54 0.5 56
15 31 - 28 59 - 56
16 21 1 32 51.5 1 59
17 29 1.82% 32 54 1.82% 56
18 31 2 31 63 2 63
19 31 95% 32 52 95% 52
20 23 - 38 51 - 61
22 31 1 31 62 1 62
23 28 2.1 31 55 2.5 57
24 31 - 31 61 - 61
25 25 2 39 50 2 57
26 29 2.1 32 56 2.5 58
27 25 - 28 53 - 55
28 30 0.35 31 59 0.68 59
30 40 0.019 mm 32 55 0.019 mm 51
31 30 1.5 32 37 1.9 37
32 28 1 28 60 1 60
33 28 0.05% 31 56 0.05% 58
34 33 0.08 35 57 0.08 58
35 32 1% 32 59 1% 59
36 30 - 34 59 - 61
37 30 3 30 57 3 57
A5.2
SD 2.12.19
Percentage Elongation after Fracture (A%) – Proportional Gauge Length (PGL) Results and Z-Scores
Lab Code Sample 1 Sample 2
PGL Result Z-Score PGL Result Z-Score
1A 32 0.29 56 -0.63
1B 32 0.30 60 0.67
2 33 0.54 61 0.95
3 24 -3.27 § 58 0.03
4A 33 0.75 51 -2.18
4B 25 -2.67 20 -12.10 §
5 36 1.78 59 0.33
6 44 5.31 § 64 1.98
7 30 -0.79 55 -0.82
8A 29 -1.34 57 -0.20
8B 28 -1.36 57 -0.20
9 31 -0.29 55 -0.71
10 35 1.25 56 -0.41
11A 33 0.58 60 0.75
11B 33 0.68 59 0.37
12 35 1.45 48 -3.22 §
13A 29 -1.00 67 2.91
14 30 -0.65 56 -0.65
15 28 -1.78 56 -0.39
16 32 0.34 59 0.36
17 32 0.27 56 -0.65
18 31 -0.23 63 1.65
19 32 0.00 52 -1.79
20 38 2.93 61 1.15
22 31 -0.08 62 1.37
23 31 -0.15 57 -0.32
24 31 -0.07 61 1.05
25 39 2.96 57 -0.20
26 32 0.32 58 0.00
27 28 -1.54 55 -0.96
28 31 -0.49 59 0.42
30 32 0.23 51 -2.09
31 32 -0.03 37 -6.45 §
32 28 -1.38 60 0.73
33 31 -0.14 58 0.00
34 35 1.49 58 0.05
35 32 0.05 59 0.29
36 34 0.85 61 0.97
37 30 -0.86 57 -0.32
A5.3
SD 2.12.19
Summary Statistics
Statistic Sample 1 Sample 2
Number of Results 39 39
Median 31.6 57.7
Normalised IQR 2.3 3.2
Uncertainty (Median) 0.5 0.6
Robust CV 7.4% 5.5%
Minimum 24 20
Maximum 44 67
Range 20 47
Notes:
1. To analyse the Percentage Elongation after Fracture results, the results
submitted by participants were converted to a proportional gauge length (PGL). For the carbon steel flat bar (Sample 1) the following formula was used:
For the stainless steel flat bar (Sample 2) the following formula was used:
2. § denotes an outlier (i.e. |z-score| ≥ 3.0). 3. The samples for laboratory code 8 were cut in half length-wise, so that they could
test two sets of samples. These samples were also machined by another laboratory.
4. The samples tested by laboratory code 30 were 60 mm in width.
0.4
Result Tensile Specimen Gauge LengthPGL Result =
2 Thickness Tensile Specimen Width .
0.127
Result Tensile Specimen Gauge LengthPGL Result =
1.25 Thickness Tensile Specimen Width .

A5.4
SD 2.12.19
3 4B
15 2
7 32
8B
8A 1
3A 3
7 7 14 2
8
9 18 23
33 22
24 31
19 35 30 17
1A
1B 2
6
16 2 1
1A
11B
4A 36
10 1
2 34
5
20
25 6
-3
-2
-1
0
1
2
3
Robust
Z-S
core
Laboratory Code
Percentage Elongation after Fracture (A%) - Sample 14B 31
12
4A 3
0 19
27 7
9 17
14
1A 1
0
15 23
37 8A
8B 25
26
33
3 34 3
5 5 16
11B
28 1
B 32
11A 2 36 24 20 2
2 18
6
13A
-3
-2
-1
0
1
2
3
Ro
bust
Z-S
co
re
Laboratory Code
Percentage Elongation after Fracture (A%) - Sample 2
SD 2.12.19
Section A6
Method Information and Other Reported Results
A6.1
SD 2.12.19
Method Information
Lab Code
0.2% Proof Stress Lower Yield Upper Yield
1A ISO 6892-1: 2019 ISO 6892-1: 2019 ISO 6892-1: 2019
1B ISO 6892-1: 2019 ISO 6892-1: 2019 ISO 6892-1: 2019
2 AS 1391 AS 1391 AS 1391
3 AS 1391 AS 1391 AS 1391
4A ASTM E8 / E8M ASTM E8 / E8M ASTM E8 / E8M
4B ASTM E8 / E8M ASTM E8 / E8M ASTM E8 / E8M
5 AS 1391 - 20 AS 1391 - 20 AS 1391 - 20
6 ISO 6892-1: 2019 ISO 6892-1: 2019 ISO 6892-1: 2019
7 AS 1391 - 2007 AS 1391 - 2007 AS 1391 - 2007
8A ISO 6892-1: 2019 ISO 6892-1: 2019 ISO 6892-1: 2019
8B ISO 6892-1: 2019 ISO 6892-1: 2019 ISO 6892-1: 2019
9 AS 1391 - -
10 AS 1391 AS 1391 AS 1391
11A ISO 6892-1 ISO 6892-1 ISO 6892-1
11B ISO 6892-1 ISO 6892-1 ISO 6892-1
12 ISO 6892-1 (2019) ISO 6892-1 (2019) ISO 6892-1 (2019)
13A ISO 6892-1 ISO 6892-1 ISO 6892-1
14 AS 1391 AS 1391 AS 1391
15 JIS Z 2241 JIS Z 2241 JIS Z 2241
16 ES ISO 6892-1: 2016 ES ISO 6892-1: 2016 ES ISO 6892-1: 2016
17 AS 1391 AS 1391 AS 1391
18 AS 1391 - -
19 AS 1391 AS 1391 AS 1391
20 ISO 6892-1: 2019 ISO 6892-1: 2019 ISO 6892-1: 2019
22 AS 1391: 2020 AS 1391: 2020 AS 1391: 2020
23 AS 1391 AS 1391 AS 1391
24 AS 1391 - -
25 - - -
26 1391 1391 1391
27 AS 1391 AS 1391 AS 1391
28 AS 1391 AS 1391 AS 1391
30 AS 1391 AS 1391 AS 1391
31 n/a n/a n/a
32 AS 1391 - -
33 AS 1391 - 2020 - -
34 AS 1391 AS 1391 AS 1391
35 AS 1391 AS 1391 AS 1391
36 AS 1391 AS 1391 AS 1391
37 ISO 6892-1 (2019) ISO 6892-1 (2019) ISO 6892-1 (2019)

A6.2
SD 2.12.19
Method Information
Lab Code Tensile Strength Percentage Elongation
after Fracture
1A ISO 6892-1: 2019 ISO 6892-1: 2019
1B ISO 6892-1: 2019 ISO 6892-1: 2019
2 AS 1391 AS 1391
3 AS 1391 AS 1391
4A ASTM E8 / E8M ASTM E8 / E8M
4B ASTM E8 / E8M ASTM E8 / E8M
5 AS 1391 - 20 AS 1391 - 20
6 ISO 6892-1: 2019 ISO 6892-1: 2019
7 AS 1391 - 2007 AS 1391 - 2007
8A ISO 6892-1: 2019 ISO 6892-1: 2019
8B ISO 6892-1: 2019 ISO 6892-1: 2019
9 - -
10 AS 1391 AS 1391
11A ISO 6892-1 ISO 6892-1
11B ISO 6892-1 ISO 6892-1
12 ISO 6892-1 (2019) ISO 6892-1 (2019)
13A ISO 6892-1 ISO 6892-1
14 AS 1391 AS 1391
15 JIS Z 2241 JIS Z 2241
16 ES ISO 6892-1: 2016 ES ISO 6892-1: 2016
17 AS 1391 AS 1391
18 AS 1391 AS 1391
19 AS 1391 AS 1391
20 ISO 6892-1: 2019 ISO 6892-1: 2019
22 AS 1391: 2020 AS 1391: 2020
23 AS 1391 AS 1391
24 AS 1391 AS 1391
25 AS 1391 AS 1391
26 1391 1391
27 AS 1391 AS 1391
28 AS 1391 AS 1391
30 AS 1391 AS 1391
31 ISO 15630-1: 2019 ISO 15630-1: 2019
32 AS 1391 AS 1391
33 AS 1391 - 2020 AS 1391 - 2020
34 AS 1391 AS 1391
35 AS 1391 AS 1391
36 AS 1391 AS 1391
37 ISO 6892-1 (2019) ISO 6892-1 (2019)
A6.3
SD 2.12.19
Tensile Specimen Thickness and Tensile Specimen Gauge Width
Lab Code
Tensile Specimen Thickness (mm) Tensile Specimen Gauge Width (mm)
Sample 1 Sample 2 Sample 1 Sample 2
Result MU (±) Result MU (±) Result MU (±) Result MU (±)
1A 5.78 0.01 5.80 0.02 20.12 0.01 19.94 0.01
1B 5.76 0.03 5.80 0.01 20.15 0.01 20.09 0.03
2 5.83 0.01 5.85 0.01 19.61 0.03 19.59 0.03
3 5.80 - 5.80 - 20.00 - 20.00 -
4A 6.00 0.026 6.00 0.026 40.00 0.026 40.80 0.026
4B 5.9 0.026 6.18 0.026 20.95 0.026 20.95 0.026
5 5.72 0.003 5.86 0.003 20.00 0.014 20.00 0.014
6 5.73 - 5.80 - 25.08 - 24.99 -
7 5.50 0.2% 5.80 0.2% 12.40 0.2% 12.30 0.2%
8A 5.70 0.01 5.80 0.01 12.50 0.01 12.50 0.01
8B 5.75 0.01 5.80 0.01 12.50 0.01 12.50 0.01
9 5.84 - 5.87 - 19.95 - 19.96 -
10 5.91 5% 5.93 5% 18.61 5% 19.22 5%
11A 5.811 0.001 5.906 0.001 20.03 0.01 20.03 0.01
11B 5.802 0.001 5.844 0.001 20.01 0.01 20.03 0.01
12 5.80 - 5.93 - 40.03 - 40.89 -
13A 6 - 6 - 40 - 41 -
14 5.80 - 5.85 - 19.95 - 20.05 -
15 5.82 - 5.86 - 24.43 - 25.16 -
16 5.70 0.01 5.74 0.01 25.00 0.01 25.33 0.01
17 5.86 0.17% 5.88 0.17% 19.99 0.17% 20.00 0.17%
18 5.79 0.01 5.85 0.01 25.26 0.01 25.30 0.01
19 5.68 95% 5.72 95% 12.42 95% 12.61 95%
20 5.77 - 5.83 - 25.02 - 25.05 -
22 5.80 0.04 5.86 0.04 12.52 0.09 12.53 0.09
23 5.74 0.0014 5.83 0.0014 20.03 0.0014 20.08 0.0014
24 5.73 - 5.83 - 12.62 - 12.65 -
25 5.79 0.007 5.89 0.007 24.84 0.007 24.84 0.007
26 5.76 - 5.88 - 20.00 - 20.03 -
27 5.66 - 5.80 - 19.9 - 19.9 -
28 5.80 0.0034 5.86 0.0034 12.40 0.014 12.49 0.014
30 5.81 0.019 5.88 0.019 39.89 0.019 39.94 0.019
31 6.05 0.02 6.20 0.02 40.00 0.02 40.80 0.02
32 5.78 0.002 5.86 0.002 12.54 0.019 12.57 0.019
33 5.65 0.02 5.80 0.02 20.23 0.02 20.29 0.02
34 5.77 0.02 5.81 0.02 9.94 0.02 10.01 0.02
35 5.76 1% 5.87 1% 20.30 1% 20.1 1%
36 5.57 - 5.87 - 20.28 - 20.27 -
37 5.80 - 5.85 - 20.6 - 19.7 -

A6.4
SD 2.12.19
Tensile Specimen Gauge Length (mm)
Lab Code Sample 1 Sample 2
Result MU (±) Result MU (±)
1A 80 1 80 1
1B 80 1 80 1
2 60 0.5 60 0.5
3 61 - 61 -
4A 200 0.026 200 0.026
4B 200 0.026 200 0.026
5 80.0 0.014 80.0 0.014
6 253 - 307 -
7 50 0.2% 50 0.2%
8A 50 0.01 50 0.01
8B 50 0.01 50 0.01
9 80 - 80 -
10 50 5% 50 5%
11A 80 0.01 80 0.01
11B 80 0.01 80 0.01
12 200 - 200 -
13A 90 - 90 -
14 80 - 80 -
15 50 - 50 -
16 200 0.6 200 0.6
17 80 0.17% 80 0.17%
18 69 0.02 70 0.02
19 50.0 95% 50.0 95%
20 246 - 301 -
22 50 1 50 1
23 80 0.013 80 0.013
24 50 - 50 -
25 200 1 200 1
26 80 - 80 -
27 80 - 80 -
28 50 0.29 50 0.29
30 50 0.019 50 0.019
31 100 0.6 100 0.6
32 50 0.019 50 0.019
33 80 0.02 80 0.02
34 50 0.02 50 0.02
35 60 1% 60 1%
36 80 - 80 -
37 60 - 60 -
A6.5
SD 2.12.19
Elastic Stress or Strain Rate (number / sec)
Lab Code
Sample 1 Sample 2
Result MU (±) Result MU (±)
1A 12 MPa / s 0.02 12 MPa / s 0.02
1B 12 MPa / s 0.80 12 MPa / s 0.80
2 0.00026 - 0.00026 -
3 19.55 MPa /sec - 14.72 MPa /sec -
4A 5.59 mm / min 0.10 5.59 0.10
4B 5.54 mm / min 0.10 5.54 mm / min 0.10
5 0.0003 - 0.0003 -
6 6 MPa s-1 - 6 MPa s-1 -
7 0.001 - 0.001 -
8A 12 MPa / s - 12 MPa / s -
8B 12 MPa / sec - 12 MPa / sec -
9 1.2 mm / min - 1.2 mm / min -
10 5 mm / min 5% 5 mm / min 5%
11A 0.0008 - 0.0008 -
11B 0.0008 - 0.0008 -
12 6 MPa / s - 6 MPa / s -
14 20 MPa / sec - 20 MPa / sec -
15 27 - 27 -
17 50 MPa / sec 2 50 MPa / sec 2
18 0.0007 - 0.0003 -
19 0.0009 95% 0.0009 95%
20 6 MPa s-1 - 6 MPa s-1 -
22 0.00025 0.00001 0.00025 0.00001
23 stress: 55 MPa / s strain: 0.0002 / s
- stress: 35 MPa / s strain: 0.0002 / s
-
24 0.5 kN - 0.5 kN -
25 n/a n/a n/a n/a
26 0.025% / s - 0.025% / s -
28 0.00025 0.25% 0.00025 0.25%
30 0.0008 - 0.0008 -
31 n/a n/a n/a n/a
32 0.0011 - 0.0008 -
33 0.00025 - 0.00025 -
34 6 MPa /s - 6 MPa /s -
35 0.00023 1% 0.00015 1%
37 0.17 - 0.17 -
A6.6
SD 2.12.19
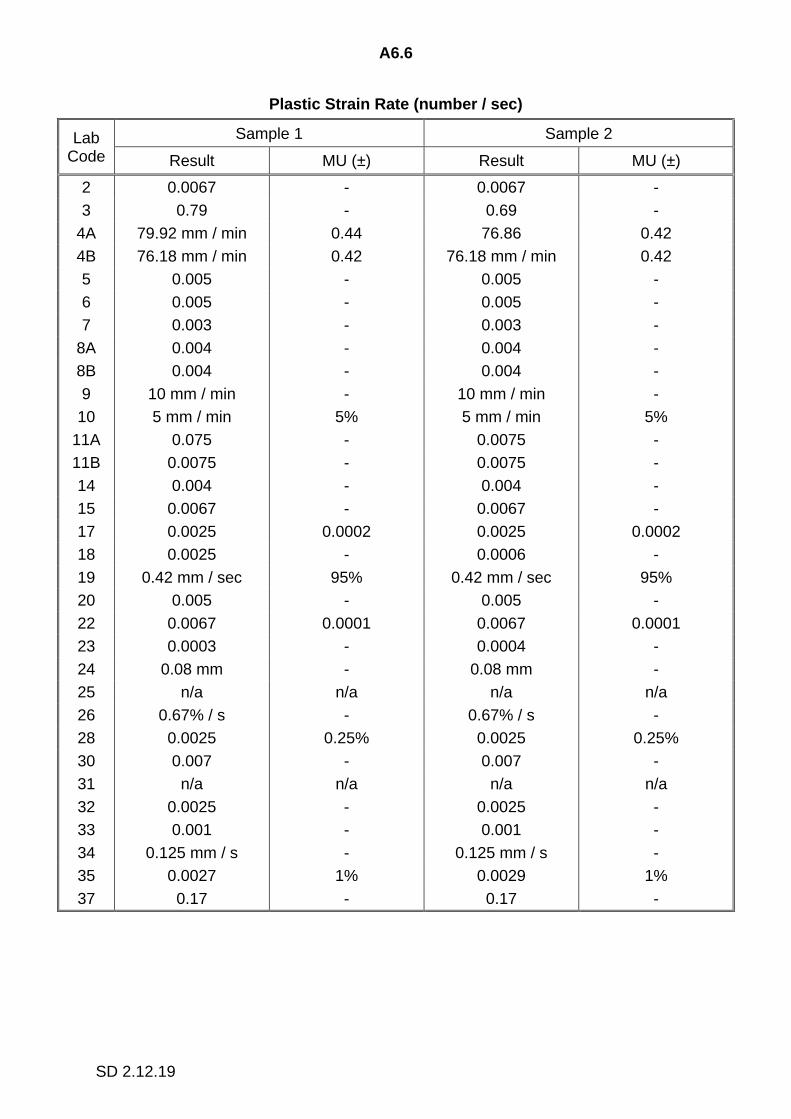
Plastic Strain Rate (number / sec)
Lab Code
Sample 1 Sample 2
Result MU (±) Result MU (±)
2 0.0067 - 0.0067 -
3 0.79 - 0.69 -
4A 79.92 mm / min 0.44 76.86 0.42
4B 76.18 mm / min 0.42 76.18 mm / min 0.42
5 0.005 - 0.005 -
6 0.005 - 0.005 -
7 0.003 - 0.003 -
8A 0.004 - 0.004 -
8B 0.004 - 0.004 -
9 10 mm / min - 10 mm / min -
10 5 mm / min 5% 5 mm / min 5%
11A 0.075 - 0.0075 -
11B 0.0075 - 0.0075 -
14 0.004 - 0.004 -
15 0.0067 - 0.0067 -
17 0.0025 0.0002 0.0025 0.0002
18 0.0025 - 0.0006 -
19 0.42 mm / sec 95% 0.42 mm / sec 95%
20 0.005 - 0.005 -
22 0.0067 0.0001 0.0067 0.0001
23 0.0003 - 0.0004 -
24 0.08 mm - 0.08 mm -
25 n/a n/a n/a n/a
26 0.67% / s - 0.67% / s -
28 0.0025 0.25% 0.0025 0.25%
30 0.007 - 0.007 -
31 n/a n/a n/a n/a
32 0.0025 - 0.0025 -
33 0.001 - 0.001 -
34 0.125 mm / s - 0.125 mm / s -
35 0.0027 1% 0.0029 1%
37 0.17 - 0.17 -
SD 2.12.19
APPENDIX B
Homogeneity
Testing
B1.1
SD 2.12.19
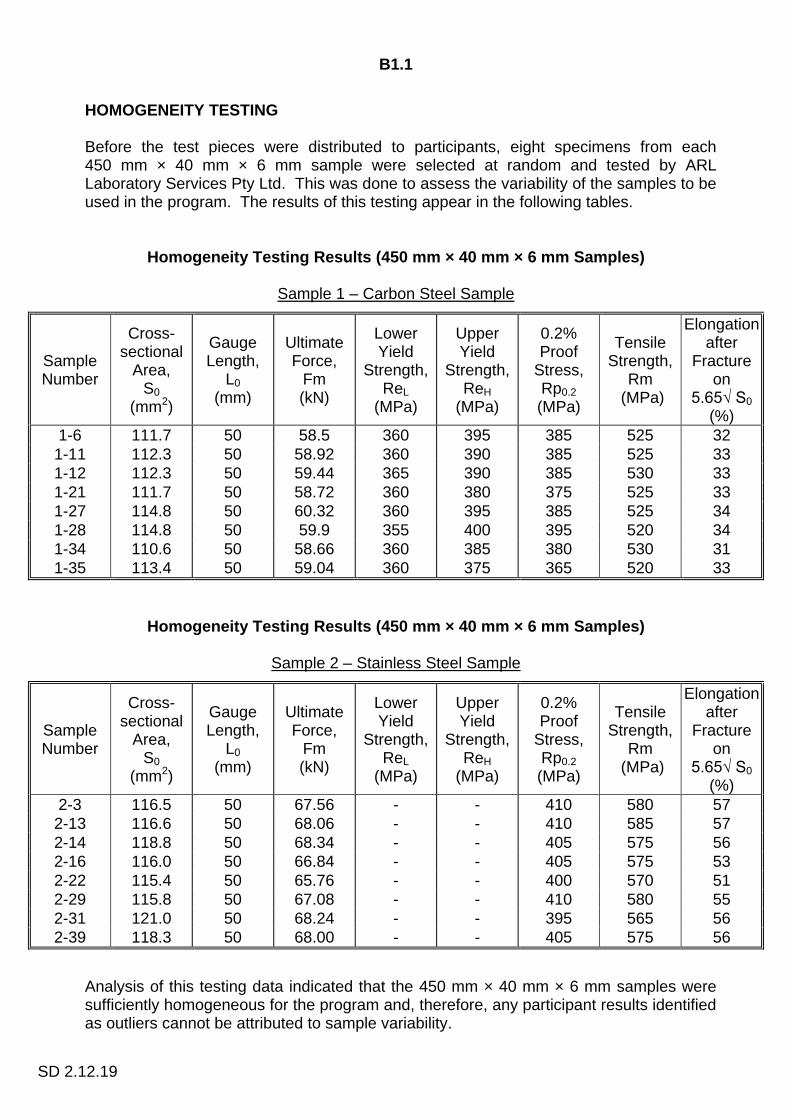
HOMOGENEITY TESTING Before the test pieces were distributed to participants, eight specimens from each 450 mm × 40 mm × 6 mm sample were selected at random and tested by ARL Laboratory Services Pty Ltd. This was done to assess the variability of the samples to be used in the program. The results of this testing appear in the following tables.
Homogeneity Testing Results (450 mm × 40 mm × 6 mm Samples)
Sample 1 – Carbon Steel Sample
Sample Number
Cross-sectional
Area, S0
(mm2)
Gauge Length,
L0 (mm)
Ultimate Force,
Fm (kN)
Lower Yield
Strength, ReL
(MPa)
Upper Yield
Strength, ReH
(MPa)
0.2% Proof
Stress, Rp0.2 (MPa)
Tensile Strength,
Rm (MPa)
Elongation after
Fracture on
5.65√ S0 (%)
1-6 111.7 50 58.5 360 395 385 525 32
1-11 112.3 50 58.92 360 390 385 525 33
1-12 112.3 50 59.44 365 390 385 530 33
1-21 111.7 50 58.72 360 380 375 525 33
1-27 114.8 50 60.32 360 395 385 525 34
1-28 114.8 50 59.9 355 400 395 520 34
1-34 110.6 50 58.66 360 385 380 530 31
1-35 113.4 50 59.04 360 375 365 520 33
Homogeneity Testing Results (450 mm × 40 mm × 6 mm Samples)
Sample 2 – Stainless Steel Sample
Sample Number
Cross-sectional
Area, S0
(mm2)
Gauge Length,
L0 (mm)
Ultimate Force,
Fm (kN)
Lower Yield
Strength, ReL
(MPa)
Upper Yield
Strength, ReH
(MPa)
0.2% Proof
Stress, Rp0.2 (MPa)
Tensile Strength,
Rm (MPa)
Elongation after
Fracture on
5.65√ S0 (%)
2-3 116.5 50 67.56 - - 410 580 57
2-13 116.6 50 68.06 - - 410 585 57
2-14 118.8 50 68.34 - - 405 575 56
2-16 116.0 50 66.84 - - 405 575 53
2-22 115.4 50 65.76 - - 400 570 51
2-29 115.8 50 67.08 - - 410 580 55
2-31 121.0 50 68.24 - - 395 565 56
2-39 118.3 50 68.00 - - 405 575 56
Analysis of this testing data indicated that the 450 mm × 40 mm × 6 mm samples were sufficiently homogeneous for the program and, therefore, any participant results identified as outliers cannot be attributed to sample variability.
B1.2
SD 2.12.19
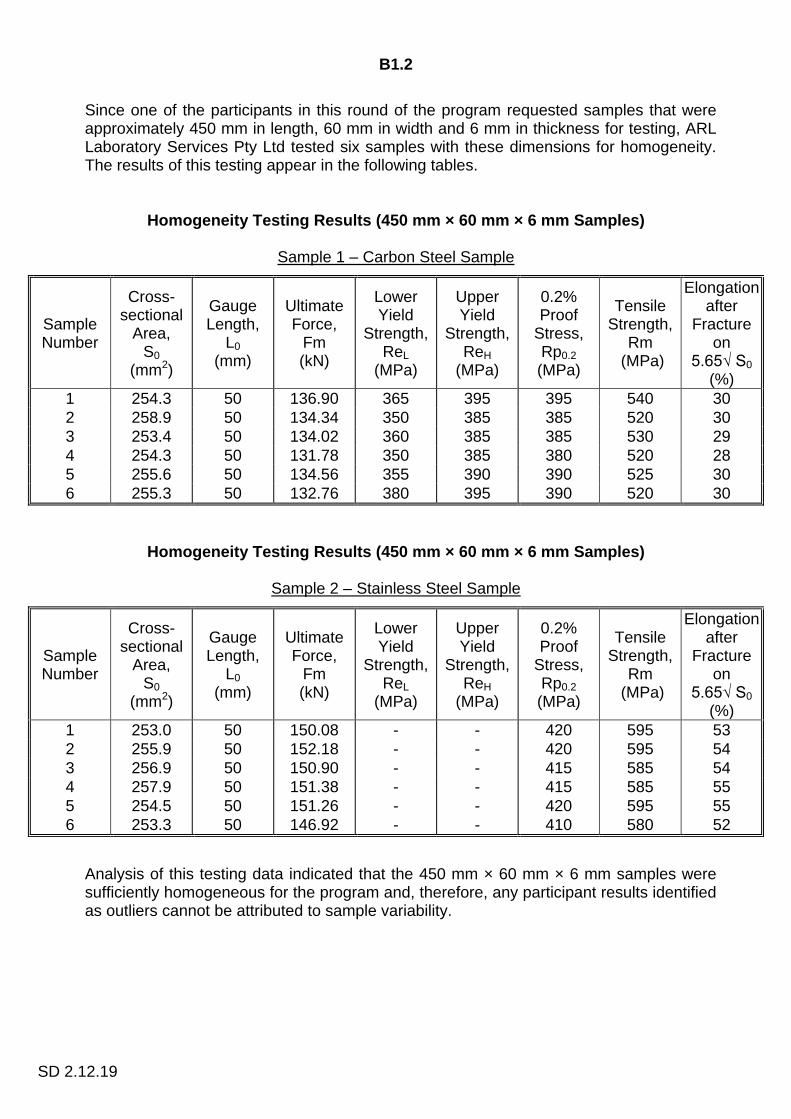
Since one of the participants in this round of the program requested samples that were approximately 450 mm in length, 60 mm in width and 6 mm in thickness for testing, ARL Laboratory Services Pty Ltd tested six samples with these dimensions for homogeneity. The results of this testing appear in the following tables.
Homogeneity Testing Results (450 mm × 60 mm × 6 mm Samples)
Sample 1 – Carbon Steel Sample
Sample Number
Cross-sectional
Area, S0
(mm2)
Gauge Length,
L0 (mm)
Ultimate Force,
Fm (kN)
Lower Yield
Strength, ReL
(MPa)
Upper Yield
Strength, ReH
(MPa)
0.2% Proof
Stress, Rp0.2 (MPa)
Tensile Strength,
Rm (MPa)
Elongation after
Fracture on
5.65√ S0 (%)
1 254.3 50 136.90 365 395 395 540 30
2 258.9 50 134.34 350 385 385 520 30
3 253.4 50 134.02 360 385 385 530 29
4 254.3 50 131.78 350 385 380 520 28
5 255.6 50 134.56 355 390 390 525 30
6 255.3 50 132.76 380 395 390 520 30
Homogeneity Testing Results (450 mm × 60 mm × 6 mm Samples)
Sample 2 – Stainless Steel Sample
Sample Number
Cross-sectional
Area, S0
(mm2)
Gauge Length,
L0 (mm)
Ultimate Force,
Fm (kN)
Lower Yield
Strength, ReL
(MPa)
Upper Yield
Strength, ReH
(MPa)
0.2% Proof
Stress, Rp0.2 (MPa)
Tensile Strength,
Rm (MPa)
Elongation after
Fracture on
5.65√ S0 (%)
1 253.0 50 150.08 - - 420 595 53
2 255.9 50 152.18 - - 420 595 54
3 256.9 50 150.90 - - 415 585 54
4 257.9 50 151.38 - - 415 585 55
5 254.5 50 151.26 - - 420 595 55
6 253.3 50 146.92 - - 410 580 52
Analysis of this testing data indicated that the 450 mm × 60 mm × 6 mm samples were sufficiently homogeneous for the program and, therefore, any participant results identified as outliers cannot be attributed to sample variability.
SD 2.12.19
APPENDIX C
Instructions to Participants
and
Results Sheet
C1.1
Tensile Testing of Metals, Round 14 March 2021 Page 1 of 3
SD 2.12.19
PROFICIENCY TESTING AUSTRALIA
Tensile Testing Of Metals Proficiency Testing Program
Round 14, March 2021
Instructions To Participants
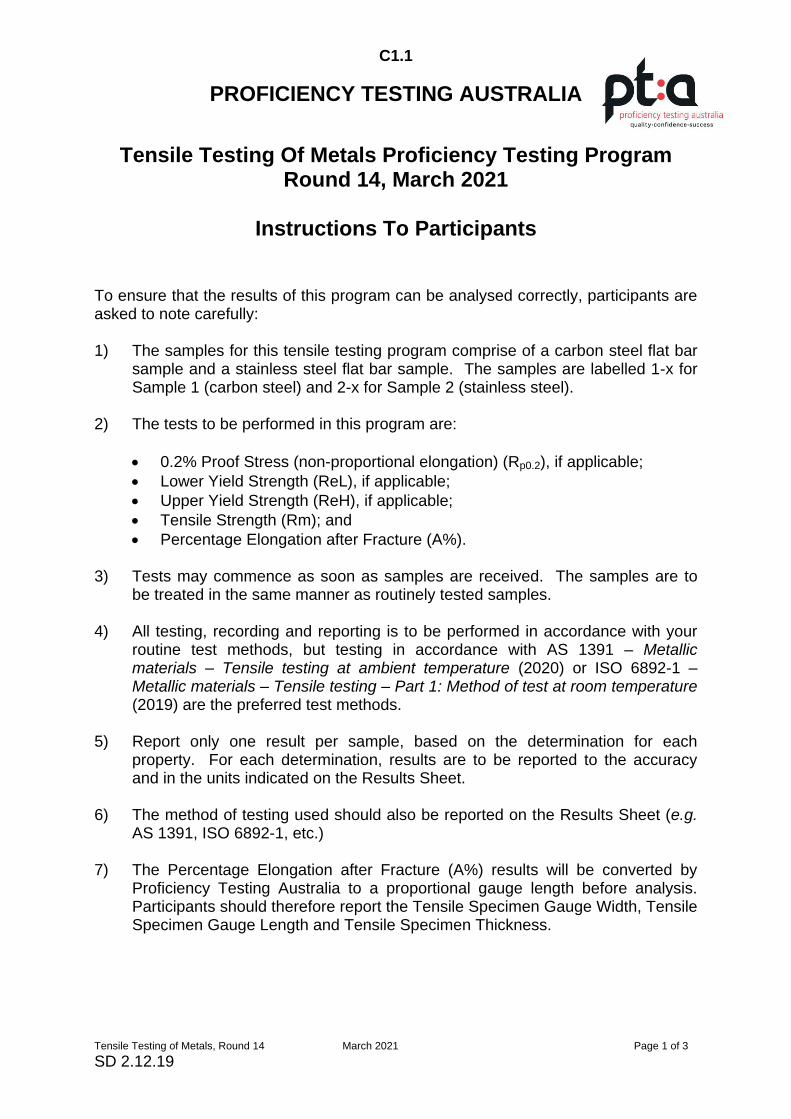
To ensure that the results of this program can be analysed correctly, participants are asked to note carefully: 1) The samples for this tensile testing program comprise of a carbon steel flat bar
sample and a stainless steel flat bar sample. The samples are labelled 1-x for Sample 1 (carbon steel) and 2-x for Sample 2 (stainless steel).
2) The tests to be performed in this program are:
0.2% Proof Stress (non-proportional elongation) (Rp0.2), if applicable;
Lower Yield Strength (ReL), if applicable;
Upper Yield Strength (ReH), if applicable;
Tensile Strength (Rm); and
Percentage Elongation after Fracture (A%).
3) Tests may commence as soon as samples are received. The samples are to be treated in the same manner as routinely tested samples.
4) All testing, recording and reporting is to be performed in accordance with your routine test methods, but testing in accordance with AS 1391 – Metallic materials – Tensile testing at ambient temperature (2020) or ISO 6892-1 – Metallic materials – Tensile testing – Part 1: Method of test at room temperature (2019) are the preferred test methods.
5) Report only one result per sample, based on the determination for each
property. For each determination, results are to be reported to the accuracy and in the units indicated on the Results Sheet.
6) The method of testing used should also be reported on the Results Sheet (e.g.
AS 1391, ISO 6892-1, etc.)
7) The Percentage Elongation after Fracture (A%) results will be converted by Proficiency Testing Australia to a proportional gauge length before analysis. Participants should therefore report the Tensile Specimen Gauge Width, Tensile Specimen Gauge Length and Tensile Specimen Thickness.
C1.2
Tensile Testing of Metals, Round 14 March 2021 Page 2 of 3
SD 2.12.19
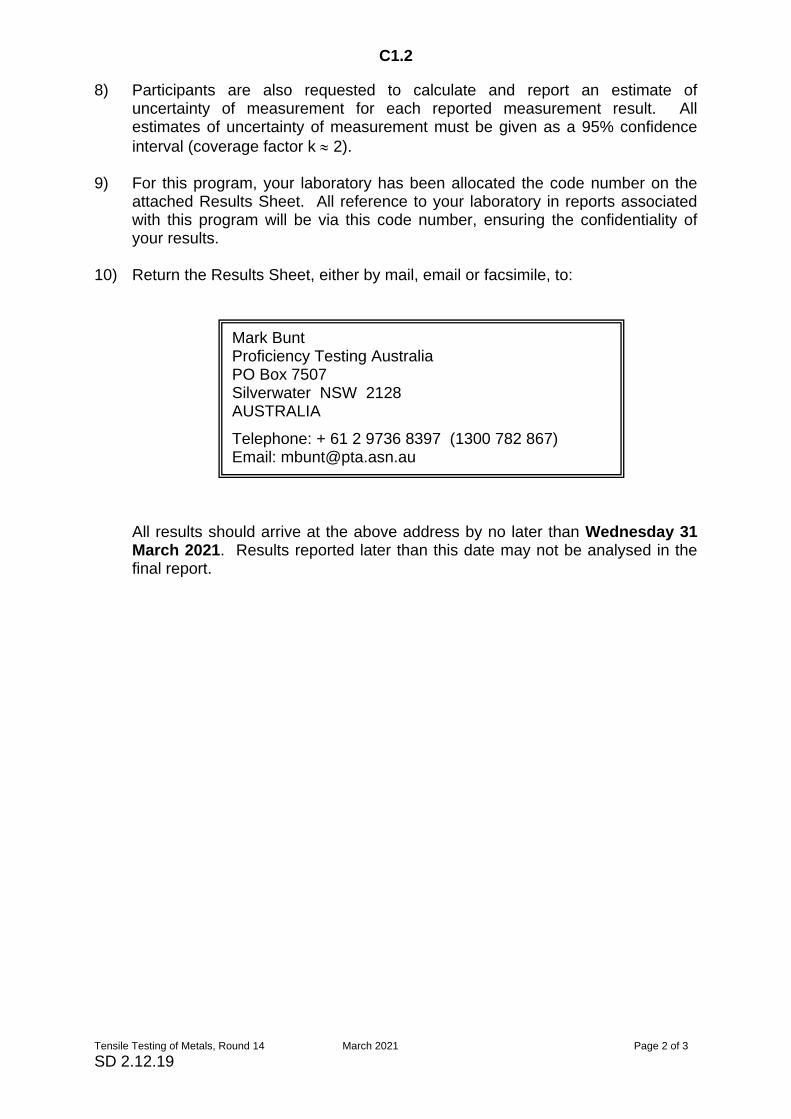
8) Participants are also requested to calculate and report an estimate of uncertainty of measurement for each reported measurement result. All estimates of uncertainty of measurement must be given as a 95% confidence
interval (coverage factor k 2). 9) For this program, your laboratory has been allocated the code number on the
attached Results Sheet. All reference to your laboratory in reports associated with this program will be via this code number, ensuring the confidentiality of your results.
10) Return the Results Sheet, either by mail, email or facsimile, to: All results should arrive at the above address by no later than Wednesday 31
March 2021. Results reported later than this date may not be analysed in the final report.
Mark Bunt Proficiency Testing Australia PO Box 7507 Silverwater NSW 2128 AUSTRALIA
Telephone: + 61 2 9736 8397 (1300 782 867) Email: [email protected]
C2.1
Tensile Testing of Metals, Round 14 March 2021 Page 3 of 3
SD 2.12.19
PROFICIENCY TESTING AUSTRALIA
Tensile Testing Of Metals Proficiency Testing Program
Round 14, March 2021
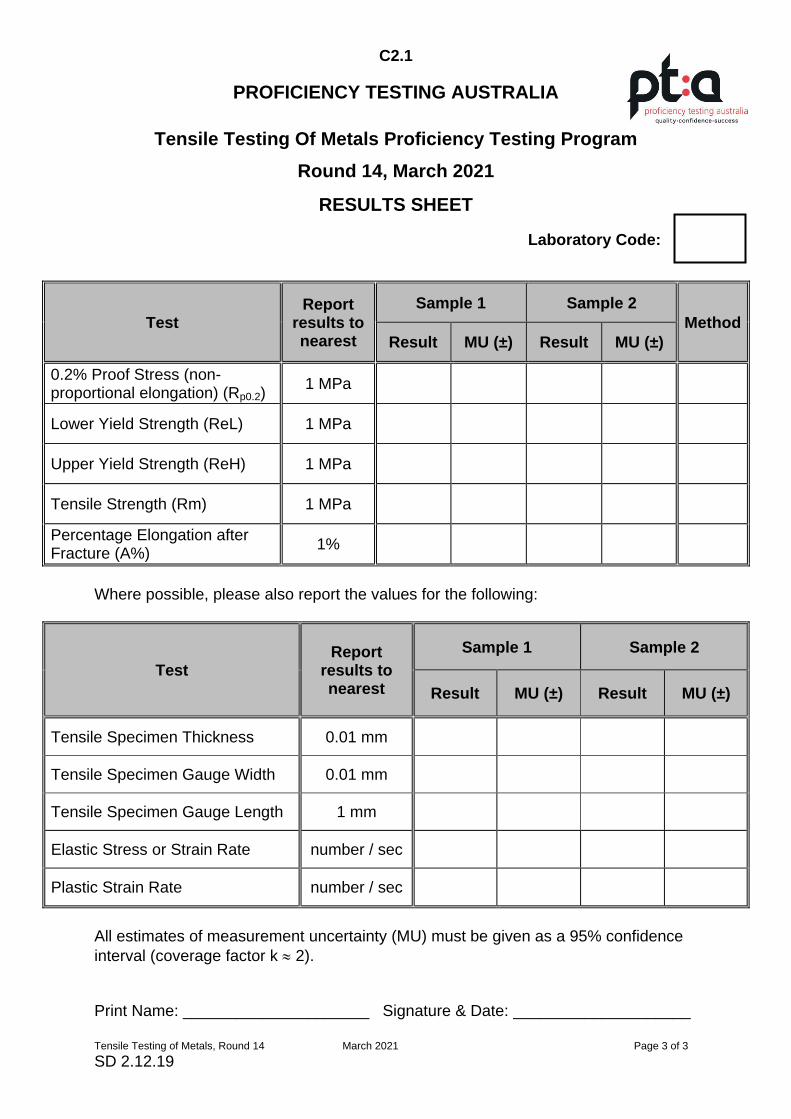
RESULTS SHEET
Laboratory Code:
Test Report
results to nearest
Sample 1 Sample 2
Method
Result MU (±) Result MU (±)
0.2% Proof Stress (non-proportional elongation) (Rp0.2)
1 MPa
Lower Yield Strength (ReL) 1 MPa
Upper Yield Strength (ReH) 1 MPa
Tensile Strength (Rm) 1 MPa
Percentage Elongation after Fracture (A%)
1%
Where possible, please also report the values for the following:
Test Report
results to nearest
Sample 1 Sample 2
Result MU (±) Result MU (±)
Tensile Specimen Thickness 0.01 mm
Tensile Specimen Gauge Width 0.01 mm
Tensile Specimen Gauge Length 1 mm
Elastic Stress or Strain Rate number / sec
Plastic Strain Rate number / sec
All estimates of measurement uncertainty (MU) must be given as a 95% confidence
interval (coverage factor k 2). Print Name: _____________________ Signature & Date: ____________________

SD 2.12.19
-----End of Report-----