final report port of nanaimo - portauthority.npa.ca · employment and the economy in the region...
TRANSCRIPT
Port of Nanaimo
Economic Impact Study
PREPARED FOR
Nanaimo Port Authority
PREPARED BY
InterVISTAS Consulting Inc.
21 October 2014
FINAL REPORT

Port of Nanaimo Economic Impact Study – 21 October 2014 i
Ongoing Economic Impacts of Port of Nanaimo
Annual Direct Impacts:
2,900 person years
$185 million in wages
$290 million in gross domestic product (GDP)
$665 million in economic output
Note: Results are based on a review of
2014 operations.
Executive Summary
The Port of Nanaimo contributes directly to employment and the economy in the region through its operations and activities. The economic contribution of the port to the community is termed the economic impact of the Port of Nanaimo. This study examines the current economic impacts of the port on the provincial economy. Economic impact is a measure of the spending and employment associated with a sector of the economy, a specific project, or a change in government policy or regulation. The three major components of economic impact are classified as direct, indirect, and induced impacts. These classifications are used as a basis for the estimation of the total economic impact of Port of Nanaimo. The port was first created in 1961 as the Nanaimo Harbour Commission. In 1999, under the Canada Marine Act, the Nanaimo Harbour Commission continued as the Nanaimo Port Authority. NPA is responsible for the management, operation and development of the port.
Ongoing Economic Impact
Direct economic impact measures the employment directly associated with the port. This includes employment from organizations such as the terminal operator, stevedores and foreman. Direct economic impacts are calculated based on employment data provided by employers directly related to the port and those firms that are located on port lands. The annual direct impacts of ongoing operations at Port of Nanaimo are estimated to be 2,900 direct person years, earning approximately $185 million in direct wages and salaries. Direct employment generates nearly $290 million in direct gross domestic product and $665 million in direct economic output in the provincial economy annually.

Port of Nanaimo Economic Impact Study – 21 October 2014 ii
Total impacts are calculated by adding together the direct operations impacts, indirect impacts, and induced impacts. Including indirect and induced multiplier impacts, ongoing economic impacts of Port of Nanaimo include a total of 5,700 person years. Total earnings of all employees amount to nearly $350 million in wages and salaries. Furthermore, Port of Nanaimo operations contribute an estimated $585 million and $1.2 billion, in total gross domestic product (GDP) and total economic output, respectively, to the provincial economy. The total economic impacts of ongoing operations at Port of Nanaimo on the provincial economy are summarized in Figure ES-1.
Figure ES-1: Annual Total Ongoing Economic Impacts of Port of Nanaimo
Notes: Job multiplier impacts based on the direct jobs to person years ratio
Wages, GDP, and Economic Output are in 2014 prices
Results are based on a review of 2014 operations
Type of Impact Employment
(Jobs) Employment
(Person Years) Wages
($Millions) GDP
($Millions)
Economic Output
($Millions)
Direct Impacts 3,200 2,900 185 290 665
Indirect 2,000 1,800 110 170 385
Induced 1,200 1,000 55 125 190
Total Impacts 6,400 5,700 350 585 1,240

Port of Nanaimo Economic Impact Study – 21 October 2014 iii
Tax Impacts of Port of Nanaimo
Federal Government:
$50 million (66% of total)
Provincial Government:
$24 million (31% of total)
Municipal Government:
$2 million (3% of total)
Total Tax Impact:
$76 million
Annual Tax Impacts
Port of Nanaimo is also an important generator of taxation revenues to all levels of government. Total taxes paid on an annual basis, paid by employers, and employees at Port of Nanaimo, are estimated at $76 million per year. The majority of taxes collected (66%) accrue to the federal government. The provincial government received $24 million in tax revenues (31% of total). Municipal governments also benefit from Port of Nanaimo through the collection of property taxes and payments in lieu of tax, amounting to approximately $2 million paid by Port of Nanaimo and its tenants (3% of total), as shown in Figure ES-2.
Figure ES-2: Annual Estimated Tax Revenues of the Port of Nanaimo ($millions)

Port of Nanaimo Economic Impact Study – 21 October 2014 iv
ContentsnoCntents
Executive Summary ....................................................................................................... i
1 Introduction ............................................................................................................ 1
1.1 The Port of Nanaimo & Facilities ...................................................................................... 1 1.2 Port Traffic Activity ............................................................................................................ 2 1.3 Nanaimo Industry and Economy ...................................................................................... 4 1.4 What is Economic Impact? ............................................................................................... 5 1.5 Port of Nanaimo Economic Impact ................................................................................... 5
2 Methodology ........................................................................................................... 7
2.1 Introduction ....................................................................................................................... 7 2.2 Estimating Current Economic Impact ............................................................................... 7 2.3 Surveying Direct Employment .......................................................................................... 8 2.4 Inferring Employment ........................................................................................................ 8 2.5 Estimating Indirect and Induced Impacts Using Economic Multipliers ............................. 9 2.6 Study Time Frame ............................................................................................................ 9 2.7 Jobs versus Person Years ................................................................................................ 9 2.8 Estimating Tax Revenues ............................................................................................... 10
3 Direct Employment Impacts of Port Operations ................................................ 11
3.1 Introduction ..................................................................................................................... 11 3.2 Direct Employment and Wages ...................................................................................... 11 3.3 Direct Full-time versus Part-time and Seasonal Employment ........................................ 12 3.4 Direct Employment by Industry Type .............................................................................. 13 3.5 Direct Employment by Job Category .............................................................................. 14
4 Indirect and Induced Employment Impacts of Port Operations ........................ 15
4.1 Introduction ..................................................................................................................... 15 4.2 Indirect Employment ....................................................................................................... 15 4.3 Induced Employment ...................................................................................................... 15 4.4 Total Employment ........................................................................................................... 16
5 Other Economic Impacts of Port Operations ..................................................... 17
5.1 Introduction ..................................................................................................................... 17 5.2 Gross Domestic Product and Economic Output ............................................................. 18
6 Cruiseship Spending Impacts ............................................................................. 19
6.1 Introduction ..................................................................................................................... 19 6.2 Cruise Ship Visitor & Crew Expenditures ....................................................................... 19
7 Tax Impacts .......................................................................................................... 20
7.1 Introduction ..................................................................................................................... 20 7.2 Tax Contributions by Level of Government .................................................................... 20
8 Summary .............................................................................................................. 22
8.1 Ongoing Economic Impact.............................................................................................. 22 8.2 Annual Tax Contribution ................................................................................................. 23
Appendix A: Employment Survey .............................................................................. 24

Port of Nanaimo Economic Impact Study – 21 October 2014 v
Appendix B: Sample Survey ...................................................................................... 27
Appendix C: Summary of Total Jobs and Full-Time Equivalent Jobs, Port Operations Only .............................................................................................................................. 35
Appendix D: Calculation of Person Years ................................................................ 36
Appendix E: Inferred Employment ............................................................................ 37
Appendix F: Contract Employment ........................................................................... 38
Appendix G: Tax Revenues Attributable to Employers ........................................... 39
Appendix I: Glossary of Terms ................................................................................. 41

Port of Nanaimo Economic Impact Study – 21 October 2014 1
1 Introduction
The Port of Nanaimo generates important employment and economic contributions to the provincial economy. The best way to show these impacts is through an economic impact study. Economic impact studies are an important tool in communicating the significance and role of a port, like Port of Nanaimo to the community. This study examines the current economic impacts of the operations and activities of the port.
1.1 The Port of Nanaimo & Facilities
The port was first created in 1961 as the Nanaimo Harbour Commission. The Nanaimo Port Authority (NPA) was formed in 1999 under the Canada Marine Act, to operate the Port of Nanaimo on behalf of the Government of Canada. The NPA is responsible for marine management and operations within the Georgia Strait, in the area adjacent to Nanaimo, British Columbia. The Port of Nanaimo is Vancouver Island’s largest commercial port. The NPA is not funded by any government source as it is self-sufficient; it generates revenues from harbour operations, cargo operations, moorage operations and property management.
The Port has two terminal facilities and a cruise ship facility, which was recently completed in 2011. The port is equipped with a container handling crane, tractors, fork/clamps, container handling toplift and lumber/pulp/newsprint trailers, and is staffed with longshore labour and stevedores for ship loading and unloading. There are four commercial berths, three of which are deep sea berths.
The NPA oversees the Nanaimo Assembly Wharf terminal, the Duke Point terminal, the Cruise Ship facility, two private marinas, as well a number of other facilities including a plaza shopping square, pier, lagoon and seaplane terminal. Figure 1-1 provides a breakdown of the specifications of the terminals.
Port of Nanaimo
3.4 million metric tonnes of total cargo throughput in 2013
Nanaimo, BC
CMA population is approximately 100,000
Measurements of Economic Impact
Employment (Jobs & Person Years)
Earnings
Gross Domestic Product (GDP)
Economic Output

Port of Nanaimo Economic Impact Study – 21 October 2014 2
Figure 1-1: Terminal Facilities at the Port
1.2 Port Traffic Activity
Figure 1-2 illustrates total cargo traffic at the Port of Nanaimo from 1997 to 2013. Total cargo traffic at the port was experiencing a downward trend from the late 1990s until the late 2000s. In 2010, total cargo traffic increased back to levels not seen since the prior decade. The main reason was an increase in “other forest products” exports through Port of Nanaimo (See Figure 1-3). BC Ferries also operates commercial passenger ferry routes from Nanaimo to the Lower Mainland. Passenger counts have seen a modest decline over the past 5 years as displayed in Figure 1-4. Traffic in 2014 is tracking ahead of passenger counts from previous years.
Nanaimo Assembly Wharf
• Three berths (two ISPS-certified deep sea)
• 8,332m2 of covered storage area
• 15 ha paved storage, three warehouses (two bonded facilities)
• Cargo handling equipment
Duke Point Terminal
• Deep sea berth
• 6 ha paved area
• 40 tonne container handling crane
• Leased industrial zone property in multi-use area
• Ferry terminal
• Deep sea barge facility
Cruise Ship Terminal
• Welcome centre
• CBSA inspection facility
• Permanent floating dock

Port of Nanaimo Economic Impact Study – 21 October 2014 3
Figure 1-2: Total Cargo at Port of Nanaimo, 1997-2013
Source: Nanaimo Port Authority.
Figure 1-3: Total Exports at Port of Nanaimo, 1997-2013
Source: Nanaimo Port Authority.

Port of Nanaimo Economic Impact Study – 21 October 2014 4
Figure 1-4: BC Ferries Passenger Traffic, 2009-2013
Source: Nanaimo Port Authority.
1.3 Nanaimo Industry and Economy
Nanaimo, the second largest city on Vancouver Island, is located on the eastern side of the island, approximately 111 km from Victoria (the provinces’ capital). The area has a long history as a commodity based economy focusing on coal mining and forestry. The area has since grown to include a number of service-based industries as well.
In 2013, the Nanaimo Census Agglomeration had a population of approximately 100,555, which is up 1.1% since 2011.
1 The total labour force of Nanaimo amounts to 55,000 people, with the top industries in
Nanaimo including retail trade, construction and professional services.2 The median income for all
employment in Nanaimo amounts $28,982 per annum in 2009, which was 1.2% lower than the provincial median.
3 At the provincial level, British Columbia has a population of approximately 4.6 million and a real
GDP of nearly $220 billion in 2012.
The port plays a significant role in the region by providing the transportation access and linkages to various markets, customers and suppliers. The cruise ship terminal also supports the growing tourism industry in the area.
A map of the Port of Nanaimo is shown in Figure 1-6.
1 BC Stats, Demographic Analysis Section, Population Estimates by CAMs and CAs.
2 Statistics Canada, Labour force survey estimates.
3 Nanaimo Economic Development Corporation.

Port of Nanaimo Economic Impact Study – 21 October 2014 5
Figure 1-5: Map of Nanaimo Port Authority Jurisdiction
Source: Nanaimo Port Authority.
1.4 What is Economic Impact?
Economic impact is a measure of the spending and employment associated with a sector of the economy, a specific project, or a change in government policy or regulation. Economic impact is most commonly measured in several ways, including employment, income, gross domestic product (GDP), and economic output, as explained in Figure 1-5.
1.5 Port of Nanaimo Economic Impact
The three major components of economic impact are direct, indirect, and induced impacts. These distinctions are used as a base for the estimation of total economic impact of a port. Each of these three components requires different tools of analysis. Employment impact analysis determines the economic impact in terms of jobs created and salaries and wages paid out. In the case of the port, the direct, indirect, induced, and total numbers of person years created at the port are examined to produce a snapshot of port operations.

Port of Nanaimo Economic Impact Study – 21 October 2014 6
Direct impacts account for the economic activity of the target sector itself. Direct employment impacts are measured by counting those individuals who work in a particular sector of the economy. In the case of a port, all of those people who work in a port related capacity either on-site or off-site would be considered direct employment (e.g. stevedores, longshoremen based at Nanaimo, and port staff members, etc.).
Indirect impacts are those that result because of the direct impacts. For a port, indirect impacts encompass the economic activities of firms that serve port users. Indirect employment includes the portion of employment in supplier industries which are dependent on sales to the water transport sector. An example would be food wholesalers that supply food for catering on ferry trips.
Induced impacts are economic impacts created by the spending of wages, salaries, and profits earned in the course of the direct and indirect economic activities. Induced employment is employment generated from expenditures by individuals employed indirectly or directly. For instance, if a boat maintenance firm employee decides to re-model his/her home, this would result in additional (induced) employment hours in the general economy. The home renovation project would support hours of induced employment in the construction industry, the construction materials industry, etc. Induced
impact is often called the household‐spending effect.
Total impacts are the sum of direct, indirect, and induced effects.
Figure 1-6: Measurements of Economic Impact
•Person years of employment generated. As many jobs may be only part-time or seasonal, the number of jobs is greater than the number of person years.
Employment
(Person Years)
• Includes wages, salaries, and benefits associated with employment tied to the sector, project or policy/regulatory change.
Earnings
•A measure of the money value of final goods and services produced locally as a result of economic activity. This measure does not include the value of intermediate goods and services used up to
produce the final goods and services.
Gross Domestic Product (GDP)
•The dollar value of industrial output produced. Sometimes referred to as “economic activity,” it reflects the spending (i.e., capital improvement plus revenue) by firms, organizations and individuals. In the case of organizations that do not generate revenue, annual operating expenses are counted.
Economic Output

Port of Nanaimo Economic Impact Study – 21 October 2014 7
2 Methodology
2.1 Introduction
InterVISTAS conducted this economic impact study during the spring/summer of 2014. The study estimates the economic impact of Port of Nanaimo’s operations in June 2014.
To calculate the direct employment impacts, the study team surveyed all the employers associated with the operation of Port of Nanaimo (e.g., terminal, stevedores, etc.). The survey produced estimates of the number of individuals employed in directly-related occupations and firms located on port lands, as well as the total amount of earnings paid to all employees. The employment survey was used to classify the total employment and average wages paid by business type.
InterVISTAS estimates the indirect and induced effects using economic multipliers developed by Statistics Canada. InterVISTAS utilizes a proprietary economic model to conduct multiplier analysis and estimate indirect and induced impacts.
We used the data from the survey to calculate the associated tax impacts (government revenue) generated by the port’s operations.
2.2 Estimating Current Economic Impact
The direct employment base related to ongoing operations at the Port of Nanaimo is measured first. Employment figures are generally more understandable by the public than more abstract measures, such
as economic output or GDP. Employment figures also have the advantage of being a more accurate measure, both because the firms are more likely to provide data on employment, as opposed to information on revenues, wages and other monetary amounts, and because there is less chance of double counting economic activity.
The economic impact study then assesses the indirect and induced (or “multiplier”) employment supported by Port of Nanaimo’s operations, as well as economic activity in terms of economic output and GDP using Statistics Canada multipliers. The tax revenue generated annually by operations at the port is also estimated.
Survey Response Rate
79% of surveys were responded to based on 92 potential surveys
93% of total person years covered by the survey
Study Time Frame
2014 operations
Economic Multiplier Source
Statistics Canada, Industry Accounts Division: Input-Output Multipliers for
British Columbia, 2010
Port of Nanaimo Economic Impact Study – 21 October 2014 8
2.3 Surveying Direct Employment
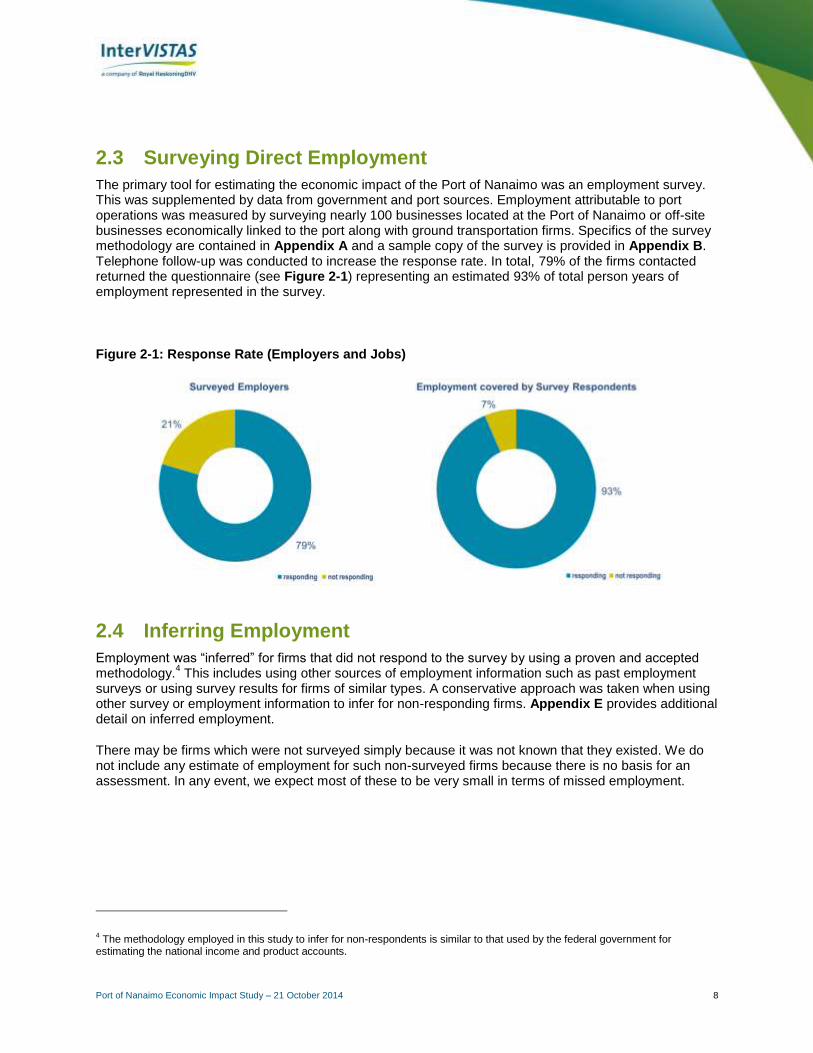
The primary tool for estimating the economic impact of the Port of Nanaimo was an employment survey. This was supplemented by data from government and port sources. Employment attributable to port operations was measured by surveying nearly 100 businesses located at the Port of Nanaimo or off-site businesses economically linked to the port along with ground transportation firms. Specifics of the survey methodology are contained in Appendix A and a sample copy of the survey is provided in Appendix B. Telephone follow-up was conducted to increase the response rate. In total, 79% of the firms contacted returned the questionnaire (see Figure 2-1) representing an estimated 93% of total person years of employment represented in the survey.
Figure 2-1: Response Rate (Employers and Jobs)
2.4 Inferring Employment
Employment was “inferred” for firms that did not respond to the survey by using a proven and accepted methodology.
4 This includes using other sources of employment information such as past employment
surveys or using survey results for firms of similar types. A conservative approach was taken when using other survey or employment information to infer for non-responding firms. Appendix E provides additional detail on inferred employment.
There may be firms which were not surveyed simply because it was not known that they existed. We do not include any estimate of employment for such non-surveyed firms because there is no basis for an assessment. In any event, we expect most of these to be very small in terms of missed employment.
4 The methodology employed in this study to infer for non-respondents is similar to that used by the federal government for
estimating the national income and product accounts.

Port of Nanaimo Economic Impact Study – 21 October 2014 9
2.5 Estimating Indirect and Induced Impacts Using Economic Multipliers
Measurement of indirect and induced economic activity is difficult. While it might be possible to conduct a survey of such employers, the survey would need to cover thousands of firms for indirect employment. For induced employment, the entire economy would need to be scrutinised. In addition to the time and financial resources needed to conduct such surveys, the quality of responses would be suspect.
As an alternative to costly and inaccurate surveys, indirect and induced effects are typically measured by the use of economic multipliers.
5 Multipliers are derived from economic/ statistical/accounting models of
the general economy. They come in a variety of forms and differ greatly in definition and application. Thus, great care must be exercised in choosing the appropriate set of multipliers to use. In addition, the use of multiplier analysis is limited by a number of factors, these being:
the accuracy of the structure and parameters of the underlying model;
the level of unemployment in the economy;
the assumption of constant returns to scale in production;
the assumption that the economy's structure is static over time; and
the assumption that there are no displacement effects.
Multiplier impacts must be interpreted with caution since they may be illusory when the economy experiences high employment and output near industry capacity. When they are reported, it is recommended that the reader be reminded of the limitations on the use of multipliers. Mindful of these limitations, this study has undertaken multiplier analysis to estimate indirect and induced employment.
2.6 Study Time Frame
The employment survey was conducted between July to October 2014.6
2.7 Jobs versus Person Years
Traditionally, employment is measured in terms of number of jobs. However, when part-time and/or seasonal workers are used, this can be a misleading measure resulting in an overstatement of economic impact. For example, one firm with 100 part-time employees may have a similar overall economic impact to another firm with 50 full-time employees. Whenever possible, employment impacts are measured both in terms of the number of jobs and the number of person years.
7
5 The multipliers used for the analysis are based on Statistics Canada economic multipliers for Newfoundland and Labrador from the
2010 Interprovincial Input-Output model, the most recent data available. These multipliers were updated with Consumer Price Indices to account for inflation. 6 The survey results include seasonal workers.
7 One person year is equivalent to 1,832 hours of work. Please see Appendix D for a detailed calculation of the number of hours
per person year. Person years are the same as full-time equivalents (FTEs).

Port of Nanaimo Economic Impact Study – 21 October 2014 10
2.8 Estimating Tax Revenues
The tax revenue contributions to the federal, provincial, and municipal levels of government that are associated with port operations are also estimated. This includes taxes paid by employers and employees (such as payroll taxes), and the Port of Nanaimo (such as payments in lieu of taxes). Estimated tax revenues are for calendar year 2013.

Port of Nanaimo Economic Impact Study – 21 October 2014 11
Annual Operations at the Port of Nanaimo support:
3,200 direct jobs
2,900 direct person years
$185 million in wages
Direct employment related to Port operations includes:
95% permanent jobs
5% seasonal jobs
The larger employers at the Port are:
Forestry (37%)
Ferry, Port & Terminal (34%)
Government & Regulatory
(12%)
3 Direct Employment Impacts of Port Operations
3.1 Introduction
This chapter describes the direct employment at the Port of Nanaimo. Jobs and person years (or full-time equivalents) figures are presented and wages associated with this direct employment are estimated. The following sections break down the direct employment in the Port of Nanaimo business community in more detail. Jobs are broken down by:
Full-time versus part-time employment; and
Seasonal versus non-seasonal.
Direct employment is also broken down by business type and by job trade.
3.2 Direct Employment and Wages
Direct employment related to on-going operations at the Port of Nanaimo totalled 3,200 jobs. After adjusting for part-time, seasonal and contract employment, these 3,200 jobs amounted to approximately 2,900 person years of employment.
Direct employment at these firms earned over $185 million in wages, yielding an average of approximately $63,800 per person year of employment. Employment figures are summarised in Table 3-1 for wages, as well as jobs and person years.
Table 3-1: Direct Employment for the Port of Nanaimo
Notes: Wages are in 2014 prices Total employment includes persons on contract.
Type of Impact Employment (Jobs) Employment
(Person Years) Wages
($ Millions)
Direct Impacts 3,200 2,900 185

Port of Nanaimo Economic Impact Study – 21 October 2014 12
3.3 Direct Full-time versus Part-time and Seasonal Employment
Of the surveyed direct permanent jobs attributable to the Port of Nanaimo operations, 95% were full-time jobs. The breakdown of the Port of Nanaimo jobs and person years by part-time and full-time positions is presented in Figure 3-1.
Figure 3-1: Full-Time versus Part-time Employment
Figure 3-2 shows that in 2013, the seasonal component of the Port of Nanaimo’s direct employment base accounted for 5% of total surveyed jobs and for 1% of total surveyed person years.
Figure 3-2: Permanent versus Seasonal Employment

Port of Nanaimo Economic Impact Study – 21 October 2014 13
3.4 Direct Employment by Industry Type
A breakdown of direct employment at the port, by industry type, provides insight into the different industries operating at the port. Figure 3-3 details direct employment of each industry.
The largest category of direct employment is forestry which accounts for a number of large mills and processing plants located in Nanaimo. There are also a significant number of person years attributed to seasonal logging. The second largest contributor of person years in Nanaimo is the ferry, port and terminal category. Terminal users, ferry services and firms involved with the port itself are included in this category, and represent approximately 34% of the total person years. The third largest category is government and regulatory services, which accounts for over 350 person years of employment.
Figure 3-3: Direct Employment by Industry Type at the Port of Nanaimo

Port of Nanaimo Economic Impact Study – 21 October 2014 14
3.5 Direct Employment by Job Category
Firms that responded to the employment survey were asked to provide a breakdown of their firm’s job functions by category. Although this is not a complete picture of the total employment related to the port, it provides an indication of the trades that are most frequently employed in the port business community.
According to Figure 3-4, Construction & Maintenance is the most common job category with more than 520 jobs. These are followed by Managerial/Clerical with approximately 502, then by Sales/Customer Service with close to 355 jobs. Of the survey respondents that indicated a type of employment other than the categories listed in the survey, some provided a specific title or job description in the “other” category. These included:
Loggers
Terminal Workers
Hotel Employees
Production Workers
Machine Operators
Research/Government Workers
Figure 3-4: Direct Employment by Job Category at the Port
Note: Not all responding firms provided a breakdown of employment by job trade.

Port of Nanaimo Economic Impact Study – 21 October 2014 15
Indirect employment impacts of the Port of Nanaimo include:
1,800 indirect person years
$110 million in indirect wages
Induced employment impacts of the Port include:
1,000 induced person years
$55 million in induced wages
Total employment impacts of the Port include:
5,700 total person years
$350 million in total wages
4 Indirect and Induced Employment Impacts of Port Operations
4.1 Introduction
The previous sections discussed how direct employment related to ongoing operations at the port as measured. However, the employment impact of the port does not end there, as other sectors of the economy are dependent on these employers’ businesses. Indirect employment is generated by suppliers to the businesses directly related to the port. In addition, there may be a general stimulus to the province-wide economy when direct (and indirect) employees spend their wages. These employment effects are referred to as induced employment. Total employment effects therefore equal the sum of direct, indirect and induced effects.
4.2 Indirect Employment
Indirect employment is employment in non-port industries that supply or provide services to this industry. Based on an analysis of the results of our survey of employers and the application of the provincial economic multipliers, it is estimated that 1,800 indirect person years are related to the Port of Nanaimo’s operations. In other words, 1,800 person years are indirectly generated in industries that supply the businesses directly related to the port. Wages associated with the total indirect employment are estimated at $110 million per annum.
4.3 Induced Employment
Induced employment is employment created because of expenditures by individuals employed both directly and indirectly by businesses directly related to the port. It represents the demand for goods and services generated by wage earnings from economic activity directly related to the port. Induced employment attributable to the Port of Nanaimo is estimated at 1,000 person years, generating $55 million per annum in earnings.

Port of Nanaimo Economic Impact Study – 21 October 2014 16
4.4 Total Employment
Ongoing port operations generate a total of 5,700 person years and $350 million in wages, including induced and indirect effects.
Figure 4-1 summarizes the direct, indirect, induced, and total impact of employment and wages in the surrounding provincial economy attributable to ongoing operations at the Port of Nanaimo.
Figure 4-1: Annual Direct, Indirect, Induced and Total Employment Impacts of the Port of Nanaimo
Type of Impact Employment
(Person Years) Wages
($ Millions)
Direct 2,900 185
Indirect 1,800 110
Induced 1,000 55
Total Impacts 5,700 350

Port of Nanaimo Economic Impact Study – 21 October 2014 17
Direct other economic impacts of the Port:
$290 million in direct GDP
$665 million in direct Economic Output
Indirect other economic impacts of the Port:
$170 million in indirect GDP
$385 million in indirect Economic Output
Induced other economic impacts of the Port:
$125 million in induced GDP
$190 million in induced Economic Output
Total other economic impacts of the Port:
$585 million in indirect GDP
$1.2 billion in indirect
Economic Output
5 Other Economic Impacts of Port Operations
5.1 Introduction
Previous sections of the report focused on the employment impacts of operations at the Port of Nanaimo. This section turns to the broader economic impacts of the port that are measured using dollar values.
The two most common measures of economic contribution (in addition to employment) are gross domestic product (GDP) and economic output. GDP is a measure of the money value of final goods and services produced as a result of economic activity, and measures only value-added revenues. Economic output is the dollar value of industrial output produced and roughly corresponds to the gross revenue of goods or services produced by an economic sector. As such, GDP removes the revenues to suppliers of intermediate goods and services and only includes the revenues from value-added production. Alternatively, economic output adds all revenues at each stage of production together as a measure of total production in the economy. Economic output will always be greater than GDP (also termed value-added). In service industries and the public sector, economic output is often simplified to equate to total wages paid.
To estimate economic output for a sector, one might add up the gross revenues of the various firms in that sector. However, to find GDP for a sector, care must be taken to avoid double-counting. The revenues of one firm providing service to another
are not incremental GDP. For example, in the automobile sector, one cannot add the value (gross revenue) of a finished auto to the value of the tires. The tires are already included in the value of the automobile.
One approach to measuring economic output and value-added GDP is to ask firms in a survey to provide information on their gross revenues, payments to suppliers, etc. However, there are several problems with this approach.

Port of Nanaimo Economic Impact Study – 21 October 2014 18
First, it is much too expensive. Second, the double counting problem makes this approach impractical. An alternative is to infer economic output and GDP for an economic sector from employment data using economic multipliers. Statistics Canada produces economic multipliers on a national and provincial level. Using these economic multipliers is both cost effective and more accurate than obtaining the data from surveys. This method is the approach adopted here.
5.2 Gross Domestic Product and Economic Output
The direct employment from ongoing port operations generates $290 million in direct GDP and $665 million in direct economic output. Including multiplier effects, operations at the port support $585 million total (direct, indirect and induced) GDP and $1.2 billion in economic output. Figure 5-1 summarizes the GDP and economic output contributions of ongoing port operations at Nanaimo to the provincial economy.
Figure 5-1: GDP and Economic Output Impacts at the Port of Nanaimo
Notes:
GDP and Economic Output are in 2014 prices
Type of Impact GDP
($Millions) Economic Output
($Millions)
Direct 290 665
Indirect 170 385
Induced 125 190
Total Impacts 585 1,240

Port of Nanaimo Economic Impact Study – 21 October 2014 19
6 Cruiseship Spending Impacts
6.1 Introduction
Nanaimo is one of five cruiseports in B.C. which inlude: Nanaimo, Vancouver, Victoria, Prince Rupert and Campbell River. The NPA has a modern cruiseship facility equipped with a welcome area and a visitor centre that awaits tourist arrivals. In 2012, construction of a state of the art cruise ship terminal was completed which now makes it much easier for passengers to step ashore and experience the city. The port receives large cruise vessels, many of which are sailing between Alaska and the U.S., as well as pocket cruiser vessels from Seattle.
Vessel traffic varies from year to year, and arrival numbers are still recovering from the 2008 economic downturn. Stops at Nanaimo from large cruise ships have become less frequent due to higher fuel costs as a result of environmental regulations. The city’s cruise season lasts from approximately April to the end of October every year due to its favourable climate. Visitors stepping off the ships can choose to shuttle downtown via several transportation options to experience museums, heritage buildings, restaurants and shopping.
6.2 Cruise Ship Visitor & Crew Expenditures
A single large cruise ship carrying an average 2,000 passengers stopping at the port accounts for an estimated $100,000 dollars in visitor spending from both passengers and ship crew.
8 This generates
significant employment at the port and supports many local businesses in retail, food and beverage and ground transportation. On average, each visitor spends approximately $50 per day.
Table 6-1: Direct Impacts from Cruise Ship Visitor Spending (2012 – 2014)
Notes: Wages and Visitor Spending are in 2014 prices.
8 Source: Visitor spending data is from Nananimo Port Authority via Cruise BC.
Direct Impacts Employment
(Person Years) Wages
($ Thousands) Visitor Spending ($ Thousands)
2012 5 220 500
2013 7 260 600
2014 2 90 200

Port of Nanaimo Economic Impact Study – 21 October 2014 20
7 Tax Impacts
7.1 Introduction
This part of the report documents the current contribution to government revenues resulting from current operations at the port and associated economic activity. This includes revenues received by federal, provincial and municipal governments.
Tax revenue consists of contributions paid by the port employers and employees to the different levels of government. They include income and payroll taxes and social insurance contributions (such as employment insurance premiums). This also includes property taxes paid by the Nanaimo Port Authority and tenants to the municipal government.
For each category, taxes paid to the federal, provincial and local levels of government are separately identified.
The purpose of this section is to present the tax revenue contributions resulting from the activity attributable to the Port of Nanaimo. As with all such studies, a conceptual decision has to be made as to how broad a definition of economic activity should be used in measuring the impacts. For this study, a relatively narrow definition has been taken, for example, the following have not been included:
Taxes associated with indirect or induced employment (i.e. multiplier effects).
Consumption taxes (e.g., PST and GST) paid by port employees when they spend their income.
Excise or import taxes on cargo.
Taxes paid by port users outside of the port.
It would be exceedingly complex to broaden the scope of the tax base in this analysis to include taxes generated by indirect and induced employment. The level of detail collected on direct employment by the survey is critical to the tax analysis while such information is not available for the indirect and induced employment. This being the case, impacts and speculation about the general economy would be complex and averages would not necessarily be precise or accurate. Therefore, the tax analysis in this report is limited to revenues attributable to direct employment only.
7.2 Tax Contributions by Level of Government
Ongoing economic activity at the Port of Nanaimo generates tax revenue for all levels of government. In 2013, total tax contributions from port related direct employment to all levels of government were approximately $76 million. Figure 6-1 provides a breakdown of tax impacts by level of government.
Annual tax contributions of the Port amount to:
$76 million
Annual tax contribution of the Port by level of government:
$50 million to the federal government (66%)
$24 million to the provincial government (31%)
$2 million to the municipal governments (3%)

Port of Nanaimo Economic Impact Study – 21 October 2014 21
The federal government was the largest recipient of tax revenue, receiving approximately $50 million (66% of total tax revenue impacts). The vast majority of that total is attributable to taxes paid by employers and employees such as income tax, corporate income tax, CPP contributions, and the like.
The provincial government received $24 million (31% of total tax revenue impacts). This total is from income taxes and provincial corporate taxes.
The municipal governments collected the remaining $2 million in tax revenue (3% of total tax revenue impacts) from the port authority and its tenants in the form or property and payments in lieu of taxes.
Figure 7-1: Annual Estimated Tax Revenues of the Port of Nanaimo by Level of Government (in $millions)

Port of Nanaimo Economic Impact Study – 21 October 2014 22
Total economic impacts of the Port include:
5,700 total person years
$350 million in total wages
$585 million in total
$1.2 billion in total Economic Output
8 Summary
8.1 Ongoing Economic Impact
Ongoing operations at the port total of 5,700 person years in the region, when multiplier impacts are included. Of this employment, 2,900 person years are directly related to the port. Because jobs related to the port extend beyond the port, the total also includes both indirect (approximately 1,800 person years) and induced employment (1,000 person years).
The Port of Nanaimo contributes significantly to the provincial economy, as well. The significance of the port is demonstrated by the direct economic impact of the port on GDP and economic output, measured at $290 million and $665 million, respectively. Including indirect and induced impacts, the total impacts are approximately $585 million and $1.2 billion, respectively. Figure 8-1 summarizes the ongoing economic impacts of the port.
Figure 8-1: Annual Total Ongoing Economic Impacts of the Port of Nanaimo
Notes:
Job multiplier impacts based on the direct jobs to person years ratio
Wages, GDP, and Economic Output are in 2014 prices
Results are based on a review of 2014 operations
Type of Impact Employment
(Jobs) Employment
(Person Years) Wages
($Millions) GDP
($Millions)
Economic Output
($Millions)
Direct Impacts 3,200 2,900 185 290 665
Indirect 2,000 1,800 110 170 385
Induced 1,200 1,000 55 125 190
Total Impacts 6,400 5,700 350 585 1,240

Port of Nanaimo Economic Impact Study – 21 October 2014 23
8.2 Annual Tax Contribution
The port is also an important generator of taxation revenues to all levels of government. Total taxes paid on an annual basis by employers and employees are estimated at $76 million per year. The majority of taxes collected accrue to the federal and provincial governments at 66% and 31%, respectively. The municipal governments also benefit from the port, such as through the collection of property taxes from the port and its tenants amounting to $2 million, as shown in Figure 8-2.
Figure 8-2: Annual Estimated Tax Revenues of the Port of Nanaimo

Port of Nanaimo Economic Impact Study – 21 October 2014 24
Appendix A: Employment Survey
Identification of the Survey Population
A total of 92 firms received employment surveys for the Port of Nanaimo’s economic impact study.
Figure A-1: Total Number of Firms Surveyed
Questionnaire Design
The basic questionnaire was designed to obtain information, and to be as clear and easy to understand as possible for respondent firms. The basic questionnaire provided to port tenants contained questions in the following areas:
General Information
Name of firm, address
Contact person's name and title
Phone and fax numbers
Email and website address
Principal business activity
Total Employment Numbers
Total employees (2014)
Number of on-site employees
Number of off-site employees
Type of Survey Number of Firms Surveyed
Number of Responding Firms
Response Rate
General 92 73 79%
Total 92 73 79%

Port of Nanaimo Economic Impact Study – 21 October 2014 25
Part-time and Full-time Employment
Full-time permanent employees
Part-time permanent employees
Full-time seasonal employees
Part-time seasonal employees
Average hours and weeks for part-time and seasonal employees
Payroll and Wage
Total payroll excluding benefits; or
Average wage per employee
Employment by Occupation
A selection of job trades was provided to categorize employment
Outsourcing and Contracting Out
Number of individuals on contract
Average hours and weeks for individuals on contract
Number and names of firms on contract
Average annual hours for firms on contract
Property Taxes & Other Taxes
Total property taxes paid (2013)
Other federal and provincial taxes paid (2013)
Business Related to the Port of Nanaimo
Proportion of firm’s business revenues related to the port (2014)

Port of Nanaimo Economic Impact Study – 21 October 2014 26
Conducting the Survey
The survey was mailed out electronically by InterVISTAS Consulting, with a cover letter from the Nanaimo Port Authority. The letter explained the purpose of the study, the confidentiality of responses and encouraged members of the port business community to participate.
Following the initial electronic mail-out of the surveys and throughout the following weeks, non-responding firms were contacted by telephone to follow-up on the completion of the survey InterVISTAS staff managed the survey follow-up. Nanaimo Port Authority staff also contributed significant time and resources to encourage survey responses from as many firms as possible. The NPA personally followed-up with the largest firms to ensure their participation in the study. Firms were encouraged to return the survey and new copies were offered if the originals were lost. The replacement surveys were emailed once again. Some survey responses were collected via a telephone interview with firms.

Port of Nanaimo Economic Impact Study – 21 October 2014 27
Appendix B: Sample Survey

Port of Nanaimo Economic Impact Study – 21 October 2014 28

Port of Nanaimo Economic Impact Study – 21 October 2014 29

Port of Nanaimo Economic Impact Study – 21 October 2014 30

Port of Nanaimo Economic Impact Study – 21 October 2014 31

Port of Nanaimo Economic Impact Study – 21 October 2014 32

Port of Nanaimo Economic Impact Study – 21 October 2014 33

Port of Nanaimo Economic Impact Study – 21 October 2014 34

Port of Nanaimo Economic Impact Study – 21 October 2014 35
Appendix C: Summary of Total Jobs and Full-Time Equivalent Jobs, Port Operations Only
The table below includes a summary of the total surveyed employment, total inferred employment for non-respondents and total contract employment. Employment is presented in both jobs and person years.
Figure C-1: Total Jobs and Person Years, Port Operations Only
Employment Source Jobs Person Years
Surveyed employment1 2,687 2,460
Inferred employment for non-respondents
2
267 189
Contract employment3 273 260
Total 3,227 2,910
Notes:
1 Appendix A
2 Appendix D
3 Appendix E

Port of Nanaimo Economic Impact Study – 21 October 2014 36
Appendix D: Calculation of Person Years
The following are details of calculations for the average number of hours per person year or full-time equivalent (FTE).
Table C-1: Full-time Equivalent Hours per Year
Calculation of FTE hours per year:
365 days per year Less: (104) weekend days (11) legal holidays (15) average vacation days (6) sick leave 229 days per person year *8 hours per work day 1,832 hours per person year
Workdays vary anywhere from 6.5 to 8 hours; however, in order to be conservative, an 8 hour workday was assumed.9 Similarly, numbers of vacation and sick leave days may also vary.
9 Essentially, we are using a measure of paid hours per year. Using a measure of productive hours per year with 6.5 hour workdays
(8 hours less 1 hour for lunch less two 15 minute work breaks) would give 1,489 hours per person year. Using this lower figure would result in inferring a greater number of FTEs from seasonal and part-time jobs. Using the 1,832 figure, we infer a lower number of FTEs.

Port of Nanaimo Economic Impact Study – 21 October 2014 37
Appendix E: Inferred Employment
Because not all employers could fully respond to our requests for information in the survey, we statistically inferred some employment data to replace that which otherwise would be missing. This allows us to estimate the total amount and type of employment, which provides the basis for other estimates of economic impact.
In general, InterVISTAS’ approach bases these inferred estimates on information provided by responding firms for each business type and validated against information from other publicly available sources of data.
The employment data in this report was compiled from a combination of two sources:
1. Employment reported by employers on surveys submitted to InterVISTAS.
2. Employment and other data were inferred for employers who did not provide a completed survey response. Inferred employment was based on employment information from those firms in each business type that did respond to the survey. The mean employment of respondents in each business type was calculated, excluding outliers, and then conservatively adjusted downwards. For instance, those firms with especially large employment levels were excluded from the "mean without outliers" to obtain conservative results. This "adjusted mean" employment for each business type was then applied to those firms who did not respond to the survey.

Port of Nanaimo Economic Impact Study – 21 October 2014 38
Appendix F: Contract Employment
Some firms contract out services that they do not have expertise in providing or when there are cost advantages to doing so. For example, many port firms contract out janitorial, elevator and maintenance services. The employment survey asked firms to identify whether they contracted out some of their work, and to estimate the number of annual hours involved.
Contract work was separated into two distinct categories in the employment survey: 1) individual “employees” paid through a contract, rather than via payroll, and 2) contracting out services to other firms.
The employment results for individuals on contract were derived by counting the number of individual positions for the number of jobs and dividing the total hours of employment by 1,832 to estimate person years. The employment results for firms on contract were derived by dividing the total hours of employment by 1,832 to estimate person years.
At the Port of Nanaimo in 2014, there were a total of 260 person years of contract employment.

Port of Nanaimo Economic Impact Study – 21 October 2014 39
Appendix G: Tax Revenues Attributable to Employers & Employees
Introduction
This appendix describes the employment and other assumptions on which tax revenue calculations are based. As well, the approaches used to estimate employer and employee contributions to local, provincial and federal governments are presented. All estimates are for the 2013 calendar year, unless otherwise stated.
Some of the taxes pose conceptual questions about how much, or if any, tax revenue from a particular source should be attributed to firms serving the Port of Nanaimo. These questions are highlighted and simplifying assumptions are put forth.
Employment at Port of Nanaimo
The majority of tax calculations in this report depend on direct employment and total wages. The total direct employment, in person years, used for these calculations is 2,910 person years. The total payroll is estimated at $185 million.
Personal Income Tax
Tax base and rates. Under the Income Tax Act federal income tax is paid on taxable income at a rate that increases with taxable income.
Provincial income tax was formerly calculated as a percentage of federal tax, but most provincial governments have begun collecting taxes on a sliding scale.
Estimation Method and Results
Because the tax rate is progressive, the tax paid by a group of employees depends on the distribution of income among those employees. Unfortunately, the distribution of income is not known and average incomes must be used.
Each employee is assumed to pay tax as a single tax filer. Estimated income tax payable is $25.3 million in federal tax and about $9.3 million in provincial tax.
The average tax rates used are derived from the more detailed calculations of taxes payable shown in Table G-1. In those calculations, assumptions have been made about income from non-employment sources, tax deductions from income (e.g., RPP and RRSP contributions), and tax credits applied against tax otherwise payable (e.g., CPP, EI and charitable contributions). Average credits are calculated from Revenue Canada, General Income Tax Forms, 2013.

Port of Nanaimo Economic Impact Study – 21 October 2014 40
Table G-1: British Columbia Single Tax Filer Income Tax Calculation – 2013
Income
Employment 20,000 25,000 30,000 35,000 40,000 45,000 50,000 55,000 60,000 70,000 80,000 90,000 100,000 150,000
TOTAL 20,000 25,000 30,000 35,000 40,000 45,000 50,000 55,000 60,000 70,000 80,000 90,000 100,000 150,000
Deductions
RPP 608 566 567 617 666 724 728 785 835 914 944 995 1,130 1,460
RRSP 39 62 113 192 321 511 704 858 1,104 1,402 1,973 2,611 2,338 2,081
Carrying Charges 51 52 73 94 129 176 224 267 325 387 501 608 548 825
Union 121 126 137 153 158 182 216 245 275 315 383 444 548 825
TOTAL 819 806 889 1,055 1,274 1,594 1,872 2,155 2,539 3,018 3,801 4,658 4,564 5,190
Taxable Income 19,181 24,194 29,111 33,945 38,726 43,406 48,128 52,845 57,461 66,982 76,199 85,342 95,436 144,810
Credits
Basic Federal 11,038 11,038 11,038 11,038 11,038 11,038 11,038 11,038 11,038 11,038 11,038 11,038 11,038 11,038
Basic Provincial 10,276 10,276 10,276 10,276 10,276 10,276 10,276 10,276 10,276 10,276 10,276 10,276 10,276 10,276
CPP 558 551 670 802 976 1,143 1,387 1,490 1,560 1,610 1,700 1,761 1,763 1,710
EI 256 234 274 316 374 433 501 521 547 557 586 605 599 554
Charity 27 39 56 70 83 94 108 123 136 157 179 208 235 321
Fed. Total 11,879 11,861 12,038 12,227 12,471 12,708 13,034 13,173 13,281 13,362 13,503 13,612 13,635 13,623
Prov. Total 11,117 11,099 11,276 11,465 11,709 11,946 12,272 12,411 12,519 12,600 12,741 12,850 12,873 12,861
Federal Tax Credit Rate 15% 15% 15% 15% 15% 15% 15% 15% 15% 15% 15% 15% 15% 15%
Provincial Tax Credit Rate 5% 5% 5% 5% 5% 5% 5% 5% 5% 5% 5% 5% 5% 5%
Federal Credits 1,782 1,779 1,806 1,834 1,871 1,906 1,955 1,976 1,992 2,004 2,025 2,042 2,045 2,043
Provincial Credits 563 562 571 580 592 604 621 628 633 638 645 650 651 651
Tax Payable
Federal - Bracket 1 2,877 3,629 4,367 5,092 5,809 6,511 6,534 6,534 6,534 6,534 6,534 6,534 6,534 6,534
Federal - Bracket 2 0 0 0 0 0 0 1,005 2,043 3,058 5,153 7,180 9,192 19,167 19,167
Federal - Bracket 3 0 0 0 0 0 0 0 0 0 0 0 0 2,161 35,114
Federal - Bracket 4 0 0 0 0 0 0 0 0 0 0 0 0 0 2,829
Federal Total 2,877 3,629 4,367 5,092 5,809 6,511 7,539 8,577 9,592 11,687 13,714 15,726 27,862 60,815
Basic Federal 1,095 1,850 2,561 3,258 3,938 4,605 5,584 6,601 7,600 9,683 11,689 13,684 25,817 58,294
BC - Bracket 1 971 1,224 1,473 1,718 1,901 1,901 1,901 1,901 1,901 1,901 1,901 1,901 1,901 1,901
BC - Bracket 2 0 0 0 0 89 450 813 1,176 1,532 2,265 2,893 2,893 2,893 2,893
BC - Bracket 3 0 0 0 0 0 0 0 0 0 0 111 1,071 1,169 1,169
BC - Bracket 4 0 0 0 0 0 0 0 0 0 0 0 0 1,127 2,272
BC - Bracket 5 0 0 0 0 0 0 0 0 0 0 0 0 0 5,888
BC Total 971 1,224 1,473 1,718 1,990 2,350 2,714 3,077 3,433 4,166 4,905 5,865 7,089 8,234
Basic Provincial 408 663 902 1,137 1,398 1,746 2,093 2,449 2,799 3,528 4,261 5,215 6,438 7,422
TOTAL TAX PAYABLE 1,503 2,513 3,463 4,395 5,336 6,351 7,677 9,050 10,399 13,211 15,950 18,899 32,255 65,716
Average Rate of Tax 7.8% 10.4% 11.9% 12.9% 13.8% 14.6% 16.0% 17.1% 18.1% 19.7% 20.9% 22.1% 33.8% 19.9%
Federal 5.7% 7.6% 8.8% 9.6% 10.2% 10.6% 11.6% 12.5% 13.2% 14.5% 15.3% 16.0% 27.1% 17.7%
Provincial 2.1% 2.7% 3.1% 3.4% 3.6% 4.0% 4.3% 4.6% 4.9% 5.3% 5.6% 6.1% 6.7% 2.3%
British Columbia Single Tax Filer Income Tax Calculation

Port of Nanaimo Economic Impact Study – 21 October 2014 41
Corporate Income Tax (Federal and Provincial)
All corporations are liable to pay federal income tax under the Income Tax Act. The tax rate varies by type and size of company and by province. Provincial governments also levy a corporation income tax on any company having a permanent establishment in that province.
Estimation Method and Results
1. To calculate tax liability precisely is very difficult. It requires knowledge of the total tax base, and the proportion of the tax base attributable to the provinces. Therefore, an approximate method has been used.
2. In British Columbia, the federal corporate income tax collected per employee was $1,834 and the provincial corporate income tax collected per employee was $982 in 2013.
3. Assuming all companies pay tax at the average rate per employee calculated above, the 2013 corporation income tax liability of the Port of Nanaimo employment sector is estimated to be $4.7 million toward federal revenues and $2.5 million toward provincial revenues. The estimated total corporate income tax revenue is roughly $7.2 million as shown in Table G-2.
Table G-2: Estimated Corporate Income Tax Paid by Firms within Port of Nanaimo
Government Revenue ($Million)
Federal 4.7
Provincial 2.5
Total 7.2
Employment Insurance Premiums
Tax base and rates. In 2014, employees in Canada paid employment insurance (EI) premiums equal to 1.88% of earnings up to a maximum of $914 per year. (Maximum insurable earnings are $48,600). Employers paid EI premiums equal to 1.4 times employee premiums.
Estimation Method and Results
The employee premium rate is applied to total payroll costs for employees earning less than $48,600 per year. The maximum contribution was used for employees earning more than $48,600 per year. Estimated employee payments were approximately $2.5 million in 2014. The employer rate is applied to the employee payments. Estimated employer payments were nearly $3.6 million in 2014.
Canada Pension Plan Contributions
Tax base and rates. In 2014, employee contributions for the Canada Pension Plan (CPP) were 4.95% of pensionable earnings. Pensionable earnings are actual earnings less $3,500 to a maximum of $49,000. The maximum annual employee contribution is $2,425. The employer contribution is the same as the employee contribution.

Port of Nanaimo Economic Impact Study – 21 October 2014 42
Estimation Method and Results
The employee contribution rate is applied to average payroll for employees who are earning less than $52,500 a year. The maximum contribution was used for employment earning more than the maximum pensionable earnings.
Estimated employer and employee contributions are over $6.7 million each, for a total of $13.5 million.
Worker’s Compensation Board (WCB)
Tax base and rates. Employers in each province are required to make contributions to the WCB to help offset the cost of on-the-job injuries. Employers are classified into industry groups. The contribution rate for each group is based on the injury costs associated with all companies in that group. The group contribution rate varies widely among industries and provinces. Some major companies are not included in the general “rateable” method of contribution but simply pay the actual cost of their claims plus an allowance for WCB administration costs. As it is not generally known which firms contribute in this manner, nor the value of their claims, an estimate based on reported payroll has been made for all firms.
Conceptual issues. It is possible that some companies are self-insured and their payments could be viewed as a business expense rather than a tax. However, we have chosen to include their contribution because they are required to be part of this government-mandated program.
Estimation Method and Results
The contribution rates for each employment classification at the port have been applied to the total payroll for that group. Port of Nanaimo employees paid an estimated $9.5 million to the WCB in 2013.
Medical Services Plan (MSP)
Tax Base and Rates
Health care premiums for single filers in British Columbia in 2014 were:
British Columbia - $69.25 per month
Conceptual Issues
Premiums must be paid by any person registered with the health care plan, whether they are employed or not. Therefore, premiums are not directly related to employment. Nevertheless, many employers pay premiums on behalf of their employees. Therefore, premiums are included as a tax contribution.
Estimation Method and Results
Many employees may be covered by premiums paid by or on behalf of a spouse. Therefore, an employee may not need the coverage offered by an employer. For any group of employees it is difficult to know how many have coverage through a spouse. Therefore, we have assumed that all employees are covered as a result of employment, but that the premium required is only the rate for single persons. The estimated MSP contribution by Port of Nanaimo employment is $2.4 million.

Port of Nanaimo Economic Impact Study – 21 October 2014 43
Marine Navigation Service Fees
The Marine Navigation Services Fee (MNSF) was officially introduced in 1996 as a user fee for navigational services provided by the Canadian Coast Guard. Subsequently revised on July 1, 1997, and again on October 1, 1998, the MNSF is assessed on all vessels operating in Canadian waters with the exception of fishing vessels, "government ships" and pleasure craft as defined by the MNSF Fee schedule. Barges operating in Canadian waters in the Western Region are exempt from payment of the MNSF.
As such, the MNSF applies to foreign flagged vessels, including cruise ships and tugs serving port waterways in 2014. There were 225 ship arrivals in 2013 at Port of Nanaimo. An estimate of 90 tugs was in operation in Port of Nanaimo waters. Based on this type and level of activity, total MNSF fees at Port of Nanaimo amounts to $383,600.
PILT & Property Taxes Collected to Government
Governments levy property taxes to help them finance local services. The Nananimo Port Authority did not pay property taxes; however, they did pay $400,000 in PILT (payments in lieu of taxes). Other property taxes paid by Port of Nanaimo tenants and an estimate of property taxes attributable to non port tenants is estimated to be $1.5 million.
10 Total payments to the municipality amount to $1.9 million.
10 Data on property taxes paid by NPA, Port of Nanaimo tenants are current as of 2013.

Port of Nanaimo Economic Impact Study – 21 October 2014 44
Appendix I: Glossary of Terms
Breakbulk: Breakbulk cargo is commodity cargo that must be loaded individually in a ship’s cargo. The goods can be packaged in bags, cases, crates, drums, barrels, or kept together by baling and placed onto pallets. Typical breakbulk commodities include paper, lumber, steel, and machinery.
Bulk: Bulk cargo is commodity cargo that is transported in large quantities and unpackaged. Typical bulk commodities include coal, grain, and chemicals.
Container: A container is a standardized re-sealable box used to transport goods. Containers are designed in standard sizes so that it can be loaded and sealed intact onto container ships, railroad cars, planes and trucks. A common size for containers is 20 feet by 8 feet by 8 feet, also known as a Twenty-foot Equivalent Unit (TEU).
Contract Work: Any work which is done for a company by an individual who is not on the payroll or work done for a company by another company. Generally speaking, firms will contract out work in areas in which they do not have expertise or when there are cost advantages to doing so.
Direct Employment: Direct employment is employment that can be directly attributable to the operations in an industry, firm, etc. It is literally a head count of those people who work in a sector of the economy. In the case of the port, all of the jobs involved in moving goods to or through the port or located on port land would be considered direct employment.
Economic Activity: (also Output, Production) The end product of transforming inputs into goods. The end product does not necessarily have to be a tangible good (for example, knowledge), nor does it have to create utility (for example, pollution). Or, more generally, the process of transforming the factors of production into goods and services desired for consumption.
Employment Impact: Employment impact analysis determines the economic impact of employment in terms of jobs created and salaries and wages paid out. In the case of the port, the direct, indirect, induced and total number of jobs or person years created at the port is examined to produce a snapshot of port operations.
Full Time Equivalent (FTE): (also Person Year) One full time equivalent (FTE) year of employment is equivalent to the number of hours that an individual would work on a full time basis for one year. In this study we have calculated one full time equivalent year to be equivalent to 1,832 hours. Full time equivalent years are useful because part time and seasonal workers do not account for one full time job.
GDP: (also value-added) A measure of the money value of final goods and services produced as a result of economic activity in the nation. This measure is net of the value of intermediate goods and services used up to produce the final goods and services.
Indirect Employment: Indirect employment is employment which results because of direct employment. For the port, it would include that portion of employment in supplier industries which are dependent on sales to the port business sector. In some cases, contract work would be considered indirect employment.
Induced Employment: Induced employment is employment created because of expenditures by direct and indirect employees.

Port of Nanaimo Economic Impact Study – 21 October 2014 45
Multiplier Analysis: Analysis using economic multipliers in which indirect and induced economic impacts are quantified. Essentially, a multiplier number is applied to the "directly traceable economic impact" to produce indirect and total effects. (See Multiplier.)
Multiplier: Economic multipliers are used to infer indirect and induced effects from a particular sector of the economy. They come in a variety of forms and differ in definition and application. A multiplier is a number which would be multiplied by direct effects in order to calculate indirect or induced effects. In the case of the port, as in many other cases, multipliers can lead to illusory results, and thus must be used with great care.
Output: (also Economic Activity, Production) The end product of transforming inputs into goods. The end product does not necessarily have to be a tangible good (for example, knowledge), nor does it have to create utility (for example, pollution). Or, more generally, it is defined as the process of transforming the factors of production into goods and services desired for consumption.
Person Year: (also Full Time Equivalent (FTE)) One person year of employment is equivalent to the number of hours that an individual would work on a full time basis for one year. In this study we have calculated one person year to be equivalent to 1,832 hours. Person years are useful because part time and seasonal workers do not account for one full time job
Seasonality: Seasonality results when the supply and demand for a good is directly related to the season in which it is consumed. For example, ski resorts experience changes in net income as a result of seasonality. Fishing companies also experience seasonality as a result of harvesting times for certain species. As a result of seasonality in fishing, some fishing companies hire extra fishermen during the busy season and furlough them in the off-season.
Tenant: A firm which pays a lease to a leasing company or to the Port Authority directly.
Twenty-Foot Equivalent Unit (TEU): Twenty-Foot Equivalent Unit is a standard unit for measuring containers. It represents the volume of a container with dimensions 20 feet by 8 feet by 8 feet.
Value-Added: (also GDP) A measure of the money value of final goods and services produced as a result of economic activity in the nation. This measure is net of the value of intermediate goods and services used up to produce the final goods and services.

Prepared by
InterVISTAS Consulting Inc.
Airport Square – Suite 550 1200 West 73
rd Avenue
Vancouver, BC Canada V6P 6G5
Telephone: +1-604-717-1800 Facsimile: +1-604-717-1818
www.intervistas.com