final thesis proofed
TRANSCRIPT

ii

iii
Dedicated
To
My Family
iv
ACKNOWLEDGMENTS
In the name of ALLAH, the Most Beneficent, the Most Merciful.
Praise and gratitude to ALLAH, the Almighty, with whose gracious help, I was able to
complete this work with patience and endurance.
Acknowledgement is due to King Fahd University of Petroleum and Minerals, Saudi
Arabia for providing the support and also for the Center for Clean Water and Clear
Energy at MIT and KFUPM.
I am deeply grateful to my thesis advisor Dr. Zuhair M. Gasem for his support, guidance
and encouragement throughout this study. His wide knowledge and logical way of
thinking have been great value for me. I would also like to thank my committee members
Dr. Abul Fazal M. Arif and Dr. Nasser Al Aqeeli for their reviews and comments.
I would also like to thank the staff Materials Science lab specially Mr. Latif Hashmi and
Mr. Saleh Al Abbas for their help during the experimental work.
Very special thanks to parents and other family members for their unconditional and
endless support, love, sacrifices, prayers and understanding throughout my academic
career. You all have been a constant support for me and showed never wavering belief in
me and understanding during the last 2 years.
I am grateful to all my colleagues for their help and friendship especially to Mr. Abdullah
Gujba, Mr. Danish Ahmed and Mr. Aqeel Mirza. I want to express my thanks to some
of my dearest friends specially Salman, Yousaf, Monim, Ahmed, Babar, Sarmad, Saad,
Nauman, Faraz and all others for their friendship and for giving me much needed bout of
laughter.
v
Table of Contents
ACKNOWLEDGMENTS…………………………………………………………...…...iv
Table of Contents………………………………………………………………………….v
List of Tables............................................................................................................... viii
List of Figures ............................................................................................................... ix
Abstract (English)……………………………………………………………………….xiii
Abstract (Arabic)………………………………………………………………………..xiv
CHAPTER 1 INTRODUCTION......................................................................................1
1.1 Motivation & objectives ..................................................................................2
CHAPTER 2 LITERATURE REVIEW ...........................................................................3
2.1 Modern Gas Turbines ......................................................................................3
2.2 Thermal Barrier Coating System .....................................................................4
2.2.1 Ceramic top coat........................................................................................5
2.2.1.1 Air Plasma Sprayed top coat ................................................................7
2.2.1.2 Electron Beam-Physical Vapor Deposition (EB-PVD) top coat ............9
2.2.2 Metallic Bond Coat .................................................................................. 10
2.2.2.1 Diffusion Aluminide .......................................................................... 10
2.2.2.2 Platinum Aluminide ........................................................................... 11
vi
2.2.2.3 MCrAly Bond coat ............................................................................ 13
2.3 Limiting factors in TBC Performance ............................................................ 14
2.3.1 Bond coat oxidation (TGO Growth) ........................................................ 14
2.3.2 Top coat degradation by hot corrosion ...................................................... 16
2.3.2.1 Type I Hot Corrosion .......................................................................... 18
2.3.2.2 Type II Hot Corrosion......................................................................... 18
2.3.3 Sulphidation ............................................................................................. 19
2.3.4 Interdiffusion between substrate and bond coat ......................................... 19
2.3.5 Sources of Salts ........................................................................................ 20
CHAPTER 3 EXPERIMENTAL PROCEDURE AND SPECIMEN PREPARATION..21
3.1 TBC System ................................................................................................... 21
3.2 Specimen Preparation ..................................................................................... 22
3.3 Exposure Procedure ....................................................................................... 23
3.4 Microstructure Characterization ..................................................................... 25
CHAPTER 4 EXPERIMENTAL RESULTS ................................................................. 26
4.1 As- Received TBC Specimen ......................................................................... 26
4.2 Oxidation ....................................................................................................... 29
4.3 Salt Mixture A (75% Na2SO4 +25% V2O5) ..................................................... 34
4.4 Salt mixture B (75% Na2SO4 + 25% NaCl) .................................................... 38
CHAPTER 5 DISCUSSION…………………………………………………………….53
vii
5.1 Degradation in Purely Oxidized Specimens .................................................... 53
5.2 Degradation in Salt Mixture A (Na2SO4 + V2O5) ............................................ 55
5.3 Degradation in Salt Mixture B (Na2SO4 + NaCl) ............................................ 56
CHAPTER 6 CONCLUSIONS…………………………………………………………67
REFERENCES .............................................................................................................. 68
VITAE .......................................................................................................................... 73

viii
List of Tables Table 2.1 Showing typical quantities of impurities in Saudi crude and distillate samples.
...................................................................................................................................... 20
Table 3.1: Compositions of TBC layers and substrate. ................................................... 22
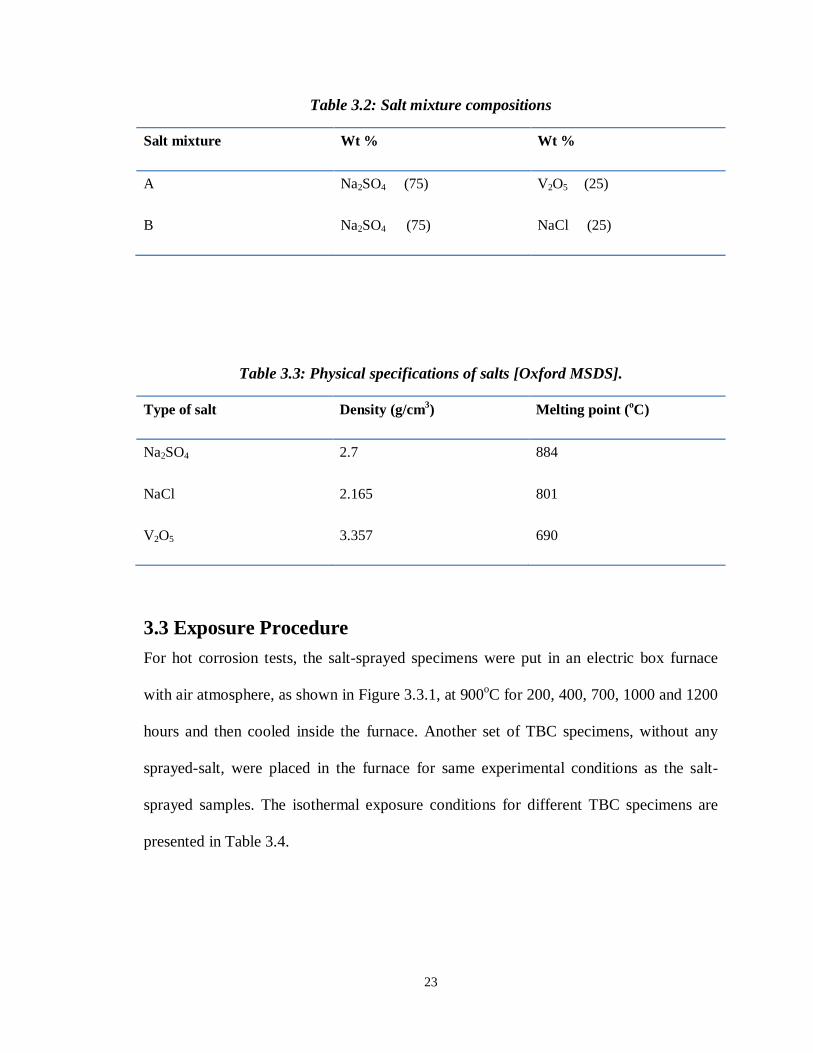
Table 3.2: Salt mixture compositions ............................................................................. 23
Table 3.3: Physical specifications of salts . .................................................................... 23
Table 3.4: Experimental conditions for isothermal exposure at 900oC. ........................... 24
Table 4.1: EDS analysis of as-received sample. ............................................................. 27
Table 4.2: EDS analysis of TGO shown in Figure 4.3.1. ................................................ 34
Table 4.3: EDS analysis of point A in Fig 4.4.3 ............................................................. 40
Table 4.4 EDS analysis of points 1-6 in Fig. 4.3.7.......................................................... 44
Table 4.5 EDS analysis of points 1-4 in Fig. 4.3.8.......................................................... 45
Table 5.1 Values of Pilling-Bedworth ratios for different oxides. ................................... 65
ix
List of Figures
Figure 2.1.1 Schematic of a TBC on an air-cooled gas turbine engine component . ..........3
Figure 2.2.1 Schematic of TBC microstructure in a thermal barrier coatings deposited by
APS and EB-PVD techniques . ........................................................................................4
Figure 2.2.2 The thermal conductivity of several ceramic materials, including ZrO2 ........5
Figure 2.2.3 Phase diagram ZrO2-Y2O3 ............................................................................7
Figure 2.2.4 Cross-sections of plasma-sprayed and EB-PVD ZrO2-8wt%Y2O3 ................7
Figure 2.2.5 Cross-sections of plasma-sprayed and APS ZrO2-8wt%Y2O3 . .....................9
Figure 2.2.6 Microstructure schematic showing platinum aluminide formed from a low
activity, high-temperature process ................................................................................. 12
Figure 2.2.7 Microstructure schematic showing platinum aluminide formed from a high
activity, low-temperature process................................................................................... 12
Figure 2.2.8 Comparative corrosion and oxidation resistance of bond coats .................. 13
Figure 2.3.1 Diffusion of O2 through the ceramic top coat towards the interface ............ 15
Figure 2.3.2 SEM micrograph of YVO4 crystals on the surface of coatings . .................. 17
Figure 3.1.1 Schematic of TBC system showing three different layers. .......................... 21
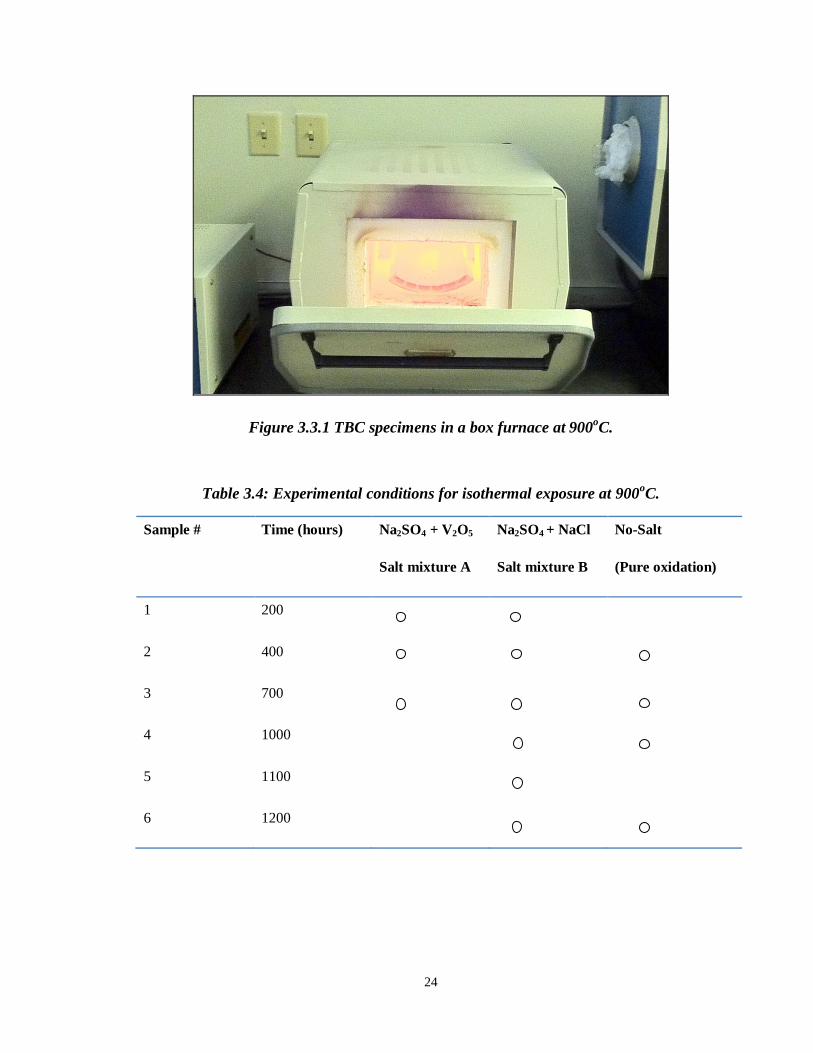
Figure 3.3.1 TBC specimens in a box furnace at 900oC. ................................................. 24
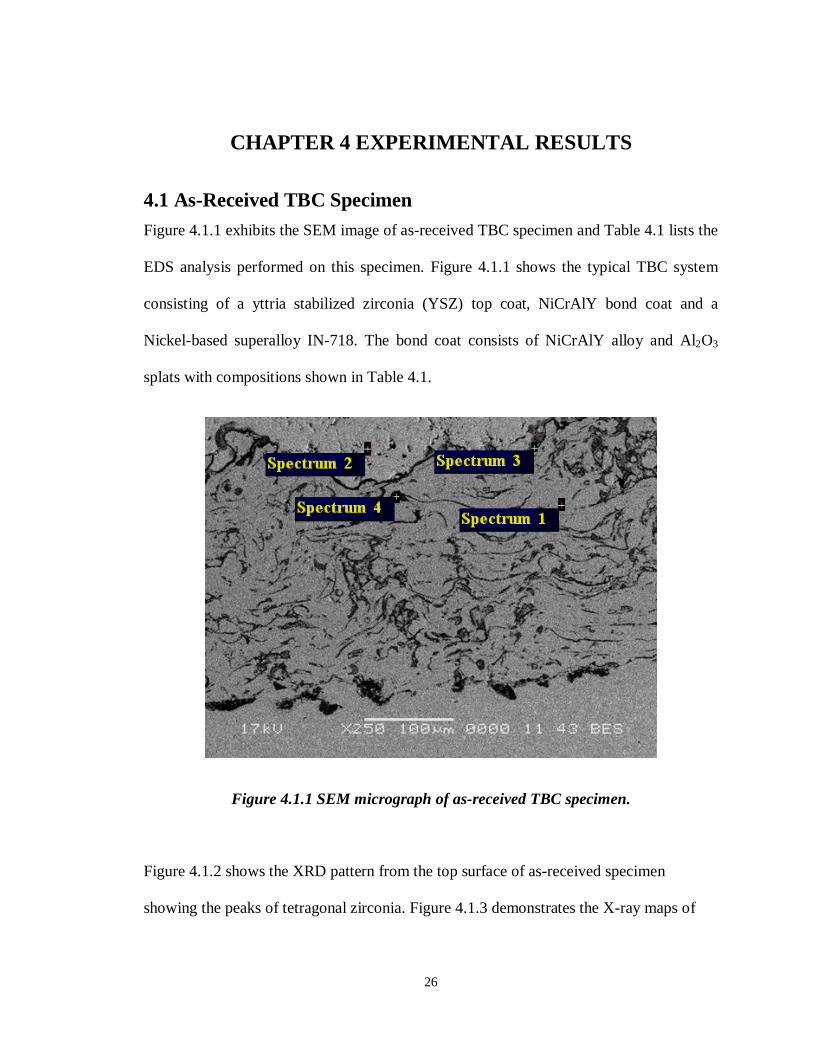
Figure 4.1.1 SEM micrograph of as-received TBC specimen. ........................................ 26
Figure 4.1.2 XRD pattern of the as-received specimen. .................................................. 27
Figure 4.1.3 Elemental distribution of as-received TBC specimen. ................................ 28
Figure 4.2.1 Back-scattered SEM Cross-section image of no-sprayed salt (pure oxidation)
specimen after 400 hours at 900oC. ................................................................................ 30
x
Figure 4.2.2 Back-scattered SEM cross-section image of no-sprayed salt (pure oxidation)
specimen after 700 hours at 900oC. ................................................................................ 30
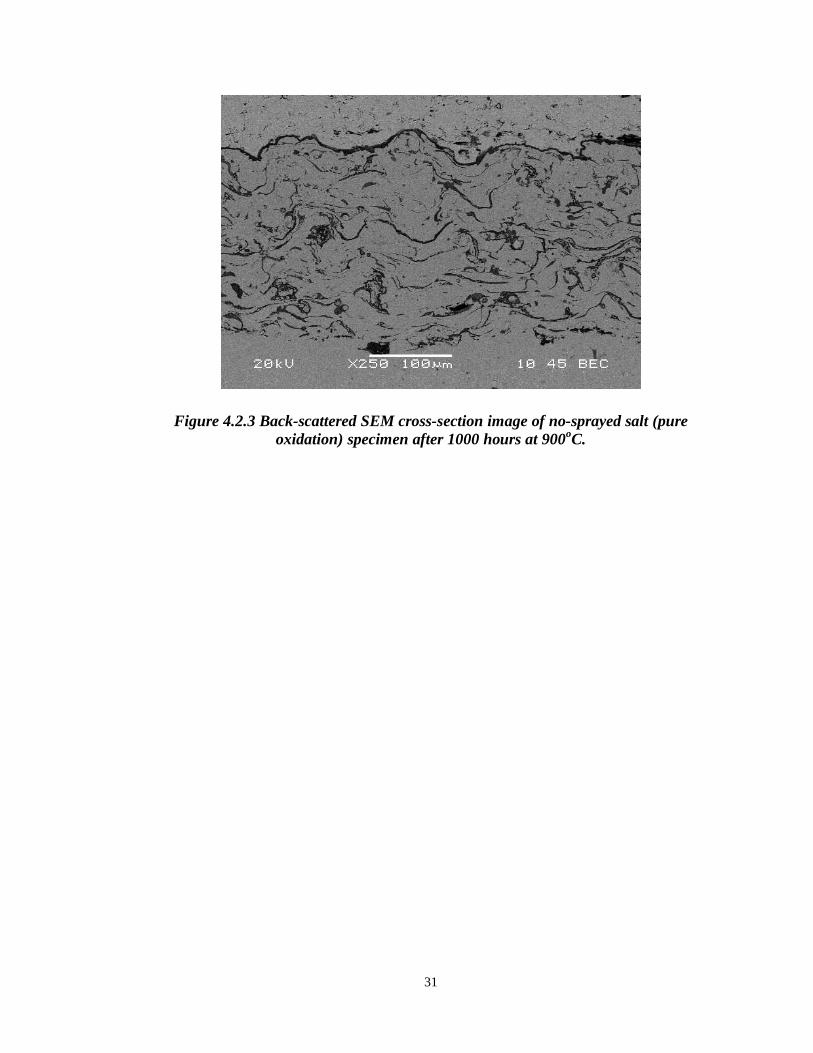
Figure 4.2.3 Back-scattered SEM cross-section image of no-sprayed salt (pure oxidation)
specimen after 1000 hours at 900oC. .............................................................................. 31
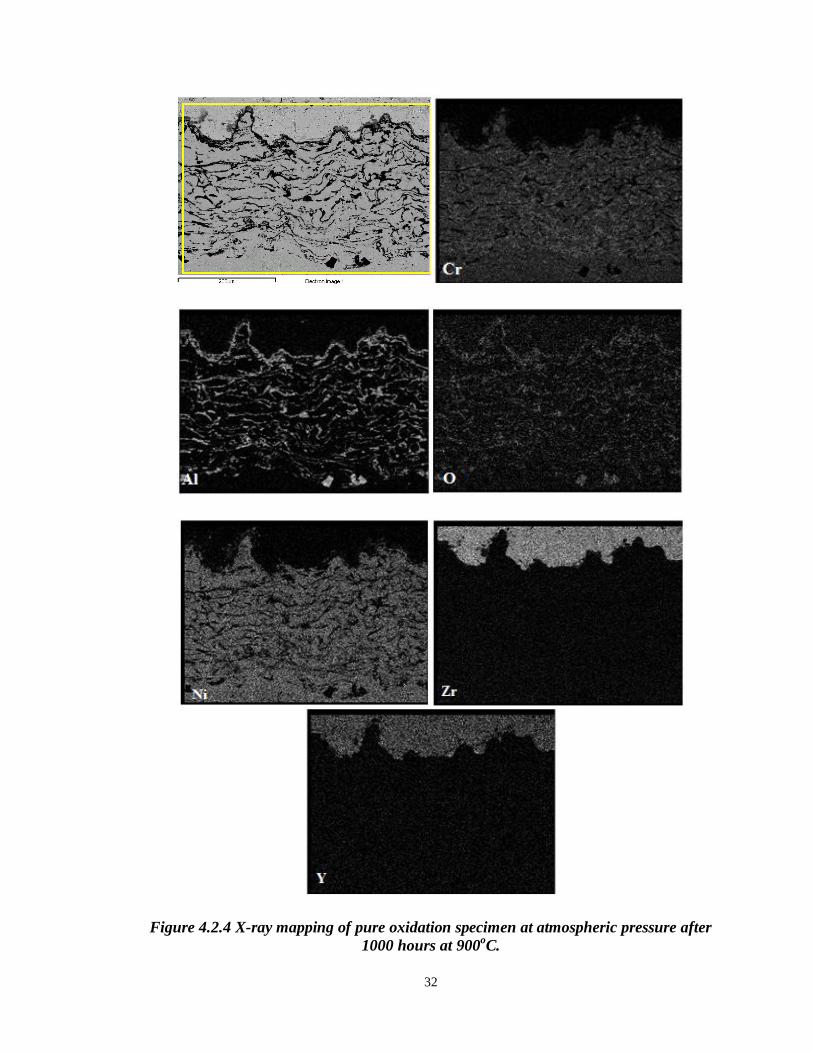
Figure 4.2.4 X-ray mapping of pure oxidation specimen at atmospheric pressure after
1000 hours at 900oC. ..................................................................................................... 32
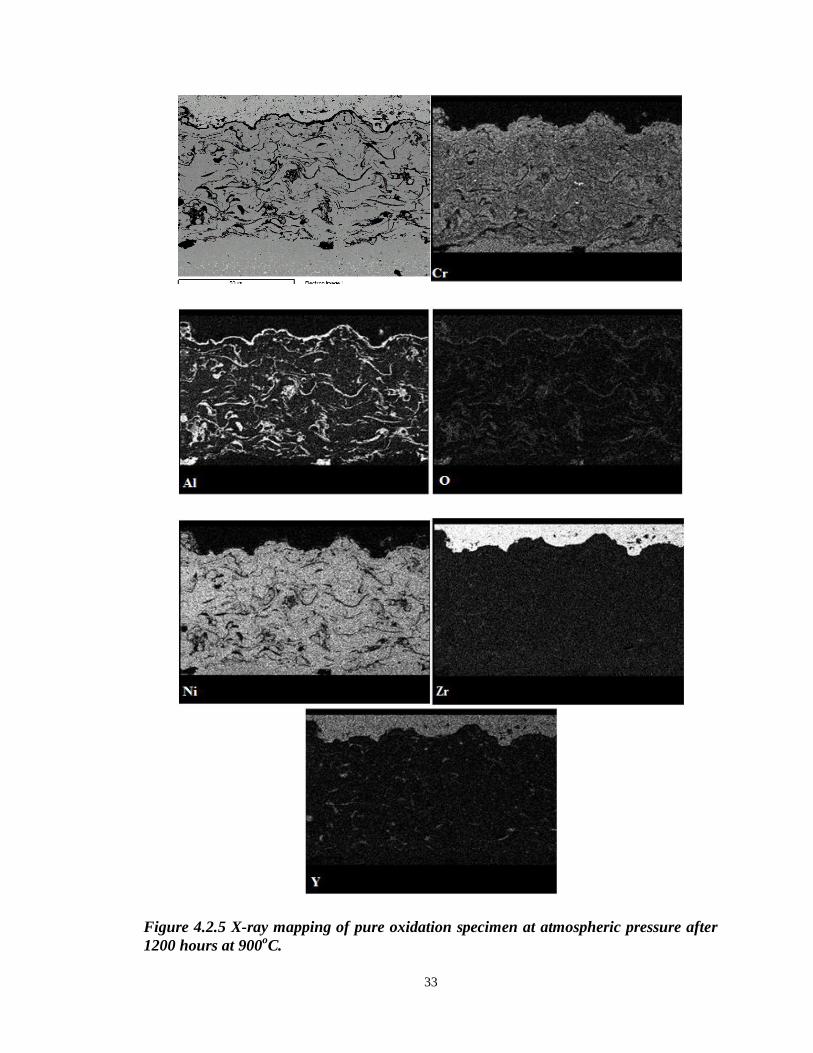
Figure 4.2.5 X-ray mapping of pure oxidation specimen at atmospheric pressure after
1200 hours at 900oC. ..................................................................................................... 33
Figure 4.3.1 Back-scattered SEM cross-section image of salt mixture A specimen
exposed for 200 hours at 900oC. .................................................................................... 34
Figure 4.3.2 Back-scattered SEM cross-section image showing interface cracking after
400 hours at 900oC using salt mixture A ........................................................................ 35
Figure 4.3.3 Back-scattered SEM cross-section image of salt mixture A showing
delamination in the top coat after 700 hours at 900oC. ................................................... 35
Figure 4.3.4 XRD pattern for the top surface of salt mixture A specimen after 400 hours.
...................................................................................................................................... 36
Figure 4.3.5 SEM image of the top surface of salt mixture A specimen showing crack and
rod like YVO4 after 400oC at 900oC. .............................................................................. 37
Figure 4.3.6 SEM image of top surface of salt mixture A specimen at higher
magnification showing rod like YVO4 particles at surface after 400oC at 900oC............. 37
Figure 4.4.1 Back-scattered SEM cross-sectional micrographs of specimens sprayed with
salt mixture B (75% Na2SO4 + 25% NaCl) after isothermal exposure: (a) 200 hours (b)
400 hours. ...................................................................................................................... 38
xi
Figure 4.4.2 Back-scattered cross-sectional micrograph of specimen sprayed with salt
mixture B and isothermally loaded for 700 hours at 900oC............................................. 39
Figure 4.4.3 Back-scattered SEM Cross-section image of salt mixture B specimen after
700 hours at 900oC showing initial growth of Cr-rich oxide at the top coat/bond coat
interface......................................................................................................................... 40
Figure 4.4.4 Back-scattered SEM Cross-section image of salt mixture B specimen after
700 hours at 900oC showing interfacial cracking at the top coat/bond coat interface. ..... 41
Figure 4.4.5 Back-scattered SEM Cross-section image of salt mixture B specimen after
1000 hours at 900oC showing Cr-rich oxide layer. ......................................................... 42
Figure 4.4.6 Back-scattered SEM Cross-section image of salt mixture B specimen after
1000 hours at 900oC showing Cr-rich oxide layer and crack in top coat. ........................ 42
Figure 4.4.7 Back-scattered SEM image at higher magnification of salt mixture B
specimen after 1000 hours at 900oC and EDS analysis at points shown in Table 4.4. ..... 43
Figure 4.4.8 Back-scattered SEM image at X850 of salt mixture B specimen after 1000
hours at 900oC and EDS analysis at points shown in Table 4.5. ..................................... 44
Figure 4.4.9 X-ray mapping of isothermally loaded specimen for 1000 hours at 900oC
sprayed with salt mixture B. .......................................................................................... 46
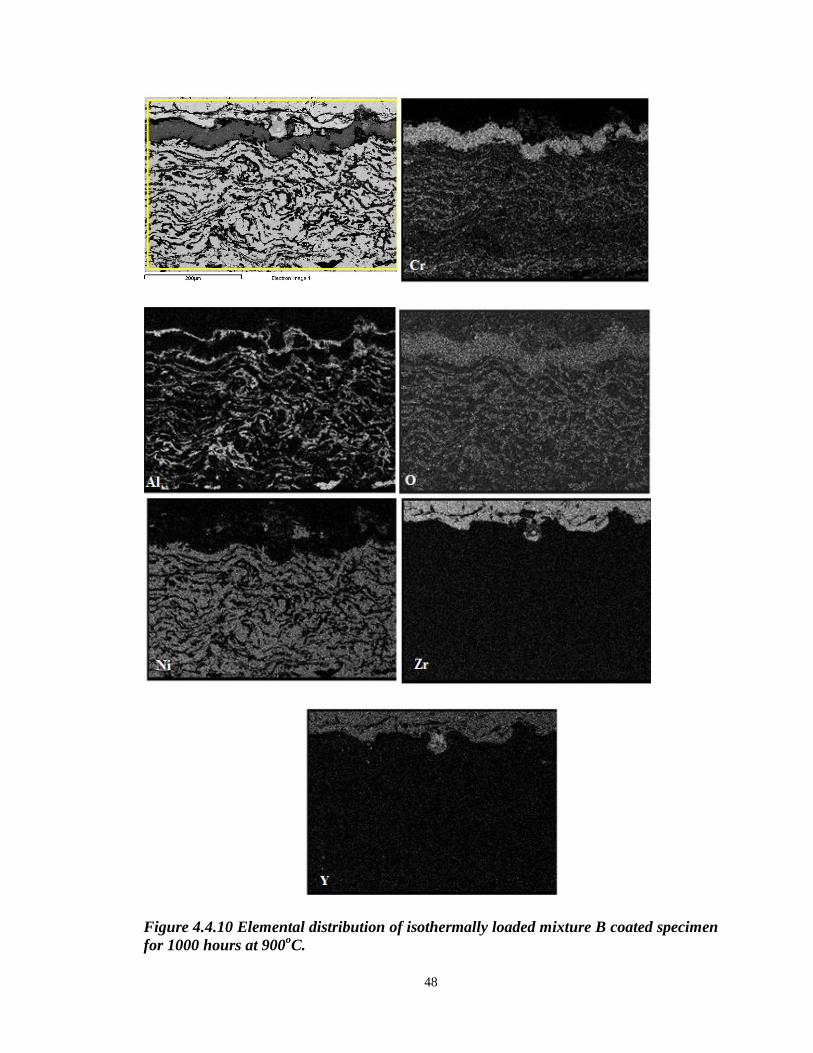
Figure 4.4.10 Elemental distribution of isothermally loaded mixture B coated specimen
for 1000 hours at 900oC. ................................................................................................ 48
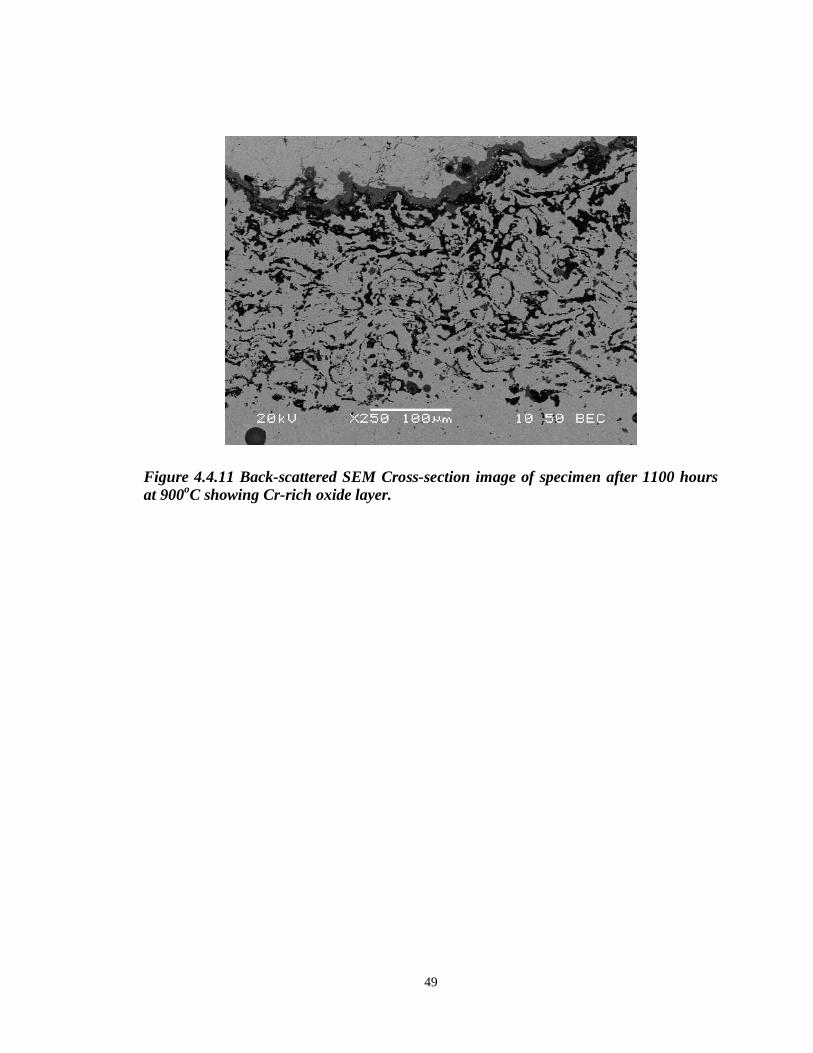
Figure 4.4.11 Back-scattered SEM Cross-section image of specimen after 1100 hours at
900oC showing Cr-rich oxide layer. ............................................................................... 49
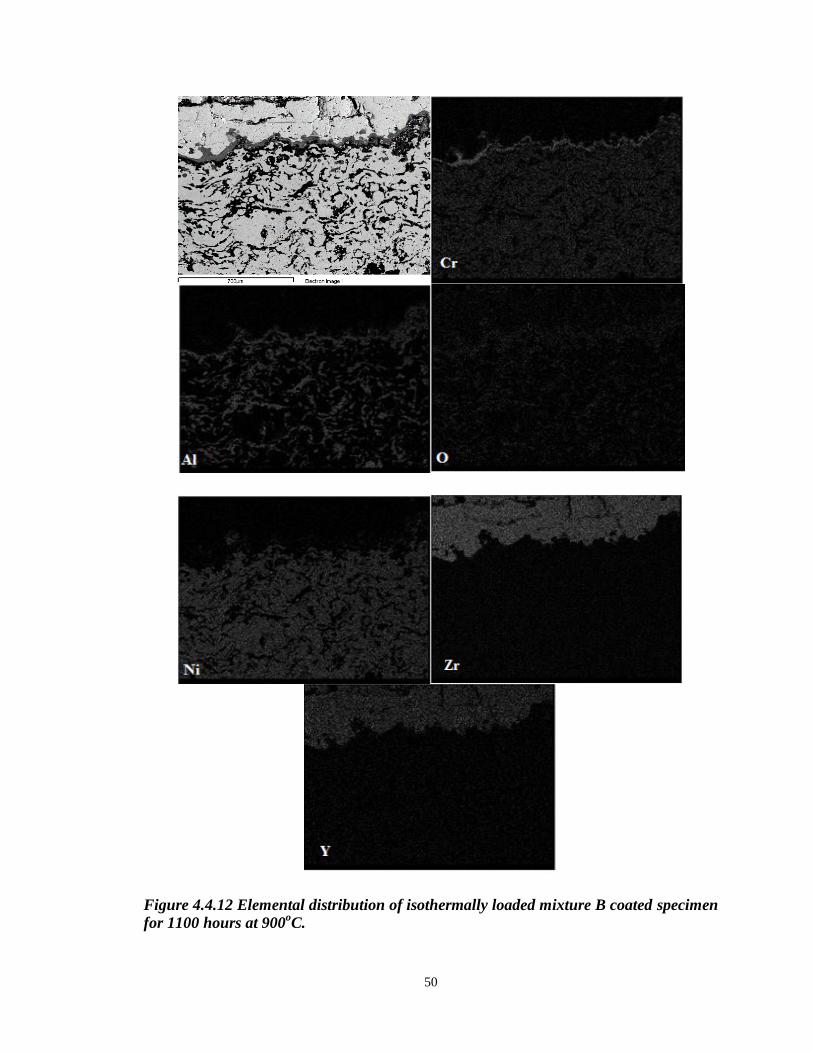
Figure 4.4.12 Elemental distribution of isothermally loaded mixture B coated specimen
for 1100 hours at 900oC. ................................................................................................ 50
xii
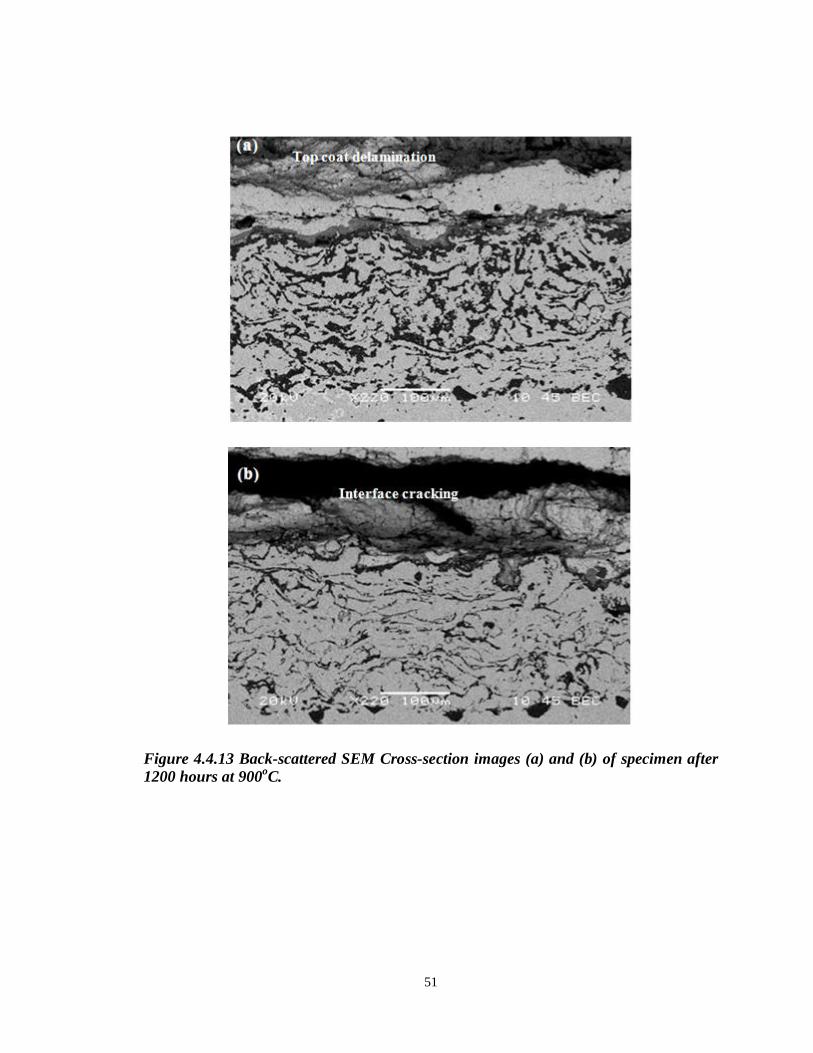
Figure 4.4.13 Back-scattered SEM Cross-section images (a) and (b) of specimen after
1200 hours at 900oC. ..................................................................................................... 51
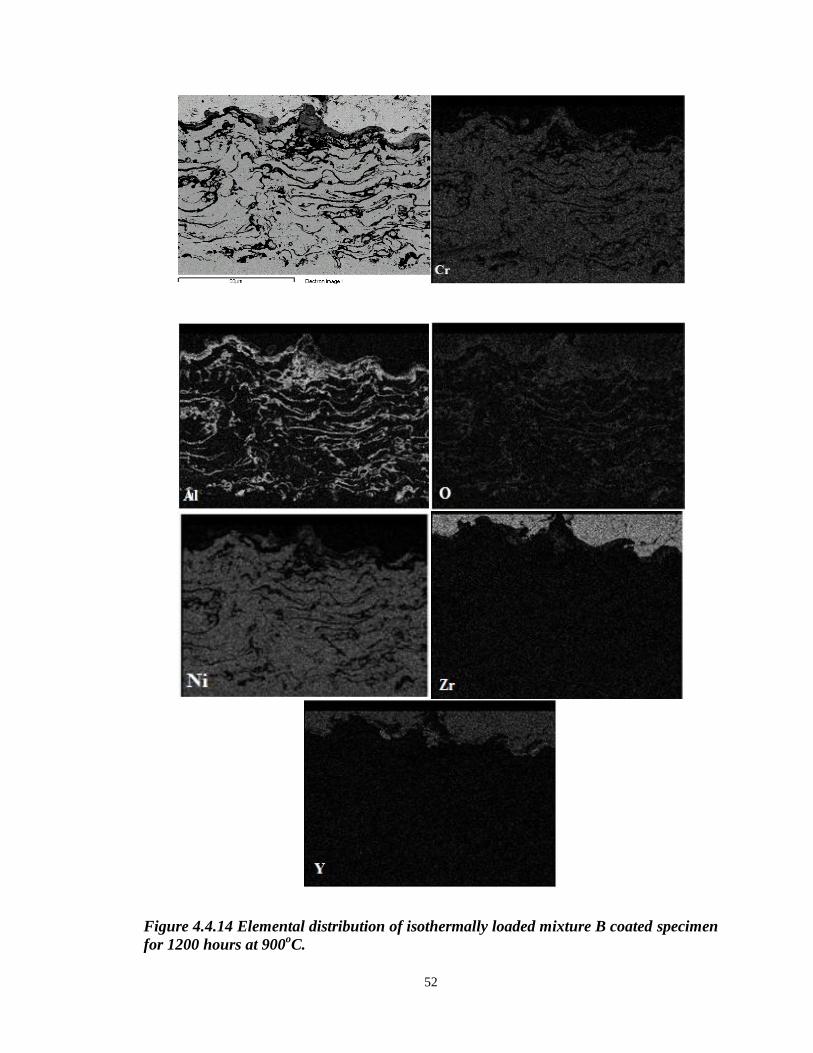
Figure 4.4.14 Elemental distribution of isothermally loaded mixture B coated specimen
for 1200 hours at 900oC. ................................................................................................ 52
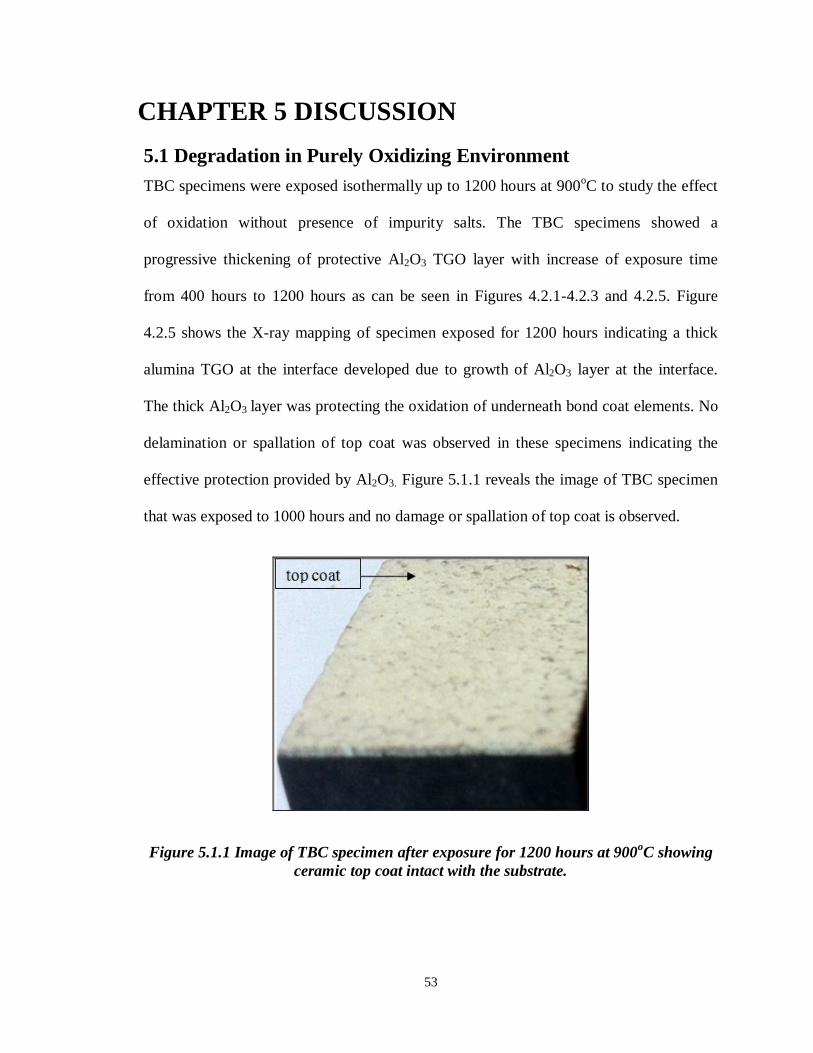
Figure 5.1.1 Image of TBC specimen after exposure for 1200 hours at 900oC showing
ceramic top coat intact with the substrate. ...................................................................... 53
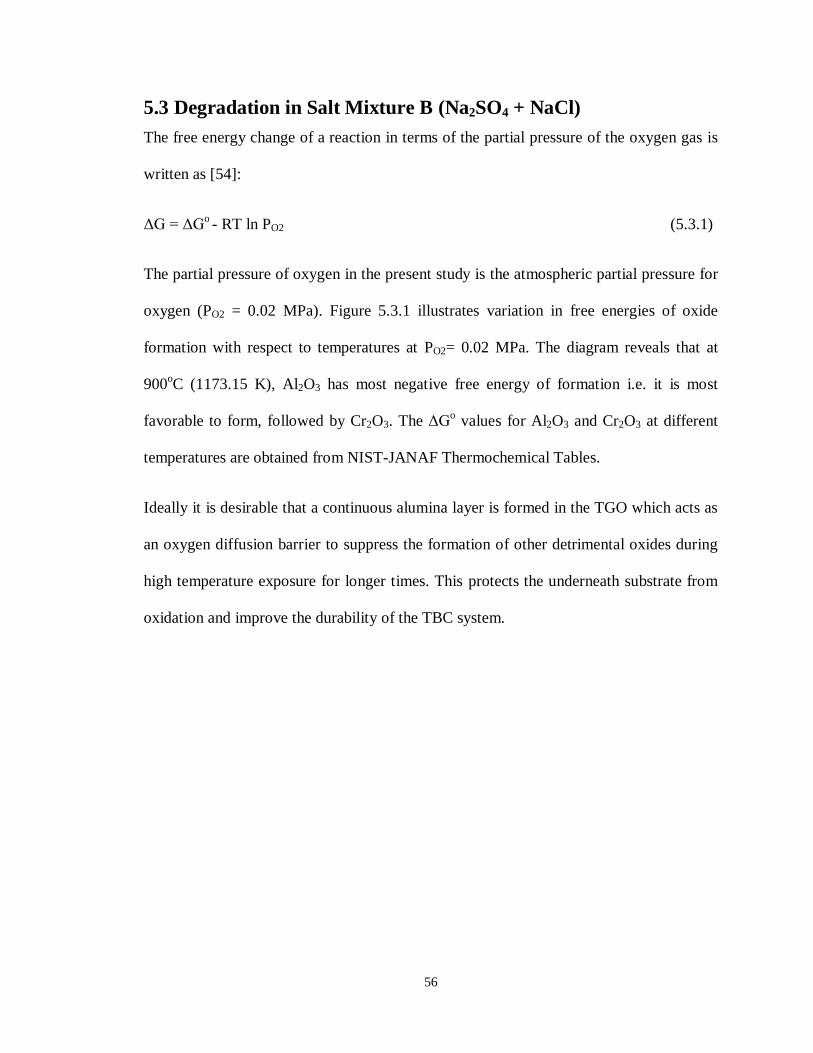
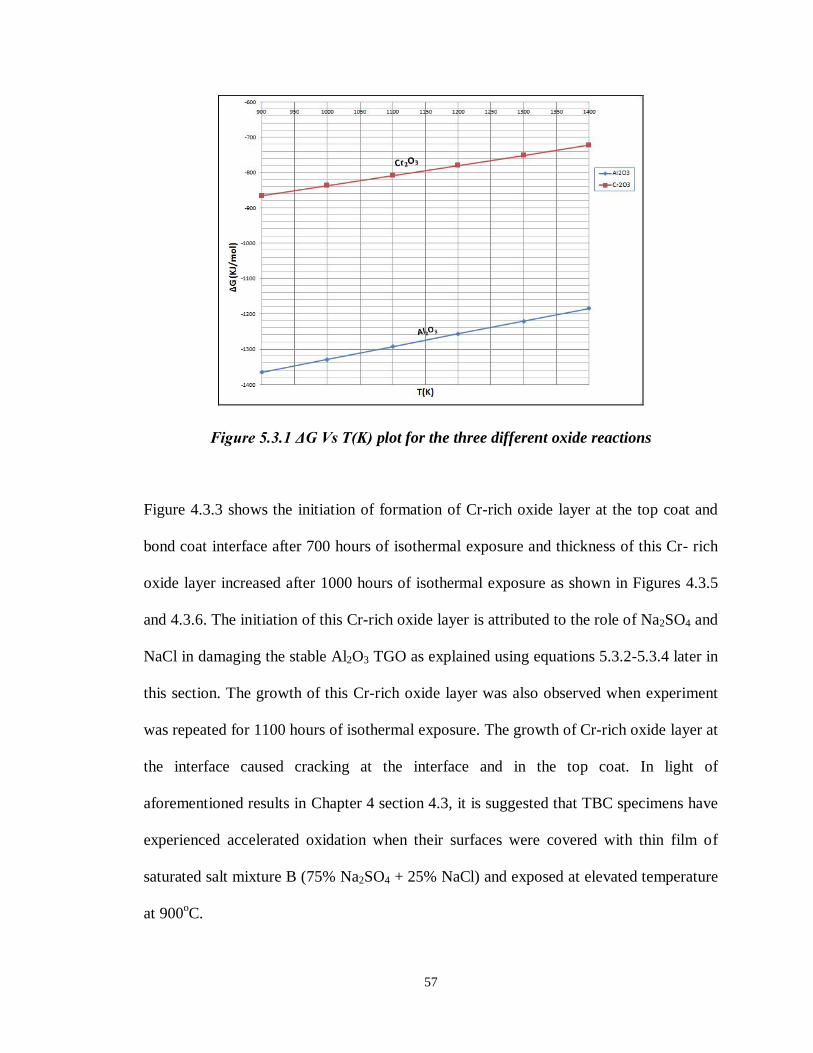
Figure 5.3.1 ΔG Vs T(K) plot for the three different oxide reactions .............................. 57
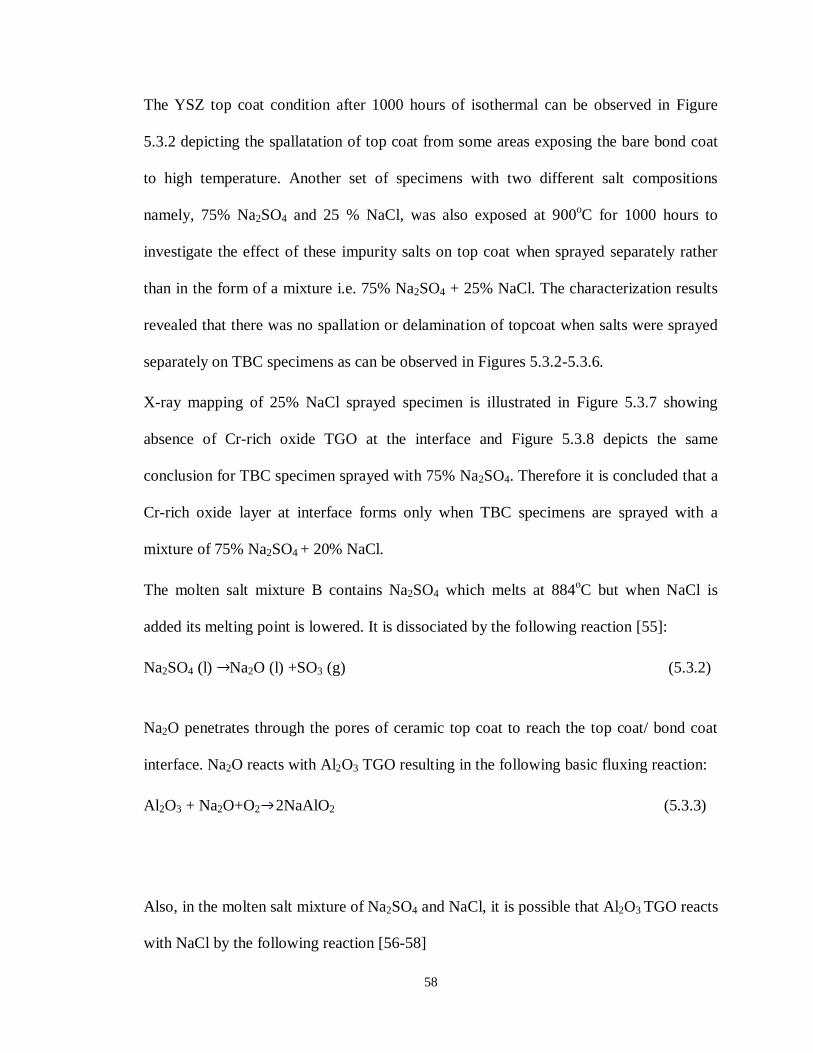
Figure 5.3.2 Image of TBC specimen sprayed with salt mixture B and exposed for 1000
hours at 900oC showing spalling of ceramic top. ............................................................ 60
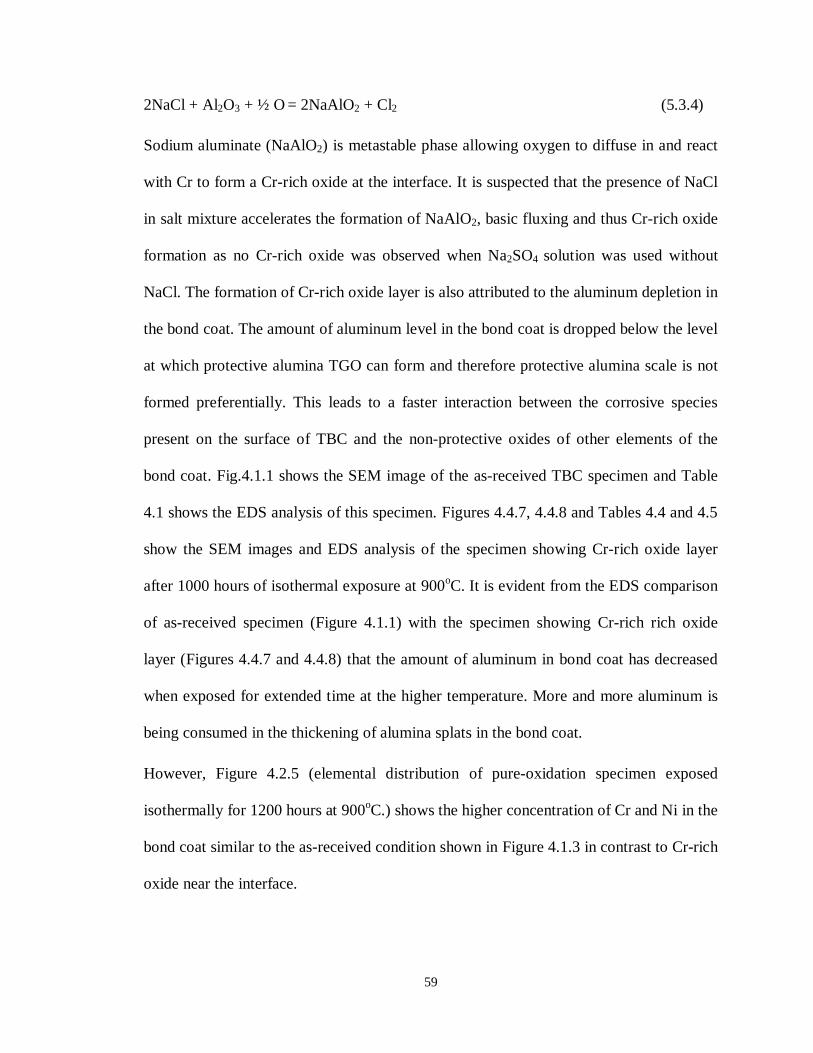
Figure 5.3.3 Top view of four different TBC specimens exposed isothermally for 1000
hours at 900oC. .............................................................................................................. 60
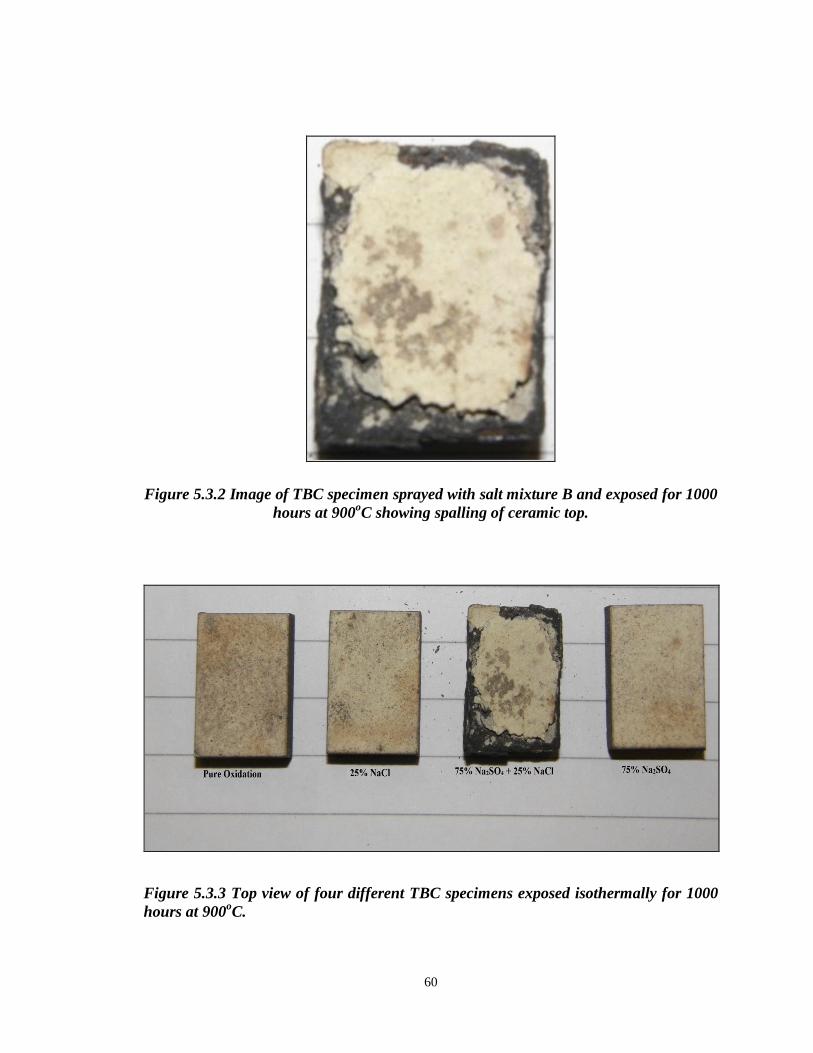
Figure 5.3.4 TBC specimen sprayed with 75% Na2SO4 and exposed isothermally for
1000 hours at 900oC. ..................................................................................................... 61
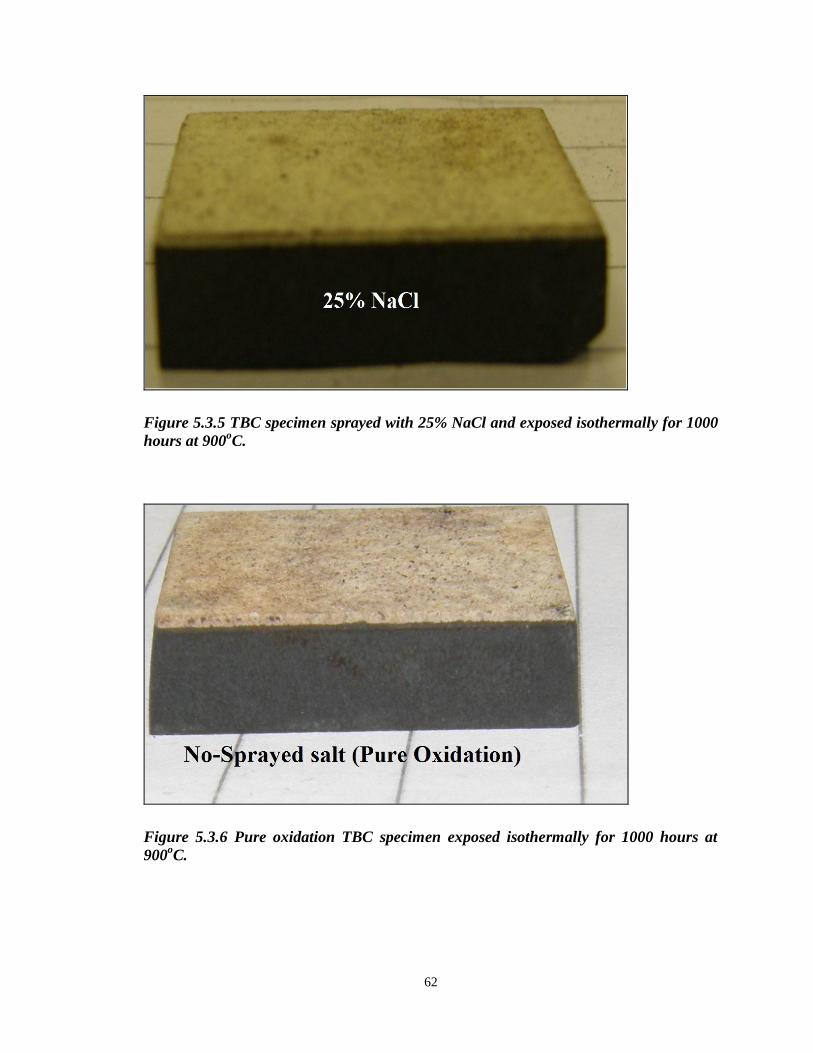
Figure 5.3.5 TBC specimen sprayed with 25% NaCl and exposed isothermally for 1000
hours at 900oC. .............................................................................................................. 62
Figure 5.3.6 Pure oxidation TBC specimen exposed isothermally for 1000 hours at
900oC. ........................................................................................................................... 62
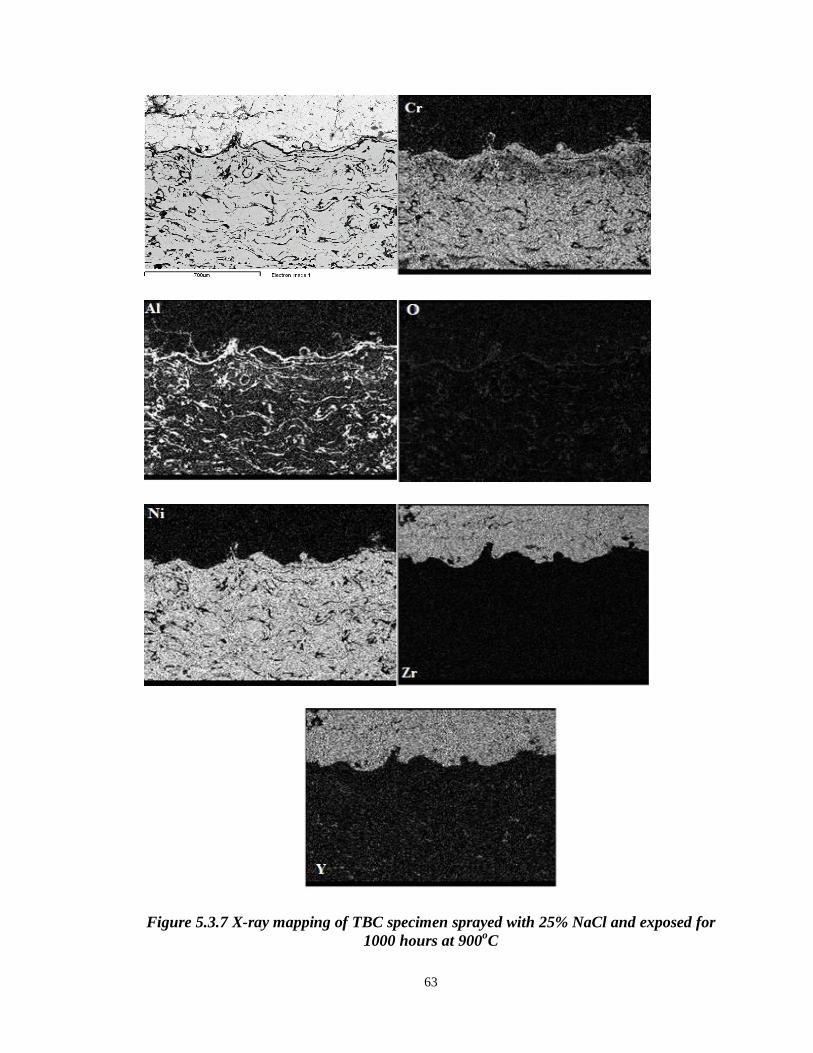
Figure 5.3.7 X-ray mapping of TBC specimen sprayed with 25% NaCl and exposed for
1000 hours at 900oC ...................................................................................................... 63
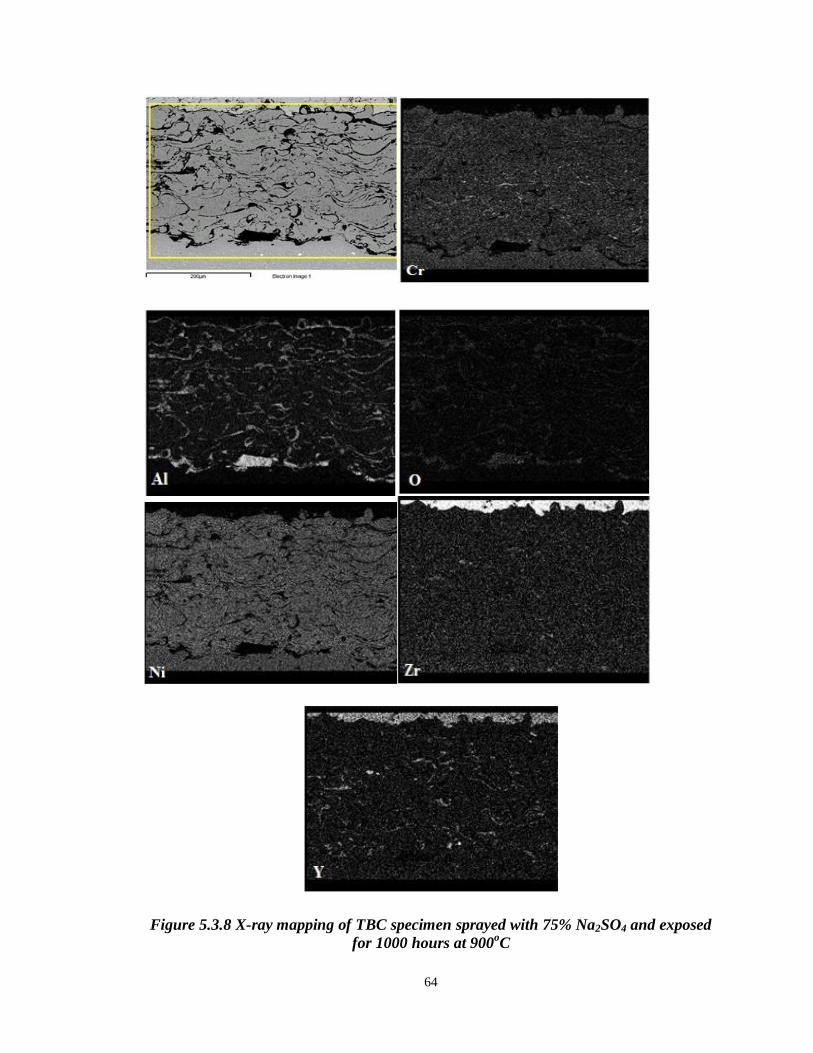
Figure 5.3.8 X-ray mapping of TBC specimen sprayed with 75% Na2SO4 and exposed for
1000 hours at 900oC ...................................................................................................... 64
xiii
THESIS ABSTRACT
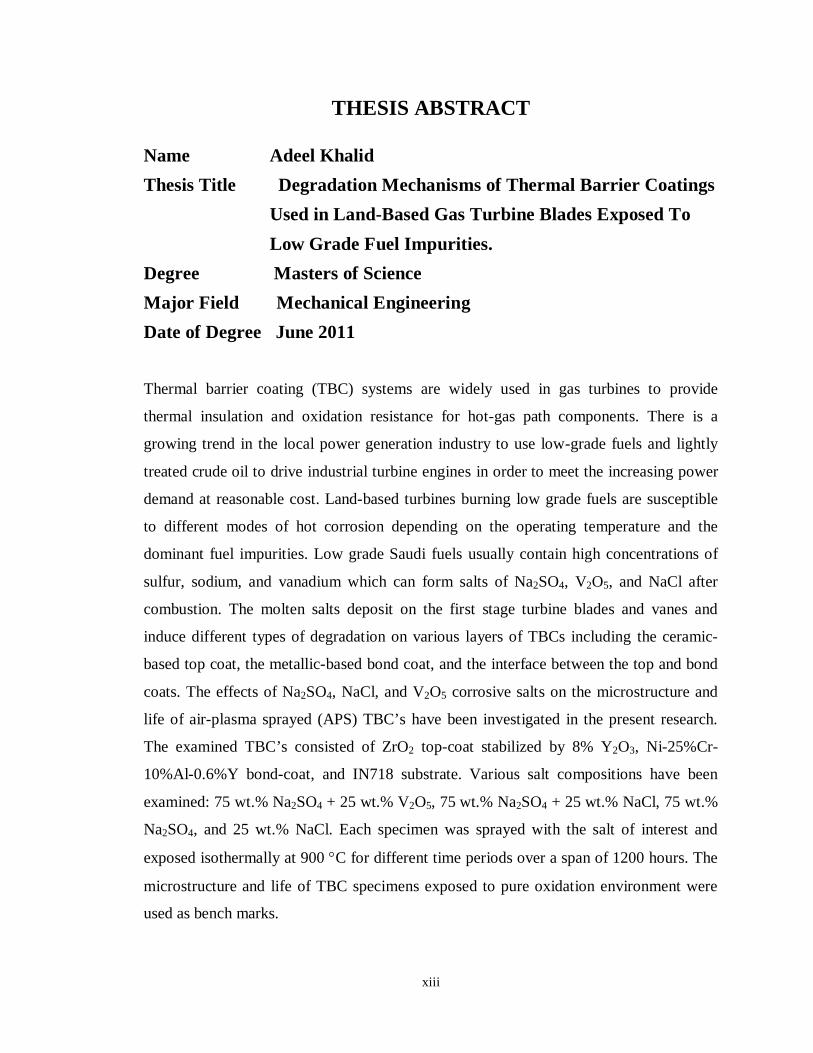
Name Adeel Khalid Thesis Title Degradation Mechanisms of Thermal Barrier Coatings Used in Land-Based Gas Turbine Blades Exposed To Low Grade Fuel Impurities. Degree Masters of Science Major Field Mechanical Engineering Date of Degree June 2011 Thermal barrier coating (TBC) systems are widely used in gas turbines to provide
thermal insulation and oxidation resistance for hot-gas path components. There is a
growing trend in the local power generation industry to use low-grade fuels and lightly
treated crude oil to drive industrial turbine engines in order to meet the increasing power
demand at reasonable cost. Land-based turbines burning low grade fuels are susceptible
to different modes of hot corrosion depending on the operating temperature and the
dominant fuel impurities. Low grade Saudi fuels usually contain high concentrations of
sulfur, sodium, and vanadium which can form salts of Na2SO4, V2O5, and NaCl after
combustion. The molten salts deposit on the first stage turbine blades and vanes and
induce different types of degradation on various layers of TBCs including the ceramic-
based top coat, the metallic-based bond coat, and the interface between the top and bond
coats. The effects of Na2SO4, NaCl, and V2O5 corrosive salts on the microstructure and
life of air-plasma sprayed (APS) TBC’s have been investigated in the present research.
The examined TBC’s consisted of ZrO2 top-coat stabilized by 8% Y2O3, Ni-25%Cr-
10%Al-0.6%Y bond-coat, and IN718 substrate. Various salt compositions have been
examined: 75 wt.% Na2SO4 + 25 wt.% V2O5, 75 wt.% Na2SO4 + 25 wt.% NaCl, 75 wt.%
Na2SO4, and 25 wt.% NaCl. Each specimen was sprayed with the salt of interest and
exposed isothermally at 900 C for different time periods over a span of 1200 hours. The
microstructure and life of TBC specimens exposed to pure oxidation environment were
used as bench marks.
xiv
خـــــلاصــــــة الرســـــــــــــالــــــــــة
ــدیل خالــد ع : اسم الطالب
ـــــس :عنوان الرسالة ـــــید ج ـــــد إن لاندباس ـــــتنجز أس ـــــریر س ـــــال ب ـــــمس أف ثیرم ـــــراداتیون میشانیس جــــوریتییس ــــول مب ــــو جــــراد ف ــــس كسبوســــید طــــھ ل ــــوربین لادی .ت
ــــــــة التخصص: ھندسھ میكانیكی
تاریخ الرسالھ: جون ٢٠١١
ومقاو_الحراري_العزل لتوفیر الغاز توربینات في نظم_)TBC( الجدار طلاء الحراریة واسع_نطاق_على وتستخدم
على الوقود المحلیة على استخدام تولید الطاقة في صناعة اتجاه متزاید ھناك .الغاز الساخن مسار الأكسدةلمكونات مة
الطلب على زیادة من أجل تلبیة الصناعیة ربینیةالمحركات التو لدفع باستخفاف یعامل والنفط الخام منخفض الدرجة
ا الساخن التآكل من_مختلفة_لأنماط_عرضة منخفضة_بدرجة الوقود_احتراق البریةتوربینات .معقولة_بتكلفة الطاقة
عل_تحتوي_ما_عادة الصف السعودیة الوقود انخفاض .المھیمن الوقود التشغیلوالشوائب_حرارة_درجة ىعل_عتمادا
،وكلوریدا Na2SO4، V2O5 أملاح تشكل_أن_یمكن_التي والفانادیوم_والكبریت الصودیوم_من لیةعا_تركیزات ى
مختلف_أنواع وحمل ودوارات_الأولى المرحلة التوربینات ریش المنصھرةعلى الأملاح إیداع .الاحتراق بعد صودیوم
المسن السنت علوي،ومعطفال مقرھا السیرامیك ذلك_في_بما TBCs معطف من_مختلفة طبقات_على التدھور من_ة
على V2O5 أملاح وتآكل_الصودیوم،_كلورید ،Na2SO4آثار .السندات والمعاطف_أعلى بین_والتفاعل المعدنیة، دة
لأ_TBC ZrO2لفح تألفت .الحالي البحث_في TBC التحقیقفي_تم_وقد )APS( البلازما رش الھواء وحیاة المجھریة
وقد .IN718 والركیزة معطف، السندات ٪ 0.6 آل Y ٪ ٪الكروم 10 - 25 - ، نيY2O3 بنسبة استقر معطف على
كلو رNa2SO4 ٪ وزن 75، و V2O5 بالوزن ٪ Na2SO4 +25بالوزن ٪ 75 : الملح المختلفة التراكیب تم فحص
و_منلاھتمام الملح مع عینة كل رش_تم .الصودیوم_دكلوری ٪_25 ووزن_،Na2SO4و_الصودیوم،_كلورید بالوزن
ــالســوث تتعرض مدى مختلفة_زمنیة لفترات_ل_یرم یتع TBCالعین والحیاة المجھریة استخدمت .ساعة 1200 عل
.مقاعد البدلاء علامات نقیة كماالأكسدة للبیئة رض
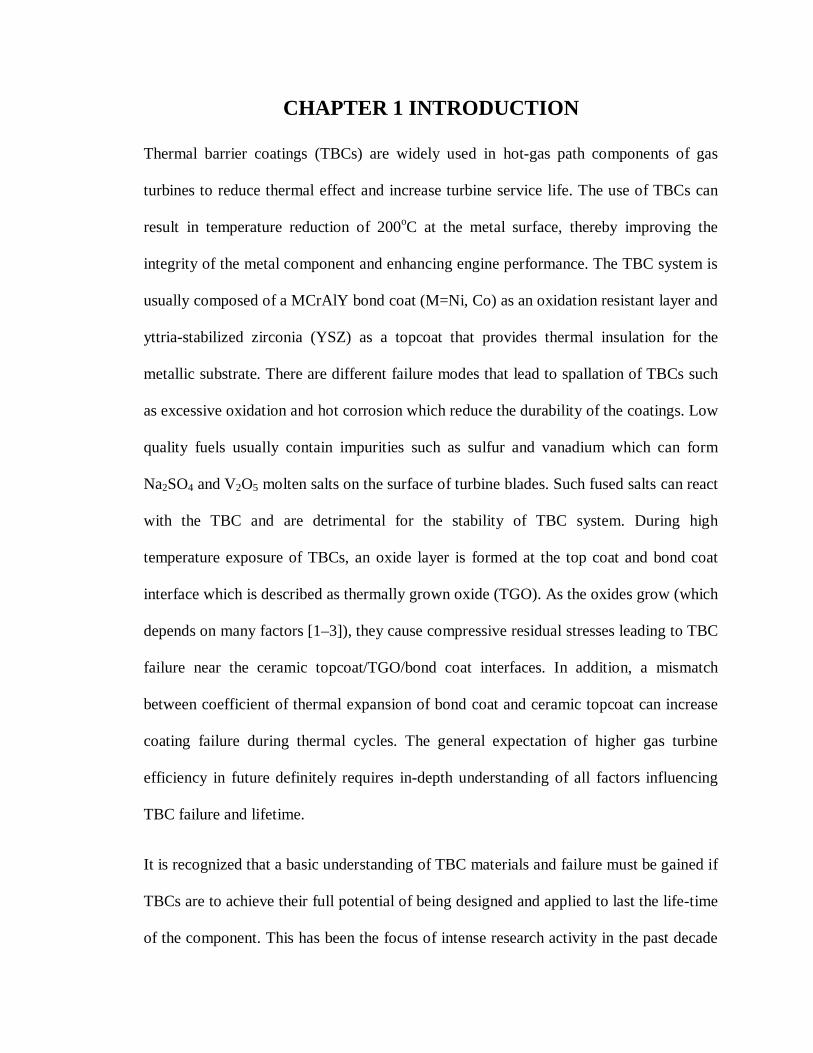
CHAPTER 1 INTRODUCTION
Thermal barrier coatings (TBCs) are widely used in hot-gas path components of gas
turbines to reduce thermal effect and increase turbine service life. The use of TBCs can
result in temperature reduction of 200oC at the metal surface, thereby improving the
integrity of the metal component and enhancing engine performance. The TBC system is
usually composed of a MCrAlY bond coat (M=Ni, Co) as an oxidation resistant layer and
yttria-stabilized zirconia (YSZ) as a topcoat that provides thermal insulation for the
metallic substrate. There are different failure modes that lead to spallation of TBCs such
as excessive oxidation and hot corrosion which reduce the durability of the coatings. Low
quality fuels usually contain impurities such as sulfur and vanadium which can form
Na2SO4 and V2O5 molten salts on the surface of turbine blades. Such fused salts can react
with the TBC and are detrimental for the stability of TBC system. During high
temperature exposure of TBCs, an oxide layer is formed at the top coat and bond coat
interface which is described as thermally grown oxide (TGO). As the oxides grow (which
depends on many factors [1–3]), they cause compressive residual stresses leading to TBC
failure near the ceramic topcoat/TGO/bond coat interfaces. In addition, a mismatch
between coefficient of thermal expansion of bond coat and ceramic topcoat can increase
coating failure during thermal cycles. The general expectation of higher gas turbine
efficiency in future definitely requires in-depth understanding of all factors influencing
TBC failure and lifetime.
It is recognized that a basic understanding of TBC materials and failure must be gained if
TBCs are to achieve their full potential of being designed and applied to last the life-time
of the component. This has been the focus of intense research activity in the past decade
2
[4]. The complexity and diversity of TBC structures and severity of operating conditions
make this a challenging task. TBC is perhaps the only system where a complex interplay
occurs of all the following phenomena: diffusion, oxidation, phase transformation, elastic
deformation, plastic deformation, creep deformation, thermal expansion, thermal
conduction, fracture, fatigue and sintering. In this framework, microstructure
characterization and description of the failure modes is a pre-requisite for life time
modeling.
Motivation & objectives A large number of power plants in the Kingdom of Saudi Arabia use low grad/crude oil
for power generation. The low grade/crude oil contains impurities which react to form
fused salts. At higher temperatures these corrosive impurity salts lead to increased high
temperature corrosion damage (hot corrosion) which can cause catastrophic failures of
TBC system.
The aim of this research is to investigate the effect of fuel impurity salts on the integrity
and performance of top coat, bond coat, and top coat/bond coat interfaces in a typical
TBC used in the local power generation industry.
3
CHAPTER 2 LITERATURE REVIEW
2.1 Modern Gas Turbines Thermal barrier coating systems (TBCs) are widely used in modern gas turbine engines
to lower the metal surface temperature in the combustor and turbine section hardware.
Engines for both aero-jet propulsion and land-based industrial power generation have
taken advantage of this technology to meet increasing demands for greater fuel
efficiency, lower NOx emissions, and higher power and thrust. The engine components
exposed to the most extreme temperatures are the combustor and the initial rotor blades
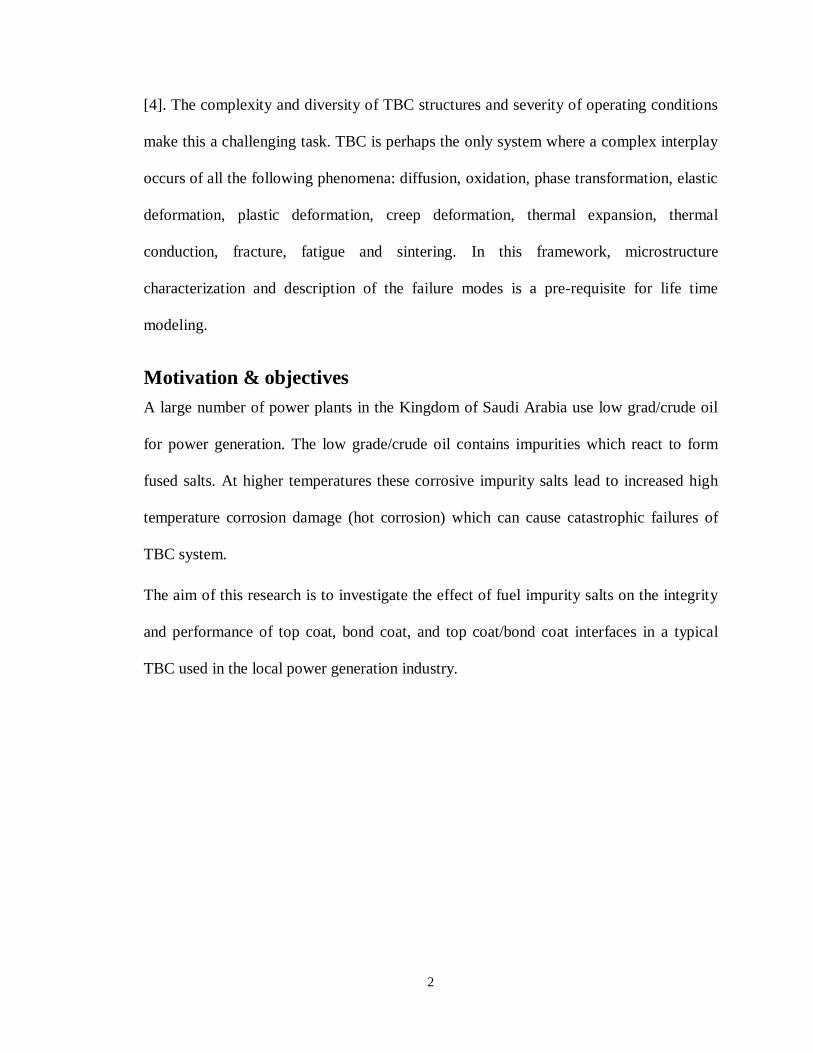
and nozzle guide vanes of the high-pressure turbine. Metal temperature reductions of up
to 200oC are possible when TBCs are used in conjunction with external film cooling and
internal component air cooling [5]. A diagram of the relative temperature reduction
achieved using both TBC and cooling air technologies on hot section hardware is shown
in Figure 2.1.1
Figure 2.1.1 Schematic of a TBC on an air-cooled gas turbine engine component [5].
4
2.2 Thermal Barrier Coating System Typical thermal barrier coatings (TBCs) consist of a ceramic overlay coating
(ZrO2, stabilized by 7-8% Y2O3) and an aluminum-rich oxidation resistant metallic layer,
also called bond coat, deposited onto the Ni-based substrate. The bond coat is
normally a MCrAlY (where “M” is Ni or Co). The ceramic top coat is deposited either by
atmospheric plasma spraying (APS) [6] or by electron-beam physical vapor deposition
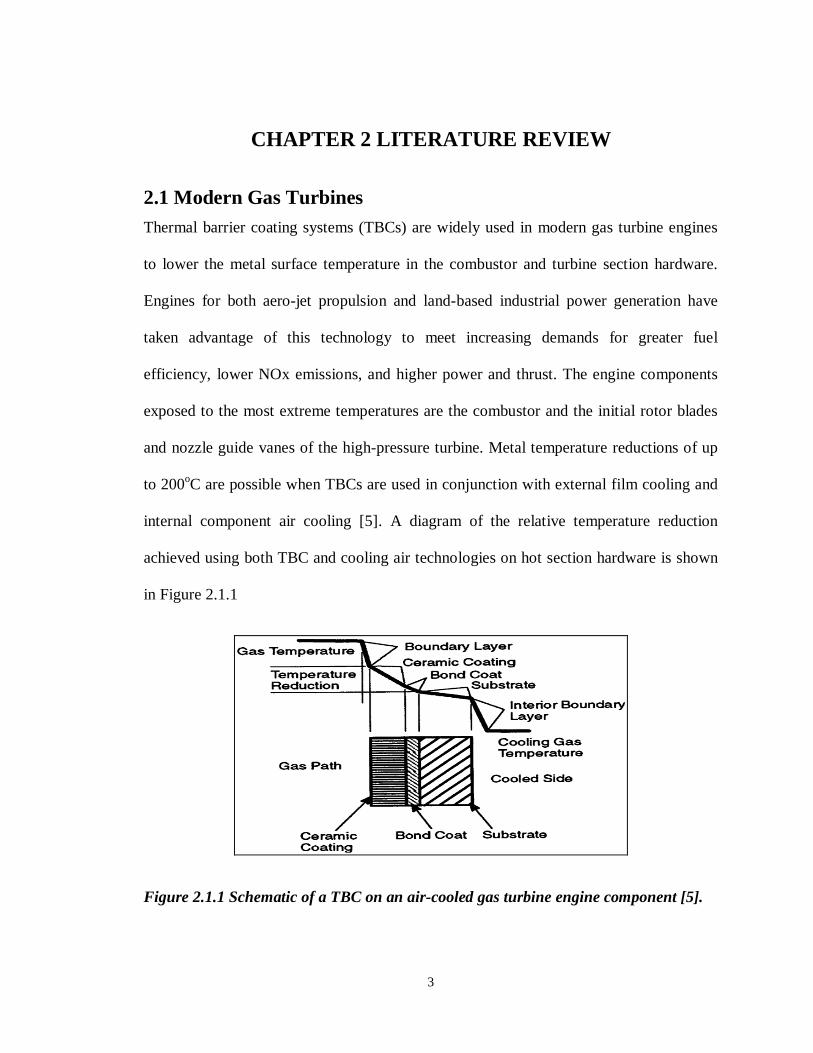
(EB-PVD) [7]. Figure 2.2.1 shows the schematic of typical microstructure formed in case
of APS and EB-PVD sprayed TBC. The Al2O3 TGO provides oxidation resistance to the
underneath bond coat elements.
Figure 2.2.1 Schematic of TBC microstructure in a thermal barrier coatings deposited by APS and EB-PVD techniques [6, 7].
5
2.2.1 Ceramic top coat In order to withstand high thermal and mechanical loading during service thermal
barrier ceramic coatings must possess low thermal conductivity, high temperature
resistance, appropriate thermal expansion coefficient, strain tolerance, chemical
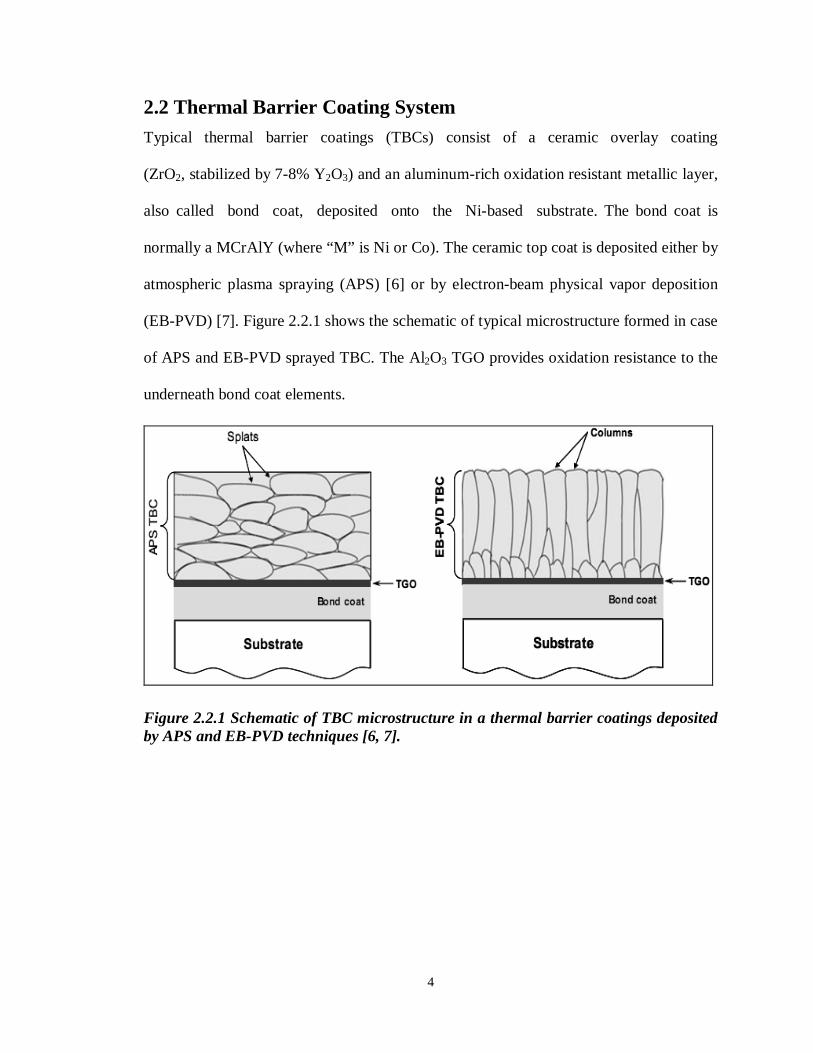
stability, corrosion and oxidation resistance. ZrO2 has a low thermal conductivity at
elevated temperature as shown in Figure 2.2.2 in combination with a high thermal-
expansion coefficient 9–11.5·10-6 K-1, which is not too far from the value of
underlying substrate (~12 · 10-6 K-1). ZrO2 is the base material of choice for the ceramic
top-coats of high temperature components [8].
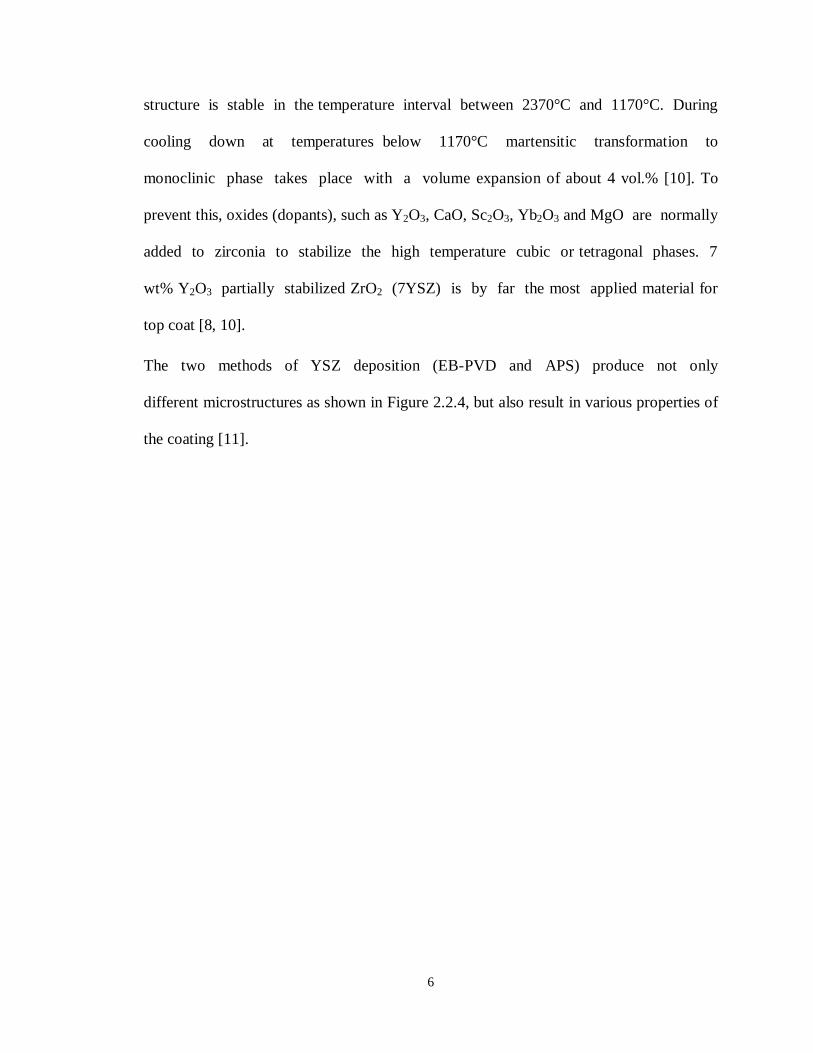
Depending on temperature, pure ZrO2 can exist in different crystallographic
modifications, as shown in the phase diagram of ZrO2-Y2O3 in Figure 2.2.3. Between the
melting point 2680°C and 2370°C pure zirconia has a cubic symmetry. Tetragonal
Figure 2.2.2 The thermal conductivity of several ceramic materials, including ZrO2 [9]
6
structure is stable in the temperature interval between 2370°C and 1170°C. During
cooling down at temperatures below 1170°C martensitic transformation to
monoclinic phase takes place with a volume expansion of about 4 vol.% [10]. To
prevent this, oxides (dopants), such as Y2O3, CaO, Sc2O3, Yb2O3 and MgO are normally
added to zirconia to stabilize the high temperature cubic or tetragonal phases. 7
wt% Y2O3 partially stabilized ZrO2 (7YSZ) is by far the most applied material for
top coat [8, 10].
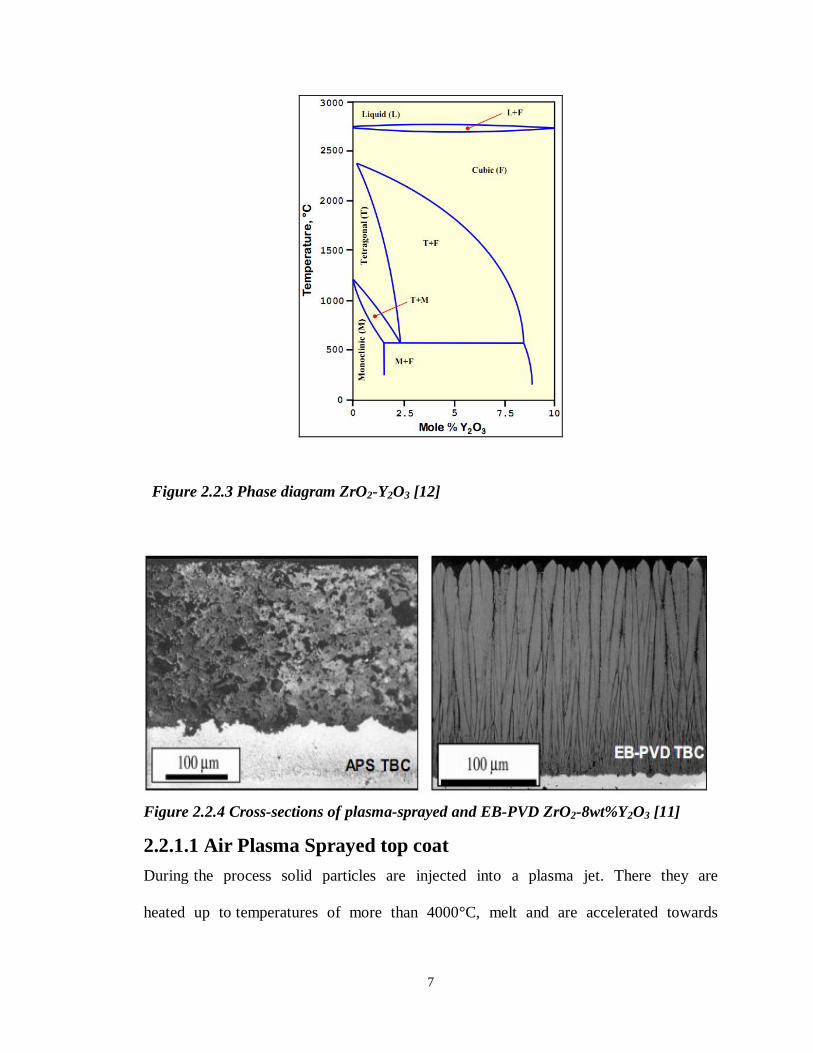
The two methods of YSZ deposition (EB-PVD and APS) produce not only
different microstructures as shown in Figure 2.2.4, but also result in various properties of
the coating [11].
7
Figure 2.2.3 Phase diagram ZrO2-Y2O3 [12]
Figure 2.2.4 Cross-sections of plasma-sprayed and EB-PVD ZrO2-8wt%Y2O3 [11]
2.2.1.1 Air Plasma Sprayed top coat During the process solid particles are injected into a plasma jet. There they are
heated up to temperatures of more than 4000°C, melt and are accelerated towards
8
the substrate by an electrostatic field. There are three main modes of plasma spraying:
air plasma (APS), vacuum plasma (VPS) and low pressure plasma spraying (LPPS).
Ceramic coatings, such as YSZ are usually deposited in air. The following parameters
may influence the final microstructure of deposited coating: density of the ceramic
powder, particle sizes, particle morphologies, melting point (the powder can be
melted not completely), temperature, velocity of the particles, etc. A low substrate
temperature between 100 and 300°C is typically chosen [13, 14].
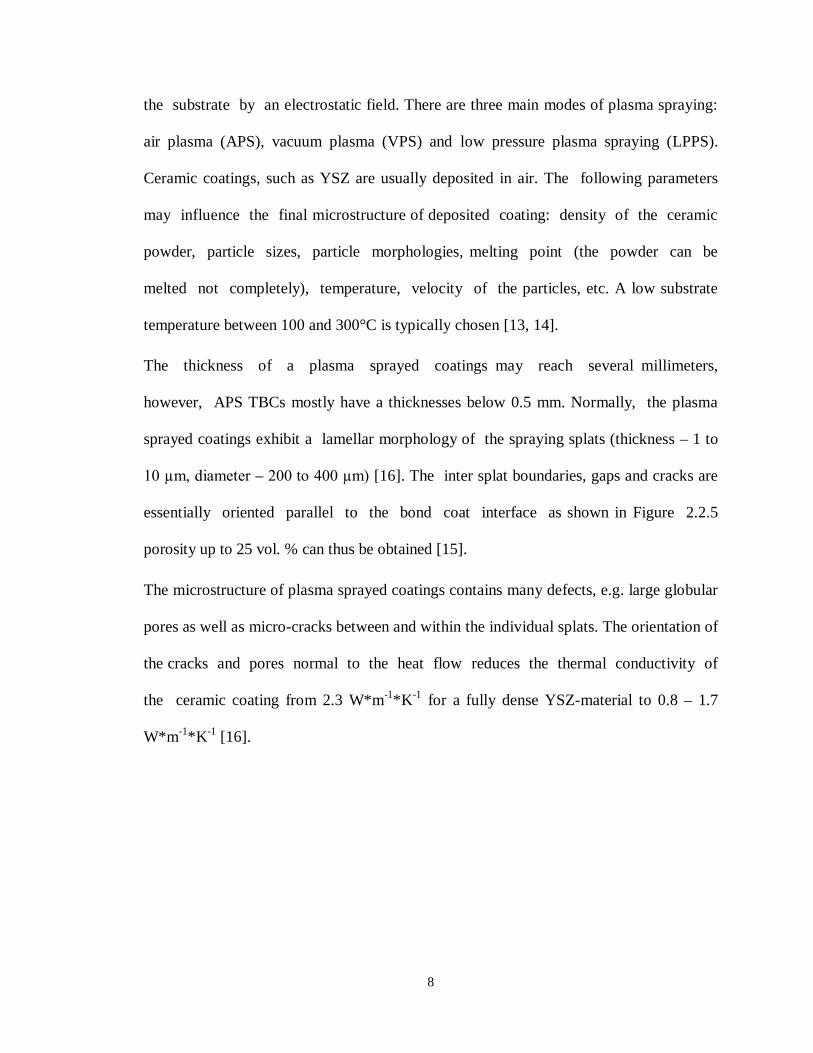
The thickness of a plasma sprayed coatings may reach several millimeters,
however, APS TBCs mostly have a thicknesses below 0.5 mm. Normally, the plasma
sprayed coatings exhibit a lamellar morphology of the spraying splats (thickness – 1 to
10 µm, diameter – 200 to 400 µm) [16]. The inter splat boundaries, gaps and cracks are
essentially oriented parallel to the bond coat interface as shown in Figure 2.2.5
porosity up to 25 vol. % can thus be obtained [15].
The microstructure of plasma sprayed coatings contains many defects, e.g. large globular
pores as well as micro-cracks between and within the individual splats. The orientation of
the cracks and pores normal to the heat flow reduces the thermal conductivity of
the ceramic coating from 2.3 W*m-1*K-1 for a fully dense YSZ-material to 0.8 – 1.7
W*m-1*K-1 [16].
9
2.2.1.2 Electron Beam-Physical Vapor Deposition (EB-PVD) top coat In contrast, TBCs deposited by EB-PVD have a columnar microstructure as shown
in Fig.2.2.1. The columnar grains are oriented predominantly parallel to the vapor
flux and normal to the substrate surface [17]. In the EB-PVD process, focused high-
energy electron beams generated from electron guns are directed to melt and evaporate
ingots as well as to preheat the substrate inside the vacuum chamber. The vapor cloud
condenses on the rotating component and forms the coating. The solidified particles have
a limited mobility because of the low thermal energy of the vapor species, leading to
shadowing effect and formation of layers within the columns, resulting in a typical
feather-like structure [18]. The disconnected columns impart excellent strain
tolerance, accommodating thermal expansion mismatch. The bond coat surface is kept
smooth for deposition, since PVD process provides good chemical bonding [19].
Figure 2.2.5 Cross-sections of plasma-sprayed and APS ZrO2-8wt%Y2O3 [16].
10
2.2.2 Metallic Bond Coat The bond coat provides protection of the base material against oxidation attack and hot
gas corrosion. The bond coat also provides the adhesion between substrate and TBC.
Three main groups of bond coats are currently state-of-the-art: diffusion aluminide,
platinum aluminide and overlay MCrAlY bond coats. All types of metallic coatings
feature a high content of Al, which enables the formation of a stable Al2O3 scale
providing good oxidation resistance. The alumina-TGO has a low growth rate, a dense
hexagonal close-packed crystal structure, which is stable between room temperature
and melting point. In addition to oxidation/corrosion protection, the bond coat, which
is ductile at high temperature, also provides significant compensation of the thermal
expansion misfit between the metallic substrate and the ceramic top coat [20]. The bond
coat is applied by either APS or vacuum plasma spraying.
2.2.2.1 Diffusion Aluminide Diffusion aluminide coatings are based on the intermetallic compound β-NiAl. Pack
cementation is a commonly used process, because it is relatively inexpensive and capable
of coating many small parts in one batch. The parts are immersed in a powder mixture,
containing alumina and aluminum particles, and ammonium halide activator. Coating
takes place at temperatures between 800 and 1000oC. Aluminum halides react on the
surface of the part and deposit aluminum. More advanced processes consist of ‘‘over the
pack’’ vapor phase aluminizing (VPA) or chemical vapor deposition (CVD). These
processes can control the flow of the aluminum halides to selected areas of the parts to be
coated, and are used especially when there is a need to coat also the internals of
components.

11
Depending on the activity of the aluminum and the coating temperature, one can achieve
two coating microstructures [21]. The low activity, high-temperature process (1050-
1100oC), forms NiAl by outward diffusion of nickel. In the high activity, low temperature
process (700-950oC), Ni2Al3 and possibly β-NiAl forms by inward diffusion of
aluminum. Typically a diffusion heat treatment is applied to form a fully homogeneous β-
NiAl layer [22].
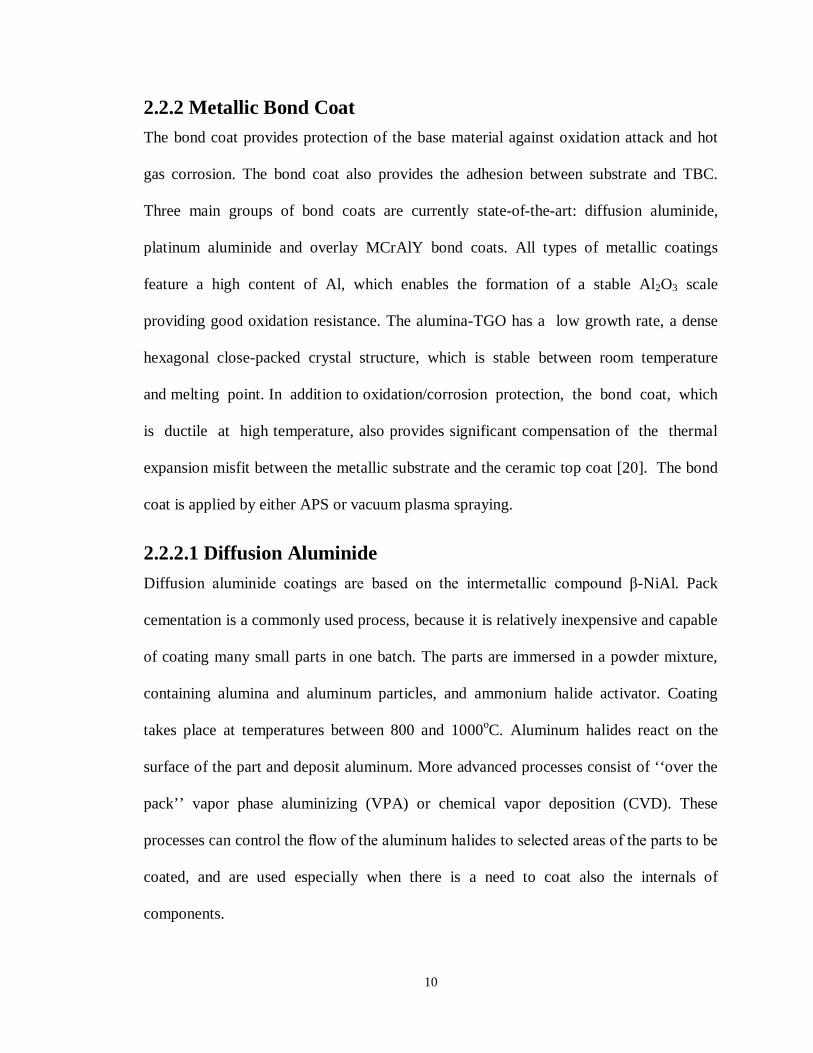
2.2.2.2 Platinum Aluminide The addition of platinum to the diffusion aluminide coating system is beneficial in two
ways: first, the platinum enhances the diffusion of aluminum [23] into the substrate alloy
during the diffusion aluminizing process. Platinum aluminide can also be made either
with the low activity, high-temperature process or by the high activity—low-temperature
diffusion process. Figures 2.2.6 and 2.2.7 show schematically the microstructures of these
two types of coatings. Since the part surface is grit blasted prior to the application of the
platinum, grit inclusions can serve as markers to indicate the additive coating layer or the
original alloy surface. In the case of the low activity—high-temperature process, the
additive layer is above the nickel diffusion zone, and in the case of high activity—low-
temperature process, the additive layer is under the original surface marked by the grit
inclusions. The relative thickness of the nickel diffusion zone also indicates the degree of
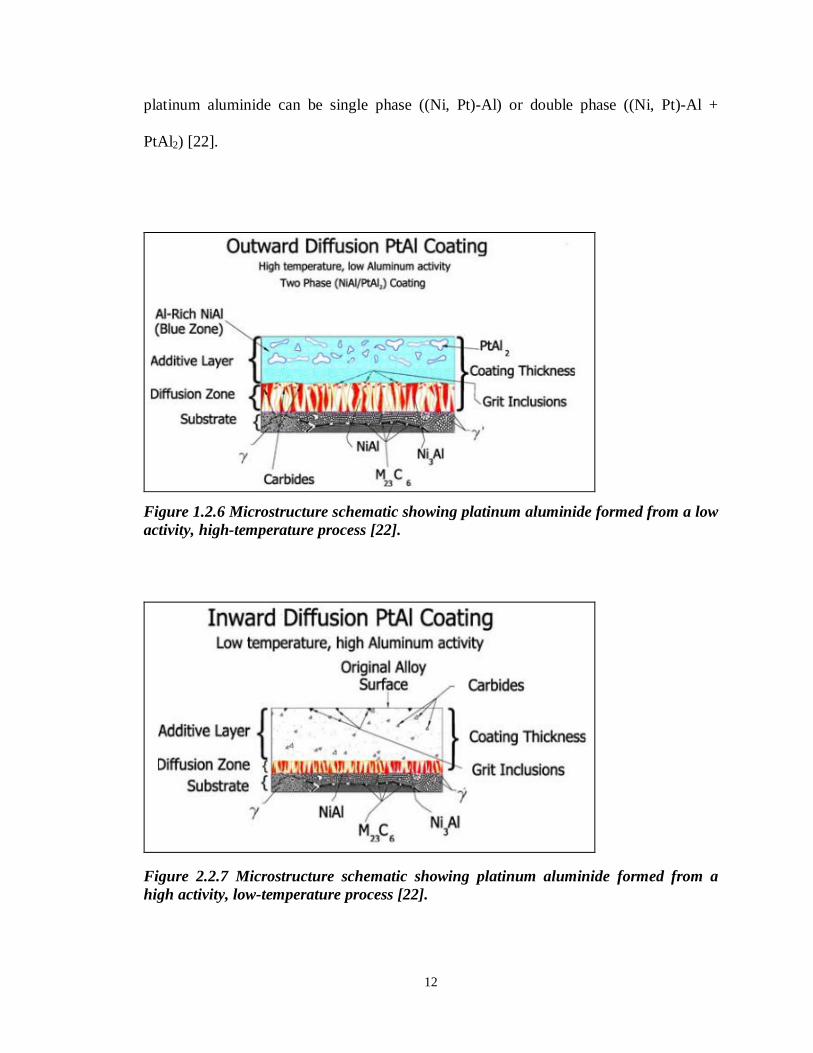
outward diffusion of nickel. As the coating grows inwardly in the high activity, low-
temperature process, it traps the carbides and other inclusions near the original alloys
surface, as shown in Figure 2.2.7. These inclusions can have a deleterious effect in that
they can lower the oxidation/corrosion resistance of the coating. In either processes,
12
platinum aluminide can be single phase ((Ni, Pt)-Al) or double phase ((Ni, Pt)-Al +
PtAl2) [22].
Figure 1.2.6 Microstructure schematic showing platinum aluminide formed from a low activity, high-temperature process [22].
Figure 2.2.7 Microstructure schematic showing platinum aluminide formed from a high activity, low-temperature process [22].
13
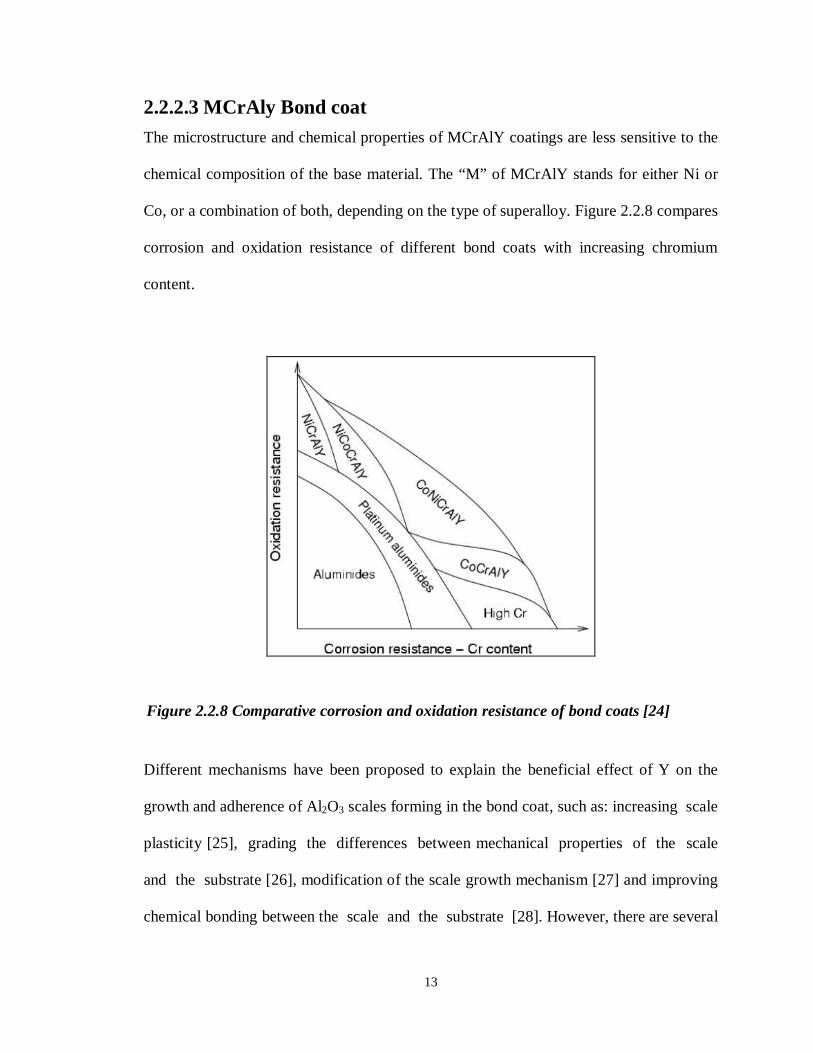
2.2.2.3 MCrAly Bond coat The microstructure and chemical properties of MCrAlY coatings are less sensitive to the
chemical composition of the base material. The “M” of MCrAlY stands for either Ni or
Co, or a combination of both, depending on the type of superalloy. Figure 2.2.8 compares
corrosion and oxidation resistance of different bond coats with increasing chromium
content.
Different mechanisms have been proposed to explain the beneficial effect of Y on the
growth and adherence of Al2O3 scales forming in the bond coat, such as: increasing scale
plasticity [25], grading the differences between mechanical properties of the scale
and the substrate [26], modification of the scale growth mechanism [27] and improving
chemical bonding between the scale and the substrate [28]. However, there are several
Figure 2.2.8 Comparative corrosion and oxidation resistance of bond coats [24]
14
studies, which demonstrate that Y can be detrimental for oxide adherence [29, 30].
Yttrium incorporates in the compact alumina TGO scale and as a result of internal
oxidation forms Y2O3 precipitations, which is accompanied by Y-depletion process in
MCrAlY bond coat. If the yttrium concentration has been decreased beneath a critical
level, its positive effect on TGO adherence is lost, resulting in TGO spallation [31].
Addition of another reactive element, like Hf plays a similar role.
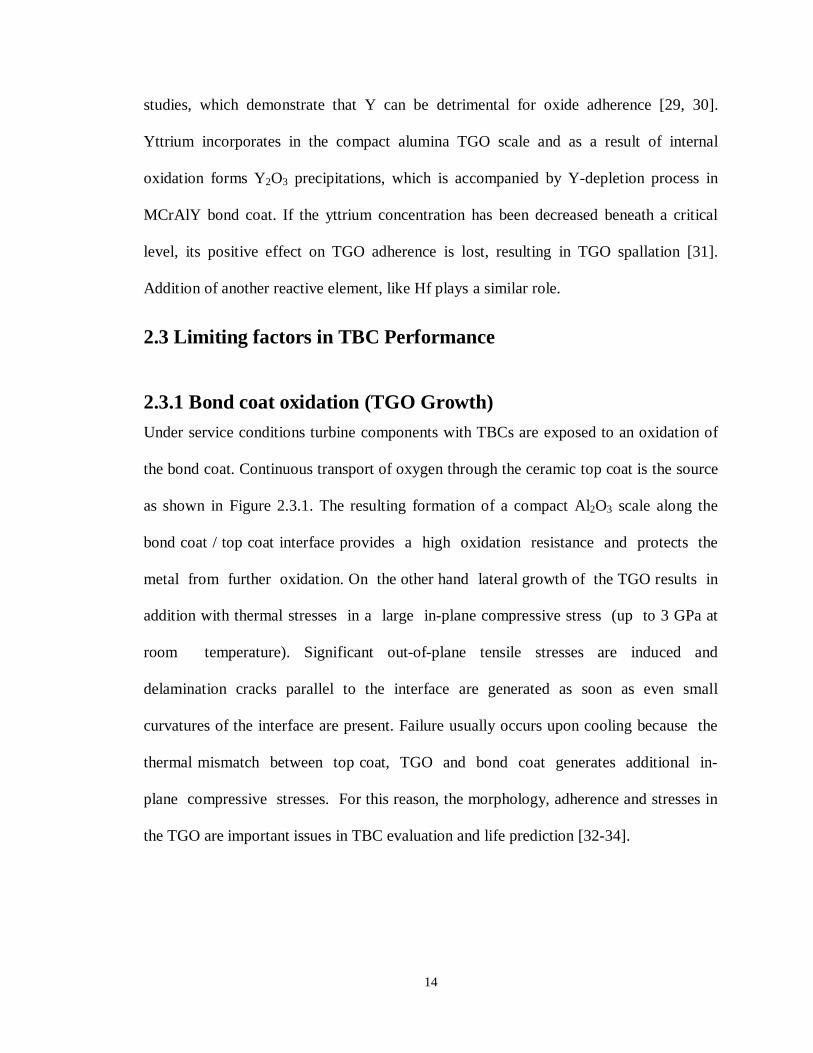
2.3 Limiting factors in TBC Performance 2.3.1 Bond coat oxidation (TGO Growth) Under service conditions turbine components with TBCs are exposed to an oxidation of
the bond coat. Continuous transport of oxygen through the ceramic top coat is the source
as shown in Figure 2.3.1. The resulting formation of a compact Al2O3 scale along the
bond coat / top coat interface provides a high oxidation resistance and protects the
metal from further oxidation. On the other hand lateral growth of the TGO results in
addition with thermal stresses in a large in-plane compressive stress (up to 3 GPa at
room temperature). Significant out-of-plane tensile stresses are induced and
delamination cracks parallel to the interface are generated as soon as even small
curvatures of the interface are present. Failure usually occurs upon cooling because the
thermal mismatch between top coat, TGO and bond coat generates additional in-
plane compressive stresses. For this reason, the morphology, adherence and stresses in
the TGO are important issues in TBC evaluation and life prediction [32-34].
15
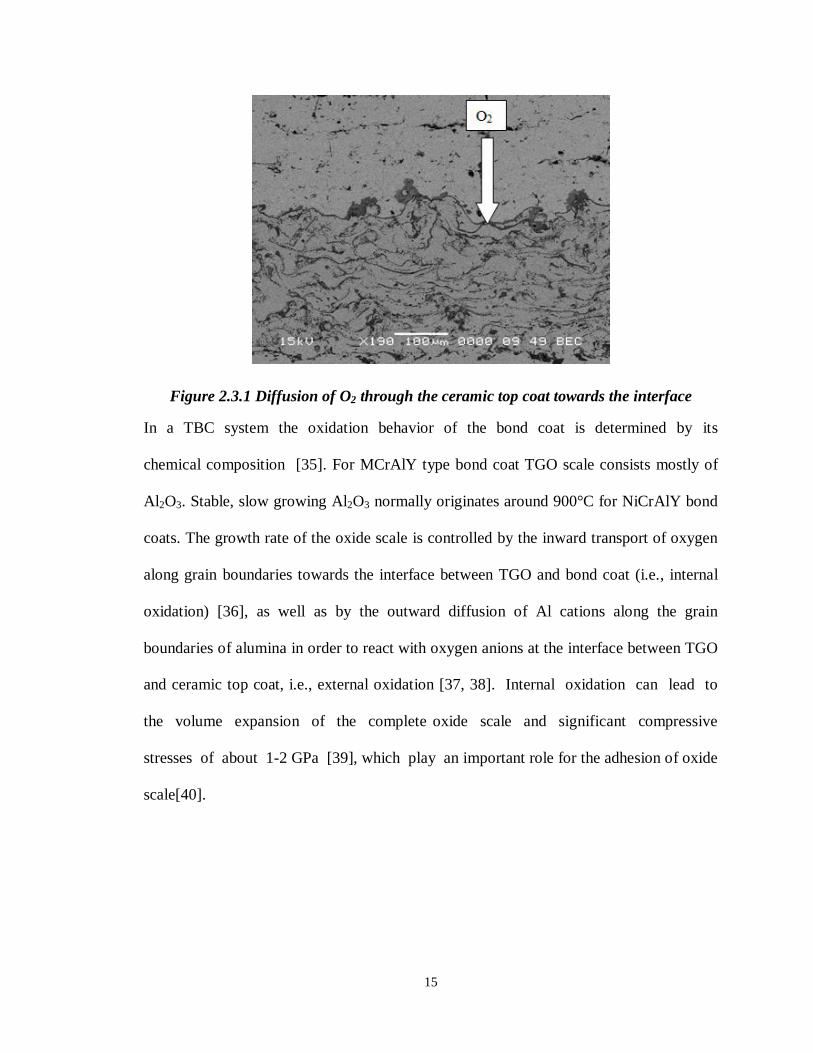
Figure 2.3.1 Diffusion of O2 through the ceramic top coat towards the interface
In a TBC system the oxidation behavior of the bond coat is determined by its
chemical composition [35]. For MCrAlY type bond coat TGO scale consists mostly of
Al2O3. Stable, slow growing Al2O3 normally originates around 900°C for NiCrAlY bond
coats. The growth rate of the oxide scale is controlled by the inward transport of oxygen
along grain boundaries towards the interface between TGO and bond coat (i.e., internal
oxidation) [36], as well as by the outward diffusion of Al cations along the grain
boundaries of alumina in order to react with oxygen anions at the interface between TGO
and ceramic top coat, i.e., external oxidation [37, 38]. Internal oxidation can lead to
the volume expansion of the complete oxide scale and significant compressive
stresses of about 1-2 GPa [39], which play an important role for the adhesion of oxide
scale[40].
16
2.3.2 Top coat degradation by hot corrosion Hot corrosion is one of the main destructive failure modes in thermal barrier coatings
(TBCs) which come as a result of molten salt effect on the coating–gas interface. Low
quality fuels usually contain impurities such as Na and V which can form Na2SO4 and
V2O5 salt on the surface of turbine blades. Such fused salts can react with yttria (the
stabilizer component of YSZ) and cause transformation of tetragonal or cubic zirconia to
monoclinic phase during cooling. This transformation is accompanied by 3–5% volume
expansion, leading to cracking and spallation of TBCs.
The mechanism of degradation during hot corrosion can be explained by the following
reactions [41, 42]
V2O5 +Na2SO4 → 2(NaVO3) + SO3 (2.1)
ZrO2(Y2O3) + 2(NaVO3)→ ZrO2 (monoclinic) + 2YVO4 +Na2O (2.2)
Usually NaVO3 is formed after the reaction of initial salts (V2O5 + Na2SO4), then NaVO3
reacts withY2O3 to produce monoclinic ZrO2, YVO4 and Na2O. But Na was detected by
Chen et al.’s investigation [43] on hot corrosion of plasma sprayed Al2O3 and ZrO2
coatings in molten Na2SO4, and it was suggested the following reactions:
Na2SO4 → Na2O + SO3 (2.3)
Al2O3 +Na2O → 2NaAlO2 (2.4)
According to Eq. (2.4), NaAlO2 can be formed on the surface of Al2O3 particles, so that
the hot corrosion rate of Al2O3 coating in molten Na2SO4 was much lower than the ZrO2
coating.
The hot corrosion behavior and failure mechanism of TBCs comprises the following [42,
44].
17
a. Molten salt penetration through microcracks and open porosities.
b. Reaction of molten salt with the stabilizer of zirconia (Y2O3)
c. Phase transformation of zirconia from tetragonal to monoclinic, due to the
depletion of stabilizer, which is accompanied by volume expansion of the coating.
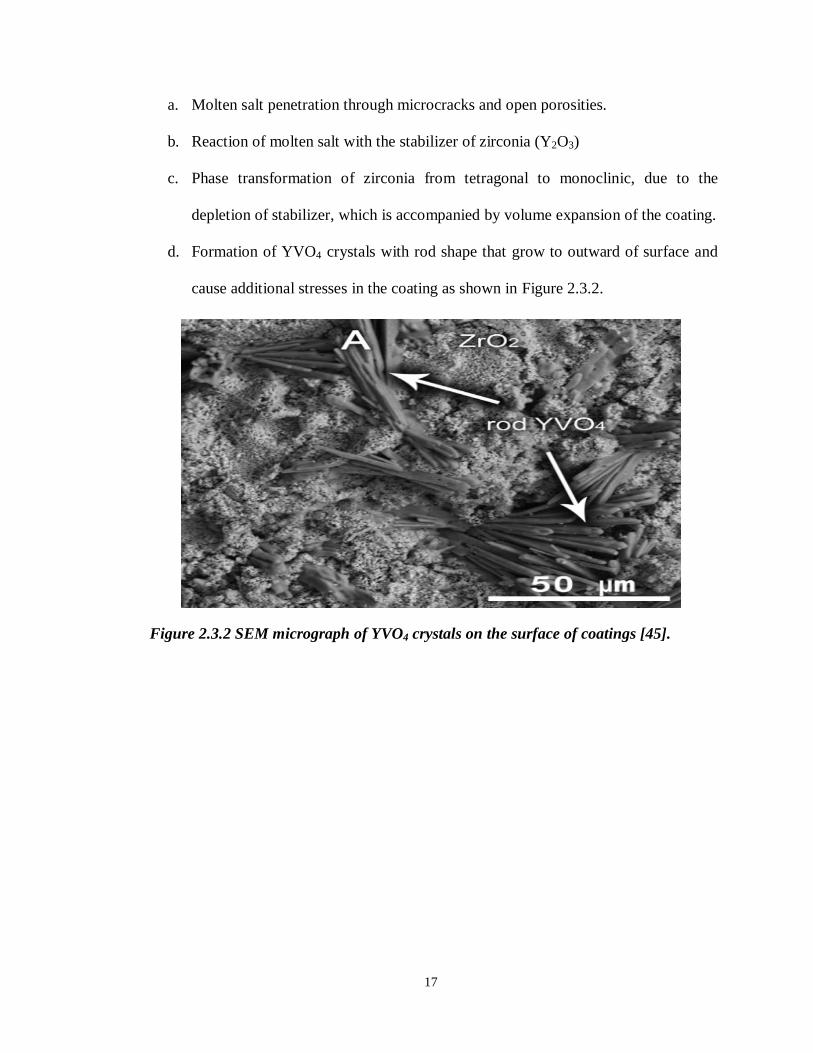
d. Formation of YVO4 crystals with rod shape that grow to outward of surface and
cause additional stresses in the coating as shown in Figure 2.3.2.
Figure 2.3.2 SEM micrograph of YVO4 crystals on the surface of coatings [45].
18
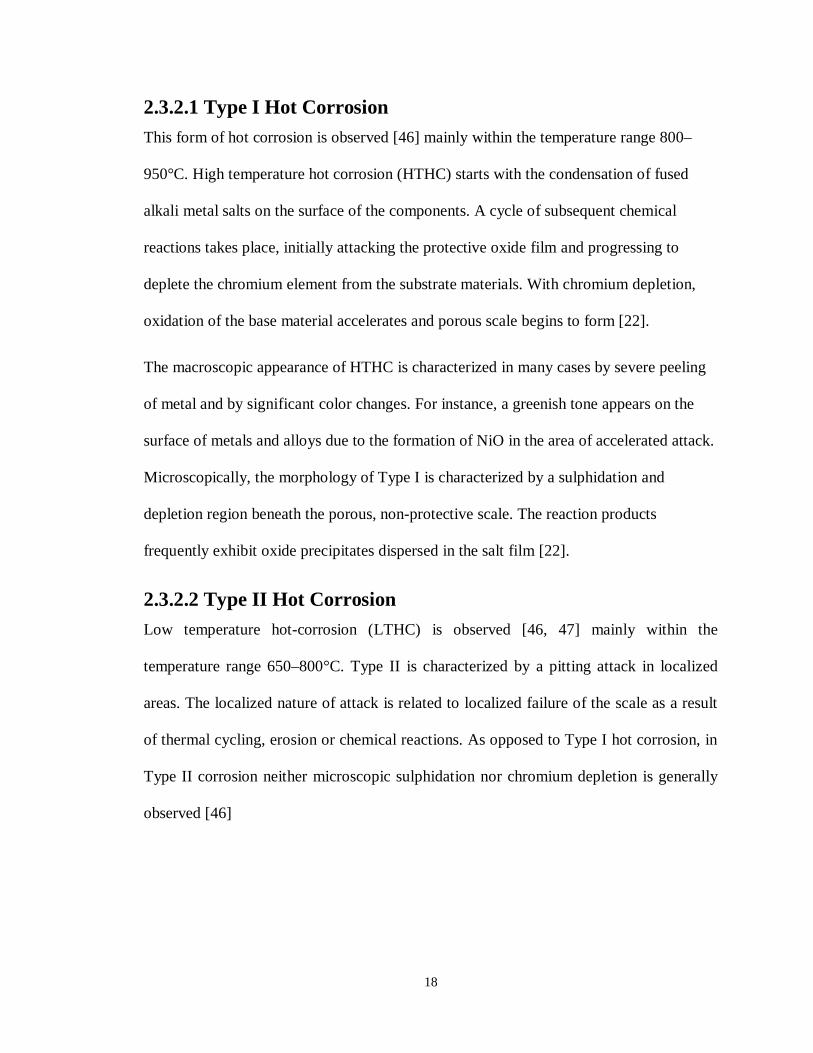
2.3.2.1 Type I Hot Corrosion This form of hot corrosion is observed [46] mainly within the temperature range 800–
950°C. High temperature hot corrosion (HTHC) starts with the condensation of fused
alkali metal salts on the surface of the components. A cycle of subsequent chemical
reactions takes place, initially attacking the protective oxide film and progressing to
deplete the chromium element from the substrate materials. With chromium depletion,
oxidation of the base material accelerates and porous scale begins to form [22].
The macroscopic appearance of HTHC is characterized in many cases by severe peeling
of metal and by significant color changes. For instance, a greenish tone appears on the
surface of metals and alloys due to the formation of NiO in the area of accelerated attack.
Microscopically, the morphology of Type I is characterized by a sulphidation and
depletion region beneath the porous, non-protective scale. The reaction products
frequently exhibit oxide precipitates dispersed in the salt film [22].
2.3.2.2 Type II Hot Corrosion Low temperature hot-corrosion (LTHC) is observed [46, 47] mainly within the
temperature range 650–800°C. Type II is characterized by a pitting attack in localized
areas. The localized nature of attack is related to localized failure of the scale as a result
of thermal cycling, erosion or chemical reactions. As opposed to Type I hot corrosion, in
Type II corrosion neither microscopic sulphidation nor chromium depletion is generally
observed [46]
19
2.3.3 Sulphidation When the sulfur activity (partial pressure, concentration) of the gaseous environment is
sufficiently high, sulfide phases, instead of oxide phases, can be formed. In the majority
of environments encountered in practice by oxidation resistant-alloys, Al2O3 should form
in preference to any sulfides, and destructive sulfidation attack occurs mainly at sites
where the protective oxide has broken down. The role of sulfur, once it has entered the
bond coat, appears to form Cr and Al sulfides and redistributing the protective TGO
forming elements near the bond coat surface and thus interfering with the process of
formation and reformation of protective TGO. If sufficient sulfur enters the bond coat so
that all immediately available Al is converted to sulfides, then the less stable sulfides of
base metal may form because of morphological and kinetic reasons [48].
2.3.4 Interdiffusion between substrate and bond coat MCrAlY coatings have higher Cr and Al contents than the superalloy substrates to
promote the formation of a protective oxide scales. This results in elemental diffusion
of these elements from the coating to the substrate at elevated temperatures. On
the other hand, the underlying superalloy has a greater content of Ni, Ti and refractory
elements such as Ta, W, Mo and Re mainly to improve the high temperature
mechanical properties. Consequently these elements diffuse from the substrate into the
coating. The inter-diffusion between Ni-base superalloys and MCrAlY bond coatings can
lead to the formation of detrimental phases, such as σ (sigma) phase, laves phases,
brittle carbides [49], voids and porosity [50].
20
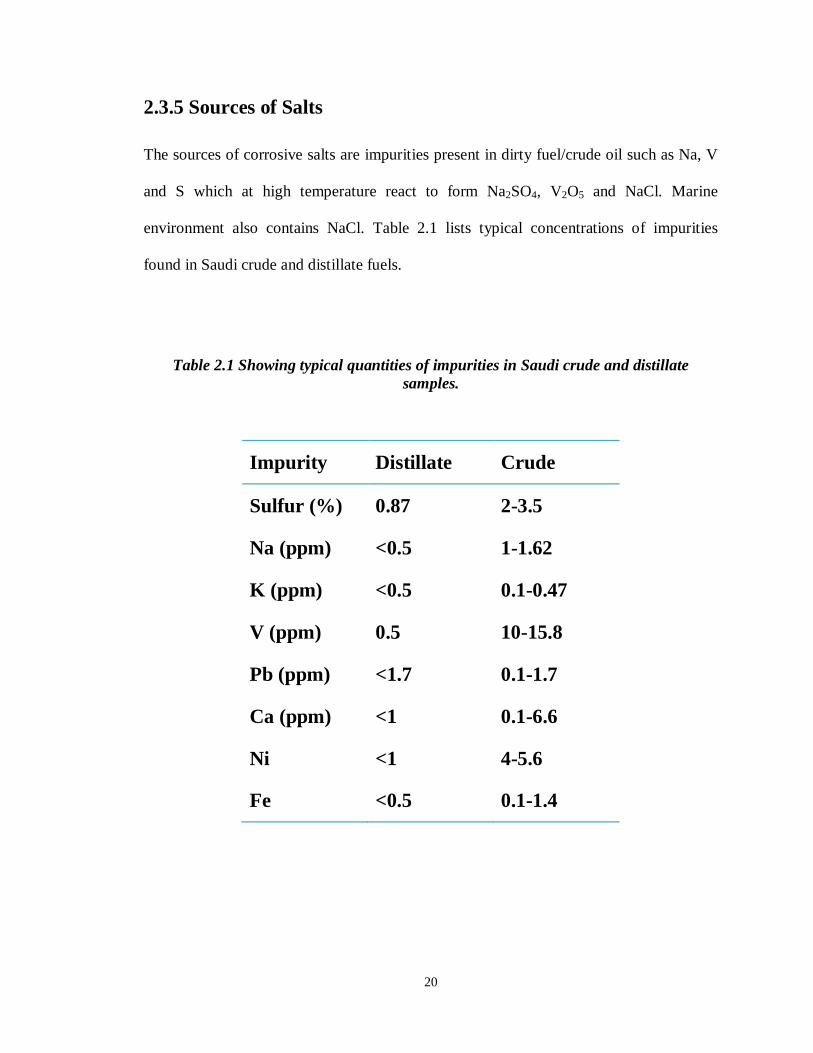
2.3.5 Sources of Salts
The sources of corrosive salts are impurities present in dirty fuel/crude oil such as Na, V
and S which at high temperature react to form Na2SO4, V2O5 and NaCl. Marine
environment also contains NaCl. Table 2.1 lists typical concentrations of impurities
found in Saudi crude and distillate fuels.
Table 2.1 Showing typical quantities of impurities in Saudi crude and distillate samples.
Impurity Distillate Crude
Sulfur (%) 0.87 2-3.5
Na (ppm) <0.5 1-1.62
K (ppm) <0.5 0.1-0.47
V (ppm) 0.5 10-15.8
Pb (ppm) <1.7 0.1-1.7
Ca (ppm) <1 0.1-6.6
Ni <1 4-5.6
Fe <0.5 0.1-1.4
21
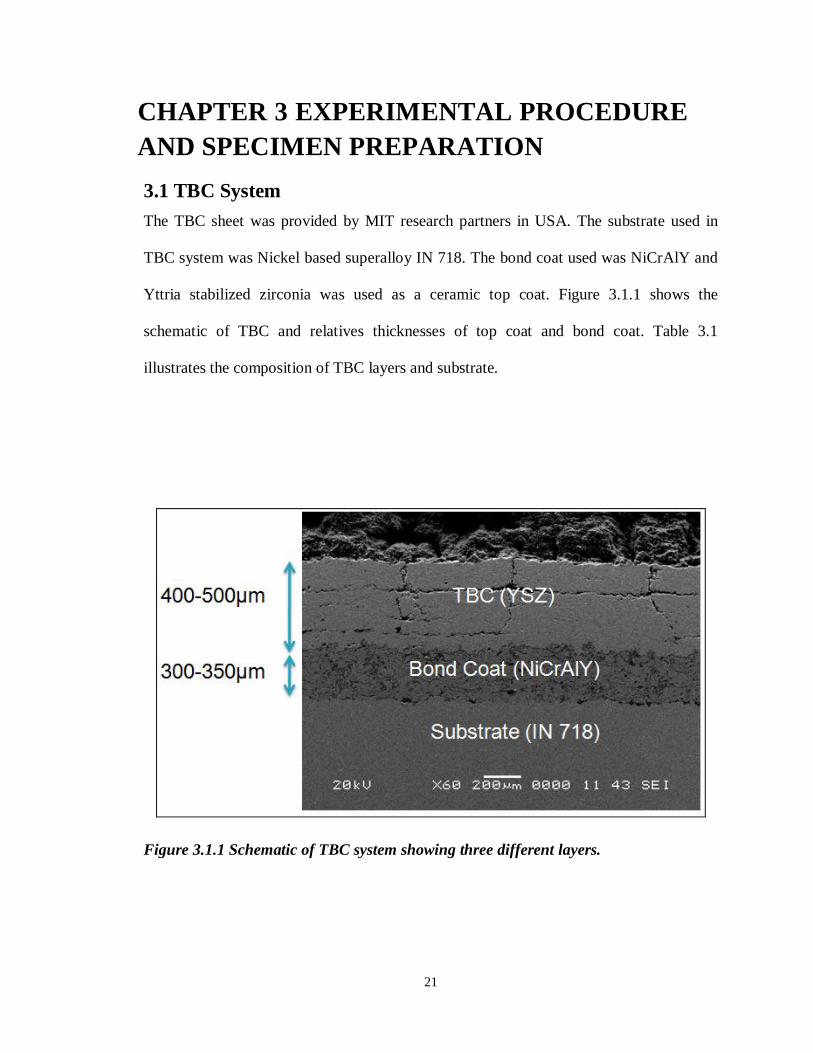
CHAPTER 3 EXPERIMENTAL PROCEDURE AND SPECIMEN PREPARATION 3.1 TBC System The TBC sheet was provided by MIT research partners in USA. The substrate used in
TBC system was Nickel based superalloy IN 718. The bond coat used was NiCrAlY and
Yttria stabilized zirconia was used as a ceramic top coat. Figure 3.1.1 shows the
schematic of TBC and relatives thicknesses of top coat and bond coat. Table 3.1
illustrates the composition of TBC layers and substrate.
Figure 3.1.1 Schematic of TBC system showing three different layers.
22
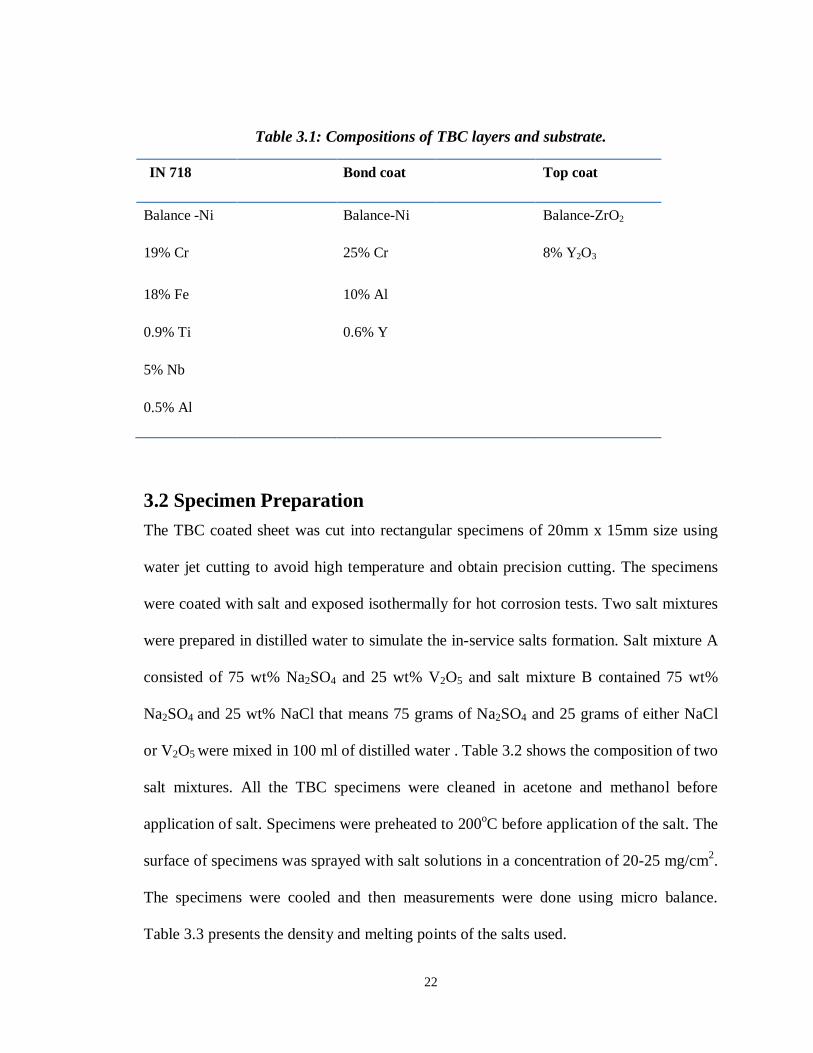
Table 3.1: Compositions of TBC layers and substrate.
IIN 718 Bond coat Top coat
Balance -Ni
19% Cr
Balance-Ni
25% Cr
Balance-ZrO2
8% Y2O3
18% Fe
0.9% Ti
5% Nb
0.5% Al
10% Al
0.6% Y
3.2 Specimen Preparation The TBC coated sheet was cut into rectangular specimens of 20mm x 15mm size using
water jet cutting to avoid high temperature and obtain precision cutting. The specimens
were coated with salt and exposed isothermally for hot corrosion tests. Two salt mixtures
were prepared in distilled water to simulate the in-service salts formation. Salt mixture A
consisted of 75 wt% Na2SO4 and 25 wt% V2O5 and salt mixture B contained 75 wt%
Na2SO4 and 25 wt% NaCl that means 75 grams of Na2SO4 and 25 grams of either NaCl
or V2O5 were mixed in 100 ml of distilled water . Table 3.2 shows the composition of two
salt mixtures. All the TBC specimens were cleaned in acetone and methanol before
application of salt. Specimens were preheated to 200oC before application of the salt. The
surface of specimens was sprayed with salt solutions in a concentration of 20-25 mg/cm2.
The specimens were cooled and then measurements were done using micro balance.
Table 3.3 presents the density and melting points of the salts used.
23
Table 3.2: Salt mixture compositions
Salt mixture Wt % Wt %
A Na2SO4 (75) V2O5 (25)
B Na2SO4 (75) NaCl (25)
Table 3.3: Physical specifications of salts [Oxford MSDS].
Type of salt Density (g/cm3) Melting point (oC)
Na2SO4 2.7 884
NaCl 2.165 801
V2O5 3.357 690
3.3 Exposure Procedure For hot corrosion tests, the salt-sprayed specimens were put in an electric box furnace
with air atmosphere, as shown in Figure 3.3.1, at 900oC for 200, 400, 700, 1000 and 1200
hours and then cooled inside the furnace. Another set of TBC specimens, without any
sprayed-salt, were placed in the furnace for same experimental conditions as the salt-
sprayed samples. The isothermal exposure conditions for different TBC specimens are
presented in Table 3.4.
24
Figure 3.3.1 TBC specimens in a box furnace at 900oC.
Table 3.4: Experimental conditions for isothermal exposure at 900oC.
Sample # Time (hours) Na2SO4 + V2O5
Salt mixture A
Na2SO4 + NaCl
Salt mixture B
No-Salt
(Pure oxidation)
1 200
2 400
3 700
4 1000
5 1100
6 1200
25
3.4 Microstructure Characterization After the high temperature exposure the TBC specimens were analyzed using
characterization techniques such as Scanning Electron Microscopy (SEM) in back-
scattered mode, Energy-dispersive X-ray spectroscopy (EDS) and XRD. The SEM used
was JEOL, Japan equipped with EDS-Oxford Instruments, UK. SEM has maximum
magnification of X300,000 and is equipped with EDS element analysis. X-Ray
Diffractometer was XRD-D8 Advance, manufactured by Bruker, Germany. XRD was
done to study any phase change after isothermal exposure and different phases present as
a result of hot corrosion.
26
CHAPTER 4 EXPERIMENTAL RESULTS
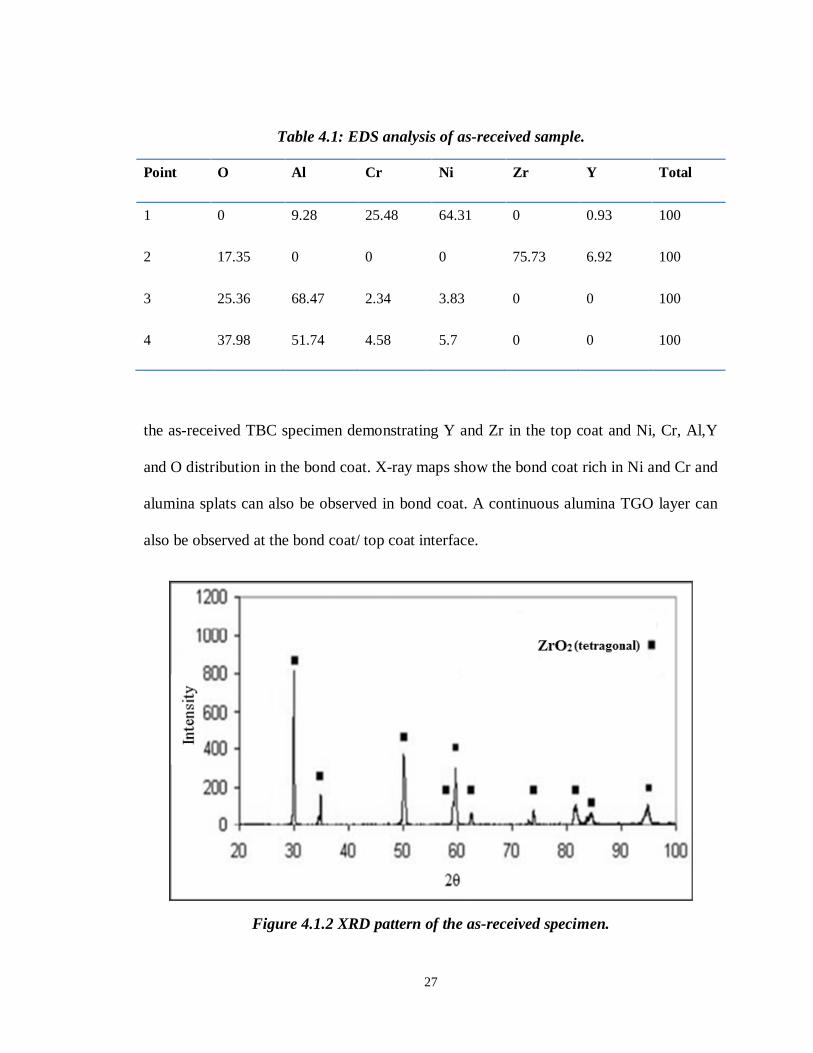
4.1 As-Received TBC Specimen Figure 4.1.1 exhibits the SEM image of as-received TBC specimen and Table 4.1 lists the
EDS analysis performed on this specimen. Figure 4.1.1 shows the typical TBC system
consisting of a yttria stabilized zirconia (YSZ) top coat, NiCrAlY bond coat and a
Nickel-based superalloy IN-718. The bond coat consists of NiCrAlY alloy and Al2O3
splats with compositions shown in Table 4.1.
Figure 4.1.1 SEM micrograph of as-received TBC specimen.
Figure 4.1.2 shows the XRD pattern from the top surface of as-received specimen
showing the peaks of tetragonal zirconia. Figure 4.1.3 demonstrates the X-ray maps of
27
Table 4.1: EDS analysis of as-received sample.
Point O Al Cr Ni Zr Y Total
1 0 9.28 25.48 64.31 0 0.93 100
2 17.35 0 0 0 75.73 6.92 100
3 25.36 68.47 2.34 3.83 0 0 100
4 37.98 51.74 4.58 5.7 0 0 100
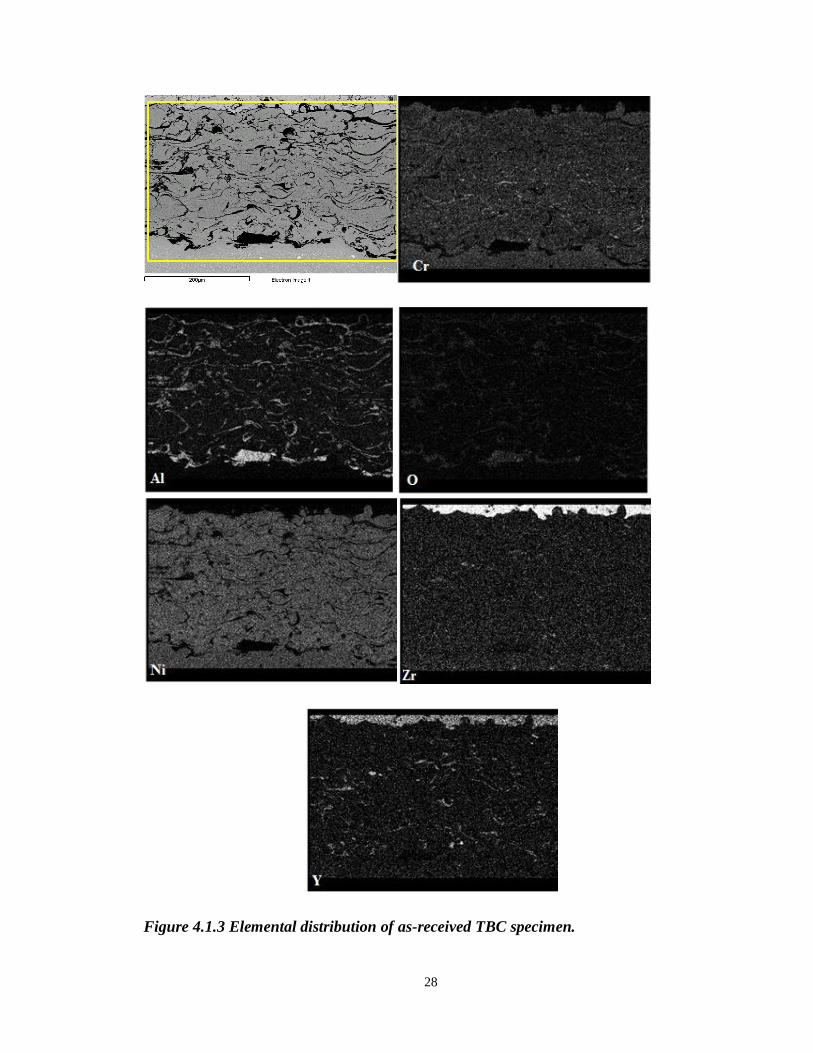
the as-received TBC specimen demonstrating Y and Zr in the top coat and Ni, Cr, Al,Y
and O distribution in the bond coat. X-ray maps show the bond coat rich in Ni and Cr and
alumina splats can also be observed in bond coat. A continuous alumina TGO layer can
also be observed at the bond coat/ top coat interface.
Figure 4.1.2 XRD pattern of the as-received specimen.
28
Figure 4.1.3 Elemental distribution of as-received TBC specimen.
29
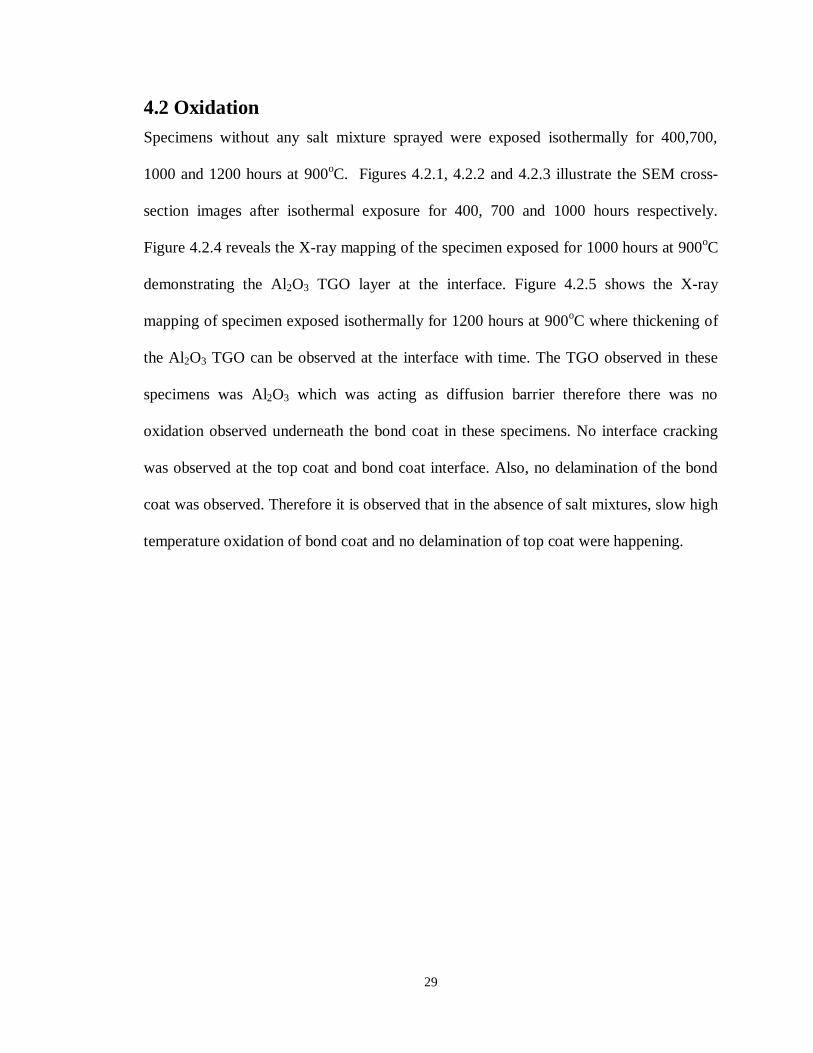
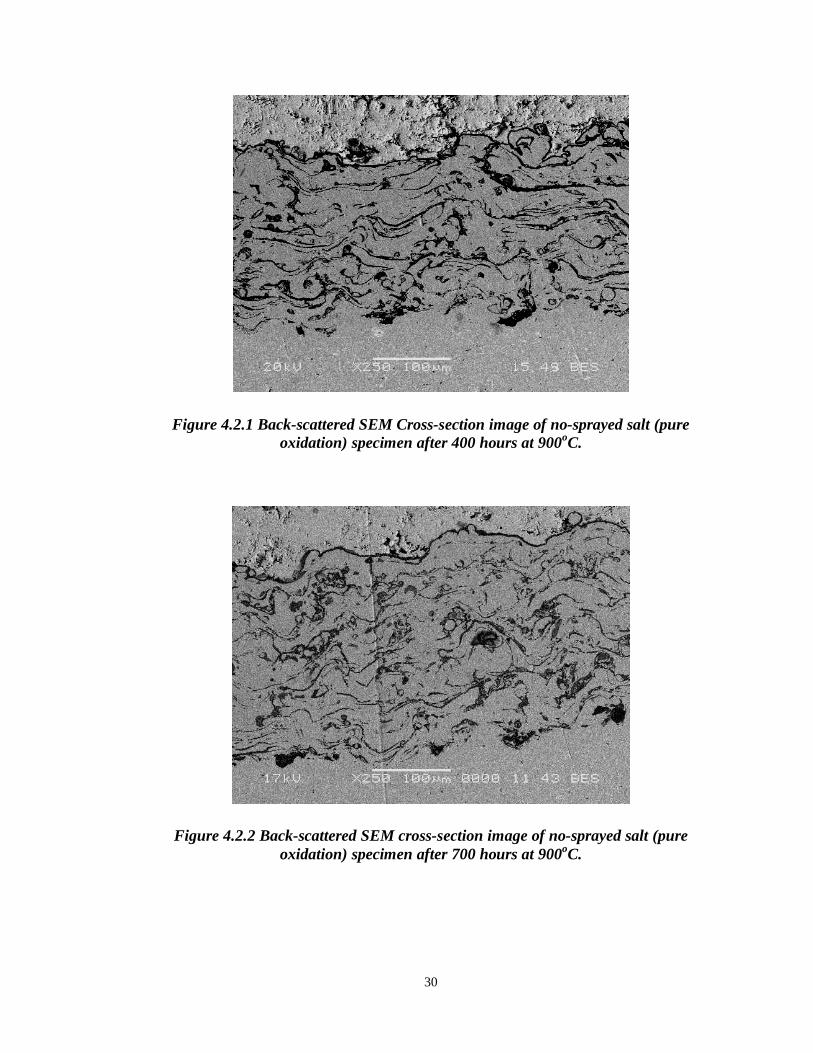
4.2 Oxidation Specimens without any salt mixture sprayed were exposed isothermally for 400,700,
1000 and 1200 hours at 900oC. Figures 4.2.1, 4.2.2 and 4.2.3 illustrate the SEM cross-
section images after isothermal exposure for 400, 700 and 1000 hours respectively.
Figure 4.2.4 reveals the X-ray mapping of the specimen exposed for 1000 hours at 900oC
demonstrating the Al2O3 TGO layer at the interface. Figure 4.2.5 shows the X-ray
mapping of specimen exposed isothermally for 1200 hours at 900oC where thickening of
the Al2O3 TGO can be observed at the interface with time. The TGO observed in these
specimens was Al2O3 which was acting as diffusion barrier therefore there was no
oxidation observed underneath the bond coat in these specimens. No interface cracking
was observed at the top coat and bond coat interface. Also, no delamination of the bond
coat was observed. Therefore it is observed that in the absence of salt mixtures, slow high
temperature oxidation of bond coat and no delamination of top coat were happening.
30
Figure 4.2.1 Back-scattered SEM Cross-section image of no-sprayed salt (pure oxidation) specimen after 400 hours at 900oC.
Figure 4.2.2 Back-scattered SEM cross-section image of no-sprayed salt (pure oxidation) specimen after 700 hours at 900oC.
31
Figure 4.2.3 Back-scattered SEM cross-section image of no-sprayed salt (pure oxidation) specimen after 1000 hours at 900oC.
32
Figure 4.2.4 X-ray mapping of pure oxidation specimen at atmospheric pressure after 1000 hours at 900oC.
33
Figure 4.2.5 X-ray mapping of pure oxidation specimen at atmospheric pressure after 1200 hours at 900oC.
34
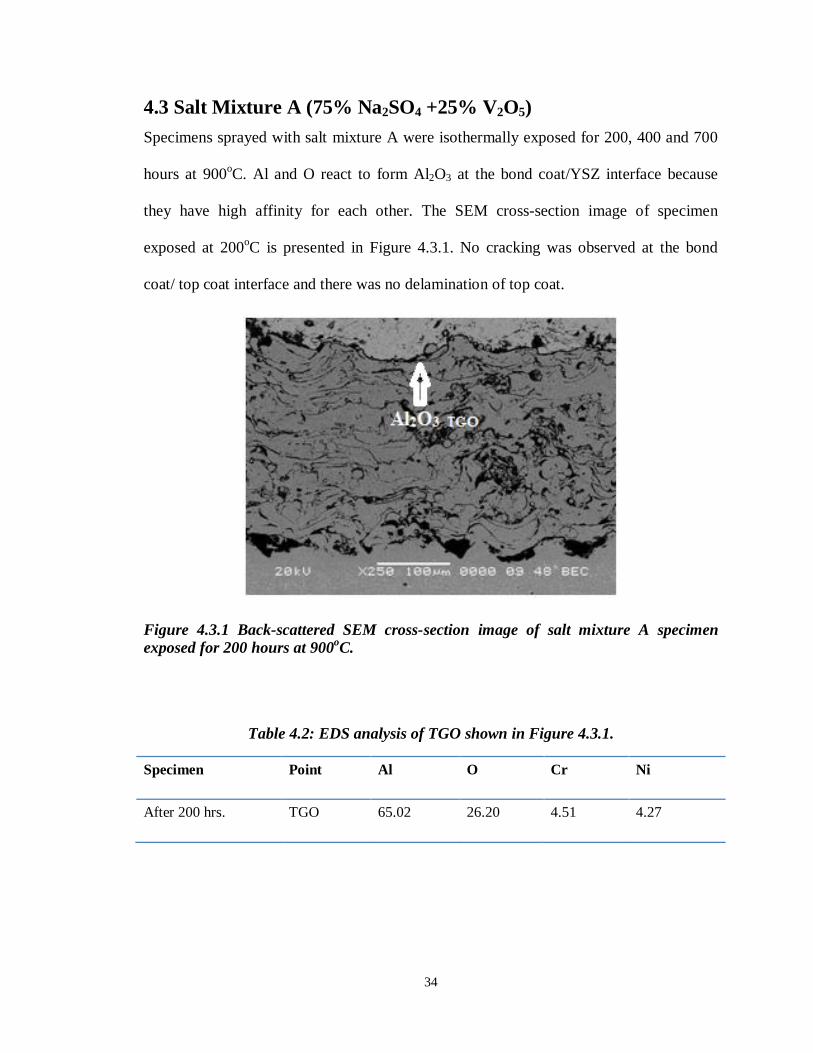
4.3 Salt Mixture A (75% Na2SO4 +25% V2O5)
Specimens sprayed with salt mixture A were isothermally exposed for 200, 400 and 700
hours at 900oC. Al and O react to form Al2O3 at the bond coat/YSZ interface because
they have high affinity for each other. The SEM cross-section image of specimen
exposed at 200oC is presented in Figure 4.3.1. No cracking was observed at the bond
coat/ top coat interface and there was no delamination of top coat.
Figure 4.3.1 Back-scattered SEM cross-section image of salt mixture A specimen exposed for 200 hours at 900oC.
Table 4.2: EDS analysis of TGO shown in Figure 4.3.1.
Specimen Point Al O Cr Ni
After 200 hrs. TGO 65.02 26.20 4.51 4.27
35
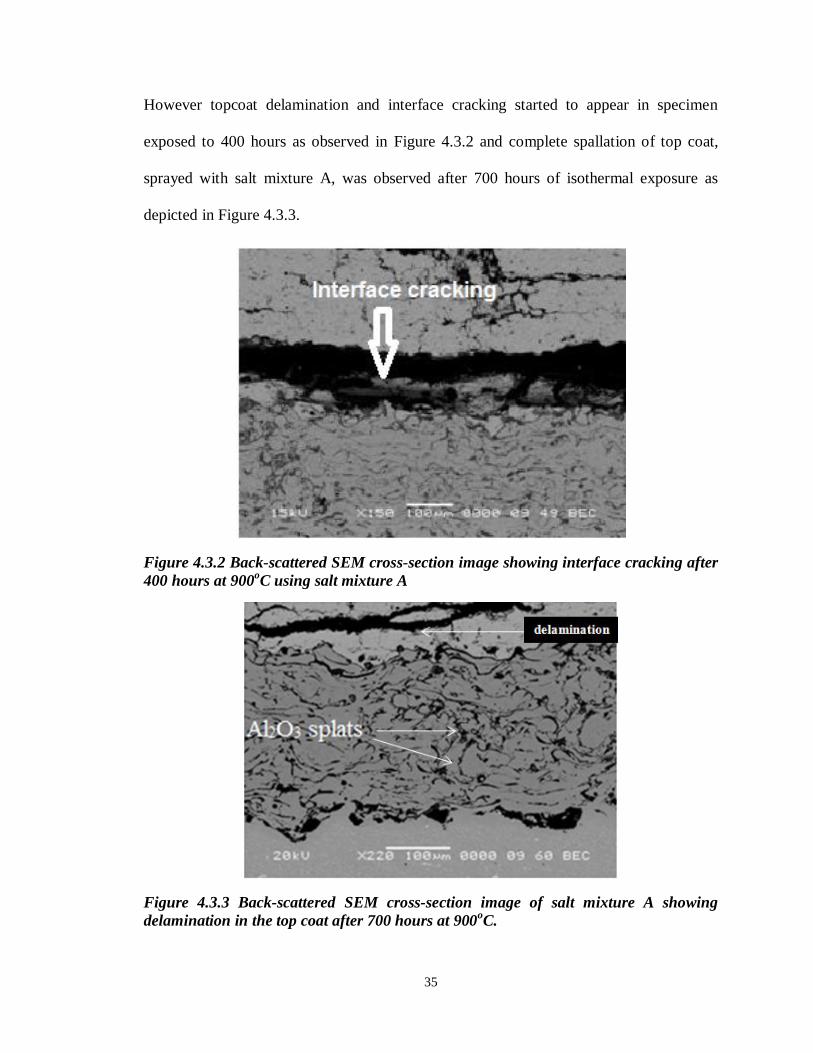
However topcoat delamination and interface cracking started to appear in specimen
exposed to 400 hours as observed in Figure 4.3.2 and complete spallation of top coat,
sprayed with salt mixture A, was observed after 700 hours of isothermal exposure as
depicted in Figure 4.3.3.
Figure 4.3.2 Back-scattered SEM cross-section image showing interface cracking after 400 hours at 900oC using salt mixture A
Figure 4.3.3 Back-scattered SEM cross-section image of salt mixture A showing delamination in the top coat after 700 hours at 900oC.
36
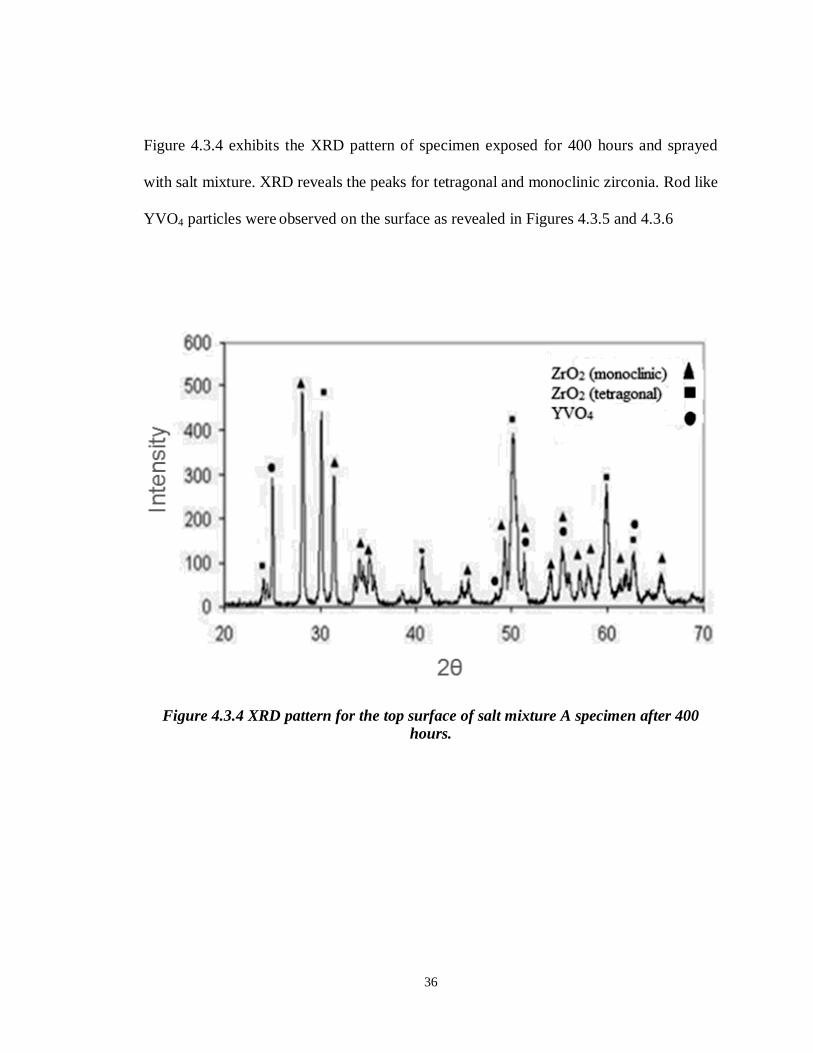
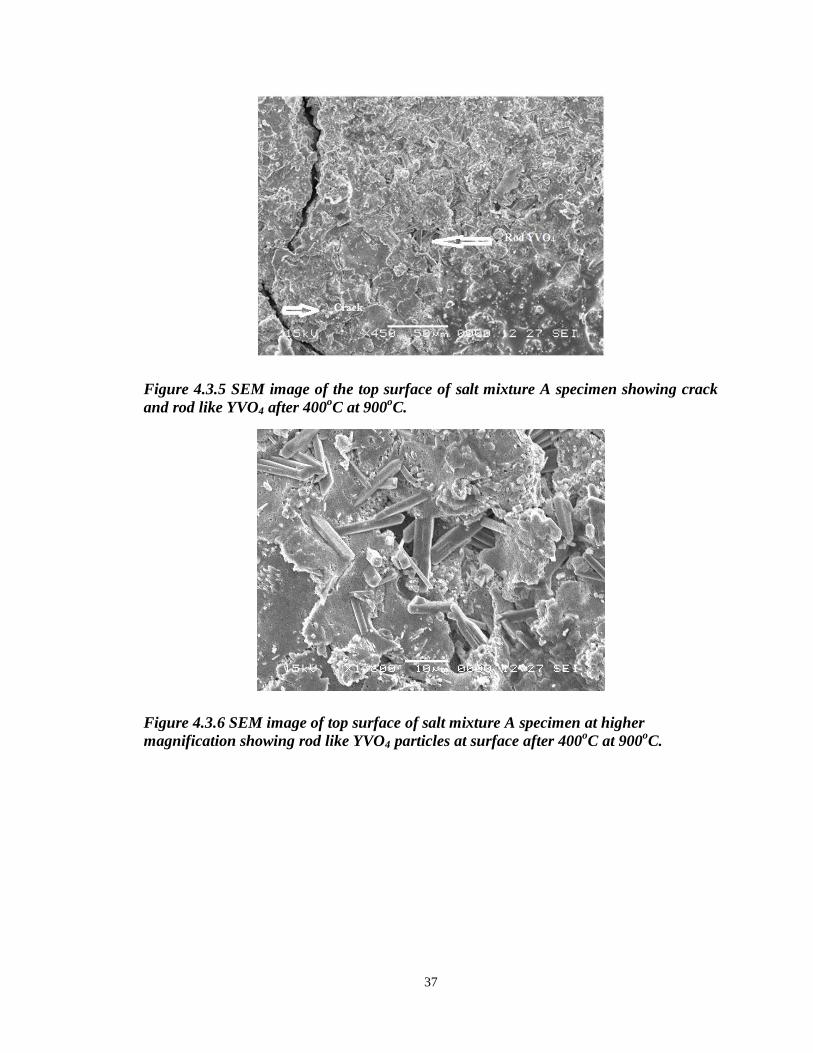
Figure 4.3.4 exhibits the XRD pattern of specimen exposed for 400 hours and sprayed
with salt mixture. XRD reveals the peaks for tetragonal and monoclinic zirconia. Rod like
YVO4 particles were observed on the surface as revealed in Figures 4.3.5 and 4.3.6
Figure 4.3.4 XRD pattern for the top surface of salt mixture A specimen after 400 hours.
37
Figure 4.3.5 SEM image of the top surface of salt mixture A specimen showing crack and rod like YVO4 after 400oC at 900oC.
Figure 4.3.6 SEM image of top surface of salt mixture A specimen at higher magnification showing rod like YVO4 particles at surface after 400oC at 900oC.
38
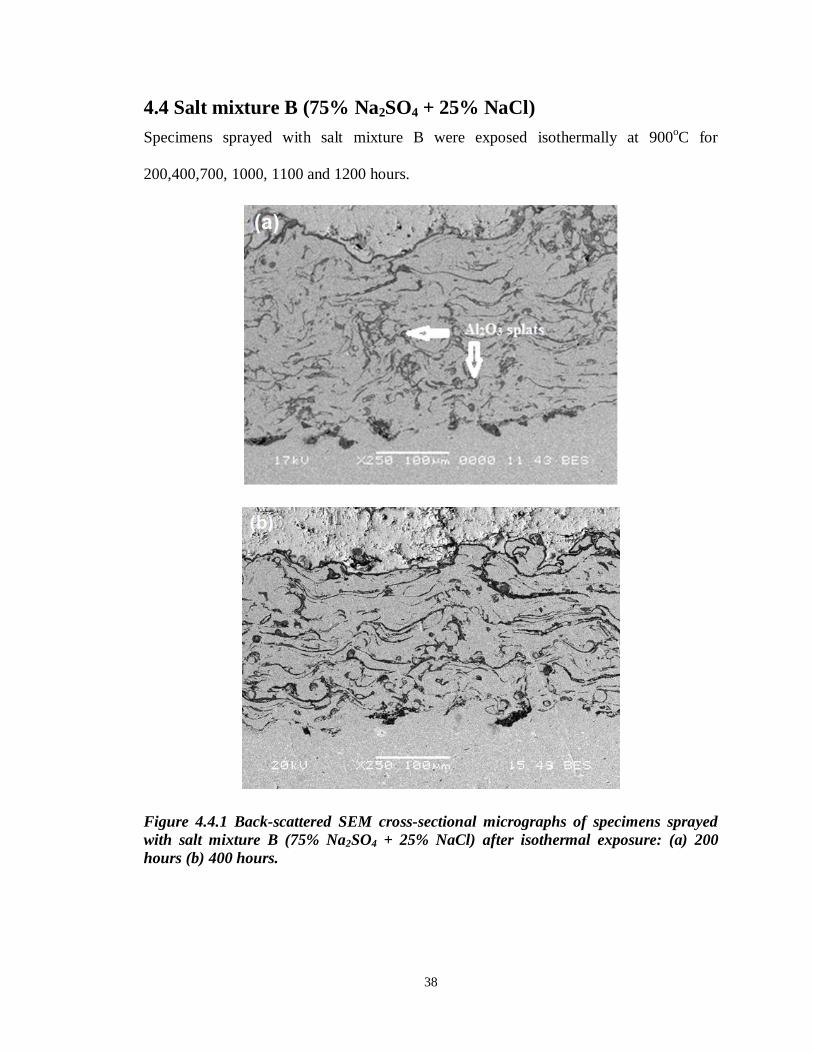
4.4 Salt mixture B (75% Na2SO4 + 25% NaCl) Specimens sprayed with salt mixture B were exposed isothermally at 900oC for
200,400,700, 1000, 1100 and 1200 hours.
Figure 4.4.1 Back-scattered SEM cross-sectional micrographs of specimens sprayed with salt mixture B (75% Na2SO4 + 25% NaCl) after isothermal exposure: (a) 200 hours (b) 400 hours.
39
Figures 4.4.1 (a) and (b) demonstrate the SEM cross-section image of specimens that
were exposed for 200 and 400 hours isothermally. Here TGO is thin layer of Al2O3.
There was no delamination or spallation of the coating observed in these samples.
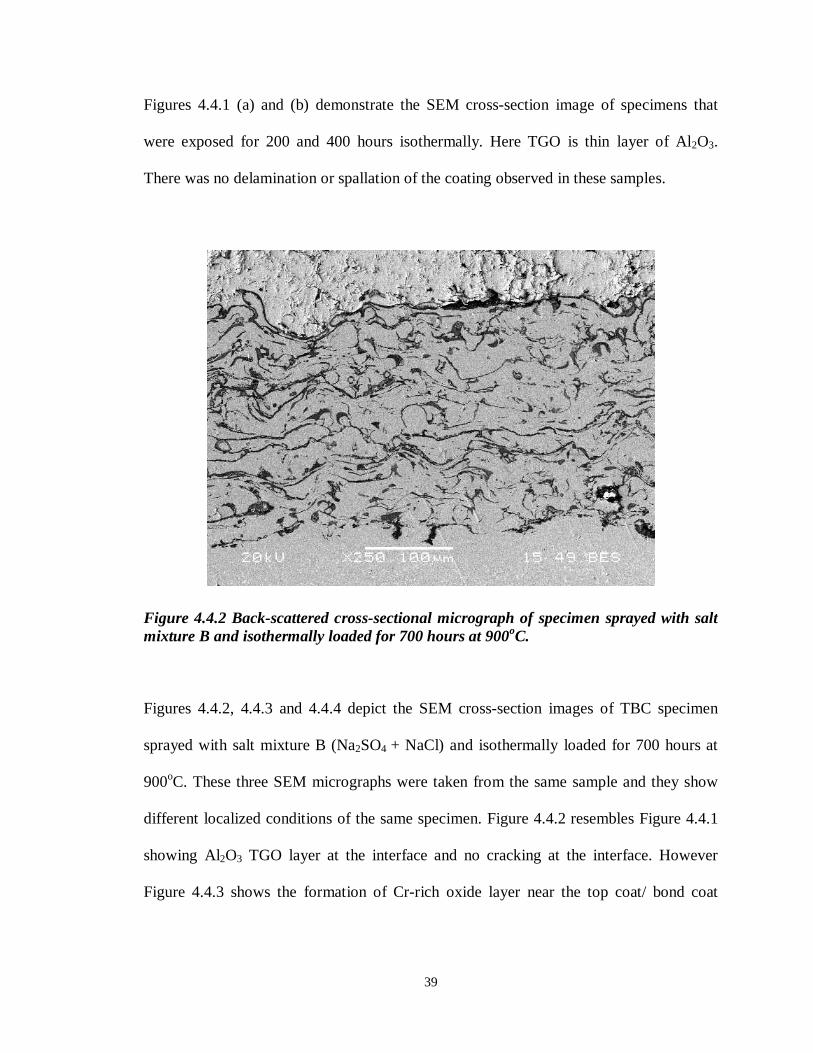
Figure 4.4.2 Back-scattered cross-sectional micrograph of specimen sprayed with salt mixture B and isothermally loaded for 700 hours at 900oC.
Figures 4.4.2, 4.4.3 and 4.4.4 depict the SEM cross-section images of TBC specimen
sprayed with salt mixture B (Na2SO4 + NaCl) and isothermally loaded for 700 hours at
900oC. These three SEM micrographs were taken from the same sample and they show
different localized conditions of the same specimen. Figure 4.4.2 resembles Figure 4.4.1
showing Al2O3 TGO layer at the interface and no cracking at the interface. However
Figure 4.4.3 shows the formation of Cr-rich oxide layer near the top coat/ bond coat

40
interface. EDS analysis performed for this Cr-rich oxide layer is presented in Table 4.3
which shows the high percentage of Cr and O.
Figure 4.4.3 Back-scattered SEM Cross-section image of salt mixture B specimen after 700 hours at 900oC showing initial growth of Cr-rich oxide at the top coat/bond coat interface.
Table 4.3: EDS analysis of point A in Fig 4.4.3
Point O Al Cr Ni Y Zr Total
A 20.02 0 75.28 4.7 0 0 100
Figure 4.4.4 shows the SEM micrograph of specimen isothermally loaded for 700 hours
at 900oC showing the crack at the top coat/ bond coat interface. This specimen
demonstrated the localized growth of Cr-rich oxide and also localized interfacial
cracking.
41
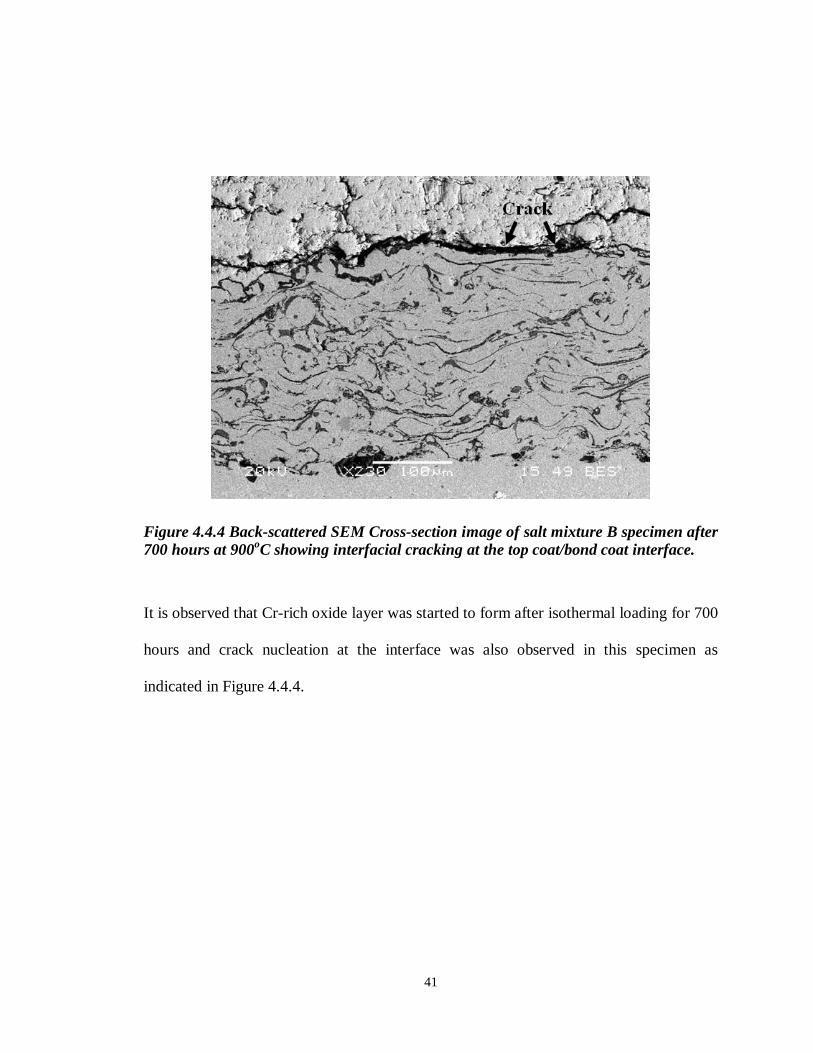
Figure 4.4.4 Back-scattered SEM Cross-section image of salt mixture B specimen after 700 hours at 900oC showing interfacial cracking at the top coat/bond coat interface.
It is observed that Cr-rich oxide layer was started to form after isothermal loading for 700
hours and crack nucleation at the interface was also observed in this specimen as
indicated in Figure 4.4.4.
42
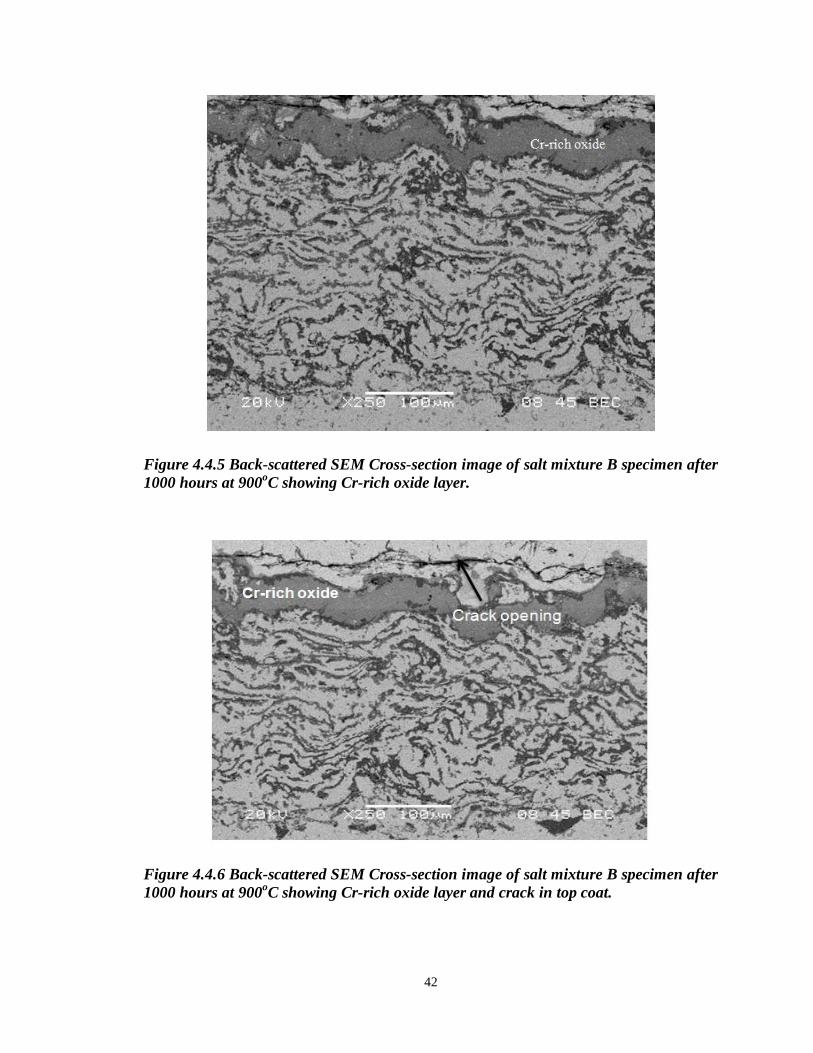
Figure 4.4.5 Back-scattered SEM Cross-section image of salt mixture B specimen after 1000 hours at 900oC showing Cr-rich oxide layer.
Figure 4.4.6 Back-scattered SEM Cross-section image of salt mixture B specimen after 1000 hours at 900oC showing Cr-rich oxide layer and crack in top coat.
43
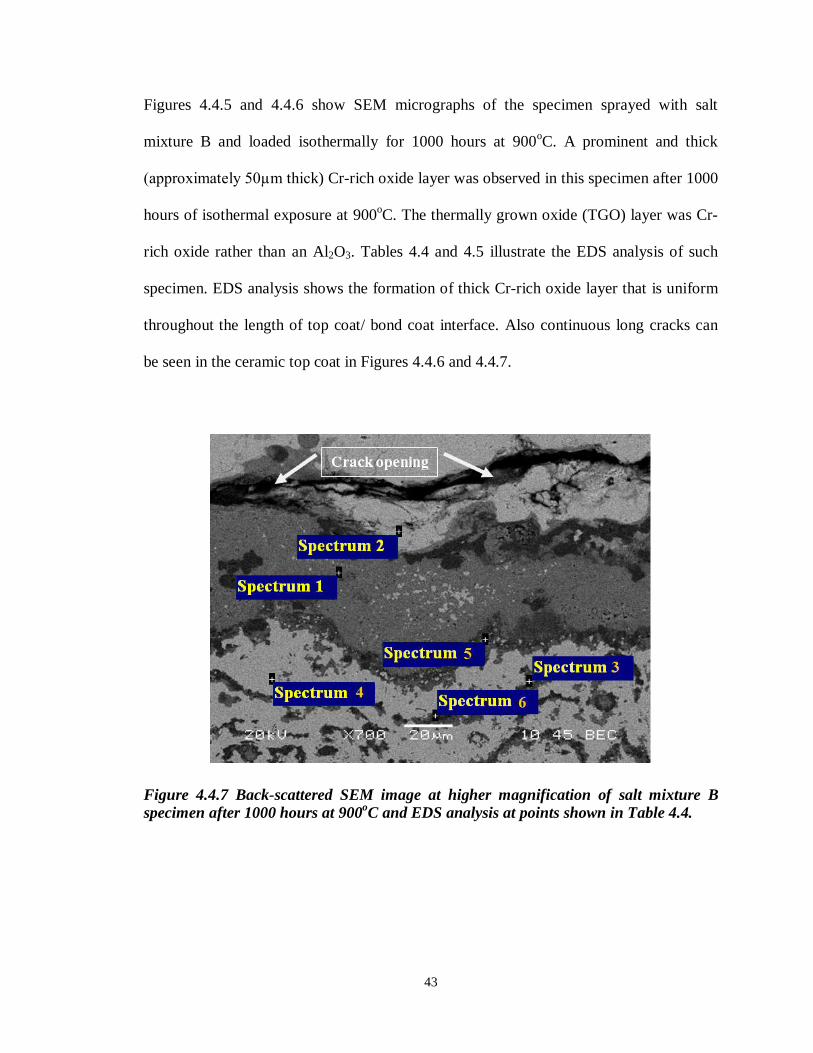
Figures 4.4.5 and 4.4.6 show SEM micrographs of the specimen sprayed with salt
mixture B and loaded isothermally for 1000 hours at 900oC. A prominent and thick
(approximately 50µm thick) Cr-rich oxide layer was observed in this specimen after 1000
hours of isothermal exposure at 900oC. The thermally grown oxide (TGO) layer was Cr-
rich oxide rather than an Al2O3. Tables 4.4 and 4.5 illustrate the EDS analysis of such
specimen. EDS analysis shows the formation of thick Cr-rich oxide layer that is uniform
throughout the length of top coat/ bond coat interface. Also continuous long cracks can
be seen in the ceramic top coat in Figures 4.4.6 and 4.4.7.
Figure 4.4.7 Back-scattered SEM image at higher magnification of salt mixture B specimen after 1000 hours at 900oC and EDS analysis at points shown in Table 4.4.
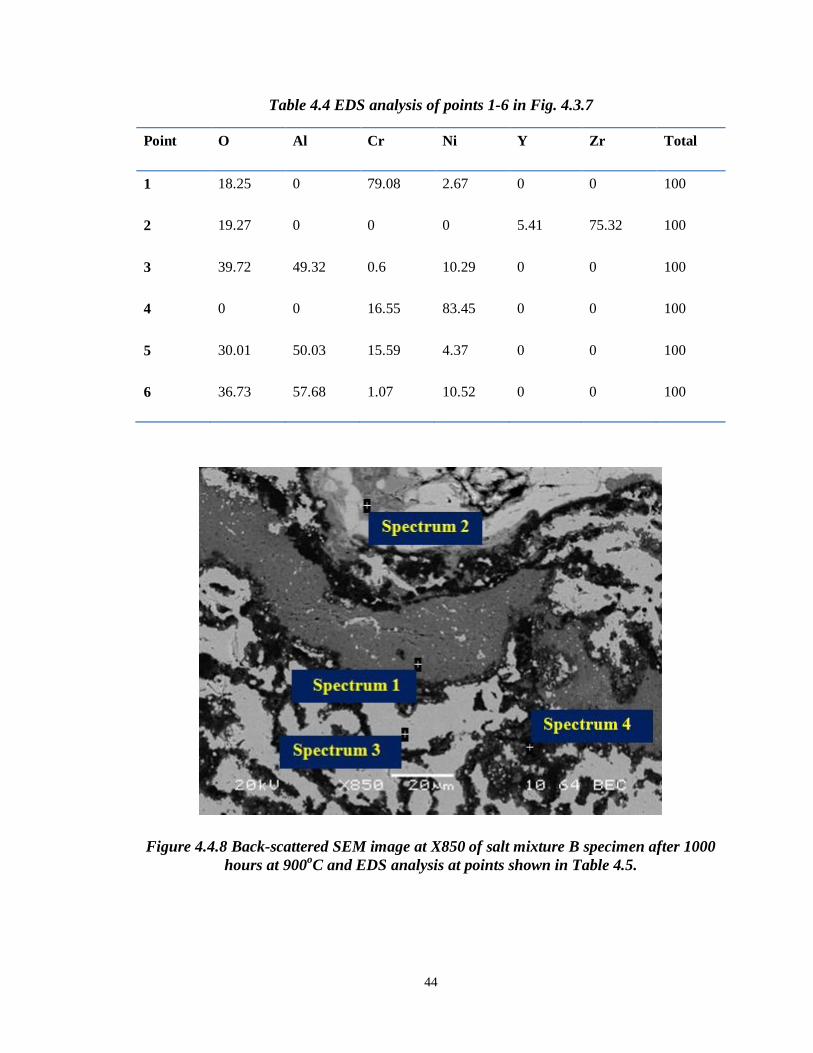
44
Table 4.4 EDS analysis of points 1-6 in Fig. 4.3.7
Point O Al Cr Ni Y Zr Total
1 18.25 0 79.08 2.67 0 0 100
2 19.27 0 0 0 5.41 75.32 100
3 39.72 49.32 0.6 10.29 0 0 100
4 0 0 16.55 83.45 0 0 100
5 30.01 50.03 15.59 4.37 0 0 100
6 36.73 57.68 1.07 10.52 0 0 100
Figure 4.4.8 Back-scattered SEM image at X850 of salt mixture B specimen after 1000 hours at 900oC and EDS analysis at points shown in Table 4.5.
45
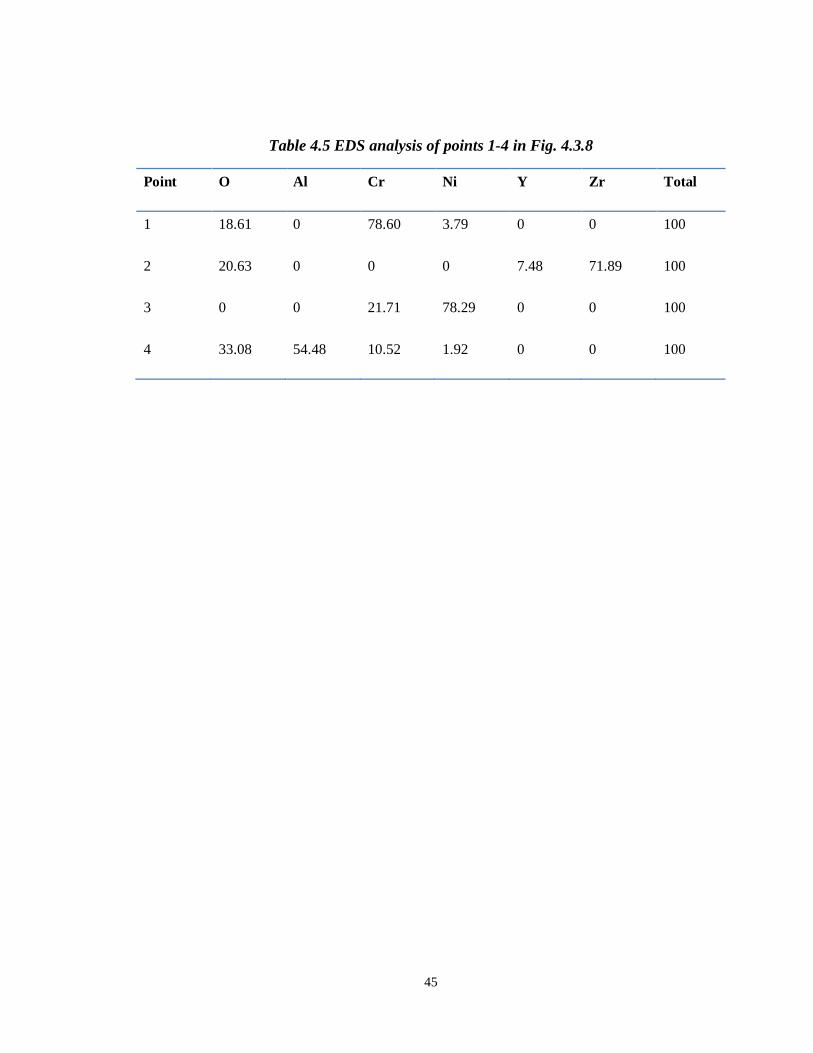
Table 4.5 EDS analysis of points 1-4 in Fig. 4.3.8
Point O Al Cr Ni Y Zr Total
1 18.61 0 78.60 3.79 0 0 100
2 20.63 0 0 0 7.48 71.89 100
3 0 0 21.71 78.29 0 0 100
4 33.08 54.48 10.52 1.92 0 0 100
46
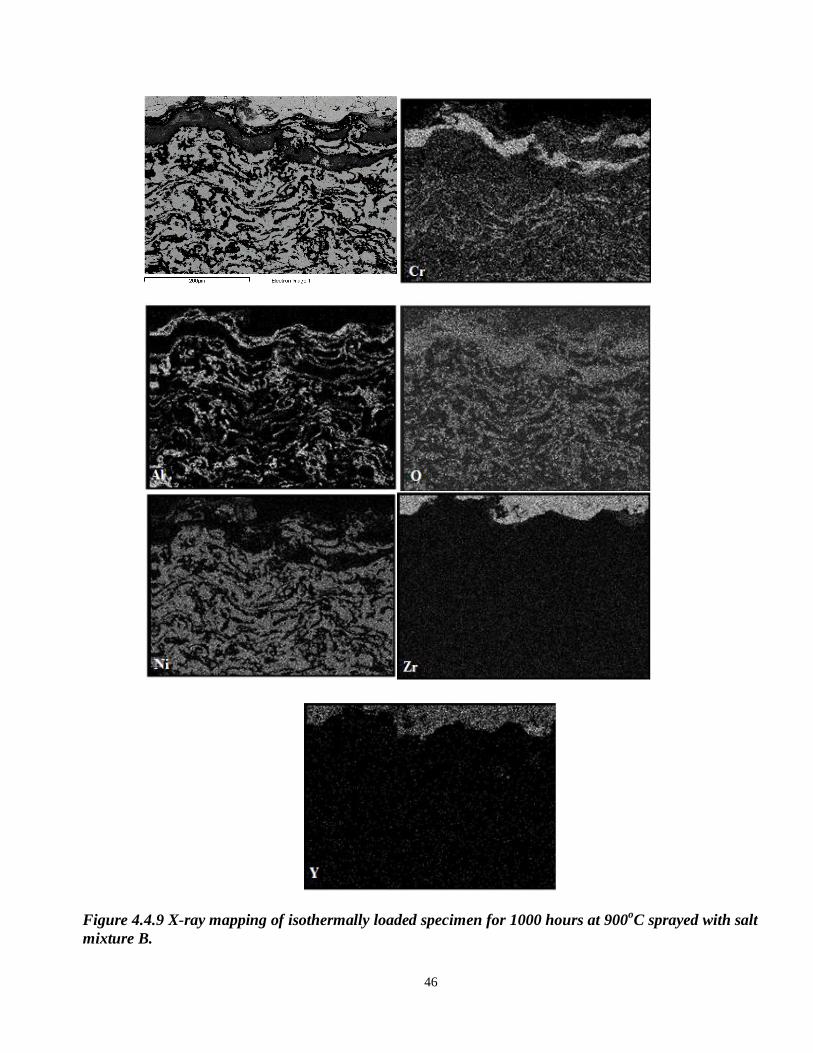
Figure 4.4.9 X-ray mapping of isothermally loaded specimen for 1000 hours at 900oC sprayed with salt mixture B.
47
Figures 4.4.9 and 4.4.10 exhibit the elemental distribution of two different areas across
the top coat/ bond coat interface of the same specimen after 1000 hours exposure. Both
figures show the higher concentration of Cr near the interface as compared to the
concentration of Cr at the bond coat.
Another experiment was carried out with the same experimental parameters to confirm
the formation of Cr-rich oxide layer. Figure 4.4.11 shows the SEM cross-section image of
specimen taken after 1100 hours of isothermal exposure and it shows the formation of Cr-
rich oxide layer at the interface. Figure 4.4.12 presents the X-ray mapping of the
specimen exposed for 1100 hours, showing the Cr-rich oxide formed at the interface.
Figures 4.4.13 (a) and (b) demonstrate the SEM cross-section images after 1200 hours of
exposure at 900oC showing cracking at the interface and delamination of the top coat.
Figure 4.4.14 shows the X-ray mapping of the still intact localized-area of the specimen
exposed for 1200 hours, showing the Cr-rich oxide formed at the interface. This
specimen is considered as a total failure as the ceramic top coat is spalled off and the top
coat can no more be utilized for its intended use as a thermal barrier. The majority of the
interface length has developed cracks because of the formation of thick Cr-rich oxide
layer.
48
Figure 4.4.10 Elemental distribution of isothermally loaded mixture B coated specimen for 1000 hours at 900oC.
49
Figure 4.4.11 Back-scattered SEM Cross-section image of specimen after 1100 hours at 900oC showing Cr-rich oxide layer.
50
Figure 4.4.12 Elemental distribution of isothermally loaded mixture B coated specimen for 1100 hours at 900oC.
51
Figure 4.4.13 Back-scattered SEM Cross-section images (a) and (b) of specimen after 1200 hours at 900oC.
52
Figure 4.4.14 Elemental distribution of isothermally loaded mixture B coated specimen for 1200 hours at 900oC.
53
CHAPTER 5 DISCUSSION 5.1 Degradation in Purely Oxidizing Environment TBC specimens were exposed isothermally up to 1200 hours at 900oC to study the effect
of oxidation without presence of impurity salts. The TBC specimens showed a
progressive thickening of protective Al2O3 TGO layer with increase of exposure time
from 400 hours to 1200 hours as can be seen in Figures 4.2.1-4.2.3 and 4.2.5. Figure
4.2.5 shows the X-ray mapping of specimen exposed for 1200 hours indicating a thick
alumina TGO at the interface developed due to growth of Al2O3 layer at the interface.
The thick Al2O3 layer was protecting the oxidation of underneath bond coat elements. No
delamination or spallation of top coat was observed in these specimens indicating the
effective protection provided by Al2O3. Figure 5.1.1 reveals the image of TBC specimen
that was exposed to 1000 hours and no damage or spallation of top coat is observed.
Figure 5.1.1 Image of TBC specimen after exposure for 1200 hours at 900oC showing ceramic top coat intact with the substrate.

54
Also, slow thickening of alumina splats is observed with isothermal exposure time due to
oxidation. The critical TGO thickness before mechanical failure in TBCs with typical
MCrAlY bond coat has been reported in the literature to be 6–9 µm [51, 52]. In the
present study the TGO thickness after isothermal exposure for 1200 hours is
approximately 4-6 µm and no interface damage was observed until 1200 hours. This
suggests that, under pure oxidation environment, TBC can sustain beyond 1200 hours of
exposure without TGO developing cracks at the interface and failing due to mechanical
damage.

55
5.2 Degradation in Salt Mixture A (Na2SO4 + V2O5) Figure 4.1.2 shows the XRD pattern of the as received specimen showing only the peaks
for tetragonal zirconia in the top coat. This XRD pattern shows only tetragonal zirconia
with no evidence of monoclinic phase or YVO4.
Figure 4.3.4 shows the XRD pattern in which it is evident that tranformation of tetragonal
zirconia to monoclinic phase took place in the specimen that was isothermally loaded for
400 hours in salt A. This transformation is accompanied by 3–5% volume expansion,
leading to interface cracking as shown in Figure 4.3.2 and delamination of top coat as
shown in Figure 4.3.3. This phase transformation started after 400 hours and resulted in
complete failure after 700 hours at 900oC. Rod like YVO4 particles were formed on the
surface as shown in Figure 4.3.5 and 4.3.6. These particles grew outward of surface and
resulted in further development of stresses in the coating which caused formation of
cracks in YSZ top coat [53].
V2O5 and Na2SO4 react to form NaVO3 at the surface of top coat. NaVO3 acts as a
leaching agent for yttria, the stabilizer of zirconia, which results in the transformation of
tetragonal zirconia to monoclinic phase. The phase diagram of stabilized YSZ is shown in
Figure 2.2.3.
The mechanism can be explained by the following reactions [25, 26];
V2O5 +Na2SO4 → 2NaVO3 + SO3 (5.2.1)
ZrO2 (Y2O3) (tetragonal) + 2NaVO3 → ZrO2 (monoclinic) + 2YVO4 +Na2O (5.2.2)
56
5.3 Degradation in Salt Mixture B (Na2SO4 + NaCl) The free energy change of a reaction in terms of the partial pressure of the oxygen gas is
written as [54]:
ΔG = ΔGo - RT ln PO2 (5.3.1)
The partial pressure of oxygen in the present study is the atmospheric partial pressure for
oxygen (PO2 = 0.02 MPa). Figure 5.3.1 illustrates variation in free energies of oxide
formation with respect to temperatures at PO2= 0.02 MPa. The diagram reveals that at
900oC (1173.15 K), Al2O3 has most negative free energy of formation i.e. it is most
favorable to form, followed by Cr2O3. The ΔGo values for Al2O3 and Cr2O3 at different
temperatures are obtained from NIST-JANAF Thermochemical Tables.
Ideally it is desirable that a continuous alumina layer is formed in the TGO which acts as
an oxygen diffusion barrier to suppress the formation of other detrimental oxides during
high temperature exposure for longer times. This protects the underneath substrate from
oxidation and improve the durability of the TBC system.
57
Figure 5.3.1 ΔG Vs T(K) plot for the three different oxide reactions
Figure 4.3.3 shows the initiation of formation of Cr-rich oxide layer at the top coat and
bond coat interface after 700 hours of isothermal exposure and thickness of this Cr- rich
oxide layer increased after 1000 hours of isothermal exposure as shown in Figures 4.3.5
and 4.3.6. The initiation of this Cr-rich oxide layer is attributed to the role of Na2SO4 and
NaCl in damaging the stable Al2O3 TGO as explained using equations 5.3.2-5.3.4 later in
this section. The growth of this Cr-rich oxide layer was also observed when experiment
was repeated for 1100 hours of isothermal exposure. The growth of Cr-rich oxide layer at
the interface caused cracking at the interface and in the top coat. In light of
aforementioned results in Chapter 4 section 4.3, it is suggested that TBC specimens have
experienced accelerated oxidation when their surfaces were covered with thin film of
saturated salt mixture B (75% Na2SO4 + 25% NaCl) and exposed at elevated temperature
at 900oC.
58
The YSZ top coat condition after 1000 hours of isothermal can be observed in Figure
5.3.2 depicting the spallatation of top coat from some areas exposing the bare bond coat
to high temperature. Another set of specimens with two different salt compositions
namely, 75% Na2SO4 and 25 % NaCl, was also exposed at 900oC for 1000 hours to
investigate the effect of these impurity salts on top coat when sprayed separately rather
than in the form of a mixture i.e. 75% Na2SO4 + 25% NaCl. The characterization results
revealed that there was no spallation or delamination of topcoat when salts were sprayed
separately on TBC specimens as can be observed in Figures 5.3.2-5.3.6.
X-ray mapping of 25% NaCl sprayed specimen is illustrated in Figure 5.3.7 showing
absence of Cr-rich oxide TGO at the interface and Figure 5.3.8 depicts the same
conclusion for TBC specimen sprayed with 75% Na2SO4. Therefore it is concluded that a
Cr-rich oxide layer at interface forms only when TBC specimens are sprayed with a
mixture of 75% Na2SO4 + 20% NaCl.
The molten salt mixture B contains Na2SO4 which melts at 884oC but when NaCl is
added its melting point is lowered. It is dissociated by the following reaction [55]:
Na2SO4 (l) Na2O (l) +SO3 (g) (5.3.2)
Na2O penetrates through the pores of ceramic top coat to reach the top coat/ bond coat
interface. Na2O reacts with Al2O3 TGO resulting in the following basic fluxing reaction:
Al2O3 + Na2O+O2 2NaAlO2 (5.3.3)
Also, in the molten salt mixture of Na2SO4 and NaCl, it is possible that Al2O3 TGO reacts
with NaCl by the following reaction [56-58]
59
2NaCl + Al2O3 + ½ O = 2NaAlO2 + Cl2 (5.3.4)
Sodium aluminate (NaAlO2) is metastable phase allowing oxygen to diffuse in and react
with Cr to form a Cr-rich oxide at the interface. It is suspected that the presence of NaCl
in salt mixture accelerates the formation of NaAlO2, basic fluxing and thus Cr-rich oxide
formation as no Cr-rich oxide was observed when Na2SO4 solution was used without
NaCl. The formation of Cr-rich oxide layer is also attributed to the aluminum depletion in
the bond coat. The amount of aluminum level in the bond coat is dropped below the level
at which protective alumina TGO can form and therefore protective alumina scale is not
formed preferentially. This leads to a faster interaction between the corrosive species
present on the surface of TBC and the non-protective oxides of other elements of the
bond coat. Fig.4.1.1 shows the SEM image of the as-received TBC specimen and Table
4.1 shows the EDS analysis of this specimen. Figures 4.4.7, 4.4.8 and Tables 4.4 and 4.5
show the SEM images and EDS analysis of the specimen showing Cr-rich oxide layer
after 1000 hours of isothermal exposure at 900oC. It is evident from the EDS comparison
of as-received specimen (Figure 4.1.1) with the specimen showing Cr-rich rich oxide
layer (Figures 4.4.7 and 4.4.8) that the amount of aluminum in bond coat has decreased
when exposed for extended time at the higher temperature. More and more aluminum is
being consumed in the thickening of alumina splats in the bond coat.
However, Figure 4.2.5 (elemental distribution of pure-oxidation specimen exposed
isothermally for 1200 hours at 900oC.) shows the higher concentration of Cr and Ni in the
bond coat similar to the as-received condition shown in Figure 4.1.3 in contrast to Cr-rich
oxide near the interface.
60
Figure 5.3.2 Image of TBC specimen sprayed with salt mixture B and exposed for 1000 hours at 900oC showing spalling of ceramic top.
Figure 5.3.3 Top view of four different TBC specimens exposed isothermally for 1000 hours at 900oC.
61
Figure 5.3.4 TBC specimen sprayed with 75% Na2SO4 and exposed isothermally for 1000 hours at 900oC.
62
Figure 5.3.5 TBC specimen sprayed with 25% NaCl and exposed isothermally for 1000 hours at 900oC.
Figure 5.3.6 Pure oxidation TBC specimen exposed isothermally for 1000 hours at 900oC.
63
Figure 5.3.7 X-ray mapping of TBC specimen sprayed with 25% NaCl and exposed for 1000 hours at 900oC
64
Figure 5.3.8 X-ray mapping of TBC specimen sprayed with 75% Na2SO4 and exposed for 1000 hours at 900oC
65
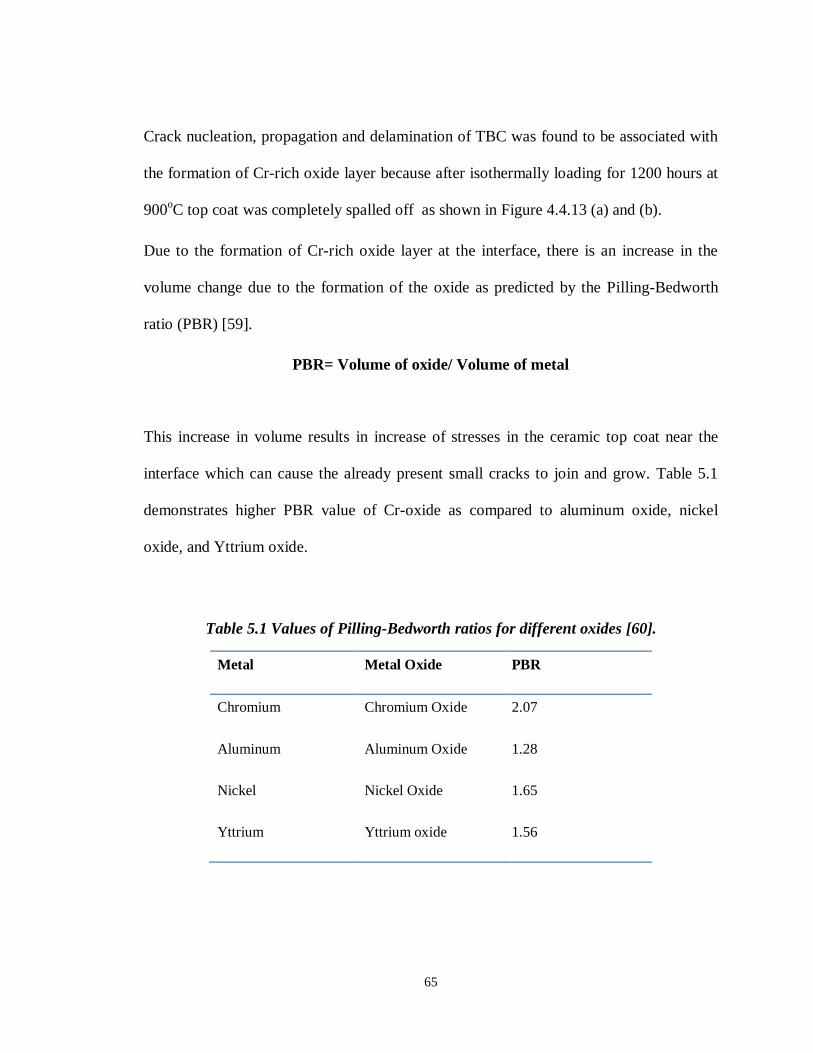
Crack nucleation, propagation and delamination of TBC was found to be associated with
the formation of Cr-rich oxide layer because after isothermally loading for 1200 hours at
900oC top coat was completely spalled off as shown in Figure 4.4.13 (a) and (b).
Due to the formation of Cr-rich oxide layer at the interface, there is an increase in the
volume change due to the formation of the oxide as predicted by the Pilling-Bedworth
ratio (PBR) [59].
PBR= Volume of oxide/ Volume of metal
This increase in volume results in increase of stresses in the ceramic top coat near the
interface which can cause the already present small cracks to join and grow. Table 5.1
demonstrates higher PBR value of Cr-oxide as compared to aluminum oxide, nickel
oxide, and Yttrium oxide.
Table 5.1 Values of Pilling-Bedworth ratios for different oxides [60].
Metal Metal Oxide PBR
Chromium Chromium Oxide 2.07
Aluminum Aluminum Oxide 1.28
Nickel Nickel Oxide 1.65
Yttrium Yttrium oxide 1.56
66
Moreover, the fracture mechanisms observed in APS and EB-PVD systems have in
common that the delamination is predominantly located in an essentially brittle
ceramic material or along the interfaces between brittle ceramics. The fracture of
ceramic materials is conveniently described in terms of fracture energy or fracture
toughness.
Thus inherent micro cracks present in the top coat, under the influence of Cr-rich oxide
layer formation after extended isothermal exposure, coalesce and result in the spallation
of ceramic top coat layer. Once the protective ceramic top coat layer is removed the TBC
coated superalloy is no longer suitable for higher temperature insulation.
67
CHAPTER 6 CONCLUSIONS The conclusions of this study are summarized below:
1. No damage to the bond coat or top coat was observed in specimens exposed to air
for 1200 hours of isothermal exposure at 900oC. However, slow thickening of
Al2O3 TGO layer was observed in these specimens.
2. Transformation of tetragonal zirconia to monoclinic phase was observed after 400
hours of exposure in specimens sprayed with salt mixture A (Na2SO4 + V2O5) and
this transformation resulted in spallation of top coat after 700 hours at 900oC.
3. No detectable damage in the bond coat was observed in salt mixture A specimens
for up to 700 hours of exposure at 900oC and thermally grown oxide (TGO) layer
at the interface was Al2O3 until failure.
4. TBC specimens sprayed with salt mixture B (Na2SO4 + NaCl) completely failed
due to spallation of top coat after 1000 hours of isothermal loading at 900oC.
5. Cr-rich oxide layer started to form near the top/bond coat interface in specimens
sprayed with salt mixture B after 700 hours of exposure at 900oC. The oxide layer
grew in thickness with longer exposure time and resulted in delamination of top
coat after 1000 hours of exposure.
6. The formation of Cr-rich oxide was attributed to fluxing of the protective TGO
(Al2O3) and depletion of free Al near the top/bond coat interface.
7. No Cr-rich oxide layer was observed in specimens sprayed with 75% Na2SO4 or
in specimens sprayed with 25% NaCl and isothermally exposed to 900C for up
to 1000 hours.
68
REFERENCES
1. Strangman, T.E. Development and Performance of Physical Vapour Deposition
Thermal Barrier Coatings Systems. Paper presented at the 1987 Workshop on
Coatings for Advanced Heat Engines, Castine, Maine 1987.
2. Tolpygo, V.K., D.R. Clarke, K.S. Murphy. Surface and Coatings Technology,
2001. 146-147: p. 124-131.
3. V.K. Tolpygo. Surface and Coatings Technology, 1999. 120-121: p. 53-60.
4. Padture, Nitin P.; Gell, Maurice; Jordan, Eric H. Science, 2002. 296: p.280.
5. A. Maricocchi, A. Barz, and D. Wortman, PVD TBC Experience on GE Aircraft
Engines, Thermal Barrier Coating Workshop, NASA Lewis Research Center,
Cleveland, OH, March 27-29, NASA Conference Publication, 1995. 3312: p 79-
90.
6. Yasuda, K., K. Suenaga, K. Wada. Journal of Materials science, 2000. 35(2): p.
317.
7. Unal, O., T.E. Mitchell, A.H. Heuer. Journal of American Ceramic Society,
1994. 77(4): p. 984.
8. Majerus, P., New_methods for_analysis_of deformation and_damage_to behavior
of_MCrAlY coatings in thermal_barrier_coating system._RWTH-Aachen._IEF-
2.2003: p. 157.
9. Golightly, F.A., F.H. Stott, and G.C. Wood. Oxid. Met., 1957. 10: p. 163.
10. Meschke F, Raddatz O, Kolleck A. Journal of American Ceramic Society, 2000.
83(2): p. 353-361.
11. Scott, H.G. J. Mat. Sci., 1975. 10: p. 1527-1535.
69
12. Bratton, R.J. and S.K. Lau, ZrO2 Thermal Barrier coatings. Advances in
Ceramics, The American Ceramic Society, Columbus, OH, 1981. 3: p. 226-240.
13. Yasuda, K., K. Suenaga, K. Wada. Journal of Materials science, 2000. 35(2): p.
317.
14. Unal, O., T.E. Mitchell, and A.H. Heuer. Journal of American Ceramic Society,
1994. 77(4): p. 984.
15. Padture, N.P. Science, 2002. 296: p. 280-284.
16. Gell, M, K.Vaidyanathan, K. McCarron, B. Barber, Y.H. Sohn, V.K. Tolpygo.
Surface and Coatings Technology, 1999. 120-121: p. 53-60.
17. Wada, K., N. Yamaguchi, H. Matsubara. Surface and Coatings Technology, 2005.
191: p. 367.
18. Schulz, U., K. Fritscher, C. Leyens. Journal of Engineering for Gas Turbines and
Power, 2002. 124.
19. Schlichting, K.W., N. P. Padture, E. H. Jordan, M. Gell. Materials Science and
Engineering A, 2003. 342: p. 120-130.
20. Smialek, J.L., R. Browning. Proc. Electrochem. Soc., 1986. 86: p. 258.
21. F.S Petit and G.W. Goward. Coatings for High Temperature Processes, E. Lang,
Ed., Applied Science Publishers, 1985.
22. Albert Feuerstein, James Knapp, Thomas Taylor, Adil Ashary, Ann Bolcavage,
Neil Hitchman. Journal of Thermal Spray Technology, 2008. 17(2).
23. R. Bouchet, R. Mevrel. Defect Diffusion Forum, 2005, 237-240: p 238-245.
24. Golightly, F.A., F.H. Stott, G.C. Wood. Oxid. Met., 1957. 10: p. 163.
25. Prescott, R. and M.J. Graham. Oxid. Met., 1992. 38: p. 233.
70
26. Brandl, W. Surface and Coatings Technology, 1996. 86-87: p. 41-47.
27. Golightly, F.A., F.H. Stott, G.C. Wood. Oxid. Met., 1957. 10: p. 163.
28. Pfeiffer, H., Werkst. Korros., 1957. 8: p. 575.
29. Smialek, J.L. and R. Browning. Proc. Electrochem. Soc., 1986. 86: p. 258.
30. Mennicke, C., M.-Y. He, D.R. Clarke, J.S. Smith. Acta Mater., 2000. 48: p. 2941.
31. Prescott, R. M.J. Graham. Oxid. Met., 1992. 38: p. 233.
32. Tolpygo, V.K., J.R. Dryden, D.R. Clarke. Acta Mater., 2000. 48: p. 3283.
33. Christensen, R.J., D.M. Lipkin, D.R. Clarke. Appl. Phys. Lett., 1996: p. 3754.
34. Busso, E.P., McClintock, F.A. Acta materialia, 2001. 49: p. 1515-1528.
35. Brindley, W.J, J.D. Materials Science and Engineering A, 1993. 163: p. 33-41.
36. Balmain, J., M.K. Loudjani, A.M. Huntz. Materials Science and Engineering A,
1997. 224: p. 87.
37. Monceau, D., E. Busso, G. Cailletaud. MECAMAT, Mechanics and Multiphysics
Processes in Solids, 1998.
38. Garriga-Majo., B.A. Shollock, D.S. McPhail, R.J. Chater. J. Inorg. Mater., 1999.
1: p. 325.
39. A.G.Evans, J.S. Wang, D.Mum. Mechanism-Based Life Prediction Issues for
Thermal Barrier Coatings. TBC Workshop, Cincinnati, Ohio, 1997.
40. B. Pint., I. Wright, W. Lee, Y. Zhang, Substrate and Bond Coat compositions:
Factors affecting Alumina Scale Adhesion. TBC Workshop, Cincinnati, Ohio,
1997.
41. A.G. Evans, D.R. Mumm, J.W. Hutchinson, G.H. Meier, F.S. Pettit. Prog. Mater.
Sci., 2001.46: p.505.

71
42. C.Batista, A. Portinha, R.M. Ribeiro,V. Teixeira, C.R. Oliveira. Surf. Coat.
Technol., 2006.200: p. 6783.
43. H.C. Chen, Z.Y. Liu, Y.C. Chuang. Thin Solid Films, 1992.223: p. 56.
44. S.Y. Park, J.H. Kim, M.C. kim, H.S. Song, C.G. Park. Surf. Coat. Technol.,
2005.190: p. 357.
45. A. Afrasiabi. Materials Science and Engineering A, 2008.478: p 264–269.
46. S. Alperine, M. Derrien, Y. Jaslier, and R. Mevrel, Thermal Barrier Coatings-The
Thermal Conductivity Challenge, AGARD Report 823 ‘‘Thermal Barrier
Coatings,’’ 15-16 October 1997: p. 1.1-1.10.
47. A. Feuerstein, A. Bolcavage, Thermal Conductivity of Plasma and EBPVD
Thermal Barrier Coatings, Proceedings ASM International Surface Engineering
Congress 2004, Orlando, Florida.
48. N.S. Bornstein. JOM 48, 1996. 37-39.
49. E. P. Busso, F. A. McClintock, Thermal fatigue degradation of an overlay
coating. Mat. Sci. Eng., 1992. A161: p. 165-179.
50. Helble, J.J., Mojtahed W, Lyyriinen J, Jokiniemi J, Kauppinen E. Fuel, 1996.
75(8): p. 931–939.
51. V.K. Tolpygo. Surface and Coatings Technology, 2001.146-147: p. 124–131.
52. T. Tomimatsu., S. Zhu, Y. Kagawa. Acta Materialia, 2003.51: p. 2397–2405.
53. Zhang, X.C. Applied Surface Science, 2008. 254: p. 1881–1889.
54. A.S. Khanna, High Temperature Oxidation and Corrosion, ASM International,
OH, 2002.
55. R.A. Rapp, Y.S. Zhang. JOM, 1994.46: p 47-55.

72
56. Zhaolin Tang, Fuhui Wang, Weaitao WU. Oxid. Met., 1999: p. 235.
57. N. Otsuka, T. Kudo : Hot Corrosion of Commercial Tube Steel Materials in a
Japenese Waste Incinerator Environment, High Temperature Corrosion of
Advanced Materials and Protective Coatings, Amsterdam, The Netherlands,
Elsevier Science Publishers, 1992.205.
58. Dongbai XIE, Fuhui Wang. J. Mater. Sci. Technol., 2003.19.
59. Pilling NB, Bedworth RE. J. Inst. Met, 1923.29: P. 529.
60. ASM Handbook Vol.13 Corrosion, ASM International, 1987.
73
VITAE Name Adeel Khalid
Date of Birth 7th October 1986
Nationality Pakistani
Religion Islam
Educational Qualifications
i) B.S. Metallurgical and Materials Engineering from Ghulam Ishaq Khan
Institute of Engineering Sciences and Technology, Pakistan, 2008.
ii) M.S. in Mechanical Engineering, KFUPM, June 2011.
Present and Permanent Address
41-A Judicial Employees Colony, Phase 1, Lahore, Pakistan.
Mobile Numbers +966568833725
+923214045089
Email address [email protected]