final version , 190kb
TRANSCRIPT
Multi-source ratings 1
Running head: CONSTRUCT VALIDITY OF MULTI-SOURCE RATINGS
Construct validity of multi-source performance ratings: An examination of the relationship of
self-, supervisor-, and peer-ratings with cognitive and personality measures
Edwin A.J. van Hooft, Henk van der Flier, and Marjolein R. Minne
Free University Amsterdam, The Netherlands
****IN PRESS at International Journal of Selection and Assessment****
Edwin A.J. van Hooft, Henk van der Flier, and Marjolein R. Minne, Department of
Work and Organizational Psychology, Free University Amsterdam.
Edwin A.J. van Hooft is now at Institute of Psychology, Erasmus University
Rotterdam, Rotterdam, The Netherlands.
An earlier version of this article was presented at the 20th Annual Conference of the
Society for Industrial and Organizational Psychology, April 2005, Los Angeles. We would
like to thank the employees of the public organization, Liesbeth van Leeuwen (Meurs HRM),
and Jeroen Meliëzer (Construct Bedrijfspsychologie) for their cooperation and the two
anonymous reviewers for their valuable comments.
Correspondence concerning this article should be addressed to Edwin A.J. van Hooft,
Institute of Psychology, Erasmus University Rotterdam, P.O. Box 1738, 3000 DR Rotterdam,
The Netherlands. E-mail: [email protected].
Multi-source ratings 2
Abstract
Although more and more organizations prefer using multi-source performance ratings
or 360-degree feedback over traditional performance appraisals, researchers have been rather
skeptical regarding the reliability and validity of such ratings. The present study examined the
validity of self-, supervisor-, and peer-ratings of 195 employees in a Dutch public
organization, using scores on an In-Basket exercise, an intelligence test, and a personality
questionnaire as external criterion measures. Interrater agreement ranged from .28 to .38.
Variance in the ratings was explained by both method and content factors. Support for the
external construct validity was rather weak. Supervisor-ratings were not found to be superior
to self-ratings and peer-ratings in predicting the scores on the external measures.
Keywords: multi-source ratings, 360-degree feedback, construct validity

Multi-source ratings 3
Construct validity of multi-source performance ratings: An examination of the relationship of
self-, supervisor-, and peer-ratings with cognitive and personality measures
Performance feedback in an organizational setting by multiple sources (e.g.,
supervisor, peers, subordinates, and self), or 360-degree feedback, is enjoying great
popularity. An increasing number of organizations have started using some kind of multi-
source performance feedback (Church & Bracken, 1997; London & Smither, 1995). Estimates
of the percentage of organizations in the United States using 360-degree feedback procedures
vary between 6% (Bettenhausen & Fedor, 1997) to 12% (Antonioni, 1996). A more recent
survey among large organizations in The Netherlands, reported that 28% of the participating
companies used 360-degree feedback (Jellema, 2000). Multi-source and 360-degree feedback
has also attracted much research attention in the last decade. The majority of 360-degree
feedback studies focused on either issues such as self-other agreement and the impact of 360-
degree feedback on behavioral change (see for reviews: Atwater, Waldman, & Brett, 2002;
London & Smither, 1995) or on the psychometric properties of multi-source performance
ratings in terms of either interrater agreement (see for a meta-analysis: Conway & Huffcutt,
1997) and validity. Studies on the validity of 360-degree feedback ratings mostly focused on
construct validity by comparing the ratings within and between the different sources (e.g.,
self, supervisor, peers, and subordinates). Only very few studies have used external criteria for
validating 360-degree feedback ratings. The main purpose of the current study therefore was
to investigate the external construct validity of multi-source ratings within a nomological
network of cognitive and personality measures.
Performance appraisal and 360-degree feedback
Performance appraisal in general is an important topic for many organizations. A
British study revealed that 82% of the participating organizations operated some formal
performance appraisal scheme (Long, 1986). Murphy and Cleveland (1991) reported several

Multi-source ratings 4
studies indicating that 74% to 89% of the surveyed organizations had a formal performance
appraisal system. Thus, performance appraisal is widely used in organizations. The four main
purposes for using performance reviews are (Drenth, 1998; Murphy & Cleveland, 1991): (a)
administrative purposes (e.g., decisions about promotions, remuneration, or dismissal), (b)
employee development, (c) assessment of potential, and (d) research purposes (e.g., use as
criterion).
360-degree feedback systems are mainly used for the purpose of employee
development, although over the last decade more and more organizations have started using
these systems for administrative purposes too (Bettenhausen & Fedor, 1997; Fletcher, Baldry,
& Cunningham-Snell, 1998; London & Smither, 1995; Waldman, Atwater, & Antonioni,
1998). However, the use of multi-source ratings to base personnel decisions on has caused
much debate (e.g., DeNisi & Kluger, 2000; Fletcher, 1998; Lepsinger & Lucia, 1997; Toegel
& Conger, 2003). Many authors have argued against the use of multi-source ratings for
administrative purposes because it affects the quality of the ratings (e.g., more leniency, less
variability, more halo; Fahr, Cannella, & Bedeian, 1991; Murphy & Cleveland, 1991; Zedeck
& Cascio, 1982), reduces the user acceptance (Bettenhausen & Fedor, 1997; Fahr et al., 1991;
McEvoy & Buller, 1987), and influences the requirements the system has to meet regarding
the content of the appraisal and the agreement among rating sources.
With regard to the content of the appraisal, 360-degree systems serving developmental
purposes must be specific and concrete. In addition, the dimensions where the appraisal and
the feedback focus on must be changeable. Therefore, when aiming at employee development,
it is specific employee behavior that should be appraised, in order to provide rich and detailed
data (Drenth, 1998; Toegel & Conger, 2003). Appraisals serving administrative purposes
should especially be objective and reliable. Objectivity and reliability positively influence the
fairness perceptions of appraisees regarding the performance appraisal, and fairness
Multi-source ratings 5
perceptions are extremely important in the area of personnel decisions. Therefore, appraisal
on some kind of measurable output, that is behavioral results, is most suitable in this case
(Drenth, 1998).
The agreement between rating sources used in a 360-degree setting is usually rather
low (Conway & Huffcutt, 1997; Harris & Schaubroeck, 1988). When 360-degree systems are
employed for developmental purposes, low or moderate interrater agreement is not
problematic, and to some extent even desirable. Different raters, from various hierarchical
levels, provide in different viewpoints of the ratee’s performance. As Toegel and Conger
(2003) note, differences between rating sources reflect legitimate differences in the
perceptions of the ratee’s various roles. In support of this idea Scullen, Mount, and Goff
(2000) found that an important proportion of the variance in supervisor and subordinate
ratings is perspective-related, that is, unique to the rating source. Because of these unique
perspectives, high interrater agreement between sources should not be expected (Greguras &
Robie, 1998). Moreover, if high interrater agreement existed, indicating that raters are
interchangeable, using multiple sources would be superfluous (Murphy & Cleveland, 1991).
Thus, for developmental purposes feedback from various rater groups is desirable, in that it
provides ratees with different views of their performance. Inconsistencies in ratings are
acceptable, and regarded as informational. For administrative purposes, however, low
interrater agreement is problematic. Consolidation of the appraisal information into one global
judgment has to be possible, in that personnel decisions can be based on it (Drenth, 1998).
Several studies have demonstrated that individual raters share little common variance, and
aggregating ratings in 360-degree settings thus may be inappropriate (Greguras & Robie,
1998; Mount, Judge, Scullen, Sytsma, & Hezlett, 1998; see also London & Smither, 1995).
Based on the different requirements 360-degree systems have to meet, Toegel and Conger
(2003) argued for using separate appraisal procedures for developmental purposes and for
Multi-source ratings 6
administrative purposes.
360-degree feedback and validity evidence
As mentioned above, research has found little evidence for the validity of 360-degree
ratings in terms of interrater agreement between different rating sources. In Conway and
Huffcutt’s (1997) meta-analysis uncorrected correlations between rater categories ranged
from .14 (self – subordinate) to .34 (peer – supervisor). Interrater agreement within rating
sources does not seem to be much higher (Greguras & Robie, 1998; Mount et al., 1998).
Furthermore, research on the construct validity of 360-degree systems has focused on
examining the extent to which the variance in 360-degree ratings can be attributed to the
ratee’s performance on the one hand and to rater characteristics (i.e., organizational level of
the rater or individual rating tendencies of the rater) on the other. Conway (1996) analyzed 20
multitrait-multirater (MTMR) studies and found a considerable proportion of method variance
(i.e., variance due to rater effects) in the data. Greguras and Robie (1998) demonstrated that
rater effects explain more variance in supervisor-, peer-, and subordinate-ratings than ratee
effects. In their studies, using data sets consisting of over 2,000 managers, Mount et al. (1998)
and Scullen et al. (2000) reported strong method effects. Moreover, they showed that method
variance in 360-degree ratings is associated more strongly with individual rating tendencies of
the raters than with their organizational level (e.g., supervisor, peer, subordinate, or self).
Overall, research using the MTMR-approach has consistently found substantial method
effects in 360-degree ratings.
Method effects associated with the rater’s organizational level can be interpreted as
part of true performance (Scullen et al., 2000), because the difference in organizational level
may cause raters to observe and assess different aspects of the ratee’s performance (Bozeman,
1997). This then raises the question what aspects of the ratee’s performance are being
measured by ratings of various rating sources. This question can be addressed by investigating
Multi-source ratings 7
the construct validity of 360-degree ratings within a broader nomological network of
intelligence, personality, skills, and abilities. However, relatively little is known about the
relationship of 360-degree ratings with such external measures. Among the few exceptions is
a study by Vance, Coovert, MacCallum, and Hedge (1989), who found a moderate
relationship of an averaged task rating based on self-, supervisor-, and peer-ratings with an
aptitude test in a sample of 201 job engine mechanics. Lance, Teachout, and Donnelly (1992)
reported correlations ranging from .21 to .29 between 360-degree ratings and a work sample
test. More recent, Atkins and Wood (2002) used assessment center (AC) ratings to validate
360-degree ratings. In their study among 63 team leaders in a service company they found a
correlation of .39 between the overall AC-score and the averaged supervisor – peer –
subordinate rating. Correlations between individual raters and separate AC-exercises,
however, were mostly non-significant.
Present study
The current study extends the work that has been done in this area by examining the
external construct validity of 360-degree ratings using not only an AC-exercise, but an
intelligence test and a personality questionnaire as well. Moreover, as Borman (1997) noted,
an important issue in the field of 360-degree feedback is whether additional ratings sources
provide incremental validity beyond the ratings of the supervisor. We examined this issue
empirically using three external measures. In addition to the external construct validity and
the incremental validity, the interrater agreement and the internal construct validity of the
360-degree ratings were investigated. Finally, the implications of findings for the use of 360-
degree ratings for developmental versus administrative purposes were discussed.
Hypotheses were tested concerning interrater agreement, internal construct validity,
external construct validity, and incremental validity. Based on previous meta-analytical
research on interrater agreement (Conway & Huffcutt, 1997; Harris & Schaubroeck, 1988),

Multi-source ratings 8
we expected that the supervisor–peer agreement would be higher than the supervisor–self
agreement (Hypothesis 1a), and higher than the peer–self agreement (Hypothesis 1b).
For multi-source ratings to be internally construct valid, the factors underlying the
ratings should reflect the ratee’s competencies or traits rather than the rating source (i.e.,
method). Using a confirmatory factor analysis (CFA) approach, it was hypothesized that the
variance in the ratings could be explained by trait-factors rather than by method-factors
(Hypothesis 2).
Regarding the external construct validity of the multi-source performance appraisal
instrument, a number of relationships were expected between the multi-source ratings and the
three external measures. First, a positive relationship was hypothesized between the total
averaged score on the multi-source instrument and the total score on the In-Basket exercise
(Hypothesis 3a), because previous research has demonstrated that overall assessment center
ratings positively relate to general job performance (Arthur, Day, McNelly, & Edens, 2003;
Schmidt & Hunter, 1998), and the total score on the multi-source instrument can be
interpreted as a measure of general job performance. Second, research has consistently found
that individuals with higher scores on tests of general mental ability perform better in their
jobs than others (e.g., Schmidt & Hunter, 1998). Again, because the total score on the multi-
source instrument can be interpreted as a measure of general job performance, we expected a
positive relationship between the total score and general intelligence (Hypothesis 3b).
In addition to relationships on the level of the total scores on the multi-source
instrument, we expected a number of relationships at the dimensions level. The multi-source
instrument consists of 14 behavioral dimensions (see Table 1 for an overview of the
dimensions and their definitions), which were all expected to correlate with conceptually
similar or related scales of the external measures. First, the dimensions Organizing and
planning and Judgment were hypothesized to relate positively to the total score on the In-
Multi-source ratings 9
Basket exercise (Hypothesis 4a), because an In-Basket is an AC-exercise focusing on people’s
potential to analyze problems, plan actions to deal with the problems, and set priorities. As
shown by the definitions in Table 1, the multi-source dimensions Judgment and Organizing
and planning are conceptually similar to the competencies as measured by an In-Basket.
Second, the dimensions Judgment and Adaptability were hypothesized to relate positively to
general mental ability (Hypothesis 4b). Using sound judgment and problem-solving ability are
generally interpreted as important components of intelligence (Sternberg, 2000). In Arthur et
al.’s (2003) meta-analysis Judgment and general mental ability were categorized in the same
main category of Problem solving. Adaptability relates to effective behavior in new and
changing situations. The ability to adapt to the environment is generally thought to be an
important component of general intelligence (Sternberg, 2000).
Third, we hypothesized that the multi-source dimensions would correlate significantly
with conceptually similar or related personality traits (Hypothesis 5a). In addition, it was
hypothesized that the average correlation between conceptually similar dimensions exceeded
the average correlation between conceptually non-similar dimensions (Hypothesis 5b).
Finally, we investigated the incremental validity of the self-ratings and the peer-ratings
over the supervisor-ratings, using the three external measures. Previous research has shown
that supervisor-ratings are more reliable than ratings of other sources (Conway & Huffcutt,
1997; Greguras & Robie, 1998; Viswesvaran, Ones, & Schmidt, 1996). Scullen et al. (2000)
concluded that supervisor-ratings captured more of the ratee’s actual performance than ratings
from other sources. Moreover, Atkins and Wood (2002) found that supervisor-ratings showed
higher correlations with overall assessment center ratings than ratings from other sources.
Therefore, we expected that supervisor-ratings would show higher external construct validity
than self-ratings (Hypothesis 6a) and peer-ratings (Hypothesis 6b). However, as Kane and
Lawler (1979) posited, no rating source is superior in every situation. Raters can only assess
Multi-source ratings 10
behavior that is observable for them. Using more raters, and using raters from different
organizational levels, results in more opportunities to observe, and a more complete picture of
the ratee (Cascio, 1991). Although ratings from different sources usually correlate only
weakly, several authors have noted that these ratings may still be valid as they reflect different
aspects of the ratee’s performance (e.g., Bozeman, 1997). In line with this argument, we
expected that self-ratings and peer-ratings would show incremental validity over ratings by
the supervisor (Hypothesis 7).
Method
Sample and procedure
Multi-source ratings were collected of 195 employees in a large Dutch public
organization. The ratings were completed as a part of an employee development program. As
a part of the employee development program participants also completed an intelligence test
(MBS-Brain-H), an In-Basket exercise (‘Zeezicht’), and a personality questionnaire (MBS-
Quest). The MBS-Quest and the MBS-Brain-H both are part of the basic set of tests for
personnel selection from the Dutch consulting firm Meurs HRM (MBS; see Evers, Van Vliet-
Mulder, & Groot, 2000).
The mean age of the ratees was 38.6, varying between 24 and 55 (SD = 6.32). Eighty
percent (n = 156) of the ratees was male, and 55.4% (n = 108) completed higher vocational or
academic education (similar to a bachelor’s and master’s degree, respectively). The supervisor
and two peers of the ratee acted as rater. In addition, the employee completed a self-rating.
Self-ratings were completed by 168 to 172 employees and supervisor-ratings were completed
for 188 to 195 employees. One peer-rating was available for 182 to 191. Because a second
peer-rating was available for 144 to 155 employees only, these ratings were excluded from the
analyses in order to maximize the number of valid cases.
Instruments

Multi-source ratings 11
The multi-source feedback instrument consisted of 14 dimensions, all measured by
one item. Items were completed by using 5-point Likert scales, with response options being
weak, moderate, normal, good, and strong. For every dimension a definition was provided on
the rating form, as well as at least two negative and two positive behavioral descriptions. The
multi-source feedback instrument was developed in the mid 1990s by the public organization.
The theoretical basis for the development was a list of 50 behavioral dimensions based on the
managerial dimensions as identified by Thornton and Byham (1982). A team of experts was
formed to reach consensus on the clustering of the 50 dimensions into a smaller set. This, and
the input of various user groups (e.g., human resource staff, managers), resulted in the 14
dimensions and definitions as presented in Table 1.
Intelligence test. The MBS-Brain-H is an intelligence test, developed by Meurs HRM,
which is supposed to measure general mental ability. The test consists of five subtests:
Analogies (18 items), Number series (14 items), Series of figures (19 items), Number work
(12 items), and Vocabulary (34 items). All subtests have a time limit, varying between 5 and
15 minutes. Based on the internal consistency reliabilities (KR-20) and the split-half
reliabilities of the subtests (see Houtman, 1996), the stratified alpha of the total score of the
Brain is .83 and .84, respectively. Validity of the Brain test is satisfactory, as is indicated by
moderate to strong correlations of the total score with several external criteria (i.e., course
grades and training ratings; Evers et al., 2000; Houtman, Van Leeuwen, & Vinke, 1999).
In-Basket exercise. The Zeezicht PC In-Basket is an AC-exercise that assesses
managerial potential. The Zeezicht test is the Dutch adaptation by De Kok (1996) of the
‘Seeblick’ PC In-Basket developed by Scharley (1994). The exercise takes 60 minutes and is
administered on a computer. The participants have to deal with 40 items of written
correspondence, representative for what a manager typically comes across with. The Zeezicht
PC In-Basket is scored electronically using a standardized scoring scheme. Scores are

Multi-source ratings 12
calculated on the dimensions Delegation, Problem recognition, Prioritizing, Planning of
appointments, and Logical order. Previous research has reported satisfactory internal
consistency reliabilities, ranging from .71 for Prioritizing to .80 for Planning of appointments
(Minne, 1999). Support has been found for the validity of the In-Basket exercise. Minne
(1999) reported positive correlations between the In-Basket total score and measures of
general intelligence (e.g., r = .32 with the MBS-Brain-H and r = .22 with the LSCP Multi-
Cultural Capacity Test). Because the correlations between the In-Basket dimensions were
substantial (ranging from .52 to .74), a confirmatory factor analysis was run to test whether
the variance in the dimensions can be explained by one underlying factor. Because the fit of a
single-factor model was satisfactory, χ²(5, N = 195) = 50.85, p < .001, SRMR = .052, CFI =
.92, we decided to collapse the dimension scores into a single In-Basket total score.
Personality questionnaire. The MBS-Quest is a personality test, developed by Meurs
HRM, measuring work related personality traits. The Quest consists of 189 items, reflecting
13 dimensions (Assertiveness, Deliberative behavior, Enthusiasm, Flexibility, Leadership
ambition, Management behavior, Manipulation, Social behavior, Achievement motivation,
Stress tolerance, Social presentation, Social adequacy, and Work locus of control). Previous
research among 5,118 applicants has shown satisfactory internal consistency reliabilities for
most dimensions (mean Cronbach’s alpha was .80, ranging from .66 for Management
behavior to .88 for Social adequacy and Leadership ambition; Houtman et al., 1999).
Moderate to high correlations of the Quest dimensions with independent assessor ratings and
a social effectiveness test support the validity of the MBS-Quest (Evers et al., 2000).
Analyses
For the analyses concerning interrater agreement, a composite performance score was
calculated (cf. Becker & Klimoski, 1989). Within each rater category the scores on the 14
dimensions of the multi-source instrument were summed into one composite performance
Multi-source ratings 13
score for every ratee. In addition, interrater agreement was examined for each multi-source
dimension separately.
To examine the internal construct validity, the dimensions of the multi-source
instrument were classified into three broad categories of managerial performance:
Administrative skills, Human skills, and Technical skills, following the work of Mount,
Scullen, and colleagues (Mount et al., 1998; Scullen et al., 2000; Scullen, Mount, & Judge,
2003). Six members of staff of the Work and Organizational Psychology department of the
Free University independently assigned the 14 dimensions of the multi-source instrument to
one of the categories, based on the dimension definitions and descriptions of the categories
(cf. Scullen et al., 2003). Dimensions were assigned to a category if at least four of the six
raters agreed on the category assignment. As a result, four dimensions were dropped because
of lack of agreement. The remaining dimensions (with the percentage of raters that agreed on
the classification in brackets) were for the Administrative skills category: Decisiveness (67%),
Organizing and planning (100%), and Progress control (100%); for the Human skills category:
Adaptability (67%), Flexibility (67%), Effort (83%), Persuasiveness (67%), and Tact (100%);
for the Technical skills category: Independence (67%), and Judgment (67%).
The resulting classification of the multi-source dimensions was used to examine the
internal construct validity of the instrument with confirmatory factor analysis (CFA). Twenty-
six cases had self-ratings or peer-ratings missing and were therefore excluded from the CFAs.
Missing values for the remaining 169 cases were imputed using the Expectation
Maximization technique (e.g., Roth, 1994). Covariances between the ten assigned dimensions
served as input into the LISREL 8.30 program. Maximum likelihood was chosen as method of
estimation. Four models (A, B, C, and D) were tested to account for the variance in the multi-
source ratings. Model A is a unidimensional model, in which all dimensions loaded on a
single factor for all raters. Model B is a three-factor trait-only model, hypothesizing that the

Multi-source ratings 14
variance in the ratings is explained by the ratee’s competencies or traits completely. Model C
is a three-factor method-only model, hypothesizing that the variance in the ratings is
explained by the rater’s characteristics completely. Model D a six-factor model, hypothesizing
that both trait-factors and method-factors are needed to explain the variance in the multi-
source ratings. Fit indices of the models were evaluated, using Hu and Bentler’s (1999)
guidelines.
External construct validity was examined by calculating and comparing mean
correlations for the predicted and non-predicted relationships. The analyses were run for every
rater separately (i.e., Self, Supervisor, and Peer), and for the total averaged rating across the
three raters. The hypotheses for conceptual similarity or relatedness between the multi-source
dimensions and the personality traits were developed as follows. The first two authors
independently hypothesized relationships of the multi-source dimensions with the personality
traits, using the definitions of the dimensions and the traits. A relationship that was predicted
independently by both authors was used in the study. Agreement between the two authors was
90.1% (Cohen’s κ = .54). The two authors discussed the relationships on which they did not
agree initially to reach consensus. Table 6 presents the resulting hypothesized relationships.
Incremental validity was examined using hierarchical regression analyses on the In-
Basket dimensions, the In-Basket total score, the intelligence total score, and the personality
traits. The supervisor-ratings were entered in the first step of the analysis and the self-ratings
and peer-ratings in the second step.
Results
Table 1 presents the descriptive statistics of the multi-source ratings. Using the
composite performance scores, the supervisor-ratings were significantly lower than both the
self-ratings, t(171) = -5.79, p < .001, and the peer-ratings, t(190) = -5.43, p < .001. The self-
and peer-ratings did not differ significantly, t(168) = -0.20, p = .84.

Multi-source ratings 15
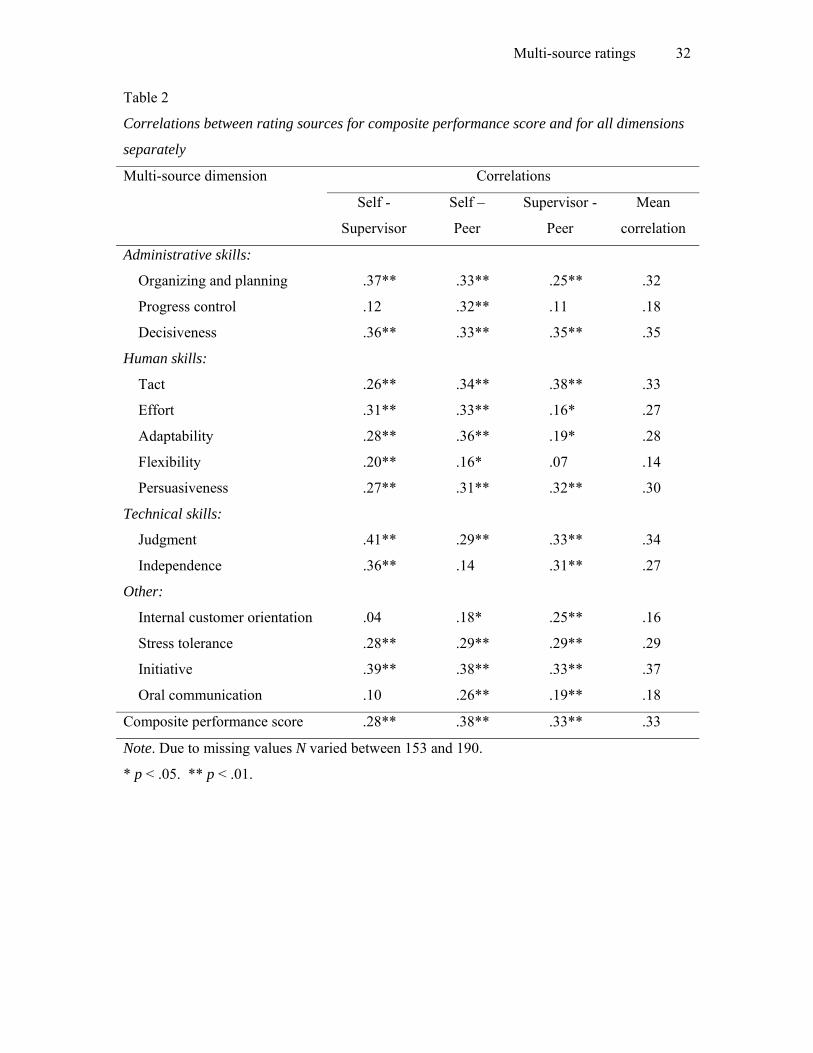
Interrater agreement
The level of agreement between the raters was calculated using both the composite
performance scores and the scores on the separate dimensions. Using the composite
performance scores, correlations between raters were .28 for Self-Supervisor, .38 for Self-
Peer, and .33 for Supervisor-Peer. All correlations were significant at the 1% level (see Table
2). As reflected by these correlations, the Supervisor-Peer agreement was a little higher than
the Supervisor-Self agreement (Hypothesis 1a supported), but lower that the Peer-Self
agreement (Hypothesis 1b not supported). Table 2 also presents the interrater agreement for
all dimensions separately. Mean correlations for the separate dimensions ranged from .14 for
Flexibility to .37 for Initiative.
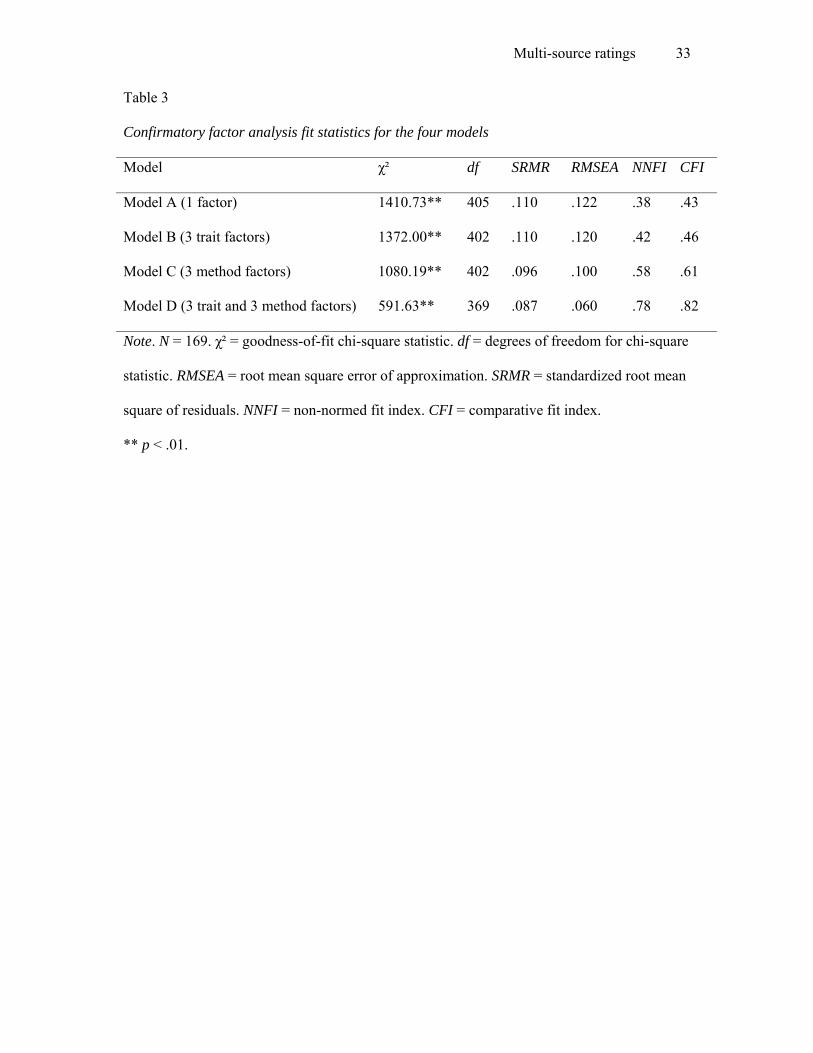
Internal construct validity
Table 3 presents the fit statistics of the CFAs of the five models tested. The first model
(Model A), had a poor fit, indicating that the multi-source performance ratings do not reflect
one single performance construct. The fit statistics for the second (Model B) and the third
model (Model C), hypothesizing that the multi-source performance ratings reflect either three
correlated trait factors (Administrative skills, Human skills, and Technical skills) or three
correlated method factors (Self, Supervisor, and Peer), were hardly better.
Model D was a six-factor model with three correlated trait factors (Administrative
skills, Human skills, and Technical skills) and three correlated method factors (Self,
Supervisor, and Peer). The trait and method factors were not allowed correlate with each
other. As shown in Table 3, Model D fitted the data significantly better than the previous
models, Δχ²Model B – Model D = 780.37, df = 33, p < .001, and Δχ²Model C – Model D = 488.56, df = 33,
p < .001. Thus, in support of Hypothesis 2, it can be concluded that both method factors and
trait factors are needed in order to reflect the factor structure of the performance ratings
properly. Model D demonstrated acceptable fit, with the RMSEA close to .06 and the SRMR

Multi-source ratings 16
close to .08 (cf., Hu & Bentler, 1999). The NNFI and CFI were lower than the recommended
values. Factor loadings of the method factors were all significant. Factor loadings of the trait
factors were significant for all dimensions, except for Persuasiveness, Effort, and
Independence. Because the factor loadings were non-significant for all three rating sources,
these findings suggest that the dimensions Persuasiveness, Effort, and Independence may not
reflect the performance category that they were assigned to.
External construct validity
Construct validity was further examined using the scores on the In-Basket exercise,
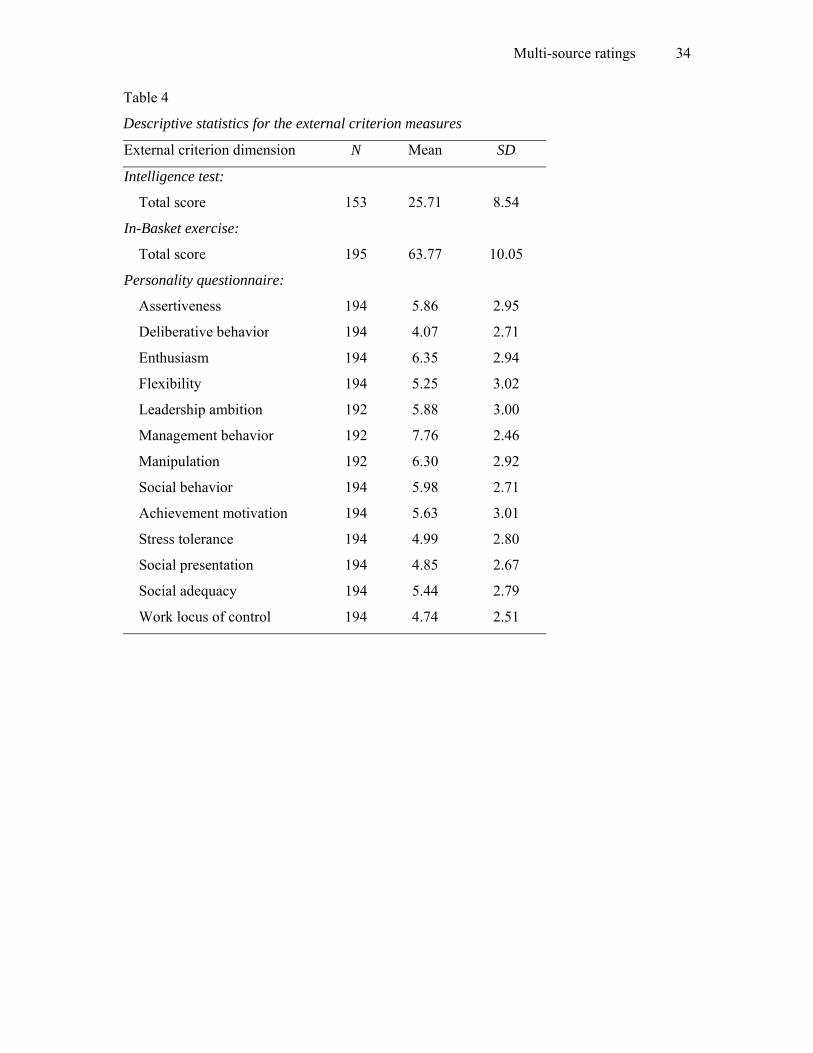
the intelligence test, and the personality questionnaire as external criteria. Table 4 presents the
descriptive statistics of the external measures. The composite performance scores for all raters
were hypothesized to correlate positively with the total score on the In-Basket exercise
(Hypothesis 3a) and the intelligence test (Hypothesis 3b). As shown in the last lines of Table
5, support for these hypotheses was very limited. Only the correlation between the peer-rating
and the In-Basket score approached significance (i.e., r = .13, p < .10).
Multi-source dimensions were expected to correlate with conceptually similar or
related external measures. Table 5 presents the correlations for the expected relationships with
regard to the In-Basket exercise and the intelligence test. Concerning the In-Basket,
significant correlations were expected for the multi-source dimensions Organizing and
planning and Judgment (Hypothesis 4a). Support for Hypothesis 4a was limited, because only
one correlation was found significant (i.e., rPeer Organizing and planning – In-Basket: Total score = .19, p <
.05). Concerning the intelligence test, significant correlations were expected for the multi-
source dimensions Adaptability and Judgment (Hypothesis 4b). Limited support was found
for Hypothesis 4b, that is, the Total rating on Judgment correlated marginally significant with
general intelligence (i.e., r = .15, p < .10). Correlations for Adaptability were not significant.
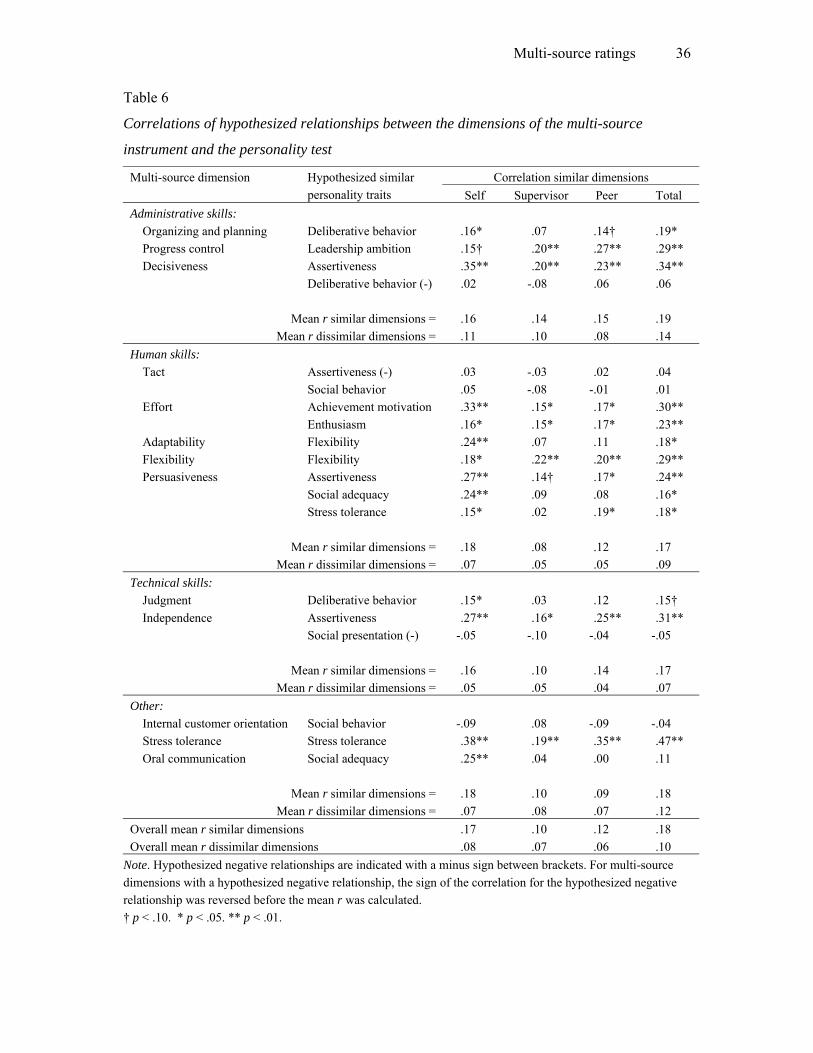
Table 6 presents the correlations for the expected relationships with regard to the

Multi-source ratings 17
personality test. In addition, per dimension category the mean correlations for the
conceptually similar dimensions and the conceptually dissimilar dimensions were calculated.
In support of Hypothesis 5a, a substantial number of predicted correlations was significant or
approached significance. Moreover, mean correlations for the similar dimensions were in all
cases higher than the mean correlations for the dissimilar dimensions. Overall, as shown on
the last line of Table 6, the mean correlations on similar dimensions exceeded the mean
correlations on dissimilar dimensions, supporting Hypothesis 5b. Some differences were
found between the multi-source dimensions. For example, most of the predicted relationships
were found significant for the Administrative skill dimensions, for Effort, Flexibility,
Persuasiveness, and Stress tolerance. In contrast, for the dimensions Tact, Adaptability,
Judgment, Internal customer orientation, and Oral communication hardly any of the predicted
relationships was supported. Furthermore, self-ratings were more strongly correlated with the
personality traits than supervisor- and peer-ratings. This finding is not surprising, as the self-
ratings and the personality questionnaire are both completed by the ratees themselves.
Although the differences were small, the peer-ratings generally correlated a little stronger
with the personality traits than the supervisor-ratings.
Incremental validity
Supervisor-ratings were hypothesized to exhibit higher criterion-related validity than
self-ratings and peer-ratings (Hypothesis 6a and 6b). As presented in Table 5 and 6, no
support was found for these hypotheses. Correlations of the supervisor-ratings were mostly
lower or about equal to the correlations of other raters.
A series of hierarchical regression analyses were performed to test Hypothesis 7,
stating that self-ratings and peer-ratings would show incremental validity over supervisor-
ratings. As presented in Table 7, the supervisor-ratings on Organizing and planning and
Judgment failed to show significant beta-weights for the predicted In-Basket dimensions.

Multi-source ratings 18
Also the averaged supervisor-rating (composite performance score) did not relate significantly
to the In-Basket total score and the total score on the intelligence test. Thus, concerning the
In-Basket exercise and the intelligence test, no validity evidence was found for the supervisor-
ratings. Furthermore, very little support was found for the incremental validity of the self-
ratings and the peer-ratings with regard to the In-Basket exercise and the intelligence test.
Only one beta-weight was significant in the predicted direction (i.e., peer-rating on
Organizing and planning with In-Basket: Total score).
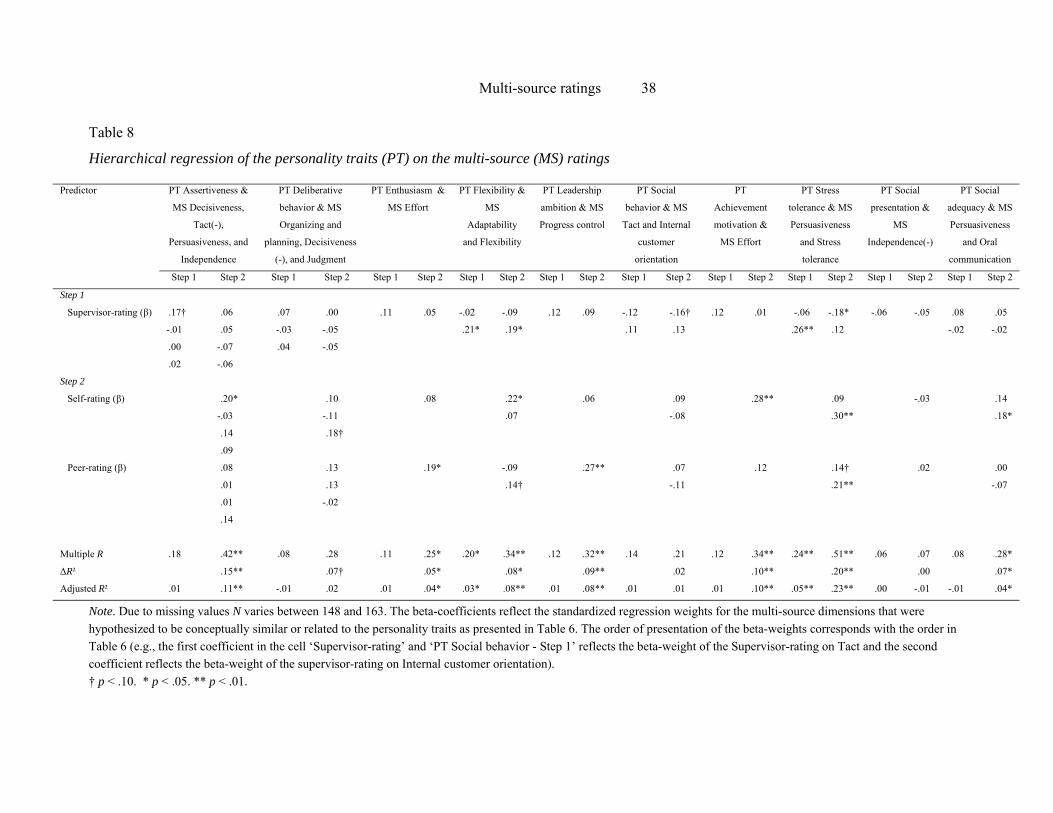
Table 8 presents the regression analyses using the personality traits as external criteria.
The supervisor-ratings significantly predicted personality scores for only two personality
traits (i.e., Flexibility and Stress tolerance). Adding the self-ratings and peer-ratings to the
regression equations, resulted in a significant increase in explained variance for seven of the
ten personality traits for which relationships were predicted. These analyses thus show
incremental validity of self-ratings and peer-ratings over supervisor-ratings when personality
is concerned as external criterion.
Discussion
In this study we evaluated self-, supervisor-, and peer-ratings, collected with a 14-
dimension, behavior-based multi-source feedback instrument. The main purpose was to
investigate the external construct validity of multi-source ratings within a nomological
network of cognitive and personality measures. However, we also examined the interrater
agreement and the internal construct validity of the ratings.
Interrater agreement
Results demonstrated that supervisors rated more severely than peers and self. The
finding that self-ratings are somewhat higher compared to supervisor-ratings is consistent
with previous research on 360-degree feedback systems (e.g., Atwater & Yammarino, 1992;
Harris & Schaubroeck, 1988; Nilsen & Campbell, 1993). Furthermore, we found moderate
Multi-source ratings 19
levels of agreement between the self-, peer-, and supervisor-ratings. Specifically, self-
supervisor, self-peer, and peer-supervisor correlations using the averaged score across the 14
dimensions were .28, .38, and .33, respectively. Correlations at the dimensions level were
mostly lower, with mean correlations across raters varying between .14 and .37. The
magnitude of these correlations is in line with previous research on multi-source ratings. In
their meta-analysis, Conway and Huffcutt (1997) reported self-supervisor, self-peer, and peer-
supervisor mean correlations of .22, .19, and .34, respectively. In contrast to these meta-
analytical findings, our results demonstrated lower peer-supervisor agreement than peer-self
agreement. Because of the explicit developmental purpose of the multi-source feedback
ratings in the current study, self-ratings might have been less biased than is generally found in
the literature.
Interrater agreement in multi-source feedback studies is much lower than the
agreement between assessors reported in the assessment center (AC) literature. Interrater
agreement in AC-research typically varies between .75 and .90 (Jansen, 1993; Kolk, Born, &
Akkerman, 1998). Several structural differences between AC-ratings and multi-source
performance ratings may explain the difference in interrater agreement between the two
systems. In assessment centers trained raters, who are not familiar with the ratee, assess
specific behavior in a controlled setting, and it is well specified what behavior is effective and
what is not (Atkins & Wood, 2002; Jansen & Vloeberghs, 1999). In multi-source ratings,
however, untrained raters, who differ in level of interaction and acquaintance with the ratee,
assess general behavior in an uncontrolled setting. Thus, political use of appraisals,
differences in viewpoints, and disagreement about what behavior is effective and what is not,
affect the ratings and are likely to suppress interrater agreement. This issue is supported by
Kenny, Albright, Malloy, and Kashy (1994), who reviewed the personality literature on
consensus among judges in rating Big Five personality traits of a common target. Among

Multi-source ratings 20
judges who were acquainted with the targets, the mean consensus correlations varied between
.26 and .29. Those values are comparable to the levels of interrater agreement in the current
study and other 360-degree feedback studies.
Internal construct validity
Internal construct validity was examined using confirmatory factor analysis. Results
demonstrated that both method and content factors were needed in order to explain the
variance in the multi-source performance ratings. That is, the factor model with three method
factors (one for every rater) and three content factors (Administrative skills, Human skills,
and Technical skills) outperformed factor models with method or content factors only. These
findings concur with previous research in this area. Mount et al. (1998), for example, also
concluded that multi-source performance ratings were best explained by a combination of
content factors and method factors (one for every rater). Furthermore, our results showed that
a method-only factor model fitted the data better than a content-only factor model. These
findings, suggesting that method factors explained more variance in the multi-source
performance ratings than content factors, are also in accordance with previous research
(Greguras & Robie, 1998; Mount et al., 1998; Scullen et al., 2000). Thus, it can be concluded
that multi-source performance ratings more reflect rater characteristics than the performance
of the ratees. These findings parallel the assessment center literature, in which it is also found
that method variance exceeds trait variance in AC-scores (Lance, Lambert, Gewin, Lievens,
& Conway, 2004). In this field of research it has been shown that decreasing the number of
dimensions improves the construct validity (Kolk, Born, & Van der Flier, 2004; Lievens &
Conway, 2001). This might also be a promising avenue for future attempts to improve the
construct validity of 360-degree appraisals.
Although method factors explained a large part of the variance in our data, content
factors (i.e., Administrative skills, Human skills, and Technical skills) improved the model

Multi-source ratings 21
significantly. Thus, in line with the work by Mount, Scullen, and colleagues (Mount et al.,
1998; Scullen et al., 2000), support was found for the three category model of managerial
performance as proposed by Katz (1974) and Mann (1975). However, the dimensions Effort,
Persuasiveness, and Independence did not reflect the performance category that they were
assigned to. When assigning the multi-source dimensions to the three performance categories,
the interrater agreement on these dimensions was also not perfect (i.e., 83%, 67%, and 67%,
respectively). These results demonstrate that the three category model may not be an
exhaustive classification of managerial performance. Indeed, Scullen et al. (2003) found
support for a fourth category, that is, Citizenship behavior.
External construct validity
Little evidence was found for the external construct validity of the multi-source
instrument used in the present study. In contrast to our hypotheses, the averaged ratings across
all 14 dimensions were not or only very weakly correlated with the overall In-Basket score
and general intelligence. These results are in accordance with Atkins and Wood (2002), who
also reported mostly non-significant correlations between AC-exercise scores and averaged
self-, peer-, and supervisor-ratings. As overall AC-ratings and general intelligence are usually
moderately to strongly related to general job performance (Arthur et al., 2003; Schmidt &
Hunter, 1998), these findings may suggest that multi-source ratings are not adequate measures
of job performance. It should be noted, however, that the current study included only one peer
and one supervisor in the ratings. Because Atkins and Wood’s (2002) results indicate that
aggregated ratings across a larger number of raters may be more valid, future research should
further examine the relationship of AC-scores and general intelligence with multi-source
ratings using more raters per rater category.
Also at the dimensions level, the support found for the external construct validity was
rather weak. In contrast to our hypotheses, multi-source dimensions like Organizing and
Multi-source ratings 22
planning, Adaptability, and Judgment largely failed to show significant associations with the
In-Basket score and general intelligence. Only the peer-rating on Organizing and planning
was associated with the In-Basket score. Using the personality questionnaire as external
criterion, more validity evidence was found. Most multi-source dimensions were significantly
correlated with conceptually similar personality traits, with effect sizes being mostly small to
medium. Moreover, mean correlations with conceptually similar traits exceeded mean
correlations with conceptually dissimilar traits for all raters.
Comparing the external validation measures, substantial differences occurred in the
support found for our hypotheses regarding the intelligence test and the In-Basket exercise on
the one hand and the personality questionnaire on the other. These differences may be
explained by common method variance and the conceptual similarity of the scales measured.
Regarding common method variance, the multi-source instrument shares more method
variance with the personality questionnaire than with the intelligence test and the In-Basket
exercise, because the multi-source instrument and the personality questionnaire are both
typical performance measures using written questionnaires, whereas the intelligence test and
the In-Basket exercise are measures of maximum performance. This argument may be
especially true for the self-ratings on the multi-source instrument. Indeed, the self-ratings
demonstrated higher correlations with the personality traits than the supervisor-ratings and
peer-ratings. Regarding the conceptual similarity of the scales, it should be noted that the
personality questionnaire measured concepts that were more similar to the multi-source
dimensions than the intelligence test and the In-Basket exercise. The highest correlations were
found between the exactly corresponding dimensions/traits Flexibility and Stress tolerance.
Future research should therefore investigate the construct validity of multi-source ratings
using external measures that assess exactly corresponding dimensions.
Previous research demonstrated that supervisor-ratings are more reliable than ratings

Multi-source ratings 23
of other sources (Conway & Huffcutt, 1997; Greguras & Robie, 1998; Viswesvaran et al.,
1996). However, the results of our study showed that this does not imply that supervisor-
ratings are more valid than ratings of other sources. In general, supervisor-ratings were
equally or less strongly correlated with the external measures than peer-ratings. These results
correspond with Lance et al. (1992), who found that supervisor-ratings were not stronger
correlated to a work sample test than peer-ratings. Furthermore, peer-ratings (and self-ratings)
demonstrated incremental validity over supervisor-ratings regarding several personality traits.
This finding may be interpreted as an argument for the use of 360-degree feedback instead of
relying on supervisor-ratings solely. Atkins and Wood (2002) came to a similar conclusion
based on their finding that the total rating aggregated across supervisors, peers, and
subordinates was a more valid predictor of overall AC-scores than individual ratings.
Limitations
In general, weak support was found for the external construct validity of the multi-
source instrument. Although the lack of associations between the multi-source ratings and the
external measures may be interpreted as lack of validity of the multi-source instrument, it may
also indicate lack of reliability and validity of the external measures. However, the external
measures all demonstrated acceptable psychometric properties, as judged by the Dutch Test
Committee (Evers et al., 2000). Nonetheless, future research should examine the construct
validity of 360-degree feedback systems, using a broader variety of external measures that
have been proven to be reliable and valid more extensively.
Another limitation of the present study relates to the number of raters used. Because
only one rater was available per rater category for most employees, we were not able to
distinguish between validity of individual raters and validity of rater categories. Moreover, no
subordinate ratings were available. These issues should be addressed in future research.
Although carefully developed and tested, the multi-source performance feedback
Multi-source ratings 24
instrument that was evaluated in the present study showed some weaknesses. For example,
each dimension was only assessed by one behavioral item. Therefore we were not able to
calculate the reliability of the dimension scores. Although there is some evidence that one-
item measures may be as valid as multiple-item measures (e.g., Wanous, Reichers, & Hudy,
1997), future research should investigate the generalizability of our results to other 360-
degree feedback systems that assess each dimension with multiple items.
Conclusion
Results of the current study and previous research on the reliability and validity of
360-degree ratings, raise the question whether 360-degree feedback ratings should be used for
administrative purposes. As discussed in the Introduction, performance appraisal systems for
administrative purposes demand objectivity, reliability and the possibility to consolidate the
appraisal information into one global judgment. 360-degree feedback ratings do not possess
objectivity. That is, raters in 360-degree feedback systems are selected on having frequent
interactions with the ratee (cf., Jansen & Vloeberghs, 1999). This results in a personalized
relationship, likely leading to subjectivity in the ratings. Furthermore, previous research (and
the current study) demonstrated that the interrater agreement in 360-degree feedback ratings is
typically low to moderate (Conway & Huffcutt, 1997; Harris & Schaubroeck, 1988).
Consequently, summing up the ratings of different rater-categories into one global judgment
is questionable. In addition to objectivity and reliability, performance ratings that are used for
administrative purposes should demonstrate strong validity. The current study found little
evidence for the construct validity of 360-degree feedback ratings using cognitive and
personality measures as criteria. These findings imply that organizations should be careful in
adopting 360-degree performance appraisals for other than developmental purposes.
Thorough research and evaluation of the reliability and validity should precede the
implementation of 360-degree performance appraisals to base administrative decisions on.
Multi-source ratings 25
References
Antonioni, D. (1996). Designing an effective 360-degree appraisal feedback process.
Organizational Dynamics, 25(2), 24-38.
Arthur, W., Day, E. A., McNelly, T. L., & Edens, P. S. (2003). A meta-analysis of the
criterion-related validity of assessment center dimensions. Personnel Psychology, 56,
125-154.
Atkins, P. W. B., & Wood, R. E. (2002). Self- versus others' ratings as predictors of
assessment center ratings: Validation evidence for 360-degree feedback programs.
Personnel Psychology, 55, 871-904.
Atwater, L. E., Waldman, D. A., & Brett, J. F. (2002). Understanding and optimizing
multisource feedback. Human Resource Management, 41, 193-208.
Atwater, L. E., & Yammarino, F. J. (1992). Does self-other agreement on leadership
perceptions moderate the validity of leadership and performance predictions?
Personnel Psychology, 45, 141-164.
Becker, T. E., & Klimoski, R. J. (1989). A field study of the relationship between the
organizational feedback environment and performance. Personnel Psychology, 42,
343-358.
Bettenhausen, K. L., & Fedor, D. B. (1997). Peer and upward appraisals: A comparison of
their benefits and problems. Group & Organization Management, 22, 236-263.
Borman, W. C. (1997). 360° ratings: An analysis of assumptions and a research agenda for
evaluating their validity. Human Resource Management Review, 7, 299-315.
Bozeman, D. P. (1997). Interrater agreement in multi-source performance appraisal: A
commentary. Journal of Organizational Behavior, 18, 313-316.
Cascio, W. F. (1991). Applied psychology in personnel management (4th ed.). Englewood
Cliffs, NJ: Prentice-Hall.

Multi-source ratings 26
Church, A. H., & Bracken, D. W. (1997). Advancing the state of the art of 360-degree
feedback: Guest editors' comments on the research and practice of multirater
assessment methods. Group & Organization Management, 22, 149-191.
Conway, J. M. (1996). Analysis and design of multitrait-multirater performance appraisal
studies. Journal of Management, 22, 139-162.
Conway, J. M., & Huffcutt, A. I. (1997). Psychometric properties of multisource performance
ratings: A meta-analysis of subordinate, supervisor, peer, and self-ratings. Human
Performance, 10, 331-360.
De Kok, P. (1996). PC InBasket onderzoeksverslag [PC In-Basket research report]. Weesp,
The Netherlands: Construct.
DeNisi, A. S., & Kluger, A. N. (2000). Feedback effectiveness: Can 360-degree appraisals be
improved? The Academy of Management Executive, 14, 129-139.
Drenth, P. J. D. (1998). Personnel appraisal. In P. J. D. Drenth, H. Thierry & C. J. De Wolff
(Eds.), Handbook of work and organizational psychology (2nd ed., Vol. 3: Personnel
psychology, pp. 59-87). Hove, UK: Psychology Press.
Evers, A., Van Vliet-Mulder, J. C., & Groot, C. J. (2000). Documentatie van tests en
testresearch in Nederland [Documentation of tests and test research in The
Netherlands]. Assen, The Netherlands: Van Gorcum.
Fahr, J. L., Cannella, A. A., & Bedeian, A. G. (1991). Peer ratings: The impact of purpose on
rating quality and user acceptance. Group & Organization Studies, 16, 367-385.
Fletcher, C. (1998). Feature 360-degree feedback: Circular argument. People Management,
4(19), 46-49.
Fletcher, C., Baldry, C., & Cunningham-Snell, N. (1998). The psychometric properties of 360
degree feedback: An empirical study and a cautionary tale. International Journal of
Selection and Assessment, 6, 19-34.

Multi-source ratings 27
Greguras, G. J., & Robie, C. (1998). A new look at within-source interrater reliability of 360-
degree feedback ratings. Journal of Applied Psychology, 83, 960-968.
Harris, M. M., & Schaubroeck, J. (1988). A meta-analysis of self-supervisor, self-peer, and
peer-supervisor ratings. Personnel Psychology, 41, 43-62.
Houtman, S. (1996). Onderzoeksrapport Quest en Brain [Research report Quest and Brain].
Woerden, The Netherlands: Meurs Personeelsadvies.
Houtman, S., Van Leeuwen, L., & Vinke, I. (1999). Aanvulled onderzoek MBS naar
aanleiding van de Cotanbeoordeling 1999 [Additional research MBS in respons to the
Dutch test committee's evaluation]. Woerden, The Netherlands: Meurs
Personeelsadvies.
Hu, L., & Bentler, P. M. (1999). Cutoff criteria for fit indexes in covariance structure
analysis: Conventional criteria versus new alternatives. Structural Equation Modeling,
6, 1-55.
Jansen, P. G. W. (1993). De werking van het assessment center [The operation of the
assessment center]. Gedrag & Organisatie, 6, 10-24.
Jansen, P. G. W., & Vloeberghs, D. (1999). Multi-rater feedback methods: Personal and
organizational implications. Journal of Managerial Psychology, 14, 455-476.
Jellema, F. (2000). Toepassing van 360-graden feedback in Nederlandse organisaties [Use of
360-degree feedback in Dutch organizations]. Opleiding & Ontwikkeling, 13(7-8), 21-
25.
Kane, J. S., & Lawler, E. E. (1979). Performance appraisal effectiveness: Its assessment and
determinants. In B. M. Staw (Ed.), Research in organizational behavior. Greenwich,
UK: JAI Press.
Katz, R. L. (1974). Skills of an effective administrator. Harvard Business Review, 52, 90-102.
Kenny, D. A., Albright, L., Malloy, T. E., & Kashy, D. A. (1994). Consensus in interpersonal

Multi-source ratings 28
perception: Acquaintance and the Big Five. Psychological Bulletin, 116, 245-258.
Kolk, N. J., Born, M. Ph., & Akkerman, T. E. (1998). De analyse/presentatie opdracht: Een
meta-analyse van de psychometrische kwaliteiten van een veelzijdig assessment center
onderdeel [The analysis/presentation exercise: A meta-analysis of the psychometric
qualities of a many-sided assessment center assignment]. Gedrag & Organisatie, 11,
148-160.
Kolk, N. J., Born, M. Ph., & Van der Flier, H. (2004). A triadic approach to the construct
validity of the assessment center: The effect of categorizing dimensions into a Feeling,
Thinking, and Power taxonomy. European Journal of Psychological Assessment, 20,
149-156.
Lance, C. E., Lambert, T. A., Gewin, A. G., Lievens, F., & Conway, J. M. (2004). Revised
estimates of dimension and exercise variance components in assessment center
postexercise dimension ratings. Journal of Applied Psychology, 89, 377-385.
Lance, C. E., Teachout, M. S., & Donnelly, T. M. (1992). Specification of the criterion
construct space: An application of hierarchical confirmatory factor analysis. Journal of
Applied Psychology, 77, 437-452.
Lepsinger, R., & Lucia, A. D. (1997). 360° feedback and performance appraisal. Training,
34(9), 62-70.
Lievens, F., & Conway, J. M. (2001). Dimension and exercise variance in assessment center
scores: A large-scale evaluation of multitrait-multimethod studies. Journal of Applied
Psychology, 86, 1202-1222.
London, M., & Smither, J. W. (1995). Can multi-source feedback change perceptions of goal
accomplishment, self-evaluations, and performance-related outcomes? Theory-based
applications and directions for research. Personnel Psychology, 48, 803-840.
Long, P. (1986). Performance appraisal revisited. London: Institute of personnel
Multi-source ratings 29
management.
Mann, F. C. (1975). Toward an understanding of the leadership role in formal organization. In
R. Dubin, G. C. Homans, F. C. Mann & D. C. Miller (Eds.), Leadership and
productivity: Some facts of industrial life (pp. 68-103). San Francisco, CA: Chandler.
McEvoy, G. M., & Buller, P. F. (1987). User acceptance of peer appraisals in an industrial
setting. Personnel Psychology, 40, 785-797.
Minne, M. R. (1999). De PC In Basket 'Zeezicht': Een onderzoek naar betrouwbaarheid en
validiteit [The In Basket test 'Zeezicht': A study of the reliability and the validity].
Unpublished master's thesis, Free University, Amsterdam, The Netherlands.
Mount, M. K., Judge, T. A., Scullen, S. E., Sytsma, M. R., & Hezlett, S. A. (1998). Trait, rater
and level effects in 360-degree performance ratings. Personnel Psychology, 51, 557-
576.
Murphy, K. R., & Cleveland, J. N. (1991). Performance appraisal: An organizational
perspective. Boston: Allyn and Bacon.
Nilsen, D., & Campbell, D. P. (1993). Self-observer rating discrepancies: Once an overrater,
always an overrater? Human Resource Management, 32, 265-281.
Roth, P. L. (1994). Missing data: A conceptual review for applied psychologists. Personnel
Psychology, 47, 537-560.
Scharley, T. (1994). PC In-Basket for Windows: Investigation at an electrical company.
Konstanz, Germany: Scharley & Partner Management Development Consultants.
Schmidt, F. L., & Hunter, J. E. (1998). The validity and utility of selection methods in
personnel psychology: Practical and theoretical implications of 85 years of research
findings. Psychological Bulletin, 124, 262-274.
Scullen, S. E., Mount, M. K., & Goff, M. (2000). Understanding the latent structure of job
performance ratings. Journal of Applied Psychology, 85, 956-970.
Multi-source ratings 30
Scullen, S. E., Mount, M. K., & Judge, T. A. (2003). Evidence of the construct validity of
developmental ratings of managerial performance. Journal of Applied Psychology, 88,
50-66.
Sternberg, R. J. (2000). The concept of intelligence. In R. J. Sternberg (Ed.), Handbook of
intelligence. Cambridge, UK: Cambridge University Press.
Thornton III, G. C., & Byham, W. C. (1982). Assessment centers and managerial
performance. New York: Academic Press.
Toegel, G., & Conger, J. A. (2003). 360-degree assessment: Time for reinvention. Academy of
Management Learning and Education, 2, 297-311.
Vance, R. J., Coovert, M. D., MacCallum, R. C., & Hedge, J. W. (1989). Construct models of
taks performance. Journal of Applied Psychology, 74, 447-455.
Viswesvaran, C., Ones, D. S., & Schmidt, F. L. (1996). Comparative analysis of the reliability
of job performance ratings. Journal of Applied Psychology, 81, 557-574.
Waldman, D. A., Atwater, L. E., & Antonioni, D. (1998). Has 360 degree feedback gone
amok? The Academy of Management Executive, 12, 86-94.
Wanous, J. P., Reichers, A. E., & Hudy, M. J. (1997). Overall job satisfaction: How good are
single-items measures? Journal of Applied Psychology, 82, 247-252.
Zedeck, S., & Cascio, W. F. (1982). Performance appraisal decisions as a function of rater
training and purpose of the appraisal. Journal of Applied Psychology, 67, 752-758.

Multi-source ratings 31
Table 1
Overview of the dimensions of the multi-source instrument, the classification, the means and standard deviations.
Self-rating Supervisor-rating Peer-rating Total-rating Multi-source dimensions Definition Mean SD Mean SD Mean SD Mean SD
Administrative skills: Organizing and planning Establishes priorities in goals and activities, and indicates when
and how goals have to be attained 3.48 0.74 3.39 0.71 3.50 0.75 3.49 0.55
Progress control Controls the progress of tasks and activities and adjusts plans if necessary 3.34 0.58 3.30 0.63 3.34 0.67 3.37 0.42
Decisiveness Takes the plunge, does not postpone decisions unnecessary, takes action, makes explicit decisions, takes position 3.65 0.74 3.34 0.68 3.66 0.82 3.58 0.56
Human skills: Tact Is sensitive, takes the interests of others into consideration
when acting 3.47 0.76 3.15 0.76 3.36 0.87 3.32 0.59
Effort Produces more than the average, performs beyond that what is asked for, is energetic and enthusiastic 4.04 0.67 3.88 0.67 4.00 0.75 3.99 0.50
Adaptability Remains effective under changing circumstances, is able to adapt to new situations, gives up initial goals if necessary 3.69 0.62 3.41 0.61 3.58 0.72 3.57 0.47
Flexibility Remains effective in case of resistance, problems, or opportunities by choosing different methods of working 3.78 0.64 3.45 0.64 3.69 0.72 3.65 0.44
Persuasiveness Is able to win others over to his/her position by putting forward relevant arguments at the right time and in the right way 3.56 0.69 3.29 0.69 3.56 0.76 3.47 0.53
Technical skills: Judgment Recognizes all important aspects, takes different viewpoints
when analyzing situations, distinguishes between main and side-issues and between cause and effect
3.71 0.60 3.49 0.68 3.75 0.71 3.67 0.50
Independence Goes by his/her own judgment, does not act on the basis of opinions and reactions of others 3.55 0.70 3.48 0.71 3.69 0.76 3.60 0.51
Other: Internal customer orientation Recognizes and takes into account the needs and interests of
internal customers 3.89 0.57 3.65 0.61 3.75 0.78 3.76 0.45
Stress tolerance Remains effective when under pressure and in case of setbacks and disappointment, is not put of balance easily 3.66 0.75 3.49 0.70 3.67 0.80 3.63 0.53
Initiative Begins out of his/her own accord, does not await, searches for opportunities, recognizes obstacles and acts accordingly 3.78 0.75 3.57 0.78 3.68 0.79 3.71 0.58
Oral communication Expresses him/herself well in conversations, meetings and presentations, uses words and gestures effectively 3.47 0.71 3.35 0.65 3.64 0.78 3.49 0.49
Composite performance score 3.65 0.36 3.45 0.37 3.63 0.44 3.59 0.29
Multi-source ratings 32
Table 2
Correlations between rating sources for composite performance score and for all dimensions
separately
Correlations Multi-source dimension
Self -
Supervisor
Self –
Peer
Supervisor -
Peer
Mean
correlation
Administrative skills:
Organizing and planning .37** .33** .25** .32
Progress control .12 .32** .11 .18
Decisiveness .36** .33** .35** .35
Human skills:
Tact .26** .34** .38** .33
Effort .31** .33** .16* .27
Adaptability .28** .36** .19* .28
Flexibility .20** .16* .07 .14
Persuasiveness .27** .31** .32** .30
Technical skills:
Judgment .41** .29** .33** .34
Independence .36** .14 .31** .27
Other:
Internal customer orientation .04 .18* .25** .16
Stress tolerance .28** .29** .29** .29
Initiative .39** .38** .33** .37
Oral communication .10 .26** .19** .18
Composite performance score .28** .38** .33** .33
Note. Due to missing values N varied between 153 and 190.
* p < .05. ** p < .01.
Multi-source ratings 33
Table 3
Confirmatory factor analysis fit statistics for the four models
Model χ² df SRMR RMSEA NNFI CFI
Model A (1 factor) 1410.73** 405 .110 .122 .38 .43
Model B (3 trait factors) 1372.00** 402 .110 .120 .42 .46
Model C (3 method factors) 1080.19** 402 .096 .100 .58 .61
Model D (3 trait and 3 method factors) 591.63** 369 .087 .060 .78 .82
Note. N = 169. χ² = goodness-of-fit chi-square statistic. df = degrees of freedom for chi-square
statistic. RMSEA = root mean square error of approximation. SRMR = standardized root mean
square of residuals. NNFI = non-normed fit index. CFI = comparative fit index.
** p < .01.
Multi-source ratings 34
Table 4
Descriptive statistics for the external criterion measures
External criterion dimension N Mean SD
Intelligence test:
Total score 153 25.71 8.54
In-Basket exercise:
Total score 195 63.77 10.05
Personality questionnaire:
Assertiveness 194 5.86 2.95
Deliberative behavior 194 4.07 2.71
Enthusiasm 194 6.35 2.94
Flexibility 194 5.25 3.02
Leadership ambition 192 5.88 3.00
Management behavior 192 7.76 2.46
Manipulation 192 6.30 2.92
Social behavior 194 5.98 2.71
Achievement motivation 194 5.63 3.01
Stress tolerance 194 4.99 2.80
Social presentation 194 4.85 2.67
Social adequacy 194 5.44 2.79
Work locus of control 194 4.74 2.51

Multi-source ratings 35
Table 5
Correlations of hypothesized relationships of the dimensions of the multi-source instrument
with the In-Basket exercise and the intelligence test
Correlation Multi-source dimension Hypothesized similar
measures Self Supervisor Peer Total
Administrative skills:
Organizing and planning In-Basket: Total score .00 .06 .19* .12
Human skills:
Adaptability Brain: Total score .08 -.01 .06 .06
Technical skills:
Judgment In-Basket: Total score
Brain: Total score
-.03
.11
.07
.03
.05
.06
.04
.15†
Composite performance score In-Basket: Total score
Brain: Total score
.03
.05
.09
-.05
.13†
-.03
.11
.01
Note: Due to incidental missing values N varies between 159 and 195 for correlations with the In-
Basket total score, and between 122 and 153 for correlations with the Brian total score.
† p < .10. * p < .05.
Multi-source ratings 36
Table 6
Correlations of hypothesized relationships between the dimensions of the multi-source
instrument and the personality test
Correlation similar dimensions Multi-source dimension Hypothesized similar personality traits Self Supervisor Peer Total
Administrative skills: Organizing and planning Deliberative behavior .16* .07 .14† .19* Progress control Leadership ambition .15† .20** .27** .29** Decisiveness Assertiveness .35** .20** .23** .34** Deliberative behavior (-) .02 -.08 .06 .06
Mean r similar dimensions = .16 .14 .15 .19
Mean r dissimilar dimensions = .11 .10 .08 .14 Human skills: Tact Assertiveness (-) .03 -.03 .02 .04 Social behavior .05 -.08 -.01 .01 Effort Achievement motivation .33** .15* .17* .30** Enthusiasm .16* .15* .17* .23** Adaptability Flexibility .24** .07 .11 .18* Flexibility Flexibility .18* .22** .20** .29** Persuasiveness Assertiveness .27** .14† .17* .24** Social adequacy .24** .09 .08 .16* Stress tolerance .15* .02 .19* .18*
Mean r similar dimensions = .18 .08 .12 .17
Mean r dissimilar dimensions = .07 .05 .05 .09 Technical skills: Judgment Deliberative behavior .15* .03 .12 .15† Independence Assertiveness .27** .16* .25** .31** Social presentation (-) -.05 -.10 -.04 -.05
Mean r similar dimensions = .16 .10 .14 .17
Mean r dissimilar dimensions = .05 .05 .04 .07 Other: Internal customer orientation Social behavior -.09 .08 -.09 -.04 Stress tolerance Stress tolerance .38** .19** .35** .47** Oral communication Social adequacy .25** .04 .00 .11
Mean r similar dimensions = .18 .10 .09 .18
Mean r dissimilar dimensions = .07 .08 .07 .12 Overall mean r similar dimensions .17 .10 .12 .18 Overall mean r dissimilar dimensions .08 .07 .06 .10
Note. Hypothesized negative relationships are indicated with a minus sign between brackets. For multi-source dimensions with a hypothesized negative relationship, the sign of the correlation for the hypothesized negative relationship was reversed before the mean r was calculated. † p < .10. * p < .05. ** p < .01.

Multi-source ratings 37
Table 7
Hierarchical regression of the In-Basket total score and the intelligence test total score on the
multi-source (MS) ratings
In-Basket: Total
score & MS
Organizing and
planning and MS
Judgment
In-Basket: Total
score & MS
Composite
performance
score
Brain: Total score
& MS
Adaptability and
MS Judgment
Brain Total score
& MS Composite
performance
score
Predictor
Step 1 Step 2 Step 1 Step 2 Step 1 Step 2 Step 1 Step 2
Step 1
Supervisor-rating (β) .08
.04
.05
.08
.07 .03 -.04
.02
-.07
-.03
-.03 -.05
Step 2
Self-rating (β) -.08
-.07
-.03 .08
.10
.07
Peer-rating (β) .22*
-.06
.14 .04
.01
-.01
Multiple R .10 .23 .07 .15 .04 .15 .03 .07
ΔR² .04 .02 .02 .00
Adjusted R² .00 .01 .00 .00 -.02 -.03 .00 .01
Note. Due to missing values N varies between 122 and 169. The beta-coefficients reflect the
standardized regression weights for the multi-source dimensions that were hypothesized to be
conceptually similar or related to the external measures. The order of presentation of the beta-weights
corresponds with the order in Table 5 (e.g., the first coefficient in the cell ‘Supervisor-rating’ and ‘In-
Basket: Total score & MS Organizing and planning and MS Judgment - Step 1’ reflects the beta-
weight of the supervisor-rating on Organizing and planning and the second coefficient reflects the
beta-weight of the supervisor-rating on Judgment).
* p < .05.
Multi-source ratings 38
Table 8
Hierarchical regression of the personality traits (PT) on the multi-source (MS) ratings
PT Assertiveness &
MS Decisiveness,
Tact(-),
Persuasiveness, and
Independence
PT Deliberative
behavior & MS
Organizing and
planning, Decisiveness
(-), and Judgment
PT Enthusiasm &
MS Effort
PT Flexibility &
MS
Adaptability
and Flexibility
PT Leadership
ambition & MS
Progress control
PT Social
behavior & MS
Tact and Internal
customer
orientation
PT
Achievement
motivation &
MS Effort
PT Stress
tolerance & MS
Persuasiveness
and Stress
tolerance
PT Social
presentation &
MS
Independence(-)
PT Social
adequacy & MS
Persuasiveness
and Oral
communication
Predictor
Step 1 Step 2 Step 1 Step 2 Step 1 Step 2 Step 1 Step 2 Step 1 Step 2 Step 1 Step 2 Step 1 Step 2 Step 1 Step 2 Step 1 Step 2 Step 1 Step 2
Step 1
Supervisor-rating (β) .17†
-.01
.00
.02
.06
.05
-.07
-.06
.07
-.03
.04
.00
-.05
-.05
.11 .05 -.02
.21*
-.09
.19*
.12 .09 -.12
.11
-.16†
.13
.12 .01 -.06
.26**
-.18*
.12
-.06 -.05 .08
-.02
.05
-.02
Step 2
Self-rating (β) .20*
-.03
.14
.09
.10
-.11
.18†
.08 .22*
.07
.06 .09
-.08
.28** .09
.30**
-.03 .14
.18*
Peer-rating (β) .08
.01
.01
.14
.13
.13
-.02
.19* -.09
.14†
.27** .07
-.11
.12 .14†
.21**
.02 .00
-.07
Multiple R .18 .42** .08 .28 .11 .25* .20* .34** .12 .32** .14 .21 .12 .34** .24** .51** .06 .07 .08 .28*
ΔR² .15** .07† .05* .08* .09** .02 .10** .20** .00 .07*
Adjusted R² .01 .11** -.01 .02 .01 .04* .03* .08** .01 .08** .01 .01 .01 .10** .05** .23** .00 -.01 -.01 .04*
Note. Due to missing values N varies between 148 and 163. The beta-coefficients reflect the standardized regression weights for the multi-source dimensions that were hypothesized to be conceptually similar or related to the personality traits as presented in Table 6. The order of presentation of the beta-weights corresponds with the order in Table 6 (e.g., the first coefficient in the cell ‘Supervisor-rating’ and ‘PT Social behavior - Step 1’ reflects the beta-weight of the Supervisor-rating on Tact and the second coefficient reflects the beta-weight of the supervisor-rating on Internal customer orientation). † p < .10. * p < .05. ** p < .01.