final year project dissertationutpedia.utp.edu.my/10202/1/2011 - comparison study for stuck...
TRANSCRIPT
UNIVERSIJI TEKNOLOG! PFTRONAS
FINAL YEAR PROJECT
Dissertation
AMIERUL REDZA BIN MOHD AFFENDI
Comparison Study For Stuck Pipe Detection Method.
Statistical Method & Current Method
Supervisor: Mr. Elias B. Abllah
Comparison Study For Stuck Pipe Detection Method.
Statistical Method & Current Method
By
AMIERUL REDZA BIN MOHD AFFENDI
Dissertation submitted in partial fulfillment of
the requirements for the
Bachelor of Engineering (Hons)
(Petroleum Engineering)
AUGUST2011
Universiti Teknologi PETRONAS Bandar Seri Iskandar 31750 Tronoh Perak Darul Ridzuan
ii

CERTIFICATION OF APPROVAL
Comparison Study For Stuck Pipe Detection Method.
Statistical Method & Current Method
By
AMIERUL REDZA BIN MOHD AFFENDI
Dissertation submitted in partial fulfillment of
the requirements for the
Bachelor of Engineering (Hons)
(Petroleum Engineering)
AUGUST20ll
(Mr. Elias B Abllah)
Universiti Teknologi PETRONAS Bandar Seri Iskandar 31750 Tronoh Perak Darul Ridzuan
iii

CERTIFICATION OF ORIGINALITY
This is certify that I am responsible for the work submitted in this project, that the original work is my own except as specified in the references and acknowledgements, and the original work contained herein have not been undertaken or done by unspecified sources or person
iv

ABSTRACT
This report fundamentally discusses the preliminary research done and the basic
understanding of the topic chosen, which is comparison study for stuck pipe detection
method, current method and statistical method. Stuck pipe in the drilling industry
results in hundreds of millions of dollars wasted because of the extra cost to ftx the
problem and the time delay of the operation. The occurrence of stuck pipe consists of
drill pipe, casing, tubing and coiled tubing getting stuck downhole. Amongst the reason
why the pipe get stuck is because of mud sticking, sand sticking , key seat sticking, stuck
packers, crooked pipe and foreign object in hole. Technology at the moment allows
detection of stuck pipe through various method and the method which will be compared
to the statistical method for this study is where readings from pressure while drilling tools
are read in a flow pattern and then with the experience and the knowledge of the
engineer, he or she is will determine whether such occurrences will happen or not. The
scope of study for this project covers 3 important parts, literature review, data gathering
and analysis of data. The study begins with familiarizing with the theory behind the
statistical method, followed by case study of previous tested wells. The study then is
continued with familiarizing with the current method used and the gathering of data in
order to compare the efficiency of the statistical method with the current method. The
data obtained then will be use for the statistical method calculation and the results will
then be compared with the results given by the current method.
v

ACKNOWLEDGEMENT
Upon the completion of this dissertation, I would like to first thank Allah S.W.T for
giving me a second chance and the courage to continue on with this study after all that
has happen. Special thank goes to thoughtful my supervisor Mr. Elias Abllah, for his
patience and support throughout the completion of this study, along with his knowledge
and guidance on matters which I was not familiar with. I would like to thank both my
parents who have also been supportive. Without them, the time taken to complete this
study might take even longer. They have always been there to support me emotionally
and spiritually. My next thank goes to Mr. Rahimi Wahab and PCSB-DOMC Team.
Without their assistance I would definitely not be able to complete this study. They have
been very helpful during the process of acquiring the data and also during the analysis of
data. Finally, I would like to thank my friends and colleagues who have always been
there for me, cheering and supporting. I thank them all.
vi

TABLE OF CONTENTS
ABSTRACT.
ACKNOWLEDGEMENT .
CHAPTER l:INTRODUCTION
1.1 Project Background
1.2 Problem Statement
1.3 Objectives
1.4 Scope of Study
1.5 Relevancy of Study
1.6 Feasibility of the Project within the Scope and Time Frame
CHAPTER 2:LITERATURE REVIEW
v
vi
1
2
3
3
4
4
2.1 Bottom Hole Pressure and Torque 5
2.2 Fundamentals of Stuck Pipe . 5
2.3 Method ofWaming of Pipe Sticking During Drilling Operations 7
2.4 Pressure While Drilling System 14
2.5 Kumang F9-Al 16
CHAPTER 3:METHODOLOGY
3.1 Research Methodology
3.2 Project Activities
3.3 Gantt Chart
3.4 Statistical Method
CHAPTER 4: RESULT AND DISCUSSION.
CHAPTER 5: CONCLUSION
vii
17
17
18
19
20
43
REFERENCES
LIST OF FIGURES
Figure 1: F-values are calculated based on segments of length N
Figure 2: BHP signal and TRQ signal for well A
Figure 3: Diagnostics signal and warnings well A
Figure 4: SPP signal and TRQ signal for well B
Figure 5: Diagnostic signal and warnings well B
Figure 6: Borehole stability plot Statfjord
Figure 7: Kumang F9 location
Figure 8: Project activities
Figure 9: Graph of Diagnostic signal Run 500
Figure! 0: Diagnostic signals & warnings Run 500
Figure 11: Graph of Diagnostic signal Run 400
Figure 12: Diagnostic signals & warnings Run 400
Figure 13: ECD vs Depth roadmaps .
Figure 14: Diagnostic signal & warnings, Run 400 & Run 500
Figure 15: Drilling drag roadmap
LIST OF TABLES
Table 1: Gantt chart
Table 2: Run 500 stand pipe pressure, psi
Table 3: Run 500 torque, kN.m
Table 4: Run 500 Diagnostic signal, F
Table 5: Run 500 P, Rand Amax value
Table 6: Run 400 Diagnostic signal, F
Table 7: Run 400 P, Rand Amax value
APPENDIX •
viii
44
9
10
11
12
13
15
16
17
24
26
33
39
40
41
42
18
21
22
23
25
28
34
45

CHAPTER I
INTRODUCTION
1.1 Project Background:
The occurrences of stuck pipe in during drilling operation are highly unwanted. The
situation results in millions of dollars spent on freeing the pipe in order to resume the
operation. Worst comes to worst, the pipe and tools downhole needs to be abandon and a
new side-track well are required to be drilled. Stuck pipe occurrences consist of drill pipe,
casing, tubing and coiled tubing getting stuck down hole for many reasons. Amongst the
common reasons it happen are:
Sand Sticking - Can occur with tubing, drill pipe or casing. Sand Sticking occurs when
sands from a downhole sand zone leak into the well. When fluids does not circulate
properly, wall cakes breaks down, drilling into depleted sand zones the chances for sand
sticking increase.
Mechanical Sticking- There are several types of mechanical sticking such as:
o Stuck packers or other downhole assemblies
o Multiple strings (wrap around)- normally tubing
o Foreign object in hole
Key Seat Sticking - This occurs when different angles are present in a well. The pipe
working around a comer or dog leg will cause the pipe to wear a groove in the side of the
well bore.
Sloughing Sticking - This is a problem encountered in drilling through heaving shale or
other formations that have a tendency to break off and fall in the bore hole. The
formation lodges around tool joints, stabilizers or drill collars.
1
Differential Pressure Sticking- Pipe can get stuck in an open hole when the pipe string
comes in contact with a permeable formation of lesser pressure than the hydrostatic
pressure of the drilling fluid. In this situation, the differential pressure causes the pipe to
be held against the wall in the lower pressure zone.
Cement Sticking - Cementing may cause stuck pipe when there is a mechanical
malfunction, human error, a lost circulation problem or during cementing to contain a
blowout. Pipe can become stuck during cementing due to human or mechanical error.
Running the pipe into green cement is the most common issue that is encountered.
These types of stuck pipe can generally be divided into two groups, either stuck pipe that
happens because of the unstable formations underneath (differential) or stuck pipe that
happens because of mechanical failure.
1.2 Problem Statement:
In oil and gas industry, numerous amounts of tools and techniques have been developed
in order to solve this problem. Some developers tackle on the most efficient method or
technique or even tools to free the pipes once it happen while other developers head to
the prevention method. In this paper, I would be focusing on the preventive method
instead of the freeing the pipe after it has gotten stuck. Even though both are highly
important, it is believe that prevention is better than cure. The current technology uses
readings from Pressure While Drilling (PWD) tools to read the flow patterns of certain
data from onshore office and notifY the platform personnel of any problems which will
occur beforehand while the statistical method will be able to notifY without reading the
patterns but once the readings reaches a certain value, notification can be done and action
can be taken.
2
1.2.2 Significant of the Project:
The project will be a comparative study between the current method and the statistical
method to detect the occurrences of stuck pipe. The main idea of the project is to
measure the reliability of statistical method to detect such occurrences. It is also to
strengthen the already available detection method of stuck pipe.
1.3 Objective:
The objectives of the project is to come up with a comparative analysis of two different
method, the already available method which uses PWD tools data to detect irregularities
inside the borehole and determining whether an occurrence of stuck pipe will happen or
not with a statistical method way to detect the occurrence of stuck pipe through statistical
method which uses the bottom hole or standpipe pressure and surface torque to determine
such occurrences. At the end of this project, it will be determine whether the proposed
method (statistical method) can be further develop to provide and strengthen the
prevention methods available in regards to this problem.
1.4 Scope of Study:
The general scope of study for this comparative study is to understand what stuck pipe is,
the types and why it occurs. From then on, we focus on tbe already available method
which uses ECD, ESD and Drag to detect the occurrence of stuck pipe. The theories
behind the usage of the data will be studied. The next focus will be on the statistical
method, using BHP or SPP and TRQ as input for the detection of stuck pipe scheme.
There will be equations which will be discuss later in the report, which will be use to
detect the occurrence of stuck pipe.
3

1.5 Relevancy of Study:
This study is an early approach to the implementation of a method for the stuck pipe
occurrences. In Oil and Gas Industry at the moment, most tools and techniques are
developed in order to free the pipe instead of preventing it from happening. This study
will analyze the efficiency of early detection of stuck pipe using statistical method. This
project uses the information of wells in Malaysian region, which are mostly
unconsolidated sandstone formation, which will enable the method to be applied for
future usage when drilling in Malaysian region and also other formation which consists
of mostly sandstones.
1.6 Feasibility Study
The Gantt chart prepared serves of how this study evolves and move through the end of
project. Using actual field data, statistical method calculations were started in early May
and comparative studies on both methods are currently ongoing. It is expected to be done
in the middle of July.
4

CHAPTER2
LITERATURE REVIEW
2.1 Bottom Hole Pressure and Torque
Bottom Hole Pressure - Pressure which is usually measured in pound per square inch
(psi), at the bottom hole. This pressure may be calculated in a static, fluid-filled wellbore
with the equation
BHP = MW * Depth * 0.052
Where MW is the mud weight in pounds per gallon, depth is true vertical depth in feet
and 0.052 is the conversion factor if these units of measures are used.
Torque - The tendency of force to rotate an object (drill string) about an axis. Where
torque can be calculated with the equation
Torque= rF sin 8
Where r is the length or magnitude of the lever arm vector, F is the magnitude of the
force and 8 is the angle between the force vector and lever arm vector
2.2 Fundamentals of Stuck Pipe
In order to understand further about stuck pipe, below are the type of stuck pipe
occurrences.
Sand Sticking - Can occur with tubing, drill pipe or casing. Sand Sticking occurs when
sands from a downhole sand zone leak into the well. When fluids does not circulate
properly, wall cakes breaks down, drilling into depleted sand zones the chances for sand
sticking increase.
5

Mud Sticking - This type is generally encountered with tubing in a cased hole and also
occurs with drill pipe and casing. Mud stuck tubing occurs when well fluids on the back
side of the pipe strings settles out. The settling causes the fluids to become thick and
heavy which limits the pipes ability to move.
Mechanical Sticking- There are several types of mechanical sticking such as:
o Stuck packers or other downhole assemblies
o Multiple strings (wrap around)- normally tubing
o Foreign object in hole
Key Seat Sticking - This occurs when different angles are present in a well. The pipe
working around a comer or dog leg will cause the pipe to wear a groove in the side of the
well bore. Often this condition allows the pipe to travel a short distance to the next upset
in the pipe. The upset is generally larger than the groove that is worn into the well bore
and does not allow tool joint to pass.
Sloughing Hole Sticking - This is a problem encountered in drilling through heaving
shale or other formations that have a tendency to break off and fall in the bore hole. The
formation lodges around tool joints, stabilizers or drill collars.
Differential Pressure Sticking- Pipe can get stuck in an open hole when the pipe string
comes in contact with a permeable formation of lesser pressure than the hydrostatic
pressure of the drilling fluid. In this situation, the differential pressure causes the pipe to
be held against the wall in the lower pressure zone.
Lost Circulation Sticking - This is an occurrence that normally react to hole sloughing
or well blowouts. This sticking is caused when drilling into a depleted or lesser zone that
breaks down when exposed to higher hydrostatic pressures. The loss of circulation does
not allow the cuttings and sands to be circulated out of the hole. This causes the cuttings
to pile up around the downhole assembly sticking the pipe.
6
The type of pipe stuck can be generally divided into two groups which are differential
sticking and mechanical sticking as mention in the introduction. In order to fully utilize
this application, data for wells drilled in the Malaysian region will be required. The data
will be computed using multivariate statistical analysis to compute the type of stuck pipe
which will occur.
2.3 Method of warning of Pipe Sticking During Drilling Operations
This is the statistical method which will be included in the comparative study. This
method uses these steps to detect possible stuck pipe occurrences. The method of warning
of the onset of pipe sticking in a rotary drilling operation using a drill string compromises
of:
a) Monitoring the pressure of a drilling fluid being pumped through the drill string
during drilling over predetermined periods of time to obtain series of pressure
measurements
b) Monitoring the torque required to rotate the drill string during said periods to
obtain series of torque measurements
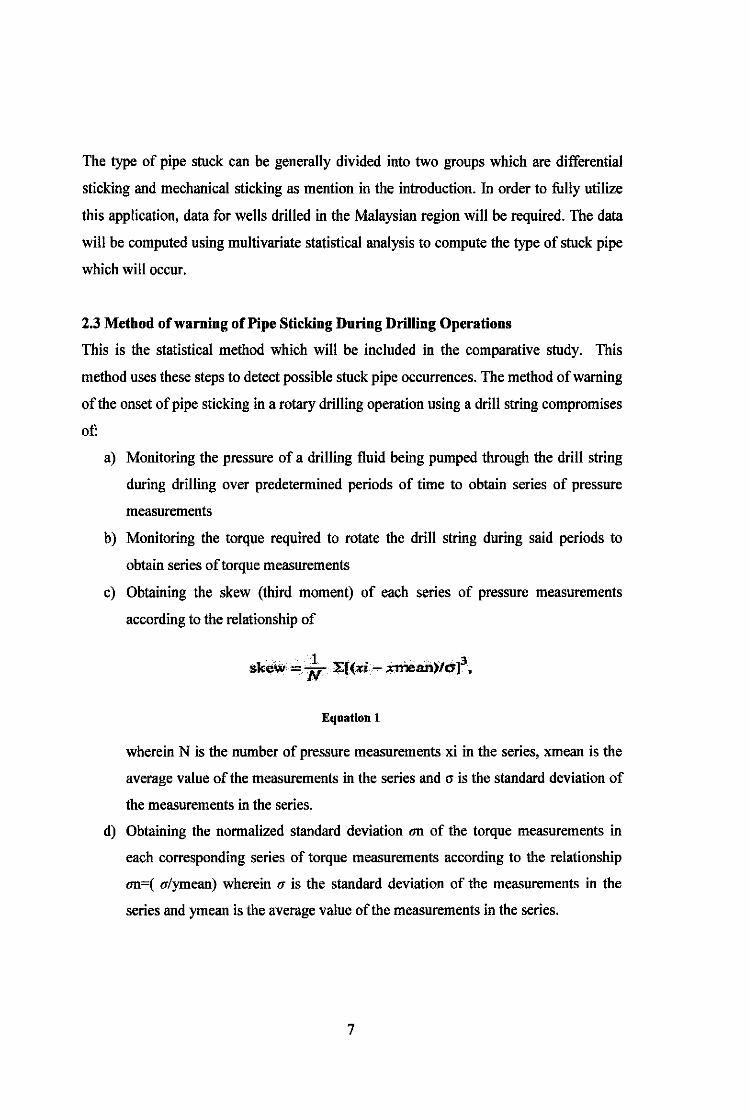
c) Obtaining the skew (third moment) of each series of pressure measurements
according to the relationship of
Equation 1
wherein N is the number of pressure measurements xi in the series, xmean is the
average value of the measurements in the series and cr is the standard deviation of
the measurements in the series.
d) Obtaining the normalized standard deviation on of the torque measurements in
each corresponding series of torque measurements according to the relationship
on=( u/ymean) wherein a is the standard deviation of the measurements in the
series and ymean is the average value of the measurements in the series.
7
e) Comparing skew and an for the series so as to identity corresponding changes in
both and raising an alarm when the magnitude of said changes pass predetermined
alarm values.
The theory behind the method is using the measured or modeled bottom hole pressure
and the surface torque as input to the detection of occurrence. If in any case that the
bottom hole pressure is unavailable, standpipe pressure signal must be use as a
replacement.
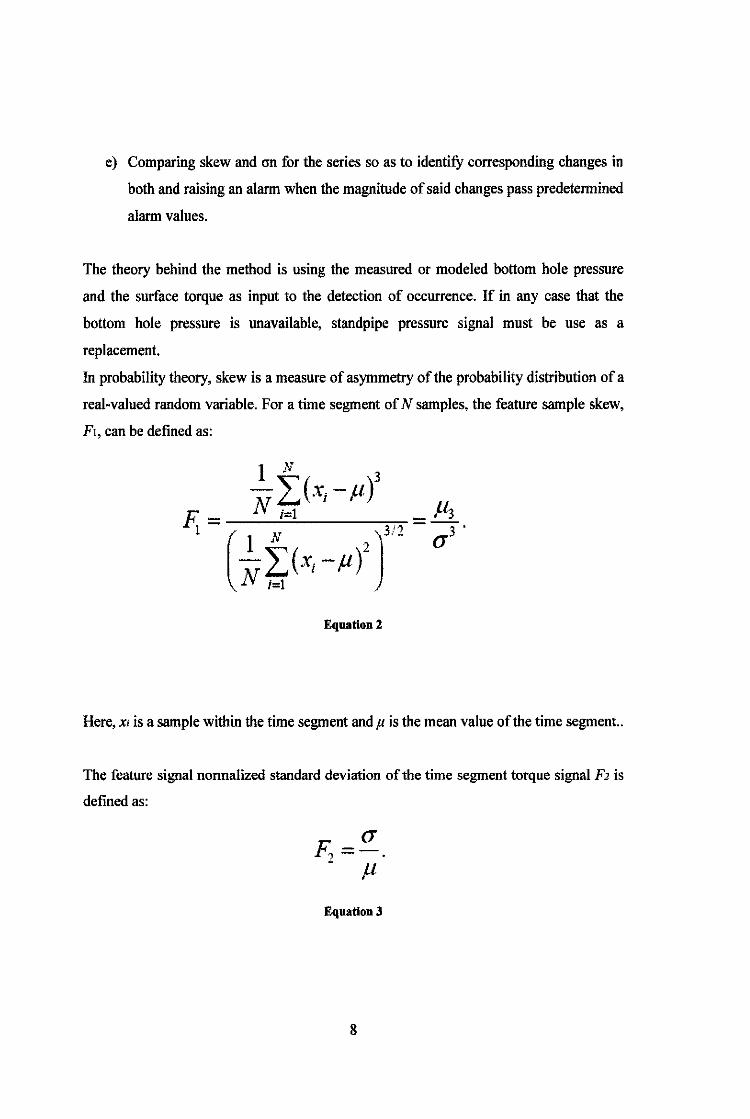
In probability theory, skew is a measure of asymmetry of the probability distribution of a
real-valued random variable. For a time segment of N samples, the feature sample skew,
F1, can be defined as:
Equation2
Here, x; is a sample within the time segment and p is the mean value of the time segment..
The feature signal normalized standard deviation of the time segment torque signal F2 is
defined as:
(1 F,=-.
- p
Equation3
8
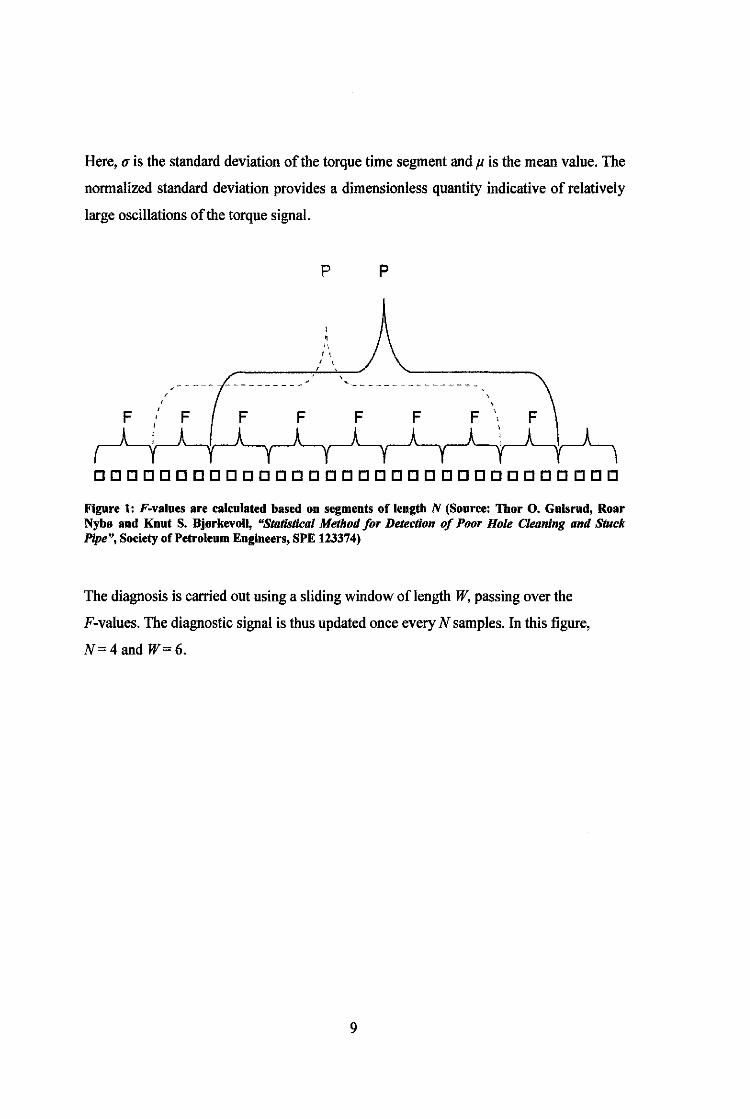
Here, u is the standard deviation of the torque time segment and fJ is the mean value. The
normalized standard deviation provides a dimensionless quantity indicative of relatively
large oscillations of the torque signal.
' '
p p
I , ,,, '' ' '
' '
DDDDDDDDDDDDDDDDDDDDDDDDDDDDDDDD
Figure 1: F-values are calculated based on segments of length N (Source: Thor 0. Gulsrud, Roar Nybo and Knut S. Bjorkevoll, "Statistical Method for Detection of Poor Hole Cleaning and Stuck Pipe", Society of Petroleum Engineers, SPE 123374)
The diagnosis is carried out using a sliding window of length W, passing over the
F-values. The diagnostic signal is thus updated once every N samples. In this figure,
N=4and W=6.
9
Case Study
The statistical method were tested with data from two different wells before, all two wells
are drilled in the North Sea area.
Well A
390
ii; CD C"j
::; U) U)
~ a.
360 0 2
30
E 20 z .><!
c.> ::J r:7 10 0 ....
2
Calculated Bottom Hole Pressure
6 Hours
Measured Torque
6 Hours
8
8
10 12
10 12
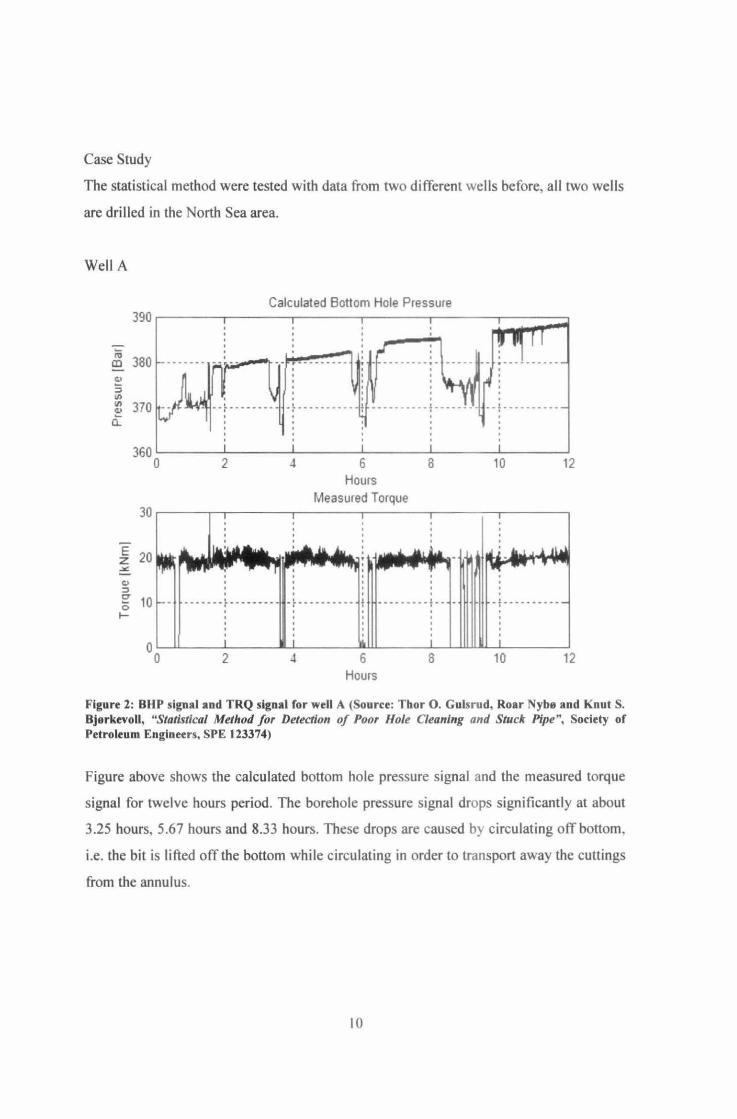
Figure 2: BHP signal and TRQ signal for well A (Source: Thor 0 . Gulsrud, Roar Nybe and Knut S. Bjerkevoll, "Statistical Method for Detection of Poor Hole Cleaning and Stuck Pipe", Society of Petroleum Engineers, SPE 123374)
Figure above shows the calculated bottom hole pressure signal and the measured torque
signal for twelve hours period. The borehole pressure signal drops significantly at about
3.25 hours, 5.67 hours and 8.33 hours. These drops are caused by circulating off bottom,
i.e. the bit is li fted off the bottom while circulating in order to transport away the cuttings
from the annulus.
10
"?.i c co: ..., J1 ,_, v; 0 c: 0)
!tl
0
Otagnosttcs and wamtngs 1 5 -----------~-----------~-----------;---------------- ------------------
0 5
0
-0 5
-1
' '
2
' ' .... ..... .......... , ... I . I i • I . I :-- ~-
' ' I I I I I ............... ...... ·r ·-· ................. , ........ ............... , ......... ... .......... ' ..... ............. .... ,
6 Hours
8 10 12
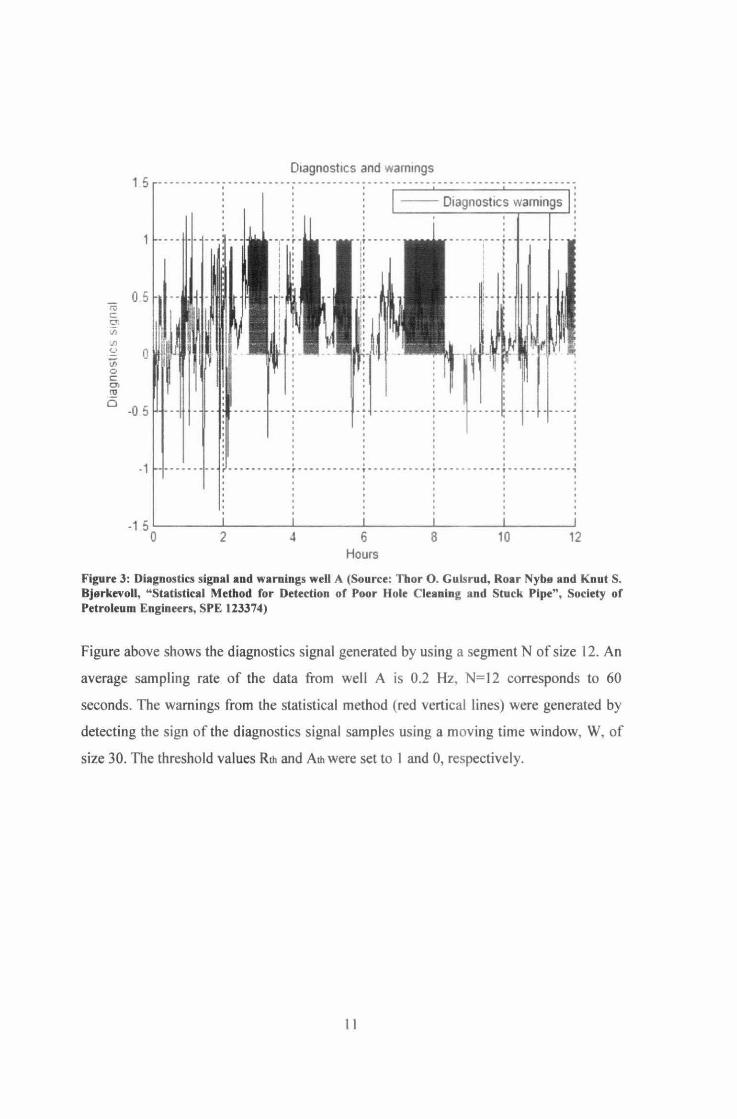
Figure 3: Diagnostics signal and warnings weU A (Source: Thor 0 . Gulsrud, Roar Nybs and Knut S. Bjsrkevoll, "Statistical Method for Detection of Poor Hole Cleaning and Stuck Pipe", Society of Petroleum Engineers, SPE 123374)
Figure above shows the diagnostics signal generated by using a segment N of size 12. An
average sampling rate of the data from well A is 0.2 Hz, N=l2 corresponds to 60
seconds. The warnings from the statistical method (red vertical lines) were generated by
detecting the sign of the diagnostics signal samples using a moving time window, W, of
size 30. The threshold values Rth and Ath were set to I and 0, respectively.
II
Well B
300
'-n:l 200 CD - ... ~ ::I U) U) 100 - -~
a_
0 0 5 10
Measured Stand P1pe Pressure
15
~ ---'"'
~; '
' . ' it. ' ; ;
20 25 30 Hours
Measured Torque
·] ·1 -' ' . .... --, -
; 35
: ' ' - · rt ~
·r - --' '
' ' "i - --
' ; -lO -l5 50
20 ~--~--~--~--~~--~--~--~--~~--~~ ~ ~ ~ ~ ~ ~ I I t t I I I I
15 I I t I I I I
~ ------ , ------ , ---·-• •r·-----r· ----- ~- ---,------ ~-------~------ ~ ------
: 10 t1 · ... , , : ...... 1.J ~ ·~ ~11"'~L .. llLl~k .. .il~~ MIM.:w· t~~MIMIM~! - -::~ • rw ~ '
~ 5 ... . -- .... '"' ' i
10 15 20 25 Hours
30
' ---.) -
i 3-!:
- --
~0 45 50
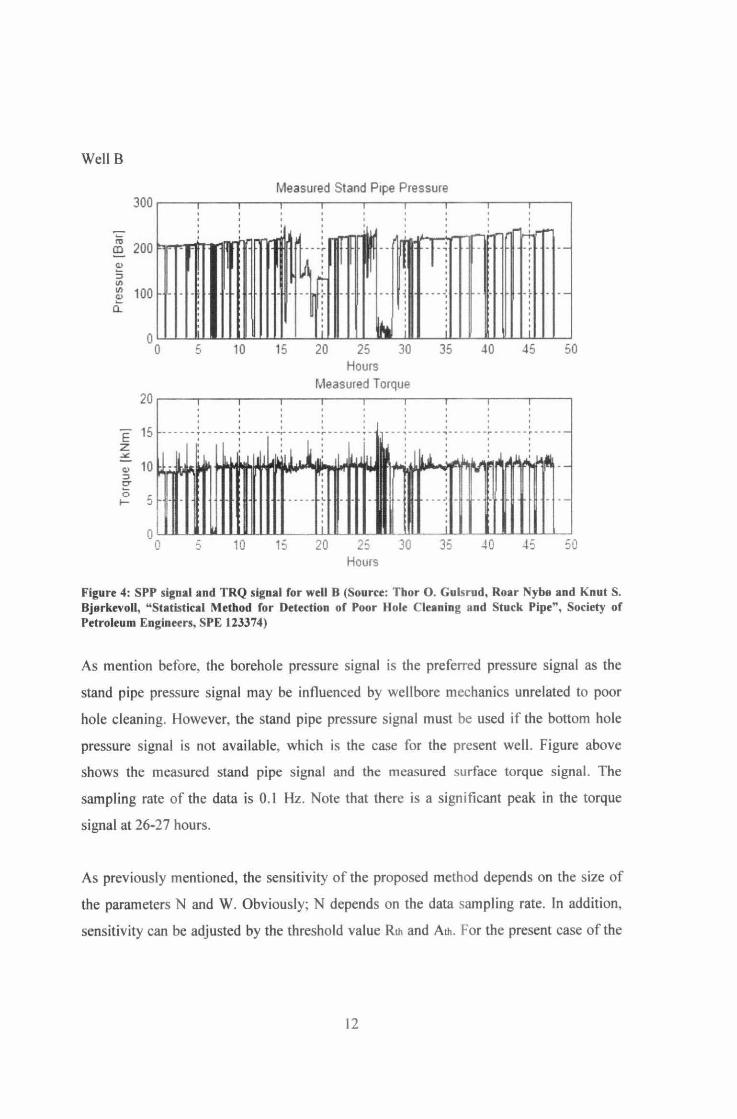
Figure 4: SPP signal and TRQ signal for well B (Source: Thor 0. Gulsrud, Roar Nybe and Knut S. Bjerkevoll, "Statistical Method for Detection of Poor Hole Cleaning and Stuck Pipe", Society of Petroleum Engineers, SPE 123374)
As mention before, the borehole pressure signal is the preferred pressure signal as the
stand pipe pressure signal may be influenced by wellbore mechanics unrelated to poor
hole cleaning. However, the stand pipe pressure signal must be used if the bottom hole
pressure signal is not available, which is the case for the present welL Figure above
shows the measured stand pipe signal and the measured surface torque signaL The
sampling rate of the data is 0.1 Hz. Note that there is a significant peak in the torque
signal at 26-27 hours.
As previously mentioned, the sensitivity of the proposed method depends on the size of
the parameters N and W. Obviously; N depends on the data sampling rate. In addition,
sensitivity can be adjusted by the threshold value Rth and Ath. For the present case of the
12

sensitivity parameters were found by trial-and-error and knowledge about the
approximate position of the poor hole cleaning and stuck pipe incidents.
10 c:: !2l !/)
!/)
u v; 0 c:: Ol 10
0
1 5
1
0 5
-0 5
-1
01agnost1cs and warnings ----- --- -- ----------- ------ -- -------------------------------------- ----1 I I I
' '
' ' ' ........ , ............ ., ... ... '
-----~·-'
I
·- ···--"-1 ' I
0 I
I I I I I f I ...... , .......... , ............. , ... -----r···--- , ·-·---,- ----~--
5 10 15
1 I
20
I
25 Hours
30 35
' ' ' ·---r-···-- r--- --- , I I 0
'
~ ------ ~ ------" I I 0 I 0
' I ' ' ·-··r······r··· -- -, I 0
40 .t5 50
Figure 5: Diagnostic signal and warnings well B (Source: Tbor 0. Gulsrud, Roar Nybe and Knot S. Bjerkevoll, "Statistical Method for Detection of Poor Hole Cleaning and Stuck Pipe", Society of Petroleum Engineers, SPE 123374)
In figure above, the diagnostics signal and the generated warnings are shown. The size of
the time segment N is twelve. The size of the moving time window is W=8. The
threshold value Rlh and Ath is 0.85 and 0.2 respectively, i.e. more than 85% of the
diagnostics samples within W have to be positive and the maximum value of the samples
has to be greater than 0.2 in order to raise a warning.
13
2.4 Pressure While Drilling System
Pressure while drilling (PWD) is a branch of measurement while drilling which uses
more advanced tools. PWD is a better approach to optimize well construction of
advanced wells for example, underbalanced drilling, extended wells, high angle wells, to
name a few. PWD system is equipped with tools which can read the downhole pressure,
Equivalent Circulating Density (ECD) monitoring and the detection of gas influxes which
will lead to better drilling efficiency. PWD application has allowed improvement on
drilling performance of Statfjord wells.
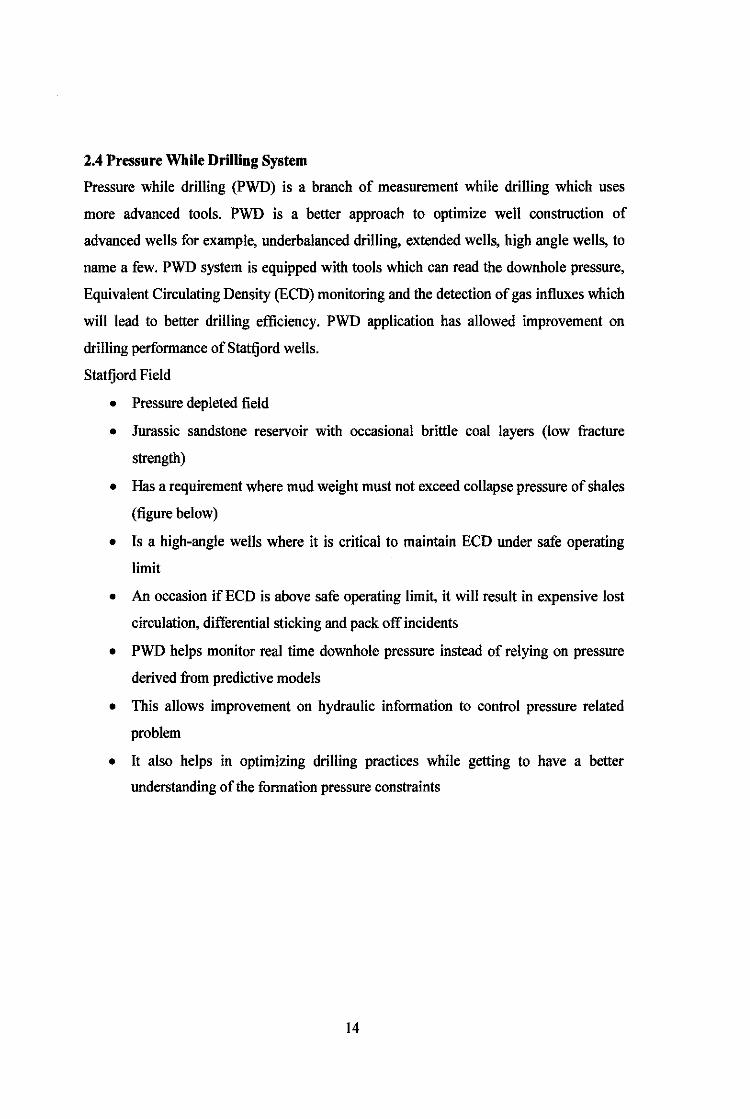
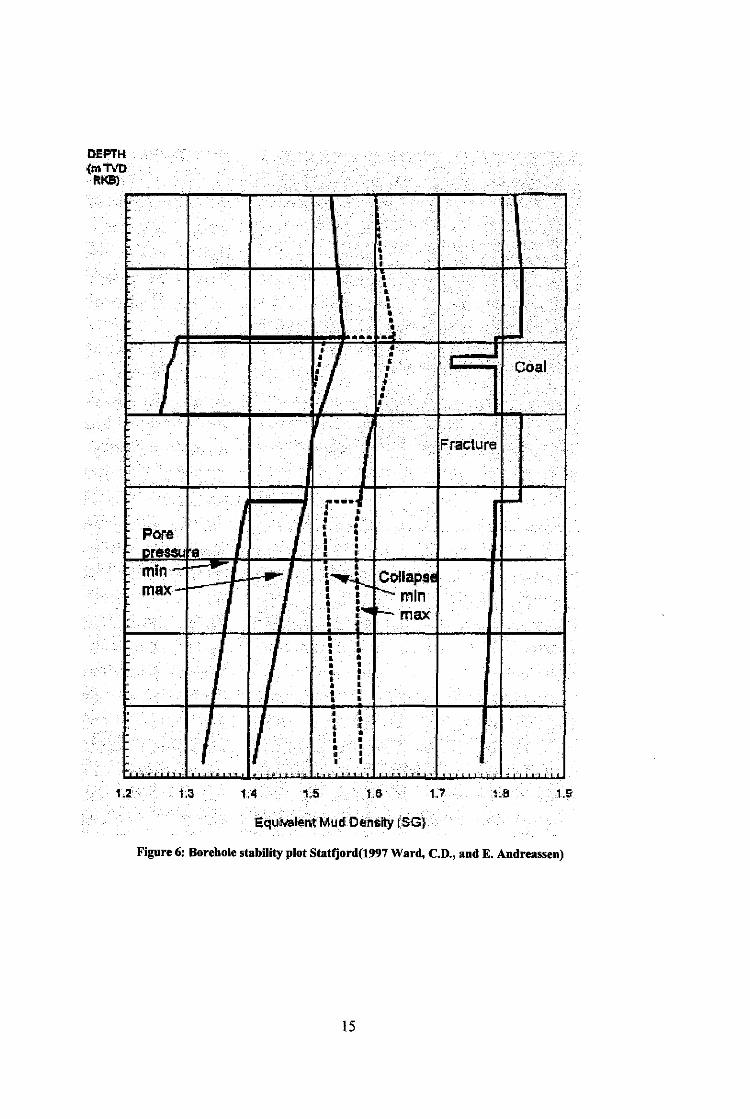
Statfjord Field
• Pressure depleted field
• Jurassic sandstone reservoir with occasional brittle coal layers (low fracture
strength)
• Has a requirement where mud weight must not exceed collapse pressure of shales
(figure below)
• Is a high-angle wells where it is critical to maintain ECD under safe operating
limit
• An occasion if ECD is above safe operating limit, it will result in expensive lost
circulation, differential sticking and pack off incidents
• PWD helps monitor real time downhole pressure instead of relying on pressure
derived from predictive models
• This allows improvement on hydraulic information to control pressure related
problem
• It also helps in optimizing drilling practices while getting to have a better
understanding of the formation pressure constraints
14
DEPTH (m1VD
fi:KEI)
.
. 1 I
J
Pore · oressu a
min-max-
-
-
1.:3
.
j .
.
I • • ,, I~ •• • • • • •
••• . l .. Lo..
fl • I • • Coal • I • • • I
II
Fracture
I
r·•·1 1-I l I 0
. I t . .. ' ;
• • I t l I
--- I • . ~~~ Collapse
• t .__min I • • . : ... J-. max l j • ; .. • • • • • • •. ,, I I
• • ' • • • • ' I • • , . I • I • • I
• I I I
'""' . '
1.4 1.5 1.6 1.7 U1
Equlola~l\t Mud Density rsG}
Figure 6: Borehole stability plot Statfjord(1997 Ward, C.D., and E. Andreassen)
15
2.5 Kumang F9-Al
'b nr 1 .,
r ;l lt .. l llOitAA. ~ ......
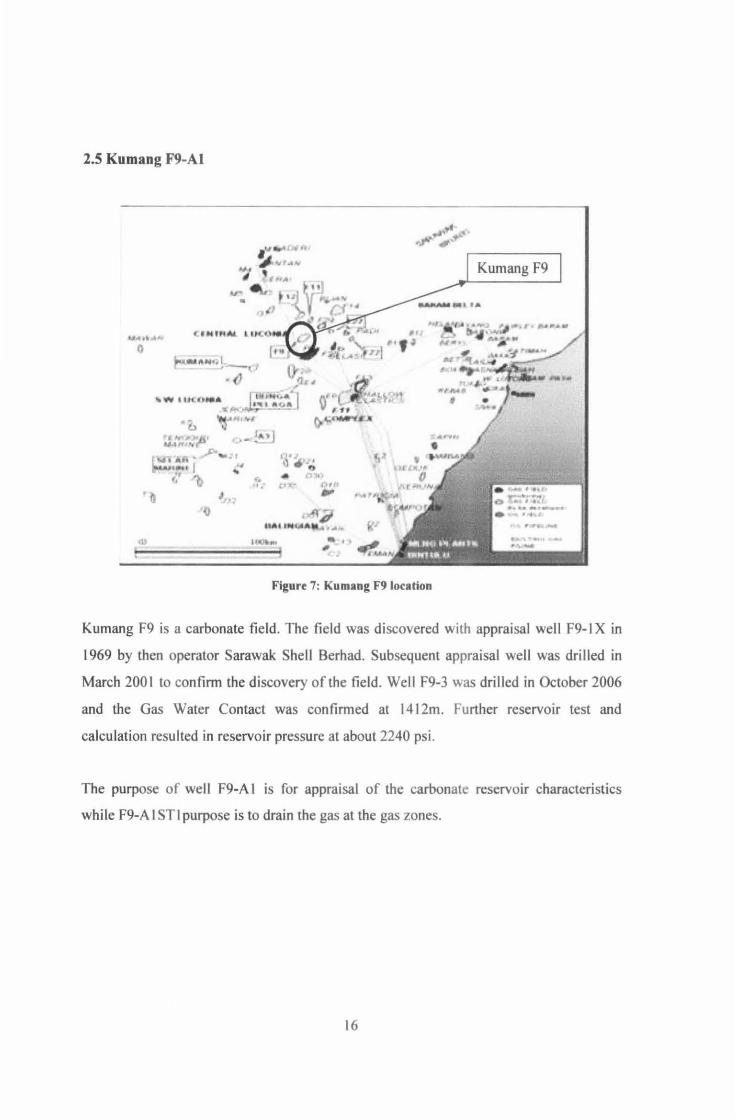
Figure 7: Kumang F9 location
Kumang F9
Kumang F9 is a carbonate field. The field was discovered with appraisal well F9-1 X in
1969 by then operator Sarawak Shell Berhad. Subsequent appraisal well was drilled in
March 200 I to confirm the discovery of the field. Well F9-3 was drilled in October 2006
and the Gas Water Contact was confirmed at 1412m. Further reservoir test and
calculation resulted in reservoir pressure at about 2240 psi.
The purpose of well F9-A I is for appraisal of the carbonate reservoir characteristics
while F9-A I ST I purpose is to drain the gas at the gas zones.
16
CHAPTER3
METHODOLOGY
3.1 Research Methodology
In order to achieve the aim of the project, studies had been done on several resources
from books, technical papers and internet. For the first step, gathering information needs
to be done on the Stuck Pipe: Types, Causes and Preventions and also for the available
methods of early detection of stuck pipe. Further analysis on PWD tools had also been
done in order to come up with comparative analysis of the statistical method and the
current method. For example, the theory behind the usage ofECD and drag to predict the
occurrence of stuck pipe.
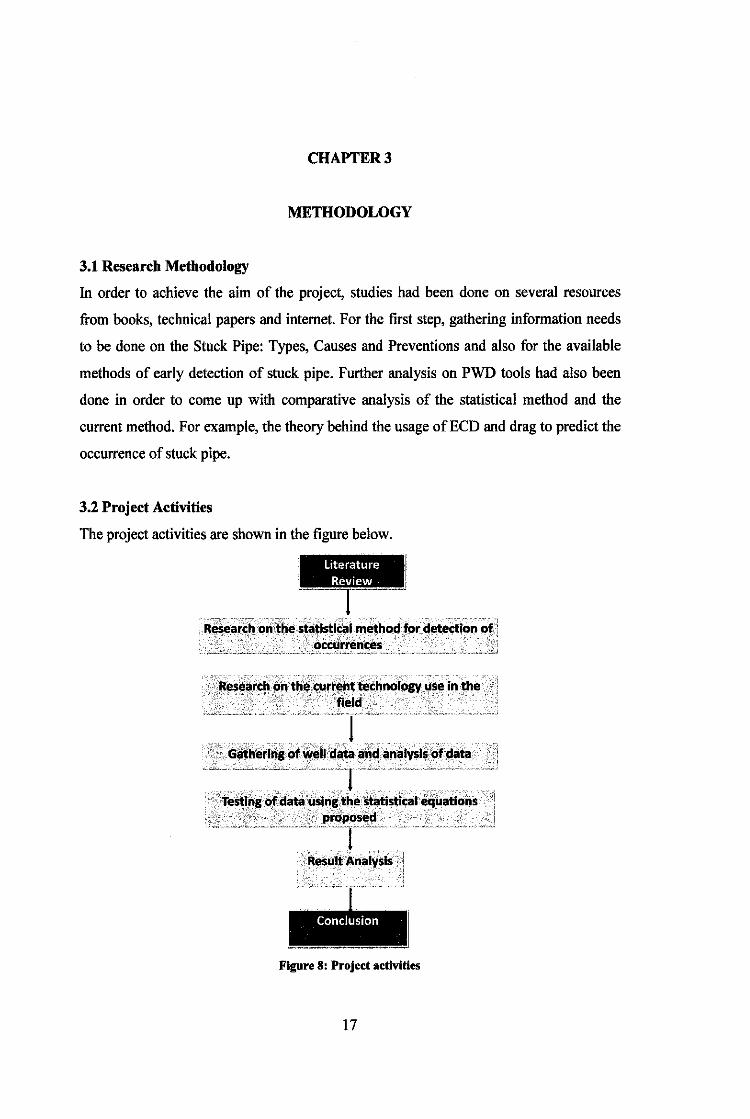
3.2 Project Activities
The project activities are shown in the figure below.
Literature Review
Research on the statistical method for detection of ~occurrenc.es
. ·-·~~-········-········ ··r ·····~·
Gatherirlll of well data a!id analysis of data . ~- ' -- -
.~ ....... ~ ..... ~ .... ···~·· ...... ~C.-r ~ ... , ...................... . Testing of data O..sing the Statistical equations
• :/ .• · ... ·•. : c •..... ••· .. · · ·· proposed ... ~·····~·······~ ···-··r~ •• Result AnalYsis
Conclusion
Figure 8: Project activities
17
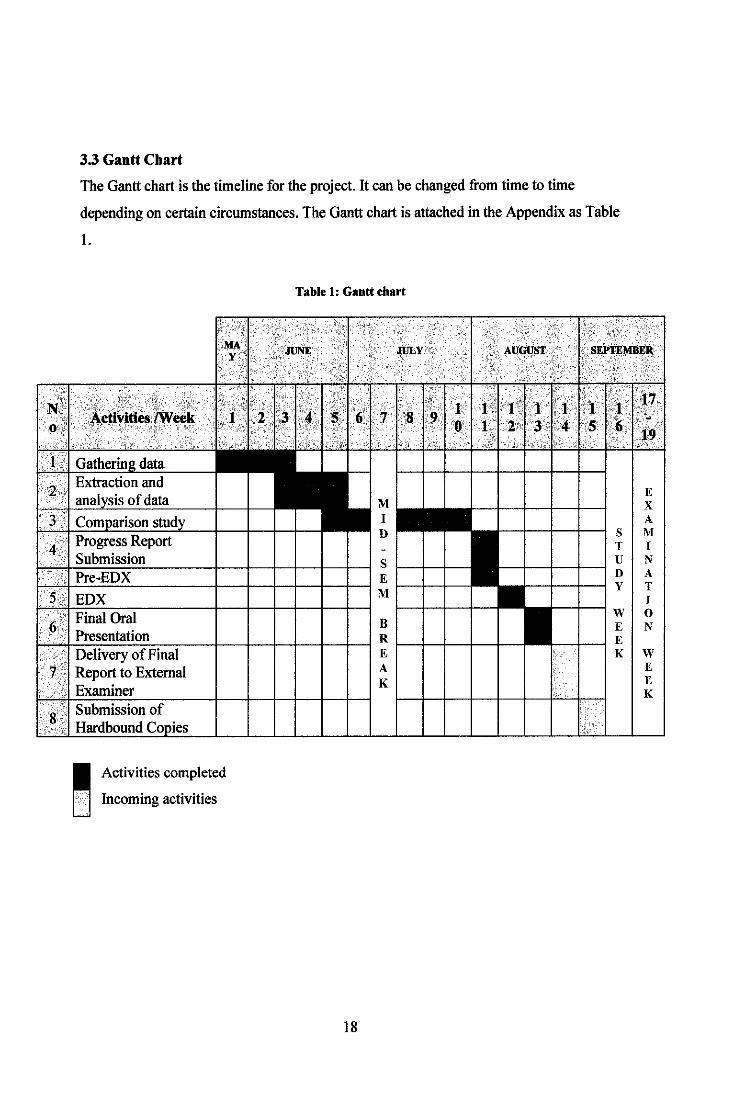
3.3 Gantt Chart
The Gantt chart is the time line for the project. It can be changed from time to time
depending on certain circumstances. The Gantt chart is attached in the Appendix as Table
I.
Extraction and of data
Presentation Delivery of Final Report to External
I Activities completed
D Incoming activities
Table l: Gantt chart
s T
s u E D
M y
w B E R E E K A K
18
E X A M I N A T I 0 N
w E E K
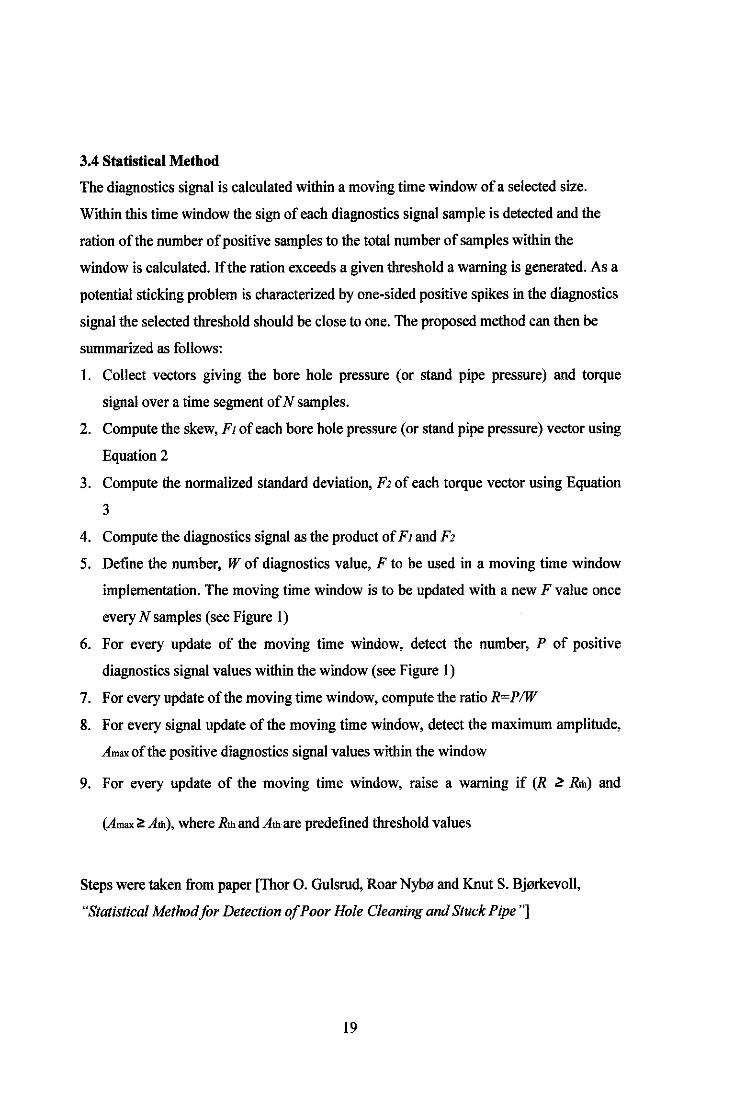
3.4 Statistical Method
The diagnostics signal is calculated within a moving time window of a selected size.
Within this time window the sign of each diagnostics signal sample is detected and the
ration of the number of positive samples to the total number of samples within the
window is calculated. If the ration exceeds a given threshold a warning is generated. As a
potential sticking problem is characterized by one-sided positive spikes in the diagnostics
signal the selected threshold should be close to one. The proposed method can then be
summarized as follows:
1. Collect vectors giving the bore hole pressure (or stand pipe pressure) and torque
signal over a time segment of N samples.
2. Compute the skew, F1 of each bore hole pressure (or stand pipe pressure) vector using
Equation 2
3. Compute the normalized standard deviation, F2 of each torque vector using Equation
3
4. Compute the diagnostics signal as the product of F1 and F2
5. Defme the number, W of diagnostics value, F to be used in a moving time window
implementation. The moving time window is to be updated with a new F value once
every N samples (see Figure 1)
6. For every update of the moving time window, detect the number, P of positive
diagnostics signal values within the window (see Figure 1)
7. For every update of the moving time window, compute the ratio R=PIW
8. For every signal update of the moving time window, detect the maximum amplitude,
Amax of the positive diagnostics signal values within the window
9. For every update of the moving time window, raise a warning if (R ~ Rth) and
(A max ~ Ath ), where Rth and Ath are predefined threshold values
Steps were taken from paper [Thor 0. Gulsrud, Roar Nyb0 and Knut S. Bj0rkevoll,
"Statistical Method for Detection of Poor Hole Cleaning and Stuck Pipe"]
19
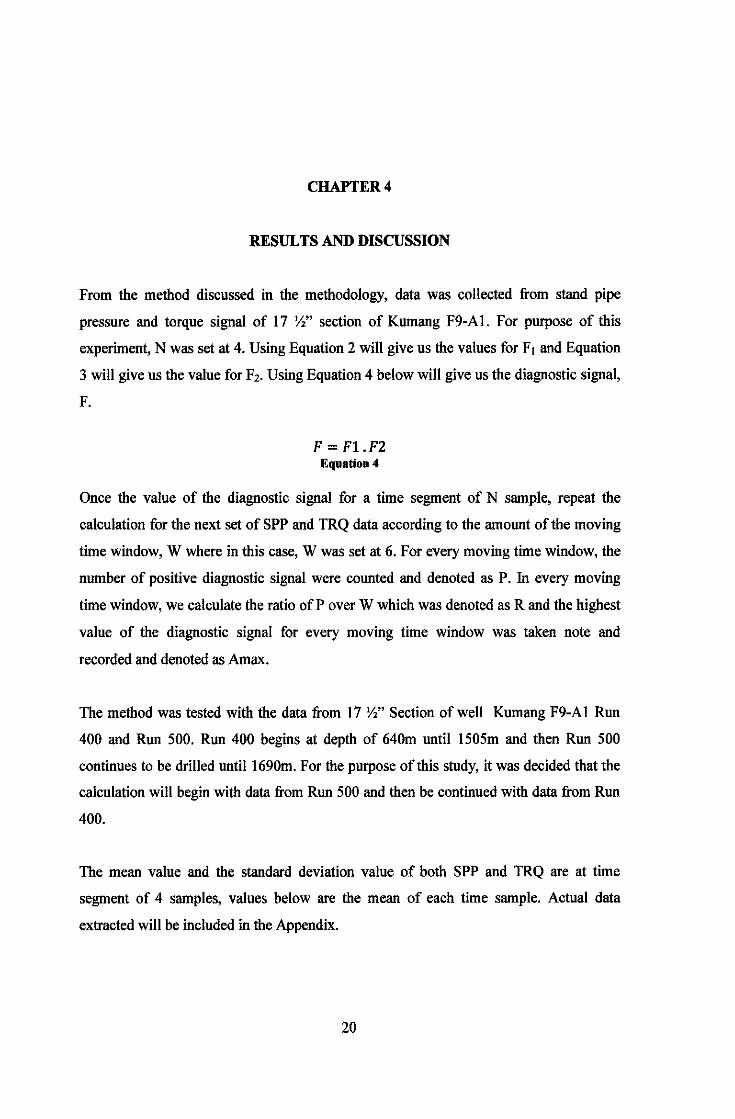
CHAPTER4
RESULTS AND DISCUSSION
From the method discussed in the methodology, data was collected from stand pipe
pressure and torque signal of 17 Yz" section of Kumang F9-Al. For purpose of this
experiment, N was set at 4. Using Equation 2 will give us the values for F 1 and Equation
3 will give us the value for F2• Using Equation 4 below will give us the diagnostic signal,
F.
F = F1.F2 Equation4
Once the value of the diagnostic signal for a time segment of N sample, repeat the
calculation for the next set of SPP and TRQ data according to the amount of the moving
time window, W where in this case, W was set at 6. For every moving time window, the
number of positive diagnostic signal were counted and denoted as P. In every moving
time window, we calculate the ratio of P over W which was denoted as R and the highest
value of the diagnostic signal for every moving time window was taken note and
recorded and denoted as Amax.
The method was tested with the data from 17 W' Section of well Kumang F9-A1 Run
400 and Run 500. Run 400 begins at depth of 640m until 1505m and then Run 500
continues to be drilled until 1690m. For the purpose of this study, it was decided that the
calculation will begin with data from Run 500 and then be continued with data from Run
400.
The mean value and the standard deviation value of both SPP and TRQ are at time
segment of 4 samples, values below are the mean of each time sample. Actual data
extracted will be included in the Appendix.
20
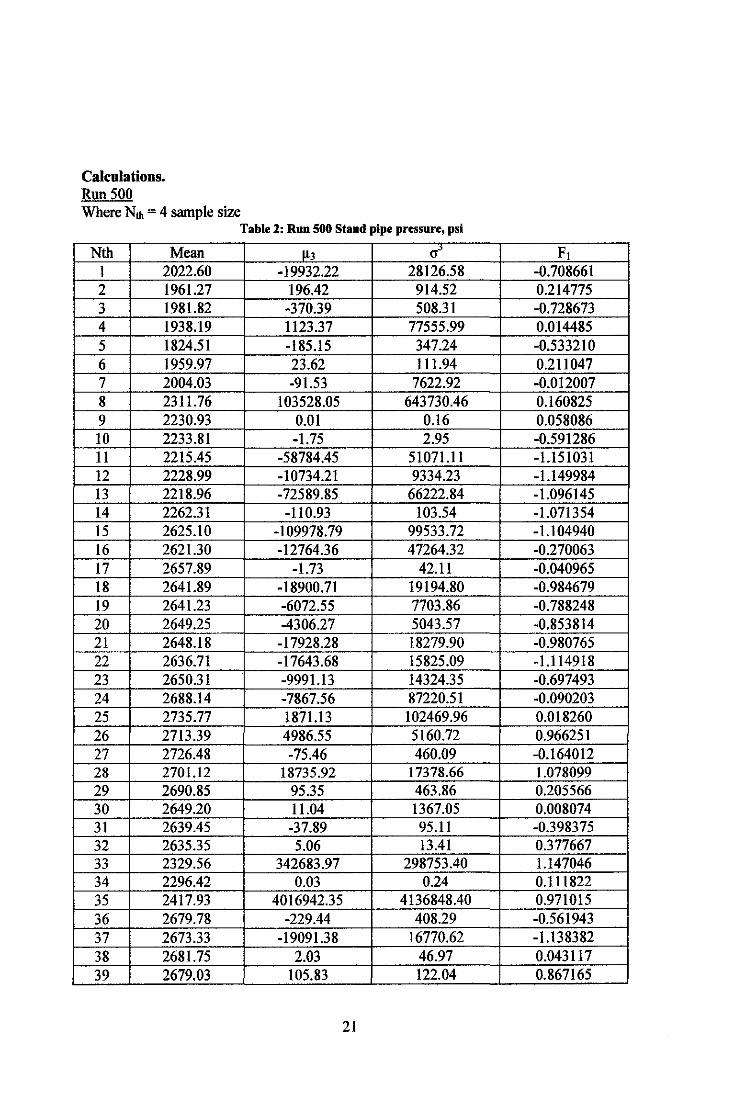
Calculations. Run 500 Where Nth = 4 sample size
Table 2: Run 500 Stand pipe pressure, psi
Nth Mean 113 a' 1 2022.60 -19932.22 28126.58 2 1961.27 196.42 914.52 3 1981.82 -370.39 508.31 4 1938.19 1123.37 77555.99 5 1824.51 -185.15 347.24 6 1959.97 23.62 111.94 7 2004.03 -91.53 7622.92 8 2311.76 103528.05 643730.46 9 2230.93 0.01 0.16 10 2233.81 -1.75 2.95 11 2215.45 -58784.45 51071.11 12 2228.99 -10734.21 9334.23 13 2218.96 -72589.85 66222.84 14 2262.31 -110.93 103.54 15 2625.10 -109978.79 99533.72 16 2621.30 -12764.36 47264.32 17 2657.89 -1.73 42.11 18 2641.89 -18900.71 19194.80 19 2641.23 -6072.55 7703.86 20 2649.25 -4306.27 5043.57 21 2648.18 -17928.28 18279.90 22 2636.71 -17643.68 15825.09 23 2650.31 -9991.13 14324.35 24 2688.14 -7867.56 87220.51 25 2735.77 1871.13 102469.96 26 2713.39 4986.55 5160.72 27 2726.48 -75.46 460.09 28 2701.12 18735.92 17378.66 29 2690.85 95.35 463.86 30 2649.20 11.04 1367.05 31 2639.45 -37.89 95.11 32 2635.35 5.06 13.41 33 2329.56 342683.97 298753.40 34 2296.42 0.03 0.24 35 2417.93 4016942.35 4136848.40 36 2679.78 -229.44 408.29 37 2673.33 -19091.38 16770.62 38 2681.75 2.03 46.97 39 2679.03 105.83 122.04
21
F1 -0.708661 0.214775 -0.728673 0.014485 -0.533210 0.211047 -0.012007 0.160825 0.058086 -0.591286 -1.151031 -1.149984 -1.096145 -1.071354 -1.104940 -0.270063 -0.040965 -0.984679 -0.788248 -0.853814 -0.980765 -1.114918 -0.697493 -0.090203 0.018260 0.966251 -0.164012 1.078099 0.205566 0.008074 -0.398375 0.377667 1.147046 0.111822 0.971015 -0.561943 -1.138382 0.043117 0.867165
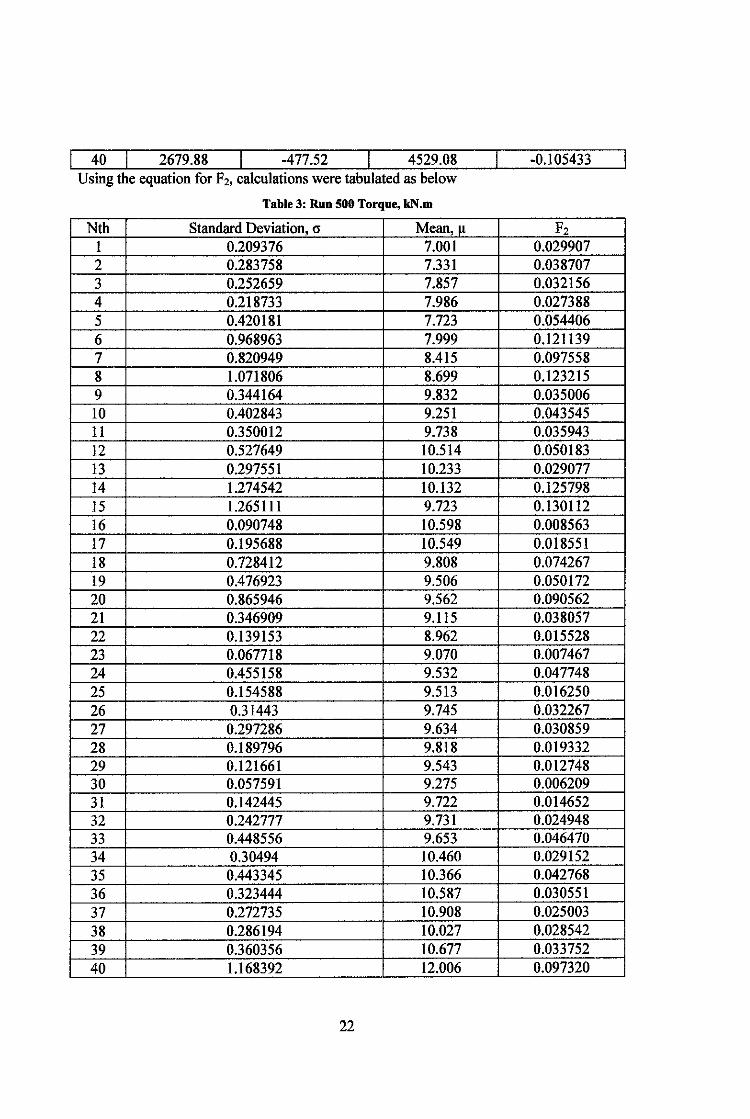
40 2679.88 -477.52 4529.08 Using the equation for F2, calculations were tabulated as below
Table 3: Run 500 Torque, kN.m
Nth Standard Deviation, cs Mean,~
1 0.209376 7.001 2 0.283758 7.331 3 0.252659 7.857 4 0.218733 7.986 5 0.420181 7.723 6 0.968963 7.999 7 0.820949 8.415 8 1.071806 8.699 9 0.344164 9.832 10 0.402843 9.251 11 0.350012 9.738 12 0.527649 10.514 13 0.297551 10.233 14 1.274542 10.132 15 1.265111 9.723 16 0.090748 10.598 17 0.195688 10.549 18 0.728412 9.808 19 0.476923 9.506 20 0.865946 9.562 21 0.346909 9.115 22 0.139153 8.962 23 0.067718 9.070 24 0.455158 9.532 25 0.154588 9.513 26 0.31443 9.745 27 0.297286 9.634 28 0.189796 9.818 29 0.121661 9.543 30 0.057591 9.275 31 0.142445 9.722 32 0.242777 9.731 33 0.448556 9.653 34 0.30494 10.460 35 0.443345 10.366 36 0.323444 10.587 37 0.272735 10.908 38 0.286194 10.027 39 0.360356 10.677 40 1.168392 12.006
22
-0.105433
F2 0.029907 0.038707 0.032156 0.027388 0.054406 0.121139 0.097558 0.123215 0.035006 0.043545 0.035943 0.050183 0.029077 0.125798 0.130112 0.008563 0.018551 0.074267 0.050172 0.090562 0.038057 0.015528 0.007467 0.047748 0.016250 0.032267 0.030859 0.019332 0.012748 0.006209 0.014652 0.024948 0.046470 0.029152 0.042768 0.030551 0.025003 0.028542 0.033752 0.097320
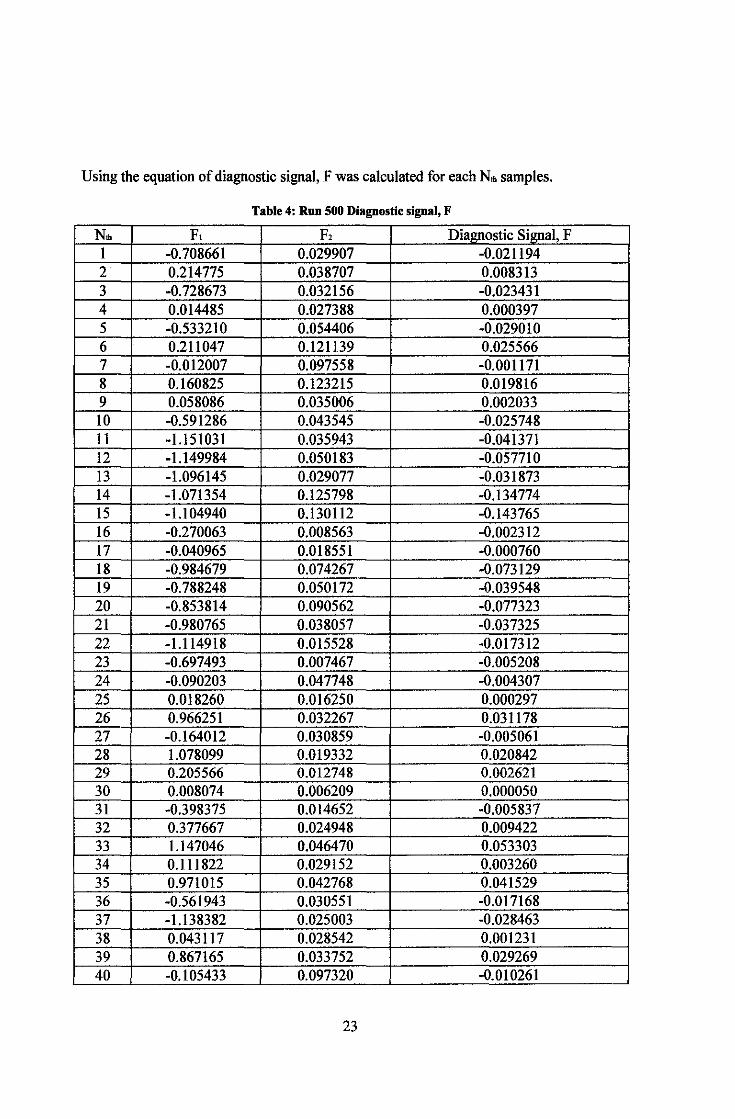
Using the equation of diagnostic signal, F was calculated for each Nlli samples,
Table 4: Run 500 Diagnostic signal, F
Nlli F1 p, Diagnostic Signal, F I -0.708661 0.029907 -0.021194 2 0.214775 0.038707 0.008313 3 -0.728673 0.032156 -0.023431 4 0.014485 0.027388 0.000397 5 -0.533210 0.054406 -0.029010 6 0.211047 0.121139 0.025566 7 -0.012007 0.097558 -0.001171 8 0.160825 0.123215 0.019816 9 0.058086 0.035006 0.002033 10 -0.591286 0.043545 -0.025748 11 -1.151031 0.035943 -0.041371 12 -1.149984 0.050183 -0.057710 13 -1.096145 0.029077 -0.031873 14 -1.071354 0.125798 -0.134774 15 -1.104940 0.130112 -0.143765 16 -0.270063 0.008563 -0.002312 17 -0.040965 0.018551 -0.000760 18 -0.984679 0.074267 -0.073129 19 -0.788248 0.050172 -0.039548 20 -0.853814 0.090562 -0.077323 21 -0.980765 0.038057 -0.037325 22 -1.114918 0.015528 -0.017312 23 -0.697493 0.007467 -0.005208 24 -0.090203 0.047748 -0.004307 25 0.018260 0.016250 0.000297 26 0.966251 0.032267 0.031178 27 -0.164012 0.030859 -0.005061 28 1.078099 0.019332 0.020842 29 0.205566 0.012748 0.002621 30 0.008074 0.006209 0.000050 31 -0.398375 0.014652 -0.005837 32 0.377667 0.024948 0.009422 33 1.147046 0.046470 0.053303 34 0.111822 0.029152 0.003260 35 0.971015 0.042768 0.041529 36 -0.561943 0.030551 -0.017168 37 -1.138382 0.025003 -0.028463 38 0.043117 0.028542 0.001231 39 0.867165 0.033752 0.029269 40 -0.105433 0.097320 -0.010261
23

Diagnostic Signal, F 0.1
0.05
... 0 ~ .. c: .rl "' u -0.05 ii 0
-diagnostic signal c: .;'
-0.1 Q
-0.15 +--------'---------
-0.2 _L_ _________ _
N.Sample
Figure 9: Graph of Diagnostic signal Run 500
24
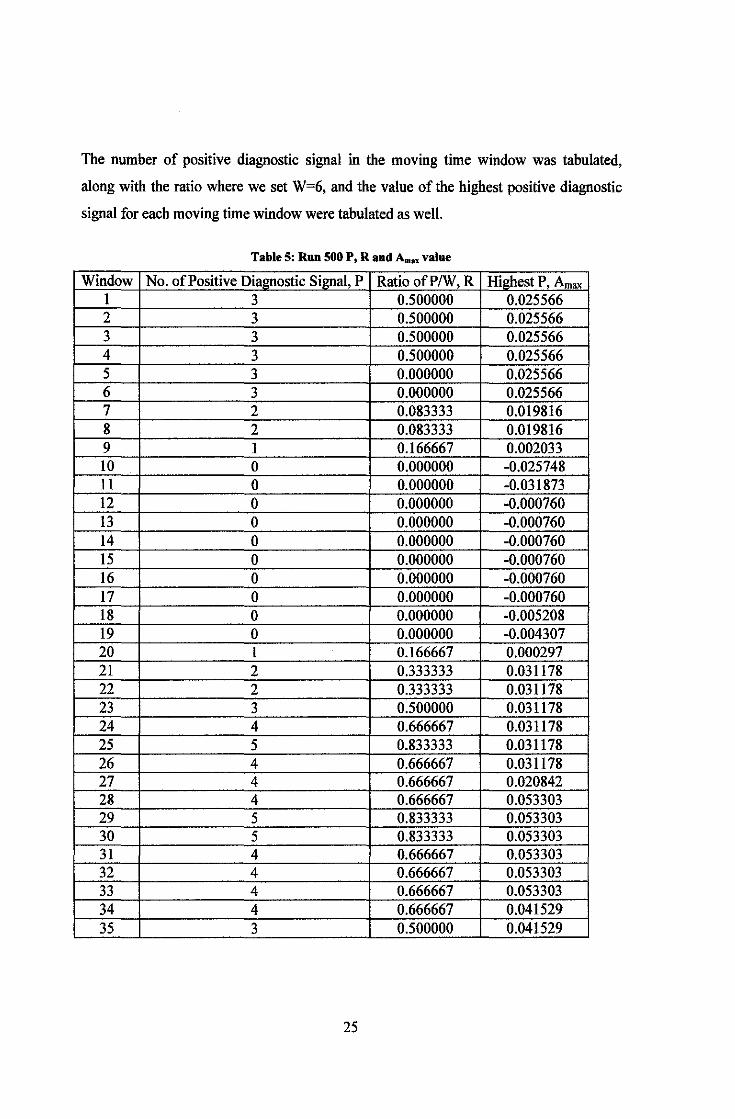
The number of positive diagnostic signal in tbe moving time window was tabulated,
along with tbe ratio where we set W=6, and the value of the highest positive diagnostic
signal for each moving time window were tabulated as well.
Table 5: Run 500 P, Rand Am., value
Window No. of Positive Dia!IDostic Si!IDal, P Ratio ofP/W, R Highest P, Amax
1 3 0.500000 0.025566 2 3 0.500000 0.025566 3 3 0.500000 0.025566 4 3 0.500000 0.025566 5 3 0.000000 0.025566 6 3 0.000000 0.025566 7 2 0.083333 0.019816 8 2 0.083333 0.019816 9 1 0.166667 0.002033 10 0 0.000000 -0.025748 11 0 0.000000 -0.031873 12 0 0.000000 -0.000760 13 0 0.000000 -0.000760 14 0 0.000000 -0.000760 15 0 0.000000 -0.000760 16 0 0.000000 -0.000760 17 0 0.000000 -0.000760 18 0 0.000000 -0.005208 19 0 0.000000 -0.004307 20 1 0.166667 0.000297 21 2 0.333333 0.031178 22 2 0.333333 0.031178 23 3 0.500000 0.031178 24 4 0.666667 0.031178 25 5 0.833333 0.031178 26 4 0.666667 0.031178 27 4 0.666667 0.020842 28 4 0.666667 0.053303 29 5 0.833333 0.053303 30 5 0.833333 0.053303 31 4 0.666667 0.053303 32 4 0.666667 0.053303 33 4 0.666667 0.053303 34 4 0.666667 0.041529 35 3 0.500000 0.041529
25
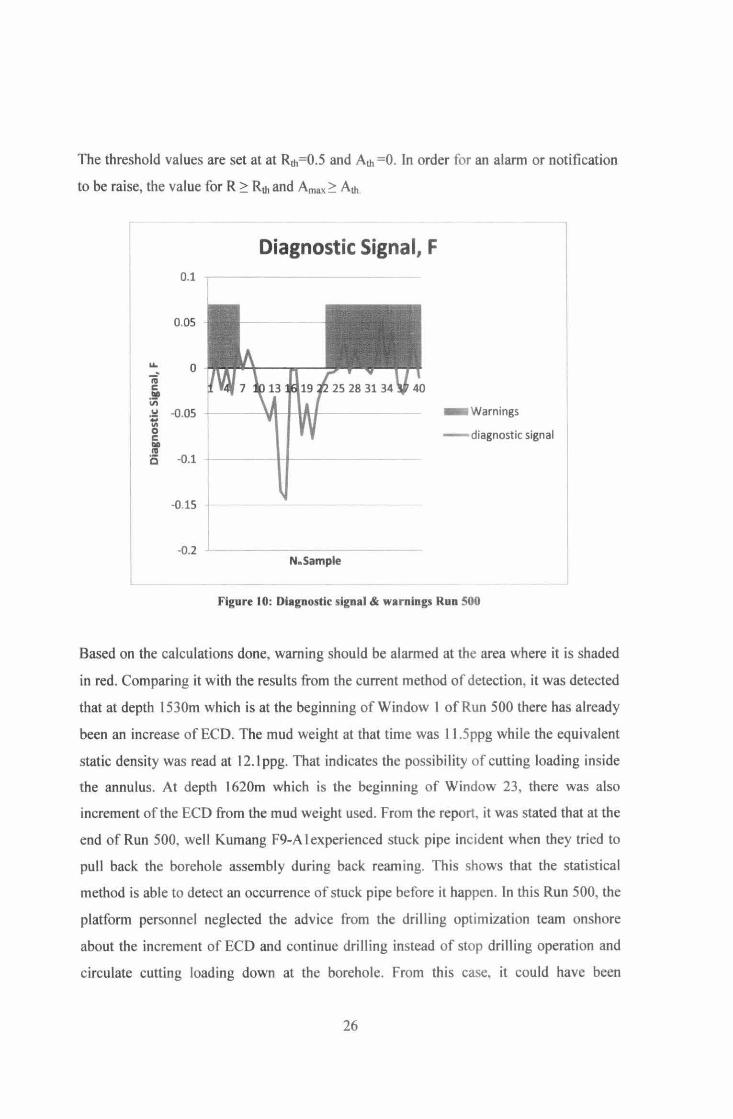
The threshold values are set at at Rth=O.S and Ath =0. In order for an alarm or notification
to be raise, the value for R ~ Rth and Amax ~ Ath
Diagnostic Signal, F 0.1
0.05
u.. 0 ;; c .!!!I ., u -o.o5 ·~
Warnings
0 c 1111 IV
- diagnostic signal
0 -0.1
-0.15
-0.2 N .. Sample
Figure I 0: Diagnostic signal & warnings Run 500
Based on the calculations done, warning should be alarmed at the area where it is shaded
in red. Comparing it with the results from the current method of detection, it was detected
that at depth 1530m which is at the beginning of Window I of Run 500 there has already
been an increase of ECD. The mud weight at that time was ll .Sppg while the equivalent
static density was read at 12.1 ppg. That indicates the possibility of cutting loading inside
the annulus. At depth 1620m which is the beginning of Window 23, there was also
increment of the ECD from the mud weight used. From the report. it was stated that at the
end of Run 500, well Kumang F9-A I experienced stuck pipe incident when they tried to
pull back the borehole assembly during back reaming. This shows that the statistical
method is able to detect an occurrence of stuck pipe before it happen. ln this Run 500, the
platform personnel neglected the advice from the drilling optimization team onshore
about the increment of ECD and continue drilling instead of stop drilling operation and
circulate cutting loading down at the borehole. From this case, it could have been
26
possible to avoid it if method such as the statistical method is presence at the platform. It
can strengthen the claim of the drilling optimization team from onshore and the losses
could have been avoided.
27

Run400
Nth= 4 sample size, W = 6 time window
Table 6: Run 400 Diagnostic signal, F
Nth F1 F2 Diagnostic Signal, F 1 -0.952533 1.189417 -1.132959 2 -0.198546 0.023643 -0.004694 3 -1.092091 0.018082 -0.019747 4 -1.154534 0.045193 -0.052177 5 -0.991455 0.067158 -0.066584 6 0.074433 0.052294 0.003892 7 0.617107 0.054145 0.033413 8 -1.095823 0.149236 -0.163536 9 -0.942482 0.076143 -0.071764 10 0.210092 0.052090 0.010944 11 0.222301 0.021545 0.004789 12 -1.074854 0.052187 -0.056094 13 0.844692 0.074850 0.063225 14 -0.107907 0.045667 -0.004928 15 -1.138933 0.044174 -0.050312 16 -0.091422 0.021588 -0.001974 17 0.272384 0.116645 0.031772 18 -0.987966 0.050765 -0.050154 19 -0.242684 0.091972 -0.022320 20 1.075765 0.068558 0.073752 21 0.034326 0.062740 0.002154 22 0.534792 0.025142 0.013446 23 -0.953006 0.147802 -0.140856 24 -1.013453 0.052648 -0.053356 25 -0.003429 0.007172 -0.000025 26 -1.135389 0.028548 -0.032413 27 -0.218057 0.034966 -0.007625 28 -1.127540 0.015776 -0.017788 29 -0.840415 0.038654 -0.032486 30 0.555528 0.034089 0.018937 31 0.019471 0.021176 0.000412 32 0.408768 0.017294 0.007069 33 -0.146777 0.015169 -0.002227 34 -0.169945 0.031058 -0.005278 35 -1.061995 0.007985 -0.008481 36 -0.839825 0.010299 -0.008649 37 -0.012327 0.069074 -0.000851 38 -0.258164 0.035573 -0.009184 39 -0.963847 0.010074 -0.009710 40 -0.513827 0.015602 -0.008017
28
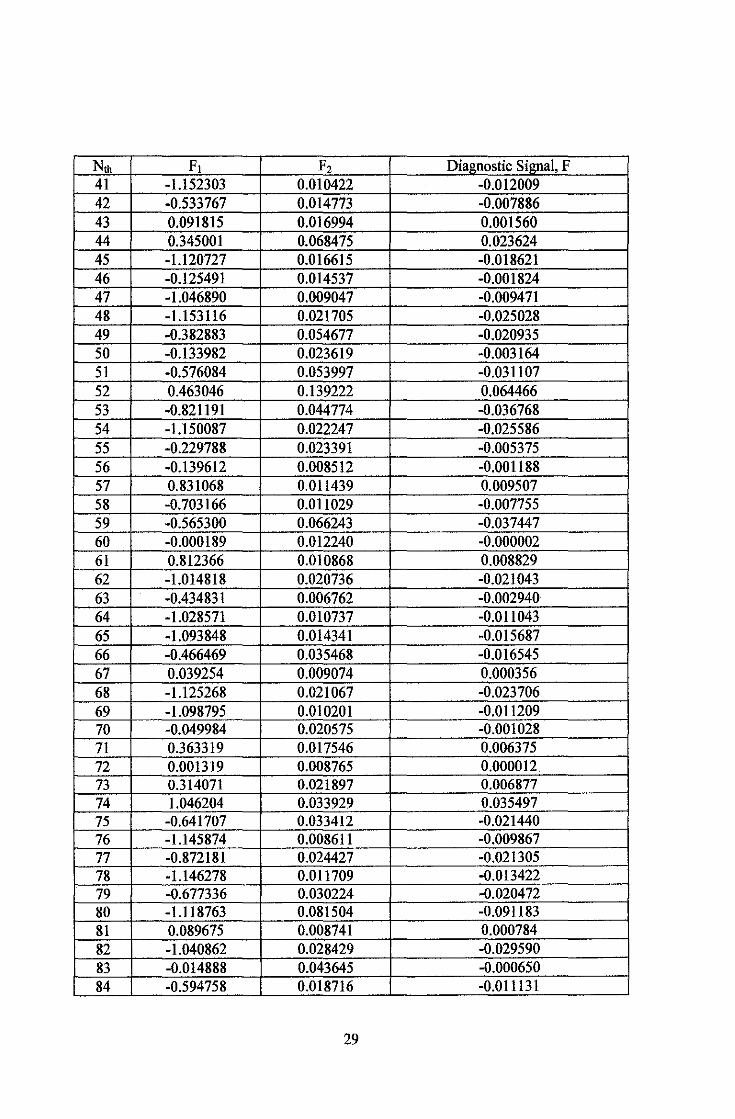
Nth F1 F2 Diagnostic Signal, F 41 -1.152303 0.010422 -0.012009 42 -0.533767 0.014773 -0.007886 43 0.091815 0.016994 0.001560 44 0.345001 0.068475 0.023624 45 -1.120727 0.016615 -0.018621 46 -0.125491 0.014537 -0.001824 47 -1.046890 0.009047 -0.009471 48 -1.153116 0.021705 -0.025028 49 -0.382883 0.054677 -0.020935 50 -0.133982 0.023619 -0.003164 51 -0.576084 0.053997 -0.031107 52 0.463046 0.139222 0.064466 53 -0.821191 0.044774 -0.036768 54 -1.150087 0.022247 -0.025586 55 -0.229788 0.023391 -0.005375 56 -0.139612 0.008512 -0.001188 57 0.831068 0.011439 0.009507 58 -0.703166 0.011029 -0.007755 59 -0.565300 0.066243 -0.037447 60 -0.000189 0.012240 -0.000002 61 0.812366 0.010868 0.008829 62 -1.014818 0.020736 -0.021043 63 -0.434831 0.006762 -0.002940 64 -1.028571 0.010737 -0.011043 65 -1.093848 0.014341 -0.015687 66 -0.466469 0.035468 -0.016545 67 0.039254 0.009074 0.000356 68 -1.125268 0.021067 -0.023706 69 -1.098795 0.010201 -0.011209 70 -0.049984 0.020575 -0.001028 71 0.363319 0.017546 0.006375 72 0.001319 0.008765 0.000012 73 0.314071 0.021897 0.006877 74 1.046204 0.033929 0.035497 75 -0.641707 0.033412 -0.021440 76 -1.145874 0.008611 -0.009867 77 -0.872181 0.024427 -0.021305 78 -1.146278 O.oi 1709 -0.013422 79 -0.677336 0.030224 -0.020472 80 -1.118763 0.081504 -0.091183 81 0.089675 0.008741 0.000784 82 -1.040862 0.028429 -0.029590 83 -0.014888 0.043645 -0.000650 84 -0.594758 0.018716 -0.011131
29

Nth F1 F2 Diagnostic Signal, F 85 -0.177848 0.005946 -0.001057 86 1.002807 0.012654 0.012690 87 -1.135031 0.064408 -0.073105 88 -0.161612 0.034722 -0.005612 89 0.230302 0.029853 0.006875 90 0.405025 0.015660 0.006343 91 -0.383592 0.020188 -0.007744 92 0.053775 0.030062 0.001617 93 0.045707 0.043951 0.002009 94 0.023109 0.025179 0.000582 95 0.698558 0.024995 0.017461 96 -1.046158 0.030027 -0.031413 97 -1.018783 0.061493 -0.062649 98 -1.112044 0.033945 -0.037748 99 -0.466384 0.036386 -0.016970 100 -0.280400 0.025593 -0.007176 101 0.098307 0.048248 0.004743 102 -0.407005 0.034157 -0.013902 103 0.730692 0.023666 0.017292 104 0.864370 0.035895 0.031027 105 -0.008944 0.050482 -0.000452 106 0.353404 0.047519 0.016793 107 -0.436985 0.004231 -0.001849 108 0.773503 0.014730 0.011394 109 -0.892918 0.034573 -0.030871 110 -1.140308 0.033092 -0.037735 111 0.216018 0.023603 0.005099 112 0.541345 0.012615 0.006829 113 -0.138959 0.109971 -0.015281 114 -1.047333 0.023309 -0.024412 115 -0.064469 0.062918 -0.004056 116 0.184161 0.088213 0.016245 117 -1.028742 0.044839 -0.046128 118 -0.909456 0.021014 -0.019111 119 -1.152211 0.026531 -0.030570 120 -0.377264 0.038904 -0.014677 121 -1.154602 0.048395 -0.055877 122 0.697811 0.013866 0.009676 123 -0.047992 0.007414 -0.000356 124 -0.661908 0.016684 -0.011043 125 0.019108 0.023561 0.000450 126 -0.905762 0.118673 -0.107490 127 0.798029 0.054772 0.043710 128 -1.106013 0.048851 -0.054030
30
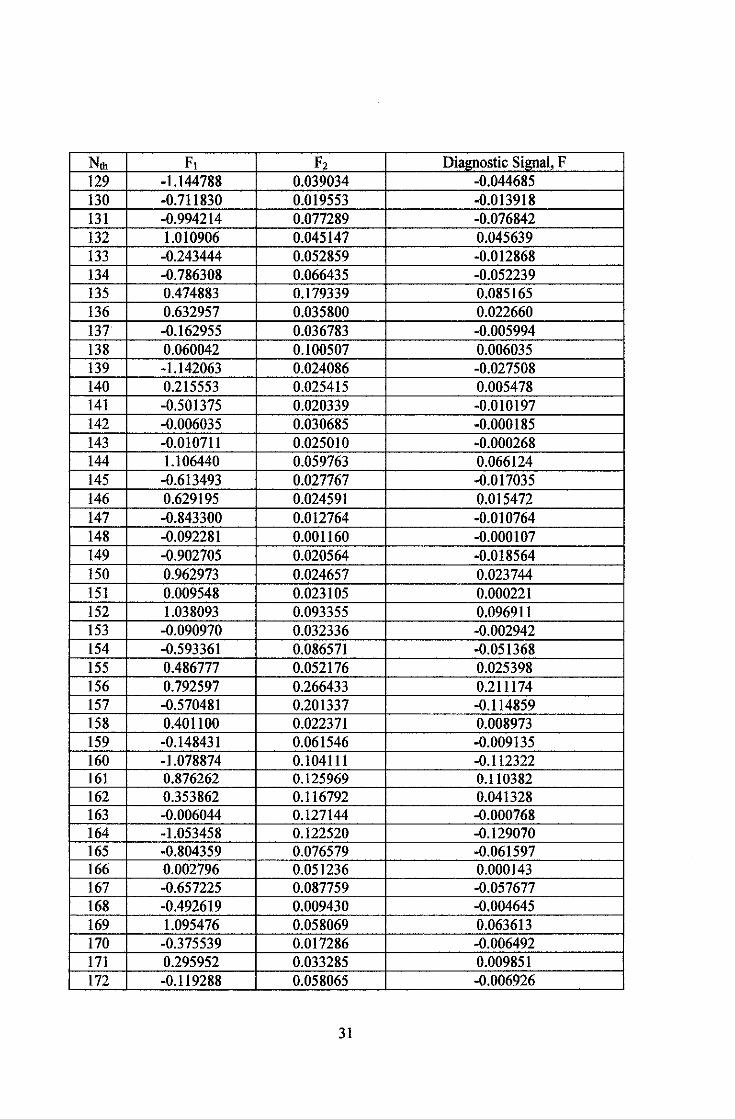
Nth Ft F2 Diagnostic Signal, F 129 -1.144788 0.039034 -0.044685 130 -0.711830 0.019553 -0.013918 131 -0.994214 0.077289 -0.076842 132 1.010906 0.045147 0.045639 133 -0.243444 0.052859 -0.012868 134 -0.786308 0.066435 -0.052239 135 0.474883 0.179339 0.085165 136 0.632957 0.035800 0.022660 137 -0.162955 0.036783 -0.005994 138 0.060042 0.100507 0.006035 139 -1.142063 0.024086 -0.027508 140 0.215553 0.025415 0.005478 141 -0.501375 0.020339 -0.010197 142 -0.006035 0.030685 -0.000185 143 -0.010711 0.025010 -0.000268 144 1.106440 0.059763 0.066124 145 -0.613493 0.027767 -0.017035 146 0.629195 0.024591 0.015472 147 -0.843300 0.012764 -0.010764 148 -0.092281 0.001160 -0.000107 149 -0.902705 0.020564 -0.018564 150 0.962973 0.024657 0.023744 151 0.009548 0.023105 0.000221 152 1.038093 0.093355 0.096911 153 -0.090970 0.032336 -0.002942 154 -0.593361 0.086571 -0.051368 155 0.486777 0.052176 0.025398 156 0.792597 0.266433 0.211174 157 -0.570481 0.201337 -0.114859 158 OA01100 0.022371 0.008973 159 -0.148431 0.061546 -0.009135 160 -1.078874 0.104111 -0.112322 161 0.876262 0.125969 0.110382 162 0.353862 0.116792 0.041328 163 -0.006044 0.127144 -0.000768 164 -1.053458 0.122520 -0.129070 165 -0.804359 0.076579 -0.061597 166 0.002796 0.051236 0.000143 167 -0.657225 0.087759 -0.057677 168 -0.492619 0.009430 -0.004645 169 1.095476 0.058069 0.063613 170 -0.375539 0.017286 -0.006492 171 0.295952 0.033285 0.009851 172 -0.119288 0.058065 -0.006926
31
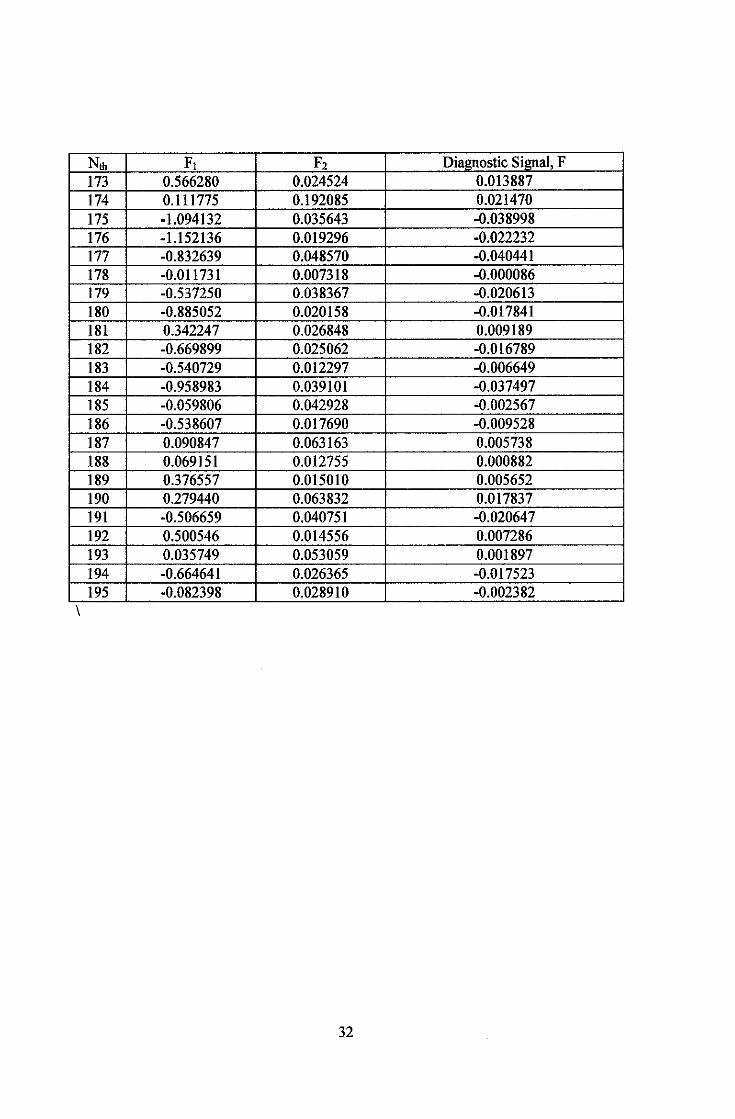
Nth F1 F2 Diagnostic Signal, F 173 0.566280 0.024524 0.013887 174 0.111775 0.192085 0.021470 175 -1.094132 0.035643 -0.038998 176 -1.152136 0.019296 -0.022232 177 -0.832639 0.048570 -0.040441 178 -0.011731 0.007318 -0.000086 179 -0.537250 0.038367 -0.020613 180 -0.885052 0.020158 -0.017841 181 0.342247 0.026848 0.009189 182 -0.669899 0.025062 -0.016789 183 -0.540729 0.012297 -0.006649 184 -0.958983 0.039101 -0.037497 185 -0.059806 0.042928 -0.002567 186 -0.538607 0.017690 -0.009528 187 0.090847 0.063163 0.005738 188 0.069151 0.012755 0.000882 189 0.376557 0.015010 0.005652 190 0.279440 0.063832 0.017837 191 -0.506659 0.040751 -0.020647 192 0.500546 0.014556 0.007286 193 0.035749 0.053059 0.001897 194 -0.664641 0.026365 -0.017523 195 -0.082398 0.028910 -0.002382
\
32
Diagnostic Signal, F 0.5
0.3
0.1
-0.1
... ~ -0.3 .. c ~ ~ -0.5 ~
a -diagnostic signal
c .. . !! -0.7 0
-0.9
-1.1
-1.3
-1.5
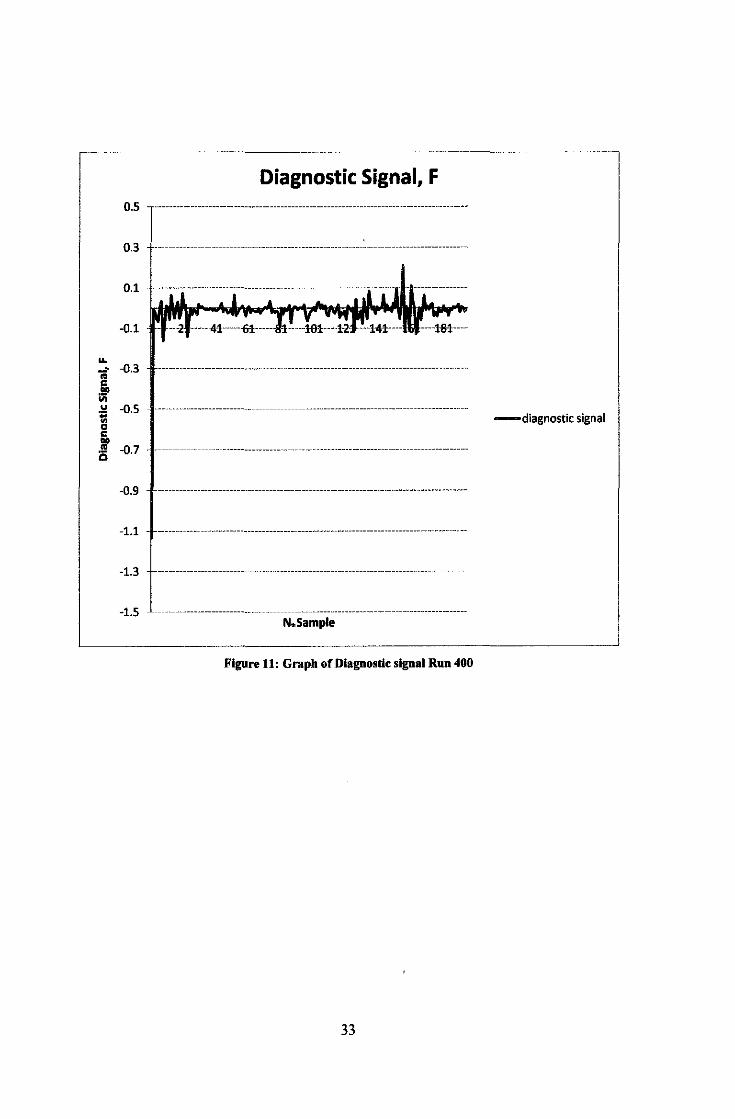
Figurell: Graph of Diagnostic signal Run 400
33
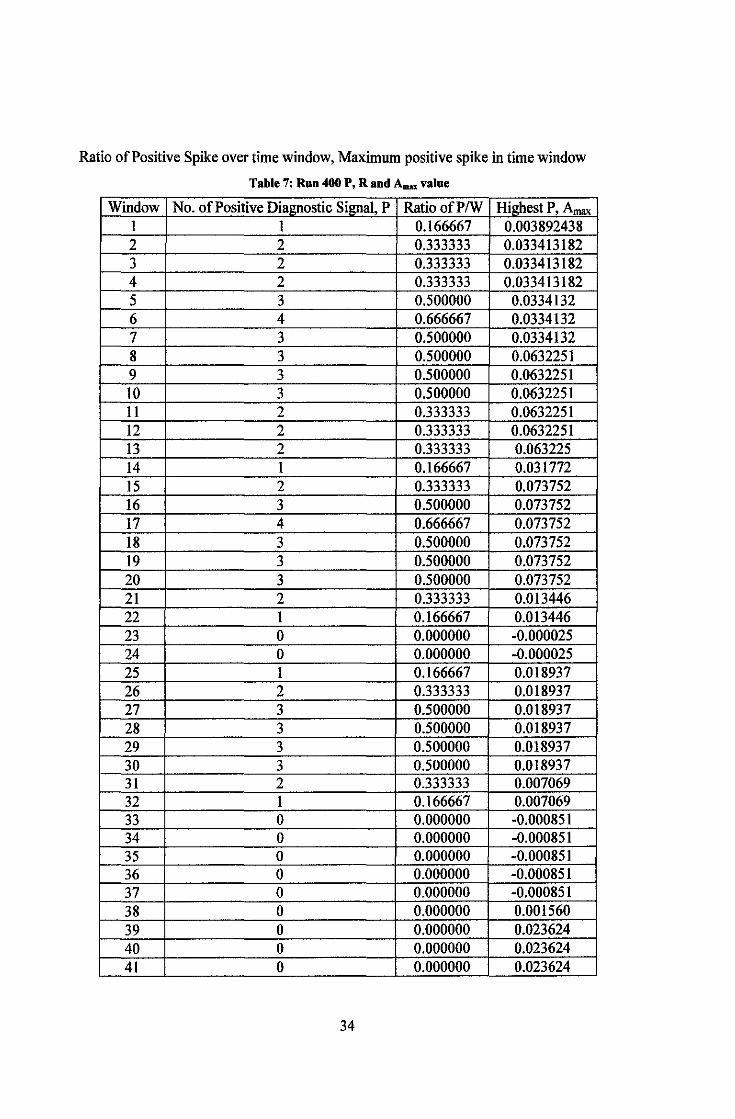
Ratio of Positive Spike over time window, Maximum positive spike in time window
Table 7: Run 400 P, Rand Amu value
Window No. of Positive Diagnostic Signal, P RatioofPIW Highest P, Amax I I 0.166667 0.003892438 2 2 0.333333 0.033413182 3 2 0.333333 0.033413182 4 2 0.333333 0.033413182 5 3 0.500000 0.0334132 6 4 0.666667 0.0334132 7 3 0.500000 0.0334132 8 3 0.500000 0.0632251 9 3 0.500000 0.0632251 10 3 0.500000 0.0632251 11 2 0.333333 0.0632251 12 2 0.333333 0.0632251 13 2 0.333333 0.063225 14 1 0.166667 0.031772 15 2 0.333333 0.073752 16 3 0.500000 0.073752 17 4 0.666667 0.073752 18 3 0.500000 0.073752 19 3 0.500000 0.073752 20 3 0.500000 0.073752 21 2 0.333333 0.013446 22 I 0.166667 0.013446 23 0 0.000000 -0.000025 24 0 0.000000 -0.000025 25 I 0.166667 0.018937 26 2 0.333333 0.018937 27 3 0.500000 0.018937 28 3 0.500000 0.018937 29 3 0.500000 0.018937 30 3 0.500000 0.018937 31 2 0.333333 0.007069 32 1 0.166667 0.007069 33 0 0.000000 -0.000851 34 0 0.000000 -0.000851 35 0 0.000000 -0.000851 36 0 0.000000 -0.000851 37 0 0.000000 -0.000851 38 0 0.000000 0.001560 39 0 0.000000 0.023624 40 0 0.000000 0.023624 41 0 0.000000 0.023624
34
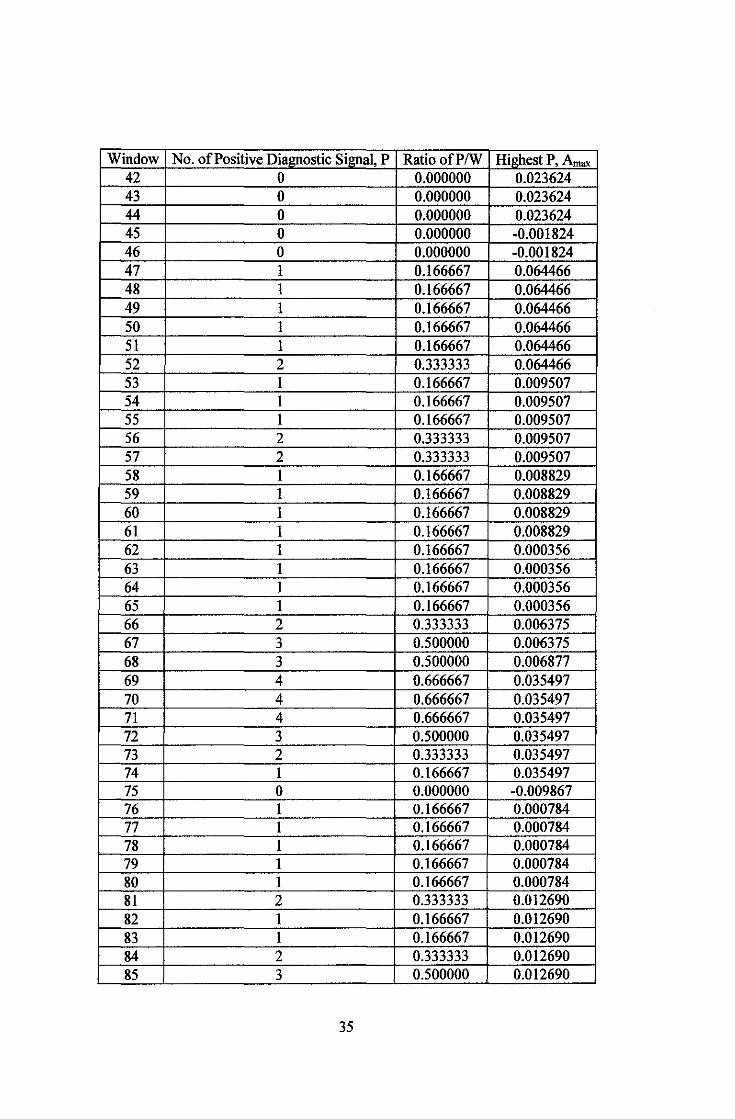
Window No. ofPositive Diagnostic Signal, P Ratio ofP/W Highest P, Amax
42 0 0.000000 0.023624 43 0 0.000000 0.023624 44 0 0.000000 0.023624 45 0 0.000000 -0.001824 46 0 0.000000 -0.001824 47 1 0.166667 0.064466 48 1 0.166667 0.064466 49 1 0.166667 0.064466 50 1 0.166667 0.064466 51 1 0.166667 0.064466 52 2 0.333333 0.064466 53 I 0.166667 0.009507 54 1 0.166667 0.009507 55 1 0.166667 0.009507 56 2 0.333333 0.009507 57 2 0.333333 0.009507 58 1 0.166667 0.008829 59 I 0.166667 0.008829 60 1 0.166667 0.008829 61 1 0.166667 0.008829 62 1 0.166667 0.000356 63 1 0.166667 0.000356 64 I 0.166667 0.000356 65 1 0.166667 0.000356 66 2 0.333333 0.006375 67 3 0.500000 0.006375 68 3 0.500000 0.006877 69 4 0.666667 0.035497 70 4 0.666667 0.035497 71 4 0.666667 0.035497 72 3 0.500000 0.035497 73 2 0.333333 0.035497 74 1 0.166667 0.035497 75 0 0.000000 -0.009867 76 I 0.166667 0.000784 77 1 0.166667 0.000784 78 1 0.166667 0.000784 79 1 0.166667 0.000784 80 1 0.166667 0.000784 8I 2 0.333333 0.012690 82 1 0.166667 0.012690 83 1 0.166667 0.012690 84 2 0.333333 0.012690 85 3 0.500000 0.012690
35

Window No. of Positive Diagnostic Signal, P RatioofP/W Highest P, Amax
86 3 0.500000 0.012690 87 3 0.500000 0.006875 88 4 0.666667 0.006875 89 5 0.833333 0.006875 90 5 0.833333 0.017461 91 4 0.666667 0.017461 92 4 0.666667 0.017461 93 3 0.500000 0.017461 94 2 0.333333 0.017461 95 1 0.166667 0.017461 96 1 0.166667 0.004743 97 I 0.166667 0.004743 98 2 0.333333 0.017292 99 3 0.500000 0.031027 100 3 0.500000 0.031027 101 4 0.666667 0.031027 102 3 0.500000 0.031027 103 4 0.666667 0.031027 104 3 0.500000 0.031027 105 2 0.333333 0.016793 106 3 0.500000 0.016793 107 3 0.500000 0.011394 108 3 0.500000 O.oJ 1394 109 2 0.333333 0.006829 110 2 0.333333 0.006829 111 3 0.500000 0.016245 112 2 0.333333 0.016245 113 1 0.166667 0.016245 114 1 0.166667 0.016245 115 I 0.166667 0.016245 116 1 0.166667 0.016245 117 I 0.166667 0.009676 118 I 0.166667 0.009676 119 I 0.166667 0.009676 120 2 0.333333 0.009676 121 2 0.333333 0.009676 122 3 0.500000 0.043710 123 2 0.333333 0.043710 124 2 0.333333 0.043710 125 2 0.333333 0.043710 126 1 0.166667 0.043710 127 2 0.333333 0.045639 128 I 0.166667 0.045639 129 I 0.166667 0.045639
36
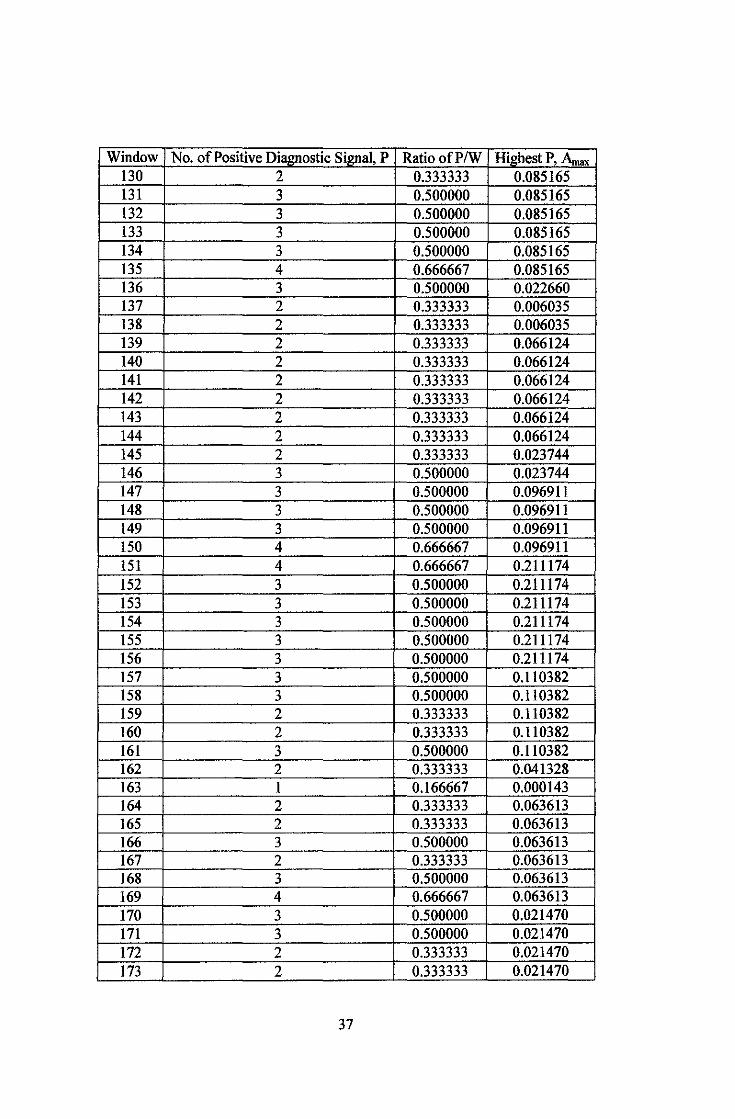
Window No. of Positive Diagnostic Signal, P RatioofPIW Highest P, A.nax 130 2 0.333333 0.085165 131 3 0.500000 0.085165 132 3 0.500000 0.085165 133 3 0.500000 0.085165 134 3 0.500000 0.085165 135 4 0.666667 0.085165 136 3 0.500000 0.022660 137 2 0.333333 0.006035 138 2 0.333333 0.006035 139 2 0.333333 0.066124 140 2 0.333333 0.066124 141 2 0.333333 0.066124 142 2 0.333333 0.066124 143 2 0.333333 0.066124 144 2 0.333333 0.066124 145 2 0.333333 0.023744 146 3 0.500000 0.023744 147 3 0.500000 0.096911 148 3 0.500000 0.096911 149 3 0.500000 0.096911 150 4 0.666667 0.096911 151 4 0.666667 0.211174 152 3 0.500000 0.211174 153 3 0.500000 0.211174 154 3 0.500000 0.211174 155 3 0.500000 0.211174 156 3 0.500000 0.211174 157 3 0.500000 0.110382 158 3 0.500000 0.110382 159 2 0.333333 0.110382 160 2 0.333333 0.110382 161 3 0.500000 0.110382 162 2 0.333333 0.041328 163 1 0.166667 0.000143 164 2 0.333333 0.063613 165 2 0.333333 0.063613 166 3 0.500000 0.063613 167 2 0.333333 0.063613 168 3 0.500000 0.063613 169 4 0.666667 0.063613 170 3 0.500000 0.021470 l7l 3 0.500000 0.021470 172 2 0.333333 0.021470 173 2 0.333333 0.021470
37
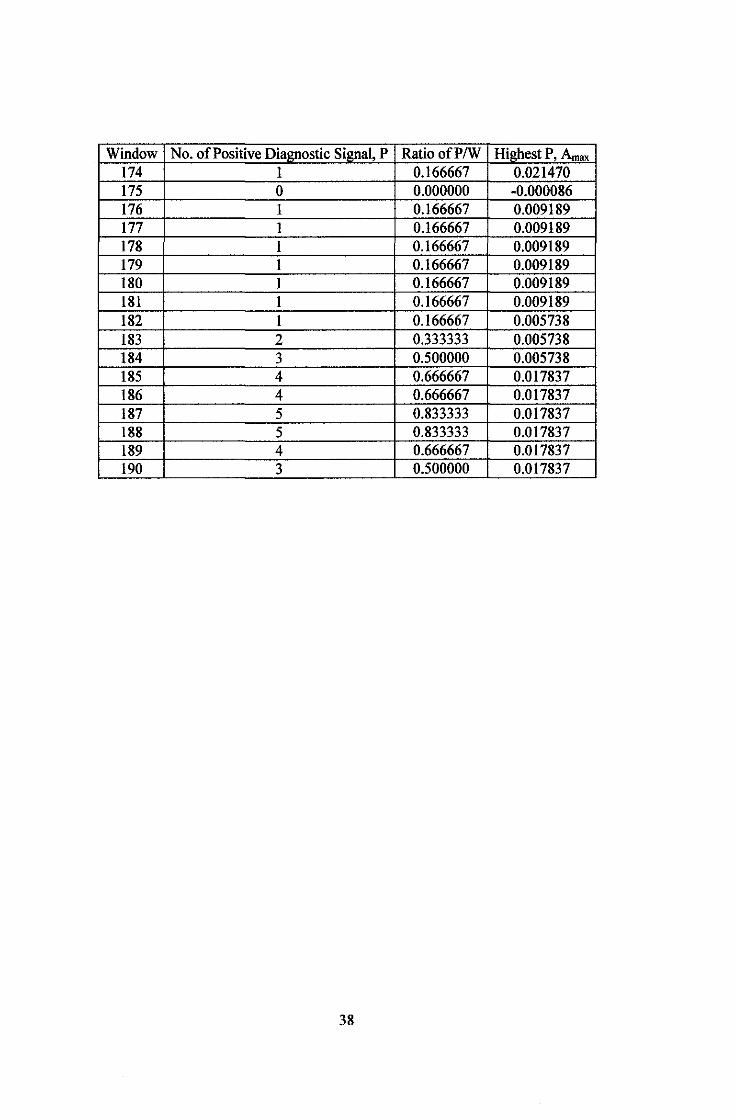
Window No. of Positive Diagnostic Signal, P Ratio ofP/W Highest P, Amax
174 1 0.166667 0.021470 175 0 0.000000 -0.000086 176 1 0.166667 0.009189 177 1 0.166667 0.009189 178 1 0.166667 0.009189 179 1 0.166667 0.009189 180 1 0.166667 0.009189 181 1 0.166667 0.009189 182 1 0.166667 0.005738 183 2 0.333333 0.005738 184 3 0.500000 0.005738 185 4 0.666667 0.017837 186 4 0.666667 0.017837 187 5 0.833333 0.017837 188 5 0.833333 0.017837 189 4 0.666667 0.017837 190 3 0.500000 0.017837
38
Diagnostic Signal, F 0.5
0.3
0.1
-0.1
u..
ii -0.3 c !JP "' u -o.5 t;
- Warnings
0 c 110 10 -o.7 0
- diagnostic signal
-0.9 .. . ------- . ........ ..........
-1.1
-1.3
-1.5 N.Sample
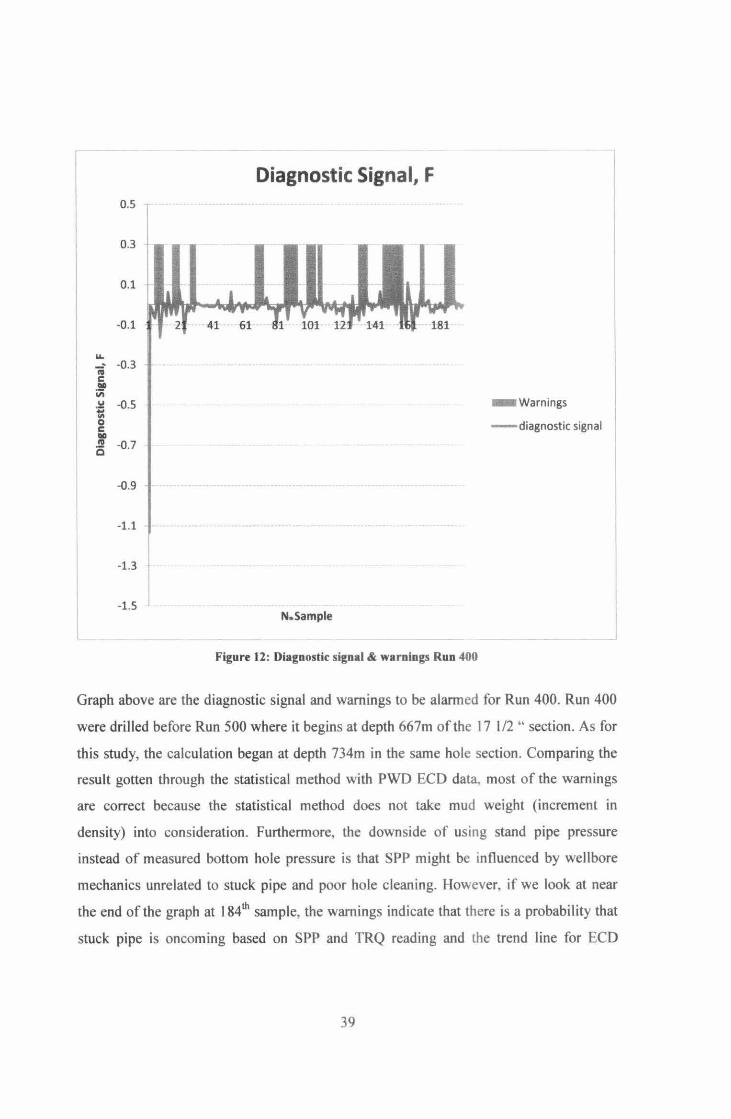
Figure 12: Diagnostic signal & warnings Run 400
Graph above are the diagnostic signal and warnings to be alanned for Run 400. Run 400
were drilled before Run 500 where it begins at depth 667m ofthe 17 1/2 " section. As for
this study, the calculation began at depth 734m in the same hole section. Comparing the
result gotten through the statistical method with PWD ECD data, most of the warnings
are correct because the statistical method does not take mud weight (increment in
density) into consideration. Furthermore, the downside of using stand pipe pressure
instead of measured bottom hole pressure is that SPP might be influenced by wellbore
mechanics unrelated to stuck pipe and poor hole cleaning. However, if we look at near
the end of the graph at I 84th sample, the warnings indicate that there is a probability that
stuck pipe is oncoming based on SPP and TRQ reading and the trend line for ECD
39
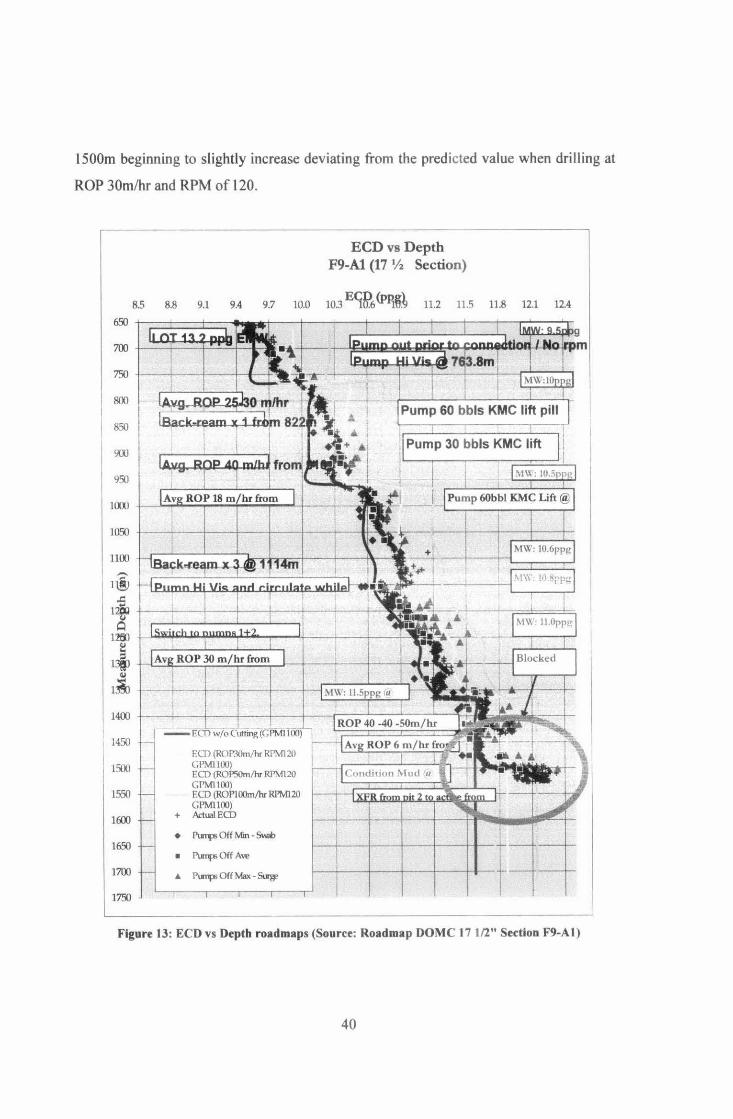
1500m beginning to slightly increase deviating from the predicted value when drilling at
ROP 30m/hr and RPM of 120.
85 650
700
750
800
850
900
950
I COl
1U50
1100 ,......
n!l .c ..
12f 0
1200 QJ
:1 13{1!
QJ
til 1400
1450
1500
1550
1600
1650
1700
1750
8.8 9.1 9.4 9.7 10.0
F.Ln (R( JP30m/hr RPM120 Gl'MllOO) EQ) (ROPSOm/hr RPM120 GPMIIOO) EQ) (ROPlOOm/hr RPM1 20 GPMllOO)
+ ActualECD
• ~Off Min- SYro
• ~OffAve
~ ~OffMax -~
ECDvsDepth F9-A1 (17 1/z Section)
11.2 11.5 11.8 12.1 12.4
Figure 13: ECD vs Deptb roadmaps (Source: Roadmap DOMC 17 112" Section F9-A1)
40
Diagnostic Signal, F 0.5
0.3
0.1
-Q.1 ... ni -Q.3 c RUN 400 RUN 500 ~ Ill u -o.5 t;
- Warnings
0 c
-Q.7 liD
"' 0
- diagnostic signal
-0.9
-1.1
-1.3
-1.5 N.Sample
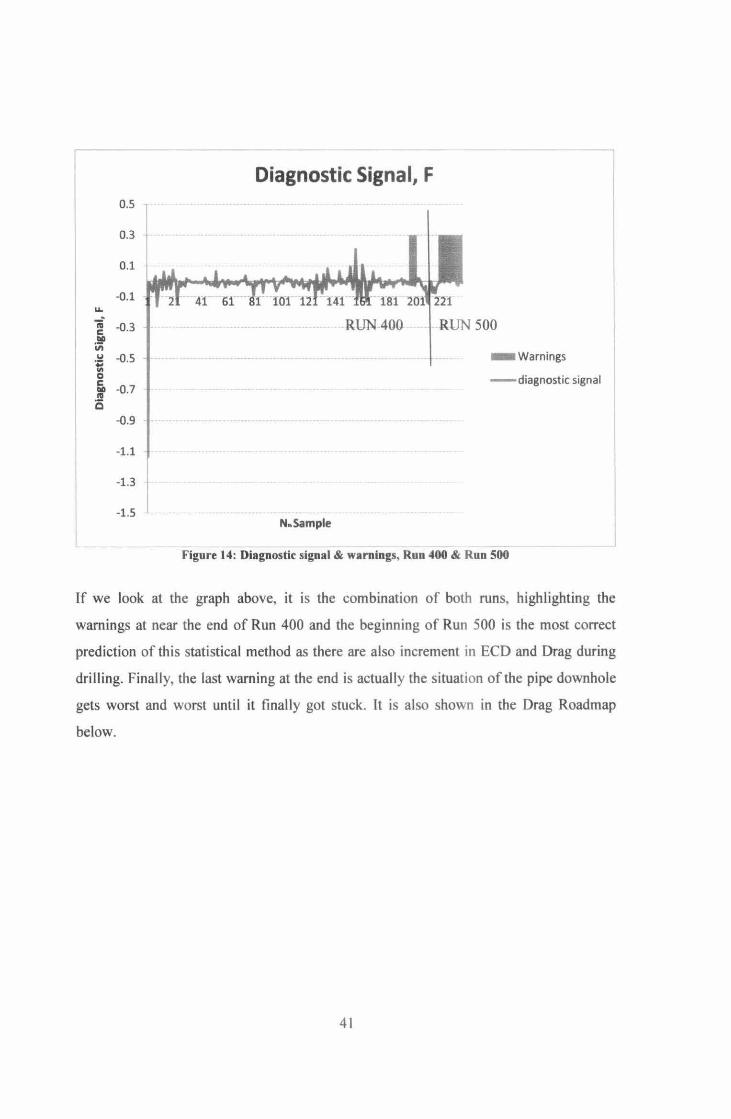
Figure 14: Diagnostic signal & warnings, Run 400 & Run 500
If we look at the graph above, it is the combination of both runs, highlighting the
warnings at near the end of Run 400 and the beginning of Run 500 is the most correct
prediction of this statistical method as there are also increment in ECD and Drag during
drilling. Finally, the last warning at the end is actually the situation of the pipe downhole
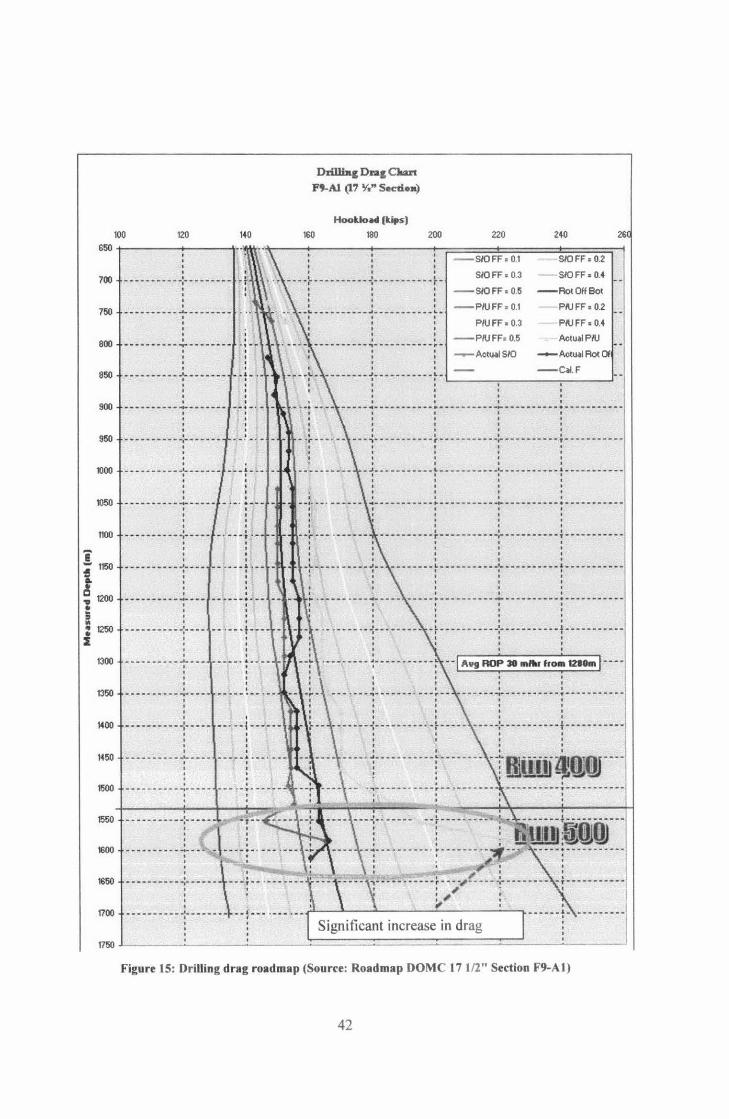
gets worst and worst until it finally got stuck. It is also shown in the Drag Roadmap
below.
41
-I! -! ! "' • ; "' " • :E
100 650 -r-----+------i
0
700 -----------:---------
750
800
850
900
950
0
------ ---- ~--------0 0 0 0 0
----------~---------
........................................... 0
0 ------- ... -................... --0
140
1000 -----------~------ ___ , ___ -0 0 0 0 0 0
1050 ----------~-----
1100
1150
1200
1250
1300
1350
1400
1450
1500
0 0 0 0 0 --... ...... --- ....... , ............. 0 0 0 0 ...................................... 0 0 0
.................... -.............
.......... -........ ·:----0
0 0 ................................. .. ... ... 0 0 0 0 0
-------- --~-----
....................... ....... : .. ......... 0 0 0 0 --- -------"""-----0 0 0 0
0 ....... .................................. 0 0
0
0 -· ......... , ·-0 0 0 0 -- .... - .. t . -- -0 0 0 0
....................... I 0 0 0
--·f---0 0 0 0
.. ----· "' ·--·
.................... . .....
0
-- · -·l---·-·
0 ............ .6. ~--· ---0 0 0
1550 -----------:-- -·--0 0
1600 __________ _, ___ _
1650
1700
1750 .1.----~-
DDJJh&& Dra& CUrl F'-Al (17 Y." s.cd.ll)
160
Hooklo~ (kips)
180 200 220
--SIOFF ·01
240 26
S/OFF = 0.2 0 0 0 S/0 FF • 0.3 SIOFF• 0.4 0 0 0
----r----------~-----------r---SIO FF • 0.5 --Rot Off Bot
--PIUFF : 0.1 PIU FF • 0.2
PlUFF• 0.3 PIU FF • 0.4
- PIUFF=0.5 ActuaiPIU 0 0 0
--Actoll S/0 -ActU~I Rot Of
--CII. F 0 0
--------:-----------:-L----------0--------------------_j
0 0 0 0 0 0 0 0 0
-----~-----------~-----------~----------·------ -----0 0 0
0 0 I I I I
---~-----------r---- -- -----~----------r·-- --------o 0 0 0
t I I I .. J ........................... ~ .......... ..... ......... ~ ....................... 4 ..................... ..
t t I I 0 0 0 0 0 0 0 0 0 0 0 0
~--- --------~-----------~----- -- ---· ------ -----0 0
0 0 0 .. .................. r .... - ................. ~----------~-----------
o 0 0
0 0 ................. L ........ ........ ....... ~ ..................... l .................... ..
0 0 0 0 0 0 0 0 0 0 0 0 0
0 0 0 0 0
-~ ... -- --- -- ........ : ...... -- ................. t ... --- ........ ---1 0 0 0
0 0 0
0 0 0 0
--1 Avg ~ 3e 111llw fro~ 12101111 ----
0 0
0 0 0 0
------1--·--·---·-t-----0 0 0 0 0
.. - .... -:- ...... -- .... -- ..... t ....... - ........ -- .... 0 0 ----· r-- ------ -r-------- -THlY.Di lf!QJW ___ _
---\-- ·1----------+- ··-------; ----------t-----------
_ ___.!
Figure 15: Drilling drag roadmap (Source: Roadmap DOMC 17 112" Section F9-At)
42
CHAPTERS
CONCLUSION
Pipe sticking and poor hole cleaning affects the cost of drilling operation badly, millions
of dollars were wasted in order to recover after such loss. These occurrences should be
avoided instead of recovered from. Prevention methods which takes advantage of
statistical method and also multivariate analysis to not only detect when the stuck pipe
will occur but also reads the type of stuck pipe which will occur will be helpful in saving
more cost. The current method available uses PWD data and the flow patterns of those
data are analyzed by experienced engineers from the drilling optimization team. It allows
early detection based on the engineer's knowledge and experience on the subject to detect
a possible occurrence. However, cases like Run 500 still happen when the drilling
platform personnel fail to adhere to their advice and continue operation like usual. This
statistical method can be developed even further so that it will be able to strengthen the
claim of the drilling optimization team. In conclusion, it is believe that the statistical
method is a viable option in order not to replace but to strengthen the current method
available for the detection of stuck pipe.
43
REFERENCES
Dialog Wireline Services, L.L.C, "Fundamentals of Stuck Pipe",
www.dialogwireline.com/Content/Fundamentals _of_ Stuck_Pipe.pdf
J. E. Warren, "Causes, Preventions and Recovery of Stuck Drill Pipe", www.onepetro.org
Oil Field Glossary Schlumberger, "Bottom Hole Pressure",
www.glossary.oilfield.slb.com/Display.clin?Term=bottomhole pressure
Jardine et al., "Method of Warning of Pipe Stucking During Drilling Operations", United
States Patent number 5454436, www.freepatentsonline.com
Thor 0. Gulsrud, Roar Nybo and Knut S. Bjorkevoll, "Statistical Method for Detection
of Poor Hole Cleaning and Stuck Pipe", Society of Petroleum Engineers, SPE 123374
1997 Ward, C.D., and E. Andreassen, Pressure-While-Drilling Data Improve Drilling
Peiformance, Journal of Petroleum Technology, February
Drilling Notice of Operation Kumang F9-A1, PETRONAS Carigali.
Elizabeth C. Duru, Forrest Liu, Haria De Santo, Oluwatosin Odeweye, "Formation
Pressure While Drilling (FPWD) Tool Application in Reservoir Management-Case Study
on Tetra-Mega Field, NYC, Nigeria" SPE 150768
DOMC-PCSB Insite Reports on Kumang F9-A1
44
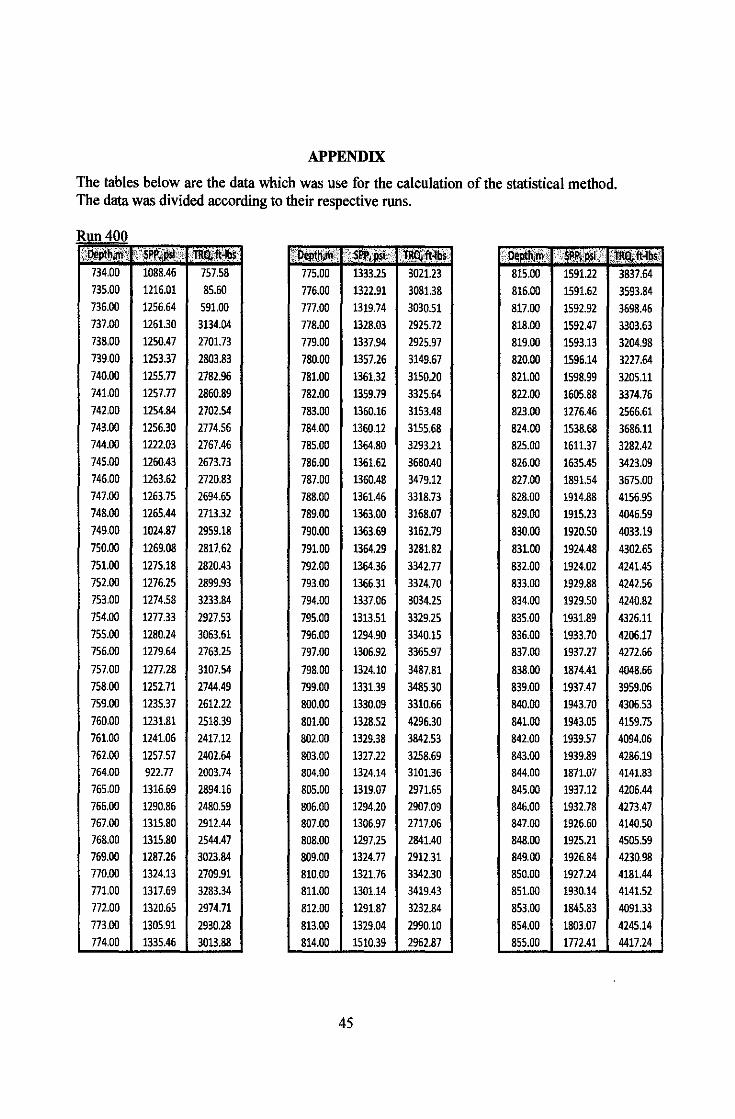
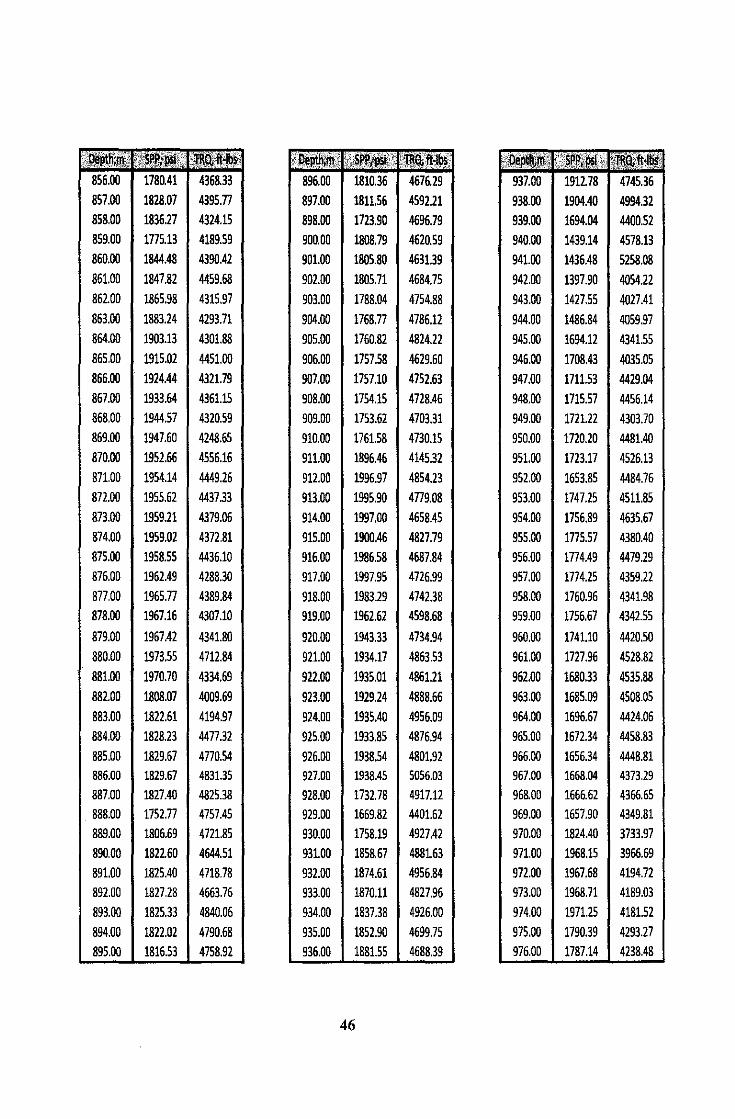
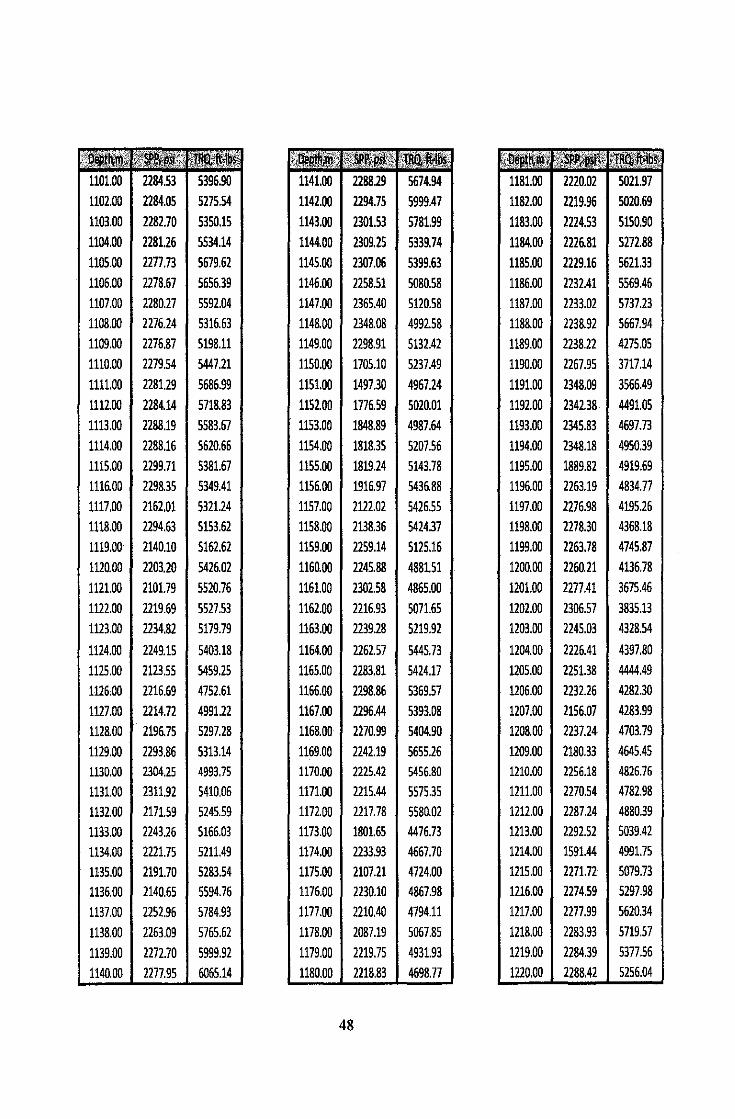
APPENDIX
The tables below are the data which was use for the calculation of the statistical method. The data was divided according to their respective runs.
735.00 736.00 737.00 738.00 739.00
740.00 741.00
742.00 743.00 744.00 745.00 746.00 747.00 748.00 749.00
750.00
751.00 752.00 753.00
754.00 755.00 756.00
757.00 758.00 759.00 760.00 761.00 762.00 764.00 765.00 766.00 767.00 768.00 769.00 770.00 771.00 772.00 773.00 774.00
1088.46 1216.01 1256.64 1261.30 1250.47 1253.37 1255.77 1257.77 1254.84 1256.30 1222.03 126Q.43 1263.62 1263.75 1265.44 1024.87
1269.08 1275.18 1276.25 1274.58 1277.33 1280.24 1279.64
1277.28 1252.71 1235.37
1231.81 1241.06
1257.57 922.77 1316.69 1290.86 1315.80 1315.80 1287.26 1324.13 1317.69 1320.65 1305.91 1335.46
757.58 85.60
591.00 3134.04 2701.73
2803.83 2782.96 2860.89 2702.54 2774.56 2767.46 2673.73 2720.83 2694.65 2713.32
2959.18 2817.62 2820.43 2899.93 3233.84
2927.53 3063.61 2763.25
3107.54 2744.49 2612.22 2518.39 2417.12 2402.64 2003.74 2894.16 2480.59 2912.44 2544.47 3023.84 2709.91 3283.34 2974.71
2930.28 3013.88
776.00 777.00 778.00 779.00 780.00
781.00 782.00 783.00 784.00 785.00 786.00 787.00 788.00 789.00 790.00
791.00 792.00 793.00 794.00
795.00 796.00 797.00
798.00 799.00 800.00 801.00 802.00
803.00 804.00 805.00 806.00 807.00 808.00 809.00 810.00 811.00 812.00 813.00 814.00
45
1322.91 1319.74 1328.03 1337.94 1357.26 1361.32 1359.79 1360.16 1360.12 1364.80 1361.62 1360.48 1361.46 1363.00 1363.69
1364.29 1364.36 1366.31 1337.06 1313.51 1294.90 1306.92
1324.10
1331.39 1330.09 1328.52 1329.38 1327.22 1324.14 1319.07 1294.20 1306.97 1297.25 1324.77 1321.76 1301.14 1291.87
1329.04 1510.39
3081.38 3030.51 2925.72 2925.97 3149.67
3150.20 3325.64 3153.48 3155.68 3293.21 3680.40 3479.12 3318.73 3168.07 3162.79
3281.82 3342.77 3324.70 3034.25 3329.25 3340.15 3365.97
3487.81 3485.30 3310.66
4296.30 3842.53
3258.69 3101.36 2971.65 2907.09 2717.06 2841.40 2912.31 3342.30 3419.43 3232.84
2990.10 2962.87
816.00
817.00 818.00 819.00 820.00 821.00 822.00 823.00 824.00 825.00 826.00 827.00 828.00 829.00
830.00
831.00 832.00 833.00
834.00
835.00 836.00 837.00
838.00 839.00 840.00 841.00 842.00
843.00 844.00 845.00 846.00 847.00 848.00 849.00 850.00 851.00 853.00
854.00 855.00
1591.62 1592.92 1592.47
1593.13 1596.14
1598.99 1605.88 1276.46 1538.68 1611.37 1635.45 1891.54 1914.88 1915.23 1920.50
1924.48 1924.02 1929.88 1929.50
1931.89 1933.70 1937.27
1874.41 1937.47 1943.70 1943.05 1939.57 1939.89 1871.07 1937.12 1932.78 1926.60 1925.21 1926.84 1927.24 1930.14
1845.83 1803.07 1772.41
3593.84 3698.46 3303.63 3204.98 3227.64
3205.11 3374.76 2566.61 3686.11 3282.42
3423.09 3675.00 4156.95 4046.59 4033.19
4302.65 4241.45 4242.56 4240.82
4326.11 4206.17 4272.66
4048.66 3959.06 4306.53
4159.75 4094.06 4286.19 4141.83 4206.44 4273.47 4140.50 4505.59 4230.98 4181.44 4141.52 4091.33 4245.14 4417.24
857.00 858.00 859.00
860.00 861.00
862.00
863.00 864.00
865.00 866.00 867.00
868.00 869.00 870.00
871.00
872.00 873.00 874.00 875.00 876.00
877.00 878.00
879.00 880.00
881.00
882.00
883.00 884.00 885.00 886.00 887.00 888.00 889.00 890.00 891.00 892.00
893.00 894.00 895.00
1828.07 1836.27 1775.13 1844.48
1847.82 1865.98
1883.24 1903.13
1915.02
1924.44 1933.64 1944.57
1947.60
1952.66 1954.14
1955.62 1959.21
1959.02 1958.55 1962.49 1965.77 1967.16
1967.42 1973.55
1970.70
1808.07
1822.61 1828.23 1829.67 1829.67 1827.40 1752.77 1806.69 1822.60 1825.40 1827.28 1825.33
1822.02 1816.53
4395.77 4324.15 4189.59 4390.42
4459.68 4315.97
4293.71 4301.88
4451.00 4321.79
4361.15 4320.59 4248.65
4556.16
4449.26 4437.33
4379.06 4372.81 4436.10 4288.30
4389.84 4307.10
4341.80 4712.84
4334.69
4009.69
4194.97 4477.32
4770.54 4831.35 4825.38 4757.45 4721.85 4644.51
4718.78 4663.76
4840.06 4790.68 4758.92
897.00 898.00 900.00 901.00
902.00
903.00 904.00 905.00
906.00 907.00
908.00 909.00 910.00
911.00 912.00
913.00 914.00
915.00 916.00 917.00 918.00 919.00
920.00 921.00
922.00
923.00 924.00
925.00 926.00 927.00 928.00 929.00 930.00 931.00 932.00 933.00 934.00 935.00 936.00
1811.56
1723.90 1808.79 1805.80
1805.71 1788.04
1768.77 1760.82
1757.58 1757.10 1754.15
1753.62 1761.58 1896.46
1996.97 1995.90
1997.00 1900.46
1986.58 1997.95 1983.29 1962.62
1943.33
1934.17
1935.01 1929.24
1935.40 1933.85
1938.54 1938.45 1732.78 1669.82 1758.19 1858.67 1874.61 1870.11 1837.38
1852.90 1881.55
46
4592.21 4696.79 4620.59 4631.39
4684.75 4754.88
4786.12 4824.22
4629.60 4752.63
4728.46 4703.31 4730.15 4145.32
4854.23
4779.08 4658.45 4827.79
4687.84 4726.99 4742.38 4598.68
4734.94
4863.53
4861.21
4888.66 4956.09 4876.94
4801.92 5056.03 4917.12 4401.62 4927.42 4881.63 4956.84 4827.96 4926.00
4699.75 4688.39
937.00 1912.78 4745.36 938.00
939.00 940.00 941.00
942.00
943.00
944.00 945.00
946.00 947.00
948.00 949.00 950.00
951.00 952.00
953.00 954.00 955.00
956.00 957.00
958.00 959.00
960.00 961.00
962.00 963.00
964.00 965.00
966.00 967.00 968.00 969.00 970.00 971.00 972.00 973.00
974.00
975.00 976.00
1904.40 1694.04 1439.14 1436.48 1397.90
1427.55
1486.84 1694.12
1708.43 1711.53 1715.57 1721.22
1720.20 1723.17 1653.85
1747.25 1756.89 1775.57 1774.49
1774.25 1760.96 1756.67
1741.10 1727.96
1680.33 1685.09
1696.67 1672.34
1656.34 1668.04 1666.62 1657.90 1824.40 1968.15 1967.68 1968.71 1971.25
1790.39 1787.14
4994.32 4400.52 4578.13 5258.08
4054.22 4027.41
4059.97 4341.55
4035.05 4429.04 4456.14 4303.70
4481.40 4526.13
4484.76 4511.85 4635.67
4380.40 4479.29 4359.22 4341.98 4342.55
4420.50 4528.82
4535.88 4508.05
4424.06 4458.83 4448.81 4373.29 4366.65 4349.81 3733.97 3966.69 4194.72 4189.03 4181.52 4293.27 4238.48

978.00 1777.27 4153.68 979.00 980.00 981.00 982.00 983.00 984.00 985.00 986.00 987.00 988.00 989.00 990.00
991.00 992.00 993.00 994.00 995.00 996.00 997.00 998.00 999.00
1000.00 1001.00 1002.00 1003.00 1004.00 1005.00 1006.00 1007.00 1008.00 1009.00 1010.00 1011.00 1012.00 1013.00 1014.00
1015.00 1016.00
1831.15 1930.44 1929.78 1891.06 1937.32 1941.15 1946.99 1949.91 1951.58 1952.95 1954.48 1951.53
1954.29 1940.01 1912.80
1955.56 1957.29 1962.68 1982.54 1993.89 1911.77
1837.35
1838.79 1823.67 1738.54 1738.82 1775.54 1897.54 1912.24 1905.08 2055.16 2138.77 2146.26 2153.09 2161.63 2160.10 2103.51 2091.72
4138.16 4056.40 4004.07 3948.45 4041.46 4146.87 4044.38 4020.42 4060.40 4085.60 4087.73
4186.68 4149.63 4106.56 4110.78
4145.57 4235.01 4222.19 4159.37 4141.92 3858.05
4138.12 4094.24 4141.72 4134.90 4185.95 4102.55 3919.01 3945.41 3946.08 4000.74 3974.08 4054.44 4057.33 4058.86 4040.86 3982.35 4181.39
1018.00 2104.68 1019.00 1020.00 1021.00 1022.00 1023.00 1024.00 1025.00 1026.00 1027.00 1030.00 1031.00 1032.00 1033.00 1034.00 1035.00 1036.00 1037.00 1038.00 1039.00 1040.00 1041.00
1042.00 1043.00 1044.00 1045.00 1046.00 1047.00 1048.00 1049.00 1050.00 1051.00 1052.00 1053.00 1054.00 1055.00 1056.00 1057.00 1058.00
2113.86 2125.36 2134.10 2110.56 2089.22 2112.74 2131.45 2145.96 2158.71 2139.45 2108.94 2111.81 2115.71 2142.63 2146.22 2151.91 2153.60 2155.85 2098.11 2162.15 2165.92
2165.50 2171.78 2194.88 2176.78 2113.70 1889.12 2159.80 2166.88 2176.57 2181.95 2191.87 2196.15 2198.91 2203.56 2205.47 2165.15 2200.70
47
4329.31 4273.66 4274.60 4285.95 4202.88 4242.47 4350.81 4274.59 4253.54 4126.61 4132.32 4199.12 4097.50 3879.48 3946.01 4164.98 4275.34 4098.57 4226.67 4199.44 4211.98
4143.96 4165.73 4169.82 4248.88 4387.46 4512.95 4636.26 4611.20 4572.92 4450.82 4576.37 4516.93 4771.79 4656.13
4780.21 4009.58 4232.15
1060.00 2161.14 4346.25 1061.00 2152.02 4401.72 1062.00 1063.00 1064.00 1065.00 1066.00 1067.00 1068.00 1069.00 1070.00 1071.00 1072.00 1073.00 1074.00 1075.00 1076.00 1077.00 1078.00 1079.00 1080.00 1082.00 1083.00
1084.00 1085.00 1086.00 1087.00 1088.00 1089.00 1090.00 1091.00 1092.00 1093.00 1094.00 1095.00 1096.00 1097.00 1098.00 1099.00 1100.00
2151.09 2158.82 2172.52 2182.37 2187.86 2113.25 2198.84 2208.05 2214.60 2223.60 2228.27 2233.62 2236.15 2237.97 2237.29 2234.52 2234.39 2231.09 2231.63 2231.41 2232.21
2234.80 2234.89 1517.13 2174.91 2188.80 2205.60 2215.76 2224.75 2232.20 2237.36 2182.04 2118.42 2089.02 2272.68 2273.24 2274.44 2275.92
4384.19 4316.79 4566.68 4773.13 4796.56 4886.60 4601.75 4968.05 4563.75 4910.67 4765.58 4892.44 4936.69 4976.75 4972.57 4986.92 5000.13 5041.58 4980.43 4925.24 4846.83
4859.37 4878.92 4302.83 4952.58 4907.65 4817.68 4883.98 5212.31 4989.08 4889.31 4954.93 5005.19 5234.17 5454.20 5625.05 5602.26 5647.79
1101.00 1102.00 1103.00 1104.00 1105.00 1106.00 1107.00 1108.00 1109.00 1110.00 1111.00 1112.00
1113.00 1114.00 1115.00 1116.00 1117.00 1118.00 1119.00 1120.00
1121.00 1122.00 1123.00
1124.00 1125.00 1126.00 1127.00 1128.00 1129.00 1130.00 1131.00 1132.00 1133.00 1134.00 1135.00 1136.00 1137.00 1138.00 1139.00 1140.00
2284.53 2284.05 2282.70
2281.26 2277.73 2278.67 2280.27
2276.24 2276.87 2279.54 2281.29 2284.14 2288.19 2288.16 2299.71 2298.35 2162.01 2294.63 2140.10 2203.20 2101.79 2219.69 2234.82
2249.15 2123.55 2216.69 2214.72 2196.75 2293.86 2304.25 2311.92 2171.59 2243.26 2221.75 2191.70 2140.65 2252.96 2263.09 2272.70
2277.95
5396.90 5275.54 5350.15
5534.14 5679.62 5656.39 5592.04
5316.63 5198.11 5447.21 5686.99 5718.83 5583.67 5620.66 5381.67 5349.41 5321.24 5153.62 5162.62 5426.02
5520.76 5527.53 5179.79
5403.18 5459.25 4752.61 4991.22 5297.28 5313.14 4993.75 5410.06 5245.59 5166.03 5211.49 5283.54 5594.76 5784.93 5765.62 5999.92 6065.14
1141.00 1142.00 1143.00 1144.00 1145.00 1146.00 1147.00 1148.00 1149.00 1150.00 1151.00 1152.00 1153.00 1154.00 1155.00 1156.00 1157.00 1158.00 1159.00 1160.00 1161.00 1162.00 1163.00
1164.00 1165.00 1166.00 1167.00 1168.00 1169.00 1170.00 1171.00 1172.00 1173.00 1174.00 1175.00 1176.00 1177.00 1178.00
1179.00 1180.00
2288.29 2294.75
2301.53 2309.25 2307.06 2258.51 2365.40 2348.08 2298.91 1705.10 1497.30 1776.59 1848.89 1818.35 1819.24 1916.97 2122.02 2138.36 2259.14 2245.88
2302.58 2216.93 2239.28
2262.57 2283.81 2298.86 2296.44 2270.99 2242.19 2225.42 2215.44 2217.78 1801.65 2233.93 2107.21 2230.10 2210.40 2087.19
2219.75 2218.83
48
5674.94 5999.47 5781.99 5339.74 5399.63
5080.58 5120.58 499258 5132.42 5237.49 4967.24
5020.01 4987.64 5207.56 5143.78 5436.88 5426.55 5424.37 5125.16 488151
4865.00 5071.65 5219.92
5445.73 5424.17 5369.57 5393.08 5404.90 5655.26 5456.80 5575.35 5580.02 4476.73 4667.70 4724.00 4867.98 4794.11 5067.85
4931.93 4698.77
1181.00 1182.00
1183.00 1184.00 1185.00 1186.00 1187.00 1188.00 1189.00 1190.00 1191.00 119200
1193.00 1194.00 1195.00 1196.00 1197.00 1198.00 1199.00 1200.00 1201.00 1202.00 1203.00
1204.00 1205.00 1206.00 1207.00 1208.00 1209.00 1210.00 1211.00 1212.00 1213.00 1214.00 1215.00 1216.00 1217.00 1218.00 1219.00 1220.00
2220.02 2219.96 2224.53 2226.81 2229.16 2232.41 2233.02 2238.92 2238.22 2267.95 2348.09 2342.38
2345.83 2348.18 1889.82 2263.19 2276.98 2278.30 2263.78 2260.21
2277.41 2306.57 2245.03
2226.41 2251.38 2232.26 2156.07
2237.24 2180.33 2256.18 2270.54 2287.24 2292.52 1591.44 2271.72 2274.59 2277.99 2283.93
2284.39 2288.42
5021.97 5020.69
5150.90 5272.88 5621.33 5569.46 5737.23 5667.94 4275.05 3717.14 3566.49 4491.05 4697.73 4950.39 4919.69 4834.77 4195.26 4368.18 4745.87 4136.78 3675.46 3835.13 4328.54
4397.80
4444.49 4282.30 4283.99 4703.79
4645.45 4826.76 4782.98 4880.39 5039.42 4991.75 5079.73 5297.98 5620.34 5719.57 5377.56 5256.04

1222.00 1223.00 1224.00 1225.00 1226.00 1227.00 1228.00 1229.00 1230.00 1231.00 1232.00 1233.00 1234.00 1235.00 1236.00 1237.00 1238.00 1239.00 1240.00 1241.00 1242.00 1243.00
1244.00 1245.00 1246.00 1247.00 1248.00
1249.00 1250.00 1251.00 1252.00 1253.00 1254.00 1255.00 1256.00 1257.00 1258.00 1259.00 1260.00
2299.22 1653.50 2287.62 2265.78 2256.12 2266.55 2275.88 2283.77 2290.81 2298.06 2289.09 2289.97 2248.98 2191.55 2291.30 2212.76 2245.49 2325.56 2330.66 2331.43 2327.17
2317.06 2279.25 2049.67 2005.24 1932.59 1782.85 1929.07 1921.34 1909.05 1841.42 1902.59 1899.04 1899.54 1904.17
1912.43 1917.95 1917.21
5497.52 4900.64 5309.68 5301.82 5410.04 5452.12 5410.57 5480.92 5438.80 5387.40 4633.19 4779.04 4685.00 4800.44 4851.15 4929.29 4668.36 4758.18 4797.68 4465.72 3847.57
3752.85 3912.08 4427.42 4377.40 4272.06 4802.98 5250.66 5230.63 5385.18 5487.56 5349.64 5303.54 4998.45 4840.16
5019.99 5019.21 5056.54
1261.00 1262.00 1263.00 1264.00 1265.00 1266.00 1267.00 1268.00
1269.00 1270.00 1271.00 1272.00 1273.00 1274.00 1275.00 1276.00 1277.00 1278.00 1279.00 1280.00 1281.00 1282.00 1283.00
1284.00 1285.00 1286.00 1287.00 1288.00 1289.00 1290.00 1291.00 1292.00 1293.00 1294.00 1295.00 1296.00 1297.00 1298.00 1299.00 1300.00
1914.34 1818.07 1944.03 1939.72 1943.19 1944.72 1952.20 1942.49 1933.76 1885.61 1859.73 1930.75 1953.15 1959.94 1961.61 1958.65 1934.82 1948.81 1927.37 1936.29 1956.94 1959.76 1960.18
1965.92 1968.35 1972.33 1980.37
1981.74 1981.31 1883.56 1900.86 1957.56 1911.58 1977.06 1974.67 1979.53 1981.28 1988.18 1985.14 1993.50
49
5133.28 4780.30 5719.15 5466.10 5731.39 5309.37 5403.63 5830.72 5826.37
6157.59 6223.25 5546.16 4959.68 5738.84 5306.96 5047.50 4338.25 4078.62 5807.57 5671.43 5786.74
5704.66 5708.72
5337.10 4990.65 5409.30 5290.09 5392.10 5485.16 5468.06 5401.99 6603.25 6237.61 6430.66 6245.93 6062.41 6394.66
6052.60 6075.33 6147.23
1301.00 1302.00 1303.00 1304.00 1305.00 1306.00 1307.00 1308.00 1309.00 1310.00 1311.00 1312.00 1313.00 1314.00 1316.00 1317.00 1318.00 1319.00 1320.00 1321.00 1322.00 1323.00 1324.00
1325.00 1326.00 1327.00 1328.00 1330.00 1331.00 1332.00 1333.00 1334.00 1335.00 1336.00 1337.00 1338.00 1339.00 1340.00 1341.00 1342.00
1900.94 1939.25 1977.88 1975.62 1974.83 1975.23 1979.63 1979.35 1978.93 1981.52 1991.33 1993.69 1993.52 1991.50 1995.33 2019.79 2020.65 2042.79
2049.16 1986.15 1986.51 1987.50 1992.65
2000.35 2006.70 2001.40 1990.96 2005.14 2012.86 2021.10 2029.70 2036.51 2033.80 2033.72 2030.41 2021.99 2020.49 2013.03 2010.51 2010.67
6229.74 6160.17 6274.32 6459.00 6268.00 6357.64 6173.19 6626.10 6556.48 6649.21 6666.35 6945.17 6774.92 6931.73 7371.42 7722.93 7603.01 7677.98 7369.66 7229.06 7440.16 7177.07 7422.67
7621.03 7355.85 7431.97 7439.70 7583.72 7723.47 7715.00 7724.85 7736.76 8080.88 8197.98 8350.81 8468.67 8381.72 8349.39 8710.22 8747.58

1343.00 1344.00 1345.00 1346.00 1347.00 1348.00 1349.00 1350.00 1351.00 1352.00 1353.00 1354.00 1355.00 1356.00 1357.00 1358.00 1359.00 1360.00 1361.00 1362.00 1363.00 1364.00 1365.00
1366.00 1367.00 1368.00 1369.00 1370.00 1371.00 1372.00 1373.00 1374.00 1375.00 1376.00 1377.00 1378.00 1379.00 1380.00 1381.00 1382.00
2006.65 2006.28 2011.90 2011.35 2009.49 2012.44
2010.51 2023.66 2031.51 2028.36 1958.27 1937.29 2030.05 2022.79 2028.33 2026.92 2028.77 2024.37 2026.52 2025.32 2028.73 2021.88 2035.22
2059.80 2087.44 2102.15 2112.13 2115.35 2111.37 2117.47 2133.91 2152.21 2146.21 2150.13 2154.66 2157.39 2157.33 2166.01 2164.59 2165.09
8254.88 8645.65 8342.73
8616.73 9149.42 9013.80 8996.28 7443.78 7245.17 7023.26 6781.15 6774.18 6736.52 6903.17 7661.06
8085.35 8833.55 9036.84
8109.44 8254.97 7749.17 5239.05 4903.16
4419.85 4111.04 4181.50 5743.59 6022.70 6057.69 6032.05 5863.01 5782.63 5786.19 5758.68 5382.55 5074.32 4746.91 5589.74 5930.96 6018.62
1383.00 1384.00 1385.00 1386.00 1387.00 1388.00 1389.00 1390.00 1391.00 1392.00 1393.00 1394.00 1395.00 1396.00 1397.00 1398.00 1399.00 1400.00 1401.00 1402.00 1403.00 1404.00 1405.00
1406.00 1407.00 1408.00 1409.00 1410.00 1411.00 1412.00 1413.00 1414.00 1415.00 1416.00 1417.00 1418.00 1419.00 1420.00 1421.00 1422.00
2169.61 2172.95 2171.34 2180.39 2179.32 2177.85 2176.73 2181.48 2174.29 2171.47 2161.83 2158.90 2167.26 2171.40 2170.61 2170.99 2166.58 2181.37 2184.11 2188.78 2180.62 2176.33 2181.56
2177.26 2177.37 2174.97 2172.86 2166.34 2166.64 2173.11 2173.28 2177.19 2182.07 2180.42 2181.08 2191.39 2185.78 2194.94
2200.10 2205.06
50
6901.20 8549.84 6852.55 6534.66 6472.13 6388.50 4999.51 6376.07 6851.76 6827.56 7794.45 8863.42 7753.59 6931.80 5937.59 6174.52 5642.71 6190.23 6401.59 6791.74 7114.16 6934.63 6472.95
6411.31 6426.55 6611.18 6652.09
7751.28 8733.08 8793.02 8670.26 8602.23 7464.21 6556.45 6949.66 7340.92 7751.21 7593.10 7712.43 7917.02
1424.00 1425.00 1426.00 1427.00 1428.00 1429.00 1430.00 1431.00 1432.00 1433.00 1434.00 1435.00 1436.00 1437.00 1438.00 1439.00 1440.00 1441.00 1442.00 1443.00 1444.00 1445.00 1446.00
1447.00 1448.00 1449.00 1450.00 1451.00 1452.00 1453.00 1454.00 1455.00 1456.00 1457.00 1458.00 1459.00 1460.00 1461.00 1462.00 1463.00
2198.35 2203.04 2198.55 2205.97 2206.18 2209.45 2216.34 2214.02 2216.96 2216.56 2221.58 2227.23 2225.09 2229.91 2423.93
2488.39 2488.91 2487.21 2329.54 2466.28 2509.55 2511.53 2287.72
2504.38 2507.92 2426.49 2484.21 2487.43 2484.91 2487.74 2474.27 2471.18 2397.16 2405.10 2480.72 2263.28 2207.67 2206.76 2182.91 2200.11
7884.20 7992.23 8504.25 8149.88 7932.65 7211.89 8057.27 8262.17 8226.63 8217.47
7816.87 7985.22 8319.00 8746.18 6353.23 5911.07 6112.89 5860.10 6006.54 5627.07 5532.52 5646.63 5711.07
5791.59 6125.12 5449.42 5691.85 5785.92 6078.09 6138.97 6150.97 6060.08 6273.55 5890.71 6379.34 5969.31 6307.24
6404.65 6103.91 6240.45
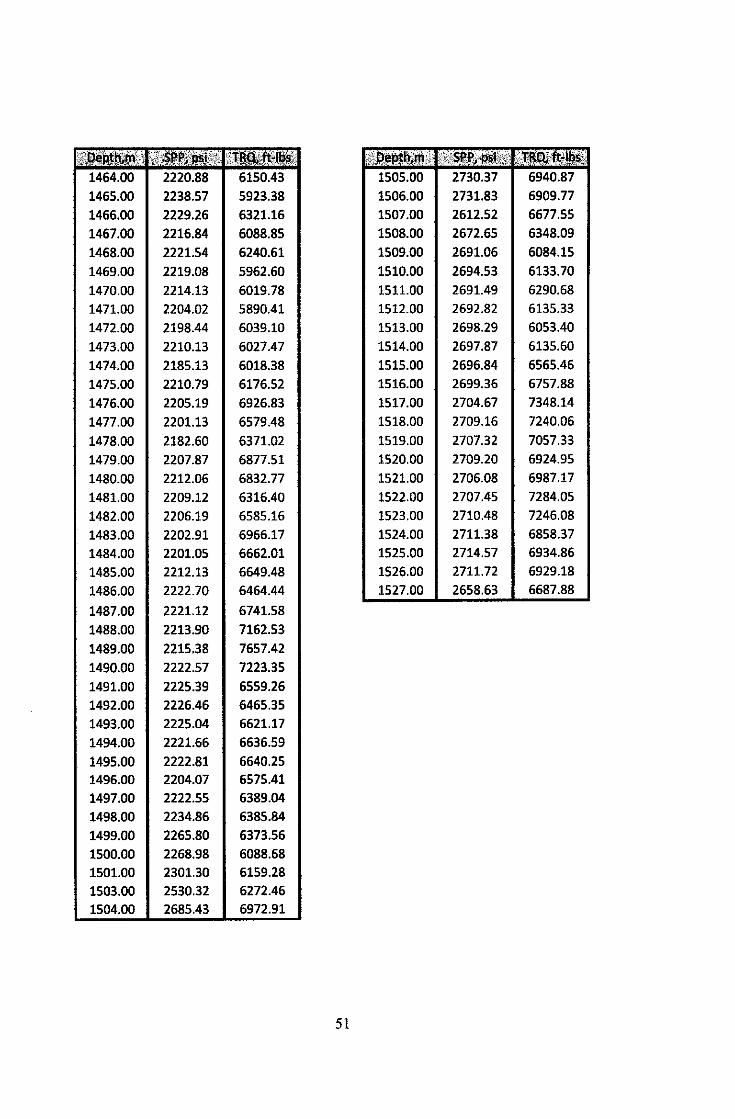
1465.00 2238.57 5923.38 1506.00 2731.83 6909.77
1466.00 2229.26 6321.16 1507.00 2612.52 6677.55
1467.00 2216.84 6088.85 1508.00 2672.65 6348.09
1468.00 2221.54 6240.61 1509.00 2691.06 6084.15
1469.00 2219.08 5962.60 1510.00 2694.53 6133.70
1470.00 2214.13 6019.78 1511.00 2691.49 6290.68
1471.00 2204.02 5890.41 1512.00 2692.82 6135.33
1472.00 2198.44 6039.10 1513.00 2698.29 6053.40
1473.00 2210.13 6027.47 1514.00 2697.87 6135.60
1474.00 2185.13 6018.38 1515.00 2696.84 6565.46
1475.00 2210.79 6176.52 1516.00 2699.36 6757.88
1476.00 2205.19 6926.83 1517.00 2704.67 7348.14
1477.00 2201.13 6579.48 1518.00 2709.16 7240.06
1478.00 2182.60 6371.02 1519.00 2707.32 7057.33
1479.00 2207.87 6877.51 1520.00 2709.20 6924.95
1480.00 2212.06 6832.77 1521.00 2706.08 6987.17
1481.00 2209.12 6316.40 1522.00 2707.45 7284.05
1482.00 2206.19 6585.16 1523.00 2710.48 7246.08
1483.00 2202.91 6966.17 1524.00 2711.38 6858.37
1484.00 2201.05 6662.01 1525.00 2714.57 6934.86
1485.00 2212.13 6649.48 1526.00 2711.72 6929.18
1486.00 2222.70 6464.44 1527.00 2658.63 6687.88
1487.00 2221.12 6741.58
1488.00 2213.90 7162.53
1489.00 2215.38 7657.42
1490.00 2222.57 7223.35
1491.00 2225.39 6559.26 1492.00 2226.46 6465.35 1493.00 2225.04 6621.17
1494.00 2221.66 6636.59
1495.00 2222.81 6640.25 1496.00 2204.07 6575.41
1497.00 2222.55 6389.04
1498.00 2234.86 6385.84
1499.00 2265.80 6373.56
1500.00 2268.98 6088.68 1501.00 2301.30 6159.28
1503.00 2530.32 6272.46 1504.00 2685.43 6972.91
51
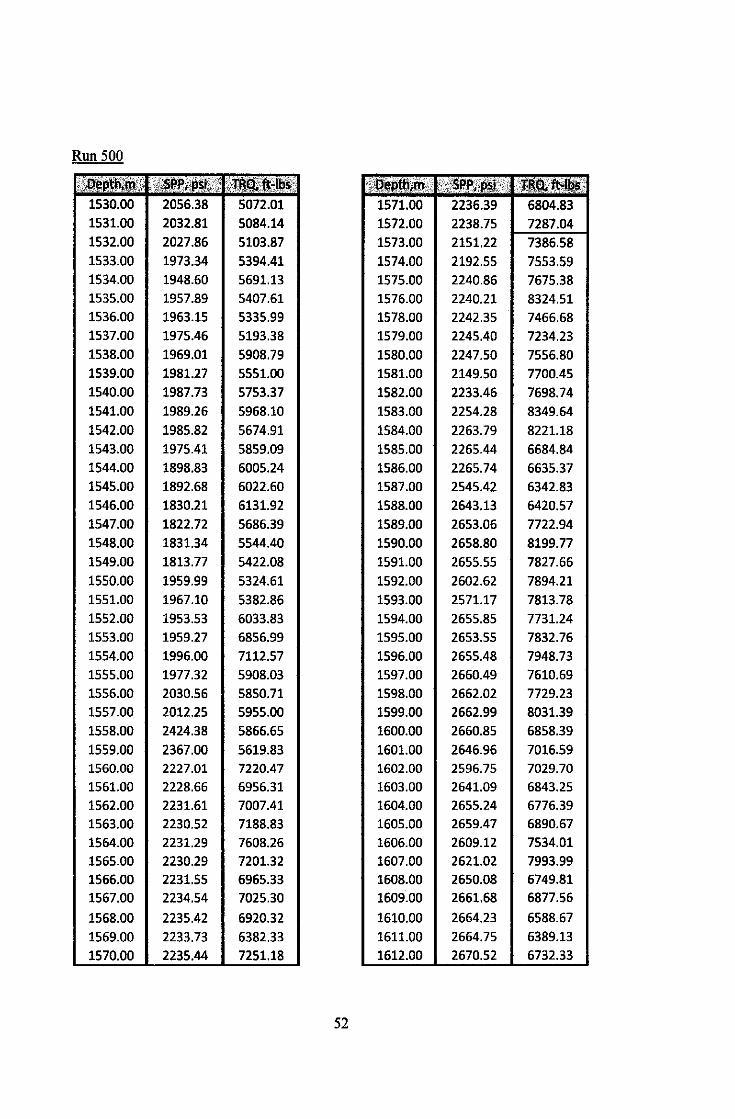
Run500
;.&!l~m:: ···'li~R;·.~~ilW ;')f;~if~~llt~: i'l::!~p~§~·· 'V·SPP;if1'§i2 .. i . :)(~fbllt$. ;•-",,-, '_,., ........ _,,_,.;;
1530.00 2056.38 5072.01 1571.00 2236.39 6804.83 1531.00 2032.81 5084.14 1572.00 2238.75 7287.04 1532.00 2027.86 5103.87 1573.00 2151.22 7386.58 1533.00 1973.34 5394.41 1574.00 2192.55 7553.59 1534.00 1948.60 5691.13 1575.00 2240.86 7675.38 1535.00 1957.89 5407.61 1576.00 2240.21 8324.51 1536.00 1963.15 5335.99 1578.00 2242.35 7466.68 1537.00 1975.46 5193.38 1579.00 2245.40 7234.23 1538.00 1969.01 5908.79 1580.00 2247.50 7556.80 1539.00 1981.27 5551.00 1581.00 2149.50 7700.45 1540.00 1987.73 5753.37 1582.00 2233.46 7698.74 1541.00 1989.26 5968.10 1583.00 2254.28 8349.64 1542.00 1985.82 5674.91 1584.00 2263.79 8221.18 1543.00 1975.41 5859.09 1585.00 2265.44 6684.84 1544.00 1898.83 6005.24 1586.00 2265.74 6635.37 1545.00 1892.68 6022.60 1587.00 2545.42 6342.83 1546.00 1830.21 6131.92 1588.00 2643.13 6420.57 1547.00 1822.72 5686.39 1589.00 2653.06 7722.94 1548.00 1831.34 5544.40 1590.00 2658.80 8199.77 1549.00 1813.77 5422.08 1591.00 2655.55 7827.66
1550.00 1959.99 5324.61 1592.00 2602.62 7894.21 1551.00 1967.10 5382.86 1593.00 2571.17 7813.78 1552.00 1953.53 6033.83 1594.00 2655.85 7731.24 1553.00 1959.27 6856.99 1595.00 2653.55 7832.76 1554.00 1996.00 7112.57 1596.00 2655.48 7948.73 1555.00 1977.32 5908.03 1597.00 2660.49 7610.69 1556.00 2030.56 5850.71 1598.00 2662.02 7729.23 1557.00 2012.25 5955.00 1599.00 2662.99 8031.39 1558.00 2424.38 5866.65 1600.00 2660.85 6858.39
1559.00 2367.00 5619.83 1601.00 2646.96 7016.59 1560.00 2227.01 7220.47 1602.00 2596.75 7029.70 1561.00 2228.66 6956.31 1603.00 2641.09 6843.25 1562.00 2231.61 7007.41 1604.00 2655.24 6776.39 1563.00 2230.52 7188.83 1605.00 2659.47 6890.67 1564.00 2231.29 7608.26 1606.00 2609.12 7534.01 1565.00 2230.29 7201.32 1607.00 2621.02 7993.99 1566.00 2231.55 6965.33 1608.00 2650.08 6749.81 1567.00 2234.54 7025.30 1609.00 2661.68 6877.56
1568.00 2235.42 6920.32 1610.00 2664.23 6588.67
1569.00 2233.73 6382.33 1611.00 2664.75 6389.13 1570.00 2235.44 7251.18 1612.00 2670.52 6732.33
52

1656.00 2632.77 7249.94 1615.00 2603.77 6759.46 1657.00 2632.67 7373.05 1616.00 2653.33 6746.82 1658.00 2638.85 7260.56 1617.00 2653.38 6625.35 1659.00 2636.11 6960.17 1618.00 2593.49 6554.04 1661.00 2633.76 7115.68 1619.00 2646.66 6512.46 1662.00 2445.22 7063.16 1620.00 2647.70 6740.51 1663.00 2286.78 6676.59 1621.00 2611.63 6704.80 1664.00 2290.59 7320.67 1622.00 2669.38 6690.76 1665.00 2295.66 7417.08 1623.00 2672.51 6621.33 1666.00 2295.91 7706.76 1624.00 2749.38 6602.94 1667.00 2297.22 8031.19 1625.00 2624.22 6967.26 1668.00 2295.72 7609.09 1626.00 2685.84 7399.50 1669.00 2296.83 7513.76 1627.00 2693.13 7153.52 1670.00 2296.01 7785.67 1628.00 2700.32 7009.10 1671.00 2297.02 7976.12 1629.00 2680.13 7007.79 1672.00 2390.83 7612.31 1630.00 2792.68 6885.05 1673.00 2687.86 7208.78 1631.00 2769.94 7163.44 1674.00 2687.72 7463.84 1632.00 2742.43 7480.99 1675.00 2668.26 7967.61 1634.00 2701.59 7260.42 1676.00 2678.56 7833.48 1635.00 2699.15 7037.97 1677.00 2684.57 7969.76 1636.00 2710.38 6969.47 1678.00 2685.19 7845.17 1637.00 2727.72 6825.41 1679.00 2629.10 7916.80 1638.00 2736.92 7064.74 1680.00 2689.73 8283.21 1639.00 2726.10 7345.68 1681.00 2689.30 8136.01 1640.00 2715.18 7185.74 1682.00 2686.44 7452.10 1641.00 2692.57 7191.26 1683.00 2677.23 7581.47 1642.00 2681.93 7449.46 1684.00 2679.48 7457.12 1643.00 2684.53 7149.86 1685.00 2683.86 7092.05 1644.00 2745.47 7173.54 1686.00 2675.01 8245.89 1645.00 2701.82 7142.29 1687.00 2675.13 7615.05 1646.00 2686.51 7051.36 1688.00 2678.77 7833.81 1647.00 2693.81 7037.62 1689.00 2687.21 7803.62 1648.00 2681.27 6923.53 1690.00 2679.46 8042.65 1649.00 2657.56 6884.35 1691.00 2681.47 9908.65 1650.00 2662.51 6793.69 1692.00 2655.94 8271.26 1651.00 2636.03 6867.94 1693.00 2702.66 9197.16 1652.00 2640.70 6817.13 1694.00 2705.45 9190.29
1653.00 2643.84 7237.56 1654.00 2643.49 7021.19 1655.00 2637.68 7174.22
53