financial analysis and fiscal viability of secondary
TRANSCRIPT

Brigham Young University Brigham Young University
BYU ScholarsArchive BYU ScholarsArchive
Theses and Dissertations
2006-12-08
Financial Analysis and Fiscal Viability of Secondary Schools in Financial Analysis and Fiscal Viability of Secondary Schools in
Mukono District, Uganda Mukono District, Uganda
Janet Jeffery Tanner Brigham Young University - Provo
Follow this and additional works at: https://scholarsarchive.byu.edu/etd
Part of the Educational Leadership Commons
BYU ScholarsArchive Citation BYU ScholarsArchive Citation Tanner, Janet Jeffery, "Financial Analysis and Fiscal Viability of Secondary Schools in Mukono District, Uganda" (2006). Theses and Dissertations. 1289. https://scholarsarchive.byu.edu/etd/1289
This Dissertation is brought to you for free and open access by BYU ScholarsArchive. It has been accepted for inclusion in Theses and Dissertations by an authorized administrator of BYU ScholarsArchive. For more information, please contact [email protected], [email protected].

FINANCIAL ANALYSIS AND FISCAL VIABILITY OF SECONDARY SCHOOLS
IN MUKONO DISTRICT, UGANDA
by
Janet J. Tanner
A dissertation submitted to the faculty of
Brigham Young University
in partial fulfillment of the requirements for the degree
Doctor of Philosophy
Department of Educational Leadership and Foundations
Brigham Young University
August 2006


Copyright © 2006 Janet J. Tanner
All Rights Reserved


ABSTRACT
FINANCIAL ANALYSIS AND FISCAL VIABILITY OF SECONDARY SCHOOLS
IN MUKONO DISTRICT, UGANDA
Janet J. Tanner
Department of Educational Leadership and Foundations
Doctor of Philosophy
Within the worldwide business community, many analysis tools and techniques
have evolved to assist in the evaluation and encouragement of financial health and fiscal
viability. However, in the educational community, such analysis is uncommon. It has
long been argued that educational institutions bear little resemblance to, and should not
be treated like, businesses. This research identifies an educational environment where
educational institutions are, indeed, businesses, and may greatly benefit from the use of
business analyses.
The worldwide effort of Education for All (EFA) has focused on primary
education, particularly in less developed countries (LDCs). In Sub-Saharan Africa,
Uganda increased its primary school enrollments from 2.7 million in 1996 to 7.6 million
in 2003. This rapid primary school expansion substantially increased the demand for
secondary education. Limited government funding for secondary schools created an
educational bottleneck. In response to this demand, laws were passed to allow the
establishment of private secondary schools, operated and taxed as businesses.


Revenue reports, filed by individual private schools with the Uganda Revenue
Authority, formed the database for the financial analysis portion of this research. These
reports, required of all profitable businesses in Uganda, are similar to audited corporate
financial statements. Survey data and national examination (UNEB) scores were also
utilized.
This research explored standard business financial analysis tools, including
financial statement ratio analysis, and evaluated the applicability of each to this LDC
educational environment. A model for financial assessment was developed and industry
averages were calculated for private secondary schools in the Mukono District of
Uganda. Industry averages can be used by individual schools as benchmarks in assessing
their own financial health. Substantial deviations from the norms signal areas of potential
concern. Schools may take appropriate corrective action, leading to sustainable fiscal
viability. An example of such analysis is provided. Finally, school financial health,
defined by eight financial measures, was compared with quality of education, defined by
UNEB scores.
Worldwide, much attention is given to education and its role in development.
This research, with its model for financial assessment of private LDC schools, offers a
new and pragmatic perspective.


ACKNOWLEDGEMENTS
I have been particularly fortunate to have the superb guidance and academic
mentorship of Steven J. Hite. His wisdom, wit, and research expertise are deeply
appreciated. He is uncompromising in his academic integrity. Julie M. Hite, a major
committee member and custodian of the survey dataset, also provided insightful
consultation and mentoring. Other mentors on this “dream team” dissertation committee
included Joseph L. Matthews, Clifford Mayes, and Ellen Williams. Each has made
substantial and unique contributions to this project. All have been truly influential and
supportive.
This work would not have been possible without the educational examples and
support of my children. Jeff, Jamie, Danny, and Melissa have given freely of their time
and expertise. They, along with Jeff’s wife, Mary, joined me in Uganda for the initial
field research. They set aside their own baccalaureate and graduate studies from time to
time to offer critical review and perspective. During the course of my doctoral studies,
all have been actively involved in NGO poverty alleviation efforts in less developed
countries. They have inspired as well as supported me in my research efforts.
Finally, many more family members, friends, and a wonderful doctoral cohort
have offered emotional, moral, and technical support whenever possible. In the later
stages of analysis, a business consultant and friend, John B. Updike, spent countless
hours proofing and verifying financial data and statistical reports. My gratitude also
extends to my siblings, particularly Larry S. Jeffery and Duane E. Jeffery, who have
inspired me for decades with their own academic research.


xv
TABLE OF CONTENTS
ABSTRACT...............................................................................................................ix ACKNOWLEDGEMENTS.......................................................................................xiii LIST OF TABLES.....................................................................................................xxi LIST OF FIGURES ...................................................................................................xxiii CHAPTER 1: INTRODUCTION.............................................................................1 Education as a Right, Education for All ....................................................................1 Education in Uganda..................................................................................................2 Financial Assessment in Education ...........................................................................3 Business Analysis as a Tool in Assessing Organizational Financial Health .............4 The Gap (Research Problem).....................................................................................6 Research Questions........................................................................................6 Purpose...........................................................................................................7 Methodology..............................................................................................................7 Perceived Benefits of this Research...........................................................................9 Clarification ...............................................................................................................9 CHAPTER 2: REVIEW OF THE LITERATURE ...................................................11 Introduction to Literature Review..............................................................................11 Education as a Right, Education for All ....................................................................13 Importance of Education in a Global Context ...............................................13 Education as a Fundamental Human Right....................................................13 Education for All (EFA) ................................................................................14 EFA Mid-decade Review...................................................................15 The EFA 2000 Review.......................................................................16 Millennial Development Goals (MDGs) .......................................................17 EFA Summary ...............................................................................................18 Education in Uganda..................................................................................................19 Education in Developing Regions of the World ............................................19 Africa and Sub-Saharan Africa......................................................................20 Education in Africa and Sub-Saharan Africa.....................................22 The Impact of HIV/AIDS on Education in Sub-Saharan Africa .......23 EFA Progress and Assessment in Sub-Saharan Africa..................................24 Uganda ...........................................................................................................26
Statistical, Historical, Demographic, and Political Background of Uganda ...............................................................................................26 Education in Uganda..........................................................................29 UPE in Uganda ......................................................................31 Challenges related to UPE in Uganda....................................32

xvi
xvii
Beyond Primary Education ....................................................33 Secondary Schools in Uganda .......................................................................34 Private Secondary Schools in Uganda ....................................................35 Incongruity in Statistics ..........................................................................37 Schools as Businesses in Uganda ..................................................................38 Financial Assessment in Education ...........................................................................42 Financial Assessment in Settings Other than Education................................43 Finances in Education....................................................................................44 Assessment in Education ...............................................................................48 Considerations for Financial Assessment in Education.................................50 Business Analysis as a Tool in Assessing Organizational Financial Health .............52 Business Analysis ..........................................................................................53 Financial Statements ......................................................................................54 Financial Statement Analysis.........................................................................57 Financial Statement Ratio Analysis ...............................................................62 Caveats Regarding Analysis Based on Financial Statements ........................65 Financial Assessment of Secondary Schools in Mukono District, Uganda...............67 Description of the Mukono District of Uganda .............................................67 Summary of Literature Review..................................................................................68 CHAPTER 3: METHODOLOGY ............................................................................71 Project Summary........................................................................................................71 Limitations .................................................................................................................72 Delimitations..............................................................................................................73 Data ............................................................................................................................74 Archival survey data ......................................................................................74 Background of the Field Research and Survey Instruments..............74 Data Collection ..................................................................................76 Data Entry ..........................................................................................77 UNEB Scores .................................................................................................78 Revenue Reports ............................................................................................78 Identifying Schools That Filed Revenue Reports ..............................79 Obtaining Filed Revenue Reports.......................................................81 Data Analysis .............................................................................................................82 Methods......................................................................................................................83 Research Question # 1 ..................................................................................83 Research Question # 2 ..................................................................................86 Research Question # 3 ..................................................................................87 Conclusion .................................................................................................................88 CHAPTER 4: ANALYSIS AND FINDINGS ..........................................................89 Survey Data Set Financial Analysis...........................................................................89 The Survey Instrument...................................................................................90 Responses to Survey Instrument....................................................................91 Revenue Report Analysis...........................................................................................92 Accuracy and Reliability of Revenue Reports...............................................93

xviii

xix
Data Difficulties, Inconsistencies and Explanations—Revenue Reports ......93 Basis for Calculation of Averages .................................................................94 Financial Analysis of Revenue Reports.........................................................95 Horizontal Analysis ...........................................................................96 Vertical Analysis................................................................................98 Common Size Statements ..................................................................99 Ratio Analysis....................................................................................103 Cross-sectional Analysis....................................................................105 Other Elements in Financial Analysis as Dictated by the Setting .....107 Ranking: A Supplementary Analysis Tool .......................................107 UNEB Data Set ..........................................................................................................109 Correlations between Data Set Elements...................................................................112 Conclusion .................................................................................................................116 CHAPTER 5: DISCUSSION AND CONCLUSIONS..............................................117 Research Questions....................................................................................................117 Potential Use of Financial Analysis Tools in an LDC Setting.......................118 Model for Assessment of Financial Viability ................................................121 Financial Quality versus Educational Quality ...............................................125 Comments on Other Findings ....................................................................................127 Non-structural Correlations between Financial Variables.............................127 Highly Leveraged Female Schools ................................................................128 Current Ratio, Size of Schools, Percent Boarding, and Age .........................130 Implications of This Research ...................................................................................132 Research Summary ....................................................................................................136 From Yellow Brick to Dirt Road: Personal Reflections on This Research ..............136 Conclusion .................................................................................................................139 REFERENCES ..........................................................................................................141 APPENDIX A: List of Acronyms.............................................................................171 APPENDIX B: Letters and Introductions.................................................................175 APPENDIX C: Four-part Survey..............................................................................187 APPENDIX D: Formulas for Business Ratio Analysis by Grouping........................225 APPENDIX E: Sample Excel Database Spreadsheets..............................................245 APPENDIX F: Findings ...........................................................................................249 APPENDIX G: Example of Comprehensive Analysis: School Y...........................345

xx

xxi
LIST OF TABLES
Table 2.1 Formal School System in Uganda ...........................................................30 Table 2.2 Number of Secondary Schools in Uganda, 1997 to 2001........................35 Table 2.3 Composition of Secondary Schools in Uganda, 2001 to 2004 ................37 Table 4.1 Horizontal Analysis: Income Statement and Balance Sheet,
School X...................................................................................................97 Table 4.2 Example of Vertical Analysis of an Income Statement,
School X....................................................................................................100 Table 4.3 Example of Balance Sheet Expressed in Comparative Common-size
Percentages, School X, 2 Fiscal Years......................................................101 Table 4.4 Example of Income Statement Expressed in Comparative Common-size
Percentages, School X, 2 Fiscal Years.....................................................102 Table 4.5 Seven Key Ratios.....................................................................................104 Table 4.6 Seven Key Ratios + One Financial Element for School X ......................105 Table 4.7 Cross-sectional Analysis, Profit Ratio, and Relative Ranking ................106 Table 4.8 Profit Margin with Comparative Ranking ...............................................109 Table 4.9 UNEB Scores and Ranking......................................................................110 Table 4.10 Correlations of UNEB Scores with 14 Other Variables .........................115 Table 5.1 Model for Financial Assessment Using Business Analysis Tool ...........123

xxii

xxiii
LIST OF FIGURES
Figure 4.1 Histogram Showing the Distribution of UNEB Scores
for 10 Schools ..........................................................................................111 Figure 4.2 Histogram Showing the Distribution of UNEB
for 59 Schools ..........................................................................................112


CHAPTER 1
INTRODUCTION
Education is critical to the progress of individuals and nations. In his opening
speech at the Conference on Education for African Renaissance in the Twenty-first
Century, President Thabo Mbeki (1999) of South Africa, stated the following:
If the next century is going to be characterized as a truly African century, for
social and economic progress of the African people, the century of durable peace
and sustained development in Africa, then the success of this project is dependent
on the success of our education systems. (p. 1)
Education as a Right, Education for All
Over 55 years ago, the Universal Declaration of Human Rights, proclaimed and
adopted by the General Assembly of the United Nations, asserted that “everyone has a
right to education” (United Nations, 1948, Article 26.1). Realizing that significant
numbers of the world’s population still did not have adequate access to education, the
World Conference on Education for All was convened in Jomtien, Thailand, in 1990.
Discussions were held, culminating in plans and global commitments to provide
education for every human being “to meet their basic learning needs” (UNESCO, 1990,
Article 1.1).
Education for All (EFA) acknowledged the need for and challenges associated
with providing educational opportunities from early childhood to adulthood. However,
much of the real commitment of countries and funding institutions alike focused on
Universal Primary Education (UPE) (Delors et al., 1996).

2
Education in Uganda
Uganda’s formal education system, like that of numerous other African countries,
reflects a post-colonial structure with students advancing by examination through
primary, secondary, and tertiary levels (Ssekamwa, 1997). Historically, education has
not been available to all. Lack of economic resources, racial and religious segregation
(Ssekamwa & Lugumba, 2001), and severe political strife have been primary contributing
factors. Under the government of President Yoweri Museveni (1986 to present), great
strides have been made in achieving universal primary education within Uganda (Ndeezi,
2000). Enrollments in primary schools increased from 2.7 million in 1996 to 7.6 million
in 2003 (Miovic, 2004; MOES, 2004a). As a midpoint perspective during this growth
period, it is noted that in 1999/2000, gross primary enrollments were calculated at 124%
and net primary enrollment was 93% (Liang, 2002).
In a World Development project assessment report, Ingram (2004) offered this
perspective on the rapid expansion of education in Uganda:
‘Big bang’ expansion of primary enrollments has long-term downstream fiscal
implications beyond just the primary sub-sector. Uganda is confronting the need
to increase capital and recurrent funding to post-primary education, now that
pupils in the universal primary education (UPE) bulge are completing the primary
cycle. ( p. x)
Analyzing the broad implications of this problem, Yusuf K. Nsubuga,
Commissioner for Secondary Education, stated “failure to absorb the growing number of
primary school leavers will undermine Universal Primary Education and broader national
goals like the elimination of poverty” (Kirungi, 2001, p. 2).

3
The government of Uganda recognized the great need and demand for secondary
schooling, but limited financial resources hampered its ability to respond. An alternative
solution was offered with the passing of the Local Governments Act of 1997. This Act
had the effect of decentralizing control of education, thereby allowing more private
secondary schools to be established (D. B. Holsinger, J. Jacob, & C. Mugimu, 2002a;
MOES, 2001; Uganda, 2001). A proliferation of these schools followed, and by 2002
there was a total of 1,390 community and private secondary schools (not government
funded), compared with 490 government secondary schools (partially government
funded) (Liang, 2002). Consequently, total secondary school enrollments increased from
445,000 in 1997 to 759,000 in 2003 (Miovic, 2004). Essentially, these new private
secondary schools were established and are being run and taxed as business entities ("The
income tax act cap. 340," 1997, p. 7034).
The success of these private secondary schools is, at least in part, dependent upon
their ability to remain financially viable. In the absence of guaranteed revenue streams,
generally via government or private funding, these entities, like all other business entities,
face the realities of competition for clients and the need to maximize revenues (financial
resource inflows) while minimizing expenses (financial resource outflows).
Financial Assessment in Education
Studies relative to finances and education in a broad, global context have
primarily focused on such measures as social and private returns on investment (Pritchett,
2004) or the relationship between financial inputs and student outputs (Ardon, 1999). In
recent decades, financial educational analysis has been most visible in the production
function model which aggregates data and then seeks to distill the entire analysis to a

4
single measurement (Greenwald, Hedges, & Laine, 1996; Hanushek, 1997). While these
types of analyses may be helpful at the policy level, they provide little benefit to fledgling
private school businesses in need of specific, non-aggregated indicators as they work
toward financial stability and long-term fiscal viability for their individual institutions.
There has been growing global usage of business concepts, such as accountability
and product quality, applied to the education context (Huitt, 2004; Watkins, Watt, &
Buston, 2001). However, basic financial assessment models used to measure financial
health of business entities have not often been applied to education. These models, so
commonly used in business throughout the world that industry standards have been
developed, look at such measures as short-term profitability, efficiency, and long-term
viability (Ketz, Doogar, & Jensen, 1990). This lack of application to the educational
context is understandable. Schools are generally viewed not as businesses but as
extensions of governmental entities or well-heeled religious or charitable organizations
with relatively unlimited streams of resources flowing to them, lack of a demand-driven
repeat market, and non-differentiation of “product” (Hartzell, 2003). However, as more
schools are established and run as businesses without governmental guarantees of
funding and in response to market demand for services, the need increases for appropriate
tools to be identified which can assist in establishing and maintaining the financial health
of these educational business entities.
Business Analysis as a Tool
in Assessing Organizational Financial Health
In a competitive marketplace, managers (internal stakeholders), investors, and
creditors (external stakeholders) are constantly searching for ways to assess the financial
5
health of a company. Business analysis tools have a long history of usage (Bliss, 1923;
Ketz et al., 1990; Lewellen, 2005; C. C. Marsh, 1850; Tamari, 1978). Based on financial
information and prescribed financial statements prepared according to generally accepted
accounting principles (GAAP), specific ratios are identified for internal and external
analysis (Gates, 1993). Indeed, many college courses and textbooks specifically address
this widely recognized field (Bernstein & Wild, 2000; White, Sondi, & Fried, 1998).
Outside the realm of academic instruction, there are many “how to” books (Helfert,
1997), trade organization publications (IOMA, 2003), and even online sources (Dun &
Bradstreet, 2001; ZeroMillion.com, 2005) that address and teach financial analysis of
organizations.
The similarity of the secondary school market in Uganda to other service sector
businesses suggests that, through the use of common business assessment practices
applied to actual school financial data, a model of fiscal viability can be developed. In an
industry (private secondary education in economically developing countries) where there
is no known standard for financial health assessment, such a model, to be refined over
time through additional analysis, would serve as a baseline for comparison, study, and for
evaluation of individual entities against an industry standard. The use of industry
standards is common, globally and across industries, and serves as a barometer for
financial health assessments (Ketz et al., 1990). It has long been recognized that
financial ratios and models are relatively uniform within industries but differ across
industry lines (M. C. Gupta & Huefner, 1972). Private schools form a substantial portion
of secondary education in many developing countries (Holsinger & Cowell, 2000).

6
Therefore, it is imperative to develop industry standards for this newly emerging
industry—the private secondary school sector in developing countries.
The Gap (Research Problem)
EFA, with its emphasis on UPE, has created a demand for secondary school
education in Uganda. Although many private schools have been established to address
this demand, there are no guidelines or models for financial viability and success in this
industry. This is an this environment of relatively impoverished customers/clients
(students) who have great expectations of personal benefits, including increased
likelihood of employment opportunities, but who lack access to resources to fund their
educations. It is imperative that these non-government funded schools, generally run as
businesses, deliver the best product at the best price. In other industries, models of
financial health have been developed as guidelines and benchmarks. Business analysis
tools, particularly financial ratio analysis, are used to measure financial health.
Identification of weaknesses in financial composition of an organization, coupled with
subsequent appropriate action, can lead to improved financial health, efficiency, and
long-term viability (Miller & Miller, 1991). In the educational market no such model
exists to serve as a beacon and guide to these fledgling schools.
Research Questions
Three research questions will be addressed. They relate to development of a
model for the assessment of fiscal viability for secondary schools in the Mukono District
of Uganda.

7
1. Using business models for financial assessment, what analysis tools and financial
ratios may be effectively applied to private secondary schools in Uganda in
developing a model of fiscal viability?
2. What transformations or modifications to standard business models of financial
assessment are required to build an appropriate model of fiscal viability for
private secondary schools in an economically developing country?
3. Using quantitative analysis, is there an apparent link between this newly
developed model and the standard quality measurement of student performance,
i.e., Uganda national examination scores (J. M. Hite, S. J. Hite, C. B. Mugimu, J.
W. Rew, & Y. Nsubuga, 2004b)?
Purpose
The purpose of this research is to develop and test a model of fiscal viability by
applying time-tested business analysis tools, including financial ratio analysis, to private
secondary schools in the Mukono District of Uganda. The majority of these schools were
essentially conceived, established, and are currently run as entrepreneurial businesses.
Chapter 2 contains a review of the literature utilized in this project.
Methodology
A complete discussion of methodology used in this research is found in Chapter 3.
Briefly, activities using previously collected data were performed in preparation for this
project. They are as follows:
1. All secondary schools with UNEB (national testing center) status within the
Mukono District of Uganda as of June 30, 2003, were identified.

8
2. Student performance data in the form of national examination scores were
obtained for these schools.
3. A list was compiled of schools responding that they have filed revenue
reports. These financial statements are required of all businesses in Uganda
for taxation purposes.
4. Revenue reports were obtained for all schools that had filed.
All previously collected data are covered under the Institutional Review Board
(IRB) Research Proposal granted to Dr. Steven J. Hite, Department of Educational
Leadership and Foundations, School of Education, Brigham Young University (BYU),
Provo, Utah, which is dated May 5, 2003 (see Appendix B). Access to this data for
purposes of this research proposal has been granted by both of the principal investigators,
Dr. Steven J. Hite and Dr. Julie M. Hite.
Additional steps were taken in the analysis phase of this research project. They
address the above stated research questions.
1. The revenue reports were reviewed and analyzed using the theoretical
framework of an exploratory data analysis approach (Hoaglin, Mosteller, &
Tukey, 1991; Tukey, 1970).
2. Determination was made of the appropriateness and applicability of standard
business financial analysis tools, in this educational setting utilizing the theory
of mindfulness advocated by Brody and Coulter (2002) in application to
dynamic business environments.
3. A model for assessing fiscal viability for private secondary schools in the
Mukono District of Uganda was developed.

9
4. The model was tested by comparing the financial health/fiscal viability of the
respective schools with their students’ examination scores in order to
determine if any relationship exists between institutional financial well-being
and quality of student performance.
Data analyses were performed using Excel and SPSS computational and statistical
programs. Findings of these analyses are presented in Chapter 4. Chapter 5 provides an
interpretation of the findings and their implications.
Perceived Benefits of this Research
It is anticipated that this research will have multiple benefits. Among them are
the following
1. Generate baseline industry averages and a model for assessing fiscal viability of
private secondary schools in the Mukono District of Uganda.
2. Stimulate further discussion and research on the relationship between fiscal
viability and quality of education.
Clarification
The first three chapters of this document were written before actual data analysis
was performed. These chapters have been slightly modified to reflect the fact that the
research and analysis have now been conducted.
In exploratory research, findings inform and guide the researcher to further
analysis and findings. This iterative, informative analysis process may provide
clarification and refinement of the research issues, including research questions.

10
A description of the exploratory research process used in this project is presented
in Chapter 5. A discussion is also included regarding the clarification of concepts and
terms, as well as refinement of the wording of the research questions.

11
CHAPTER 2
REVIEW OF THE LITERATURE
Introduction to Literature Review
The twenty-first century dawned with the world connected in a way previously
unknown. Globalization has become a commonplace term. Its implications are profound.
No longer can world citizens live in isolation, unconcerned about their neighbors and
their neighbors’ well-being. Global organizations dominate many arenas and are manifest
in structures as diverse as governmental alliances, religious and philanthropic institutions,
and business corporations. Although our motives and objectives may differ, all attest to
the fact that almost every facet of our lives is affected by some global influence.
Great world wars, both militaristic and ideological, were fought in the century
past. This new century brings new understanding and concerns, and also new
technologies to address age-old problems. It is with the hope of wisdom garnered from
past experience that we look outward, as well as inward, for solutions.
The problems of inequality, injustice, poverty, and lack of opportunities for
growth and development are not new. However, the structures created to address these
problems on a global scale have generally been created since the middle of the last
century. In particular, the United Nations, with membership covering virtually all of the
recognized nation states of the world, was created, in part, to advance the cause of human
rights and human development. Much effort has been made to formulate specific goals
and related time tables for accomplishing them with continual monitoring and
assessment.

12
This study primarily focuses on the case of education, proclaimed in 1948 by the
United Nations as a basic, fundamental human right for all (United Nations, 1948).
Other human rights and development issues play closely into the education scenario but
will be addressed only as deemed necessary.
Government intervention alone has not provided sufficient answers to all the
questions and challenges surrounding education on a worldwide basis. Looking to other
frameworks to inform the situation, it can be seen that there may be extremely helpful
tools in common usage in the business world that have the potential of furthering the
cause of education.
This review of literature chronicles the development, progress, and evolution of
education in the realm of public global intervention. The author also discusses the
massive global emphasis on UPE. The state of education and related challenges in less
developed countries is presented. Focus is directed to Sub-Saharan Africa, specifically
Uganda. In Uganda, great increases in numbers of students completing their primary
education has created a demand for secondary education, for which public funding is
insufficient. Private schools have emerged to meet this educational demand. To best
serve all stakeholders, it is necessary that these institutions be financially stable (fiscally
viable). Next, the author shifts attention to the business world, exploring the tools that are
commonly used to assess the financial health of organizations. Arguments for and
against the use of business principles in educational settings are addressed. Finally, the
author makes the case for application of business tools to assess financial health of
secondary schools in the Mukono District of Uganda, thus laying the foundation for the
creation of a model for assessment of fiscal viability.

13
Education as a Right, Education for All
Education, its purposes, importance, and implications are global in nature. It is a
universal right and affects all people, everywhere.
Importance of Education in a Global Context
Throughout history, education has been widely acknowledged as having primary
importance in most civilizations, nations, and communities. Educational issues of every
sort have been discussed and researched. Education for whom, by whom, and provided
in what manner have been central themes of discussion from the kitchen table to halls of
government to world forums (Belfield, 2000).
In recent decades, education has been specifically acknowledged as an effective
vehicle for personal improvement. Education has also been accepted as a primary
component in the overall advancement of nations, their economic growth, and the
alleviation of poverty (Belfield, 2000; Bruns, Mingat, & Rakotomalal, 2003; Glewwe,
1999; Greenspan, 2004; Schultz, 1993).
Education as a Fundamental Human Right
Shortly after its establishment, the General Assembly of the United Nations issued
the Universal Declaration of Human Rights (United Nations, 1948). Article 26 identified
education as a basic human right. This Article asserts, in part, that everyone has a right to
free basic education; that elementary education should be compulsory; that additional
education should be available to all on the basis of merit; that education should address
the need for personal development, tolerance, and freedom; and that parents have the
right to choose their children’s education.

14
However, simply declaring education to be a right of all people did not guarantee
that it would become a reality. Despite the efforts of many institutions, individuals, and
governments throughout the world, education for every human being, like many other
basic recognized human rights, has been neither easily nor universally achieved.
Education for All (EFA)
Acknowledging that some progress had been made, but concerned with the vast
number of world inhabitants who still lacked access to education, the United Nations
(UN), through United Nations Educational, Scientific and Cultural Organization
(UNESCO), called for a World Conference on Education for All (EFA). The conference
was to be held in Jomtien, Thailand, in March 1990.
At the Jomtien EFA conference, discussions were held and plans were drawn.
The international community committed to provide worldwide education for every
human being “to meet their basic learning needs” (UNESCO, 1990, Article 1.1). One
hundred and fifty governments promised their support to achieve this far-reaching vision
of education for all. They specifically committed to the goals of cutting the world adult
illiteracy rate by one-half and providing accessible primary education to all children by
the year 2000. While EFA acknowledged the need for and challenges associated with
providing educational opportunities from early childhood to adulthood, much of the real
commitment of countries and funding institutions alike focused on UPE (Delors et al.,
1996).
Although the goals of EFA encompass a variety of specific concerns, only those
relevant to primary and secondary education will be specifically addressed in this paper.
Hence, other important areas of education such as adult literacy, vocational training,

15
gender equity, and tertiary education lie beyond the main focus of this study and will be
discussed only in passing.
EFA Mid-decade Review
In order to assess progress being made towards EFA’s millennial goals, the UN
General Assembly passed a resolution in December 1995 for a mid-decade review.
Consequently a mid-decade meeting of the International Consultative Forum on
Education for All was held in Amman, Jordan, in June 1996. In that forum, the benefits
and necessity of education were re-affirmed. UNESCO (1997a) made the following
assertion:
Education is empowerment. It is the key to establishing and reinforcing
democracy, to development which is both sustainable and humane and to peace
founded upon mutual respect and social justice. Indeed, in a world in which
creativity and knowledge play an ever greater role, the right to education is
nothing less tha[n] the right to participate in the life of the modern world. (p. 2)
All countries were called upon to engage in self-examination and to report their
achievements and shortfalls in relation to their specific country’s goal of EFA. In
addition to country reports, the conference addressed other sources of information such as
worldwide statistical reports submitted to UNESCO, country case studies, a cross-
sectional survey of the conditions of schools in lesser developed countries, and NGO
(non-governmental organizations) and donor reports. The general picture that emerged
was one of some statistical progress, particularly in the increase in numbers of children
(approximately 50 million more) aged 6-11 who were now in school. However, this
perceived progress was not without shortfalls and concerns (UNESCO, 1997a).

16
Challenges, both continuing and those recently identified, were summarized in the
Amman Affirmation in June 1996. Conference leaders called for governments of the
world to set definitive targets and timetables for their achievement.
The EFA 2000 Review
Ten years after the inception of Education for All, another conference, The World
Education Forum, was held at Dakar, Senegal, in April 2000, to review progress towards
EFA, especially with respect to concerns set forth in the Amman mid-decade review.
In this conference, the largest evaluation of education in history was undertaken. Over
1,100 participants from 164 countries attended. Data was gathered by country and
synthesized into regional reports which provided the most comprehensive picture ever of
education in the global context (UNESCO, 2000c).
Participants acknowledged that much had changed in the world between the years
of 1990 and 2000. Technology had greatly advanced methods of communication and
information dissemination. The worldwide web and internet capabilities increased
opportunities for education, support, and research. However, this connective capability
for some has also been seen as widening the gap between educational opportunities in
wealthy countries versus those available to the citizenry of low income nations
(UNESCO, 2000c).
The World Education Forum of 2000 re-affirmed the intent and goals of the 1990
Jomtien World Declaration on Education for All, called for higher levels of political
commitment, and solicited greater technical and financial resource mobilization. Focus
was to be at the country level, the “heart of EFA.” Goals, policies, funding strategies,
and monitoring would be set on an individual country basis. A new target date for

17
reaching EFA was set for the year 2015 (UNESCO, 2002a). In addition, the Forum
adopted the Dakar “Framework for Action” with its six specific goals, including
universal free compulsory primary education, and improved quality of education.
Millennial Development Goals (MDGs)
In a separate action, closely related to the EFA efforts but much broader in
perspective, the Millennium Summit at the United Nations headquarters in New York
addressed what were viewed as the greatest world challenges of the new millennium
(UNICEF, 2000). The importance of this summit is underscored by the fact that it was
the largest gathering of world leaders ever to take place.
The United Nations adopted the Millennium Declaration on September 8, 2000,
in its eighth plenary meeting (United Nations, 2000). This document provided the basis
for establishing eight “Millennium Development Goals”, now commonly referred to as
MDGs. All 191 United Nations Member States pledged to support these goals, aimed
primarily at reducing the problems associated with worldwide poverty (United Nations,
2005d). The MDGs bore a target date of 2015 (Chioke.org, 2005; tearfund.org, 2005;
United Nations, 2000).
Like EFA, the MDGs target universal primary education (UPE) (United Nations,
2005d). Support for UPE is extremely broad, to the point that it is perceived as a “given”
in most discussions of poverty alleviation and development. Efforts to establish effective
implementation plans and evaluate progress towards the MDGs have been made on a
continuing basis since their adoption (Bruns et al., 2003; Jayasuriya, 2003). The
“Millennium Development Goals Report 2005” brings together research and data
contributed by such organizations as The World Bank, World Health Organization,

18
UNESCO, Economic Commission for Africa, and the World Trade Organization (United
Nations, 2005b). Preparers of this report note that while some developing regions of the
world are approaching universal primary enrollment, “in sub-Saharan Africa, fewer than
two-thirds of children are enrolled in primary school” (p. 4).
Hosted by the United Nations, a “Millennium +5 Summit” took place in
September 2005 to evaluate progress (or lack of progress) in achieving the MDGs of the
United Nations Millennium Declaration. At this summit, “many calculated that the world
would not meet the UN goals in one hundred years, let alone by 2015” (GPF, 2005).
While many nations and authors laud the intent of the MDGs, others contend that the
goals are largely unrealistic and unattainable. Furthermore, in some cases where primary
school enrollments have increased, these increases have often come at the expense of the
quality of instruction and have resulted in high dropout rates. Still, many people argue
that the goals do focus world attention on issues of great concern in the realm of
education for all (M. Clemens & Moss, 2005).
In October of 2005, UNESCO’s Ministerial Round Table on EFA reaffirmed its
commitment to the Dakar Framework and also to the Millennium Development Goals on
the basis that education is a fundamental human right The report stated that there has
been “notable progress towards the 2015 targets evident in many countries, such as the
sharp increases in primary school enrollment in Sub-Saharan Africa and South Asia”
(UNESCO, 2005a, p. 2).
EFA Summary
Education is seen as a fundamental human right that must be protected and
advanced through formal international organizations and forums. Beginning with the

19
Jomtien Conference in 1990, UNESCO and many other international organizations have
encouraged governments to set goals and to give higher priority and effort to providing
education for all. Some positive strides have been made. The world has seen significant
increases in the total numbers of students enrolled in primary school. However, increases
in global average enrollments mask large regional differences. “Sub-Saharan Africa has
the lowest completion rate by far, with barely half of all school-age children completing
primary school” (Bruns et al., 2003, p. 3).
Education in Uganda
To better understand education in Uganda, it is necessary to examine the
backdrop of education in developing areas in the world and education in Africa,
specifically Sub-Saharan Africa. Historical, political, and economic perspectives inform
this discussion.
Education in Developing Regions of the World
Without digressing into a lengthy discussion regarding the many causes and
implications of poverty, the author notes that education has long been seen as a critical
factor in the reduction of poverty and the building of self-reliant nation states (Aoki et al.,
2003; Caillods, 1998; Watkins, 1999). Addressing the World Education Forum, World
Bank President James D. Wolfensohn stated “No country has succeeded without
educating its people. Education is key to sustaining growth and reducing poverty”
(Wolfensohn, 2000, p. 1).
A recent World Bank (2006) statement provides an excellent summary of the
situation, and also addresses the impact of Education for All and the Millennium
Development Goals:

20
Education is development. It creates choices and opportunities for people,
reduces the twin burdens of poverty and diseases, and gives a stronger voice in
society. For nations it creates a dynamic workforce and well-informed citizens
able to compete and cooperate globally—opening doors to economic and social
prosperity. The 1990 Conference on Education for All pledged to achieve
universal primary education by 2000. But in 2000, 104 million school-age
children were still not in school, 57 percent of them girls and 94 percent were in
developing countries—mostly South Asia and Sub-Saharan Africa. The
Millennium Development Goals set a more realistic, but still difficult, deadline of
2015 when all children everywhere should be able to complete a full course of
primary schooling.” (Goal 2)
These assertions underscore the position that education is a critical key to the success and
development of struggling nations—and that Sub-Saharan Africa is struggling in
providing this education.
Africa and Sub-Saharan Africa
While Africa is often discussed in various literature and contexts as an entire
continent, there are marked differences between the lifestyles, cultural, political and
economic concerns of those relatively few northern African countries and those countries
south of the Sahara Desert in the region commonly referred to as Sub-Saharan Africa
(GlobalSecurity.org, 1997). This region is acknowledged as one of the poorest regions of
the world. The World Bank recognizes 155 countries as “developing countries” (Bruns et
al., 2003). Of the 50 countries worldwide that bear the dubious distinction as least

21
developed countries or LDCs, 34 are located in Africa. Furthermore, all of those 34 are
Sub-Saharan countries (United Nations, 2005e).
Experts have advanced possible explanations for this concentration of poverty in
Sub-Saharan Africa. Jeffrey Sachs asserts that much of the poverty can be explained
through geography, ecological zones and the diseases inherent therein (Sachs, 2005).
Other possibilities include the left-over effects of colonial conquest (Shinns & Lyne,
2004), and political instability (Tupy, 2005). Acknowledging that conflict is a huge
contributor to poverty, the UN in June 2005 disclosed its findings that “extreme poverty
had actually increased in Sub-Saharan Africa since the 1990s” (United Nations, 2005c).
In addition to poverty, Sub-Saharan Africa has faced difficult natural and man-
made disasters in recent years, including droughts, famine, floods, armed conflicts, civil
wars, genocide, heavy debt, government corruption, and ravaging diseases, particularly
Human Immuno-deficiency Virus and Acquired Immune Deficiency Syndrome
(HIV/AIDS) and malaria (Dunne & Mhone, 2003; UNESCO, 1999). Unfortunately,
some of these disasters link together with awful synergy. For example, a causal
correlation is seen between armed conflict and the spread of HIV/AIDS via rape,
displaced refugees forced into survival sex, and the breakdown of the stable family unit
(Katel, 2005; UNICEF, 2003, 2005). The impact of HIV/AIDS on education in Sub-
Saharan Africa is addressed later in this chapter.
Inequity is also an issue in Sub-Saharan Africa. Huge gaps exist between the
wealthy countries of the world and those of the Sub-Saharan Africa developing nations.
Within each country gaps are common—in wealth, in power, in access to resources, and
in opportunities. Equity gaps often lead to instability and conflict (J. Tanner, 2004).

22
Many experts and individuals believe that providing education for all will play an integral
role in closing the gaps of inequality (The World Bank, 2005d).
Education in Africa and Sub-Saharan Africa
African countries have generally relied on the models and systems of education
that were imposed on them by their European colonizers. Little has changed in these
educational systems in the thirty-five or so years since these countries gained their
independence. While the elite have generally had access to education that is on par with
that available in more educationally advanced countries, the masses have generally been
deprived of even basic education (Delors et al., 1996; Holsinger & Cowell, 2000;
Watkins, 2000).
Although espoused by many countries across the continent, the effort to provide
equal access to formal education has been hampered. Critical factors include inadequate
government funding, required school fees, and centralized education systems which
concentrated their focus on urban areas and largely ignored those in scattered rural
settings (Bentaouet Kattan & Burnett, 2004; Delamonica, Mehrotra, & Vandemoortele,
2004; Watkins, 2000).
As a continent, Africa still lags behind most of the world in education. According
to the World Development Report 2006, “The mean educational attainment level for
adults born in 1975-79 in Sub-Saharan Africa remains at 5.4 years, compared with 10.1
years in Latin American and Caribbean and 13.4 years in developed countries” (The
World Bank, 2005d, p. 4). Areas of concern that continue to plague the region of Sub-
Saharan Africa include gender disparity in schooling, the lowest school enrollments of all

23
regions of the world, high repetition rates, low completion rates, and limited minority
access to secondary and tertiary education (UNESCO, 2004c).
Poverty affects and is affected by education (Holsinger, 2005; UNESCO, 2004d).
According to the Millennium Development Goals Report 2005, “in sub-Saharan Africa,
fewer than two-thirds of children are enrolled in primary school” (p. 4) and there is some
question as to the quality of the education offered to those who are in school (United
Nations, 2005b, p. 4). Educational issues in Sub-Saharan Africa factor into the most
pressing challenges in global development today (The World Bank, 2005d).
The Impact of HIV/AIDS on Education in Sub-Saharan Africa
The HIV/AIDS virus has affected health and society in Sub-Saharan Africa in a
number of ways. Parents, children, and teachers all have been affected and that has
impacted education. A recent World Bank publication states, “…the AIDS pandemic is
devastating the teaching force and undermining the entire educational fabric” (The World
Bank, 2005c, p. 1).
The World Education Forum of 2000 was held in Dakar, Senegal, a Sub-Saharan
location that served as a poignant and urgent reminder of the growing impact of
HIV/AIDS on education. Speakers noted that progress made towards Education for All
could easily be negated by this pandemic. Parents were unlikely to educate a sick child
and orphans were left with few resources or incentives to remain in school (UNESCO,
2000c). In addition, the supply of trained teachers was severely challenged (Aoki et al.,
2003). AIDS has killed one or both parents of an estimated 15 million children
worldwide; 12 million of these are in Sub-Saharan Africa (UNICEF, 2000). Orphans
face higher likelihood of dropping out of school, rendering them less likely to escape the

24
bonds of continued poverty (Aoki et al., 2003) or to be educated about HIV/AIDS
transmission and protection (United Nations, 2005b).
Many countries ravaged by HIV/AIDS are struggling to train teachers quickly
enough. UNESCO reported in its World Education Forum document that in one Sub-
Saharan country an alarming “two-thirds of newly trained teachers die of AIDS each
year” (UNESCO, 2000c, p. 22). Such attrition in the teacher ranks, coupled with high
absenteeism due to illness, calls into question the quality of education (Delamonica et al.,
2004).
A study by De Walque (2003) asserts that there is a definite relationship between
education and HIV/AIDS. The more educated the individual, the more receptive they are
to HIV information campaigns and the less likely they are to engage in activities that
would infect them (De Walque, 2003).
EFA Progress and Assessment in Sub-Saharan Africa
Noted progress has been made in the area of EFA in Sub-Saharan Africa. A 1996
UNESCO report found that few African countries had attained primary education for all
and some had only 4 or 5% enrolled in secondary school (Delors et al., 1996). Only four
years later, the Senegal World Forum for Education 2000 claimed that great progress had
been made throughout the world. EFA was declared to be a realistic and achievable goal
(UNESCO, 2000a). However, two areas in the world still lagged behind the others in this
progress: Southeast Asia and Sub-Saharan Africa.
The EFA Global Monitoring Report 2003/2004, prepared by UNESCO
(UNESCO, 2004b), provides a relatively up-to-date look at Education for All in Sub-

25
Saharan Africa. The report identifies three actions which will define the achievement of
EFA in that region:
1. Ensure free and compulsory primary education by 2015,
2. Expand adult literacy by 50 percent by 2015,
3. Eliminate gender disparities in access to education by 2005 and achieve genger
equality by 2015.
The report then assesses progress made to date by each country and categorizes them as
to their potential for achieving these three goals. It was found that six have a “high
chance of achieving or having achieved all three goals;” fourteen (including Uganda)
were categorized as “at least one goal likely to be missed;” and twenty are at “serious risk
of not achieving any of the three goals” (UNESCO, 2004b, p. 1).
A discussion of efforts to achieve EFA in Sub-Saharan Africa would be
incomplete without the acknowledgement of multiple external funding organizations.
Notably, World Bank has greatly increased its education budget to Africa (Alexander,
2001; UNESCO-BREDA, 2003). Support has also been given through other
international organizations including United Nations Educational, Scientific and Cultural
Organization /Regional Bureau for Education in Africa (UNESCO/BREDA), United
Nations Population Fund (UNFPA, formerly known as United Nations Fund for
Population Activities), United Nations Development Program (UNDP), United Nations
International Children’s Emergency Fund (UNICEF) and World Food Program (WFP).
This assistance has taken numerous forms, from loans to grants to food (UNESCO-
BREDA, 2002; UNESCO, 2002b).

26
Although a great deal of external funding has been made available for the
advancement of EFA, funding alone cannot guarantee success. Indeed, some contend that
this may not even be the best use of funds (Bregman, 2003). Some challenges to EFA are
shared by most Sub-Saharan countries. Some are unique to the country setting. Each
country must individually plan its appropriate course of action (UNESCO, 2002a).
Uganda
In many ways Uganda is similar to other Sub-Saharan countries. Yet in others, it
is unique. This section provides descriptions of the country, its history, its peoples, and
its challenges to help the reader better understand this particular setting.
Statistical, Historical, Demographic and Political Background of Uganda
Uganda is a landlocked country in eastern Africa. It lies on the equator north and
west of Lake Victoria and totals 263,040 square kilometers or slightly smaller than the
U.S. state of Michigan. Only 1,809 kilometers of the country’s 27,000 kilometers of
roads are paved. The most recent statistics available estimate the population of Uganda to
be 27,269,482 as of July 2005. Life expectancy at birth is estimated at 51.59 years.
However, the median age of the general population is only 14.97 years. Approximately
66% are Christian; 16% are Muslim and 18% follow tribal religions. It is estimated that
69.9% of the population aged 15 or older is literate. Population growth rate for 2005 is
estimated at 3.31%. Public debt makes up 73.9% of Gross Domestic Product (GDP).
External aid received in 2000 amounted to $1.4 billion. In comparison, the 2004 national
budget estimated $1.491 billion in revenues, with $1.727 billion in expenditures. In
2001, an estimated 35% of the population fell below the poverty line. A 2004 estimate of
GDP per person, expressed in terms of purchasing power parity, was $1,500. Inflation

27
was estimated at 3.5% in 2004. Uganda is a republic, based on English common law and
customary law. Its current constitution was adopted October 8, 1995. In addition, there
are 1.4 million internally displaced persons in Uganda and over 200,000 refugees who
have fled from neighboring countries (CIA, 2005).
The 2005 World Population Data Sheet highlights other facts of interest which
may have bearing on the educational climate of Uganda. Of the population aged 15-49,
7.1 % have HIV/AIDS. Less than 2% of the population are aged 65 or older. A full 97%
of the population live on less than the equivalent of $2 per day (PRB, 2005).
Uganda, a former British Protectorate in eastern Sub-Saharan Africa, achieved
independence in October of 1962. This nation is comprised of many ethnic groups, none
of which has majority status. About 40 languages are spoken in Uganda. English is the
official national language. Luganda and Kiswhahili are also widely spoken and may be
the language of instruction for lower levels of primary school (Ssekamwa, 1997).
Uganda is one of 50 countries of the world grouped into the economic and sociopolitical
category, less developed countries (LDCs) (United Nations, 2005a).
Civil unrest and political strife since its independence have had a huge and
debilitating effect on this country. The world was shocked at the violations of human
rights under the military dictatorships of Milton Obote (1966-1971 and 1980-85) and Idi
Amin (1971-1979) (Melady & Melady, 1977).
Historians estimate that 350,000 people were murdered during Amin’s rule.
During British rule, many Asians were brought into Uganda. In the 1970s, 50,000 to
55,000 Asians, mostly Indian merchants, were expelled and their businesses and homes
were often given to Amin’s cronies. This expulsion had unforeseen and devastating

28
effects on the nation’s economy (IMDb, 2005; Jamison, 1992). Many of the wealthy
and/or best educated, including teachers and professionals, were murdered or forced to
flee for their lives.
The U.S. Department of State asserts that Ugandan security forces under Obote’s
rule had one of the world’s worst human rights records (U.S. Department of State, 2005).
It is estimated that 100,000-300,000 lives were lost under his rule (Answers.com, 2006).
These atrocities left Uganda in a state of political and economic chaos and drained or
diverted many of the financial resources that could otherwise have been utilized for
public services such as health and education.
Yoweri Museveni became President of Uganda January 29, 1986, and remains in
that position to the present. There are still armed conflicts within the northern and
eastern boundaries of Uganda, primarily with the rebel group referred to as The Lord’s
Resistance Army (LRA) (IDMC, 2005; Internal Displacement Monitoring Service, 2005).
Although from time to time this armed conflict garners negative international attention,
Museveni has generally been seen as bringing stability to the country. He has been
recognized by the West as one of Africa’s most influential leaders (Council on Foreign
Affairs, 2006; Council on Foreign Affaris, 2006; Matsamura, 2005a). Recently,
Museveni has drawn international and internal criticism, however, for instigating a
constitutional change which would allow him to seek a third term in office (Matsamura,
2005b; The New Vision, 2005). This change allowed him to be re-elected in February of
2006 for his third term of office (Lacey, 2006). Whether this move, perceived by some as
power-mongering in the disinterest of his constituents (Matovu & Matovu, 2005), will
erode his effectiveness as a leader is yet to be seen.

29
Education in Uganda
Historically, Uganda had a strong, indigenous education system where life skills
were taught through presentation, repetition, and practice. Students were trained in skills
that would benefit their daily lives and fit them for a constructive role in their society. In
1877, European Christian missionaries introduced a more formal type of education with
literacy and numeracy. Schools were generally church-run. In the early 1900s, some
public schools were introduced. After Uganda’s independence from Britain in 1962,
there was a movement to strip schools of their religious identities. Years of war and
internal strife stagnated much of the educational progress envisioned at the time of
independence (Ssekamwa, 1997). Surprisingly, although Uganda suffered greatly from
extreme political turmoil following its independence (Uganda, 2001), primarily at the
hands of the Obote and Idi Amin regimes, its formal education system did not entirely
collapse (Paige, 1998).
The current formal school system structure in Uganda, in place since the early
1960s, is described as a 7-4-2 system and is driven by compulsory national examinations.
(See Table 2.1.) It begins with seven years of primary school, after which the student
must pass the Primary Leaving Examination (PLE). Successful candidates may move on
to secondary school, the first four years of which are considered to be lower or “O”
(Ordinary) level. After the completion of this four year sequence, students sit for national
Uganda Certificate of Education (UCE) O-level exams. The successful candidate may
then move on in secondary school for another two years of coursework at the “A”
(Advanced) level, after taking the Uganda Advanced Certificate of Education (UACE)
examination. Students’ marks on the UACE position them to compete for

30
Table 2.1
Formal School System in Uganda Level Duration (yrs) Ages (yrs) Terminal Exam
Primary 7 06 - 13 UPE
Lower Secondary (UCE) 4 14 - 18 UCE
Upper Secondary (UACE) 2 19 - 20 UACE
Note. From C. B. Mugimu (personal communication, November 11, 2005). Adapted
with permission.
places at one of the eight state universities in Uganda or to look for alternative post-
secondary training at teacher training colleges, technical institutes, or colleges of business
and commerce (ExperienceAfrica, 2004; Liang, 2002; MOES, 1999; UNESCO).
Schools are run by church organizations, non-governmental organizations
(NGOs), government, or private interests. For statistical purposes, schools are often
classified as government, community, or private, with very little differentiation being
made between community and private (Liang, 2002). Government schools are given that
designation because they receive some funding from the Uganda national government.
However, this designation does not mean that the government provides all of the funding
for these schools. “Government-assisted” or “government-aided” schools would
probably be better identifiers. Government assistance may take the form of grants such
as “capitation grants” or “capital development grants” ( Mugimu, 2004). Other important
funding sources for school operations include school fees (which are generally paid by
the student’s parents or other sponsors), grants, and loans.

31
All schools charge fees for attendance, even government-aided schools. Fees may
be assessed for tuition, textbooks and materials, uniforms, and “unexpected costs” such
as special celebrations, physical facilities construction costs, telephone line installations,
PTA contributions, and teachers’ funerals (Bentaouet & Burnett, 2004; Kattan & Burnett,
2004)). The average family in Uganda consists of about eight children (Experience
Africa, 2004). These combined factors may put a strain on family resources, thus
affecting the ability of some children to stay in school (Bentaouet & Burnett, 2004).
UPE in Uganda. Decades of war and widespread poverty caused severe
shortages of government funding for education in Uganda. Much of the surviving
infrastructure fell into decay. Textbooks and teaching materials were in short supply and
there was a general teacher shortage. Trained, experienced teachers faced the challenge
of low pay, irregular paychecks, and little support. Parents generally had to bear the
burden of the cost for schooling their children, paying for school fees, books and
materials, and uniforms. Many of the poor simply could not afford to send their children
to school. In the period 1971-1985, only about 50% of primary aged children attended
school (MOES, 1999). In addition, corruption led to “leakage of funds” (The World
Bank, 2005a, p. 64; XINHUA, 2004).
Aligning with the worldwide education agenda, Uganda’s President Yoweri
Museveni led governmental efforts to provide increased access to primary school
education. The global emphasis on primary education driven by EFA, coupled with
Uganda’s introduction of Universal Primary Education in January of 1997, contributed to
tremendous increases in primary school enrollments (Delamonica et al., 2004; UNESCO,
2000b).

32
Based on President Museveni’s 1996 campaign promises of universal primary
education for Uganda and free education for up to four children per family, two of which
were to be girls (Deininger, 2003), greater government support was given to provide
increased access to primary school education (UNESCO, 2000b). UPE was implemented
in January of 1997. Immediate and continued increases were seen in primary school
enrollments. During the ten year period from 1986 to 1996 enrollments rose only from
2.2 million to 2.7 million. However, in 1997 alone (the year that UPE was implemented)
enrollments increased by 94% to 5.3 million (MOES, 2004a). Enrollments continued to
rise to 6.5 million by early 2000 and reached 7.6 million in 2003 (Miovic, 2004;
UNESCO, 2000b).
These tremendous increases in enrollments have attracted much global attention
(UNESCO, 2000b). Hailed as a UPE success story, a UNESCO report calls the results
“dramatic and beyond expectations” (UNESCO, 2001, par. 7.2). Indeed, in the numbers
game, Uganda has been a leader in achievement of universal primary education (The
World Bank, 2005a).
This “big bang” approach to achieving UPE in a short period of time has not been
without its difficulty. The huge increase in enrollments without corresponding increases
in infrastructure and trained teachers has resulted in overcrowded classrooms, high
student/teacher ratios, and widespread concern about the quality of this education
(Ingram, 2004; UNESCO, 2001) as well as its sustainability (M. A. Clemens, 2004).
Challenges related to UPE in Uganda. The swiftness with which the “free
education for 4” primary school policy was implemented (it became law in December
1996 and was implemented January 1997) left no time to build new schools, expand old
33
ones, or create a master plan for primary school expansion. As a consequence, schools in
urban areas quickly became overcrowded and facilities in rural areas were pushed to the
point that some schools were forced to meet under trees (Ndeezi, 2000; UNESCO,
2000b). Learning materials were in short supply or at times non-existent. Pupil to
teacher ratios shot up to 110:1 in lower levels of primary school (USAID, 2000) and
were reported as high as 234:1 in conflict areas (Internal Displacement Monitoring
Service, 2005). Such extreme ratios underscore the sad fact that many children had little
opportunity for individual attention (Kirungi, 2001).
Another bottleneck occurred in the transition of primary school students to
secondary school (Ingram, 2004; Kirungi, 2001; UNESCO, 2005b). While much of the
world takes this step for granted, Uganda presents a different picture. Most of the funds
earmarked for education go to primary level education, leaving little for the expansion of
secondary schools (Liang, 2002). As the number of students completing primary school
has increased, the demand for secondary schools has risen dramatically (UNESCO,
1997b).
Beyond Primary Education. The demand for secondary education throughout the
world is soaring. This is a direct result of the great global emphasis placed on universal
primary education (The World Bank, 2005c). However, while the main educational
emphasis to date has been on achieving basic education for everyone everywhere, there is
also a critical need for secondary school education. A World Bank (2005b) report states
In today’s world, secondary education has a vital mission....Secondary education
is now being recognized as the cornerstone of educational systems in the 21st
century. Quality secondary education is indispensable in creating a bright future

34
for individuals and nations alike….There is no question that secondary education
has a key role to play in the social, economic, and human capital development of
countries around the world. (p. 1, 6)
With the implementation of UPE and subsequent swelling numbers of primary
school graduates, it soon became evident that if these students were to advance beyond
primary school, new and dramatic measures would have to be taken to provide that
opportunity (MOES, 2004b). Government funding, tied to international funding sources
such as World Bank, USAID, the Netherlands government, Denmark and Britain,
generally focused on primary schools, leaving few resources for post-primary education
(Liang, 2002; UNESCO, 2000b).
Uganda’s Local Government Statute of 1993 had the effect of decentralizing
primary and secondary school administration and management, priming the climate for
more local control of schools (MOES, 1999). The Local Government Act of 1997 further
decentralized public education and opened the door to greater private investment in
educational institutions (UNCHS).
Secondary Schools in Uganda
Kirungi (2001) underscores the importance of secondary schooling in Uganda
with the following statement by Yusuf K. Nsubuga, Commissioner for Secondary
Education. “Failure to absorb the growing number of primary school leavers will
undermine Universal Primary Education and broader national goals like the elimination
of poverty" ( p. 2).
Although some may assert that primary education is adequate in a developing
country setting, there is strong argument that secondary education has an important role

35
to play in personal development, human capital expansion, nation building, and
economic development (Government of Uganda, 2003; Holsinger & Cowell, 2000;
Lewin & Caillods, 2001b; UNESCO, 2005c). Higher-order thinking skills and problem
solving are generally introduced at the secondary school level. Math, science, and
technology capabilities are built during this phase of a student’s education. Although the
costs associated with secondary education are higher on a per student basis than those of
primary schools, the skills learned at this level are critical to the development and
progress of the country (Aoki et al., 2003).
Table 2.2 shows the rapid increase in the number of secondary schools in Uganda
from 1997 to 2001. The number of secondary schools in Uganda almost quadrupled in
this period.
Table 2.2
Number of Secondary Schools in Uganda, 1997 to 2001 Year Number of Secondary Schools
1997 621
1998 837
1999 1633
2000 1892
2001 2400
Note. From Education Profile; Uganda Ministry of Education and Sports, 2004, p. 6.
Private Secondary Schools in Uganda
Formal education was introduced in Uganda in the late 1800s via missionaries and
private schools. Following Uganda’s independence in 1962, private schools, generally

36
run by churches, were required to shut down or abandon all affiliation with religious
organizations, most of which had required church membership of their students
(Ssekamwa, 1997). Those private schools that did survive were forced to rely
exclusively on private funding sources such as parental funding, catering primarily to the
wealthy. Although some government requirements and restrictions are present, private
schools generally have had more flexibility in decision making, curriculum, and services
offered. Those families who can afford to do so often send their children to elite private
schools (Deininger, 2003; Matovu & Matovu, 2005).
The rapid increase in primary school enrollments in Uganda has greatly increased
the demand for secondary education (Stoker, 2005). Lacking adequate public funds to
meet the growing demand of those students completing primary school, government
leaders took action to decentralize education and to encourage private investment in
schools. Indeed, privatization of goods and services was encouraged throughout the
economy to bolster growth (Datta-Mitra, 2001).
In developing countries, it is common to find more private schools at the
secondary level than at the primary level (Holsinger & Cowell, 2000). In Uganda, while
the large majority of primary schools, 81% of 13,407, remain in the public domain
(government-aided), the majority of secondary schools are private (UBOS, 2005;
Uganda Bureau of Statistics, 2005). According to the Uganda Bureau of Statistics, the
composition of secondary schools 2001 to 2004 was as follows in Table 2.3.
Combining private and community schools to form a non-government aided
grouping, we see that this group represents 61% of secondary schools in Uganda for the
year 2004. Government-aided schools make up only 39% of secondary schools. Thus, it

37
Table 2.3 Composition of Secondary Schools in Uganda, 2001 to 2004 Type of School Number of Schools 2001 2002 2003 2004 Government-aided 601 Not available 718 764 Private 1140 Not available 885 1175 Community 109 Not available 487 30 Total 1809 Not available 2055* 1969 Note. From Education Statistics; Uganda Bureau of Statistics, 2005, p. 1.
*The mathematically correct total for the 2003 column is 2090.
is clear that unlike primary schools, the majority of secondary schools in Uganda are not
government-aided, but are privately funded and privately run.
Incongruity in Statistics
Of note is the difficulty that researchers encounter in LDCs in obtaining reliable,
consistent, verifiable statistics and data, even though they may be obtained from official
sources. Three matters in the above two tables illustrate this dilemma. First, in Table
2.3, the 2003 total is not mathematically correct. Second, the community school line in
Table 2.3 shows great inconsistency over time, particularly with respect to the 2003
figure (unreasonable increase for one year only). Looking one line above to private
schools for that same year, we also see a great inconsistency (an unexplainable one year
decrease). It would appear that there was some confusion in classification of schools
between private and community for 2003. Third, consider the differences in statistics for

38
2001 in the two tables shown above (Table 2.2 and Table 2.3). Data in Table 2.2 shows
that the Uganda Ministry of Education and Sports (UMOES) reported a total of 2,400
secondary schools in Uganda in the year 2001. Table 2.3, based on more finely
delineated statistics provided by the Uganda Bureau of Statistics (UBOS), shows a total
of 1,850 secondary schools in Uganda in the year 2001. The difference in these two
“official” figures, or 550 schools, represents a huge variation; the UMOES figure is 30%
higher than the UBOS figure. However, each source internally shows an upward trend in
the number of secondary schools in Uganda, a condition relevant to the purposes of this
paper.
Many possible explanations could be provided for the differences in figures
between these reporting entities of the Uganda government, but that is beyond the scope
of this paper. Other limitations and challenges in conducting research in LDCs are
addressed in Chapter 3, under the heading Limitations.
Schools as Businesses in Uganda
In an environment of rapidly expanding post-primary education, financial stability
must be addressed, as emphasized by Aoki, et al. (2003):
Progress in expanding enrollment in primary education quickly creates pressure
for the expansion of secondary school and tertiary education, and it is important to
put in place a policy framework for expanding these levels that ensures quality,
relevance, equity, and financial sustainability [italics added]. ( 19.2.1)
Financial stability, a concept inherent in successful business, is viewed somewhat
differently in most educational circles. There has been a long-standing, worldwide
debate about the intersection of schools and businesses. The business world has strongly

39
advocated that its practices be adapted by schools. Schools have resisted any comparison
(Hartzell, 2003). Business seeks to maximize outputs in comparison to inputs. Educators
contend that output is difficult to measure and often cannot be quantified (Darling-
Hammond, 2004). Educators further argue that the focus of business is profit and that the
focus of education is to serve the public good (D. Tanner, 2000).
In the early part of the last century, employers demanded that schools provide
them with workers better equipped to work in a factory setting. The industrialization of
business led to the industrialization of schools (Cuban, 2004). In much of the world, the
factory school model grew as society demanded publicly-funded mass education (Martin,
1994). In the latter part of the 20th century, the business concepts of efficiency and
accountability were promoted for schools as more and more school boards were
composed of business types, more law makers came from business, and the public
demanded that their tax dollars be better utilized (Barkley Jr., 1991).
Since that time, there has been a gradual acceptance of some business
management concepts being applied to educational settings (Huitt, 2004; Jost, 1991).
However, it is rare that schools are actually viewed as businesses (Shipps, 2000). Little
has been written on this topic (Karmokolias & Maas, 2003) and what has been written
generally addresses it only in piecemeal fashion, one subtopic or issue at a time (Gray,
2004; Greene, 2002; J. A. Langer, 2004). Indeed, mass public educational systems and
practices may bear little resemblance to those common in the business sector (Cuban,
2004). However, as will be shown below, there are circumstances where schools,
particularly private schools, do and should look very much like businesses.

40
This research project assumes the perspective of schools as businesses rather than
schools for business, business for schools, or business schools. Specifically, it explores
the similarities between private secondary schools in Uganda and business systems and
structures in general. Those similarities identified, this author could rationally explore
the use of business practices as related to long-term financial viability of private
secondary schools.
Private secondary schools in Uganda are entrepreneurial in nature. They
generally have been established as for-profit organizations. Although they must operate
within some governmental guidelines, their structures are very similar to small, start-up
businesses.
The following is a non-exhaustive list of readily identifiable similarities between
private secondary schools in Uganda and typical entrepreneurial businesses.
1. Private secondary schools are created by entrepreneurs (sometimes educators,
but often not) to meet a demand for services (J. J. Tanner, 2002; Tooley,
2003).
2. Private secondary schools charge fees for services provided. These fees are
set in much the same way as prices in any service industry; they are a function
of market influences such as supply, demand, and perceived quality of the
product (Bray, 1996; Deininger, 2003).
3. Private secondary schools are on their own to procure materials, supplies,
teachers, and other critical resources. The marketplace in which these critical
resources are to be found may be highly competitive (Mugimu, 2004).

41
4. Private secondary schools must satisfy their customers or face losing their
clientele (C. B. Mugimu, personal communication, November 26, 2002,
January 27, 2005, and March 24, 2006; Mugimu, 2004).
5. Competition for customers/clientele/students is a reality, and private
secondary schools must work at building their reputations to attract the “best”
students (C. B. Mugimu, personal communication, November 26, 2002, and
March 24, 2006; J. Tooley, P. Dixon, & J. Stanfield, 2003).
6. Private secondary schools look for ways to differentiate their “product” (C. B.
Mugimu, personal communication, December 5, 2004).
7. Private secondary schools do not have a governmentally guaranteed revenue
stream or flow of other resources (D. B. Holsinger, W. J. Jacob, & C. B.
Mugimu, 2002b).
8. Risks are assumed by private secondary school owners (C. B. Mugimu,
personal communication, June 22, 2006; J. J. Tanner, 2002).
9. Private secondary schools are capital intensive and capital expansions require
financing via owner investments, loans or retained earnings (V. Marsh, 2005).
10. Returns (profits) may be distributed to owners or retained for use by the
school (reinvestment of funds into capital structures, financing expansions,
etc.), just like any other business (C. B. Mugimu, personal communication,
March 24, 2006).
11. Efficiency and cost savings are critical to profitability (Bray, 1996; Holsinger
et al., 2002b; J. Tooley, P. Dixon, & L. Stanfield, 2003).

42
12. Owners must think in terms of long-term survival of their organization as well
as short-term profitability (C. B. Mugimu, personal communication,, March
24, 2006).
13. Finally, these private schools are required to file revenue reports (essentially
tax returns) with the Uganda Revenue Authority (Uganda’s taxation arm), the
same as every other business. By contrast, government schools, as
“educational institutions of a public character” are specifically excluded from
this requirement, qualifying as “exempt organizations” (Bahemuka, 2004, p.
61, "The income tax act cap. 340", 1997).
Thus, this author presents the case that private secondary schools in Uganda are
essentially businesses—being established, run, and taxed as businesses.
In essence, private secondary schools in Uganda may be seen as social
entrepreneurships. Social entrepreneurialism (a term used with increasing frequency in
the world of NGOs, relatively new to the business world, but rarely seen yet in
educational realms) refers to organizations with a double bottom line (Bornsein, 2004;
The Institute for Social Entrepreneurs, 2002). These are organizations dually driven,
with one eye towards societal good and the other towards sustained profitability. They
have a “do well; do good” orientation (Wilson, 2006). The application of effective
business assessment tools to these schools may be of great benefit in achieving the “do
well” goal, just as they have proven beneficial to businesses in general.
Financial Assessment in Education
Financial Assessment in Education is an amalgamated title rarely seen in
educational literature. Deconstruction and discussion of the component parts of this title

43
will be beneficial to understanding the underlying issues. Hence, the following
discussion features four topic areas: (a) financial assessment in settings other than
education, (b) finances in education, (c) assessment in education, and finally, (d) financial
assessment in education.
Financial Assessment in Settings Other than Education
The term financial assessment quite literally refers to investigating certain key
financial figures or relationships for a particular individual, entity, or group of entities
(Kapp, 2005; Merrill Lynch & Third Age, 1997). Financial assessment may also be
referred to as financial analysis (Helfert, 1997; White et al., 1998). To avoid confusion,
the author notes that this term, financial assessment, is also a term widely used in
governmental settings where it has a very different meaning and specific application
(Cambridgeshire County Council, 2006; Office of Government Commerce, 2002). The
governmental use of the term is not the meaning referred to in this study.
The figures or relationships investigated through financial assessment may be
industry specific (Ahang, 2005; Björkdahl, Bohlin, & Lindmark, 2004; Ketz et al., 1990;
Mangiero, 2004). Whether applied to individuals, profit-oriented businesses, non-profit
organizations, associations, trusts, foundations or governmental entities, they all are used
to provide important information regarding financial health of the entity (Fernández,
2003; MGT of America, 2005; Powell, 1996; Quick & Kahn, 2002). Users may be
internal (owners, managers, or those with fiduciary responsibilities) or external
(regulatory agencies, trade organizations, etc.) (Bank Proposal, 2005; Tamari, 1978).
In the world of business, financial considerations are of primary importance
(Kapp, 2005; Mandell, Cowen, & Miller, 1981). Simply put, if an organization cannot

44
maintain its financial health, it will likely fall into the disastrous state of business failure
(L. C. Gupta, 1983). Studies have shown that financial problems are the leading cause of
business failures (Katz & Cabezuelo, 2004). Given the disappointing statistics of
business failure rates worldwide, it is imperative that any organization pay attention to its
financial health and look for warning signs that may signal potential areas of distress
(Farney, 1995).
In business settings, it is common to look for a model of financial health within
the industry of operation (Ketz et al., 1990; Mandell et al., 1981). These models are
compilations of statistics from actual companies within each given industry (Dun &
Bradstreet, 2003; RMA, 2002-2003). Wise business managers look inwardly at key
financial relationships based on figures provided by a reliable accounting system. These
then can be compared with industry averages to monitor the individual organization’s
health. Appropriate corrective action may be taken before it is too late (A. Lev, 1969).
As will be discussed in more depth later in this chapter under the heading
Business Analysis as a Tool in Assessing Organizational Financial Health, specific
analysis tools have been created to inform financial users about such important issues as
solvency, cash flow, debt structure, and inventory management, all of which play into the
organization’s prospects for sustained operations, or long-term viability (Thompson,
2005; Viscione, 1983).
Finances in Education
Literature that addresses school funding generally assumes government-funded
schooling (Haselow & Josna, 1995). Many countries of the world have mandatory,
government-funded schooling. Indeed, government funding is often seen as an ideal.

45
However, public schooling is not necessarily the norm in all countries. For example, in
the Netherlands, 70% of students attend private primary schools (Kober, 1999). In
LDCs it is not unusual to see public funding of education narrow at upper educational
levels, leaving secondary and tertiary education more and more to the private market
(Liang, 2002; UNESCO, 2000b).
Generally speaking, the distinction of public versus private school refers to the
funding source and attendant regulation authority—the governing body with power to
decide the direction, the curriculum, etc. This funding designation is also present in so-
called government or non-government schools (Kober, 1999).
With public/government funding comes a demand for public accountability. In
some countries, government funding is so extensive that specific accounting guidelines
have been set with corresponding reporting requirements (Brimley & Garfield, 2005;
NCES, 2003). These accounting reports are generally filed with appropriate government
agencies and are open to public inspection. Researchers will note that this public
accessibility generally makes for greater ease in obtaining data for analysis.
Private or non-governmental schools, with little or no government funding, are
left to locate their own alternative sources of funding. Traditionally, this funding has
come from such sources as grants from charitable or religious institutions, tuition and
fees charged to students, community fundraising activities, etc. (Bentaouet Kattan &
Burnett, 2004; Tsang, 2002). Reporting requirements for private educational institutions
vary with country and circumstance. Generally speaking, financial reports for private
institutions are rather inaccessible. If not publicly funded, the institution may not be

46
required to produce publicly accessible financial statements. This greatly limits the
ability of an outside researcher to access data for analysis.
Over the few most recent decades, analysis of financial matters related to
education has primarily focused on the attempt to determine an optimal level of funding
(Brimley & Garfield, 2005; Hanushek, 1986, 1996). Financial inputs are compared to
quality of educational outputs (primarily student attainment) (Anderson, 2002; Burtless,
1996; Crampton, 2006; Haselow & Josna, 1995; Knoeppel & Verstegen, 2006; Kozol,
1991). Analysis examining the efficiency of resource usage has generally been applied to
public education in the form of production function analysis (Hadderman, 1998;
Knoeppel & Verstegen, 2006; Levin, 1993). Although the research, findings, and
interpretations of educational production function have been widely published and hotly
debated, it is important to point out that this type of analysis is useful primarily for its
education policy implications (Greenwald et al., 1996; Hanushek, 1997; Pritchett &
Filmer, 1999). Beyond the public policy arena, production function analysis provides
little assistance in the cause of helping individual schools to improve their financial well-
being. These schools need tools that offer them the opportunity for introspection and
analysis of their own individual financial circumstances, such that they can assess and
take appropriate actions to improve their fiscal viability.
Business concepts, such as accountability and efficiency, have made their way
into the educational realm (Baughan, 2002; Graham, Lyman, & Trow, 1995; Huitt, 2004;
Lockheed & Hanushek, 1988; McEwan & Carnoy, 2000), and accounting practices have
been developed in some countries for the financial reporting of governments and
educational units (Brimley & Garfield, 2005; Governmental Accounting Standards

47
Board, 2006; Montesinos & Vela, 2002; National Center for Education Statistics, 2003).
Although it may seem logical that the education world would fully embrace business
concepts and practices, that has not been the case (Hartzell, 2003; Shipps, 2000).
One area where there appears to be a void in the use of business practices in
schools is that of assessment of financial health or financial well-being of individual
educational institutions. As will be discussed in more detail in the next section,
assessment in education tends to focus on student outputs or learning outcomes, rather
than on institutional financial concerns (Drum, 2001; Greene, 2002). There are several
possible explanations for the lack of attention and application of business practices to the
educational environment.
1. Education in much of the world is dominated by government rather than private
enterprise (Belfield, 2000; Kozol, 1991; Lewin & Caillods, 2001a).
2. Schools are generally not perceived as businesses by the education community
(Hartzell, 2003).
3. Schools established and run as businesses are generally left to their own devices
for financial survival; there is no known international association of private
schools which offers financial support and advice.
4. In consideration of tenure and review, academics generally look to publish their
research in “A level” journals which tend to concentrate on theory rather than
practical measures. Therefore, research for pragmatic purposes may not be given
very high priority.
In addition, it is possible that relatively few academics have a background or interest in
the practical matters of running a business and keeping it going.

48
Assessment in Education
Within the field of education, assessment has become “extraordinarily
widespread” (Banta, 1999). Driven, in part, by publicly demanded accountability
(Darling-Hammond, 2004; Huitt, 2004), assessment may take a number of directions and
forms. Even though they are difficult to define, student learning outcomes are a common
target for assessment (Bers, 2001). The Education for All movement has acknowledged
the need for assessment of student learning, and not just as a matter of caring that
students are actually learning. Evidence shows that some aid-granting institutions have
begun to link aid to achievement of learning targets (Goldstein, 2004).
Assessment in education is often associated with perceptions of quality of
education. Student testing may not be the ideal method to determine quality of education
nor individual student knowledge, abilities and desirable skills. However, it is the most
widespread and commonly accepted assessment tool (Glaser & Silver, 1994; UNESCO,
2004a).
National examinations may be used in a number of ways. As an approximation of
quality of education offered by a particular institution, test scores may be tied to funding
(Ullrich, 2006). Test scores may be published, allowing students and their families an
avenue to assess the quality of a particular educational institution (C. B. Mugimu,
personal communication, November 26, 2002). Underscoring its widely accepted usage,
testing is seen by UNESCO’s EFA Monitoring Team as a way to evaluate how well
students have learned at particular junctions, especially at points where they may exit the
school system. Test results are used to examine the relationships between education
quality and economic growth (UNESCO, 2004a).

49
National examinations in Uganda are ubiquitous and are administered at all levels
of education. Although the use of national examinations as a proxy for quality is highly
contested in other regions of the world, this is the commonly accepted and recognized
assessment tool in the Ugandan education system (J. M. Hite, S. J. Hite, B. C. Mugimu,
W. J. Rew, & Y. Nsubuga, 2004a).
The Ministry of Education and Sports (MOES) administers national exams
through the Uganda National Exam Board (UNEB). The Ugandan national exam is given
at specific points in a child’s academic career: Primary 7, Secondary 4, and Secondary 6.
Exams are administered in November of each year at schools that qualify as examination
centers. The examinations may be from two days (for primary school) to four weeks in
duration. Results of the exams are made public in January or February of the next year.
The school year is run on a calendar year basis, from January to December (J. M. Hite,
Hite, Jacob, & Tanner, 2002).
UNEB examinations are administered only at schools that meet specific criteria
and are designated as UNEB schools. Students enrolled in non-UNEB schools must
make arrangements to be examined at a UNEB school. Examination scores are reported
by UNEB site, not the student’s school of enrollment, although in the majority of cases
these are the same (Naluwemba, 2002).
The following observations, made by Ugandan secondary school owners or head
masters, underscore the extreme emphasis placed on national examination scores as
indicators of quality of education.

50
1. Mr. Duncan, headmaster of Greenville Secondary School: “Now, the system
is backed by only one factor, the examination. We are usually gauged by
that” (J. M. Hite et al., 2002).
2. Namiryango Senior Secondary School: “…our education system is, anyway,
mostly focusing on passing in exams” (J. M. Hite et al., 2002).
3. Dr. Christopher Mugimu, owner of Mukono Town Academy: “The national
exam plays a central role in the Ugandan educational system. It drives
everything” (C. B. Mugimu, personal communication, November 26, 2002).
National examinations are the normative recognized measure of effectiveness or
quality of education in Uganda. These examinations are accepted as valid instruments for
quality measurement. A host of issues could be raised as to the “rightness” of this
measure, “teaching to the test,” or other testing-related issues, but such discussion is
beyond the purpose and scope of this research.
Considerations for Financial Assessment in Education
Financial assessment in education has generally focused on public,
governmentally funded education (Carvlin, 2003; Kapp, 2005). There are four possible
explanations for this.
1. Public demand for accountability. When public funds are used for education,
the public generally wants to know how those funds are used. On the heels of
the accountability movement, governmental institutions have been drivers of
financial assessment in education, spurred by public inquiry (Alexander,
2001; Huitt, 2004; O'Day, 2002).

51
2. Data accessibility. Financial information for public institutions is publicly
accessible, making the analyst’s job much easier (Koski & Weis, 2004; Laine
& Hinrichs, 1995).
3. Special training and skills needed for assessment. Financial assessment may
require the services of specially trained professionals. This author suggests
that it is more likely that a government with many smaller units to assess
would have access to such assessment expertise than would an individual
educational institution.
4. Cost of analysis. Closely tied to the need for special skills for financial
reporting assessment is the need for funding to pay for that expertise.
Governments are more likely to build this into their budgets than are private
institutions. Large international organizations that have an interest in public
education, such as the UN, UNESCO or World Bank, often conduct their own
assessments relative to public education (UNESCO, 2003).
Whereas financial assessment in education has primarily had a public,
governmental funding emphasis, much of the post-primary education in developing
countries is provided through private schools (Holsinger & Cowell, 2000). Private or
non-governmental schools, unable to access public funding, or having limited
government funding, are left to look for other sources of funding. Traditionally, this
funding has come from such sources as grants from charitable or religious institutions,
tuition and fees charges, community fund raising activities, etc. (Tsang, 2002). The non-
public, non-governmental funding nature of these institutions contributes to the relative
absence of published financial assessments relative to these private schools.

52
Reporting requirements for private educational institutions vary with country and
circumstance (Kober, 1999; McEwen, 1995; Nesdale, 2002). Generally speaking,
financial reports for private institutions are rather inaccessible. An institution, if not
publicly funded, may not be required to produce publicly accessible financial statements.
This greatly limits the ability of an outside researcher to access data for analysis.
Private secondary schools in developing nations meet a demand for continued
education and serve important societal needs (Holsinger & Cowell, 2000; Lewin &
Caillods, 2001a). It is in the best interest of all stakeholders—society at large, local
communities, parents, students, teachers, administrators and managers, owners, etc.—that
all schools, whether public or private be efficiently run and financially stable. School
failure affects all stakeholders; investments are lost, expectations go unmet, jobs vanish,
learning is lessened, and a ripple effect is felt throughout the community.
One means of protecting the viability of a school is to carefully assess its financial
practices and status. Where there are no known industry standards for comparative
purposes, models of financial stability can be built. To do so entails careful analysis of
available data utilizing widely accepted financial analysis methods and tools (Chabotar,
1986).
Business Analysis as a Tool
in Assessing Organizational Financial Health
Assessment of organizational health may include analysis of such factors as
organizational structure, organizational culture, economic conditions, product quality
management, policies and strategies, management style, and legal environment, as well
as business practices. Each of these factors may affect the health and viability of the

53
organization (Chabotar, 1986). While a need exists for thorough and pervasive analysis
of all organizational considerations, this research project concentrates only on business
analysis as a tool to assess the financial health of privately-operated educational
organizations in Uganda.
Business Analysis
The term business analysis generally refers to the study of various factors which
may affect the viability and profitability of an organization (HCA, 2002). In a broad
sense, business analysis may address any elements which are critical to the short- and
long-term success of a business (Bernstein & Wild, 2000; biz/ed, 2005; Meyer & Zucker,
1989). The following list includes common factors to be considered in a comprehensive
business analysis (Ebert & Griffin, 2003; Mandell et al., 1981; U.S. Small Business
Administration).
1. Purpose, mission, vision, and philosophy of the organization
2. Product or service
3. Factors unique to industry and location
4. Market factors such as supply, demand, product differentiation, and
competition
5. Leadership and management; risk and risk management; resource
management
6. Technological needs and capabilities; information systems
7. Legal environment
8. Ownership
9. Finances, financial reporting, and financial assessment

54
Many factors contribute to the success of an organization. Few would argue that
whether the organization is a governmental unit, a non-profit organization or a business,
finances do not matter. It appears that since the beginning of human writing, there have
been attempts to quantify and describe economic and financial transactions (Brown,
2004; Girous, 1999; Woodrow Wilson Institute, 1924).
Numerous tools exist to address each of the above-listed factors (Dun &
Bradstreet, 2002; Hornung & Associates; Rueters, 2004). Most of these factors could be
addressed in an overall business analysis of private schools. However, the project at hand
will focus only on the last of these items: finances, financial reporting, and financial
assessment.
Financial Statements
In today’s world, most successful organizations have some formalized system for
recording and summarizing financial data. Financial statements are prepared at the end
of each fiscal period to provide information to stakeholders or regulatory entities
(Maurer, Shulman, Ruwe, & Becherer, 1995).
In theory, and in good practice, these financial statements are prepared according
to generally accepted accounting principles (GAAP). GAAP are usually determined
nationally by an independent accounting standards board representing the accounting
profession (Maurer et al., 1995). GAAP set by the US and the UK are most recognized
worldwide and have influenced accounting practices in many other countries. In
addition, International Accounting Standards (IAS) have been formulated (Roberts,
Weetman, & Gordon, 1998). Their use may be adapted by large corporations that deal

55
with international investments or cross-border security investments (Securities and
Exchange Commission, n.d.).
The benefits of preparing financial statements according to GAAP include
consistency, comparability, understandability, reliability, objectivity, and disclosure
(Revsine, Collins, & Johnson, 2002; Roberts et al., 1998). Statements may be used for
internal purposes (management information and decision making) or they may be
prepared for external use (lending institutions, regulatory agencies, etc.) (Maurer et al.,
1995). Many organizations are required to file financial statements with governmental
agencies. Governments, however, may set their own reporting standards which may be at
variance with GAAP. As a case in point, in the US, large publicly-held corporations
prepare their primary financial statements according to GAAP (Fridson, 1996) set by the
Financial Accounting Standards Board (Maurer et al., 1995). These statements are
generally subjected to an external audit and may be widely circulated (White et al.,
1998). They form the basis for external evaluations such as those performed by bond
rating companies, financial analysts, stock brokerage firms, individual investors, lenders,
etc. However, these financial statements are not to be confused with tax returns required
by the IRS, which are based on the United States Tax Code, subject to laws passed by the
US Congress (United States Department of the Treasury).
A full set of formal financial statements usually consists of three prescribed
financial statements, followed by a set of explanations and other relevant information,
much like footnotes. A brief description of each follows:
1. Balance Sheet (or it may be called a Position Statement). This statement lists
assets, liabilities, and equity accounts as of the close of operations on the last day

56
of the fiscal period. The balance sheet is like a snapshot of the “real” or non-
periodic accounts of the organization at a specific point in time (Hatfield, 1920;
Hey-Cunningham, 2000; Jiambalvo, 2004).
2. Income Statement (or it may be called a Profit and Loss Statement). This
statement, if prepared on an accrual basis of accounting, according to GAAP,
reflects the revenues earned during the fiscal period less expenditure incurred in
order to generate the revenues recognized (Albrecht, Stice, Stice, & Swain, 2005).
The difference between revenues and expenditures is recognized as profit or loss,
commonly referred to as “the bottom line” for business purposes.
3. Statement of Cash Flows. This statement shows (a) cash inflows by source such
as from operations, from loans, from stock sales or sale of capital assets, etc., and
(b) cash outflows by source such as operational expenditures, capital asset
acquisitions, loan repayments, etc. (Albrecht et al., 2005).
4. Notes to the Financial Statements. Items or events of significance that may affect
the organization’s financial status, but are not shown in the above financial
statements are disclosed in this narrative section. The Notes are considered an
integral part of the financial statements (Downes & Goodman, 2003). Examples
of situations that may be disclosed here are subsequent events, such as a factory
lost to fire one week after the close of the fiscal period, or major legal
proceedings, or contracts not reflected in the financial statements themselves.
The first three of these above statements are quantitative in nature. The Notes to
the Financial Statements bring in qualitative information that should be considered in
analyzing financial statements. Business leaders have long recognized that both

57
quantitative and qualitative factors must be addressed in order to make good decisions
based on financial statement information (Garrison, Noreen, & Brewer, 2006; Saliers &
Holmes, 1937; White et al., 1998).
In large organizations, formal financial statements are prepared by an internal
accounting staff. Financial statements may be subjected to an external audit. These
auditors perform an attestation function, performing sampling and testing in order to
render an opinion on the financial statements. This opinion states whether or not the
financial statements as a whole do indeed portray a fair and accurate picture of the
organization’s financial position, based on the auditor’s tests, as of the close of the
specified fiscal period (Arens, Elder, & Beasley, 2005; Ricchiute, 2005).
Fiscal periods covered by audited financial statements are generally 12 months in
length and are consistent over time, the same fiscal year period being used year after year
(Thomsett, 1991). The organization’s fiscal year may begin at any point deemed most
beneficial to management, unless specifically set by some government or regulatory
agency. The fiscal year end may be set at the lowest period of activity in the calendar
year. As examples, many retail businesses set fiscal years ending January 31 when
inventory levels are lowest following peak holiday and sales periods; many colleges and
universities in the U.S. logically use June 30 as a fiscal year end.
Financial Statement Analysis
As used above, the term business analysis generally refers to the study of various
factors which may affect the viability and profitability of an organization. It may
consider qualitative as well as quantitative factors. Strictly speaking, financial statement
analysis, a subset of business analysis, is quantitative in nature, and concentrates on data

58
contained in the financial statements of an organization and relationships between those
figures (Finance for managers, 2002). This analysis should be informed, however, by
critical qualitative information such as that contained in the Notes to the Financial
Statements (Albrecht et al., 2005; Niskanen, 2005).
By themselves, financial statements may not be extremely useful in assessing an
individual organization’s financial health. However, utilizing specific analysis tools to
examine the information contained in an organization’s financial statements may provide
valuable insight as to the organization’s financial well-being. Absolute numbers on
financial statements, expressed in monetary units, in and of themselves mean little. Only
in comparison to other contextual data and information can they be understood. Financial
statement analysis relies on comparisons—over time, between organizations within the
same industry, and among financial statement line items at the same point in time (Ketz
et al., 1990).
Financial statement analysis may be performed in a variety of ways. Five of the
most common analyses are discussed below:
1. Horizontal (longitudinal or trend or time series) analysis. Select financial
figures for the same company are examined over several periods of time. This
allows the analyst to identify trends or question substantial differences in key
relationships of a specific organization between fiscal periods (BookRags;
Garrison & Noreen, 2003; Garrison et al., 2006; Revsine et al., 2002; Steffy,
Zearley, & Strunk, 1974).
2. Vertical analysis. A single period’s financial statements are analyzed by
expressing each figure as a percentage of a total for that particular statement.

59
Line items on the Income Statement are expressed as a percentage of
revenues. Line items on the Balance Sheet are expressed as a percentage of
total assets. The numbers are presented vertically on financial statements,
thus the term, vertical analysis (BookRags; Garrison et al., 2006; Lanza,
2004).
3. Common size statements. Once each figure is expressed as a percentage in
vertical analysis, entire statements may be presented as percentages, allowing
for comparisons between organizations of dissimilar size (Schaeffer, 2002).
However, greater validity attaches to comparisons between organizations with
the greatest similarities. Comparisons between organizations may be
appropriately made only within the same industry (Miller & Miller, 1991).
Even factors such as geographic location may render comparison between
common size statements less valid. Common size statements may also be
prepared for longitudinal study, eliminating the effect of growth in size of the
same company and allowing the analyst to concentrate on relationships as
percentages rather than monetary units (Revsine et al., 2002).
4. Ratio analysis. In this type of analysis, mathematical relationships expressed
as ratios are explored and interpreted (Viscione, 1983). Specific monetary
figures are compared with other monetary figures on the same financial
statement or on another financial statement for a specific purpose. Liquidity,
solvency, and profitability are among the many concerns that may be
addressed through the use of ratio analysis (BookRags; Garrison et al., 2006;
Revsine et al., 2002).

60
5. Cross-sectional analysis. Ratios of two or more organizations in the same
industry may be compared, or ratios of a specific organization may be
compared to industry average ratios (Revsine et al., 2002; VentureLine,
2005a).
Financial statements are commonly analyzed both internally and externally.
Comparisons often are made to industry standards. A number of organizations secure
and analyze financial statements from literally millions of companies and prepare and
publish industry norms (Dun & Bradstreet, 1992, 2003; RMA, 2003-2004). Industry
norms may also be called industry guides, industry standards, industry averages, or
industry benchmarks. Industry norms do not identify what is “best,” but rather, what is
common or average within an industry. Some services provide ranges of responses,
identifying upper and lower quartiles and midpoints within (Dun & Bradstreet, 2003).
These industry norms are used in a variety of ways. Benchmark comparisons
measure an organization’s financial health, historic, and current performance against a
predetermined standard (Revsine et al., 2002). Investors may compare a specific
company to appropriate industry averages in order to assess financial health and the
potential for future performance (Ketz et al., 1990; Troy, 2004). Lenders may compare
an individual organization’s financial statements and key ratios with industry averages as
part of their assessment of risk in lending to that organization (Huff, Robert M. Harper, &
Eikner, 2000). Substantial deviations from the norms serve as red flags for further
investigation (VentureLine, 2005a). Individual companies may compare their own
financial statements to industry benchmarks as an assessment of financial well-being. In

61
this process, irregularities may be identified which, when properly addressed, can lead to
corrective action (Jones, Werner, Terrell, & Terrell, 2000).
Financial statement analysis is widely accepted and frequently applied to
businesses of all types. Indeed, virtually every college business student is required to
take courses which offer exposure to this topic. Accounting textbooks have been around
for over 500 years (Sadler, 1894; L. M. Smith, 2002). During that period of time,
accounting practice has evolved from simple debits and credits, to financial statement
preparation, to the recognition for the need and establishment of GAAP, to computerized
accounting information systems (Mathews & Perera, 1996). In recent years, many
textbooks approach accounting and financial statements from an analysis perspective
(Bergevin, 2002; Bernstein & Wild, 2000; Stice, Stice, & Diamond, 2003; Warren, Fess,
& Reeve, 2005). The emphasis has moved from how to properly classify and record
financial transactions (Sadler, 1894) to how to best utilize information provided by
accounting systems (Revsine et al., 2002).
Financial statement analysis is time-tested and widely used (Lanza, 2004). A
quick search on the internet will reveal the breadth of financial statement analysis usage.
Literally millions of results offer articles and guides, from first-time user level to
advanced competencies. Services are offered to provide financial statement analysis for
those who wish to learn more or for those who do not wish to tackle it themselves
(American Express, 2005; NECF; New England College of Finance; VentureLine, 2005b;
ZeroMillion.com, 2005). Key financial ratios and their use are carefully explained (Dun
& Bradstreet, 2001; va-interactive.com).

62
Financial statement analysis is generally seen as an application-oriented rather
than theory-oriented type of analysis. Hence, fewer scholarly articles have been written
on this topic. Those few that exist generally examine the empirical bases for financial
ratio analysis through the lens of pragmatical empiricism (Horrigan, 1968; Salmi &
Martikainen, 1994). Such discussion may be of interest, but is not pertinent to the
purposes of this research project.
Financial Statement Ratio Analysis
The most commonly used and widely understood of the financial statement
analyses described above is that of ratio analysis (Beaver, 1966; Garrison et al., 2006).
As noted earlier, ratios are created when specific figures are compared for a specific
purpose with other figures on the same financial statement or on another financial
statement.
Financial statement ratios are used by investors, creditors, lenders, managers,
owners (Fridson, 1996; Steffy et al., 1974), and even auditors (Lanza, 2004) to better
understand the financial condition of an organization. Ratio analysis may be performed
for intra-company comparisons—looking at two or more years of financial statements for
the same company, or for inter-company comparisons—comparing companies within the
same industry (Weygandt, Kieso, & Kimmel, 1999).
Although the notion of ratios hails back to at least 300 BC in Euclid’s writings,
the practice of using ratios in the study of financial statements began in the last half of the
1800s. In the early 20th century there was considerable excitement over the possibility of
finding a “perfect” ratio to predict financial well-being or impending financial doom

63
(Horrigan, 1968). Eventually many ratios emerged for use in financial statement analysis
(Gates, 1993).
Today, it is common to find discussions of financial ratios grouped according to
the purpose or area of concern addressed by the specific ratios (B. Lev, 1974; Palepu,
Bernard, & Healy, 1996; Revsine et al., 2002; Roehl-Anderson & Bragg, 2005; Tyran,
1986; White et al., 1998). These actual groupings and their component ratios may vary
somewhat over time and from author to author, given their particular orientation and
writing purpose. [For examples of this, see the evolution and variances in presentation
among Horrigan (1965), Lev (1974), Tyran (1986), Gates (1993), and Garrison (2006).]
Manufacturing firms with their various inventories and productive facilities have the
greatest number of ratios available for analysis. Service-oriented organizations
(including schools) which rely primarily on the sale of services rather than the sale of
goods, have fewer elements of concern. Therefore, fewer financial ratios are available
for analysis purposes for service organizations.
The following groupings and their specific ratios are typical for financial
statement analyses of business organizations. Those ratios that pertain only to
manufacturing or merchandising entities (which generally have inventories as a large
component of their assets, the sale of which constitutes their main source of operating
revenue) are outside the scope of this study and will not be discussed herein. This
research project is geared towards financial analysis of schools; therefore, it will focus on
those financial ratios most appropriate for analysis of service-oriented businesses.
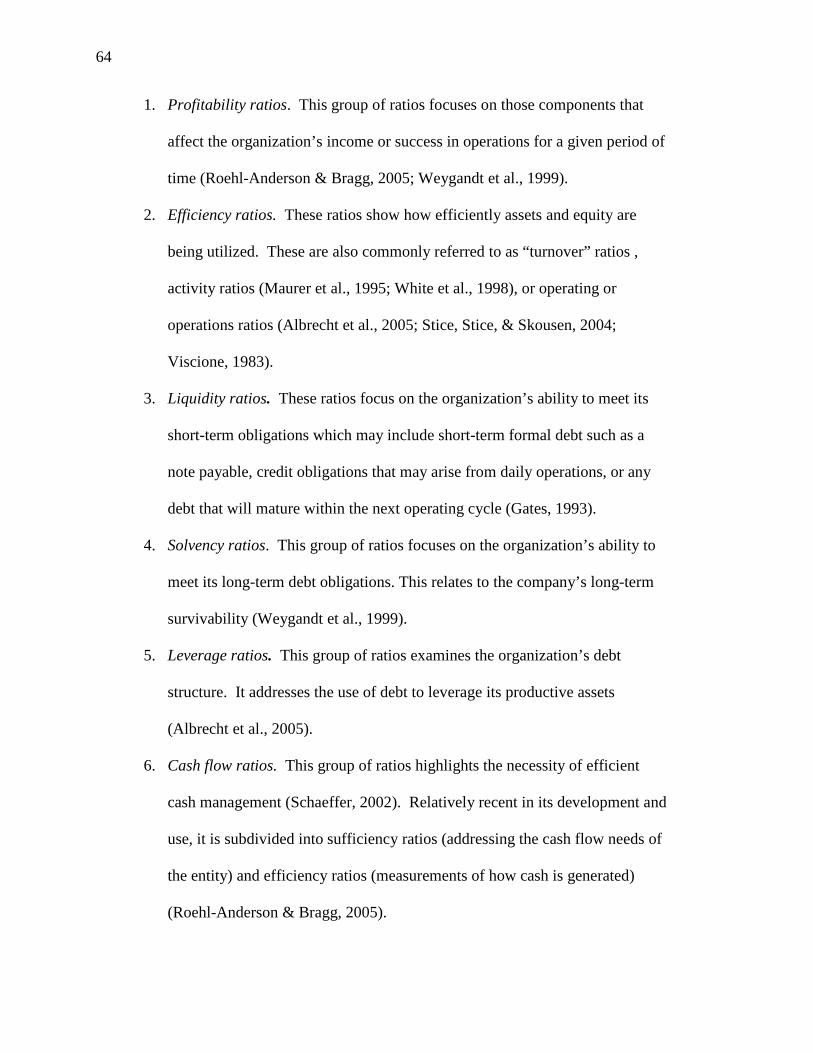
64
1. Profitability ratios. This group of ratios focuses on those components that
affect the organization’s income or success in operations for a given period of
time (Roehl-Anderson & Bragg, 2005; Weygandt et al., 1999).
2. Efficiency ratios. These ratios show how efficiently assets and equity are
being utilized. These are also commonly referred to as “turnover” ratios ,
activity ratios (Maurer et al., 1995; White et al., 1998), or operating or
operations ratios (Albrecht et al., 2005; Stice, Stice, & Skousen, 2004;
Viscione, 1983).
3. Liquidity ratios. These ratios focus on the organization’s ability to meet its
short-term obligations which may include short-term formal debt such as a
note payable, credit obligations that may arise from daily operations, or any
debt that will mature within the next operating cycle (Gates, 1993).
4. Solvency ratios. This group of ratios focuses on the organization’s ability to
meet its long-term debt obligations. This relates to the company’s long-term
survivability (Weygandt et al., 1999).
5. Leverage ratios. This group of ratios examines the organization’s debt
structure. It addresses the use of debt to leverage its productive assets
(Albrecht et al., 2005).
6. Cash flow ratios. This group of ratios highlights the necessity of efficient
cash management (Schaeffer, 2002). Relatively recent in its development and
use, it is subdivided into sufficiency ratios (addressing the cash flow needs of
the entity) and efficiency ratios (measurements of how cash is generated)
(Roehl-Anderson & Bragg, 2005).

65
7. Other indicators. In a catch-all category, some financial statement users
suggest that there are other ratios that may be helpful in financial analysis
(Fridson, 1996; Stice et al., 2004).
Specific ratios, along with explanations of their use, meanings and formulas, will be
provided in Appendix D.
Caveats Regarding Analysis Based on Financial Statements
Financial statement analysis may form the quantitative basis for critical business
decisions. Many experts believe that decisions based on financial statement analysis
must be informed by other relevant information that may not be addressed by or
presented in the financial statements (Garrison et al., 2006; Patrone & duBois, 1981).
Financial statement analysts must recognize that there are certain types of information
that cannot be captured in financial statements or even in quantitative terms. Such items
include, but are not limited to, unique location, organization reputation, customer brand
loyalty, key employees, professional associations, management quality, etc. (Albrecht et
al., 2005).
In addition, financial statement analysis must be appropriately applied (Tyran,
1986). For comparability purposes, this analysis should only be applied to the same
organization over several periods of time (intra-company comparisons), or to similar
organizations within the same industry (inter-company comparisons). The most
appropriate inter-company comparisons are between organizations of similar size and
location within the same industry (M. C. Gupta & Huefner, 1972; Weygandt et al., 1999).
Of further importance, financial statements themselves have limitations. For
instance, the balance sheet is based on historical cost information; hence, assets shown at

66
depreciated historical cost may bear little resemblance to their current market value.
Severe or persistent inflation or deflation, or other economic factors may influence
market values. If the organization is a corporation with publicly-traded stock, market
value may be approximated through calculations dealing with market value of the stock
compared to book value of the stock (Stice et al., 2004). However, this type of market
value approximation is not available to privately owned companies.
Comparability between entities may also be limited because of classifications or
titles used, or because of the accounting practices employed (Finance for managers,
2002; Stice et al., 2004). GAAP may allow for several different ways of accounting for a
particular situation. Cases in point include GAAP methods of depreciation (straight line,
double declining balance, sum-of-the-years’-digits, or units of production) or accounting
for uncollectible receivables (direct write-off method or allowance provisions). Each
acceptable accounting practice will yield a different monetary amount for the related
expense, and will consequently impact the profit line. Furthermore, financial accounting
standards may differ from tax accounting requirements imposed by a governmental entity
(Maurer et al., 1995).
In addition, an entity may structure a financial transaction so as to have the “best”
impact (this could be the complete absence of a financial impact) on its financial
statements. “Off balance sheet financing,” which may be in the form of leases or joint
ventures, may constitute major economic financial commitments that do not require
disclosure in the financial statements. The relatively recent Enron scandal in the US
underscores this potential difficulty and the commensurate need for looking beyond the
face of the financial statements alone (Niskanen, 2005; Stice et al., 2004).

67
Financial Assessment of Secondary Schools
in Mukono District, Uganda
There is wide-spread use of financial assessment tools within the business
community at large (Lanza, 2004; Tyran, 1986). Perceived benefits of their usage
include identification of financial weakness that if left unaddressed may lead to
permanent failure of the organization (Ooghe & Verbaere, 1985; Tamari, 1978) .
Financial guidelines, industry averages, and benchmarks exist for most industries.
Education, however, is a notable exception (Ketz et al., 1990).
No known study addresses the financial health of private secondary schools in the
Mukono District of Uganda. It appears that there is no trade association for these private
schools, no source to which these schools may turn for guidance on what constitutes
financial health and viability within their industry and location. There is no known
standard for comparison.
There is a relative lack of pertinent information upon which to build a model for
financial viability in an LDC setting such as Uganda. However, one such data set exists.
This data set is based on research conducted in the Mukono District of Uganda in 2003
under the direction of Dr. Julie M. Hite and Dr. Steven J. Hite (J. M. Hite, Hite, Rew,
Mugimu, & Nsubuga, 2004).
Description of the Mukono District of Uganda
The Mukono District is the fifth largest in the nation of Uganda with 11,764
square kilometers of land. It is centrally located and lies just east of the capital of
Kampala, along the northern shores of Lake Victoria. According to the official Mukono
website, population of the district totals 807,923. The district includes both urban and

68
rural households ("Mukono", 2006). Some parts of the district are accessible only by foot
or on motorcycle (Flake, 2003). Of the 1459 kilometers of reported roadways, only 759
are considered “motorable” ("Mukono", 2006).
A 2003 survey identified 74 secondary schools in the Mukono District (J. M.
Hite, Hite, Rew et al., 2004). These secondary schools range in size from 50 to 1,310
students. This Hite & Hite database, the most extensive known for all secondary schools
in a single district of Uganda, and also the most accessible, was used for this project. The
richness of this data set with its emphasis on financial resources offers the opportunity for
in-depth exploration and application of business analysis tools to secondary schools in an
LDC setting. More extensive information regarding the database and construction of
survey instruments is given in Chapter 3.
Summary of Literature Review
The EFA movement has focused globally on universal primary education for all.
Massive efforts have been made to bring primary education to every world citizen. This
emphasis on primary education has created a demand for secondary education. In many
nations, including Uganda, government funding has focused on primary education,
leaving little funding for secondary education. The resulting short supply of government-
funded secondary institutions compared to the demand for secondary schooling has
created a bottleneck in the education system. As a result, laws have been passed in
Uganda which allow private secondary schools to be organized and run as businesses.
Throughout the world, businesses utilize financial assessment tools and
comparisons with industry benchmarks as a means of analyzing and attaining financial
health and stability which may, in turn, contribute to the long-term viability and success

69
of the business. There is a lack of application of business assessment tools to education
in general and specifically to the industry of private secondary schools in Uganda.
This research project applied financial assessment tools widely utilized in
business to selected private secondary schools in the Mukono District of Uganda. The
intent of this project was to construct a model for assessment of financial viability for
these schools. Individual schools were compared with this new industry average model.
The project also explored the potential relationship between fiscal viability and quality of
education.

70

71
CHAPTER 3
METHODOLOGY
Project Summary
This project sought to build a model for assessment of fiscal viability for private
schools in the Mukono District of Uganda. Increased government funding for universal
primary education has resulted in tremendous increases in primary school enrollments in
recent years. Increased numbers of primary school graduates now seek secondary school
opportunities. However, there is relatively little government funding for secondary
schools. To meet this demand, many private secondary schools have been established.
These schools are essentially businesses. This project used business analysis tools to
explore the financial health of private secondary schools in the Mukono District of
Uganda in order to build a model for assessment of financial viability. Select financial
measures were compared to the schools’ national examination scores to determine if any
relationship exists between fiscal viability and quality of education as measured by
examination scores.
Using primarily quantitative methods and methodologies, this project employed
Tukey’s theoretical framework of an exploratory data analysis approach (Hoaglin et al.,
1991, p. 100; Tukey, 1970). In addition, Langer’s concept of mindfulness (E. J. Langer,
1989), as Brody and Coulter (2002) apply it to business and accounting settings,
informed this analysis. In this mindful exploratory mode, emphasis was placed on
pragmatism.
The thrust of this project was to lay the foundation for building a model of
financial well-being, or financial viability as it may be termed. Therefore, attention was

72
also given to model building in financial settings (Cheng & Shimerda, 1981; Nagorniak,
2005; M. Smith, 2003; Tjia, 2004).
Limitations
Some aspects of the research were not controllable by the author. The following
were notable limitations of this project.
1. Throughout the data collection phase of this project it became evident that
data collection and reporting systems in Uganda are inconsistent and largely
unpredictable. Data for this project may therefore be subject to a less than
desirable degree of validity.
2. Research studies generally seek to have a large sample size. However, only
74 secondary schools exist in the Mukono District of Uganda. The relatively
small sample size was further limited by UNEB status. Only 59 schools bore
this designation. Revenue reports were filed for only 10 schools, restricting
the actual database even further.
3. Not all students who sit for a UNEB examination at a testing site are actually
students enrolled in that school. While these “non-enrolled” students
generally represent a small fraction of the testing population, test results are
reported by UNEB testing site and, therefore, may be skewed by the inclusion
of students not actually enrolled in classes at the site.
4. The primary survey respondents (headmasters or headmistresses) may not be
fully and properly informed nor trained as to all aspects of the school’s
financial resources. Hence, their responses may not be entirely accurate or
consistent among respondents.

73
Delimitations
Some limiting aspects of research must be established by the researcher. This
author set the following delimitations on this project.
1. This study was delimited to secondary schools in the Mukono District of
Uganda. Preliminary data had been previously collected during the summer
of 2002, which identified these schools and allowed the author access to
further exploration. The results and conclusions of this study should be
viewed as applicable for that district only with perhaps some transferability to
similar limited settings, but not global generalizability to settings beyond the
population from which the sample was taken (S. J. Hite, 2001).
2. A measure of the quality of education was sought for this project. UNEB test
scores are publicly available and offer a reasonable and widely accepted proxy
for quality of education provided by schools. Consequently, the author chose
this measure as a proxy for quality of education rather than other potential, but
less accessible, normative data sources.
3. Revenue reports are filed with the Uganda Revenue Authority (URA) and
constitute a relatively readily accessible source document for financial
information relative to individual schools. The author delimited financial data
sources to that which was obtainable through these 10 official reports, coupled
with survey data obtained from the same schools.
4. The survey questions regarding financial resources were worded to achieve
the most information with the least amount of offense. Cultural concerns,

74
those both of the European researchers and the Ugandan participants, may
have restricted both the breadth and depth of the questions.
Data
Data used for analysis in this study came from three separate primary sources:
archival survey data, revenue reports, and UNEB test scores. These data sources are
individually discussed.
Archival Survey Data
Archival survey data constituted the initial database for this research project. The
following discussion addresses the historical background for the research, development
of the survey instruments, pre-testing and administration of the survey, data capture
procedures, data entry, and analysis set up.
Background of the Field Research and Survey Instruments
All survey data from the Mukono District of Uganda which are relevant to this
project were collected under the IRB (see Appendix B-2), field work, and coordination of
BYU professors Dr. Steven J. Hite and Dr. Julie M. Hite. Original educational field work
commenced in 2000 and continued through 2004.
Initial data identifying all known secondary schools in the Mukono District of
Uganda were collected during the summer of 2002 by this author and other field research
assistants. Data collection was performed in conjunction with the BYU Uganda
International Volunteers Program (IVP) student researchers, under the direction of Dr.
Steven J. Hite and Dr. Julie M. Hite. Data gathered that year included demographic
identifiers and the Global Positioning System (GPS) location of the school. There are
few named roads, physical addresses, or other specific identifiers for building locations in

75
the Mukono District of Uganda, particularly in rural areas. Public transportation to many
of the school locations was non-existent. Researchers employed the services of “boda
boda” (small motorcycle) drivers for transport to outlying, limited-access areas of the
District. These preliminary data were gathered in order to build a secondary school site
database for continuing research purposes.
The following year this author was involved in the design of new survey
instruments to be administered as part of the continuing educational research efforts in
the Mukono District. A four-part school site resource survey was developed to capture
data regarding personnel human resources, financial and administrative human resources,
physical resources, educational resources, and some other administrative data. (See
Appendix C, Part 2, for that portion of the survey which addresses financial resources.)
These surveys were to be administered to appropriate administrators, teachers, and staff
at each secondary school location. Having a strong academic background and prior
professional experience in business and educational accounting, this author substantially
contributed to those sections pertaining to financial resources.
Primary financial data for this study were collected via these newly developed
survey instruments. Surveys were administered by field research assistants of the BYU
Uganda IVP during the summer of 2003 under the continuing direction of Dr. Steven J.
Hite and Dr. Julie M. Hite. Financial resources data, as related to assessment of financial
viability of these secondary schools, is the focus of this author’s interest and study and
forms the basis of this project.

76
Data Collection
Two secondary schools were selected randomly for the initial survey testing.
These schools were drawn from the pool of secondary schools identified as being within
a five kilometer radius buffer-zone previously created by the ESRI Arc-GIS software
(Mugimu, 2004, p. 100). This determination was based on GPS location readings
gathered during field research conducted in 2002. Administrators at these two schools
studied the surveys and indicated those areas that needed further explanations,
clarifications, or other modifications. These relatively minor changes were approved by
the field director.
The revised surveys were then administered to eight secondary schools, chosen
via random selection with replacement, and minor changes were again made to the
instruments. In total, approximately 600 variables were generated in this set of four
survey instruments. However, only those data items relevant to financial resources were
included in this project.
School resource surveys were administered to 74 secondary schools in Mukono
District of Uganda during the summer of 2003. Approximately 10 to 12 field research
assistants gathered data under the direct supervision of BYU IVP field director Joshua
Rew and the administrative assistance of native Ugandan BYU PhD candidate
Christopher B. Mugimu. Two letters of introduction, one from the Permanent Secretary
of MOES and another from the research project directors printed on BYU letterhead (see
Appendix B) explaining the project, its purpose and background, were presented to the
schools before the surveys were administered.

77
In addition to administering the surveys, these field research assistants gathered
supplementary data through observations and interviews. School visitations required on-
location contact of approximately two to eight hours, depending on the size and
complexity of the school. The difficulty and length of travel time occasionally
necessitated more than a single one-day trip to collect data at a given location. At the
conclusion of the survey administration, field research assistants left a token of
appreciation with the schools. These nominal gifts took the form of textbooks, maps,
sports equipment, and certificates of recognition (Mugimu, 2004).
Overall, the schools’ reception of the field research assistants and the survey was
positive. According to the field director, Joshua Rew, “The most significant problem
with respect to data capture is that financial data is sensitive data and it is possible that
many administrators ‘doctored’ their data” (J. Rew, personal communication, February
15, 2006). However, Rew also noted that many of the administrators referred to their
financial records in answering the questions pertaining to financial resources.
Data Entry
Data were transcribed into an Access database at BYU by paid undergraduate
research assistants during Fall 2003 and Winter 2004 semesters. This data entry was
conducted under the continuous mentoring and monitoring of field administrator/BYU
EDLF master’s degree student/research assistant, Joshua Rew, and principal investigator,
Dr. Julie M. Hite.
A copy of the data from the financial section of the resources surveys as well as
selected identifying and demographic data for each school was transferred to an Excel
spreadsheet format (see an example of these spreadsheets in Appendix E) and forwarded

78
to this researcher for further review and analysis. This author then identified data by
question number and keyed the data to a master data identification list for financial
resources.
The original data are archived in an Access database under the direction and
protection of principal investigator, Dr. Julie M. Hite. Access to this database is limited
to only those researchers who have express consent and training. Periodic updates are
made to the database as necessary and/or available (J. Rew, personal communication,
February 15, 2006).
UNEB Scores
UNEB national test score data were procured in 2003 from the Uganda
government’s Ministry of Education and Sports (MOES) under the IRB and direction of
Dr. Steven J. Hite and Dr. Julie M. Hite. Scores are reported by school testing site. Only
59 of the 74 secondary schools in the Mukono District of Uganda have the distinction of
designation as a UNEB site.
The author obtained permission to access the UNEB data from the principal
investigators, who maintain overall database security . These data were used as a
measure for quality of education. The UNEB data were compared with the select
financial measures, identified by the model for assessment of fiscal viability, to determine
what, if any, relationship existed.
Revenue Reports
It is difficult, if not impossible, to obtain formal financial statements for
secondary schools in Uganda. Only public companies are required by the Companies Act
79
to submit complete sets of financial statements with the Registrar of Companies, and
compliance is poor (Uganda Accounting and Auditing ROSC, 2005).
Identifying Schools That Filed Revenue Reports
In search of some means of obtaining information that would generally be found
in formal financial statements, it was discovered that business organizations are required
to file revenue reports with the Uganda Revenue Authority (URA). These reports, which
may closely resemble formal financial statements, are the basis for taxation by the
Ugandan government.
In an attempt to identify those secondary schools for which revenue reports would
be available, Question 52 of the Headmaster Survey asked this question: “Did you file
revenue reports last year with government, district or town assessors?” Positive
responses were given by 36 of the 59 UNEB schools.
This response raised questions as to which schools are required to file reports and
under what circumstances the reports must be filed. According to Section 92 of The
Income Tax Act, Cap. 340, a publication of the Uganda government, regarding
“furnishing of return of income,” it is found that (1) “every taxpayer shall furnish a return
of income for each year of income of the taxpayer…,” and that (2) “A taxpayer carrying
on business shall furnish with the taxpayer’s return of income a statement of income and
expenditure and a statement of assets and liabilities” ("The income tax act cap. 340",
1997, p. 7102-7103).
Further investigation revealed that Section 2 of the Income Tax Act allows for
exempt organizations. An explanation of exempt organizations is provided by Pius K.

80
Bahemuka (2004), a professional accountant and former Chief Executive of the Institute
of Certified Public Accountants of Uganda (ICPAU):
[An] exempt organization is defined as any company, institution or irrevocable
trust which is...(ii) a religious, charitable or educational institution [italics added]
of a public character....It is not clear what 'of a public character' in (ii) above
means. However, it is clear that an organization exempt from tax (say a school
[italics added]) must be established for the benefit of all people without any
discrimination provided of course it fulfills the minimum requirements. Therefore
where the income from an educational institution will benefit one or more
individuals [italics added] that institution cannot claim to be an exempt
organisation. In any case, it is important to note that the exempt organization
must apply for and obtain a ruling [italics added] from the Commissioner that it is
an exempt organization [italics added]. (p. 61)
From these sources it appears that all secondary schools in the Mukono District,
except those that are clearly government-aided and have no private ownership, are
required to file revenue reports. It would be logical to expect, therefore, that of the 59
UNEB designated schools, all 40 of which are private organizations (and therefore not
exempt) should have filed revenue reports.
It was ascertained that of the 59 UNEB schools, 36 schools reported that they had
filed the revenue reports. Some confusion comes with the realization that 11 of these 36
schools are self-reported government-aided schools, which we would expect to be exempt
and, therefore, would not need to file revenue reports. In summary, 25 private schools
reported filing revenue reports.

81
Obtaining Filed Revenue Reports
During 2005, this author worked with Dr. Steven J. Hite, Dr. Christopher B.
Mugimu, and various authorities and agents in Uganda to obtain copies of revenue
reports for the schools reporting in the 2003 surveys that these reports had been filed. A
search was made of Uganda Revenue Authority (URA) records for the 59 UNEB
secondary schools from the Mukono District to determine which schools actually did file
revenue reports. Filed reports were found for only 10 of the expected 25 private UNEB
schools indicating that they had filed the reports.
In search of a plausible explanation for the low number (10) of filed revenue
reports in comparison to the number (25) of private schools that responded that the
reports had been filed, it was recognized that (a) respondents may not have been properly
informed, and that (b) schools need not file unless they actually had an income.
Therefore, the author concluded that only 10 non-exempt schools actually earned
incomes and therefore filed revenue reports. This filing was, in itself, a filter for financial
well-being. Those schools which were not profitable, essentially self-selected out of the
analysis. Although it may have been beneficial to analyze the financial statements of the
non-profitable schools, this was impossible; such financial statements simply do not
exist.
Few revenue reports were filed in comparison to the numbers expected and the
numbers reported. The following speculations are offered regarding the implications of
this condition.
1. Financial health overall for secondary schools in the Mukono District is
relatively poor. Many of these schools are relatively new and may be

82
experiencing financial difficulties. Indeed, Dr. Mugimu indicated that this
may well be the case. He noted that quite a number of schools in the District
have failed or are threatened by the realistic probability of failure. This
underscores the great need to identify those factors of a financial nature that
are critical to financial well-being in secondary schools in the Mukono
District (C. B. Mugimu, personal communication, November 16, 2005).
2. Although the number of revenue reports (the sample population; n=10) may
be considered too small to have statistical significance in regression models,
descriptive statistics for the schools that have filed revenue reports generated a
wealth of information upon which to begin the process of building a model for
assessment of financial viability.
Data Analysis
Data derived from copies of these revenue reports were entered by the author into
Excel spreadsheets. This data was used for further analysis and application of business
analysis techniques.
Data analysis using financial assessment tools identified in Chapter 2 was
performed in conjunction with the three research questions posed in Chapter 1. These
questions formed the basis for exploration of the development of a model for assessment
of fiscal viability—a measurement of organizational financial health for the secondary
schools in the Mukono District of Uganda.

83
Methods
The three research questions identified in Chapter 1 provided the framework for
analysis. Each research question is re-presented here. Data and methods appropriate to
addressing each question are identified.
Research Question # 1
Using business models for financial assessment, what analysis tools and financial
ratios may be effectively applied to private secondary schools in Uganda in
developing a model of fiscal viability?
This question indicated two areas of exploration. They are as follows:
1. Given the database, both from survey data relative to financial resources and
from secured revenue reports, what analysis could be applied, i.e., was the
data comprehensive and complete enough to use all five analysis tools
identified in Chapter 2?
2. Identification was made of analysis tools and ratios that could be
appropriately applied to this setting of private secondary schools in LDCs,
i.e., what was relevant to the setting and the needs of these stakeholders?
In order to address this first research question, the author thoroughly examined
the data derived from the financial resources surveys and from the revenue reports. Ideal
conditions dictate access to very specific financial data. Each of the revenue reports had
to be examined in detail to determine whether or not it is possible to apply each of the
five analysis tools identified in Chapter 2. Briefly, the afore-mentioned analysis tools are
(a) horizontal (longitudinal, trend or time series) analysis, (b) vertical analysis, (c)
common size statements, (d) ratio analysis and (e) cross-sectional analysis.

84
A template for ideal financial statement content for a private secondary school in
an LDC was constructed in an Excel spreadsheet format. Then, data from each of the 10
revenue report schools were entered into this template. Deficiencies, if any, were noted
and the implications of those deficiencies were explored.
Application of each of the five analysis tools was then explored. Deficiencies, if
any, were identified and addressed.
It was anticipated that the most commonly used of the five analysis tools, ratio
analysis, would be the focus of much of the data analysis. As noted in Chapter 2,
financial statement ratio analysis is often grouped by function or area of concern such as
profitability, efficiency, liquidity, solvency, leverage, or cash flows. Specific ratio
formulas are commonly utilized within each of these groupings. This phase of analysis
applied formulas, within groupings, to the data previously entered into the ideal template.
The meaning, usefulness, and ease of calculation of each of these formulas were
also addressed. Appendix D outlines the ratio analysis groupings and respective
formulas. The following is provided as an example of this analysis:
1. Name of ratio grouping: Liquidity
2. Intent or function of this ratio grouping: Measure the ability of an
organization to meet its short-term obligations
3. Name of specific ratio: Current Ratio (also known as the Working Capital
Ratio)
4. Formula for this ratio: Current Assets / Current Liabilities

85
5. Where the data for this ratio can be found in the database: The Assets section
and Liabilities section of the Balance Sheet found in the Revenue Report should contain
this specific data.
6. Use of this ratio: This ratio is used both internally and externally. It is one of
the most commonly used and widely recognized measures of short-term liquidity.
7. Meaning/Interpretation of the ratio: A ratio greater than 1.0 means that
Current Assets exceed Current Liabilities, a positive indication. (This is also interpreted
as having “positive working capital.”) This ratio is often compared to known industry
standards. However, there is no known industry standard for secondary schools in
Uganda. The industry averages (sample means) calculated in this project may now serve
as industry standards or benchmarks, against which individual school ratios may be
compared.
8. Expected range of the ratio: This depends on the “experience base” and can
only be established as based on an analysis of specific data. However, the values could,
theoretically, range from zero to a very large positive number. Normal values, however,
would be expected in the range of perhaps 0.5 to 5.0.
9. Appropriateness of this ratio in LDC settings: This key ratio is extremely
appropriate, relevant, and useful in LDC settings. A low Current Ratio indicates potential
difficulties in meeting financial obligations. An extremely high ratio, on the other hand,
may indicate inefficiency or stockpiling of current assets or inefficient leveraging
activities.
An effort was made to identify those few (two to four) ratios in each ratio
category that best (a) capture the essence of the category, and (b) can be calculated given

86
the data available. This simplification strategy sought to distil the conversation without
losing its critical components.
A discussion of each of the ratios explored is provided in Chapter 4. An
expanded explanation of each of those ratios found to be most useful in this setting is
presented in Appendix F-15.
It was anticipated that this stage of the research would be exploratory. This
question was addressed to determine which items in the database were usable as
compared to an ideal database and what deficiencies existed. Analysis of this research
question set the foundation for the proposed development of a model of fiscal viability.
Research Question #2
What transformations or modifications to standard business models of financial
assessment are required to build an appropriate model of fiscal viability for
private secondary schools in an economically developing country?
Building on the analysis performed in addressing Research Question #1, this
question addressed the need for changes (if any) that must be made to the standard
financial assessment models in order to build a fiscal viability model appropriate to the
setting of secondary schools in LDCs. This question asked what could be gleaned and
utilized from globally accepted corporate finance models and tailored to the needs of
LDCs. It was recognized that there could be elements commonly utilized in these
globally accepted corporate finance models that are not relevant to LDCs. Where
identified, these elements were modified or deleted. This question again contrasted an
ideal with reality and sought to describe a model that is both doable and useful.

87
This question was addressed by carefully looking at the findings of Research
Question #1. The need and possibilities for changes to standard business models of
financial assessment in order to construct a model of financial viability for secondary
schools in a developing nation setting were then addressed.
Some anticipated possibilities were the construction of average ranges for ratios
or inner quartiles. It was thought that perhaps a ranking system would emerge. The data
itself (or lack thereof) had to guide this stage of the analysis.
Research Question # 3
Using quantitative analysis, is there an apparent link between this newly
developed model and the standard quality measurement of student performance,
i.e. Uganda national examination scores (J. M. Hite, Hite et al., 2004b)?
The model proposed for creation in addressing Research Question # 2 was to
provide some way to compare the financial health of the secondary schools with the
UNEB test scores of that school. This was an attempt at a comparison of financial health
with quality of education. This question sought to identify a relationship (if indeed there
was one; it could have been a negative or inverse relationship rather than a positive
relationship) between institutional financial well-being (fiscal viability) and quality of
education offered by the institution in this LDC setting.
Although it was anticipated that other analysis possibilities might emerge in this
exploratory process, one conceivable approach was seen as the formulation of a ranking
system for financial health that could be compared to a ranking based on test scores. It
was anticipated that this could also be explored by applying the standard statistical

88
procedure of a Pearson Product Moment Correlation, using the fiscal viability ratios and
the UNEB scores, both of which are interval type data.
Conclusion
This chapter explored and outlined the methods to be used for data analysis. In an
exploratory mode, it was anticipated that some modifications would be needed as the
analysis progressed. Chapter 4 addresses the findings of this research. Chapter 5
provides a discussion of the findings and offers concluding remarks.

89
CHAPTER 4
ANALYSIS AND FINDINGS
This chapter describes the process of data examination, analyses, and findings. In
answering the three research questions, a comprehensive approach was taken to analyze
the three data sets described in Chapter 3. The reader is guided through this process as a
basis for understanding financial statement analysis as it may be applied to secondary
schools in an LDC setting.
The exploratory nature of this research dictated an iterative process between
analyses and findings. Each finding informed the next analysis. This process is
described in a chronological manner.
Survey Data Set Financial Analysis
When the data set was obtained via surveys administered in 2003, it was
anticipated that enough financial data could be collected in a non-threatening manner to
construct financial statements for each of the schools. Surveys may be a less-than-ideal
manner of gathering reliable financial data. However, with no national requirement for
schools in Uganda to provide audited financial statements (as opposed to the international
corporate world where this generally is a requirement), the survey appeared to be the
least expensive, most efficient and realistic method of collecting financial data for all the
secondary schools in the Mukono District of Uganda.
All survey data were entered into Excel spreadsheets. To perform a financial
analysis, the author found it necessary to re-arrange this data into a meaningful format.
Templates were constructed for an “ideal” set of financial statements. These templates

90
were based on traditional content for formal financial statements of service-related
organizations.
As explained in more detail in Chapter 2, a full set of formal financial statements
includes: (a) an income statement showing revenues less expenses; (b) a balance sheet
outlining assets, liabilities and owners’ equity; (c) a statement of cash flows; and (d)
notes to the financial statements. Templates were established for an income statement, a
balance sheet, and a statement of cash flows that could be completed with data from each
school in the study. Notes to the financial statements cannot be constructed on a template
basis as they must be tailored to each organization. Notes outline specific accounting
principles used by that entity, supporting schedules for specific calculations (such as tax
liability or depreciation calculations), and other items that may impact the financial status
of the entity.
The Survey Instrument
After the templates were established, effort was expended to determine which
questions from the survey data set could best provide the necessary financial detail to fill
in each line item. (See Appendix F-1, “Template for Financial Statements.”) A number
of challenges were encountered with this approach to financial statement construction
that rendered the attempt invalid. Some of the notable concerns follow.
1. Some survey questions contained terms that were not clearly and precisely
defined in the survey instrument. This ambiguity provided the opportunity for
various and diverse interpretations and responses. As discussed below, some data
were obtained that indicated significant between-respondent variation, to the point

91
that insufficient consistency was found in the data to proceed with reasonable
confidence with these particular responses.
2. Some of the survey questions were formatted such that responses were gathered
as categorical data. While this is much easier for the respondent, it does limit
analysis and interpretation for quantitative purposes. An attempt was made to use
the categorical midpoints for further analysis, but this attempt was later
abandoned. It is impossible to mathematically balance financial statements that
are based on categorical data midpoints.
3. Data were incomplete or inaccurate. By definition, amounts that are labeled as
totals should equal the mathematical sum of individual elements comprising that
total. Indeed, in a number of instances, the totals indicated by the respondents
were significantly out of balance to the actual calculated totals.
Responses to Survey Instrument
A simple exercise was conducted to determine the closeness of the survey data
with the revenue report data. Two key figures were chosen: total assets (which is a
critical balance sheet figure) and total revenues (which is a critical income statement
figure). Question 76 from Part 2 of the survey was intended to identify the total assets of
the school. Reponses to this question were compared with the total assets figure obtained
from the revenue report of each school. A difference between the two figures was
calculated and then expressed as a percentage to quickly identify the magnitude of the
misstatement. Percentage differences ranged from 18% to 99%. A similar process was
conducted to compare revenues. Question 74 of Part 2 was intended to identify revenues
which were then compared to revenues as identified on the revenue reports. Differences

92
between these figures ranged from 18% to 76% misstatement. The great disparity in
these comparative numbers indicated that the survey data set was not a valid or reliable
source for financial data when compared to data from audited formal financial
statements. At this point in the analysis, it was determined that construction of financial
statements from survey data would render meaningless results. Therefore, the attempt to
create financial statements from survey data was abandoned.
This analysis confirmed the assertion that financial data must be obtained from
sources that are reliable and consistent. Ideally, that data source should also allow for
some type of verification of the data.
Although the survey data set did not provide useful, reliable financial data, it did
contain a large amount of information that proved useful in understanding the financial
background and status of the individual schools. It also provided a basis for comparison
of contextual elements between the data set at large and the limited number of schools in
this study. Data elements that were particularly useful included age of the school, its size
as expressed in terms of student enrollments, gender composition, student/teacher ratios
and boarding versus day student status. Descriptive statistics for both the sample and the
population are presented in Appendix F-2, “Contextual Variables from the Survey Data
Set.”
Revenue Report Analysis
As previously stated, revenue reports were successfully retrieved from the
Uganda Revenue Authority (URA) for 10 of the 59 UNEB schools in the Mukono
District. These revenue reports are basically audited formal financial statements that
have been filed with the URA for tax purposes. They are required to be filed only if the

93
school was profitable for the fiscal year. The researcher assumed that schools that did not
file had no profit. This may or may not be a correct assumption. Other explanations may
exist, but could not be easily found. Based on this assumption, the 10 schools that filed
revenue reports most likely constitute those schools in the Mukono District that enjoy the
greatest profitability and financial stability.
Accuracy and Reliability of Revenue Reports
Financial statements, such as revenue reports, that have been audited must contain
an auditor’s report. This is not a guarantee that the financial statements properly report
every financial aspect of the reporting entity. However, the auditor is required to give a
clean opinion or else qualify the opinion for specific, identified reasons. A qualified
opinion may be rendered for such conditions as inconsistencies in recording or reporting
or lack of consistent application of GAAP. Only one of the ten revenue reports has a
qualified opinion and that one did not indicate a material deficiency in the report. One
school’s revenue report was apparently not audited as it was not accompanied by an audit
report. The other eight were accompanied by clean audit reports, similar to those
rendered on corporate financial statements worldwide.
Therefore, it can be assumed that these statements were prepared according to
GAAP, consistently applied over the time periods covered by the financial statements.
While this does not necessarily indicate accuracy, these auditors’ statements do provide a
reasonable level of confidence in the revenue report data set.
Data Difficulties, Inconsistencies, and Explanations—Revenue Reports
A number of challenges were encountered in analyzing the revenue reports. Those
concerns that impact the analysis process or its outcomes, along with explanations of how

94
each issue was resolved, are provided in detail in Appendix F-3, “Data Difficulties,
Inconsistencies, and Explanations—Revenue Reports.” A brief list is provided here.
1. Inconsistency in titles used in financial statements
2. Ambiguity in titles
3. Summary data
4. Inconsistencies in balance sheet presentations
5. Inconsistencies in owners’ equity presentation
6. Technical difficulties
7. Incomplete reports
8. Inconsistency in fiscal years
Basis for Calculation of Averages
Not all of the revenue reports contained all of the expected financial statements.
The basis for calculating average (mean) figures, i.e., number of cases used in the
denominator, varies with the financial statement from which those averages are
calculated. Industry averages were calculated only on the actual number of financial
statements available in the revenue reports.
One revenue report was incomplete; it contained no balance sheets. Balance sheet
averages, therefore, are based on only nine schools, and one of those had no comparative
data (a balance sheet was included for only one fiscal year). In total, 17 balance sheets
were available and formed the basis of calculations for industry average ratios requiring
balance sheet data. (Eight schools presented two fiscal years’ worth of balance sheet
information, one school had only one fiscal year and one school did not have a balance

95
sheet.) The exception is that calculations relative to contributed capital versus earned
capital could only be performed for 13 cases as per number 5 above.
Income statement data were available for 19 cases (9 of the 10 schools included
income statements for two fiscal years). One school showed no comparative data.
Only 4 revenue reports of the 10 obtained included cash flows statements; two of
those do not have comparative data for the prior fiscal year. Therefore, formal financial
analysis was not performed on cash flows statements. The author notes, however, that
traditionally, financial statement analyses have focused most heavily on balance sheets
and income statements. Cash flows statements, although very useful if provided, are
relatively new to the financial analyses scene (Bergevin, 2002).
Financial Analysis of Revenue Reports
The author recognizes that not all readers of this dissertation will be equally
familiar with accounting and financial analysis. To assist in the reader in understanding
financial statements—the foundation for financial statement analysis, a brief description
of the accounting equation and financial statement content and purpose is provided in
Appendix F-6, “Brief Explanation of Accounting and Financial Statements.”
Data from the revenue reports, in the form of formal financial statements, were
entered into Excel spreadsheets for further mathematical computations. All five financial
statement analysis tools identified in Chapter 2 were applied to the financial statement
data obtained via the revenue reports. Brief descriptions of the purpose, the process, and
the findings of each of these analyses are provided here.

96
Horizontal Analysis
Horizontal analysis is valuable in spotting trends and evaluating how an entity is
performing over time. Financial data over many years was not available for this study.
Most revenue reports used in this analysis contained data for two years. Although this
limits the usefulness of horizontal analysis, one important issue emerged. Some schools
were growing at a tremendous rate. Financial stability of any entity is affected by how
well expenditures can be tied to revenues in percentage terms. For example, in School #1,
a school that was only two years old in 2003, it was seen that although overall revenues
increased by 85% compared to the prior year, the expenses for salaries and wages very
closely followed that increase at 89% compared to the prior year. At the other extreme,
another school showed a 12% decrease in net revenues but a 26% increase in salaries and
wages and a 139% increase in financing expenses. According to standard financial
analysis, the latter school would be considered to be clearly experiencing financial
distress. A model for assessment of fiscal viability must address the relationship of
changes in composition of financial statement items over time.
A brief example of horizontal analysis is provided. Table 4.1 presents the results of
horizontal analysis for the income statement and balance sheet for School X.
The following observations are made based on data in Table 4.1. They are
representative of the type of observations made in horizontal analysis.
1. In order to maintain the same level of net income, the changes in percentages in
total expenses would have to approximate the changes in percentages in
revenues. In this case, the revenues increased by 85%; total expenses increased

97
Table 4.1
Horizontal Analysis: Income Statement and Balance Sheet, School X
Income Statement Balance Sheet
(by category) (by category)
Percent change Percent change
from 2002 from 2002
Net Revenues 85.23358 Quick Assets -22.27003
Salaries & Wages 89.19143 Current Assets 126.62706
Administrative Costs 33.49853 Fixed Assets 80.960458
Depreciation Expense 89.11671 Total Assets 83.980084
Finance Charges 183.2831 Current Liabilities 155.21969
Other Expense 94.99271 Long-term Liabilities --
Bad Debts Expense 94.77089 Total Liabilities 155.21969
Net Income 510.3189 Capital 0
Retained Earnings 610.31886
Total Owners’ Equity 54.66833
Total Liabilities +
Owners' Equity 83.980084
by only 72%. The magnitude of these changes is seen in the net income which (based
on a small monetary figure in the prior year) increased by an impressive 510%. It
appears that management was able to increase revenues while keeping a relative hold
on overall expenses. This practice, if sustained into future fiscal years, will contribute
to long-term profitability.

98
2. The finance charges show a relatively large increase at 183%. A large increase in
financing charges often indicates that the entity is suffering from cash flow
problems which may be due to school policies, poor collection of receivables, or
management deficiencies.
3. Current assets increased by 127 % while quick assets declined by 22%. In this
case, quick assets were mostly composed of cash balances. This supports the
above assertion that there could be cash flow difficulties.
4. Retained earnings increased by 610%, an indication that the increased earnings
are being retained by the school and were not paid out to the owners in this fiscal
year. This suggests that owners may be more concerned about long-term viability
than they are about short-term profitability.
The numeric results of horizontal analysis for all 10 balance sheets and income
statements are presented in Appendix F-7, “Summary of Horizontal Analysis—Balance
Sheets and Income Statements.” Percentage changes are summarized for each of the 10
schools individually. Mean values calculated from the school information are also
presented as Appendix F-8, “Horizontal Analysis—Industry Averages; Percent Changes
for Balance Sheets and Income Statements.”
Vertical Analysis
In the vertical analysis stage, every item on the balance sheet was expressed as a
percentage of total assets. This facilitated analysis of relationships between various
components of assets, liabilities, and owners’ equity. Vertical analysis applied to the
income statements expressed each item as a percentage of net revenues, enabling the
author to examine relationships between the various components of revenues and

99
expenses. The relative size of each component signaled its significance and effect on net
income, the bottom line measure of profitability for the fiscal year.
Vertical analysis was performed on each element of each financial statement as
presented in the revenue reports. The numbers and titles of accounts were not consistent
between schools to allow direct comparison, but provided the author with an overall
understanding of the composition of each individual school’s financial statement content
and the relative importance (percentage of total) of each financial statement item.
Vertical analysis of the individual school financial statements lays the foundation for
common size analysis. An example of vertical analysis for one school’s income
statement is shown in Table 4.2.
Common Size Statements
Common size statements are an extension of vertical analysis. The thrust of this
analysis tool is to allow comparisons between schools. By grouping balance sheet items
into several predetermined categories and expressing each as a percentage of assets, the
author was able to make comparisons between entities as to the composition of balance
sheet items. For example, it was found that 3 of the 10 schools in this study had long-
term liabilities of significance. This finding indicates that these schools have chosen to
finance their operations and acquisition of fixed assets through the use of debt financing
rather than through owners’ contributions. Generally speaking, common size statements
help a financial analyst to identify owners’ and management’s practices and strategies
relative to those of other schools.

100
Table 4.2 Example of Vertical Analysis of an Income Statement, School X Uganda Schillings % Revenue Income
School Fees 173,672,914 100 Expenses
Food Stuffs 33,662,050 19.38244 Stationery & Printing 4,464,850 2.570263 Uniforms 5,977,000 3.441527 Burial & Condolences 83,500 0.048079 Transport & Travel 13,398,500 7.71479 Firewood 3,901,000 2.246176 Salaries & Wages 51,510,600 29.65955 Water 2,332,000 1.342754 General Repairs & Maintenance 1,458,800 0.38997 Staff Accommodation 2,410,000 1.387666 Games & Sports 1,975,000 1.137195 Students’ Medical Expenses 4,935,600 2.841894 Electricity 3,089,900 1.779149 Entertainment 154,400 0.088903 Cleaning & Sanitation 1,912,300 1.101093 Staff Welfare 2,166,000 1.247172 Clubs & Seminars 1,532,900 0.882636 Examination Expenses 10,864,100 6.255495 Phone & Postage 916,000 0.527428 Lighting 703,900 0.405302 Security 1,932,000 1.112436 Advertising 2,482,700 1.429526 Compound Maintenance 1,443,000 0.830872 Bank Charges 2,099,822 1.209067 Audit charges 1,000,000 0.575795 Repairs & Renovations 4,786,700 2.756158 Church Expenses 148,500 0.085506 Practical Materials 1,829,300 1.053302 Depreciation on Fixed Assets 5,452,320 3.139419
Total Expenses 168,621,742 97.09156 Profit 5,051,172 2.90844

101
In order to facilitate comparisons of financial statements among the 10 schools,
each financial statement item was condensed into predetermined summarized categories.
Calculations were performed to express these summarized categories as percentages of
the total. A summary of these comparative figures is given in Appendix F-9, “Common Size Balance Sheets, Two Years for Each School” and Appendix F-10, “Common Size
Income Statements, Two years for Each School.” Examples of common size statements
for one school are provided in Tables 4.3 and 4.4.
Table 4.3 Example of Balance Sheet Expressed in Common Size Percentages, School X, 2 Fiscal Years
Common Size Balance Sheet
School X
(All figures are expressed as percentages of Total Assets) 2003 2002 Assets:
Current Assets 8.145081 6.612329
Fixed Assets 91.85492 93.38767
Total Assets 100 100
Liabilities + Owners’ Equity:
Total Liabilities 40.4387 29.15103
Total Owners’ Equity 59.5613 70.84897
Total Liabilities + Total Owners’ Equity 100 100

102
Table 4.4
Example of Income Statement Expressed in Comparative Common Size Percentages, School X, 2 Fiscal Years
Common Size Income Statement
School X
(All figures are expressed as percentages of Net Revenues) 2003 2002
Net Revenues 100 100
Expenses
Salaries & Wages 18.16075 17.78083
Administration 24.56413 34.08354
Depreciation on Fixed Assets 6.600057 6.464538
Financing Charges 1.653614 1.081268
Other Expenses 38.82811 36.88481
Bad Debt Expense 0.944064 0.897836
Total Expenses 90.75072 97.19282
Profit 9.24928 2.807184
Total Expenses + Profit 100 100
Mean values calculated from individual school information are presented as
Appendix F-11, “Industry Averages—Common Size Statements.” These averages
represent an approximation of industry averages for balance sheets and income
statements in common size format for secondary schools in the Mukono District.

103
Ratio Analysis
Ratio analysis explores common relationships between items on the financial
statements. By combining factors from all financial statements in a logical and
methodical manner, a more comprehensive assessment may be made of the financial
condition of a school.
Appendix D provides a discussion of ratio analysis and identifies ratios that are
typically calculated in financial statement ratio analyses, their components, formulas, and
usefulness. Each of these 38 ratios was carefully examined in light of the data contained
in the revenue reports to determine which, if any, could be calculated. Appendix F-12,
“Ratio Analysis—Calculability & Modifications Necessary for LDC Setting” addresses
each of the 38 ratios and discusses challenges encountered when applying each formula
to the revenue report data set.
Sufficient data (with a few minor modifications) were available to calculate 13 of
the formulas identified in Appendix D. These 13 financial ratios are presented in
Appendix F-13, “The 13 Viable Financial Ratios.” Notably, those ratios that required
“cash from operations” could not be calculated. Only 3 of the 10 revenue reports
included cash flows statements which identified this amount. The others did not contain
enough data to reliably calculate “cash from operations.” Therefore, the author
determined that all calculations that contained the component “cash from operations” in
their formulas should be dropped from further consideration in this analysis. Two more
ratios, although calculable were dropped as they were very close in composition to other
ratios and provided little additional information given this data set. The 13 remaining
ratios were applied to the data found in the revenue reports. Results of these calculations

104
and further explanations are provided in Appendix F-14, “Cross-sectional Analysis—13
Financial Statement Ratios.”
An effort was made to further limit the number of ratios used in a model for
assessment of fiscal viability in secondary schools in an LDC setting. After preliminary
descriptive and correlation statistics were calculated, seven ratios were identified for
further consideration. A listing of the seven key ratios, covering five areas of financial
concern and their underlying formulas, is presented in Table 4.5. These ratios and their
usefulness are discussed in greater detail in Appendix F-15, “Ratio Analysis—Details of
Seven Key Ratios.”
Table 4.5 Seven Key Ratios Ratio Group Specific Ratios Formula
Profitability Ratios 1 Profit Margin Net Income/Net Revenues 2 Return on Equity Net Income/Total Equity Liquidity Ratios 3 Current Ratio Current Assets/ Current Liabilities Solvency Ratios 4 Long-term Liabilities to Long-term Liabilities/ Total Equity Total Equity Leverage Ratios 5 Total Liabilities to Total Liabilities/ Total Assets Total Assets 6 Total Liabilities to Total Liabilities/ Total Equity Total Equity Asset Composition 7 Asset Mix Fixed Assets/
Total Assets

105
As an example of the application, the seven key ratios plus one financial element
are calculated for School X in Table 4.6. They are representative of the 10 schools in the
sample.
Table 4.6
Seven Key Ratios + One Financial Element for School X School X Ranking 1. Profit Margin 0.092493 3 of 10
2. Return on Equity 0.42933 1 of 9
3. Current Ratio 0.201418 5 of 9
4. Long-term Liabilities to Total Equity 0 4 of 4
5. Total Liabilities to Total Assets 0.404387 4 of 9
6. Total Liabilities to Total Equity 0.678943 4 of 9
7. Asset Mix 0.918549 7 of 9
8. Revenue per Student 546,724.70 8 of 9
Cross-sectional Analysis
Cross-sectional analysis builds on ratio analysis. Ratios for all schools may be
compared to assess relative position. Comparison with industry averages for each ratio
may also identify areas of financial strength or weakness. This financial assessment tool
is very commonly used throughout the world. Although it may require considerable data
manipulation and calculations to generate the appropriate ratio factors, the result—easy
comparison between schools of key financial relationships—is well worth the effort.
These key financial relationships allow this author, and future financial analysts, to more
readily identify areas of comparative weakness and strength in an individual school.

106
Descriptive statistics for the seven key ratios are provided in Appendix F-16,
“Seven Key Financial Ratios and Ranking.” For comparative purposes, each school’s
values for these seven key ratios are also provided, along with rankings according to
relative size of the ratio values. Table 4.7 provides, as an example of cross-sectional
analysis, the comparative current ratio and relative ranking for each of the 10 schools in
the sample.
Table 4.7
Example of Cross-sectional Analysis: Current Ratio and Relative Rankings
Current Ratio (Defined as Current Assets/Current Liabilities)
School Ratio Relative Rank
1 0.2014 5
2 0.5571 2
3 0.0702 7
4 1.2186 1
5 0.0804 6
6 0.0434 8
7 0.384 3
8 0.328 4
9 0.0199 9
10 -- --
Note. Balance sheet data was unavailable for School #10.

107
Other Elements in Financial Analysis as Dictated by the Setting
In the process of applying the five identified analysis tools, the author was led to
ask whether there were other financial elements, outside the realm of the formal financial
statement analyses, that may have a bearing on the fiscal viability of the schools in the
sample. Comparison was made between what was desirable to know and what could be
known given the limitations of the data set. One calculable financial measure was
revenue per student. To obtain the numeric values for this element, net revenues from
the revenue report of each school were divided by total number of students obtained from
the survey data set. Comparative rankings were assigned and an industry average was
calculated.
This new financial element could be a critical factor in assessing fiscal viability of
a school. A high ranking could be an indication of high quality of education. It could
also indicate that the school enjoys a good reputation, can charge more for its services,
and enjoys the opportunity for greater profits. If this were true, it would positively affect
the school’s long-term existence and its fiscal viability. Alternatively, a high ranking
could mean that the school is run inefficiently and must charge more to cover its
expenses. The long-term implication here has a negative impact on fiscal viability.
Ranking: A Supplementary Analysis Tool
While ranking is not one of the financial analysis tools identified in the literature
review, it has usefulness in ascertaining the relative position of an individual school
compared to other schools in a study. It is not the absolute number of the ranking that is
of interest, but its relativity. For example, mid-range rankings on a particular measure
(for example, current ratio or UNEB scores) would generally give a financial analyst little

108
concern. But measures in which the school’s ranking is exceptionally high or
exceptionally low (like a low ranking of 9 or 10 out of 10 on a school’s current ratio or
the highest ranking of 1 on UNEB scores ) would signal to an analyst that further
investigation may be merited. Investigation of a school with a superior ranking may
reveal information leading to a recommended best practice and may, if shared and
implemented, be used to the future benefit of schools with lower rankings.
Table 4.8 shows an example of cross-sectional analysis with ranking. The profit
margin was calculated for each school as Net Income/Net Revenues. This is a widely
recognized measure of profitability and is based on figures presented in the income
statement of each of the school’s revenue reports. After the profit margins were
calculated for each school, a relative rank was assigned, such that the school with the
largest profit margin (School 3 in this analysis) was given a ranking of 1. This process
continued on down to the lowest (School 6) which was assigned a ranking
number of 10, an indication of the lowest profit margin in the sample group. In this
sample, the number 1 ranked school has a profit margin of 9.55%. The lowest ranked
school has a negative profit margin, a loss, of almost 13%.
While ranking is an ordinal measure and was not used in any statistical
calculations in this study, it allowed the author to quickly identify areas of potential
concern or interest. Rankings for each of the 15 variables used in correlation
explorations (the seven key financial ratios, one additional financial measure “revenues
per student,” the six contextual variables from the survey data set described below, and
the UNEB mean) is provided in Appendix F-17, “15 Variables, School Values and
School Rankings.”

109
Table 4.8
Example of Ranking: Profit Margin—Ratios and Relative Rankings
Profit Margin (Defined as Net Income/Net Revenues)
School Ratio Relative Rank
1 0.092492801 3
2 -0.061616977 9
3 0.09550227 1
4 0.024646838 5
5 -0.02148598 7
6 -0.129932202 10
7 0.029084397 4
8 0.018250181 6
9 -0.028735402 8
10 0.095076564 2
Fifteen variables were used in analyses and correlations. Comparing school
rankings on these variables allowed the author to more easily evaluate the relative
financial position and fiscal viability of each school.
UNEB Data Set
From the third data set, UNEB scores, a weighted average score (similar to a
GPA) for each school was calculated on a 6-point basis. A mean score for each of the 10
schools was then calculated. Table 4.9 shows each school’s mean score and its relative
ranking.

110
Table 4.9
UNEB Scores and Ranking School 1=6pts 2=5pts 3=4pts 4=3pts 5=2pts 6=1pt TotPts #Stdnts WtdAve Rank
1 78 240 120 30 4 0 472 103 4.582524 9
2 60 165 80 9 0 1 315 67 4.701493 8
3 24 95 88 45 0 7 259 67 3.865672 10
4 126 185 32 3 2 0 348 68 5.117647 7
5 306 150 0 0 0 0 456 81 5.62963 2
6 300 390 72 18 0 0 780 152 5.131579 6
7 264 80 0 0 0 0 344 60 5.733333 1
8 300 220 56 12 0 1 589 113 5.212389 5
9 426 225 8 0 0 0 659 118 5.584746 3
10 306 255 4 3 0 0 568 104 5.461538 4
The mean score of these 10 UNEB scores was calculated as 5.1021. The mean
score was also calculated for the entire UNEB school population for comparison
purposes. The population mean was 4.4335. A t-test was run using SPSS to confirm
that the mean score of the sample (n=10) is statistically different from the mean score of
the population (n=59).
The UNEB scores are used in this research to represent quality of education. The
statistically significant difference in UNEB mean scores between the sample and the
population raises questions that will be addressed in Chapter 5. The observation is made
here that 9 of the 10 sample schools were in the top 21 of 59 schools in the population.
There was one outlier school in the sample which fell into the third quartile of the

111
population distribution. A visual confirmation of the differences is presented in Figures
4.1 and 4.2. Respectively, these histograms show the distribution of the sample UNEB
means and the population UNEB means.
6.005.505.004.504.003.50
UNEBmean
3.0
2.5
2.0
1.5
1.0
0.5
0.0
Fre
qu
ency
Mean = 5.1021Std. Dev. = 0.57844N = 10
Figure 4.1 Histogram Showing the Distribution of UNEB Scores for 10 Schools
Appendix F-18, “UNEB scores—Comparisons between Sample and Population”
provides additional observations and comments regarding the differences between UNEB
mean, and the graphic presentations of the distributions of scores. The weighted average
of UNEB scores for the 10 schools was used as a variable for correlation purposes.
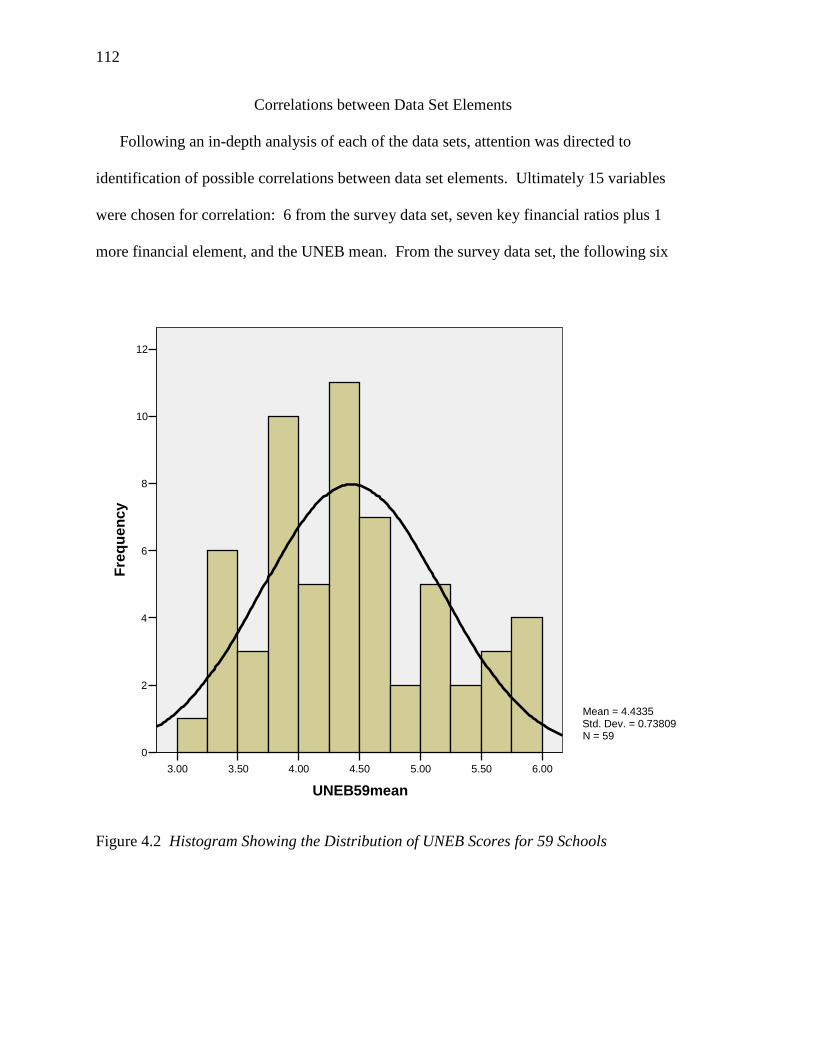
112
Correlations between Data Set Elements
Following an in-depth analysis of each of the data sets, attention was directed to
identification of possible correlations between data set elements. Ultimately 15 variables
were chosen for correlation: 6 from the survey data set, seven key financial ratios plus 1
more financial element, and the UNEB mean. From the survey data set, the following six
6.005.505.004.504.003.503.00
UNEB59mean
12
10
8
6
4
2
0
Fre
qu
ency
Mean = 4.4335Std. Dev. = 0.73809N = 59
Figure 4.2 Histogram Showing the Distribution of UNEB Scores for 59 Schools

113
contextual elements were identified as correlation variables. The first two elements were
obtainable directly from survey data. The remaining four elements required preliminary
calculations to obtain values that could be used for statistical calculation purposes.
1. Size of school as expressed in total number of students
2. Number of students who sat for the UNEB exams at the school
3. Age of school
4. Percentage of boarding students at the school
5. Percentage of female students at the school
6. Student/teacher ratios
Financial variables were chosen from the revenue reports to be used in correlation
statistics. All seven key financial ratios were used as well as a newly created eighth
financial variable, revenue per student. This new variable was intended as a measure of
how expensive each school is from the perspective of a student and the student’s family.
On a rather cursory level, when correlated with UNEB scores, it could address the
question: “Does more expensive mean better quality?”
Bivariate Pearson correlation statistics were calculated using SPSS software. The
use of one-tailed correlation statistics yielded 23 relationships at the .05 significance
level. These 23 significant correlations between the 15 variables were divided into 5
potential categories for presentation and examination. The categories are briefly
discussed here. (A detailed listing of all 23 correlations, by category, is provided in
Appendix F-19, “Correlations between UNEB Means, Financial Ratios, and Contextual
Variables.”)

114
1. UNEB means with financial variables. These correlations directly address
Research Question #3. One correlation of significance was found.
2. UNEB means with contextual variables. One correlation of significance fell into
this category.
3. Financial variables with financial variables. High correlations in this category
generally indicate that there is a structural correlation. Investigation of these
correlations reveals that there is generally a common factor in the calculation of
the ratio. Typically the numerator of the two ratios is identical or closely related
or the denominator of the two ratios is identical or closely related. All four
correlations in this category are structural correlations.
4. Contextual variables with contextual variables. While these correlations revealed
several potentially interesting and statistically significant correlations, these lie
beyond the scope of this study. Six correlations were found in this category.
5. Financial variables with contextual variables. Eleven correlations of significance
were found in this category. The implications of these findings are discussed in
Chapter 5.
While the full statistical results of the correlations between the 15 variables may
be of interest to the reader, the output is too large and cumbersome to include in this
document. Table 4.10 presents the correlation statistics for only one variable, the UNEB
scores, compared with the 14 other variables: the seven key financial ratios, the revenue
per student variable, and six contextual ratios. This correlation addresses Research
Question #3 about financial well-being (as measured by any of the financial variables)
versus quality of education (as measured by UNEB scores).

115
Table 4.10 Correlations of UNEB Scores with 14 Other Variables UNEB Mean Mean StndDev Range Correlation Profit Margin: Net Income/Net Revenues 0.0113 0.07393 -0.13- -0.30025 0.096 Return on Equity: Net Income/Total Equity 0.0297 0.20285 -0.25- -0.33529 0.49 Current Ratio: Current Assets/Current Liabilities 0.3226 0.38214
0.02-1.22 0.028554
Long-term Liabilities/Total Equity 2.3738 4.41584 0-11.49 0.401839
Debt Ratio: Total Liabilities/Total Assets 0.4439 0.3477 0.03-0.94 0.57447*
Debt to Equity Ratio: Total Liabilities/Total Equity 3.34336 5.52664
0.03- 15.26 0.443374
Asset Mix: Fixed Assets/Total Assets 0.9463 0.9483 0.86-1.00 0.047524
Revenues per Student 694351 193660 323413-
970584.9 0.099401 Age of School 8.8 10.2 2-36 0.239104
Size-Total # Students 649.2 338.4 208-1224 0.52952*
Size-Total # UNEB Students 93.3 29.7 60-152 0.192654
Percent Female 55.6163 20 42.86-100 0.094571
Percent Boarding 85.162 20.8 42.69-100 0.364323
Student/Teacher Ratio 22.8259 8.4 11.89-37.66 0.136244
* p < .05.

116
Only one correlation of significance was found at the .05 level between UNEB
scores and any of the financial variables. UNEB mean and Total Liabilities/Total Assets
showed a positive correlation of .574. In addition, one correlation of significance was
found between the UNEB means and a contextual variable—school size as measured by
total number of students. Discussion of this significant correlation and other findings is
presented in Chapter 5.
Conclusion
In this chapter, exploratory methodology was used to study the three data sets and
their relationships to each other. The iterative process of analysis and findings has been
described and illustrated. Findings of each analysis informed the next step.
Several findings had significant impact on the direction and scope of the
research. Survey data were found to be unsuitable for financial analysis. However,
survey data did yield helpful contextual data. Although some deficiencies were
encountered, revenue reports yielded more consistent and reliable financial data. Too
few schools provided cash flows data for a reliable cash flows analysis to be undertaken.
The five financial statement analysis tools were successfully and effectively applied to
revenue report data. Sample UNEB scores were examined and compared to the
population UNEB scores. A statistically significant difference was found between their
means. Correlations were run between financial, contextual, and UNEB variables.
Correlations of significance between these variables are discussed in Chapter 5.

117
CHAPTER 5
DISCUSSION AND CONCLUSIONS
This dissertation focuses on financial analysis and assessment of fiscal viability
for secondary schools in the Mukono District of Uganda. The research and analysis were
driven by three research questions. In pursuit of answers to these questions, three data
sets were analyzed. Financial statements contained in revenue reports from 10 UNEB
schools, submitted to the Uganda Revenue Authority, provided the primary data for
financial analysis purposes. This chapter will first address the three research questions
and then will look at other areas of interest that were discovered in the analysis process.
Research Questions
An exploratory approach to data analysis was employed in this research. The
original research questions contained the phrase “model of fiscal viability.” As the
author carefully examined each of the data sets and applied the five financial analysis
tools introduced in the review of literature, it became apparent that this phrase, as used in
this project, was not well-defined. The author, therefore, explored possible meanings of
the phrase to determine which would best fit this project. The iterative analysis process
itself revealed a model for assessment of financial position. Hence, this interpretation of
“model” was used from that point forward.
For purposes of this chapter, the original research questions have been modified
slightly to reflect the above definition. They will be presented here in their modified
form. These slight modifications in wording, shown in italicized print, are made for
clarity. The nature of the questions remains unchanged.

118
Potential Use of Financial Analysis Tools in an LDC Setting
The first research question addresses the potential use of financial analysis tools
in an LDC school setting. The development of a model for financial assessment is
explored. The question, as modified per the discussion above, is restated here.
Using business models for financial assessment, what analysis tools and financial
ratios may be effectively applied to private secondary schools in Uganda in
developing a model for assessment of fiscal viability?
As a precursor to actually applying financial analysis tools to the data, the author
thoroughly examined the data for content and consistency. For contextual purposes, the
survey data set was highly productive. For financial analysis purposes, the revenue
reports yielded excellent data. Only 10 of the 59 UNEB schools had filed revenue reports
and therefore could be included in this data set. The author recognizes that these 10
schools may or may not be representative of the population as a whole. Data was re-
formatted as necessary and preliminary calculations and descriptive statistics were run on
selected contextual elements from the survey data set and financial data from the revenue
reports.
Each of the five financial analysis tools presented in Chapter 2 was carefully
considered within the context of the available data. The researcher found that all of the
five tools could be effectively applied. Each tool examines the data for specific purposes
as described previously. Together, they offer a comprehensive picture of the financial
status of the school in a format that also provides a basis for relative comparisons with
the performance and status of other schools in the sample and with newly calculated
industry standards.

119
As exploratory research methodology is iterative, findings drive further analysis.
The author recognized that the five analysis tools described in the literature review were
not necessarily exhaustive of tools that could be helpful in assessing the financial health
of secondary schools. A flexible model for assessment should allow for other tools,
ratios, or financial comparisons to be made as dictated by the setting. Another financial
variable, revenue per student, was created to assist in financial assessment. The author
also found that the use of ranking was helpful. This simple comparative tool was applied
wherever the financial analysis tools focused on relative position of the individual school.
This finding, that financial tools commonly used in business at large can also be
effectively applied to secondary schools in an LDC setting, has immense implications.
The traditional notion can be dispelled that in order to survive, schools must have
guaranteed funding streams via government allocations or charitable donations. The
schools in this study are businesses. They can and should benefit from good business
practices, analysis methodologies, and assessment tools used in the business world. By
proactively identifying and applying best business practices, these schools can strategize
and realize success, both financially as well as academically.
Financial success and academic success are intertwined in the concept of fiscal
viability. Schools cannot continue to operate indefinitely without adequate financial
structures. However, without academic success, in this competitive marketplace where
UNEB scores are published and students are free to shop for the best educational bargain,
schools which do not attract students will eventually fail. A school’s long-term fiscal
viability, then, depends on both its ability to remain financially healthy and its ability to
provide a quality education at a reasonable price to the consumer, the student.

120
The analysis tools identified for use in this LDC setting, when properly applied,
can have considerable positive impact on a school’s ability to maintain its financial
health. Each of the analysis tools can assist school owners in identifying areas of
financial concern and weakness. These financial red flags, if identified and acted upon in
a timely manner, can enable a school to avert possible financial disaster.
Industry averages play an important role in financial analyses. Businesses—in
this case private schools—are able to learn about their own financial status and condition
by comparing prescribed financial statistics for their school against the averages for
schools in their own market setting. This study presents key financial industry averages
based on the 10 sample schools. These averages are likely to be more financially
desirable (healthier) than the true averages of all secondary schools in the Mukono
District. The lack of financial data for all secondary schools in the District precluded the
calculations of true industry averages. The development of broad-based industry
averages, based on consistent, reliable, verifiable financial data is a necessary condition
for full financial analyses in this LDC setting. Future research should address the
logistics of procuring usable financial data from all of the schools. This question must
also be addressed: “What organization or governmental entity could or should use this
data to calculate the industry averages and to provide this information to schools?”
This study has provided detailed descriptions of each of the financial analysis
tools employed. Supplemental explanations have also been given to further acquaint the
reader with basic business and accounting practices. These discussions are intended to
lay a foundation such that the reader could use these analysis tools to assess the financial
health of a single school or a group of schools. (See Appendix G for an example of a

121
single school analysis using the model for financial assessment identified in this paper.)
The author has provided information to support both the theoretical basis of financial
analyses and specific tools as well as their practical application.
Future research may seek the best way to assist schools in applying these financial
analysis tools. An educational piece for school owners or managers may be appropriate.
Possible delivery systems for training could be identified. Future research could also
explore the role of government, trade associations, professional associations, independent
consultants, or NGOs that focus on business development in assisting private schools to
become more financially self-aware, assessment oriented, and fiscally viable.
Model for Assessment of Financial Viability
The second research question addresses the possible need for modifications to the
five financial assessment tools. It is restated as follows:
What transformations or modifications to standard tools of financial
assessment are required to build an appropriate model for assessment of fiscal
viability of private secondary schools in an economically developing country?
The five analysis tools themselves did not require transformations or
modifications. However, two areas of concern arose. First, in ratio analysis, some slight
modifications in formulas were necessary to fit the research data. Financial practices in
this LDC setting appear to be less sophisticated than corporate settings in which the
formulas are most often applied. Modifications essentially were simplifications made to
accommodate the available data. The essence and purpose of the formulas did not
change. Second, the data itself limited the application of some financial analysis tools.
In particular, the author anticipated that analysis of cash flow would be an important part

122
of this study. However, for the majority of the schools in this sample, there were no data
available that could be used for cash flow analysis. Cash from operations, a key figure in
cash flow analysis, was available for only 3 of the 10 schools. Therefore, cash flow
analysis was not performed in this financial analysis. The analysis tools were in place;
the data simply were not available to facilitate their full application.
Each of the five financial analysis tools employed in this research examines the
data from a unique perspective. The model for assessment that emerged from this
research uses all five analysis tools. This provides a broad-based, in-depth examination
of the data. Some of the tools utilize data as re-formatted during the application of some
other tool. For greatest efficiency and ease of calculation, the author suggests that the
financial analysis tools be administered in the order set forth in Table 5.1.
From reliable financial data, ideally presented in balanced traditional financial
statement format, individual school ratios must be calculated before a cross-sectional
analysis can be undertaken. It is in the cross-sectional analysis that comparisons of
financial ratios are made between an individual school and other schools or between an
individual school and industry averages, if those figures are available. Ratios that differ
greatly from averages suggest that further investigation may be necessary. Vertical
analysis explores the relationships, as expressed in percentages, among components of
each financial statement. The financial statements expressed in these percentages may
then be compared with similarly prepared financial statements from other schools, if
available. This comparison, known as common size statement analysis, may highlight

123
Table 5.1 Model for Financial Assessment Using Business Analysis Tools Analysis Tool Application
1. Ratio analysis of the a. Calculate and study the results of the seven key ratios.
individual schools b. Other financial ratios may be explored if necessary.
2. Cross-sectional analysis a. Compare ratios between schools.
using the ratios of the b. Industry average ratios may be calculated.
individual schools
3. Vertical analysis of the a. Calculate financial statement components’ relative
individual schools percentages.
b. Investigate internal aberrations.
4. Common size statements a. Common categories may be developed for financial
statement summaries and comparisons with other
schools.
b. Industry average percentages may be calculated.
5. Horizontal analysis of a. Calculate activity level changes between fiscal years.
individual schools b. Investigate internal trends.
c. Comparisons may be made between schools.
d. Industry averages may be calculated.
6. Other financial analyses as
dictated by the setting
124
areas of significant difference and suggest further investigation. Horizontal analysis may
be the most difficult tool to employ in an LDC setting such as this, because it requires
financial data over several years. However, it may be the most useful in tracking and
evaluating the effects of management policies, decisions, and practices.
A sixth category, “other financial analysis as dictated by the setting,” was added
to this model. The model, therefore, can be dynamic and tailored to the specific needs of
the LDC setting. There may be other items of financial interest and consideration which
are unique to the setting, that are critical to the assessment of fiscal viability, but which
are not captured in the five formal analyses. In this research one such item emerged,
revenue per student.
In addition to the six named financial analysis tools, ranking may also be helpful
in evaluating the overall financial position of a specific school. This analysis tool would
be employed only if financial analysis is undertaken for multiple schools. Ranking
establishes relative position among schools.
The author anticipates that ongoing research into the application of business tools
in an LDC private school environment will lead to discovery of other financial measures
of great meaning and benefit. The financial assessment model suggested in Table 5.1
lays a foundation for financial assessment of schools. It should be modified as needed to
fit the circumstances and requirements of the individual educational setting.
This study is not expected to be an end-all. Rather, it is intended to initiate a
continuing discussion concerning schools as businesses. Recognizing the business
identity of these private schools opens doors of opportunity. The owners of these schools
can benefit directly from the application of time-tested business practices. Ultimately,

125
students and society at large should also benefit from well-run, efficient schools that have
as their focus both quality of financial standing and quality of education.
Financial Quality versus Educational Quality
The third research question explores the possibility of linking financial measures
to a measure of educational quality. This question is restated as follows:
Using quantitative analysis, is there an apparent link between financial elements
identified in this model for assessment and the standard quality measurement of
student performance, i.e. Uganda national examination scores (J. M. Hite, Hite et
al., 2004b)?
Of the many financial elements identified, calculated, and studied in the
application of this financial assessment model, eight were selected as broad spectrum
indicators. The possibility of any relationship between these elements and UNEB scores
was explored via one-tailed bivariate Pearson correlation analysis.
As reported in Chapter 4, only one direct correlation of significance emerged.
UNEB scores positively correlates with the financial ratio Total Liabilities to Total
Assets. This suggests that the higher the Total Liabilities to Total Assets ratio (indicating
that the school is more highly leveraged), the higher the UNEB scores. While there is no
obvious explanation for this relationship, at least three possibilities exist. First, the
financing of assets through long-term debt appears to be the exception rather than the rule
in this LDC setting; only 3 of the 10 schools have long-term debt. It could be that only
those owners who are familiar with business and alternative methods of financing
business (leverage) consider this option. These forward-thinking business minds may also
be strategizing on how to achieve quality of education. Second, these schools may be

126
doing so well from a UNEB point of view that the owners have opted to expand through
debt, confident that they can earn a high enough profit to repay the loans. Their
confidence in their ability to perform makes them less risk averse. Third, this may be a
Type I error, a false positive. Future research with a larger data set could explore this
relationship more fully.
The author cautions the reader about the danger of misinterpreting the positive
correlation between UNEB scores and the key ratio Total Liabilities to Total Assets.
Correlation does not mean causation. It cannot be asserted that highly leveraging a
school’s assets could lead to higher UNEB scores. This interpretation could only lead to
financial disaster.
There could be another positive correlation or link, although statistically
immeasurable, between financial well-being and quality of education. It appears that the
schools in this sample represent superior performance in both financial and academic
spheres. One finding presented in Chapter 4 is that the mean UNEB score for the sample
(10 schools) is significantly higher than the mean UNEB score for the population (59
UNEB schools). Indeed, 9 of the 10 sample schools are in the top 21 of 59 UNEB
schools. No similar financial status comparison can be made between the sample and the
population. Although revenue reports provided this financial data for the sample schools,
there is no known consistent, reliable financial data for the population at large. However,
the fact that these 10 schools are the only schools in the Mukono District to file revenue
reports suggests that they are the 10 most financially successful schools.
It could be logically claimed that the sample group does represent the most
financially successful and fiscally viable schools in the Mukono District. Only those

127
schools which have positive net income are required by the URA to file revenue reports.
It is possible that the 49 schools that did not file revenue reports had no positive net
income to report and were therefore not required to file the reports. This would verify the
idea that the sample schools are indeed the most profitable, which could indicate that they
enjoy the most secure financial status. This line of reasoning, unsupportable due to lack
of adequate financial data for all 59 UNEB schools, suggests that there is a positive
relationship between quality of financial status and quality of education.
Comments on Other Findings
Beyond the scope of the three research questions, there were other findings of
interest that arose in the course of analysis. A discussion of these findings may help to
guide future research.
This section addresses relationships between the 15 variables used in the
correlation study. These include the previously identified seven key ratios, revenue per
student, UNEB mean scores, and six contextual elements.
Non-structural Correlations between Financial Variables
As noted in Chapter 4, of the four significant correlations between key financial
ratios, all were expected. They are all structural correlations. It is somewhat surprising
that there were not any non-structural correlations. If, indeed, these seven key ratios
capture the essence of financial well-being, there logically should be some non-structural
correlations between these ratios. The relative lack of correlation between financial
ratios may indicate that (a) there are no truly financially healthy schools in this sample, or
that (b) there could be an omitted variable or some other measures of financial well-being
that are as yet unrecognized. Further research is needed to explore these possibilities.

128
An additional financial element, revenue per student, was identified and used in
the correlations. This element had a positive significant correlation with one of the
financial ratios, Asset Mix, and is a non-structural correlation. This indicates that the
more a school invests in fixed assets (as a proportion of total assets), the higher are its
charges to students. Depending on the specific school, another explanation could be that
with large proportions of assets, the school could generate other revenues in addition to
student revenues. It could rent the facilities. The revenue figure used to calculate this
financial element is total revenues, not just revenues generated from students. The total
revenues figure was selected because some schools did not provide a breakdown in their
revenues between student-related and non-student-related revenues. Future research
could seek to isolate these components of revenue. It could also address the relationship
between fixed assets and revenues generated.
Highly Leveraged Female Schools
Of all the correlations calculated between the final 15 variables in this study
(seven key ratios, revenue per student, six contextual variables and UNEB scores), the
variables that show the most significant and highest correlation are Percent of Females
and the Long-term Liabilities to Equity, a measure of solvency: .959 at a .000 level. Not
unexpectedly, the two leverage ratios which use total liabilities as their numerators also
show significant correlations with percent of females in a school. These correlations
mean that in the sample group, the higher the percentage of females in a school, the
greater the likelihood that the school is highly leveraged. Simply put, the owners of
female schools invest less proportionately because they work with borrowed funds.

129
At least two possible explanations may address this phenomenon. First, it could
be that owners do not want to personally finance female education. While they must
have some interest in female education, they may not want to risk losing their own
investment should the school be unsuccessful. Second, the owners of female schools
may not have the ability to finance the school through their own investment. They may
have more interest in female education than they have the financial ability to make a
large personal investment.
An investigation of the first possible explanation led the author to ask whether
there is limited liability in Uganda. If so, an investor can be protected from personal
liability should the business they invest in default on its business loans. If there is no
limited liability, investors could be personally liable for debts of the business. While
investors in developed nations may take limited liability legal status for granted, this may
not be the case in an LDC. Preliminary inquiries about this legal situation indicate that
there is no limited liability in Uganda for default on a school’s loans (C. B. Mugimu,
personal communication, June 22, 2006). If the school is not able to meet its debt
obligations, the lender can not only take over the school, but has legal authority to attach
the personal assets of the owners. This is, indeed, a great risk to owners of any highly
leveraged business, not just female secondary schools.
The second possible explanation suggests that owners of female secondary
schools may be substantially different from owners of other secondary schools. It may be
that these owners have fewer personal assets because they themselves are female.
Further research is necessary to ascertain (a) why female schools are more highly
leveraged, and (b) the implications of this high leverage.

130
Current Ratio, Size of Schools, Percent Boarding, and Age
In the sample schools, there is a significant negative correlation between size of
school and the financial variable, current ratio. This suggests that the larger the school,
the lower is its relative working capital. In other words, the larger the school, the lower
are its current assets in relation to its current liabilities.
There is a similar significant negative correlation between percentage of boarding
students and the current ratio. The higher the percentage of boarding students at a school,
the more likely the school is to have a poor current ratio position.
As might be expected, there is a significant positive correlation between size of
school and percentage of boarding students. Tying these three variables together, the
larger the school, the more likely it is to have boarding students and the less likely it is to
have a healthy current ratio. A decreasing current ratio indicates that current assets (cash
and other liquid assets) are not keeping pace with the increase in current liabilities.
This odd relationship between variables could be an indication of poor pricing
policy and/or poor management of accounts receivable and cash. A decreasing current
ratio indicates that current assets (primarily cash in this LDC setting) are not increasing
as quickly as current liabilities (those amounts owed within the current fiscal year may
include such items as utilities payable, the cost of food owed to vendors, etc.). It is
possible that schools set their boarding prices not according to their actual costs, but in
response to market demands—whatever the student is willing to pay. Schools likely have
a stair-step cost “curve” rather than a smooth linear function cost curve. This is a
reflection of the fact that total boarding school costs must include fixed as well as
variable costs. Theoretically, the marginal cost of student number 901 in a 900 bed

131
facility would be significantly greater than the marginal cost of student 900. For student
901, a new dormitory may have to be built, representing a significant increase in fixed
costs. However, the variable cost of student 901 would likely be very close, if not
identical, to the variable cost of student 900. Understanding the cost structure of a school
should have a direct impact on pricing for that school’s services.
It is probable that large schools allow more students to attend without full, up-
front payment of tuition, fees, and boarding costs. They also may have a more lax policy
on collecting student accounts receivable. The school would still be incurring marginal
costs such as increased food and utilities for these non-paying students. Eventually, if
uncollectible, they would have to write off these accounts receivable. Or worse, the
accounts receivable may never be booked—they may never be entered as accounts
receivable on the balance sheet, yet the increased costs associated with those students
would still appear on the income statement. Any unpaid costs (such as amounts owed to
vendors for food) associated with these non-paying students would show up as current
liabilities. This would therefore decrease the current ratio.
A decreased current ratio may also be indicative of poor cash flow. This data set
did not contain sufficient data to assess cash flows. Future research should focus on the
relationship between cash flows and other financial variables as well as to contextual
variables.
The possibility exists that there is some other explanation for the relationship
between size of schools and percent of boarding students and their negative correlations
with the current ratio. There could be an omitted variable bias. Further research is

132
needed to examine pricing structure, student credit policies, and the specific effects of
size and boarding status on current assets as well as current liabilities.
Another interesting, significant correlation with percent of students boarding is
age of school. This negative correlation suggests that newer schools are likely to have a
larger percentage of boarding students. It could be that if, as suggested above, boarding
schools are more likely to be large, to have poorly conceived fees structures, and to
extend credit to students, older schools have figured this out and have opted out of
boarding status. The older schools represent survivors. Certainly in their years of
existence, they have learned how to stay afloat. This age correlation coupled with the
size, boarding status, and current ratio may suggest that the newer, larger boarding
schools should pay particular attention to issues of liquidity before they become issues of
viability. Further research should address this issue.
Implications of This Research
This research has several theoretical and practical implications. In the theoretical
realm, the author found that common business analysis tools can be effectively applied to
private secondary schools in an LDC setting with minor modifications. The financial
analyses form the basis for assessment of financial status and fiscal viability of these
schools. The limitations of this application are more closely related to availability and
reliability of data than to the analysis tools themselves. Financial data to which these
analysis tools can be applied, must be accessible, integral, reliable, consistent, and
verifiable. In this particular research project, the author determined that one of the most
valuable foci of financial assessment—analysis of cash flows—could not be addressed
due to lack of appropriate data. In further research which may build on this project,

133
delimitations set by the author could be modified so that financial data of schools in a
larger or different geographic region are studied, provided that quality financial data
could be realistically obtained.
Many questions and issues are raised by this research. The following specific
questions are suggested for future study.
1. How can financial data be collected for schools in the Mukono District of Uganda
(or elsewhere) which have not filed revenue reports, i.e., what data collection
methods or instruments could be developed to obtain reliable, consistent, and
verifiable financial data from these schools?
2. What tracking methods or dynamic databases could be established such that
horizontal analysis could be effectively applied to identify trends in individual
schools and industry averages?
3. What laws or regulations in a specific LDC setting encourage, discourage, or
impede private investment in education? What risks could be minimized through
government or legal interventions?
4. What is the prevailing “mindset” of private school owners in a specific LDC
setting? What practices are self-defeating or based on lack of information or
understanding of business principles? What practices foster financial stability?
5. What measures could be taken to educate private school investors about financial
assessment so that their schools can experience better financial stability and fiscal
viability?
6. What role does cash flow play in the overall assessment of financial viability of
private secondary schools in an LDC setting?

134
In addition, much could be learned from studying failed schools. A post-mortem
financial analysis may inform the topic of fiscal viability in private schools run as
businesses in an LDC setting. Currently there is no known way to access financial data
from failed schools. Government collection of financial data on all schools, not just those
which are required to file revenue reports, would be helpful in this regard.
This research also has practical implications. While all stakeholders stand to
benefit from financially viable schools, two groups in particular could benefit directly
from the findings of this research: schools and government.
Several areas of concern for schools were identified in the research findings. The
following recommendations are made to private secondary schools in the Mukono
District of Uganda. It is intended that these recommendations could assist in improving
fiscal viability of these schools.
1. Private schools should be encouraged to keep complete and accurate accounting
records. At the end of each fiscal year, formal financial statements should be
prepared. These may be based on a format similar to the financial templates
found in Appendix F-1 of this study. Preparation of a formal statement of cash
flows is highly encouraged.
2. Financial analysis tools, as described and applied in this study, should be applied
to the data contained in each school’s financial statements.
3. Schools should examine their use of long-term debt. Over-leveraging without
adequate liquid assets to meet debt obligations may render the school financially
inoperable. Tracking changes in debt levels through horizontal analysis may be
informative.
135
4. Schools should pay particular attention to their cash flow and to liquidity. Nine of
the 10 schools in this example appear to have poor liquidity as manifest in their
current ratio of less than 1.0.
5. Schools should examine their policies of extending credit to students as well as
their successful collection of accounts receivable.
6. Schools should examine the amounts charged for tuition and fees. Fixed as well
as variable costs and indirect as well as direct costs must be covered. For long-
term fiscal viability, pricing must cover all expenses and still provide a positive
and adequate return on the owners’ capital investment.
7. Expenses should be analyzed using vertical analysis. Comparison with industry
averages as well as horizontal analysis may highlight areas of concern.
The findings of this research may be helpful to governments. The following
policy suggestions are made:
1. If the government has a social goal of providing greater access to education for
girls, some assistance may be needed in the area of financing girls’ education. The
high correlation between percentage of females and long-term debt suggests that
it may be very difficult to attract investor capital for girls’ education. While the
government may not have adequate cash to directly fund investment in girls’
schools, other legal and financial incentives may be appropriate.
2. The apparent lack of limited liability for school owners may keep schools from
using debt when it could be appropriate and helpful. Effective borrowing could
assist schools in obtaining those resources that may be helpful in increasing the
quality of education they provide.

136
3. The government could play a key role in encouraging fiscal viability of private
schools. Analysis of financial data could help schools to become more fiscally
viable. Industry averages, representative of the population (rather than only the
sample used in this study), could be calculated for comparison if the government
collected the appropriate financial data. This author suggests that data be collected
in a template format similar to that found in Appendix F-1. This format requires
internal balancing of the financial reports.
Research Summary
This research project explored the application of financial assessment tools used
in the business world at large to private secondary schools in an LDC setting. A model
for financial assessment was identified. Specific ratios and financial measures were
applied to financial data secured in the form of revenue reports from the Uganda Revenue
Authority. Statistical analysis of the financial data, key contextual measures, and UNEB
scores revealed several correlations of significance that merit further investigation.
Suggestions have been made that (a) may assist schools in achieving greater fiscal
viability, (b) encourage governments to set policies and collect financial data to assist
researchers and all schools in assessing fiscal viability, and (c) direct future research.
From Yellow Brick to Dirt Road:
Personal Reflections on this Research
It is with certain nostalgia, mixed with amusement at my naïveté, that I look back
over this research journey. This project has been a blending of my past and present
worlds. It has also provided tremendous learning opportunities and understanding of the
research process unavailable in a classroom setting.

137
Renowned researchers and authors such as Kuhn and Phillips and Burbules
describe research processes in terms of exploration, messiness, and learning opportunities
(Kuhn, 1962; Phillips & Burbules, 2000). Often, the original intent of a research project
dims in comparison to other unexpected discoveries along the journey.
The exploratory research undertaken in this project was, indeed, not tidy. The
original intent of this project was to explore, on a micro-level in an LDC setting, what
effect financial resources might have on student performance. Would a micro-level study
confirm the findings of previous macro-level studies of similar focus? A thorough
examination of the financial data collected in the Hite and Hite 2003 survey project
revealed that while it could be extremely useful for contextual purposes, its deficiencies
(as noted in Chapter 4) rendered it unreliable for sophisticated financial analysis.
Unwilling to abandon ship, the search was made for a data source more fit for
financial analysis. One survey question regarding filing of revenue reports was
promising, with 36 schools responding in the affirmative. Contacts were made to secure
copies of these reports from the Uganda Revenue Authority.
Ultimately, however, the project seemed doomed when only 10 revenue reports
were found. Then came the realization that these schools must constitute the most
financially successful schools in the District! The requirement to file a revenue report is
only incumbent upon those schools which earned a profit. These schools, then, must be
the model schools for financial viability in the Mukono District. The project was
redirected towards identifying methods of financial analysis that could be used in this
LDC setting and using data from these 10 schools to develop a model for fiscal viability.

138
Challenges continued to arise, even with revenue report data (as discussed in
Chapter 4). Dark days and long nights were spent wrestling with the data. However, with
the challenges came learning opportunities. Perhaps the greatest lesson this author
learned is that research, by nature, is messy. A close second is that good research
requires vision, determination, and passion.
My dedicated and insightful mentor, Dr. Steven J. Hite, shared his views and
experiences with dirty data and asked if I was willing to put on my hip boots and wade
through the muck to mine for nuggets. Most likely, every researcher must have such a
moment of reflection. Is the anticipated destination worth the difficulty of the journey?
In this reflective moment, my thoughts were drawn back to the people of Uganda
who had become so dear to me. My mind’s eye revealed Margaret and the 20-plus
orphans she was single-handedly struggling to raise; Papa P, my host and landlord in
Uganda, and his struggles not only to keep a large, private secondary school afloat, but to
fund a girls’ vocational school which he had built, but had no capital with which to
commence operations; and Jasper, an entrepreneur who served as my chauffeur and
confidant. Jasper startled me with his assertion that Uganda could never stand on its own
feet until foreigners quit giving financial handouts—Ugandans must learn principles and
practices that would allow them to stand on their own feet. Finally, thousands of young
eager faces, as well as myriads of weary older ones, flooded my memory.
At this point the project took on a new focus and passion. Much as I might like
to, I could not personally educate or finance the education of the next generation in
Uganda. Perhaps my research could initiate a dialogue that could promote education and

139
influence schools to become more financially healthy, which would benefit students,
families, and society in general.
Over the years, my business paradigm, based on prior professional experience as
an accountant with CPA certification, a university financial administrator, and, finally, a
full-time university faculty member teaching accounting for over a decade, had often
conflicted with my educational paradigm. Furthermore, during much of the last decade I
had been operating in a poverty alleviation paradigm as my children and I worked with
NGOs in LDCs. Before me now was an opportunity to blend those paradigms in a
synergistic manner to engage in research that ultimately could foster better financial
health of schools in an LDC setting. The project took on new life and deeper meaning.
With clearer vision and renewed vigor, the research came into sharper focus. The search
was on to identify best business practices in financial analysis and tailor them to this
LDC setting, then identify a model for assessment of financial viability and compare
financial measures with quality measures.
At the conclusion of this research project, two outcomes are noteworthy. First,
financial industry averages have been calculated for private secondary schools in the
Mukono District of Uganda. Second, a model for financial analysis of private schools in
an LDC setting has been identified. It is hoped that future research will continue this
discussion.
Conclusion
Education is critical to the development of strong, progressive nations. In recent
years, UPE has spawned large increases in the number of students desiring secondary
education in Uganda. Private secondary schools have been established to meet the excess

140
demand. Without dedicated inflows of resources, these schools must, as any other
businesses throughout the world, become financially independent. Application of sound
business practices, continuous monitoring, and use of specific financial analyses
identified in this research have long assisted businesses in maintaining fiscal viability.
Private schools in an LDC setting can similarly benefit.
This study has posed many questions. The findings suggest that continuing
research and dialogue are needed. In no small measure, the future of Uganda, like other
LDCs, rests upon the fiscal viability of its private schools. If these private schools fail,
then with them goes the hope of a nation.
141
REFERENCES
Ahang, X. (2005). Financial viability analysis and capital structure optimization in
privatized public infrastructure projects. Journal of Construction Engineering &
Management, 131(6), 656-668.
Albrecht, W. S., Stice, J. D., Stice, E. K., & Swain, M. R. (2005). Accounting: Concepts
and applications (9th ed). Mason, OH: South-Western Publishing Co.
Alexander, N. C. (2001). Paying for education: How the World Bank and the
International Monetary Fund influence education in developing countries.
Peabody Journal of Education, 76(3/4), 285-338.
American Express. (2005). Financial ratio analysis, a business resource from American
Express: Take your fiscal temperature with financial ratios. Articles and Tools:
Financial Management Retrieved January 14, 2005, from
http://www133.americanexpress.com/osbn/tool/ratios/financialratio.asp
Anderson, S. E. (2002). The double mirrors of school improvement: The Aga Khan
foundation in East Africa. In S. E. Anderson (Ed.), Improving schools through
teacher development: Case studies of the Aga Khan Foundation projects in East
Africa (pp. 1-19). Lisse: Swets & Zeitlinger Publishers.
Answers.com. (2006). Milton Obote. Retrieved March 7, 2006, from
http://www.answers.com/topic/milton-obote
Aoki, A., Bruns, B., Drabble, M., Marope, M., Mingat, A., Moock, P., et al. (2003).
Education. In Macroeconomic and sectoral approaches (Vol. 2): World Bank.
Ardon, K. (1999). The effect of educational finance on school quality. Unpublished
Dissertation, University of California, Santa Barbara, Santa Barbara.

142
Arens, A. A., Elder, R. J., & Beasley, M. (2005). Auditing and assurance services: An
integrated approach (11th ed.). Upper Saddle, NJ: Prentice Hall.
Bahemuka, P. K. (2004). Income tax in Uganda. Kampala, Uganda: Fountain Publishers.
Bank Proposal. (2005). Financial assessment. Retrieved March 21, 2006, from
http://www.bankproposal.com/
Banta, T. W. (Ed.). (1999). Assessment update: The first ten years., 1999. Boulder, CO:
National Center for Higher Education Management Systems.
Barkley Jr., R. (1991). Teaching schools a lesson. Management Review, 80(10), 64.
Baughan, A. C. (2002). Standards, accountability, and the determination of school
success. The Educational Forum, 66, 206-213.
Beaver, W. H. (1966). Financial ratios as predictors of failure. Journal of Accounting
Research, 4(3), p71-111.
Belfield, C. R. (2000). Economic principles for education. Cheltenham, UK: Edward
Elgar.
Bentaouet, R., & Burnett, N. (2004). User fees in primary education: UNESCO.
Retrieved October 6, 2005 from http://portal.unesco.org/education/en/ev.php-
URL_ID=32498&URL_DO=DO_TOPIC&URL_SECTION=201.html
Bergevin, P. M. (2002). Financial statement analysis: An integrative approach. Upper
Saddle River, NJ: Prentice Hall.
Bernstein, L. A., & Wild, J. J. (2000). Financial statement analysis (5th ed.). New York:
McGraw-Hill Book Co.
Bers, T. H. (2001). Measuring and reporting competencies. New Directions for
Institutional Research, Summer 2001(110), 29-40.
143
biz/ed. (2005). Business analysis. Retrieved March 8, 2006, from
http://www.bized.co.uk/ educators/16-
19/business/strategy/presentation/analysis.ppt
Björkdahl, J., Bohlin, E., & Lindmark, S. (2004). Financial assessment of fourth generation
mobile technologies. Paper presented at the EURO CPR 2004 Conference,
Barcelona, Spain.
Bliss, J. H. (1923). Financial and operating ratios in management. New York: The
Ronald Press Company.
BookRags. Financial statement analysis. Business Study Guide Retrieved November 6,
2005, from http://www.bookrags.com/other/business/financial-statement-analysis-
ebf-01.html
Bornsein, D. (2004). How to change the world: Social entrepreneurs and the power of
new ideas. Oxford University Press.
Bray, M. (1996). Privatization of secondary education: Issues and policy implications.
Paris: UNESCO.
Bregman, J. (2003, June 9-13, 2003). Secondary education in Africa (SEIA). Paper
presented at the First Regional SEIA Conference in Uganda: Summary of
Secondary Education (SE) reform trends in OECD countries with an African
perspective.
Brimley, V., Jr., & Garfield, R. R. (2005). Financing education in a climate of change
(9th ed.). Boston: Pearson/Allyn & Bacon.
Brown, R. (2004). A history of accounting and accountants. Frederick, MD: Beard
Books.

144
Bruns, B., Mingat, A., & Rakotomalal, R. (2003). Achieving universal primary education
by 2015: A chance for every child. Washington, DC: World Bank.
Burtless, G. (1996). Does money matter: The effect of school resources on student
achievement and adult success. In G. Burtless (Ed.), (pp. 1-41). Washington, DC:
Brookings.
Caillods, F. (1998). Education strategies for disadvantaged groups: Some basic issues
(Viewpoints No. Report Number: IIEP-31). Paris: UNESCO.
Cambridgeshire County Council. (2006). Financial assessment. Retrieved March 21,
2006, from http://www.cambridgeshire.gov.uk/social/accessing/Finass.htm
Carvlin, E. (2003). Illinois' fiscal report cards for schools stirs debate. Bond Buyer,
343(31801), 30.
Chabotar, K. J. (1986). Financial ratio analysis comes to nonprofits. The Journal of
Higher Education, 60(2), 188-208.
Cheng, K. H., & Shimerda, T. A. (1981). An empirical analysis of useful financial ratios.
Financial Management, 10(1), 51-60.
Chioke.org. (2005). The Millennium Development Goals--MDGs. Retrieved September
28, 2005, from http://www.choike.org/nuevo_eng/informes/302.html
CIA. (2005, Nov. 1, 2005). The world fact book--Uganda. CIA--The World Fact Book
Retrieved December 21, 2005, from http://www.cia.gov/cia/publications/
factbook/geos/ug.html
Clemens, M., & Moss, T. (2005). What's wrong with the Millennium Development
Goals? (Brief): Center for Global Development.

145
Clemens, M. A. (2004). The long walk to school: International education goals in
historical perspective--working paper 37 (Working Paper): Center for Global
Development.
Council on Foreign Affairs. (2006, February 21, 2006). Uganda's presidential elections.
Retrieved March 20, 2006, from http://www.cfr.org/publication/9917/
Crampton, F. E. (2006). The impact of investment in human, social, and physical capital
on student achievement, American Education Finance Association. Denver:
AEFA.
Cuban, L. (2004). The blackboard and the bottom line: Why schools can't be businesses.
Cambridge, MA: Harvard University Press.
Darling-Hammond, L. (2004). Standards, accountability, and school reform. The
Teachers College Record, 106(6), 1047-1085.
Datta-Mitra, J. (2001). Uganda: Policy, participation, people. Washington, DC: World
Bank.
De Walque, D. B. (2003). How do education and information affect health decisions?
The cases of HIV/AIDS and smoking (immune deficiency). Chicago: The
University of Chicago
Deininger, K. (2003). Does the cost of schooling affect enrollment by the poor?
Universal primary education in Uganda. Economics of Education Review, 22(3),
291-305.
Delamonica, E., Mehrotra, S., & Vandemoortele, J. (2004). Education for All: How
much will it cost? Development and Change, 25(1), 3-30.

146
Delors, J., Mufti, I. a. A., Amagi, I., Carneiro, R., Chung, F., Geremek, B., et al. (1996).
Learning the treasure within: Report to UNESCO of the international
commission of education for the twenty-first century. Paris: UNESCO.
Downes, J., & Goodman, G. E. (2003). Finance & investment handbook (6th ed.). New
York: Barron's.
Drum, R. (2001). Focus on assessment report: Arizona Western College.
Dun & Bradstreet. (1992). Dun & Bradstreet's key business ratios (1991-92, Finance,
Real Estate, Services ed.). Murray Hill, NJ: Dun & Bradstreet.
Dun & Bradstreet. (19 Oct 2001). Fourteen key business ratios used by D&B. Retrieved
January 10, 2005, from https://www-dnb-com.erl.lib.byu.edu/product/contract/
ratiosP.htm
Dun & Bradstreet. (2002). Run your business more profitably through D&B's suite of
business analysis tools. Retrieved April 7, 2006, from http://www.dnb.com/us/
mycompany.asp
Dun & Bradstreet. (2003). Industry norms & key business ratios (2002-2003 Desk-Top
Edition ed.). Short Hills, NJ: Dun & Bradstreet
Dunne, P., & Mhone, G. (2003). Africa's crises: Recent analysis of armed conflicts and
natural disasters in Africa; working paper no. 5 (Working Paper). Geneva,
Switzerland: International Labour Organization.
Ebert, R. J., & Griffin, R. W. (2003). Business essentials (5th ed.). Upper Saddle River,
NJ: Prentice Hall.
Experience Africa. (2004, 2004). Formal education in Africa. Retrieved February 3,
2005, from http://www.experienceafrica.co.uk/D1.htm

147
Farney, H. (1995). Bring financial ratios alive with bankruptcy analysis. Business
Education Forum, 50, 37-38.
Fernández, D. (2003). Financial assessment report (Financial Assessment Report):
USAID/Bolivia.
Finance for managers. (2002).). Boston: Harvard Business School Press.
Flake, A. (2003). Mukono district, Uganda secondary schools: Equity and importance of
resources. Provo, UT: Brigham Young University.
Fridson, M. S. (1996). Financial statement analysis: A practitioner's guide. New York:
John Wiley & Sons.
Garrison, R. H., & Noreen, E. W. (2003). Managerial accounting (10th ed.). New York:
McGraw-Hill/Irwin.
Garrison, R. H., Noreen, e. W., & Brewer, P. C. (2006). Managerial accounting (11th
ed.): McGraw/Irwin.
Gates, S. (1993). 101 business ratios. Scottsdale, AZ: McLane Publications.
Girous, G. (1999, September 1999). A short history of accounting and business.
Retrieved November 9, 2005, from http://acct.tamu.edu/giroux/Shorthistory.html
Glaser, R., & Silver, E. (1994). Assessment, testing, and instruction: Retrospect and
prospect. In L. Darling-Hammond (Ed.), Review of research in education (Vol.
20). Washington, DC: The American Educational Research Association.
Glewwe, P. (1999). The economics of school quality investments in developing countries.
New York: St. Martin's Press.

148
GlobalSecurity.org. (1997). Sub-Sahara Africa, a historical perspective and a look into
the future. Retrieved March 7, 2006, from http://www.globalsecurity.org/
military/library/report/1997/Harms.htm
Goldstein, H. (2004). Education for All: The globalization of learning targets.
Comparative Education Review, 40(1), 7-14.
Government of Uganda. (2003). Strategies to promote economic growth (Progress
report). Kampala: Government of Uganda.
Governmental Accounting Standards Board. (2006). Governmental Accounting
Standards Board. Retrieved March 22, 2006, from http://www.gasb.org/
Global Policy Forum. (2005). The UN Millennial Summit and its follow-up. Retrieved
January 7, 2006, from http://www.globalpolicy.org/msummit/millenni/
Graham, P. A., Lyman, R. W., & Trow, M. (1995). Accountability of colleges and
universities. New York: The Trustees of Columbia University.
Gray, J. (2004). Back to school. Canadian Business, 77(5), 91-93.
Greene, J. P. (2002). The business model. Education Next. Retrieved May 18, 2005, from
http://www.educationnext.org/20022/20.html Greenspan, A. (2004). The critical role of education in the nation's economy. Omaha,
Nebraska: The Federal Reserve Board.
Greenwald, R., Hedges, L. V., & Laine, R. D. (1996). The effect of school resources on
student achievement. Review of Educational Research, 66(3), 361-396.
Gupta, L. C. (1983). Financial ratios for monitoring corporate sickness: Towards a
more systematic approach. Delhi: Oxford University Press.

149
Gupta, M. C., & Huefner, R. J. (1972). A cluster analysis study of financial ratios and
industry characteristics. Journal of Accounting Research, 10(1), 77-95.
Hadderman, M. (March 1998). School productivity. ERIC Digest.
Hanushek, E. A. (1986). The economics of schooling: Production and efficiency in
public schools. Journal of Economic Literature, 24(3), 1141-1177.
Hanushek, E. A. (1996). School resources and student performance. In G. Burtless (Ed.),
Does money matter: The effect of school resources on student achievement and
adult success (pp. 43-73). Washington, DC: Brookings Institution Press.
Hanushek, E. A. (1997). Assessing the effects of school resources on student
performance: An update. Educational Evaluation and Policy Analysis, 19(2), 141-
164.
Hartzell, G. (2003). As school is a school. School Library Journal, 49(12), 35.
Haselow, D., & Josna, R. C. (1995). Finance in education. Retrieved July 23, 2001,
from http://www.ncrel.org/sdrs/pbriefs/95/95-1jasn.htm
Hatfield, H. R. (1920). Modern accounting: Its principles and some of its problems. New
York and London: D. Appleton and Company.
HCA. (2002). The HCA online business analysis. Retrieved March 8, 2006, from
http://www.hubbardcollege.org/tools/businessanalysis.html
Helfert, E. A. (1997). Techniques of financial analysis: A practical guide to measuring
business performance (9th ed.): McGraw-Hill.
Hey-Cunningham, D. (2000). Financial statement demystified (3rd ed.). Crows Nest,
Australia: Allen & Unwin.

150
Hite, J. M., Hite, S. J., Jacob, J., & Tanner, J. J. (2002). The role of national exams in
Uganda. Unpublished manuscript, Brigham Young University, Provo, UT.
Hite, J. M., Hite, S. J., Mugimu, B. C., Rew, W. J., & Nsubuga, Y. (2004a). Making the
grade: Using student national exams scores in school evaluation. Paper
presented at the 48th annual Conference of the Comparative and International
Education Society, Salt Lake City, UT.
Hite, J. M., Hite, S. J., Mugimu, C. B., Rew, J. W., & Nsubuga, Y. (2004b, March 9).
Exploring the relationship between critical resources and students' performance
in secondary schools in Mukono-Uganda. Paper presented at the 48th annual
Conference of the Comparative and International Education Society, Salt Lake
City, UT.
Hite, J. M., Hite, S. J., Rew, J. W., Mugimu, C. B., & Nsubuga, Y. (2004, March 10). On
the road to school effectiveness and efficiency: An inventory of school resources
in 74 Ugandan secondary schools. Paper presented at the 48th annual Conference
of the Comparative and International Education Society, Salt Lake City, UT.
Hite, S. J. (2001). Reviewing quantitative research to inform educational policy
processes. Paris: UNESCO: International Institute for Educational Planning.
Hoaglin, D. C., Mosteller, F., & Tukey, J. W. (1991). Fundamentals of exploratory
analysis of variance. New York: John Wiley & Sons.
Holsinger, D. B. (2005). Inequality in public provision of education: Why it matters.
Comparative Education Review, 49(3), 297-310.
Holsinger, D. B., & Cowell, R. N. (2000). Positioning secondary school education in
developing countries. Paris: IIEP/UNESCO.

151
Holsinger, D. B., Jacob, J., & Mugimu, C. (2002a). Private secondary education in
Uganda, Comparative and International Education Society. Orlando, FL.
Holsinger, D. B., Jacob, W. J., & Mugimu, C. B. (2002b). Cost-effectiveness analysis of
secondary schools in Uganda: Comparison of government and private schools.
Unpublished manuscript, Provo. UT.
Hornung & Associates, L. The business analyzer: A financial & operational analysis
model. Retrieved April 7, 2006, from http://www.hornungllc.com/analyzer.htm
Horrigan, J. O. (1968). A short history of financial ratio analysis. The Accounting Review,
43(2), 284-294.
Huff, P. L., Robert M. Harper, J., & Eikner, A. E. (2000). Should you consider company
size when making ratio comparisons? The National Public Accountant, 45(1), 8-
11.
Huitt, W. G. (2004, November 6, 2004). Educational accountability in an era of global
decentralization. Paper presented at the 12th Annual Applied Psychology in
Education, Mental Health, and Business Conference, Valdosta, Georgia.
IMDb. (2005). Biography for Idi Amin. Retrieved October 12, 2005, from
http://www.imdb.com/name/nm0024907/bio
The income tax act cap. 340, (1997). Uganda statute.
Ingram, G. K. (2004). Uganda - primary education and teacher development and
education sector adjustment credit project (Project performance assessment report
No. 27538): The World Bank.
The Institute for Social Entrepreneurs. (2002). Social entrepreneurialism. Retrieved
October 28, 2005, from http://socialent.org/
152
Internal Displacement Monitoring Service. (2005). Uganda: Government fails to protect
idps in the north, as international presence remains inadequate. Retrieved May
26, 2005, from http://www.db.idpproject.org/Sites/IdpProjectDb/idpSurvey.nsf/
wViewSingleEnv/UgandaProfile+Summary
IOMA. (2003). The best analysis tool to predict corporate financial trouble. IOMA's
Report on Financial Analysis, Planning & Reporting, 3(11), 2.
Jamison, M. (1992). Idi Amin and Uganda: An annotated bibliography. Westport, CT:
Greenwood Press.
Jayasuriya, R., Ed.; Wodon, Quentin, Ed. (2003). Efficiency in reaching the Millennium
Development Goals. World Bank working paper (pp. 93): The World Bank.
Jiambalvo, J. (2004). Managerial accounting. Hoboken, NJ: John Wiley & Sons.
Jones, K. H., Werner, M. L., Terrell, K. P., & Terrell, R. (2000). Introduction to financial
accounting: A user perspective (2nd ed.). Upper Saddle River, New Jersey:
Prentice Hall.
Jost, K. (1991). Business' role in education. The CQ Researcher, 1(27).
Kapp, K. M. (2005). Are you ready for e-learning? Retrieved March 21, 2006, from
http://www.learningcircuits.org/2005/apr2005/kapp.htm
Karmokolias, Y., & Maas, J. V. L. (2003). The business of education: A look at Kenya's
private education sector. Washington, D.C.: The World Bank.
Katel, P. (2005). Ending poverty. CQ Researcher, 15(31).
Kattan, R. B., & Burnett, N. (2004). User fees in primary education. In E. S. H. D.
Network (Ed.) (pp. 69): World Bank.

153
Katz, J., & Cabezuelo, A. (2004). Handbook of entrepreneurial dynamics: The process of
business creation. In W. B. Gartner, K. G. Shaver, N. M. Carter & P. D. Reynolds
(Eds.), (pp. 575). Thousand Oaks, CA: Sage Publications.
Ketz, J. E., Doogar, R. K., & Jensen, D. E. (1990). A cross-industry analysis of financial
ratios: Comparabilities and corporate performance. Westport, CT: Quorum
Books.
King, T. E., Lembke, V. C., & Smith, J. H. (2001). Financial accounting: A decision-
making approach. New York: John Wiley & Sons.
Kirungi, F. (2001). Uganda tackling school bottlenecks. Africa Recovery Online, A
United Nations Publication Vol 114, No 2. Retrieved January 21, 2005, from
http://www.un.org/ecosocdev/geninfo/afrec/subjindx/childpdf/childed3.pdf
Knoeppel, R. C., & Verstegen, D. (2006). What is the relationship between resources and
student achievement? A canonical analysis, American Education Finance
Association. Denver, CO: AEFA.
Kober, N. (1999). Lessons from other countries about private school aid. Washington,
D.C.: Center on Education Policy.
Koski, W. S., & Weis, H. A. (2004). What educational resources do students need to
meet California's educational content standards? A textual analysis of California's
educational content standards and their implications for basic educational
conditions and resources. Teachers College Record, 106(10), 1907-1935.
Kozol, J. (1991). Savage inequalities: Children in America's schools (1st ed.). New York:
Harper Perennial.

154
Kuhn, T. S. (1962). The structure of scientific revolutions (3rd ed.). Chicago: The
University of Chicago Press.
Lacey, M. (2006). Museveni extends his rule in Uganda. Retrieved March 20, 2006,
from http://www.iht.com/articles/2006/02/26/news/uganda.php
Laine, R. D., & Hinrichs, W. L. (1995). Funding high-quality public education: The
Illinois dilemma. Retrieved July 23, 2001, from http://www.ncrel.org/sdrs/
pbriefs/95/95-1gc3.htm
Langer, E. J. (1989). Mindfulness. Reading, Mass: Merloyd Lawrence Book.
Langer, J. A. (2004). Getting to excellent: How to create better schools. New York:
Teachers College Press.
Lanza, R. B. (2004, June 1, 2004). Financial-statement analysis is back in style. Audit
Tools Vol. 7. Retrieved November 8, 2005, from http://www.theiia.org
/itaudit/index.cfm?fuseaction=forum&fid=5523
Lev, A. (1969). Industry averages as targets for financial ratios. Journal of Accounting
Research, 7(2), 290-299.
Lev, B. (1974). Financial statement analysis: A new approach. Englewood Cliffs, New
Jersey: Prentice-Hall.
Levin, B. (1993). Students and educational productivity. Education Policy Analysis
Archives, 1(5).
Lewellen, J. (2005). Predicting returns with financial ratios. CFA Digest, 35(2), 39, 33p.
Lewin, K., & Caillods, F. (2001a). Financing secondary education in developing
countries: Strategies for sustainable growth. Paris: United Nations Educational,
Scientific and Cultural Organization.

155
Lewin, K., & Caillods, F. (2001b). Financing the development of secondary education in
developing countries. Prospects, SSSI(1), 61-72.
Liang, X. (2002). Uganda post-primary education sector report (No. 29706). Kampala,
Uganda: Human Development Sector: Africa Region, The World Bank.
Lockheed, M. E., & Hanushek, E. (1988). Improving educational efficiency in
developing countries: What do we know? Compare, 18(No. 1), 21-37.
Mandell, S. L., Cowen, S. S., & Miller, R. L. (1981). Introduction to business: Concepts
and applications. St. Paul, MN: West Publishing Company.
Mangiero, S. M. (2004). Why the Dupont model is important. Valuation Strategies, 7(3),
24.
Marsh, C. C. (1850). The science of double-entry book-keeping: The theory and practice
of accounts. New York: John C. Riker.
Marsh, V. (2005, May 26, 2005). A community of scholarly distinction. Financial Times,
p. 13.
Martin, J. (1994). Origins and history of American compulsory schooling: An interview
with John Taylor Gatto. Flatland Magazine(11).
Mathews, M. R., & Perera, M. H. B. (1996). Accounting theory and development. South
Melbourne, Australia: Nelson, An International Thomson Publishing Company.
Matsamura, E. K. (2005a). Third term bid irks donors. News and Views on Africa from
Africa Retrieved March 7, 2006, from
http://www.newsfromafrica.org/newsfromafrica/articles/art_10257.html

156
Maurer, J. G., Shulman, J. M., Ruwe, M. L., & Becherer, R. C. (1995). Encyclopedia of
business. New York: Gale Research, An ITP Information/Reference Group
Company.
Mbeki, P. T. (1999, 6 December 1999). Opening speech. Paper presented at the
Conference on Education for African Renaissance in the Twenty-first Century,
Johannesburg, South Africa.
McEwan, P. J., & Carnoy, M. (2000). The effectiveness and efficiency of private schools
in Chile's voucher system. Education Evaluation and policy Analysis, 22(3), 213-
239.
McEwen, N. (1995). Educational accountability in Alberta. Canadian Journal of
Education, 20(1).
Merrill Lynch, & Third Age. (1997). Your financial assessment. Retrieved March 21,
2006, from http://www.thirdage.com/money/retirement/assessment/
Meyer, M. W., & Zucker, L. G. (1989). Permanently failing organizations. London: Sage
Publications.
MGT of America, I. (2005). Diagnostic financial assessment of Detroit public schools:
Final diagnostic report. Tallahassee, FL: Finance Committee of the Governor's
Transition Team.
Miller, B. E., & Miller, D. E. (1991). How to interpret financial statements for better
business decisions. New York: AMACOM, a division of American Management
Association.
Miovic, P. (2004). Poverty reduction support credits in Uganda: Results of a stocktaking
study (Economic report No. 29602): The World Bank, Africa Region.

157
MOES. (1999). The Ugandan experience of universal primary education (UPE).
Kampala: Ministry of Education and Sports, The Republic of Uganda. Retrieved
February 3, 2005, from http://www.adeanet.org/programs/ pstr99/
pstr99_uganda.pdf
MOES. (2001). The development of education in Uganda in the last ten years. Report on
the Development of Education for the 46th Session of (ice) 5th-7th September
2001, Geneva. Retrieved from http://www.ibe.unesco.org/International/
ICE/natrap/Uganda.pdf
MOES. (2004a). Education profile. Retrieved March 25, 2005, from Uganda Ministry of
Education and Sports via http://www.ugandainvest.com/education.pdf
MOES. (2004b). The national report on the development of education in Uganda at the
beginning of the 21st century (August 30, 2004): Ministry of Education & Sports;
Republic of Uganda. Retrieved from http://www.ibe.unesco.org/International/
ICE47/english/Natreps/reports/uganda_rev.pdf
Montesinos, V. & Vela, J. (Eds.). (2002). Innovations in governmental accounting.
(2002).). Dordrecht, Netherlands: Kluwer Academic Publishers.
Mugimu, C. B. (2004b). Exploring the relationships between critical resource variables
and school performance in secondary schools of Mukono Uganda. Unpublished
doctoral dissertation, Brigham Young University, Provo, UT.
Mukono. (2006). Retrieved April 3, 2006, from http://www.mukono.go.ug/
Nagorniak, J. J. (2005). From theory to practice. Financial Analysts Journal, 61(4), 42-
46.
158
National Center for Education Statistics. (2003). Financial accounting for state and local
school systems. Retrieved February 4, 2005, from http://nces.ed.gov/pubs2004/
h2r2/ch_6.asp
Ndeezi, A. (2000, March 2000). Universal primary education in Uganda. Focus on Policy
4. Retrieved January 21, 2005, 2005 from http://www.eenet.org.uk/newsletters/
news4/p7.shtml
Nesdale, P. (2002). International perspectives on government funding of non government
schools, 14th Biennial NCISA Conference.
New England College of Finance. NECF seminars: Introduction to financial statement
analysis. Retrieved November 7, 2005, from http://www.finance.edu/sem/
semcatintfinstmanaly.htm
The New Vision. (2005, 9-29-05). Musevini signs 3rd term bill. Retrieved October 19,
2005, from http://www.newvision.co.ug/D/8/12/458167
Niskanen, W. A. (2005). Don't count too much on financial accounting. In W. A.
Niskanen (Ed.), After Enron: Lessons for public policy (pp. 397). Lanham,
Maryland: Rowman & Littlefield Publishers.
O'Day, J. A. (2002). Complexity, accountability, and school improvement. Boston:
President and Fellows of Harvard College.
Office of Government Commerce. (2002). Financial assessment. Retrieved March 3,
2005, from http://www.supplyinggovernment.gov.uk/finassess.asp
Ooghe, H., & Verbaere, E. (1985). Predicting business failure on the basis of accounting
data: The Belgian experience. International Journal of Accounting, 20(2), 19-26.

159
Paige, J. R. (1998). Preserving order amid chaos: The survival of schools in Uganda,
1971-1986. Unpublished dissertation, University of Maryland, College Park,
Palepu, K. G., Bernard, V. L., & Healy, P. M. (1996). Business analysis & valuation
using financial statements. Cincinnati, OH: South-Western College Publishing.
Patrone, F. L., & DuBois, D. (1981). Financial ratio analysis for the small business.
Journal of Small Business Management, 19(1), 35.
Phillips, D. C., & Burbules, N. C. (2000). Postpositivism and educational research.
Lanham, Maryland, US: Rowman & Littlefield Publishers.
Population Reference Bureau, (2005). 2005 world population data sheet. Retrieved
December 21, 2005, from http://www.prb.org/pdf05/05WorldDataSheet_Eng.pdf
Powell, T. C. (1996). How much does industry matter? An alternative empirical test.
Strategic Management Journal, 17(4), 323-334.
Pritchett, L. (2004). Does learning to add up add up? The returns to schooling in
aggregate data. Unpublished manuscript, Cambridge, MA.
Pritchett, L., & Filmer, D. (1999). What education production functions really show: A
positive theory of education expenditures. Economics of Education Review, 18(2),
223-239.
Quick, P., & Kahn, D. (2002). Analysis sheds light on what investors value. National
Underwriter, 1-6(29), 18-19.
Revsine, L., Collins, D. W., & Johnson, W. B. (2002). Financial reporting & analysis
(2nd ed.). Upper Saddle River, NJ: Prentice Hall.
Ricchiute, D. (2005). Auditing (8th ed.). Cincinnati: South-Western College Publishers.

160
RMA. (2002-2003). Annual statement studies: Financial ratio benchmarks 2002-2003.
Philadelphia: The Risk Management Association.
RMA. (2003-2004). Annual statement studies: Financial ratio benchmarks.
Philadelphia: The Risk Management Association.
Roberts, C., Weetman, P., & Gordon, P. (1998). International financial accounting: A
comparative approach. London: Financial Times; Pitman Publishing.
Roehl-Anderson, J. M., & Bragg, S. M. (2005). The controller's function: The work of
the managerial accountant (3rd ed.). Hoboken, NJ: John Wiley & Sons.
Rueters. (2004). Online business analysis tools. Retrieved April 7, 2006, from
http://about.reuters.com/productinfo/s/online_business_analysis_tools/
Sachs, J. D. (2005). The end of poverty: Economic possibilities for our time. New York:
The Penguin Press.
Sadler, W. H. (1894). Business bookkeeping & practice. Baltimore: Williams & Wilkins
Co. Press.
Saliers, E. A., & Holmes, A. W. (1937). Basic accounting principles. Chicago: Business
Publications.
Salmi, T., & Martikainen, T. (1994). A review of the theoretical and empirical basis of
financial ratio analysis. The Finnish Journal of Business Economics, 43(4), 426-
448.
Schaeffer, H. A., Jr. (2002). Essentials of cash flow. Hoboken, NJ: John Wiley & Sons.
Schultz, T. W. (1993). The economic importance of human capital in modernization.
Education Economics, 1(1), 13-19.

161
Securities and Exchange Commission (n.d.). Primer on SEC's initial adoption and
implementation of international accounting standards (IAS)/statement of financial
accounting standards (SFAS). Retrieved November 4, 2005, from
http://www.sec.gov.ph/primer/IAS%20primer.pdf
Shinns, L. H., & Lyne, M. C. (2004). Possible causes of poverty within a group of land
reform beneficiaries in the midlands of KwaZulu-Natal: Analysis and policy
recommendations: School of Agricultural Sciences and Agribusiness, University
of KwaZulu-Natal through BASIS CRSP Management Entity, Department of
Agricultural and Applied Economics, University of Wisconsin-Madison.
Shipps, D. (2000, Sunday, September 3, 2000). Business model won't fix schools. Los
Angeles Times, p. 2.
Smith, L. M. (2002). Lucia Pacioli: The father of accounting. Retrieved November 8,
2005, from http://acct.tamu.edu/smith/ethics/pacioli.htm
Smith, M. (2003). Research methods in accounting. London: SAGE Publications.
Ssekamwa, J. C. (1997). History and development of education in Uganda. Kampala,
Uganda: Fountain Publishers Ltd.
Ssekamwa, J. C., & Lugumba, S. M. E. (2001). Development and administration of
education in Uganda (2nd ed.). Kampala, Uganda: Fountain Publishers.
Steffy, W., Zearley, T., & Strunk, J. (1974). Financial ratio analysis: An effective
management tool. Ann Arbor, Michigan: Industrial Development Division;
Institute of Science and Technology; The University of Michigan.
Stice, E. K., Stice, J. D., & Diamond, M. A. (2003). Financial accounting: Reporting
and analysis (6th ed.). Mason, OH: South-Western.

162
Stice, E. K., Stice, J. D., & Skousen, F. F. (2004). Intermediate accounting (15th ed.).
Mason, OH: South-Western Publishing.
Stoker, N. (2005). Ugandans desperately seeking education. Retrieved October 6, 2005,
from http://news.bbc.co.uk/2/hi/africa/4112560.stm
Tamari, M. (1978). Financial ratios: Analysis and prediction. London: Paul Elek.
Tanner, D. (2000). Manufacturing problems and selling solutions: How to succeed in the
education business without really educating. Phi Delta Kappa, 82(3), 188-202.
Tanner, J. (2004). World Bank--summary of part iii e discussion for the World
Development Report 2006: Equity and development. DevForum: E-discussions
& Communities Retrieved October 3, 2005, from http://www.dgroups.org/
groups/worldbank/WDR2006/index.cfm?cat_id=8394&msgid=175800&op=dsp_
showmsg
Tanner, J. J. (2002a). Field notes journal: Mukono, Uganda. Unpublished manuscript,
Mukono, Uganda.
Tanner, J. J. (2002b). The role of national exams in Uganda. Unpublished manuscript,
Provo, UT.
tearfund.org. (2005). The Millennium Development Goals (MDGs). Retrieved
September 28, 2005, from http://www.tearfund.org/Campaigning/
Millennium+Development+Goals.htm
Thompson, A. (2005). Dimensions of business viability. Entrepreneurship and Business
Innovation Retrieved March 8, 2006, from http://bestentrepreneur.murdoch.
edu.au/Understanding_Dimensions_of_Business_Viability.pdf

163
Thomsett, M. C. (1991). The little black book of business words. New York: AMACOM,
American Management Association.
Tjia, J. S. (2004). Building financial models: A guide to creating and interpreting
financial statements. New York: McGraw-Hill.
Tooley, J. (2003). A lesson from the third world: James Tooley on the extraordinary
success of private education in Africa and India. Retrieved September 5, 2003,
from www.spectator.co.uk/article
Tooley, J., Dixon, P., & Stanfield, J. (2003). Delivering better education: Market
solutions for educational improvement. England: ASI (Research) Ltd.
Tooley, J., Dixon, P., & Stanfield, L. (2003). Delivering better education: Market
solutions for educational improvement. London: ASI (Research) Ltd.
Troy, L. (2004). Almanac of business and industrial financial ratios (35th ed.). New
York: Aspen Publishers.
Tsang, M. C. (2002). Comparing the costs of public and private schools in developing
countries. In H. M. Levin & P. J. McEwan (Eds.), Cost-effectiveness and
educational policy (pp. 111-136). Larchmont, NY: Eye on Education.
Tukey, J. W. (1970). Exploring data analysis (Limited Preliminary Edition ed. Vol. III).
Reading, Massachusetts: Addison-Wesley Publishing Company.
Tupy, M. L. (2005). Trade liberalization and poverty reduction in Sub-Saharan Africa
(Vol. Policy Analysis No. 557): Cato Institute.
Tyran, M. R. (1986). Handbook of business and financial ratios. Englewood Cliffs, NJ:
Prentice-Hall.

164
U.S. Department of State. (2005). Background note: Uganda. Retrieved May 19, 2005,
from http://www.state.gov/r/pa/ei/bgn/2963.htm
U.S. Small Business Administration. The essential elements of a good business plan.
Retrieved April 7, 2006, from http://www.sba.gov/test/wbc/docs/starting/
bp_essentials.html
Uganda Bureau of Statistics. (2005). Education statistics, October, 13, 2005. Retrieved
October 19, 2005, from Uganda Bureau of Statistics via http://www.ubos.org/
steducation.html
Uganda Accounting and Auditing ROSC. (2005). Report on the observance of standards
and codes (ROSC): Republic of Uganda; accounting and auditing: The World
Bank.
Uganda Bureau of Statistics. (2005). Education statistics. In Uganda Bureau of Statistics
(Ed.).
Ullrich, L. (2006). Educational efficiency in Tennessee: The impact of no child left
behind, American Education Finance Association. Denver, CO: AEFA.
UNCHS. Decentralization of local government in East Africa: Uganda. Retrieved
October 27, 2005, from http://www.unchs.org/unchs/planning/privat/ch3.htm
UNESCO-BREDA. (2002). UN agencies and the World Bank act to foster education in
Africa. Retrieved May 18, 2005, from http://www.dakar.unesco.org/
efa/news/en/020513_pam.shtml
UNESCO-BREDA. (2003). EFA Africa bulletin (pp. 10). Dakar: UNESCO--Regional
Bureau for Education in Africa (BREDA).

165
UNESCO. Information sheet-Uganda education system. Retrieved May 19, 2005, from
http://www.childrenslegalcentre.com/shared_asp_files/uploadedfiles/%7B8FFFC
C63-E512-4132-9CDB-0EC8A99FE0C8%7D_Ugandaed.pdf
UNESCO. (1990, March 5-9, 1990). World declaration on Education for All. Paper
presented at the World Conference on Education for All 1990, Jomtien, Thailand.
UNESCO. (1997a). Progress report on the implementation process of the Education for
All objectives (Summary Report). Geneva: United Nations.
UNESCO. (1997b). Report on the state of education in Africa: Challenges and
reconstruction. Dakar, Senegal: UNESCO Regional Office for Education in
Africa (BREDA).
UNESCO. (1999, 6-10 December 1999). Education for All--a framework for action in
Sub-Saharan Africa: Education for African renaissance in the twenty-first
century. Paper presented at the Regional Conference on Education for All for
Sub-Saharan Africa, Johannesburg, South Africa.
UNESCO. (2000a). Education for All: Meeting our collective commitments: Text
adopted by the World Education Forum Dakar, Senegal, April 26-28, 2000.
Retrieved October 26, 2004, from http://www.unesco.org/education/
efa/ed_for_all/dakfram_eng.shtml
UNESCO. (2000b, April 28, 2000). Uganda hits universal primary education target.
Newsletter of the World Education Forum in Dakar Retrieved February 3, 2005,
from http://www.unesco.org/education/efa/wef_2000/daily_conf_news/
pag_7e.pdf

166
UNESCO. (2000c). World Education Forum. Paris: UNESCO. Retrieved January 24,
2005, from http://www2.unesco.org/wef/countryreports/uganda/rapport_2_2.html
UNESCO. (2001). Uganda: The EFA 2000 assessment--country reports: UNESCO.
UNESCO. (2002a). Education for All: An international strategy to operationalize the
Dakar framework for action on Education for All (EFA): UNESCO.
UNESCO. (2002b). EFA global monitoring report, 2002: Is the world on track? Paris:
UNESCO. Retrieved January 9, 2006, from http://www.unesco.org/education/
efa/monitoring/monitoring_2002.shtml
UNESCO. (2003). Financing education-investments and returns: Analysis of the world
education indicators, 2002 edition, executive summary (Executive Summary).
Paris, France: UNESCO.
UNESCO. (2004a). Education for All--the quality imperative; summary; EFA global
monitoring report 2005. Paris: UNESCO.
UNESCO. (2004b). EFA global monitoring report 2003/2004. Retrieved May 18, 2005,
from http://www.unesco.org/education/africa/Dakargoabyregion.doc
UNESCO. (2004c). Gender and Education for All: The leap to equality: UNESCO.
Retrieved from http://www.unesco.org/education/efa_report/
zoom_regions_pdf/ssafrica.pdf
UNESCO. (2004d). UNESCO: Global education digest 2004: UNESCO.
UNESCO. (2005a). Communiqué of the ministerial round table on EFA 7-8 October
2005 on the occasion of the 33rd session of the general conference of UNESCO.
Paris: UNESCO.

167
UNESCO. (2005b). Global education digest 2005: Comparing education statistics
across the world. Montreal: UNSECO Institute for Statistics.
UNESCO. (2005c). UNESCO institute for statistics fact sheet: Making the transition to
secondary education. Retrieved May 19, 2005, from UNESCO via
http://www.uis.unesco.org/file_download.php?URL_ID=6093&filename=111462
63651UIS_factsheet_04_EN.pdf&filetype=application%2Fpdf&filesize=142604
&name=UIS_factsheet_04_EN.pdf&location=user-S/
UNICEF. (2000). UNICEF Millennium Development Goals. Retrieved September 28,
2005, from http://www.unicef.org/mdg/
UNICEF. (2003). How does HIV affect young people? HIV/AIDS Retrieved October 4,
2005, from http://www.unicef.org/aids/index_youngpeople.html
UNICEF. (2005). HIV/AIDS and armed conflict. Retrieved October 4, 2005, from
http://www.unicef.org/aids/index_armedconflict.html
United Nations. (1948). Universal declaration of human rights: United Nations.
United Nations. (2000). United Nations millennium declaration (pp. 9): United Nations.
United Nations. (2005a). List of least developed countries. Retrieved December 21,
2005, from http://www.un.org/special-rep/ohrlls/ldc/list.htm
United Nations. (2005b). Millennium Development Goals report 2005 (pp. 48): United
Nations.
United Nations. (2005c). Sub-Saharan Africa lags, rest of the world on track to meet
poverty goals--UN report. Retrieved September 29, 2005, from
http://www.un.org/apps/news/story.asp?NewsID=14550&Cr=millennium&Cr1=d
evelopment

168
United Nations. (2005d). UN Millennial Development Goals. Retrieved September 29,
2005, from http://www.un.org/millenniumgoals/
United Nations. (2005e). World population prospects: The 2004 revision population data
base. Department of Economic and Social Affairs. Retrieved, March 7, 2006,
from http://esa.un.org/unpp/index.asp?panel=5
United States Department of the Treasury. History of the U.S. Tax system. Retrieved
November 4, 2005, from http://www.treas.gov/education/fact-sheets/taxes/
ustax.shtml
USAID. (2000). Quality basic education for an increased percentage of Uganda
children, 617-003: USAID. Retrieved January 9, 2006, from
http://www.usaid.gov/pubs/cbj2002/afr/ug/617-003.html
va-interactive.com. Analyzing your financial ratios. Retrieved November 8, 2005, from
http://www.va-interactive.com/inbusiness/editorial/finance/ibt/ratio_analysis.html
VentureLine. (2005a). Financial ratio analysis. Retrieved November 7, 2005, from
http://www.ventureline.com/FinAnal_OnePrivate.asp
VentureLine. (2005b). My business analyst (MBA). Retrieved November 8, 2005, from
http://www.ventureline.com/
Viscione, J. A. (1983). Analyzing ratios: A perceptive approach. New York: National
Association of Credit Management.
Warren, C. S., Fess, P. E., & Reeve, J. M. (2005). Accounting. Mason, Ohio: Thomson
South-Western.
Watkins, K. (1999). Education now: Break the cycle of poverty: Oxfam International.
Retrieved from www.caa.org.au/oxfam/advocacy/education/report/index.html

169
Watkins, K. (2000). The Oxfam education report: Oxfam GB in association with Oxfam
International.
Watkins, K., Watt, P., & Buston, O. (2001). Education charges: A tax on human
development (Oxfam Briefing Paper). London, Great Britain: Oxfam
International.
Weygandt, J. J., Kieso, D. E., & Kimmel, P. D. (1999). Managerial accounting: Tools
for business decision making. New York: John Wiley & Sons.
White, G. I., Sondi, A. C., & Fried, D. (1998). The analysis and use of financial
statements (2nd ed.). New York: John Wiley & Sons.
Wilson, D. (2006, 3-10-06). One roof, inc. Microfranchises: A new model to deliver it &
other essential services. Paper presented at the Economic Self-Reliance
Conference, Brigham Young University, Provo, UT.
Wolfensohn, J. D. (2000, April 2000). Education is the key to relieving poverty, Dakar,
Senegal. Retrieved January 30, 2006, from http://www.unesco.org/education/
efa/wef_2000/speeches/wolfen.shtml
Woodrow Wilson Institute. (1924). Accounting: How business keeps and interprets its
records (Vol. 5). Chicago: Woodrow Wilson Institute.
The World Bank. (2005a). Pro-poor growth in the 1990s: Lessons and insights from 14
countries. In Department for International Development (Ed.) (Vol. 1 of 1, pp.
116): The World Bank Group.
The World Bank. (2005b). Secondary education. Retrieved November 12, 2005, from

170
<http://web.worldbank.org/WBSITE/EXTERNAL/TOPICS/EXTEDUCATION/0
,,contentMDK:20521252~menuPK:738179~pagePK:148956~piPK:216618~theSi
tePK:282386,00.html>
The World Bank. (2005c). Secondary education--key issues. Retrieved November 12,
2005, from <http://web.worldbank.org/WBSITE/EXTERNAL/TOPICS/
EXTEDUCATION/0,,contentMDK:20521328~menuPK:738179~pagePK:148956
~piPK:216618~theSitePK:282386,00.html#emphasis>
The World Bank. (2005d). World Development Report 2006: Equity and development.
Washington, DC: The World Bank and Oxford University Press.
The World Bank. (2006). The Millennium Development Goals. Corporate Governance &
Corporate Social Responsibility Retrieved January 30, 2006, from
http://web.worldbank.org/WBSITE/EXTERNAL/WBI/WBIPROGRAMS/CGCS
RLP/0,contentMDK:20459496~pagePK:64156158~piPK:64152884~theSitePK:4
60861,00.html
XINHUA. (2004, 2004-12-23 15:43:50). Corruption in primary education costs Uganda
US$8.2 mln: Official. Retrieved January 23, 2005, from
http://news.xinhuanet.com/english/2004-12/23/content_2372543.htm
ZeroMillion.com. (2005). Financial ratio analysis. Financial Management Series
Retrieved January 13, 2005, from http://www.zeromillion.com/business/
financial/financial-ratio.html

171
APPENDIX A
LIST OF ACRONYMS

172

173
Appendix A
List of Acronyms
BYU Brigham Young University
EFA Education for All
GAAP Generally Accepted Accounting Principles
GDP Gross Domestic Product
GPA Grade Point Average
GPS Global Positioning System
HIV/AIDS Human Immuno-deficiency Virus and Acquired Immune
Deficiency Syndrome
IAS International Accounting Standards
ICPAU Institute of Certified Accountants of Uganda
IRB Institutional Review Board
IRS Internal Revenue Service (US)
IVP International Volunteers Program (BYU)
LDCs Less Developed Countries (or Lesser Developed Countries or
Least Developed Countries)
LRA Lord’s Resistance Army (Uganda)
MDGs Millennium Development Goals
MOES Ministry of Education and Sports (Uganda)
NGO Non-government organization
PLE Primary Leaving Examination (Uganda)
SEC Securities and Exchange Commission (US)

174
UACE Uganda Advanced Certificate of Education
UCE Uganda Certificate of Education
UK United Kingdom
UN United Nations
UNDP United Nations Development Program
UNEB Uganda National Exam Board
UNESCO United Nations Educational, Scientific and Cultural Organization
UNESCO/BREDA United Nations Educational, Scientific and Cultural Organization
/Regional Bureau for Education in Africa
UNFPA United Nations Population Fund
UNICEF United Nations International Children’s Emergency Fund
UPE Universal Primary Education
URA Uganda Revenue Authority
US United States
WFP World Food Program

175
APPENDIX B
LETTERS AND INTRODUCTIONS

176

177
APPENDIX B
TABLE OF CONTENTS B-1 IRB Approval Letter from BYU...........................................................179 B-2 Informed Consent to be a Research Subject .........................................181 B-3 Letter of Introduction, Nsubuga............................................................183 B-4 Letter of Introduction, BYU .................................................................185

178

179

180

181
Appendix B-2
INFORMED CONSENT TO BE A RESEARCH SUBJECT March 5, 2003
Site Resource Survey -- Mukono District, Uganda
PURPOSE OF THE STUDY: The purpose of this research study is to examine and assess the financial, physical, and human resources of schools in Mukono District in Uganda to build and test theoretical propositions regarding resources, school performance and educational planning. Dr. Steven J. Hite is Principal Investigator directing this study. You were selected for participation because your school is in Mukono District, Uganda. PROCEDURES: Tour, Interview and Survey You will be asked to help two researchers facilitate the completion of a Site Resource Survey for your school. This survey may assess financial, physical and human resources, as well as external resources to which you may have access. You will first meeting with researchers for approximately 30 minutes to take a brief tour of your school and to plan the completion of the Site Resource Survey. The actual completion of the Survey may take the researchers up to two days, depending upon the size of your school. You will be asked to provide them access to measure, count or assess your resources. You may assign a member of your staff to help them in this process if you desire. Upon the completion of your participation, your school will receive a token of our appreciation for your participation. RISKS /DISCOMFORTS: There are no known physical risks associated with participating in this network study. Any fears regarding the confidentiality of your information are normal and will be respected. Potential organizational risks may be involved with the opportunity costs of your spending time in the interview session. Given the efforts that will e taken to maintain confidentiality (see below), no additional risks will be associated with this research. BENEFITS: This research will result in educational benefits—both scientific and social--for Ugandan education. Scientific benefits will include the discovery of themes, patterns and relationships between school resources, locations and relationships and the resulting performance of schools. Social benefits include improving Ugandan education, schools and school systems through better planning as well as resource and relationship management. In addition, this research will inform a broader educational audience about these relationships. If so you request, you may receive a copy of your own Site Resource Survey results for your records. CONFIDENTIALITY : Your identity and your responses will remain confidential and will not be revealed in published or unpublished results of this study. You will not be asked to divulge any information that you are uncomfortable sharing. The researcher team is under non-disclosure and confidentiality obligations. The information you share will be kept confidential. We will not share your information with other headmasters in Mukono District; thus, we will also not share their information with you. Every effort will be made to insure confidentiality for you, your staff and your school. WITHDRAWAL : Participation in this research is voluntary with no penalties for non-participation or withdrawal. You may refuse to answer any question during the survey. The researchers will not influence you to provide more information than that which you feel comfortable sharing. In addition, you may choose to withdraw from this study at any time.

182
CONCERNS: If you have any concerns or questions at any time during this study, you may contact: Principal Investigator, Dr. Steven J. Hite, Brigham Young University School of Education, Assistant Professor, Department of Educational Leadership and Foundations, USA Phone 801-422-3814, [email protected]. Research Field Director, Mr. W Joshua Rew, Brigham Young University, Uganda Address: PO Box 440, Mukono, Uganda, Uganda Phone Number: 077-835-488. To discuss concerns that cannot be discussed directly with the principal investigator or your rights as a participant in research projects, you may contact Dr. Shane S. Schulthies, Chair of the Institutional Review Board, 120B, Brigham Young University, Provo, Utah 84602; phone, 801-422- 5490; email [email protected].. I understand the procedures and my questions have been answered to my satisfaction. I have read, understood and received a copy of the above statement of Informed Consent and agree to participate in this study. ___________________________ ________________________ Participant’s Name (printed) Participant’s School (printed) ___________________________ ________________________ Participant’s Signature Date ___________________________ ________________________ Researcher’s Signature Date

183

184


186

187
APPENDIX C
FOUR-PART SURVEY

188

189
APPENDIX C
TABLE OF CONTENTS
Secondary School Site Survey—2003: Personnel Survey (Part 1)...............191 Secondary School Site Survey—2003: Headmaster Survey (Part 2) ...........198
Secondary School Site Survey—2003: Deputy Headmaster Survey (Part 3) ...........................................................................................................211 Secondary School Site Survey—2003: Additional Information (Part 4)………………………………………………………………………224

190

191
SECONDARY SCHOOL SITE SURVEY - 2003
Personnel Survey (PART 1)
Administrator, Teacher and Staff Resources
We appreciate your willingness to participate with Brigham Young University (U.S.A.) in conducting research addressing the role of resources in secondary schools in Uganda.
This School Site Survey is composed of three parts: PART 1: Consent Form and Personnel Survey
PART 2: Headmaster Survey
PART 3: Deputy Headmaster Survey
We would appreciate your help in completing PART 1 of this survey either before or after our scheduled appointment.
SCHOOL INFORMATION : Please print your name and information about your school:
School Name: _____________________________________
Interviewee Name: _______________________________________ Post:
_________________________________
ADMINISTRATOR RESOURCES : Please tell us about the administrators at your school:
_________ How many administrators live at the school or have their accommodation funded by
the school?
1. What is the average salary (including all wages and allowances) for your administrators per month (UGS 000’s)?
a. Below UGS 100 b. Between UGS 101-200 c. Between UGS 201-300 d. Between UGS 301-400 e. Between UGS 401-500 f. Between UGS 501-600 g. Between UGS 601-700 h. Between UGS 701-800 i. Between UGS 801-900 j. Between UGS 901-1,000 k. Above UGS 1,000 (one million)

192
2. Please list and describe your administrators:
Administrator by first name
Title
Gen
der?
M/F
Ful
l/par
t tim
e? F
/P
Age Range: 1=20-30 2=31-40 3=41=50 4=51-60 5=Over 60
Tot
al #
of y
ears
at s
choo
l?
# Y
ears
Adm
in e
xper
ienc
e at
ano
ther
sch
ool?
# of
com
plet
e y
ears
of
Uni
vers
ity?
Tea
chin
g or
Adm
in D
egre
e or
Cer
t? Y
/N
Par
ticip
ates
in D
istr
ict
Ass
ocia
tion?
Par
ticip
ates
in D
istr
ict
trai
ning
?
Ex. Frank Clerk M F 2 4 2 4 Y Y Y
1
2
3
4
5
6
7
8
9
10
11
12
13
14
15
STAFF RESOURCES: Please tell us about your school’s staff members (all functions except administrators and teachers).
3. _______ How many staff are employed by the school (not administrators or teachers)?
4. _______ How many full time staff members work at the school?
5. _______ How many part time staff members work at the school?
6. _______ How many staff members live at the school?
7. _______ How many staff members live elsewhere and have accommodation funded by the school?
8. _______ How many male staff members work at the school?
9. _______ How many female staff members work at the school?

193
10. What is the average salary for your staff members per month (in UGS 1,000’s)?
a. Below UGS 50 b. Between UGS 51-100 c. Between UGS 101-150 d. Between UGS 151-200 e. Over UGS 200
TEACHER RESOURCES: Please tell us about your teachers.
11. _____ How many teachers live off-campus and have accommodation funded by the school?
12. _____ How many of your teachers that live on campus also teach at other schools?
13. _____ How many of your teachers live at other schools yet teach subjects at your school?
14. _____ How many of your teachers are NOT certified?
15. _____ How many of the teachers also perform administrative duties?
16. _____ How many department heads do you have?
17. YES NO Are department heads paid extra?
18. How much extra money (UGS) are department heads paid?
______UGS per _____________ (specify month, term, etc.)
19. _______ How many teachers left (stopped teaching at) your school last year?
20. Of those teachers that left, how many found employment in the following sectors:
a. ___ Private Schools b. ___ Government Schools c. ___ Private Sector d.___ Other
21. For which subjects are teachers the hardest to find (list)?
_____________________________________
22. Which subjects lose teachers the most (list)?
_____________________________________________
23. In this past year, have you paid your teachers’ salaries:
a. ___ Almost always late b. ___ Sometimes late c. ___ Usually on time d.___
Always on time
24. How much control do teachers generally have over instructional materials, curriculum and class
time?
a. ___ Very little control b. ___ Some control c.___ Quite a bit of control d.___ Total
control
25. _____ How many of the teachers are examiners for UNEB exams?
26. _____ How many of the teachers are markers for the UNEB exams?
27. _____ How many examiners do you contract to help your candidates? How often?
___________________

194
28. _____ How many markers do you contract to mark your exams?
29. What is the average salary for your teachers per month (in UGS 1,000’s)?
a. Below UGS 100 b. Between UGS 101-200 c. Between UGS 201-300 d. Between UGS 301-400 e. Between UGS 401-500 f. Above UGS 500
30. ____ What is the average number of different subjects for each teacher?
31. ____ Lowest number for a teacher? ____ Highest number for a teacher?
32. Please describe the total number of teachers at your school (during the last term): Subjects: M=Math H=History E=English B=Biology C=Chemistry G=Geography W=Computers O=Other
# Teacher by first name
Main Subjects (write in):
Ful
l or
part
tim
e? F
/P
Gen
der?
M/F
Age Range: 1=20-30 2=31-40 3=41=50 4=51-60
# yr
s at
sch
ool
Live
s at
you
r sc
hool
?
# of
sub
ject
s ta
ught
Tea
ch e
lsew
here
?
Finding a replacement for this teacher would be: 1=Fairly easy 2=Somewhat difficult 3=Very difficult
Ex. Frank Math and Science F M 2 3 Y 2 Y 2
1
2
3
4
5
6
7
8
9
10
11
12
13
14
15
16
17

195
# Teacher by first name
Main Subjects (write in):
Ful
l or
part
tim
e? F
/P
Gen
der?
M/F
Age Range: 1=20-30 2=31-40 3=41=50 4=51-60
# yr
s at
sch
ool
Live
s at
you
r sc
hool
?
# of
sub
ject
s ta
ught
Tea
ch e
lsew
here
?
Finding a replacement for this teacher would be: 1=Fairly easy 2=Somewhat difficult 3=Very difficult
Ex. Frank Math and Science F M 2 3 Y 2 Y 2
19
20
21
22
23
24
25
26
27
28
29
30
31
32
33
34
35
36
37
38
39
40
41
42
43
44
45
46
47
48

196
# Teacher by first name
Main Subjects (write in):
Ful
l or
part
tim
e? F
/P
Gen
der?
M/F
Age Range: 1=20-30 2=31-40 3=41=50 4=51-60
# yr
s at
sch
ool
Live
s at
you
r sc
hool
?
# of
sub
ject
s ta
ught
Tea
ch e
lsew
here
?
Finding a replacement for this teacher would be: 1=Fairly easy 2=Somewhat difficult 3=Very difficult
Ex. Frank Math and Science F M 2 3 Y 2 Y 2
49
50
51
52
53
54
55
56
57
58
59
60
61
62
63
64
65
66
67
68
69
70
71
72
73
74
75
76

197
TEACHING RESOURCES: Please describe the resources you have for teaching.
34. Please describe the more permanent teaching resources in your school.
Teaching Resources (These resources are reusable.) (Add additional teaching resources if they are not listed)
Number (count)
Overall Condition 1=Poor 2=Fair 3=Good 4=Very Good 5=Excellent
How expensive is this
resource? 1=Not expensive 2=Slightly 3=Somewhat 4=Very 5=Extremely
How important is this resource?
1=Not important 2=Slightly 3=Somewhat 4=Very 5=Extremely
Chalkboards Maps Wall charts Tables Student Desks (1 person)
Student Desks (3 person)
Textbooks Math English Geography Biology History Chemistry Laboratory Equipment Beakers Bunsen Burner Microscope Test Tubes Tripod Stands Conical Flasks Litmus Paper Masses

198
Appendix C (continued)
SECONDARY SCHOOL SITE SURVEY - 2003
Headmaster Survey (PART 2)
Financial and Administrative Resources
We appreciate your willingness to participate with Brigham Young University (U.S.A.) in conducting research addressing the role of resources in secondary schools in Uganda.
This School Site Survey is composed of three parts: PART 1: Consent Form and Personnel Survey
PART 2: Headmaster Survey
PART 3: Deputy Headmaster Survey
We would appreciate your help and guidance in completing each of the three parts. As you are the Headmaster, we would be grateful if you would complete PART 1 before or after our scheduled appointment.
We would also appreciate being able to work with you and your Deputy Headmaster to complete PARTS 2 and 3 during our scheduled visit. If you would prefer to complete the entire survey yourself (PARTS 1-3), that would be fine. However, we are aware of your many important duties and may be able to obtain this information from your associates under your direction.
Before beginning the survey, please review PARTS 2 and 3, and determine how you would prefer to complete each part. If there are several researchers on site today, and if you so direct, they may be able to work with your Deputy Headmaster or additional school administrators to complete PARTS 2 and 3.
SCHOOL INFORMATION : Please print your name and information about your school:
Interviewee’s Name: __________________________________ Post:
___________________________________
School: _________________________________________ Phone #:
___________________________________
Town/Trading Center/Village: _________________________________________
Year School Started: ___________________________ School License #:
____________________________
Registration #: ___________________ UNEB #: __________________ 1st Year of UNEB:
________________

199
Mailing Address: ___________________________________ School Founder: SELF or _____________________ (circle) or (print name)
HEADMASTER : Please tell us about yourself:
33. In what year were you born?
34. Female Male Gender (please circle)
35. What is your university degree?
Type: ____ __ Field: ________
University: __ Date of Completion: _
36. How many total years have you been in your current administrative post?
37. How many total years have you worked as an administrator?
38. How many total years have you taught in schools?
39. In how many different schools have you worked (total for both teaching and
administration)? 40. YES NO Are you a member of the Mukono Headmaster and Teacher Association?
____________________________________________________________________________________________________
STUDENT COMPOSITION : Please tell us about your students:
41. ____________ What is your total student enrollment? Of these students, how many are:
_____ Girls? _______ Boys?
_____ Boarding students? _______ Day students?
42. ___________ How many new students applied to your school last year?
43. _____________ How many total new students did you accept last year?
44. How many new students did you accept into each form this last year?
S1 ______ S2 ______ S3 ______ S4 ______ S5 _____ S6 _______
45. What percentage of your students are from village areas? ___ 0-25% ___ 26-50% ___ 51-
75% ___ 76-100%
46. What percentage of your students are from urban areas? ___ 0-25% ___ 26-50% ___ 51-
75% ___ 76-100%
47. What percentage of students are from low-income families? ___ 0-25% ___ 26-50% ___ 51-
75% ___ 76-100%

200
48. What percentage of students are from middle-income families?___ 0-25% ___ 26-50% ___ 51-
75% ___ 76-100%
49. What percentage of students are from high-income families? ___ 0-25% ___ 26-50% ___ 51-
75% ___ 76-100%
50. ___________ What is the total enrollment of non-Ugandan students attending your school?
51. ___________ How many different countries do your students come from (other than
Uganda)?
a. Please list the countries:
_____________________________________________________________
52. Estimate your total student population in the following school years:
____________ 2000-2001 _____________ 2001-2002 ____________ 2002-2003.
53. ___________ How many students left your school after finishing O-level exams last year?
54. How many O-level students left your school last year due to drop out or
transfer?
a. For what reasons did O-level students leave your school last year (before completing
exams)?
55. ___________ How many students left your school after finishing A-level exams last year?
56. How many A-level students left your school last year due to drop out or
transfer?
a. For what reasons did A-level students leave your school last year (before completing
exams)
57. Tell us about seating students for national exams LAST YEAR:
O-Level
A-Level
How many of your own students did your school seat for national exams
last year?
How many students from other schools did your school seat for national
exams last year?
How many students did you send to another school to sit for national
exams last year?

201
SCHOOL SERVICES, APPLICATIONS & FEES: Please tell us about your fees:
58. If you have different fees for students, please indicate fees in the table below:
Class
Day Boarding
# of Student
s
Fees per Term # students on any
scholarship
# of Students
Fees per Term
# students on any
scholarship
S-I
S-II
S-III
S-IV
S-V
S-VI
Last year:
59. ______ How many students paid full school fees in cash (including checks)?
60. ______ How many students supplemented or paid part of their school fees with in-kind labor or services?
61. ______ How many students paid school fees only with in-kind labor or services?
62. For students that pay part or all of their school fees with in-kind labor or services, how do you
determine the value of labor or service in exchange for school fees?

202
ADMINISTRATIVE RESOURCES : Please tell us about your administrative resources:
63. _______ How many administrative office rooms does your school have?
64. _______ How many administrative desks does your school have?
65. _______ How many functioning administrative typewriters does your school have?
66. _______ How many functioning photocopy machines does your school have?
67. _______ How many functioning computers are in the administrative offices?
(If they do not have computers, go to question 41.)
68. _____ __ How many administrators use or know how to use computers?
69. YES NO Is the computer in a room that can be locked for security?
70. How many of these functioning computers were manufactured in the following time
periods:
________ Pre 1995 _______1995-1999 _______ 2000-present
71. How many of these functioning computers for administrators have the following:
______3 ½” drives
______Zip drives
______CD drives
______CD Burning Capability
______Internet connection
______Connected to working printer
72. How many of these functioning computers for administrators have the following software
functions:
______Word Processing
______Spreadsheet
______Presentations or Slide Shows
______Database
______Games

203
FINANCIAL RESOURCES: Please describe your financial resources as of June 30, 2003:
73. Please estimate the amount of TOTAL financial resources your school received last year (2002-2003) from all sources combined (circle one):
a. None b. Less than UGS 25
million c. Between UGS 25-
50 million d. Between UGS 50-
75 million e. Between UGS 75-
100 million f. Between UGS 100-
200 million
g. Between UGS 201-300 million h. Between UGS 301-400 million
i. Between UGS 401-500 million j. Between UGS 501-600 million k. Between UGS 601-700 million l. Between UGS 701-800 million m. Between UGS 801-900 million n. Between UGS 901-999 million o. More than UGS 1 billion
74. Please describe the source of your school’s financial resources last year. Please estimate in millions.
Source of Funding Estimated the value received in UGS millions
(last year, 2002-2003)
School Fees (cash)
School Fees (in-kind)
NGO Sources
Government Sources- Capitation Grants
Religious/Church Affiliation Sources
Community Sources
Students’ Family Sources
Other Donations (cash)
Other Donations (in-kind)
Gov’t Capital Development Grants
Gov’t Bursary Scheme (Scholarships)
TOTAL

204 Please estimate the TOTAL value of your school’s financial resources as of 30 June 2003 (circle one):
a. None b. Less than UGS 25 million c. Between UGS 25-50 million d. Between UGS 50-75 million e. Between UGS 75-100 million f. Between UGS 100-200 million g. Between UGS 201-300 million h. Between UGS 301-400 million
i. Between UGS 400-500 million j. Between UGS 501-600 million k. Between UGS 601-700 million l. Between UGS 701-800 million m. Between UGS 801-900 million n. Between UGS 901-999 million o. More than UGS 1 billion
75. Please describe the composition of these financial resources by estimating, in millions, the value of each of the following financial resources as of June 2003.
Location of Financial Resources Estimated Value in millions
(as of 30 June 2003)
Bank Account (checking or savings)
Other Cash Resources
Resources, things or money that other people owe you
Other:
TOTAL
76. Please estimate the value of your school’s TOTAL non-financial assets as of 30 June 2003 (circle one): a. None b. Less than UGS 25 million c. Between UGS 25-50 million d. Between UGS 50-75 million e. Between UGS 75-100 million f. Between UGS 100-200 million g. Between UGS 201-300 million h. Between UGS 301-400 million
i. Between UGS 400-500 million j. Between UGS 501-600 million k. Between UGS 601-700 million l. Between UGS 701-800 million m. Between UGS 801-900 million n. Between UGS 901-999 million o. More than UGS 1 billion

77. Please estimate the value of the school’s non-cash resources.
Non- Financial Resources Estimated Value in millions
(as of 30 June 2003)
School Land
School Vehicles
School Computers, Furniture & Equipment
School Inventories & Supplies
School Building Blocks
School Animals
TOTAL
78. YES NO Did your school receive financial assistance from donors last year? (If no, go to question 52.)
79. ______ Approximately how many total donors contributed to your school last year (not including students’
fees or in-kind payments)?
80. Please estimate the TOTAL value of future donations already promised or committed for your school next year – from all combined sources:
a. None b. Less than UGS 25 million c. Between UGS 25-50 million d. Between UGS 50-75 million e. Between UGS 75-100 million f. Between UGS 100-200 million g. Between UGS 201-300 million h. Between UGS 301-400 million
i. Between UGS 400-500 million j. Between UGS 501-600 million k. Between UGS 601-700 million l. Between UGS 701-800 million m. Between UGS 801-900 million n. Between UGS 901-999 million o. More than UGS 1 billion

206
81. Please rank up to four of the following as sources of past donations, from 1 to 4 “1” = Most Valuable; “4” = Less Valuable. Source:
a. _____ Community b. _____ Religious or Church Organizations c. _____ NGOs Organizations d. _____ Students’ Families e. _____ Government Sources f. _____ Friends of Administrators & Teachers g. _____ Other Organizations within Uganda h. _____ Other Organizations outside of Uganda
82. Please rank up to four the following as potential sources of future donations, from 1 to 4 (“1” = Most Valuable; “4” = Less Valuable). Source:
a. _____ Community b. _____ Religious or Church Organizations c. _____ NGOs Organizations d. _____ Students’ Families e. _____ Government Sources f. _____ Friends of Administrators & Teachers g. _____ Other Organizations within Uganda h. _____ Other Organizations outside of Uganda
83. YES NO Did you file revenue reports last year with government, district or town assessors?
84. YES NO Does your school have past or current financial loans? (If no, go to question 59.)
85. Please estimate the TOTAL value of your school’s past financial loans cumulative up to 30 June 2003.
86. That is, how much have you borrowed since the school started AND fully repaid (circle one): a. Less than UGS 50 million b. Between UGS 51-250 million c. Between UGS 251- 500 million d. Between UGS 501-750 million e. Between UGS 751 million -1 billion f. More than UGS Over 1 billion
87. Please describe the sources of these past financial loans (where you borrowed money or credit).
Financial Loan Sources Estimated Cumulative Value in millions
(Cumulative up to 30 June 2003)
Banking Institution
Friend
Family
Other Schools
Community Association
Other:
TOTAL

207
88. Please estimate the TOTAL value of your school’s current financial loans as of 30 June 2003.
That is, how much have you borrowed that had not yet been repaid as of 30 June 2003 (circle one):
a. Less than UGS 50 million b. Between UGS 51-250 million c. Between UGS 251- 500 million d. Between UGS 501-750 million e. Between UGS 751 million -1 billion f. More than UGS Over 1 billion
89. Please describe the sources of these current financial loans (where you borrowed money or credit).
Financial Loan Sources Estimated Value in millions
(as of 30 June 2003)
Banking Institution
Friend
Family
Other Schools
Community Association
Other:
TOTAL
90. SKIP THIS QUESTION! For later: Calculate the value of school’s buildings & facilities using the
Deputy Headmaster Survey and the Evaluation formulas from Uganda:____________________________________
__________________________________________________________

208
OVERALL RESOURCES:
91. Please describe your resources using the following questions and scale:
SCALE:
1 2 3 4 5
Not Sometimes not Somewhat Usually Always
Resources
To what extent do
you need more
of this resource?
To what extent is this
resource expensive?
How common is it for your school
to share this resource with
another school?
To what extent is this resource important
to your school’s successful
performance?
Land
Buildings
Classrooms
Vehicles
Teaching Materials
Textbooks
Science equipment Science chemicals
Food
Water
Electricity
Repairs & Maintenance
92. Which expenses took the largest proportion of your budget last year? Rank up to the top five (1 = Most, 5 = Least).
a. ________ Land
b. ________ Classrooms
c. ________ Vehicles
d. ________ Teaching Materials
e. ________ Food
f. ________ Water
g. ________ Electricity
h. ________ Teachers

209
i. ________ Staff
j. ________ Administrators
k. ________ Exam Seats
l. ________ Other: (Rank only if identified)
_______________________________________________
__________________________________________________________________________________________
_________
PARENT/SCHOOL BOARD RESOURCES: 93. __________ Approximately how many parents/guardians are actively involved in school activities?
94. YES NO Do you have an active PTA in your school (circle)?
a. If YES, about how many parents/guardians are involved? ________
95. Please describe what types of activities parents/guardians are generally involved in (list):
_____________________________________________________________
96. YES NO Is the headmaster an owner of the school?
97. YES NO Does the school have a school board?
98. _________ How many people serve on the School Board of Directors (or its equivalent)?
99. _________ How many of these people on the Board are employed at the school (as opposed to
having their main employment elsewhere)?
100. Please tell us about your streams by class and subject:
S1-S4
Subject # Streams Average Stream Size (number of students)
# of Teachers
How many of these teachers are certified in
the Subject Class � 1 2 3 4 1 2 3 4 1 2 3 4 1 2 3 4
Math
Geography
Biology
History
English

210
101. Please indicate your average stream size (number of students) & number of teachers (by subject):
S5-S6
# Streams Average Stream Size
(number of students)
# of Teachers
How many of these teachers are certified in
the Subject
Subject
5 6 5 6 5 6 5 6
Math
Biology
Chemistry
Physics
Agriculture
Geography
History
English Literature
Economics
Divinity
Fine Arts
Home Economics
General Paper

211
Appendix C (continued)
SECONDARY SCHOOL SITE SURVEY - 2003 Deputy Headmaster Survey (PART 3) Physical and Educational Resources
APPENDIX C (CONTINUED)
SECONDARY SCHOOL SITE SURVEY - 2003
Deputy Headmaster Survey (PART 3)
Physical and Educational Resources
We appreciate your willingness to participate with Brigham Young University (U.S.A.) in conducting research addressing the role of resources in secondary schools in Uganda.
This School Site Survey is composed of three parts: PART 1: Consent Form and Personnel Survey
PART 2: Headmaster Survey
PART 3: Deputy Headmaster Survey
We would appreciate your help and guidance in completing PART 3 of this survey under the direction of your Headmaster.
SCHOOL INFORMATION : Please print your name and information about your school:
School Name: _____________________________________
Interviewee Name: _________________________________________ Position:
_______________________________
SCHOOL LAND : Please tell us about your school’s land. 2. What year was your land purchased or obtained? _______________________
3. What is the size of your school’s property? ___________________ Acres 4. Please describe how you use the land owned by the school:
Is land used for (circle one):
Size of Space in Acres
List crops and animals raised and
sports played
Is the land shared with other schools
for these purposes?
Agriculture YES or NO Husbandry YES or NO

212
Sports YES or NO
5. How much of your land is currently undeveloped for school used? ______________ Acres
6. Please describe the physical location and condition of your school land (check one in each category).
a. Useability: ___ Mostly unuseable ___ Partially useable ___ Mostly useable
b. Wetlands: ___ No wetlands ___ Some wetlands ___ All
wetlands
c. Near Homes/Shops: ___ Near few ___ Near some ___ Near
many
d. Paved Roads: ___ Next to the school ___Some nearby ___ Only
few nearby
e. Hilly or Flat: ___ Flat ___ Somewhat Hilly ___ Very
Hilly
f. Land Cleared: ___ Only slightly ___ Quite a bit ___ All
g. Taxi access: ___ Under 5 min. walk ___ 5-15 min walk ___ More
than 15 minutes
7. Please describe the appearance of your school (check one in each category):
a. Walkways: ___ Mostly tarmac ___ Partially tarmac ___ None
tarmac b. Front Gate: ___ Locking ___ Gate, but not locking ___ No
front gate
c. Security guard: ___ Visible from front ___ On premises, not always visible ___ No
security guard
d. Yard : ___ Large grass area ___ Some grass area ___ No
grass area
e. Fencing: ___ Entire compound ___ Partial compound ___ No
fencing
f. Physical Appearance: How often do parents comment positively on the physical appearance of your school?

213
1 2 3 4 5 Rarely Occasionally Sometimes Often Very Often
SCHOOL’S WATER : Please tell us about your school’s water.
8. Describe your school’s source of water:
a. YES NO Is your water source on your property (circle one)?
b. _________ If no, how far away is the water source (in kilometers)?
c. How do you transport water (circle all that apply):
Gerry cans Buckets Pumps Other (specify) ______________
d. YES NO Do you have access to a well, a spring, or a bore hole?
e. YES NO Do you have tap water?
f. How do you store your water (circle all that apply):
Cistern Tanks Gerry cans Buckets Other (specify)
_______________
g. YES NO Do you have any system for capturing and storing rain water?
Please describe:
h. How do you purify your water (circle all that apply):
Boiling Chemicals No purification treatment
i. How would you rate the quality of your water before purification (circle one)?
1 2 3 4 5 Poor Moderate Excellent
SCHOOL’S FUEL SOURCES: Please tell us about your school’s fuel sources.
9. Describe your schools fuel sources:
Which of the following
fuel sources are used by your school (mark all that apply):
Please rank these sources in order of importance for your school (1=Most important):
What is the average cost of this fuel source for a month? (in UGS 000’s)
Wood
Petrol for Generator

214
Petrol for Vehicles
Natural Gas or Propane LP Gas
Paraffin
SCHOOL’S ELECTRICITY/LIGHT : Please tell us about your school’s resources for electricity and light.
10. YES NO Is UEB your main supply of electricity (please circle)?
11. What does your average electricity bill cost for a month (UGS 000’s)? ____________________
12. How much do you agree or disagree that the cost of electricity causes you to limit its use?
1 2 3 4 5 Strongly Disagree Agree Strongly Agree
13. What alternative sources of electricity are available at the school (circle all that apply)?
a. Gas generator b. Batteries c: Solar d: Other (please describe)
_____________________________
14. How often are alternative sources of electricity used (circle one)?
a. About once a day e. Every few months b. About once a week f. About once a year c. Every few weeks g. Never
d. About once a month
15. What alternative sources of light are available at the school (circle all that apply)?
a. Candles b. Torch c. Paraffin Lamps d. Other (please describe):
_________________________
_____________________________________________________________________________________________________
HEALTH & SANITATION : Please tell us about your school’s health and sanitation resources.
16. YES NO Does the school have access to a nurse for students?
17. YES NO Is the nurse a member of the school staff?
18. YES NO Does the school have health clinic services available at the school?
19. YES NO Does the school have flushing toilets? ______ How many?
20. YES NO Does your school have separate pits/stances for girls & boys?
21. __________ How many stances (pits) does the school have?
22. __________ How many showers does the school have?
23. __________ How many wash areas (wash basin equivalents) does the school have?

215
TRANSPORTATION: Please describe your school’s transportation.
23. YES NO Does the school own or have vehicles? (If no, skip diagram and go to question 24.)
Vehicle Descriptions Describe each vehicle that the school owns (type, make, model)
1
2 3 4
Year of Vehicle
Estimate of annual kilometers used for school business
How many days a month is this vehicle used?
Number of people that can be transported at one time
Square meters of space that could be used for hauling supplies, etc. (e.g. truck bed)?
Who services this vehicle and where?
How many times a year do you service this vehicle?
Date of last maintenance
Estimate of maintenance cost per year
24. ________ How many vehicles are owned personally by school staff yet used for school purposes?
25. YES NO Do you hire vehicles from other persons, schools organizations?
26. How often does the school hire or borrow a vehicle (circle one)?
a. Daily b. Once a week c. Once a month d. Every few months e. Never
27. For what reasons do you hire or borrow vehicles?
a. _______________________________________________________________________
b. _______________________________________________________________________
28. ________ How many bicycles are owned by the school for school use?

216
_____________________________________________________________________________ COMMUNICATION : Please tell us about your school’s communication equipment.
29. __________ How many different telephone numbers does the school support (including mobile
phones)?
30. __________ In addition to school phones, how many faculty or staff generally have mobile
phones with them?
31. YES NO Does the school have a functioning FAX machine available?
32. YES NO Is a reliable internet connection available at the school for admin/faculty/staff use?
33. YES NO Does the school have an email address?
If the school has an email address and would share it with us, please list it here:
____________________________________
__________________________________________________________________________________________
___________
EDUCATIONAL RESOURCES: Please tell us about your educational
resources.
34. Do you provide any of the following supplies for students?
g. YES NO Exercise Books
h. YES NO Writing Paper (other than exercise books)
i. YES NO Pens

217
35. Please describe the teaching supplies that your school provides to the students or uses for teaching activities.
Teaching Supplies
On average, how often do you
replenish your supplies?
(weeks, months, or terms)
How expensive is this resource?
1=Not expensive 2=Slightly 3=Somewhat 4=Very 5=Extremely
How important is this resource? 1=Not important 2=Slightly 3=Somewhat 4=Very 5=Extremely
Writing Paper (for teachers)
Chalk
Pencils & Pens
Science Chemicals
Hydrochloric Acid
Sulfuric Acid
Nitric Acid
NaOH hydroxide
Copper Sulfate
Zinc Metal
Sodium Metal
Benedict Solution
Fehlings Solution
COMPUTER RESOURCES: Please tell us about your computer resources.
36. YES NO Do you have computers available for student use?
(If no, go to question 55.)
Please describe your school’s involvement in computer training:
37. YES NO Do you offer formal computer training as a subject?
38. _______ Approximately what percentage of your students receive any computer training?
39. _______ How many teachers know how to use a computer?

218
40. _______ How many different teachers participate in teaching computer courses for students?
41. _______ How many teachers have received external computer training or certification of some
type?
Please describe your school’s computer resources that are available for student use:
42. _______ How many hours a week are computers available to A-Level students (in and out of
class)?
43. _______ How many hours a week are computers available to O-Level students (in and out of
class)?
44. _______ Do A-Level students use the computer to complete homework assignments?
45. _______ Do O-Level students use the computer to complete homework assignments?
46. _______ How many functioning printers does the school own?
47. _______ How many functioning computers do you have for student use?
48. YES NO Are all the student computers in one location?
49. YES NO Is the computer in a room that can be locked for security?
50. How many of these functioning computers were manufactured in the following time periods:
________ Pre 1995 _______1995-1999 _______ 2000-present
51. How many of these functioning computers for students have the following:
______3 ½” drives
______Zip drives
______CD drives
______CD Burning Capability
______Internet connection
______Connecting to working printer
52. How many of these functioning computers for students have the following software functions:
______Word Processing
______Spreadsheet
______Presentations or Slide Shows
______Database
______Games

219
53. Please describe your school’s computer supplies:
Computer Supplies
Number as of today (count)
How long will current inventory
last? (months)
How expensive is this
resource? 1=Not expensive 2=Slightly 3=Somewhat 4=Very 5=Extremely
How important is
this resource? 1=Not important 2=Slightly 3=Somewhat 4=Very 5=Extremely
Printer Paper (# reams of 500 sheets)
New 3 ½” disks
New Zip disks
New CD-R’s
ATHLETIC RESOURCES :
54. Please describe the different athletic activities or sports supported by the school’s facilities and equipment:
Athletic/Sport Descriptions Name of Sport/Athletic Activity
Does the school have a team that competes with other schools in this sport? Y/N
If teams, has the school received awards or honors in this sport? Y/N
Activity for (B) boys, (G) girls or (BG) both?
Athletic equipment available for this sport or activity (e.g. counts):
Balls Nets Hoops Goals Other:

220
Athletic/Sport Descriptions Name of Sport/Athletic Activity
Does the school have a team that competes with other schools in this sport? Y/N
If teams, has the school received awards or honors in this sport? Y/N
Activity for (B) boys, (G) girls or (BG) both?
Athletic equipment available for this sport or activity (e.g. counts):
Balls Nets Hoops Goals Other: VOCATIONAL RESOURCES :
55. Please describe any vocational resources at your school. Vocational Activities (add additional activities if they are not listed)
Which activities
are provided by your School? (check)
Which activities are available for your students through another school or
partnership? (Check)
If yes, where?
List Resources that the School has to support these activities
Agriculture Y N
Woodworking Y N
Sewing/Tailoring Y N
Metalworking Y N
Husbandry Y N
Computer Studies Y N
(Already listed in this survey.)
Electrician Y N

221
BUILDING BLOCKS : Please tell us about your school’s buildings blocks.
56. Please describe your school’s buildings:
a. ____Number of separate building blocks in your school
b. ____Number of buildings blocks currently under construction
c. ____Number of buildings blocks planned but not yet under construction
d. ____Number of buildings blocks with doors?
e. ____Number of buildings blocks with glass in windows?
f. ____Number of buildings blocks with cement floors (or other covering)?
g. ____Number of buildings blocks with electricity?
57. How many of your building blocks have the following exterior finishes:
a. ____ Brick b. ____ Stucco c. _____ Paint d. Other (Specify):
______________________
58. Please describe how many of your building blocks have the following construction:
a. ___ Brick (self made) b. ____ Brick (purchased) c. Wood
d. Other (Specify): ______________________
59. How many classrooms for each grade level?
S1 S2 S3 S4 S5 S6
60. In the space below and if needed behind, please diagram your school’s building blocks. Give each block a unique number and list the number of classrooms, administrative rooms, and laboratories each block contains.
(The researcher will measure these by “pacing them off” during the course of the interview.) Name of Researcher Pacing: ____________________________________________ Length of Pace: _______ inches 61.

222
61. Please measure the following rooms and answer the questions in the table:
Room
Size Max Capacity
S1
S2
S3
S4
S5
S6
D1
SL1
L1
Size & Capacity of each of the
following rooms:
-Classrooms (S1-S6) -1 Dormitory (D1) -Science Laboratory (SL1) -Library (L1) -1 Administrative Room (A1) Size =( meters x meters, e.g. 6.21 x 4.25) Max Capacity (only for classrooms & dorms) = # of persons seated or boarded)
A1
Total Internal Size (sq. ft) Calculate from previous question (later)
Type of Room How many rooms does the school utilize for the following purposes?
Administrative
Dormitory/ Student Boarding
Library
Food Prep/Storage
Meeting Hall
Computer Lab/Room
Science Laboratory
Faculty/Staff Area
Faculty/Staff Boarding
Husbandry
Storage/ Tools
Dining Area
Garage
Entertainment
Health & Medical
Security
Hall for National Exams

223
LIBRARY RESOURCES: Please describe the books and library resources in your school.
62. YES NO Do students read in the library (please circle)?
63. In what places do the students usually read?
64. (To be done by the research assistants) ---- Estimate “other” books available to the school that teachers, administrators or school students keep in their possession. This is not book loans to other schools.
Library Resources
School-owned Books
in Library (estimate number
of books in library)
School-owned Books
with Teachers (estimate number
held by teachers & NOT in library)
School-owned Books
with Administrators (estimate number
held by administrators & NOT in library)
School-owned Books
with Students (estimate number held by school’s
students & NOT in library)
Number of Books (count)
Overall Condition of Books 1=Poor 2=Fair 3=Good 4=Very Good 5=Excellent
65. What are the copyright dates on 10 books?
Random Check for Age of Books – Instructions for Research Assistants: Pick the 1st book on a shelf in the school’s library. Write down the copyright year from the front pages into one of the boxes below. Go about 3 feet of books to the right and select a 2nd book. Continue through the shelves in a methodical, non-duplicating manner, until you have 10 books. If you run out of shelf space, begin again 1 foot to the right of your previous beginning point and go every 3 feet until you have 10 books.

224
Appendix C (CONTINUED)
SECONDARY SCHOOL SITE SURVEY – 2003 Additional Information Resource Survey (PART 4)
Student Intake, UNEB Exam, & Class/School Timetable Information SCHOOL INFORMATION: Please complete the following demographic information: School Name: ___________________________ Your Name: ____________________________ Post: _____________________ Please tick one of the following school types: Government______ Private______ Community______ STUDENT INTAKE INFORMATION: Please describe the school’s student intake for 1999-2002: 1. Please name up to five primary schools that send the largest number of primary students to your school: a. ___________________________ b. ___________________________ c. ___________________________ d. ___________________________ e. ___________________________ 2. Please provide one of the following: either COPIES of the PLE and O-level exam admission scores for the students accepted to your school through the years 1999-2002 or INDICATE the mean PLE and O-level exam admission scores for the years 1999-2002: a. 1999: ____________ ____________ b. 2000: ____________ ____________ c. 2001: ____________ ____________ d. 2002: ____________ ____________ PLE O-level PLE O-level UNEB EXAM INFORMATION: Please provide information in reference to UNEB O/A-level exams: 3. Do other secondary schools send students to your school to sit for the UNEB O/A-level exams? Please circle: Yes or No 4. If yes, please name up to three secondary schools that send students to your school to sit for the UNEB O/A-level exams: a. ___________________________ b. ___________________________ c. ___________________________ 5. Does your school send students to sit for the UNEB O/A-level exams at other secondary schools? Please circle: Yes or No 6. If yes, please name up to three secondary schools where your school sends students to sit for the UNEB O/A-level exams: a. ___________________________ b. ___________________________ c. ___________________________ CLASS/SCHOOL TIMETABLE INFORMATION: Please describe the class timetable for the school. 7. Please indicate the amount of time allocated to the following areas: a. Minutes per Lesson _________ b. Time per Chemistry Practical: __________ (hours per week) c. Time per Biology Practical: __________ (hours per week ) d. Time per Physics Practical: __________ (hour per week) 8. Please indicate how often science practicals are conducted per week: a. Chemistry: _______________ b. Biology: _______________ c. Physics: _______________ 9. Please indicate how many hours per week your students spend in the library: _____________________ 10. Please indicate how often parent teacher association meetings take place: Please circle one of the following: a. weekly b. monthly c. once each term d. once each year e. never f. other: __________

225
APPENDIX D
FORMULAS FOR BUSINESS RATIO ANALYSIS BY GROUPING

226

227
APPENDIX D
TABLE OF CONTENTS Introduction..........................................................................................................229 Ratio Groups and Formulas .................................................................................231
Profitability Ratios ..................................................................................231 Efficiency Ratios......................................................................................232 Liquidity Ratios .......................................................................................233
Solvency Ratios .......................................................................................236 Leverage Ratios .......................................................................................237 Cash Flow Ratios .....................................................................................237 Other Indicators .......................................................................................238 Summary..............................................................................................................241 Key to Sources Cited in Ratio Formulas..............................................................241 References for Appendix D .................................................................................243
LIST OF TABLES
Table D.1 Profitability Ratios ............................................................................233 Table D.2 Efficiency Ratios...............................................................................234 Table D.3 Liquidity Ratios ................................................................................235 Table D.4 Solvency Ratios ................................................................................236 Table D.5 Leverage Ratios ................................................................................238 Table D.6 Cash Flow Sufficiency Ratios...........................................................239 Table D.7 Cash Flow Efficiency Ratios ............................................................239 Table D.8 Interest Coverage Ratios ...................................................................240 Table D.9 Asset Mix Ratio .................................................................................241

228
.

229
Appendix D
Formulas for Business Ratio Analysis by Grouping
Introduction
Financial statement ratio analysis has grown in the corporate world to near global
acceptance and application. Hundreds of ratios are used, some almost universally and some
only for specific applications, along a broad spectrum of analyses purposes. The author has
limited the coverage here to those ratios are more likely to be appropriate to this research.
The following three criteria have been used as filters in limiting the number of ratios
considered for this project. These filters serve as logical restrictions to seemingly
innumerable possibilities.
1. The ratio is widely used and generally recognized.
2. The ratio is appropriate for use in a setting with private individual or partnership
ownership, rather than public corporate ownership. All ratios pertaining to areas of
concern to common corporate shareholders such as earnings per share (EPS),
dividend payouts, or price/earnings ratios (P/E ratios) have not been included.
3. The ratio is appropriate to a service industry. The many common ratios applied to
manufacturing, wholesaling or retailing firms are not included. These excluded ratios
primarily focus on inventories which are produced or held for resale. Any inventories
found on the balance sheets of service industries are incidental rather than primary
components in asset value or determination of income from the operations of the
organization.

230
Ratios which meet the above criteria were grouped into seven categories which have
been identified as relevant to this study. The groups are presented here with a brief
explanation of each (as provided in Chapter 2, but slightly expanded here).
With literally millions of users of financial analysis ratios, it is not surprising that
alternative names have evolved for ratios and varying nuances on formulas used in
calculating the ratios. An effort has been made to identify those ratios, names, and formulas
most commonly used, with particular emphasis on academic textbook presentation,
management/controllership sources, and actual industry benchmarking services.
Some ratios are known by more than one name. In such cases, an effort has been
made to provide each of the common names for the ratio in question. In other cases, there
may be alternative formulas for a given ratio name. In such cases, alternative ratios are
presented. An effort has been made to consolidate and simplify presentation of the ratios and
their formulas. The use, meaning, or significance of each ratio is also presented to give the
reader some sense of its importance.
Parenthetical letters following an entry refer the reader to sources where further
coverage on that particular ratio may be found. A key to these sources is given at the
conclusion of the ratio presentation. Full citations for these sources may be found under
“References” at the conclusion of this Appendix.
Ratios are presented here in the same order and groupings as seen in Chapter 2 of this
document. This appendix is provided as detailed supplemental material to support and
deepen the literature review on financial ratios.
It is anticipated that in the analysis stage, the following information will be provided
for each ratio employed in the analysis. [Note: an illustration of this presentation was given

231
in Chapter 3, Research Question #2, for the current ratio, a ratio commonly associated with
liquidity.]
Name of ratio grouping
Intent or function of this ratio grouping
Name of specific ratio
Formula for this ratio
Where the data for this ratio is found in the database
Use of this ratio
Meaning/Interpretation of the ratio
Expected range of the ratio
Appropriateness of this ratio in LDC setting
It is acknowledged that the relatively few ratios presented here may still be
overwhelming to the uninitiated reader. The author notes that in the analysis of Research
Question #1, an effort will be made to identify those few (perhaps 2 to 4) ratios in each ratio
category which (a) may best capture the essence of the category, and (b) can be calculated
given the data available.
Ratio Groups and Formulas
Ratios are presented here in the same groupings as introduced in Chapter 2. Each
grouping is discussed in greater depth. Formulas are given for those specific ratios within
the grouping that may be most helpful in this analysis.
Profitability Ratios
This group of ratios focuses on those components that affect the organization’s
income or success in operations for a given period of time (Weygandt et al., 1999).

232
Profitability provides a measure of a company’s operating success (King, Lembke, & Smith,
2001).
It is noted that profitability ratios traditionally analyze income as compared to some
other factor. Income is largely a function of revenue and expense figures based on accrual
concepts of accounting (White). That is, income is calculated as the difference between
revenues earned (not necessarily collected) and expenses incurred (but not necessarily paid
for) in generating those revenues. This accrual-based perspective may provide a very
different picture of income than a cash-based perspective.
Profitability may be viewed as “the ease with which a company generates income”
(Jones et al., 2000, F455). While it is imperative that a company experience profitability in
order to continue its operations into the foreseen future (the business concept known as going
concern (Maurer et al., 1995), profitability is not the only factor of importance. Again
quoting Jones, “A preoccupation with short-term profits is detrimental to the long-term value
of a business!” (Jones et al., 2000, F455).
Profitability ratios are presented in Table D.1. The formulas and significance for
each profitability ratio are also presented.
Efficiency Ratios
These ratios show how efficiently assets and equity are being utilized. These are also
commonly referred to as turnover ratios (B. Lev, 1974) , activity ratios (White et al., 1998)
or operations or operating ratios (Albrecht et al., 2005; Stice et al., 2004; Viscione, 1983).
These ratios are helpful in evaluating management performance (RMA, 2003-2004)
and policies. The emphasis here is on operational efficiency (B. Lev, 1974).

233
Table D.1 Profitability Ratios
Ratio
Formula
Significance
Percent Return on Net Sales
or
Profit Margin
Net Profit / Net Sales Revenue
or
Net Income / Sales
Measure of share of sales turned into profit (RA)
Gross Profit to Net Sales Gross Profit / Net Sales Revenue
Measures gross margin as a proportion of net sales (RA)
Break Even Point (BEP) Total Operating Expenses / Average Gross Margin Percentage
Shows exact sales level at which a company covers all costs but makes no profit (RA)
Margin of Safety (Current Sales level – BEP / Current Sales Level
Indicates amount by which sales can drop before BEP (RA)
Ratio of Administrative Expenses to Sales
Total General and Administrative Expenses / Gross Sales
Shows level of administrative overhead required to maintain a particular level of sales (RA)
Return on Equity Net Income / Average Stockholders’ Equity
Measures profitability relative to owners’ investment (W)
Efficiency ratios are presented in Table D.2. The formulas and significance for each
efficiency ratio are also presented.
Liquidity Ratios
These ratios focus on the organization’s ability to meet its short-term obligations
which may include short-term formal debt such as notes payable, credit obligations that may

234
Table D.2 Efficiency Ratios Ratio Formula Significance
Return on Total Assets
or
Return on Assets (ROA)
or
ROA
(Net Income + (Interest Expense X (1-tax rate))) / Average Total Assets
or
(Net Income + After-tax Interest Cost) / Average Total Assets
or
EBIT / Ave. Tot Assets
Measure of how well the assets have been employed by management (G)
or
measures management’s ability and efficiency in using the firm’s assets to generate operating profits (W)
Total Asset Turnover
Sales/Total Average Assets
Measure of overall investment efficiency (W)
Fixed Assets Turnover Sales / Ave. Fixed Assets Measure of efficiency of LT capital investment (W)
Average Collection Period
(Age of Receivables)
or
Ave collection period
365 days / Accounts Receivable Turnover
or
Ave AR /Ave Cr sales per day
Measure of the average number of days taken to collect an Account Receivable (G)
Payables Turnover
Total Purchases / Ending Accounts Payable Balance (RA)
or
Sales / Ave AP (W)
Shows how rapidly the company is paying its obligations (stretched too far or taking all possible discounts for early payment?) (RA)
Days AP Outstanding (R)
or
Average Number Days Payables Outstanding (W)
365/ AP Turnover Shows in number of days the rapidity with which ST obligations are met
Ratio of Depreciation to Fixed Assets
Total Accumulated Depreciation / Total Gross Fixed Assets
Rough check on adequacy of depreciation policy (RA)
Working Capital Turnover Sales / Average Working Capital
Summary ratio that reflects amount of working capital needed to sustain a given level of sales (W)

235
arise from daily operations, or any debt that will mature in the next operating cycle (Gates,
1993). As RMA, an industry benchmarking giant, explains: “Liquidity is a measure of the
quality and adequacy of current assets to meet current obligations as they come due” (RMA,
2003-2004, p. 12). Liquidity ratios are presented in Table D.3. The formulas and
significance for each liquidity ratio are also presented.
Table D.3 Liquidity Ratios Ratio Formula Significance
Current Ratio
or
Working Capital Ratio (W)
Current Assets / Current Liabilities
Test of short-term debt-paying ability (G)
Quick (Acid Test) Ratio (Cash + Marketable Securities + Current Receivables) / Current Liabilities
Test of short-term debt-paying ability without having to rely on inventory
(G)
Working Capital (not a ratio, but is a measure of liquidity and is used in other ratios in other groupings)
Current Assets - Current Liabilities
Measures the company’s ability to repay Current Liabilities using only Current Assets (G)
Cash Ratio
or
Cash Ratio
(Cash + Short-Term Securities) / Current Liabilities
or
(Cash+ Marketable Securities / Current Liab’s
Most conservative measure of company’s ability to pay off short-term liabilities (RA)
or
(W)
Defensive Interval 365 X (Cash + Marketable Securities + Accounts Receivable) / Projected Expenditures
Provides intuitive feel for a company’s liquidity; compares the quickly available sources of cash with the expected expenditures (R)

236
Solvency Ratios
This group of ratios focuses on the organization’s ability to meet its long-term debt
obligations. This relates to the company’s long-term survivability (Weygandt et al., 1999).
The seriousness of the issue of solvency is summed up by White: “…the priority of
interest and debt claims can have a severe negative impact on a firm when adversity strikes.
The inability to meet these obligations can lead to default and possible bankruptcy” (White et
al., 1998, p. 161).
Solvency ratios are presented in Table D.4. The formulas and significance for each
solvency ratio are also presented.
Table D.4 Solvency Ratios Ratio Formula Significance
Long-Term Debt to Equity Total Long-Term Debt / Total Owners’ Equity
Expression of the company’s capitalization; excessive debt may indicate potential insolvency (RA)
Long-Term Debt to Assets LT Debt / Total Assets Shows the portion of assets financed by LT Debt (R)
Long-Term Debt to Tangible Assets
LT Debt / Total tangible Assets
Shows the portion of tangible assets as related LT Debt (R)
Capital Expenditure Ratio Cash from Operations (CFO) / Capital Expenditures
Measures ability to finance the replacement and expansion of company’s investment in productive capacity (W)
CFO to Debt Ratio CFO / Total Debit Shows generation of cash for debt repayment (W)

237
Leverage Ratios
This group of ratios examines the organization’s debt structure. It addresses the use
of debt to leverage its productive assets (Albrecht et al., 2005) or compares debt to net worth.
Organizations that are heavily leveraged (meaning they have high debt in relationship to net
worth) may face greater vulnerability during business downturns (RMA, 2003-2004).
The concept of financial leverage asserts that leverage (debt) may be effectively and
safely used as a means to finance assets and growth (i.e., positive financial leverage exists) as
long as the returns to the organization’s owners (rate of return on equity) exceed the cost of
the debt (rate of return the company must pay its creditors) (Garrison et al., 2006). This is a
measure of “risk and return trade-off” (White et al., 1998).
It may appear that there is some overlap or close correspondence between the ratio
categories of leverage and solvency. Indeed, they are closely related and utilize some of the
same components in their calculations. Both are attempts to pinpoint areas of potential risk.
Yet they address slightly different issues. Solvency focuses on an organization’s long-term
ability to meet its obligations. Leverage concentrates on the use the company is making of
the long-term debt it has incurred.
Leverage ratios are presented in Table D.5. The formulas and significance for each
leverage ratio are also presented.
Cash Flow Ratios
This group of ratios highlights the necessity of efficient cash management (Schaeffer, 2002).
Relatively recent in its development and use, it is subdivided into sufficiency ratios
(addressing the cash flow needs of the entity) and efficiency ratios (measurements of how
cash is generated) (Roehl-Anderson & Bragg, 2005).

238
Table D.5 Leverage Ratios Ratio Formula Significance
Total Liabilities to Total Assets
Total Liabilities / Total Assets (W)
Shows the relationship between total assets and total liabilities, a measure of leverage in financing assets
Debt to Equity Total Debt/ Total Equity (W)
Shows the relationship directly of debt to equity
Debt to Equity Turnover Total Liabilities / Stockholders’ Equity
Measure of the amount of assets being provided by creditors for each dollar of assets being provided by the stockholders (G)
Debt to Total Capital Total Debt (Current + Long-Term) / Total Capital (Owner’s Contributions + Retained Earnings)
Measure of risk relating to financing (W)
Cash sufficiency ratios are presented in Table D.6. Cash efficiency ratios are
presented in Table D.7. The formulas and significance for each of these cash flow ratios are
also presented in their respective tables.
Other Indicators
In a catch-all category, some financial statement users suggest that there are other
ratios that may be helpful in financial analysis (Fridson, 1996; Stice et al., 2004).
a. Interest coverage ratios. These ratios are closely related to liquidity yet are not
appropriately included in that category of ratios. Interest coverage ratios are seen as
useful in directly addressing the organization’s ability to meet interest payments
(White et al., 1998). Interest may be a major component of current liabilities (a key
component in liquidity measures). Interest expenses may be incurred as a result of

239
Table D.6 Cash Flow Sufficiency Ratios Ratio Formula Significance
Cash Flow Adequacy Cash from Operations / (Long-Term Debt Paid + Funds from Assets Purchased + Dividends Paid)
Measures company’s ability to generate sufficient cash to pay its debts, reinvest in its operations and pay dividends to its owners (RA)
Long-Terms Debt Repayment
Long-Term Debt Payments / Cash from Operations
Measures sufficiency of cash to cover long-term debt obligations (RA)
Debt Coverage Total Debt / Cash from Operations
Reflects how many years, at the current level of cash generation, are needed to retire all existing debt (RA)
Cash to Working Capital (Cash + Short-Term Marketable Securities) / (Current Assets – Current Liabilities)
Shows proportion of working capital that can be quickly converted to cash to meet obligations (RA)
Table D.7 Cash Flow Efficiency Ratios Ratio Formula Significance
Cash Flow to Sales Cash Flow from Operations / Sales
Percentage of sales realized in cash (RA)
Cash Flow Return on Assets Cash Flow from Operations / Total Assets
Relative amount of cash generated by assets (RA)
Cash Flow from Operations Cash Flow from Operations/Current Liabilities
Measures liquidity by comparing actual cash flows with current liabilities (R)
Fixed Charge Coverage Ratio (Cash Basis)
Adjusted Operating Cash Flow / Fixed Charges
Compares cash from operations with fixed charges (W)
Times Interest Earned (Cash Basis)
Adjusted Operating Cash Flow / Interest Expense
Addresses interest coverage from operating cash (W)

240
management policy or practice regarding short-term debt, such as paying or not
paying accounts payable within the no-interest period allowed. Interest obligations
may also be incurred as they relate to long-term debt. Debt ratios assist in
understanding of financial structure of an organization, but provide “no information
about its ability to generate a stream of inflows sufficient to make principal and
interest payments. One financial ratio commonly used for this purpose is the interest
coverage ratio” (Revsine et al., 2002, p. 162). Similar ratios, but prepared with a cash
emphasis, are presented in the Cash Flows ratio group. The interest coverage ratios,
along with their formulas and significance, are presented in Table D.8.
b. Asset Mix Ratio. This ratio is not as widely used as others, but may be a critical
factor in the setting of this research. It looks at asset composition (Stice et al., 2004)
and may relate to the issue of efficient use of assets. The asset mix ratio, its formula,
and significance are presented in Table D.9.
Table D.8 Interest Coverage Ratios Ratio Formula Significance
Times Interest Earned Earnings Before Interest & Taxes (EBIT) / Interest Expense
Measures the extent to which earnings are available to cover interest expense (W, G)
Fixed Charge Coverage Earnings Before Fixed Charges and Taxes / Fixed Charges
A more comprehensive measure including all fixed charges (W)

241
Table D.9 Asset Mix Ratio Ratio Formula Significance
Asset Mix Ratio Buildings and Equipment / Total Assets
Measures the portion of assets tied up in fixed assets
(S)
c. Other ratios to be determined through analysis. It is possible that in the analysis
stage, other factors or indicators may emerge that appear to be relevant and necessary
to include in ratio analysis. One area of possible development, unseen in the
literature but that may be of use and closely ties to the aforementioned asset mix ratio,
could be ratios that further explore asset composition.
Summary
Ratios presented in this appendix are those that appear to be good possibilities for use
in addressing the research questions as identified in this project. The analysis stage of the
project will seek to further refine and distill the ratios that may be appropriately applied to
secondary schools in the Mukono District of Uganda in assessing fiscal viability.
Key to Sources Cited in Ratio Formulas
G = Gates
R = Revsine
RA = Roehl-Anderson
S = Stice
W = White

242

243
References for Appendix D
Albrecht, W. S., Stice, J. D., Stice, E. K., & Swain, M. R. (2005). Accounting: Concepts and
applications (9th ed.). Mason, OH: South-Western Publishing.
Fridson, M. S. (1996). Financial statement analysis: A practitioner's guide. New York: John
Wiley & Sons.
Garrison, R. H., Noreen, E. W., & Brewer, P. C. (2006). Managerial accounting (11th ed.):
McGraw/Irwin.
Gates, S. (1993). 101 business ratios. Scottsdale, AZ: McLane Publications.
Jones, K. H., Werner, M. L., Terrell, K. P., & Terrell, R. (2000). Introduction to financial
accounting: A user perspective (2nd ed.). Upper Saddle River, New Jersey: Prentice
Hall.
King, T. E., Lembke, V. C., & Smith, J. H. (2001). Financial accounting: A decision-making
approach. New York: John Wiley & Sons.
Lev, B. (1974). Financial statement analysis: A new approach. Englewood Cliffs, New
Jersey: Prentice-Hall.
Revsine, L., Collins, D. W., & Johnson, W. B. (2002). Financial reporting & analysis (2nd
ed.). Upper Saddle River, NJ: Prentice Hall.
RMA. (2003-2004). Annual statement studies: Financial ratio benchmarks. Philadelphia:
The Risk Management Association.
Roehl-Anderson, J. M., & Bragg, S. M. (2005). The controller's function: The work of the
managerial accountant (3rd ed.). Hoboken, NJ: John Wiley & Sons.
Schaeffer, H. A., Jr. (2002). Essentials of cash flow. Hoboken, NJ: John Wiley & Sons.

244
Stice, E. K., Stice, J. D., & Skousen, F. F. (2004). Intermediate accounting (15th ed.).
Mason, OH: South-Western Publishing.
Viscione, J. A. (1983). Analyzing ratios: A perceptive approach. New York: National
Association of Credit Management.
Weygandt, J. J., Kieso, D. E., & Kimmel, P. D. (1999). Managerial accounting: Tools for
business decision making. New York: John Wiley & Sons.
White, G. I., Sondi, A. C., & Fried, D. (1998). The analysis and use of financial statements
(2nd ed.). New York: John Wiley & Sons.

245
APPENDIX E
SAMPLE EXCEL DATABASE SPREADSHEET

246

247
Appendix E
Sample Excel Database Spreadsheet
analysno Sch_ID TotFR02 TotSFC02 TotSFI02 TotRNG02 TotRGG02 1 S0057 2 1.5 0.5 0 0 2 S0105 2 2.6 0.2 0 0 3 S0106 2 20 5 0 0 4 S0108 3 36 0.04 1.38 0 5 S0113 7 246 4.24 0 5.4 6 S0138 3 43 2 0 0 7 S0139 3 15 1.5 0 6.96 8 S0140 5 92.793 3.776 0 0 9 S0143 3 19.767 0 0 11.76392
10 S0146 2 1.684 0.112 0 0 11 S0147 2 14 0.9 0.68 0 12 S0148 7 259.2 0 0 0 14 S1004 10 297 0 0 18 15 S1005 7 204.537 6.8365 0 0 16 S1007 3 35 3 0 0 17 S1008 5 30 0.3 0 0 18 S1010 4 52 10 0 0 20 S1013 5 80 1 0 0 21 S1014 14 900 7 0 0 22 S1015 7 250 0 0 0 23 S1016 3 30 2 0 0 24 S1017 6 35 0 0 0 28 S1029 0 0 0 0 0 29 S1050 6 100 0 500 15 31 S1052 3 30.5 0.5 0 8.4 33 S1095 4 38 7 0 0 34 S1096 14 800 0 0 0 35 S2011 2 99999 10 0 0 38 S2025 5 31 0 0 53 40 S2027 7 191 0 10 0 41 S2031 4 15.1622 1 0 35.89852 42 S2040 6 17.7974 0.14 0 15.372 45 S2054 7 200 0 0 0 47 S3039 4 10 0.5 0 3.9 48 S3047 2 10 0.3 0 0 49 S3063 13 662.6767 0 0 181 50 S3064 6 180 16 0 0 51 S3065 2 17 0.2 0 0

248

249
APPENDIX F
FINDINGS

250

251
APPENDIX F
TABLE OF CONTENTS
F-1 Template for Financial Statements........................................................253 F-2 Contextual Variables from the Survey Data Set ...................................255 Graph 1: Age of School, Population.................................................256 Graph 2: Age of School, Sample ......................................................257 Graph 3: Total Number of Students in School, Population ..............258 Graph 4: Total Number of Students in School, Sample....................259 Graph 5: Number of Students taking the UNEB at a School, Population .....................................................................................260 Graph 6: Number of Students taking the UNEB at a School, Sample............................................................................................261 Graph 7: Percentage of Females in a School, Population.................262 Graph 8: Percentage of Females in a School, Sample ......................263 Graph 9: Percentage of Boarding Students in a School, Population ......................................................................................264 Graph 10: Percentage of Boarding Students in a School, Sample....265 Graph 11: Student Teacher Ratios, Population.................................266 Graph 12: Student Teacher Ratios, Sample ......................................267 F-3 Data Difficulties, Inconsistencies, and Explanations— Revenue Reports ...............................................................................269 F-4 Income Statement Components from 10 Revenue Reports...................277 F-5 Depreciation, Comparisons, and Effects ...............................................281 Table F-5.1: Comparison of Depreciation Rates Methods and Rates per Asset Category ...........................................................283 Table F-5.2: Net Income as a Percentage of Net Revenues, Recalculated without the Effects of Depreciation ............................284 F-6 Brief Explanation of Accounting and Financial Statements .................285 F-7 Summary of Horizontal Analysis—Balance Sheets and Income Statements .........................................................................................289 F-8 Horizontal Analysis—Industry Averages; Percent Changes for Balance Sheets and Income Statements ......................................291 F-9 Common Size Balance Sheets, 2 Years for Each School......................293 F-10 Common Size Income Statements, 2 Years for Each School ...............295 F-11 Industry Averages—Common Size Statements ...................................297 F-12 Ratio Analysis—Calculability & Modifications Necessary for LDC Setting .........................................................................................299 Table F12.1: Profitability Ratios.........................................................302 Table F12.2: Efficiency Ratios ...........................................................303 Table F12.3: Liquidity Ratios .............................................................305 Table F12.4: Solvency Ratios.............................................................306 Table F12.5: Leverage Ratios ............................................................306 Table F12.6: Cash Flow Sufficiency Ratios .......................................307 Table F12.7: Cash Flow Efficiency Ratios.........................................307

252
Table F12.8: Interest Coverage Ratios................................................308 Table F12.9: Asset Mix Ratio.............................................................308 F-13 The 13 Viable Financial Ratios ..........................................................311 F-14 Cross-sectional Analysis—13 Financial Statement Ratios ..................312
F-15 Ratio Analysis--Details of Seven Key Ratios ......................................317 Profit Margin........................................................................................317 Return on Equity..................................................................................319 Current Ratio........................................................................................321 Long-term Liabilities to Equity ...........................................................323 Total Liabilities to Total Assets...........................................................325 Total Liabilities to Equity ....................................................................326 Asset Mix .............................................................................................329 F-16 Seven Key Financial Ratios and Rankings...........................................333 F-17 15 Variables, Industry Averages and School Rankings .......................335 F-18 UNEB scores—Comparisons between sample and population ...........337 Descriptive Statistics for 10 Schools ...................................................337 Descriptive Statistics for 59 Schools ...................................................337 Graph: Distribution of UNEB Scores for 10 Schools.........................338 Graph: Distribution of UNEB Scores for 59 Schools.........................339 UNEB Weighted Average Scores and Rankings for 10 Schools.........339 Observations and Comments Regarding UNEB Score Distributions, Means, and Rankings .......................................................................340 F-19 Correlations between UNEB Means, Financial Ratios, and Contextual Variables………………………………………………341

253
Appendix F-1
Template for Financial Statements Financial Statement Corresponding Question in survey
database I. Balance Sheet
(format: Assets = Liabilities + Equities) Assets Current Assets Cash Q44/77 Cash equivalents (Marketable Securities) Q44/77 Accounts Receivable Q44/77 Supplies Q46/79 Long-Term Assets: Q45/78
Long-Term Note Receivable Property, Plant & Equipment Q 46/79
Total Assets Q 43/76 Liabilities and Equity Liabilities: Current Liabilities (due within 1 year): Q53/86 Accounts Payable ST Notes Payable LT Liabilities (loans; term > 1 year): Q56/90 Bank Notes Payable Mortgages Payable Total Liabilities: Q 57/91 Equities: Owner Contributions Retained Earnings Total Equities Default calculation II. Income Statement
Revenues Q 42/75 - Expenses Q60/94 (only asks for proportions, not
monetary amounts) = Net Income Default calculation

254
III. Cash Flows Statement Inflows: Cash from operations Q42/75 Cash from financing activities Q 57/91; Q47/80 Cash from investing activities Outflows: Cash for operations Q60/94 (not direct, somewhat close) Cash for financing activities Cash for investing activities Net cash inflow (outflow)

255
Appendix F-2 Contextual Variables from the Survey Data Set
The following descriptive statistics are output from SPSS analysis. Descriptive statistics for population (59 UNEB schools)
N Minimum Maximum Mean Std. Deviation Age 56 .00 101.00 18.3036 23.30737 Tot#Stud 59 114.00 1310.00 423.2712 284.79199 UNEB#Std 59 19.00 203.00 82.8644 40.69799 PrctFemale 54 .00 1.00 52.07 15.990 PrctBrdng 57 .00 1.00 40.38 36.276 StudTchrR 56 9.50 37.66 19.8385 6.54683 Valid N (listwise) 49
Descriptive statistics for sample (10 schools)
N Minimum Maximum Mean Std. Deviation SclAge 10 2.00 36.00 8.8000 10.20675 Tot#Stdnts 10 208.00 1224.00 649.2000 338.38893 Tot#UNEBs 10 60.00 152.00 93.3000 29.69493 PrctFemale 7 42.86 100.00 55.6163 20.00037 PrctBrdng 8 42.69 100.00 85.1620 20.75107 StudTchrR 9 11.89 37.66 22.8259 8.44073 Valid N (listwise) 6
Observations:
1. School Age: Population age (18.3) is considerably larger than the sample age (8.8). The sample, however, has a much smaller standard deviation
2. Total Number of Students: The sample mean is much larger (649.2) than the population mean (423.27).
3. UNEB students: This reflects how many students sit for the UNEBs at a school. These means are relatively close.
4. Percentage of Females in a school: These figures are quite close. 5. Percent Boarding Students in a school: The sample mean (85.2) is more than twice as
high as the population mean. 6. Student Teacher Ratio: These means are not substantially different.
Discussion: Revenue reports (the defining similarity between the sample schools) are much more likely to be filed by large, new schools. These schools, on the average, have twice as high a proportion of boarding students, compared to the population mean. Graphs of the distribution of values follow to offer the reader a pictorial explanation of differences in composition between the population (all UNEB schools in the Mukono

256
District; n=59) and the sample (those UNEB schools that filed revenue reports for 2003; n=10). Graph 1: Age of School, population
120.00100.0080.0060.0040.0020.000.00
Age
30
25
20
15
10
5
0
Fre
qu
ency
Mean = 18.3036Std. Dev. = 23.30737N = 56

257
Graph 2: Age of School, sample
40.0030.0020.0010.000.00
Age of School
5
4
3
2
1
0
Fre
qu
ency
Mean = 8.80Std. Dev. = 10.20675N = 10
Histogram

258
Graph 3: Total Number of Students in School, population
1400.001200.001000.00800.00600.00400.00200.000.00
Tot#Stud
20
15
10
5
0
Fre
qu
ency
Mean = 423.2712Std. Dev. = 284.79199N = 59

259
Graph 4: Total Number of Students in School, sample
1400.001200.001000.00800.00600.00400.00200.00
Tot#Stdnts
4
3
2
1
0
Fre
qu
ency
Mean = 649.20Std. Dev. = 338.38893N = 10

260
Graph 5: Number of Students taking the UNEB at a school, population
200.00150.00100.0050.000.00
UNEB#Std
14
12
10
8
6
4
2
0
Fre
qu
ency
Mean = 82.8644Std. Dev. = 40.69799N = 59

261
Graph 6: Number of Students taking the UNEB at a school, sample
160.00140.00120.00100.0080.0060.00
Tot#UNEBs
4
3
2
1
0
Fre
qu
ency
Mean = 93.30Std. Dev. = 29.69493N = 10

262
Graph 7: Percentage of Females in a school, population
1.000.800.600.400.200.00
PrctFemale
25
20
15
10
5
0
Fre
qu
ency
Mean = 0.5207Std. Dev. = 0.1599N = 54

263
Graph 8: Percentage of Females in a school, sample
100.0090.0080.0070.0060.0050.0040.00
PrctFemale
4
3
2
1
0
Fre
qu
ency
Mean = 55.6163Std. Dev. = 20.00037N = 7

264
Graph 9: Percentage of Boarding Students in a school, population
1.000.800.600.400.200.00
PrctBrdng
20
15
10
5
0
Fre
qu
ency
Mean = 0.4038Std. Dev. = 0.36276N = 57

265
Graph 10: Percentage of Boarding Students in a school, sample
100.0090.0080.0070.0060.0050.0040.00
PrctBrdng
5
4
3
2
1
0
Fre
qu
ency
Mean = 85.162Std. Dev. = 20.75107N = 8

266
Graph 11: Student Teacher Ratios, population
40.0030.0020.0010.000.00
StudTchrR
12
10
8
6
4
2
0
Fre
qu
ency
Mean = 19.8385Std. Dev. = 6.54683N = 56

267
Graph 12: Student Teacher Ratios, sample
40.0035.0030.0025.0020.0015.0010.00
StudTchrR
3.0
2.5
2.0
1.5
1.0
0.5
0.0
Fre
qu
ency
Mean = 22.8259Std. Dev. = 8.44073N = 9

268

269
Appendix F-3
Data Difficulties, Inconsistencies, and Explanations—Revenue Reports
A number of challenges were encountered in analyzing the revenue report database.
Those concerns that impact the analysis process or its outcomes are provided here along with
explanations of how each issue was resolved. A brief list of these items is found in
Chapter 4.
1. Inconsistency in titles used in financial statements. Different account or line item
titles are used for essentially the same thing. For example, some revenue reports use
the title “income” to mean “revenues.” Generally in the business world, “income” is
another title for “net profit.” The author found it necessary to standardize titles
before beginning the analysis.
2. Ambiguity in titles. Several titles, while they may make perfect sense to preparers
and those familiar with operations of the schools, are vague or unusual and leave the
author questioning their purpose or content. Examples are Administration, Holiday
Fees, Field Work, Staff Welfare, Gratuity, Domestic Materials, NSSF.
3. Summary data. Some schools’ revenue reports provided a great deal of detail in their
financial statements. Other schools presented their statements more in summary
form. In order to make comparisons between the schools, the author found it
necessary to identify the “greatest common denominator” between them and re-
classify each school’s financial statements accordingly. The following categories
were used for income statement re-statements. Appendix F-4 “Income Statement
Components from 10 Revenue Reports” provides details on the actual accounts
included in each of the expense categories.

270
A. Total Revenues
B. Expenses:
1) Salaries & Wages
2) Administration
3) Depreciation
4) Finance Charges
5) Other Expenses
6) Bad Debts (6 of the 10 schools identified this expense, so it
was kept as a separate line item. It is used in the overall
financial analysis of each school.)
7) Fixed Assets (may be referred to as Property, Plant &
Equipment
C. Net Income (or Net Profit). This is the calculated difference between
Total Revenues and the total of the six expense categories identified
above. This amount was verified with the revenue report figures.)
4. Inconsistencies in balance sheet presentations. Most businesses, worldwide, present
balance sheet information in the following categories and order:
A. Assets
1) Current Assets (listing cash first and continuing on in order of
liquidity)
2) Intangible Assets
3) Fixed Assets (may be referred to as Property, Plant &
Equipment

271
4) Total Assets
B. Liabilities + Owners’ Equity
1) Liabilities
a) Current Liabilities (listing of all liabilities due within
the next fiscal year)
b) Long-Term Liabilities (listing of liabilities due beyond
one fiscal year)
c) Total Liabilities
2) Owners’ Equity
a) Contributed Capital (owners’ cumulative contributions)
b) Earned Capital (cumulative earnings – cumulative
distributions to owners. (This is generally referred to
as “retained earnings”)
3) Total Liabilities + Owners’ Equity (this total must be equal to
Total Assets)
Several of the balance sheets in the revenue reports did not follow this format.
However, adequate information was given to allow the author to re-construct balance sheets
in the above format and calculate category subtotals so that comparisons could be easily
made among the schools and averages could be calculated.
5. Inconsistencies in owners’ equity presentation. Two of the schools combined
contributed capital with earned capital. It cannot be determined what portion of the
capital is contributed versus what portion has been retained from earnings of the

272
school. While this does not affect most calculations for financial analyses, it does
obliterate information that could have been useful. If a very small portion of the
capital is earned, the profitability of the entity may be questioned. A low balance in
retained earnings could, however, also be an indication that the entity is profitable,
but the owners chose to distribute the earnings back to the owners.
6. Technical difficulties. Two of the revenue reports contained financial statements that
did not foot and cross-foot. This means that there was an error in the financial
statement itself, perhaps an omission or a transposition error. The figures provided on
the statements simply did not add up. All figures were reviewed with a business
associate to determine if the author had mis-read the statements. The reason for the
errors could not be determined. The magnitude of each error was calculated. For
School # 2, the misstatement was extremely small, -0.00019 of 1% of total expenses,
so was attributed to “other expense” with virtually no effect on the analysis. For
Sschool # 6, two financial statements did not “foot.” The difference on the balance
sheet was miniscule and therefore inconsequential. The income statement was more
challenging. The revenue reports had been scanned in Uganda and transmitted via
email to the author, but several figures were too light to read with confidence.
Arrangements were made for the “original copies” obtained from the URA to be
hand-delivered to the author. Although many key figures were now legible, a few
still remained a mystery. The printing on the reports was extremely light and one key
figure was obliterated by a URA stamp. The author determined that as the totals on
the income statement were clear, they should be trusted. The “unexplained
difference” due to illegibility was classified as an “other expense” to balance this

273
statement. This unexplained difference was 5.6% of the total expenses. It does not
affect calculations that deal with revenues or net income. Its only effect, if misstated,
would be on percentages of expenses per the 6 expense categories outlined in #3
above. Furthermore, the “unexplained difference” was not for the target fiscal year,
but was contained in the prior year comparative data. Additionally, the depreciation
schedules (supporting calculations for depreciation expense which affects the income
statement and accumulated depreciation, a contra-account, which affects book value
of fixed assets) for 2 schools contain errors. One, School #5, simply does not foot or
cross-foot for the equipment category and totals. These erroneous figures were
carried on to the income statement and balance sheet. This misstatement is calculated
at .08 % or less than 1/10 of 1% of total FA. This is considered by the author to be an
immaterial misstatement, but it does draw attention to the fact that although these
revenue reports are largely audited, some do contain internal errors. The other, school
#4, has nonsensical data in its motor vehicles category. Accumulated depreciation,
by definition, cannot exceed historical cost of an asset. Yet on this schedule, the
accumulated depreciation is 18 times greater than the shown cost. These figures were
also carried forward into the formal financial statements.
7. Incomplete reports. A number of revenue reports did not contain complete financial
statements. While these elements may not have been necessary for the purposes of
the URA, they would be expected to be included in audited financial statements.
A. One of the 10 revenue reports lacked comparative data. Financial
statements were included for the filing year, but no data was
included from the prior year. While this is likely not a requirement

274
of the URA, it would have been helpful for analysis purposes. This
lack of comparative data meant that no horizontal (trend) analysis
could be performed for that school.
B. One of the 10 revenue reports lacked a balance sheet. It appears that
this was filed (according to the page numbers on the report
transmitted, two pages are unaccounted for), but was simply not
included in the revenue report that was provided to the researcher.
Inquiries were made, but no additional information could be
obtained. From the distance of half-way around the world, the
researcher was faced with the decision of whether or not to use the
rest of this revenue report or to exclude it entirely. As the data pool
for revenue reports was already extremely small, the researcher
determined that it would be beneficial to use the portion that was
complete.
C. Six revenue reports did not include cash flows statements. This was
less of a surprise because the cash flows statement has found
worldwide acceptance relatively recently and has been required by
many countries for only a decade or two. Additionally, it does not
impact the calculation of taxes, the primary purpose for revenue
reports. This lack of cash flows statements, however, greatly impacts
the ability to perform some of the analyses proposed in this project.
For example, any ratio that requires the inclusion of “cash flow from
operations” in its calculation can be performed only for the three

275
schools which identify “cash flow from operations.” The fourth cash
flows statement is formatted such that this figure is not specifically
identified and cannot be reliably calculated. The other 6 schools
have no cash flow data at all in their revenue reports.
8. Inconsistency in fiscal years. As previously stated, a fiscal year is generally a twelve
month period designated for financial reporting, ending on the same date each year.
Two challenges emerged when studying the revenue reports that relate to fiscal years.
A. One school provided reports based on a 16-month fiscal year. Income
statement data was prorated to re-state results as 12-month figures. Balance
sheet data was taken as presented as it is a snapshot of the financial makeup of
the entity at a particular point in time and does not measure activity for a
period of time as does an income statement.
B. Although the request was made for revenue reports with fiscal years ending as
close to June 30, 2003, as possible, the revenue reports actually obtained bear
fiscal year ending dates as follows. Revenue reports for three schools have
fiscal year ends in 2002; six in 2003 and one in 2004. This inconsistency
limits strict comparability, but does provide the best data that could be
obtained in this developing nation setting.

276

277
Appendix F-4
Income Statement Components from 10 Revenue Reports
The income statements from the 10 revenue reports were re-formatted and
summarized into categories that allowed for comparisons between schools.
The following categories were used for income statement re-statements. Actual
account titles included in each expense category are shown parenthetically.
1. Total Revenues
2. Expenses:
A. Salaries & Wages (includes such expenses as Salaries &
Wages, Staff Welfare, Directors’ Remunerations, and
Directors’ Allowances)
B. Administration (includes items such as Rent, Telephone,
Stationery, Consultancy, Insurance, License/Fees, Advertising,
Electricity, Office Expense, Printing, Postage, Firewood, Fuel-
Generator, Security, Town Council Rates, Audit Charges,
Examination, Seminars, Staff Accommodation, Computer
Repairs, Membership Fees, Email, Office Running, Publicity,
Heating & Lighting, Tuition & Examination Expenses, Staff
Training, Water, Legal Fees, Admission Expenses, UNEB
Marking Expenses, Water & Sewage, Seminars & Workshops,
Audit & Accountancy, Land Transfer Expenses)
C. Depreciation (Depreciation was usually included as
supplemental information in the revenue report. The totals
278
from that schedule were carried into the income statement. See
Appendix F-5, “Depreciation, Comparisons and Effects” for a
comparison of depreciation rates by school, discussion, and the
effect of depreciation on the net income of each school.)
D. Finance Charges (includes Bank Charges, Interest Paid on
Overdraft, Interest, Bank Charges & Commissions)
E. Other Expenses (this is a catch-all category which includes
Food, Medical, Sundry Expenses, Uniform, Entertainment &
Sports, Motor Vehicle Repairs, Maintenance & Repairs,
Transport & Travel, Games & Sports, Uniforms, Burial &
Condolences, Fumigation, Newspapers Magazines, Architect
Fees, Clubs & Seminars, Sanitation & Cleaning, Building
Renovations, Generator Repairs, Kitchen Repairs, Library
Costs, Food & Kitchen Requirements, Prizes, Cleaning
Materials, Education Trips, Teaching Aids, Traveling, Special
Allowances, General Expenses, Tools & Machinery Repairs &
Maintenance, Water System Repair, General Instruction
Materials & Fart, Bursary Awards, School Garden, Sports
Fluid Expense, Feeding Expenses, Co-Curricular Activities,
Motor Vehicle Running Expenses, Scholastic Materials,
Entertainment, Students Catering, Farm Expenses, Donations
& Subscriptions, Drama & Sports, Bed Repairs, Mowing
Machine-Write Off, Gratuity, Poultry, NSSF, Water Project)

279
F. Bad Debts (6 of the 10 schools identified this expense, so it
was kept as a separate line item. It is used in the overall
financial analysis of each school.)
3. Net Income (or Net Profit). This is the calculated difference between
Total Revenues and the total of the six expense categories identified
above. This amount was verified with the revenue report figures.

280

281
Appendix F-5
Depreciation, Comparisons, and Effects
Discussion of Depreciation in the 10 Revenue Reports
Depreciation rates vary considerably across the 10 sample schools. The notes to the
financial statements generally disclosed depreciation rates per category of assets. Where
disclosure was not made, depreciation expense for the year was compared with the
depreciable basis of the asset in question to calculate the rate of depreciation taken for that
asset group.
The following table, Table F-5.1, summarizes the method of depreciation used and
the rates of depreciation for each asset category. Generally accepted accounting principles
(GAAP) allow for several depreciation methods. Depreciation is shown as an expense on the
income statement.
Land is traditionally not considered to be a depreciable asset, unlike other long-term
or fixed assets, as it is not “used up” and has an indefinite life. There was inconsistency in
the application of depreciation to building. This is generally the single largest depreciation
item on an income statement. Not taking depreciation expense on a building would lower the
total expenses which (artificially) increases net income.
The few revenue reports that disclose tax calculations show that depreciation is added
back to the net income (loss) figure from the bottom line of the income statement in
determining a profit or loss for tax calculations. An adjustment is then made for “wear and
tear,” apparently an expense dictated in lieu of depreciation for Uganda Revenue Authority
tax purposes.
The following problems in calculations were noted in a review of depreciation schedules.

282
1. By definition, accumulated depreciation cannot exceed the historical cost of an asset.
However, in one instance the accumulated depreciation shown on the depreciation
schedule was 18 times the amount of the historical cost shown. This nonsensical data
is likely the result of a transfer error where a figure may have been correct on another
schedule or working paper that is not included in the revenue report, but was
transferred erroneously to this depreciation schedule. The problem is exacerbated by
its use in calculations that are then transferred to the income statement (misstated
depreciation expense) and to the balance sheet (misstated book values on fixed
assets).
2. Inconsistency in rates applied and asset categories. Although most of the Notes to the
financial statements disclosed depreciation rates per category, these were not always
the rates employed in the accompanying depreciation schedule calculations.
Occasionally an asset category identified in the Notes did not even exist in the
accompanying depreciation schedule. Conversely, at times, asset categories appeared
in the depreciation schedules that were not shown in the Notes.
Effect of Depreciation on Net Income in the 10 revenue report schools
Depreciation rates, as shown in Table F5.1, are not consistently applied across
schools. The following table addresses the question: “What if depreciation were eliminated
as an expense on the income statement; what would the effect be on net income?” This
would nullify the effect of inconsistently applied rates and methods of depreciation and may
allow for greater comparison of “untainted” income figures.

283
Table F5.1 Comparison of Depreciation Rates Methods and Rates per Asset Category % Depreciation Rates School # 1 2 3 4 5 6 7 8 9 10 Method RedBal StrtLine StrtLine StrtLine RedBal StrtLine StrtLine StrtLine RedBal StrtLine Land 0 0 0 0 0 0 Land/Bldg 0 4 4 Buildng 4 2.5 0 Equipment 12.5 20 12.5 20 20 12.5 20 Funishings 12.5 20 20 12.5 20 10 20 12.5 25-35 20 Computers 33.3 40 50 20 15 40 Vehicles 25 35 20 25 30 35 Generator 20 20 Water Tank 20 20 Water System 20 Roads&Compound 20 ElectricalSystem 20 Textbooks 20 15 CBD Books 0 Tools/Machinery 10 Office Equipment 10 Beds 20 RedBal=Reducing Balance Method of depreciation StrtLine=Straight Line Method of depreciation 7 used StrtLine; 3 used ReducingBalance 0=Present, but not depreciated CBD=reducing balance rate cannot be determined from information given. Approx 23.6% depreciation expense for this FY
Table F-5.2 shows what net income percentages would be if depreciation expense
were ignored, i.e., it is added back to the net income figure to negate its effect on the income
statement.
These figures are derived from the common size statements (they are expressed as
percentages of net revenues), therefore, they are comparable across schools. Bolded figures
highlight those schools whose comparative rankings would change if depreciation were
eliminated.

284
Table F5.2 Net Income as a Percentage of Net Revenues, Recalculated without the Effects of Depreciation School# Depr% NI% NI+Depr% Ranking PriorRnkng
1 6.600057 9.24928 15.84934 2 3 2 8.637312 -6.16189 2.475424 7 9 3 15.31357 9.550227 24.8638 1 1 4 2.464793 2.464684 4.929477 5 5 5 0 -2.1486 -2.1486 9 7 6 8.162513 -12.9932 -4.83071 10 10 7 3.139419 2.90844 6.047858 4 4 8 2.066751 1.825018 3.891769 6 6 9 4.366088 -2.87354 1.492548 8 8
10 3.915663 9.507656 13.42332 3 2 Average Net Income per Revenue Reports 1.299093 Average Net Income without Depreciation Expanse 6.599423
The “Average Net Income without Depreciation Expense” shows that if depreciation
were not considered as an expense on the revenue reports, net income would, on the average,
be 6.6 % of net revenues. Currently, with depreciation included as an expense on the
revenue reports, the average net income is calculated at 1.3% of net revenues.
It is interesting to note that School #3 had the highest depreciation as a percentage of
net revenues at 15.3%. However, it also had the highest net income %, even before
depreciation is added back.

285
Appendix F-6
Brief Explanation of Accounting and Financial Statements
The Accounting Equation
Accounting systems are based on a simple formula, known as the “accounting
equation”. This equation must always be kept in balance. Understanding this relationship
helps users of financial statements to explore relationships of various items contained in the
financial statements.
Assets = Liabilities + Owners’ Equity (capital)
Increases (or decreases) in assets must be accompanied by increases (or decreases) in
liabilities and/or increases (or decreases) in capital (also referred to as owners’ equity).
Balance sheets are constructed on this simple formula. Total assets are primarily an
accumulation of current assets—cash or those assets that may be consumed or converted to
cash within the next fiscal year—and fixed assets—land, buildings, equipment, etc. which
have a useful life greater than one fiscal year.
Assets may be obtained in three basic ways. Each will keep the accounting equation in
balance.
1. One asset may be exchanged for another. As one asset is increased, another is
decreased by the same amount. For example, cash is used to purchase land or
equipment.

286
2. Debt may be incurred to obtain an asset. As assets are increased, liabilities on the
other side of the equation are increased. For example, land may be obtained by
signing a financing agreement which requires future payment of assets.
3. Assets may be obtained through capital activities. For example, the owner may
contribute cash to the organization. The asset entitled “cash” would increase as
would the owner’s capital account.
Liabilities represent credit obtained, or debt owed. These are amounts due to be paid to
outside entities. Those liabilities that have due dates within the next fiscal year are referred to
as current liabilities. Long-term liabilities are those liabilities that have due dates beyond the
next fiscal year.
Owners’ Equity represents the owners’ interest in the assets of the organization. Using
simple algebra to manipulate the accounting equation, it is easy to see that owners’ equity is
a residual amount.
Owners’ Equity = Assets – Liabilities
Owners’ equity partly consists of amounts contributed to the organization by the
owners. This may be referred to by such titles as “capital”, “owners’ contributions,” or
“stock.” Another important component of owners’ equity is the cumulative amount of
earnings (often referred to as Retained Earnings) less payments that have been made to the
owners (known as distributions, dividends, or owner withdrawals). Therefore, owners’
equity is a combination of contributed capital and earned capital.

287
The Balance Sheet
The balance sheet lists all assets, liabilities, and owners’ equity accounts. The
accounting equation is the foundation for the balance sheet. Assets must equal the total of
liabilities and owners’ equity.
The Income Statement
An income statement contains information about revenues earned by the entity.
Expenses are subtracted from revenues to identify net income (or loss) for the fiscal period.
The Cash Flows Statement
A cash flows statement shows sources of cash flowing into the organization. It also
identifies the uses of cash for the period. Cash activities from operations are usually isolated
from cash activities derived from or used in investing or financing activities.

288

289
Appendix F-7
Summary of Horizontal Analysis—Balance Sheets and Income Statements
Table F7.1 Balance Sheet: Percent Change in Category (using prior year as the basis—denominator) Balance Sheet, by Category School # 1 2 3 4 5 6 7 8 9 10 %chng %chng %chng %chng %chng %chng %chng %chng
from 2002
from 2001
from 2002
2004 only
from 2002
from 2001
from 2002
from 2002 from 2002
Quick A -22.27 33.72 360.89 -- -33.32 -31.67 40.48 402.5 -81.85 No BS CA 126.6 23.43 360.89 -- -13.17 -37.74 20.42 402.5 -81.85 FA 80.96 0.165 45.287 -- 129.37 2.567 -0.17 10.549 52.75 Tot A 83.98 2.888 45.509 -- 122.56 1.511 1.618 15.075 43.048 CL 155.2 -0.049 118.33 -- 200.82 25.35 -8.17 325.07 226.74 LTL -- -- -- -- 146.66 -- -- 0 0 Tot L 155.2 -0.049 118.33 -- 158.15 25.35 -- 14.809 70.744 Cap 0 18.05 -- -- 0 3.296 5.746 0 0 RE 610.3 -37.47 -- -- -78.93 154.8 -- -9.146 37.996 TotOE 54.67 3.916 43.94 -- -28.29 -8.69 150.8 17.878 -6.924 TotL+OE 83.98 2.888 45.509 -- 122.56 1.511 1.618 15.075 43.048 Key to abbreviations used in Table F7.1: %chng = Percent change in this figure from the prior year, using the prior year as the denominator Quick A = Quick Assets CA = Current Assets FA = Fixed Assets Tot A = Total Assets CL = Current Liabilities LTL = Long-term Liabilities Tot L = Total Liabilities Cap = Capital (owners’ contributions or total capital if no retained earnings is identified) RE = Retained Earnings TotOE = Total Owners’ Equity TotL+OE = Total Liability + Owners’ Equity

290
Table F7.2 Income Statement: Percent Change in Category (using prior year as the basis—denominator) Income Statement, by Category School # 1 2 3 4 5 6 7 8 9 10 %chng %chng %chng %chng %chng %chng %chng %chng %chng
from 2002
from 2001
from 2002
2004 only
from 2002
from 2002
from 2002
from 2002
from 2002
from 2002
Net Rev 85.23 19.55 36.621 62.095 25.4 29.88 -12.07 29.815 15.7 1 S&W 89.19 50.93 32.951 34.454 14.4 25.82 26.414 22.33 36.14 2Admin 33.5 -1.443 91.602 84.888 167.2 0.013 -29.77 33.583 2.274 3Depr 89.12 82.98 20.941 -- 146.8 23.89 -7.091 0.4374 25.21 4Fin 183.3 43.61 58.443 168.86 116 443.2 138.64 19.485 17.76 5OtherExp 94.99 25.14 34.028 41.342 11.18 53.38 -20.9 28.398 2.685 6B/D 94.77 -- -- -- -41.73 -- -64.68 -- -- Total Exp 72.96 29.99 36.622 68.58 34.22 30.38 -12.97 25.708 16.03 NetInc 510.3 -411.8 0 -295.6 192.7 14.99 97.847 -40.17 12.63
Key to abbreviations in Table F7.2: Net Rev = Net Revenues 1S&W = Salaries and Wages Expenses 2Admin = Administrative Expenses 3Depr = Depreciation Expense 4Fin = Financial Expenses (Bank Charges, Interest Expense, etc.) 5OtherExp = Other Expenses (all others that were not included in the above 4 expense categories or Bad Debts) 6B/D = Bad Debts (uncollectible accounts receivable written during the fiscal year) Total Exp = Total Expenses NetInc = Net Income (Net Revenues – Total Expenses)

291
Appendix F-8
Horizontal Analysis—Industry Averages:
Percent Changes for Balance Sheets and Income Statements
Balance Sheet, by category Descriptive Statistics N Minimum Maximum Mean Std. Deviation QuickAssts 8 -81.85 402.50 83.5592 188.40482 CurrntAssts 8 -81.85 402.50 100.1387 184.12845 FixedAssts 8 -.17 129.37 40.1851 46.78897 TotAssts 8 1.51 122.56 39.5231 44.30545 CurrntLiabs 8 -8.17 325.07 130.4130 119.61316 LngTrmLiab 8 .00 146.66 18.3321 51.85105 TotLiabs 8 -8.17 158.15 66.7980 69.01835 Capital 8 .00 18.05 3.3862 6.30034 RetaindErng 8 -78.93 610.32 84.6926 223.03772 TotOwnrEqty 8 -28.29 150.77 28.4085 56.63787 TotLiabOEqt 8 1.51 122.56 39.5231 44.30545 Valid N (listwise)
8
Income Statement, by category Descriptive Statistics N Minimum Maximum Mean Std. Deviation NetRevenue 9 -12.07 85.23 32.4694 27.78130 SalWages 9 14.40 89.19 36.9592 22.09323 Admin 9 -29.77 167.24 42.4321 61.75141 Depr 8 -7.09 146.78 47.7831 53.18582 FinChrgs 9 -58.44 443.24 119.1621 145.54383 OtherExp 9 -20.90 94.99 30.0282 32.84927 BadDebt 3 -64.68 94.77 -3.8793 86.20051 TotExp 9 -12.97 72.96 33.5027 25.84745 NetIncome 9 -411.81 510.32 8.9968 265.84024 Valid N (listwise)
3

292

293
Appendix F-9
Common Size Balance Sheets, 2 Years for Each School
Table F9.1 Common Size Balance Sheets, 2 Years for Each School School # 1 2 3 4 5 %TotAssts-Common Size FYE 2003 2002 2002 2001 2003 2002 2004 NA 2003 2002 Quick A 2.79 6.61 7.73 5.95 0.22 0.07 0 1.22 4.08 CA 8.15 6.61 14 11.7 0.22 0.07 6.23 1.87 4.78 FA 91.9 93.4 86 88.3 99.8 99.9 93.8 98.1 95.2 Tot A 100 100 100 100 100 100 100 100 100 0 0 0 0 0 0 0 0 0 CL/TotL 100 100 100 100 100 100 100 24.7 21.2 LTL/TotL 0 0 0 0 0 0 0 75.3 78.8 Cap/OE 58.9 91 84.7 74.5 100 100 59.3 89.5 64.2 RE/OE 41.1 8.96 15.3 25.5 0 0 40.7 10.5 35.8 TotL/TotLOE 40.4 29.2 25.2 25.9 3.16 2.11 5.11 93.8 80.9 TotOE/TotLOE 59.6 70.8 74.8 74.1 96.8 97.9 94.9 6.15 19.1 Total L+OE 100 100 100 100 100 100 100 100 100 School # 6 7 8 9 10 %TotAssts-Common Size FYE 2002 2001 2003 2002 2002 2001 2003 2002 NA NA Quick A 1.3 1.93 6.06 4.38 5.04 1.15 0.91 7.21 CA 1.61 2.62 10.3 8.69 5.04 1.15 0.91 7.21 FA 98.4 97.4 89.7 91.3 95 98.8 99.1 92.8 Tot A 100 100 100 100 100 100 100 100 0 0 0 0 0 0 0 0 CL/TotL 100 100 100 100 16.9 4.56 59.7 31.2 LTL/TotL 0 0 0 0 83.1 95.4 40.3 68.8 Cap/OE 122 108 100 100 251 295 127 118
RE/OE -
22.1 -5.5 0 0 -151 -195 -27 118 TotL/TotLOE 37 30 26.8 29.7 91.1 91.3 76.8 64.3 TotOE/TotLOE 63 70 73.2 70.3 8.87 8.66 23.2 35.7 Total L+OE 100 100 0 0 100 100 100 100
Basis = % of total assets (or alternatively % of total liabilities + owners’ equity which yields exactly the same result, given the accounting equation) (See key on the next page.)

294
Key to abbreviations used in Table F9.1: FYE = Fiscal Year Ending Quick A = Quick Assets CA = Current Assets FA = Fixed Assets Tot A = Total Assets CL/TotL = Current Liabilities / Total Liabilities LTL/TotL = Long-term Liabilities / Total Liabilities Cap/OE = Capital (owners’ contributions) / Total Owners’ Equity RE/OE = Retained Earnings / Total Owners’ Equity TotL/TotLOE = Total Liabilities/ (Total Liabilities + Total Owners’ Equity) TotOE/TotLOE = Total Owners’ Equity/ (Total Liabilities + Total Owners’ Equity) Total L +OE = Total Liabilities + Total Owners’ Equity NA = School 10 revenue reports did not contain balance sheet information.

295
Appendix F-10
Common Size Income Statements, 2 Years for Each School
Table F10.1 Common Size Income Statements, 2 Years for Each School School # 1 2 3 4 5 %Net Rev's-Common Size FYE 2003 2002 2002 2001 2003 2002 2004 NA 2003 2002 Net Rev 100 100 100 100 100 100 100 100 100 1 S&W 18.16 17.78 39.67 31.42 28.83 31.36 38.2 19.25 23.21 2Admin 24.56 34.08 20.99 25.46 18.98 14.33 23.46 51.95 45.54 3Depr 6.6 6.465 8.637 5.643 15.31 18.31 2.465 0 0 4Fin 1.654 1.081 0.851 0.708 0.942 3.278 1.026 11.08 6.681 5OtherExp 38.83 36.88 36.01 34.4 26.38 28.47 26.93 19.87 22.79 6B/D 0.944 0.898 0 0 0 0 5.455 0 0 Total Exp 90.75 97.19 106.2 97.64 90.45 95.76 97.54 102.1 98.22 NetIncome 9.249 2.807 -6.16 2.362 9.55 4.245 2.465 -2.15 1.781 School # 6 7 8 9 10 %Net Rev's-Common Size FYE 2002 2001 2003 2002 2002 2001 2003 2002 2003 2002 Net Rev 100 100 100 100 100 100 100 100 100 100 1 S&W 21.87 23.98 30.91 31.9 28.87 20.08 19.92 21.14 39.24 33.35 2Admin 22.01 10.33 19.63 25.49 17.31 21.68 15.78 15.33 11.89 13.45 3Depr 8.163 4.148 3.139 3.291 2.067 1.956 4.366 5.643 3.916 3.618 4Fin 3.658 2.123 1.209 0.289 1.109 0.409 14.59 15.85 0.83 0.815 5OtherExp 56.93 64.21 42.2 35.74 48.24 53.63 47.74 48.27 34.62 39 6B/D 0.363 0.782 0 0 0.579 1.442 0.479 0 0 0 Total Exp 113 105.6 97.09 96.71 98.17 99.19 102.9 106.2 90.49 90.23 NetIncome -13 -5.47 2.908 3.285 1.825 0.811 -2.87 -6.23 9.508 9.766
Basis = % of Net Revenues Note: The underlying formula for an income statement is:
Net Revenues – Total Expenses = Net Income This formula holds true whether the income statement is expressed in actual monetary units, such as the Uganda schilling, or in percentages of net revenues, as shown in this table. (See key on next page.)

296
Key to abbreviations used in Table F10.1: %Net Rev-s = Percentage of Net Revenues FYE = Fiscal Year End Net Rev = Net Revenues 1S&W = Salaries and Wages Expenses 2Admin = Administrative Expenses 3Depr = Depreciation Expense 4Fin = Financial Expenses (Bank Charges, Interest Expense, etc.) 5OtherExp = Other Expenses (all others that were not included in the above 4 expense categories or Bad Debts) 6B/D = Bad Debts (uncollectible accounts receivable written during the fiscal year) Total Exp = Total Expenses NetIncome = Net Income (Net Revenues – Total Expenses)

297
Appendix F-11
Industry Averages—Common Size Statements Table F11.1 Industry Averages—Common Size Statements based on Balance Sheet Percentages % Total Assets Range Industry Averages Low Value High Value Quick A 3.334239 0 6.058105 CA 5.364229 0.070155 14.03642 FA 94.63577 85.96358 99.92984 Tot A 100 CL/TotL 74.01619 4.555699 100 LTL/TotL 25.98381 0 95.4443 Cap/OE 114.3154 58.86316 295.4692 RE/OE -6.14962 -195.469 40.74825 TotL/TotLOE 44.2894 2.108656 91.34469 TotOE/TotLOE 55.7106 8.655308 97.89134 TotL+OE 100
Note: In constructing common size balance sheets, all figures are expressed as a percentage of Total Assets. The accounting equation demands that Total Liabilites + Total Owners’ Equity must equal Total Assets. Key to abbreviations used in Table F11.1: Quick A = Quick Assets CA = Current Assets FA = Fixed Assets CL/TotL = Current Liabilities / Total Liabilities LTL/TotL = Long-term Liabilities / Total Liabilities RE/OE = Retained Earnings / Owners’ Equity TotL/ TotLOE = Total Liabilities / (Total Liabilities + Total Owners’ Equity) TotOC/TotLOE = Total Owners’ Equity / (Total Liabilities + Total Owners’ Equity) TotL+OE = Total Liabilities + Total Owners’ Equity

298
Table F11.2 Industry Averages—Common Size Statements based on Income Statement Percentages % Total Revenues Range Industry Averages Low Value High Value Net Rev 100 1 S&W 27.32 17.8 39.67297 2Admin 22.75 10.3 51.94629 3Depr 5.46 0 18.31379 4Fin 3.589 0.29 15.85216 5OtherExp 39.01 19.9 64.20562 6B/D 0.576 0 1.441876 Total Exp 98.71 NetInc 1.29 TotExp+NI 100
Note: In constructing common size income statements, all figures are expressed as a percentage of Net Revenues. The basic mathematical equation upon which the income statement is constructed is: Net Revenues – Total Expenses = Net Income. Key to abbreviations used in Table F11.1: Net Rev = Net Revenues 1S&W = Salaries and Wages Expenses 2Admin = Administrative Expenses 3Depr = Depreciation Expense 4Fin = Financial Expenses (Bank Charges, Interest Expense, etc.) 5OtherExp = Other Expenses (all others that were not included in the above 4 expense categories or Bad Debts) 6B/D = Bad Debts (uncollectible accounts receivable written during the fiscal year) Total Exp = Total Expenses NetInc = Net Income (Net Revenues – Total Expenses TotExp+NI = Total Expenses + Net Income (this Total is a check figure and must equal Net Revenues)

299
Appendix F-12
Ratio Analysis—Calculability & Modifications Necessary for LDC Setting
As noted in Chapter 3, ratios were identified that are commonly used for financial
statement ratio analysis in service oriented entities in the business world. Ratios that
specifically applied only to corporate forms of business were eliminated. The remaining
ratios, those that it appeared could be used to assess financial health of secondary schools in
Uganda, were presented in Appendix D. Research Question# 2 recognizes that when applied
to the actual data sets, it may be discovered that some of these ratios are easily calculated, but
others may be impossible or may require some modification. The following challenges were
encountered when applying the ratios presented in Appendix D.
1. The author discovered that not all elements necessary for calculation of a specific
ratio were included or specifically delineated in the revenue report financial
statements. Examples include “interest expense” and “tax expense.” Interest expense
for some of the schools appears to be included in “finance charges.” However,
finance charges may also include bank fees such as overdraft fees and other bank
charges, unrelated in the strict sense to actual interest. The author made the choice to
eliminate any ratios that require interest expense in their calculation
2. There is no distinction made in the revenue reports as to fixed charges versus variable
charges. While some of these may be logically classified according to the author’s
experience, without the specific classification of these charges by someone close to
the source (school financial administrator or auditor), the author determined that
ratios involving fixed or variable charges should not be performed.

300
3. Gross Profit is calculated as Net Sales – Cost of Goods Sold. This is a key figure for
business entities that manufacture, wholesale, or retail goods. It was initially thought
that this could not apply to service organizations such as schools. However, one of
the revenue reports does present its income statement in the format that identifies
gross profit. The titles of accounts led the author to assume that the “goods sold”
here refers to the direct costs, mainly food, of boarding operations. With only one
school reporting in this manner, all ratios involving cost of goods sold or gross
margin have been eliminated from the calculations performed in this study.
4. Current versus long-term liabilities (debt). Long-term liabilities were identified for
only three of the nine schools which had balance sheets. This is not a common
situation in more affluent countries where fixed assets are often financed by long-
term debt. In an LDC, it is likely that there is less access to long-term financing
option, such as mortgages. Given the small number of schools with long-term debt,
ratios that cover this can only be applied on a very limited basis. Despite the
relatively small number of schools that have long-term debt, these ratios will be left
in the mix for further discussion. In the author’s view, it is highly likely that as LDCs
advance financially, long-term debt will become more and more common and
therefore must be examined as a critical factor in financial statement analysis. Further
attention may be given to this in overall financial analysis for each school.
5. Solvency versus leverage. It appears that several of the formulas for leverage require
essentially the same elements as formulas given for solvency. Although the terms
used vary slightly, “a rose by a different name remains the same.” Solvency focuses

301
on the entity’s ability to meet its long-term obligations. Leverage is the use of debt to
secure productive assets (Albrecht et al., 2005) or compares debt to net worth.
As presented in Appendix D, the following ratios were found in the literature review.
Appendix D provides an explanation of each formula and citations. The formulas are
presented here in Tables F12.1 through F12.9 with brief discussions about whether or not
each formula can be calculated using the revenue report data. Modifications that must be
made in order to calculate the ratio are also noted.

302
Table F12.1 Profitability Ratios Ratio Formula Useable? Modifiable?
Percent Return on Net Sales
or
Profit Margin
Net Profit / Net Sales Revenue
or
Net Income / Sales
Useable without modification
Essentially these are the same calculation, but with different names on the ratio and its component parts.
Gross Profit to Net Sales Gross Profit / Net Sales Revenue
Unusable. Only 1 school presents data that could be used to calculate this.
Break Even Point (BEP) Total Operating Expenses / Average Gross Margin Percentage
Unusable. Schools do not consistently classify their expenses as operating or non-operating expenses. Also, no disclosure as to fixed or variable costs that are often associated with BEP calculations.
Margin of Safety (Current Sales level – BEP / Current Sales Level
Unusable. No BEP can be calculated.
Ratio of Administrative Expenses to Sales
Total General and Administrative Expenses / Gross Sales
Unusable as schools do not classify expenses according to general and administrative categories. Groupings could be assigned and calc’d by researcher, but this would be largely unreliable.
Return on Equity Net Income / Average Stockholders’ Equity
Usable if redefined as
Net Income/Average Owners’ Equity, which is essentially the same thing, but in a non-corporate form.

303
Table F12.2 Efficiency Ratios Ratio Formula Useable? Modifiable?
Return on Total Assets
or
Return on Assets (ROA)
or
ROA
(Net Income + (Interest Expense X (1-tax rate))) / Average Total Assets
or
(Net Income + After-tax Interest Cost) / Average Total Assets
or
EBIT / Ave. Tot Assets
Unusable. Cannot be calculated from the data given. Interest Expense & tax rates are not consistently disclosed in the revenue reports.
Total Asset Turnover
Sales/Total Average Assets
Unusable. Cannot be calculated from the data given. Interest Expense & tax rates are not consistently disclosed in the revenue reports.
Fixed Assets Turnover Sales / Ave. Fixed Assets Usable. Sales is equated to net revenues from the income statements; fixed assets is found on the balance sheets.
Average Collection Period
(Age of Receivables)
or
Ave. collection period
365 days / Accounts Receivable Turnover
or
Ave .AR /Ave. Cr sales per day
Unusable. This would be an instructive ratio, but credit sales (revenue) is not disclosed on any of the income statements or in the notes to the financial statements. The closest related figure would be the balance of accounts receivable which represents those amounts of credit sales that remain uncollected at the end of the fiscal year.

304
Table F12.2 (continued)
Ratio
Efficiency Ratios
Formula
Useable? Modifiable?
Payables Turnover
Total Purchases / Ending Accounts Payable Balance (RA)
or
Sales / Ave AP (W)
Unusable. Could be informative for boarding schools that consider purchases of food for boarders. One school does show this. The others do not.
Days AP Outstanding (R)
or
Average Number Days Payables Outstanding (W)
365/ AP Turnover Unusable. Not enough detail is provided in the revenue reports to calculate.
Ratio of Depreciation to Fixed Assets
Total Accumulated Depreciation / Total Gross Fixed Assets
Usable. All schools have fixed (depreciable) assets. 9 of the 10 revenue reports provide necessary data.
Working Capital Turnover Sales / Average Working Capital
Usable. Figures from both the income statement and the balance sheet are used.

305
Table F12.3 Liquidity Ratios Ratio Formula Useable? Modifiable?
Current Ratio
or
Working Capital Ratio (W)
Current Assets / Current Liabilities
Usable.
The name “current ratio” will be used in further discussions.
Quick (Acid Test) Ratio (Cash + Marketable Securities + Current Receivables) / Current Liabilities
Usable. However only 10 of the 17 balances sheets contained in the revenue reports have quick assets that differ from current assets.
Cash Ratio
or
Cash Ratio
(Cash + Short-Term Securities) / Current Liabilities
or
(Cash+ Marketable Securities) / Current Liab’s
Usable. None of the 10 revenue reports disclose short-term or marketable securities, so the numerator will be cash only
Defensive Interval 365 X (Cash + Marketable Securities + Accounts Receivable) / Projected Expenditures
Unusable. Projected expenditures are included for only 1 school.

306
Table F12.4 Solvency Ratios Ratio Formula Useable? Modifiable?
Long-Term Debt to Equity Total Long-Term Debt / Total Owners’ Equity
Usable
Long-Term Debt to Assets LT Debt / Total Assets Usable
Long-Term Debt to Tangible Assets
LT Debt / Total tangible Assets
Usable if Tangible Assets are defined as and equated to Net Fixed Assets
Capital Expenditure Ratio Cash from Operations (CFO) / Capital Expenditures
Unusable. Only 3 of the 10 revenue reports discloses CFO.
CFO to Debt Ratio CFO / Total Debit Unusable. Only 3 of the 10 revenue reports discloses CFO.
Table F12.5 Leverage Ratios Ratio Formula Useable? Modifiable?
Total Liabilities to Total Assets
Total Liabilities / Total Assets (W)
Usable.
Debt to Equity Total Debt/ Total Equity (W)
Usable
Debt to Equity Turnover Total Liabilities / Stockholders’ Equity
Usable. However, this is essentially the same calculation as the Debt to Equity ratio. Eliminate it.
Debt to Total Capital Total Debt (Current + Long-Term) / Total Capital (Owner’s Contributions + Retained Earnings)
Usable. Content is redundant with Debt to Equity ratio. Use that and eliminate this.

307
Table F12.6 Cash Flow Sufficiency Ratios Ratio Formula Significance
Cash Flow Adequacy Cash from Operations / (Long-Term Debt Paid + Funds from Assets Purchased + Dividends Paid)
Unusable. Cash from operations is available for only 3 of the 10 schools.
Long-Term Debt Repayment
Long-Term Debt Payments / Cash from Operations
Unusable. Cash from operations is available for only 3 of the 10 schools
Debt Coverage Total Debt / Cash from Operations
Unusable. Cash from operations is available for only 3 of the 10 schools
Cash to Working Capital (Cash + Short-Term Marketable Securities) / (Current Assets – Current Liabilities)
Usable. No short-term securities are disclosed in the revenue reports so cash will be the only component in the numerator.
Table F12.7 Cash Flow Efficiency Ratios Ratio Formula Significance
Cash Flow to Sales Cash Flow from Operations / Sales
Unusable. Cash from operations is available for only 3 of the 10 schools.
Cash Flow Return on Assets Cash Flow from Operations / Total Assets
Unusable. Cash from operations is available for only 3 of the 10 schools.
Cash Flow from Operations Cash Flow from Operations/Current Liabilities
Unusable. Cash from operations is available for only 3 of the 10 schools.
Fixed Charge Coverage Ratio (Cash Basis)
Adjusted Operating Cash Flow / Fixed Charges
Unusable. Cash from operations is available for only 3 of the 10 schools.
Times Interest Earned (Cash Basis)
Adjusted Operating Cash Flow / Interest Expense
Unusable. Cash from operations is available for only 3 of the 10 schools. In addition, interest expense is not clearly defined on most of the revenue reports.

308
Table F12.8 Interest Coverage Ratios Ratio Formula Significance
Times Interest Earned Earnings Before Interest & Taxes (EBIT) / Interest Expense
Unusable. Cannot be calculated from the data given. Interest expense & taxes are not consistently disclosed in the revenue reports.
Fixed Charge Coverage Earnings Before Fixed Charges and Taxes / Fixed Charges
Unusable. Cannot be calculated from the data given. Interest expense & taxes are not consistently disclosed in the revenue reports.
Table F12.9 Asset Mix Ratio Ratio Formula Significance
Asset Mix Ratio Buildings and Equipment / Total Assets
Usable if modified slightly. This may be calculated as Fixed Assets (essentially the same but could have slightly different contents)/Total Assets. This utilizes data from the balance sheets.
This activity, identifying those formulas that could actually be calculated based on the
data contained in the revenue reports of the 10 sample schools, shows that many of the
standard formulas that are used in financial statement analyses cannot be used with this
particular data set. The most pervasive problem lies not in the formulas themselves, but in
the fact that many of the components necessary for calculation are simply not available in the
majority of the revenue reports. Sixteen ratios were identified that could be calculated, some
with minor modifications, using the revenue report data.

309
In carefully analyzing these 16 ratios, matching the components of their formulas
with data available (assessing the relative magnitude or dearth of data), and then comparing
them to each other, the author identified three ratios that are somewhat redundant. These
three ratios were dropped from further analysis. A discussion of the three ratios follows.
1. Quick (Acid Test) Ratio [(Cash + Marketable Securities + Current
Receivables)/Current Liabilities)]. This liquidity ratio was found to be calculable.
However, of the 17 balance sheets available for analysis (two years’ worth of data for
eight schools plus one year for one other school; the tenth school had no balance
sheet data), 7 showed that those assets categorized as Quick Assets were identical to
the assets categorized as Current Assets. Careful analysis of the remaining balance
sheets’ composition showed that none of the schools had Marketable Securities and
there was very little difference between Current Assets, the numerator for the Current
Ratio, and the numerator for the Quick Ratio. The Quick Ratio and the Current Ratio
have the same denominator and essentially the same numeric numerators in this data
set. Therefore, the Current Ratio was used while the Quick Ratio was eliminated
from further analysis.
2. Debt to Equity Turnover (Total Liabilities/Stockholders’ Equity. The formula for this
ratio is essentially the same as the Debt to Equity ratio, so this ratio was eliminated
from further calculations.
3. Debt to Total Capital (Current Liabilities + Long-term Liabilities)/ (Owner’s
Contributions + Retained Earnings). This formula is also essentially the same as the
Debt to Equity ratio, so it was also eliminated from further calculations.

310
Thirteen ratios remain that can be calculated using the revenue reports from the 10
sample schools. These ratios, along with their formulas, are presented in Appendix F-13
“The 13 Viable Financial Ratios.”

311
Appendix F-13
The 13 Viable Financial Ratios
Thirty-eight financial ratios commonly used in business analysis were identified and
discussed in Appendix D. Appendix F-12 examined each of these 38 ratios in the context of
the revenue report data set to determine which could actually be calculated. Sixteen ratios
were identified as calculable. Further investigation led the author to eliminate 3 of the 16 on
the basis of relative redundancy. The remaining 13 ratios (along with their formulas) were
ultimately utilized in financial analysis for the 10 sample schools. The numeric results of
these calculations are presented in Appendix F-14 “Cross-sectional Analysis—13 Financial
Statement Ratios.”
1. Profitability Ratios
a. Profit Margin (Net Income/Net Total Revenues)
b. Return on Equity (Net Income/Average Owners’ Equity)
2. Efficiency Ratios
a. Fixed Asset Turnover (Net Total Revenues/Average Fixed Assets)
b. Ratio of Depreciation to Fixed Assets (Total Accumulated Depreciation/Total
Gross Fixed Assets)
c. Working Capital Turnover (Net Total Revenues/Average Working Capital)
3. Liquidity Ratios
a. Current Ratio (Current Assets/Current Liabilities)
b. Cash Ratio (Cash/Current Liabilities)

312
4. Solvency Ratios
a. Long-term Liabilities to Equity (Total Long-term Liabilities/Total Owners’
Equity) However, only 3 of the 10 schools actually have long-term debt. This
is very similar to the Debt to Equity leverage ratio.
b. Long-term Liabilities to Fixed Assets (Total Long-term Liabilities/Net Total
Fixed Assets) Only 3 of the 10 schools actually have long-term debt.
5. Leverage Ratios
a. Long-term Liabilities to Assets (Total Long-term Liabilities/Total Assets).
This ratio is similar to the solvency ratio titled Long-term Liabilities to Fixed
Assets. Again, only 3 of the 10 schools actually have long-term debt.
b. Debt to Equity (Total Liabilities/Total Owners’ Equity)
6. Cash Flow Sufficiency Ratios. Most cannot be calculated. Reliable data for Cash
from Operations is necessary for these calculations. This data is available for only 3
of the 10 schools. However, one ratio, Cash to Working Capital, does not require
Cash from Operations in its calculation. Rather, it utilizes Cash as identified on the
balance sheet. Each balance sheet in this sample lists Cash. Therefore, the Cash to
Working Capital ratio is utilized as a measure for cash flow sufficiency.
a. Cash to Working Capital (Cash/(Current Assets – Current Liabilities). Both
of these components come from the balance sheet, rather than the cash flows
statement.
7. Cash Flow Efficiency Ratios. None will be calculated. Reliable data for Cash from
Operations is necessary for these calculations. This data is available for only 3 of the
10 schools.

313
8. Interest Coverage Ratios. Will not be calculated. Interest expense is not clearly
delineated on the income statements in the revenue reports.
9. Asset Mix Ratio
a. The Asset Mix formula was slightly modified. It was calculated as Fixed
Assets/Total Assets.
In summary, of the 38 ratios presented in Appendix D, 16 ratios could be calculated
from the data in the revenue reports, some with slight modifications. Of these, the above 13
ratios were calculated for the most recent year of data. Prior year data was utilized in
calculating “average” amounts where indicated in the formulas. For example, Average Fixed
Assets, the denominator in the Fixed Assets Turnover ratio, is calculated as the sum of Fixed
Asset balance at the end of the most recent year plus the balance at the end of the prior year,
divided by 2.
Comparisons for ratio analysis were conducted only between schools, i.e., inter-
school rather than intra-school comparisons were made. This is referred to as “cross-
sectional analysis.” The results of these calculations, utilizing the 13 ratios identified above,
are presented in Appendix F-14, “Cross-sectional Ratio Analysis.”

314

315
Appendix F-14
Cross-sectional Analysis—13 Financial Statement Ratios
School PrftMrgn RetEquity FA t/o Depr/FA WC t/o
1 0.092493 0.42933 3.191954 0.200014 -10.2195 2 -0.06162 -0.09354 1.297265 0.185137 -8.91566 3 0.095502 0.045937 0.468607 0.179369 -18.1772 4 0.024647 0.025117 1.031248 0.167464 86.46751 5 -0.02149 -0.24718 1.202385 0.133781 -6.29756 6 -0.12993 -0.12802 0.669232 0.125622 -2.08622 7 0.029084 0.077697 1.523194 0.125254 -7.36225 8 0.01825 0.229388 1.138905 0.174253 -15.9146 9 -0.02874 -0.07173 0.732752 0.067469 -2.22749
10 0.095077 -- -- 0.130821 --
School CurrntRto CashRatio LTL/Eqty LTL/FA
1 0.201418 0.023058 0 0 2 0.557099 0.00973 0 0 3 0.070231 0.070231 0 0 4 1.218642 0.080765 0 0 5 0.080386 0.052698 11.48533 0.719868 6 0.043446 0.011284 0 0 7 0.384022 0.006856 0 0 8 0.327998 0.117007 8.545142 0.79785 9 0.019941 0.001679 1.333695 0.312301 10 -- -- -- --
School Liab/Assts Debt/Eqty Csh/WC AsstMix
1 0.404387 0.678943 -0.02887 0.918549 2 0.251956 0.336819 -0.02197 0.859636 3 0.03164 0.032674 -0.07554 0.997778 4 0.051148 0.053905 0.369394 0.937669 5 0.938492 15.25805 -0.0573 0.981346 6 0.370046 0.587418 -0.0118 0.983923 7 0.268031 0.366179 -0.01113 0.89707 8 0.911339 10.27888 -0.17412 0.949582 9 0.767979 3.309947 -0.00171 0.990857
10 -- -- -- -- Key: 1. PrftMrgn = Profit Margin 8. LTL/Eqty = Long-term Liabilities to Equity 2. RetEquity = Return on Equity 9. LTL/FA = Long-term Liabilities to Fixed Assets 3. FA t/o = Fixed Assets Turnover 10. Liab/Assets = Total Liabilities to Total Assets 4. Depr/FA = Ratio of Depreciation to Fixed Assets 11. Debt/Eqty = Total Liabilities to Total Equity 5. WC t/o = Working Capital Turnover 12. Csh/WC = Cash to Working Capital 6. CurrntRto = Current Ratio 13. AsstMix = Asset Mix 7. Cash Ratio = Cash Ratio Note: School 10 had no balance sheet information, therefore some ratios could not be calculated.

316

317
Appendix F-15
Ratio Analysis—Details of Seven Key Ratios
A profile is provided for each of the Seven Key Ratios. In addition to the eight
information items identified in Chapter 3 for each ratio, also included here are findings
regarding this ratio as it was used in the research project and comments about the findings.
Profit Margin
1. Name of ratio grouping: Profitability
2. Intent or function of this ratio grouping: Measure of operating success for a given
period of time
3. Name of specific ratio: Profit Margin; also known as Return on Net Sales
4. Formula for this ratio: Net Income/Net Revenue
5. Where the data for this ratio is found in the database: Income Statement
6. Use of this ratio: This ratio compares the profit (or loss) with the revenues. It is
the most common measure of profitability.
7. Meaning/Interpretation of the ratio: This ratio represents the portion of revenues
that was not consumed by expenses. It indicates the business/school’s “bottom line” as a
proportion of its revenues. This is the most traditional measure of profitability. A negative
value on this ratio indicates that the entity was not profitable for the fiscal year. A near zero
value would indicate a “break even” situation where net revenues are completely consumed
by expenses. This would indicate that it is impossible to finance future operations or
expansions via current earnings. Fiscal viability is, in part, dependent upon the entity having
a healthy, positive profit margin over many operating periods.

318
8. Expected range of the ratio: Although this may have a negative value, indicating
an operating loss for the period, it is expected that positive values would be indicated. While
there is no boundary for a lower limit, the value, by definition cannot exceed 1.0 on the high
end. This, though illogical, would indicate that all revenues were also profit; in other words,
this would be the profit margin if no expenses at all were present. A zero value would
indicate no income or loss.
9. Appropriateness of this ratio in LDC settings: This is a valuable and widely
accepted measure of profitability. A business entity cannot survive indefinitely if this ratio is
negative or very low.
10. Findings:
a. Range of ratio values found in this sample: -0.12993 to 0.0955
b. Industry average (mean), 10 schools, for this ratio: 0.0113
c. Standard deviation: .074
d. Significant correlation with other variables in the study: This ratio was
correlated at the .02 level with another key financial ratio, Return on Equity. This is an
expected structural correlation. The two ratios have an identical numerator, Net Income.
They are both included as key ratios as they pit this numerator against very different
denominators which come from different financial statements.
11. Discussion: The range indicates loss rates of approximately 13% to profit rates
of 10%. The industry average, .0113 indicates that these schools, as a whole, are not very
profitable at this point in time. The average net income is only 1.1% of net revenues. This is
an extremely low value compared to most other industries in the world. Taken by itself, this

319
indicates that secondary schools in this sample are not as profitable as they need to be to
ensure long-term fiscal viability.
Return on Equity
1. Name of ratio grouping: Profitability
2. Intent or function of this ratio grouping: Measure of operating success for a
given period of time
3. Name of specific ratio: Return on Equity
4. Formula for this ratio: Net Income/Total Owners’ Equity
5. Where the data for this ratio is found in the database: Net Income is the bottom
line on the Income Statement and Total Owners’ Equity is found on the Balance Sheet.
6. Use of this ratio: This ratio measures profitability as compared to the investment
the owners have made in the business/school. From an investment perspective, this may be
the most important ratio in financial statement analysis.
7. Meaning/Interpretation of the ratio: A negative figure here means that there was a
net loss for the period; the owners’ lost on their investment. A zero would indicate no loss,
no gain. A positive figure shows the magnitude of earnings in relationship to the owners’
investments. World-wide, it is generally the owners’ expectations of a positive return on
their investment that draws them into business. Sustained positive returns on investment are
vital to long-term viability of an organization. Few business owners could continue
indefinitely to sustain negative or low level returns on their investments.
8. Expected range of the ratio: There are no lower or upper boundaries on this ratio.
A 0 value would indicate no gain or loss and no return on investment for the period. A
negative value indicates a loss and a positive value results from net income for the period.

320
Negative returns are unacceptable in the long run. A profitable, financially healthy school
has a positive ratio. The higher the ratio, generally the greater the expectation of continued
operations.
9. Appropriateness of this ratio in LDC settings: This ratio is of critical importance
in LDC settings as it is in any industry. Long-term financial viability rests heavily on this
indicator. It directly impacts owners’ satisfaction with their investment and their perceptions
about the institution as a whole.
10. Findings:
a. Range of ratio values found in this sample: -0.247 to 0.4293
b. Industry average, 10 schools, for this ratio: 0.0297
c. Standard deviation: .20285
d. Significant correlation with other variables in the study: This ratio was
correlated at the .02 level with the financial ratio, Profit Margin. This is an expected
structural correlation. The two ratios have an identical numerator, Net Income. They are
both included as key ratios as they pit this numerator against very different denominators
which come from different financial statements.
11. Discussion: The range on this ratio indicated a great amount of dispersion. This
indicates that while the average return on owner’s equity is 3%, some owners experienced a
loss of 25% on their investment and one school earned 43% on their invested capital. This
great variability suggests that an investment in a secondary school in the Mukono District
may have considerable risk.

321
Current Ratio
1. Name of ratio grouping: Liquidity
2. Intent or function of this ratio grouping: Measures the ability of an organization
to meet its short-term obligations.
3. Name of specific ratio: Current Ratio (also known as the Working Capital Ratio)
4. Formula for this ratio: Current Assets / Current Liabilities
5. Where the data for this ratio is found in the database: The Assets section and
Liabilities section of the Balance Sheet found in the revenue report should contain this
specific data.
6. Use of this ratio: This ratio is used both internally and externally. It is one of the
most commonly used and widely recognized measures of short-term liquidity.
7. Meaning/Interpretation of the ratio: This ratio compares current assets with
current liabilities. The mathematical difference between these two components is known as
working capital. While working capital was not one of the financial ratios specified in this
model for financial assessment, this ratio uses working capital components. A ratio of greater
than 1.0 means that Current Assets exceed Current Liabilities, a positive indication that the
company is in a liquid position, i.e., it has liquid assets to meet its obligations as they become
due. The lower the ratio, the greater the concern that the entity may not be able to meet its
short-term financial obligations.
8. Expected range of the ratio: This depends on the “experience base” and can only
be established based on an analysis of data. However, theoretically, values for this ratio
could range from zero to a very large positive number. Normal ranges, however, would be

322
more in the realm of perhaps 0.5 to 5.0. An unlikely (and unhealthy) zero value would
indicate that the school has no cash or any other liquid assets.
9. Appropriateness of this ratio in LDC setting: This key ratio is extremely
appropriate, relevant, and useful in LDC settings. A low Current Ratio indicates potential
difficulties in meeting financial obligations. An extremely high ratio, on the other hand, may
indicate inefficiency or stockpiling of current assets or inefficient leveraging activities.
10. Findings:
a. Range of ratio values found in this sample: .019941 to 1.218642
b. Industry average, 10 schools, for this ratio: 0.3226
c. Standard deviation: 0.38214
d. Significant correlation with other variables in the study: The Current
Ratio showed significant correlations with the following variables:
(1) Size of school as expressed by total number of students: -.653
at the .028 significance level.
(2) Student/Teacher ratio: -.611 at the .05 significance level
(3) % Boarding Students: -.673 at the .03 significance level
11. Discussion: A current ratio of less than one means that the school does not have
enough current assets to cover its current liabilities. This short-fall may be due to timing. It
could be an indication of poor cash flow management. It may indicate that the school will
have to use some short-term financing measure like a pre-arranged line of credit with a bank
to secure the necessary cash to meet its obligations. This can become a deadly cycle of
borrowing to pay debt. The industry average indicates that schools, on the average, have
about three times as many current liabilities as they have current assets to pay off their

323
liabilities. The industry average ratio appears to be dreadfully low according to traditional
business finance. On an individual school basis, vertical analysis would show relative
magnitude of financing charges. Horizontal analysis of financing expenses would indicate
changes in the level of financing charges. Substantial increases may indicate that the school
has liquidity problems and needs to look for a more permanent financing solution. Without
other information which may refute the findings, the author suggests that all schools attempt
to bring their current ratios to a value of more than 1.0. This means that current assets should
exceed current liabilities. Currently, only one school meets this threshold.
Long-term Liabilities to Equity
1. Name of ratio grouping: Solvency
2. Intent or function of this ratio grouping: Indicates the entity’s ability to meet its
long-term debt obligations. This relates to long-term survivability or fiscal viability.
3. Name of specific ratio: Long-term Liabilities to Equity
4. Formula for this ratio: Total Long-term Liabilities/Total Owners’ Equity
5. Where the data for this ratio is found in the database: Both the numerator and the
denominator are found on the balance sheet.
6. Use of this ratio: This ratio is an expression of the school’s capitalization. It may
be used both internally by owners and externally by lending institutions.
7. Meaning/Interpretation of the ratio: Excessive debt may indicate potential
insolvency. The higher the ratio, the greater the debt risk.
8. Expected range of the ratio: The lower bound of this ratio is 0, an indication that
the school has no long-term debt. In this sample, two-thirds of the reporting schools have no
long-term debt, so their ratio is 0. There is no upper bound on this ratio.

324
9. Appropriateness of this ratio in LDC settings: This ratio is the “quick look” at the
school’s long-term financing strategy. A high ratio may be an indication that the school is
having difficulty attracting investment capital. It appears that this may be the case with the
all-female school in this sample. If true, there may be policy implications at the government
level. Globally, there is a great emphasis on gender equality and equal access to education.
A high long-term liabilities to equity ratio may indicate that there are forces at play that, in
essence, are undermining this goal.
10. Findings:
a. Range of ratio values found in this sample: 0 to 11.48533
b. Industry average, 10 schools, for this ratio: 2.3738
c. Standard deviation: 4.4158
d. Significant correlation with other variables in the study: There were
expected significant correlations between this ratio and two other ratios that have
similar elements in their numerators: Total Liabilities to Total Assets, and Total
Liabilities to Equity. In addition, an unusually high level of correlation, .959 at the
.000 significance level, was found between this variable and a contextual variable,
Percentage of Females. Additional discussion of this phenomena is found in
Chapter 5 under the heading “Highly Leveraged Female Schools.”
11. Discussion: Only three of the nine revenue reports that included a balance sheet
showed long-term liabilities. This indicates that three schools are financing their
acquisitions, and perhaps their operations, through debt. The higher the ratio, the more highly
leveraged the school and the greater the risk. The financial goal of a highly leveraged school
must be to successfully earn profits that cover the interest expense on the debt as well as to

325
generate a cash flow to cover those interest payments plus the debt repayment and still leave
enough to provide a reasonable rate of return on the owner’s capital. If this goal is not met,
the debt may be called in and the school could be forced to cease its operations. Depending
on the laws of the country of operation, the owners may be personally liable should the
school default on its debt obligations. Limited liability to the owners should not be taken for
granted in an LDC setting.
Total Liabilities to Total Assets
1. Name of ratio grouping: Leverage
2. Intent or function of this ratio grouping: Leverage ratios examine the
organization’s debt structure. These ratios examine the position and prominence of debt in
securing assets.
3. Name of specific ratio: Total Liabilities to Total Assets, often referred to as the
Debt Ratio.
4. Formula for this ratio: Total Liabilities/Total Assets
5. Where the data for this ratio is found in the database: Both elements of this ratio
are found on the Balance Sheet.
6. Use of this ratio: This ratio indicates the portion of assets that are financed by
debt. The debt may be viewed as a claim against the assets.
7. Meaning/Interpretation of the ratio: This ratio compares amounts owed to outside
parties with the value of the school’s assets. It shows the portion of assets financed through
debt and may therefore be referred to as a capitalization ratio. The higher the ratio, the
greater the potential financial risk. Horizontal analysis identifies changes over time and
trends in the financial status of a school. If the debt ratio increases over time, this may be an

326
indication of expansion. Alternatively, it could be an indication that the school is borrowing
to finance persistent losses.
8. Expected range of the ratio: This ratio is bounded on the lower end at 0, an
indication that the school has no debt at all. There cannot be a negative value for this ratio.
The upper bound it 1.0, an indication that all assets of the school are leveraged, and that there
is no owners’ equity at all. Both of these boundaries are unrealistic.
9. Appropriateness of this ratio in LDC settings: This ratio is of great use in an LDC
setting as it is a measure of risk. Schools with a high debt ratio may have to charge more for
their services in order to cover their financing charges and provide adequate cash flow to
service their debt.
10. Findings:
a. Range of ratio values found in this sample: .03164 to .938492
b. Industry average, 10 schools, for this ratio: .4439
c. Standard deviation: .34770
d. Significant correlation with other variables in the study: This ratio
positively correlates with the two other ratios that contain long-term liabilities in their
formulas. This structural correlation is expected.
11. Discussion: The industry average here is skewed somewhat because only three
schools had significant debt. Statistically it is correct. However, it is misleading. There is
only one school in the sample with a ratio within .25 of the calculated mean of .44. Ratio
values for the three schools are very high. Their ratio values of .77, .91, and .94 indicate that
these three schools are in a position of high risk. The higher this ratio, the greater the

327
financial risk that the debt cannot or will not be repaid. This is a matter of considerable
concern.
Total Liabilities to Equity
1. Name of ratio grouping: Leverage
2. Intent or function of this ratio grouping: Leverage ratios examine the
organization’s debt structure. These ratios examine the position and prominence of debt in
securing assets.
3. Name of specific ratio: Liabilities to Equity. Common name is Debt to Equity
Ratio.
4. Formula for this ratio: Total Liabilities/Total Equity
5. Where the data for this ratio is found in the database: Both elements of this ratio
are found on the Balance Sheet.
6. Use of this ratio: The ratio compares debt with equity (the two means of securing
or financing assets). It shows the relative position of each to the other.
7. Meaning/Interpretation of the ratio: From a creditor or lender’s perspective, this
ratio is a measurement of the lender’s protection. It is also an indication of financial risk
associated with the owner’s capital. The greater the liability as compared to capital, the
greater the interest expense that must be incurred and the greater the demands on cash flow to
pay the interest and to retire the debt. Interest can greatly affect earnings in a negative
manner. Lower earnings generally lead to a lower return on investment to the owners.
Therefore, a higher debt to equity ratio indicates a greater level of risk to the owners.
8. Expected range of the ratio: The lower bound for this ratio is zero. There cannot
be a negative value. A zero value would indicate the unlikely condition that the school has

328
no liabilities. This ratio has unlimited upper bounds. The higher the ratio, the greater the
financial risk.
9. Appropriateness of this ratio in LDC settings: This ratio is not only appropriate,
but critical in an LDC setting. It serves as a sort of “warning bell” for risk. A high Debt to
Equity ratio indicates that the school must earn adequate income as well as generate steady
cash flow to meet its debt obligations. It may also signal deeper concerns like poor
owner/investor commitment to the school.
10. Findings:
a. Range of ratio values found in this sample: 0 to 15.25805
b. Industry average, 10 schools, for this ratio: 3.44336
c. Standard deviation: 5.52684
d. Significant correlation with other variables in the study: As expected, this
ratio had high structural correlation with the two financial ratios that address long-term debt.
The schools in this sample had extremely small amounts of current liabilities compared with
their long-term liabilities. Therefore, long-term liabilities and total liabilities were very
closely related.
11. Discussion: The statistics look a little odd here. In the absence of negative
values, the standard deviation is larger than the mean value. This is a result of skewed data.
Six of the nine schools for which this ratio could be calculated had ratios of less than 0.68.
The three remaining schools had significant long-term liabilities which were respectively 3,
10, and 15 times as much as their equity. The concern here would be that 2 of these 3 schools
may be leveraged beyond their abilities to repay the debts. This is a risky situation. It
suggests that careful attention needs to be given to profitability, to cash flows, and to the

329
current ratio over the course of the life of the loans, so that debt obligations may be met as
they become due.
The reader may question the inclusion of two very similar ratios as key ratios: (a)
Long-term Liabilities to Equity, and (b) Total Liabilities to Equity. The denominators are
identical, the numerators could be very close in value. For the three highly leveraged schools
in this sample, these ratios are very similar. These two ratios, although similar, look at the
role of debt from different perspectives; one addresses the role of long-term debt, while the
other looks at overall debt. Both indicate risk.
Asset Mix
1. Name of ratio grouping: (This ratio is not included in a ratio grouping.)
2. Intent or function of this ratio grouping: (This ratio is not included in a ratio
grouping.)
3. Name of specific ratio: Asset Mix Ratio
4. Formula for this ratio: Fixed Assets/Total Assets
5. Where the data for this ratio is found in the database: This data is found on the
balance sheet.
6. Use of this ratio: This ratio compares non-current assets with total assets. This is
an indication of capital intensive asset structure.
7. Meaning/Interpretation of the ratio: This ratio shows what portion of the total
assets is tied up in fixed or productive assets. Fixed assets represent assets that are not
consumed or used up within a fiscal year. In this school setting, fixed assets may include
land, buildings, libraries and textbooks, computers, kitchen equipment, and beds. These

330
assets may also be referred to as Property, Plant, and Equipment. With the exception of land,
these are depreciable assets.
8. Expected range of the ratio: This ratio has a lower boundary of zero which would
indicate that there are no fixed assets in the school. The upper boundary is 1.0, an indication
that the school has only fixed assets. Neither of these extremes is practical for a school
setting. Schools are capital intensive. The author would expect these ratios to be in the 0.6
to 0.9 range.
9. Appropriateness of this ratio in LDC settings: This ratio is very appropriate for an
LDC setting. A high value indicates a commitment to long-term operations. Schools in LDC
settings, as elsewhere in the world, are capital intensive.
10. Findings:
a. Range of ratio values found in this sample: .88596 to .99085
b. Industry average, 10 schools, for this ratio: .9463
c. Standard deviation: .04752
d. Significant correlation with other variables in the study: Two correlations
of significance were found. First, there was a .659 correlation at the .03 significance
level with Percent of Boarding Students. This is logical. The more students that
board at a school, the greater the investment the school must have in fixed assets such
as dormitory buildings, sanitation and kitchen facilities, and eating and study areas.
Second, there was a .870 correlation at the .001 significance level with the Revenue
per Student variable. This is also a logical correlation. The greater the investment in
fixed assets, the higher the charges must be to cover costs.

331
11. Discussion: This appears to be a fixed asset intensive (or capital intensive)
industry. While there is an obvious necessity for great investment in fixed assets to run a
school, this industry average may be too high to be financially healthy. This indicates that on
the average, only about 5% of a school’s assets are current assets. As previously noted, the
current ratios for these schools appears to be extremely low. Without sufficient current
assets, schools are forced to borrow to meet expenses and debt commitments as they become
due. This practice significantly decreases the financial viability of any organization.

332

333
Appendix F-16
Seven Key Financial Ratios and Rankings
Descriptive Statistics for Seven Key Financial Ratios N Minimum Maximum Mean Stnd Dev Profitability: Profit Margin 10 -0.13 0.10 0.0113 0.07393 Profitability: Return on Equity 9 -0.25 0.43 0.0297 0.20285 Liquidity: Current Ratio 9 0.02 1.22 0.3226 0.38214 Solvency: Long-Term Liabilities/Equity 9 0.00 11.49 2.3738 4.41584 Leverage: Total Liabilities/Total Assets 9 0.03 0.94 0.4439 0.34770 Leverage: Total Liabilities/Total Equity 9 0.03 15.26 3.4336 5.52684 Asset Mix: Fixed Assets/Total Assets 9 0.86 1.00 0.9463 0.04752

334
Seven Key Financial Ratios by School with relative rankings 1.Profit Margin 2.Return on Equity 3.Current Ratio 4.LTLiabilities/Equity School Ratio Rank Ratio Rank Ratio Rank Ratio Rank 1 0.09249 3 0.429 1 0.2014 5 0 2 -0.0616 9 -0.094 7 0.5571 2 0 3 0.0955 1 0.046 4 0.0702 7 0 4 0.02465 5 0.025 5 1.2186 1 0 5 -0.0215 7 -0.247 9 0.0804 6 11.4853 1 6 -0.1299 10 -0.128 8 0.0434 8 0 7 0.02908 4 0.078 3 0.384 3 0 8 0.01825 6 0.229 2 0.328 4 8.54514 2 9 -0.0287 8 -0.072 6 0.0199 9 1.3337 3 10 0.09508 2 -- -- -- 5.Liabilities/Assets 6.Debt/Equity 7.Asset Mix School Ratio Rank Ratio Rank Ratio Rank 1 0.404 4 0.6789 4 0.9185 7 2 0.252 7 0.3368 7 0.8596 9 3 0.032 9 0.0327 9 0.9978 1 4 0.051 8 0.0539 8 0.9377 6 5 0.938 1 15.258 1 0.9813 4 6 0.37 5 0.5874 5 0.9839 3 7 0.268 6 0.3662 6 0.8971 8 8 0.911 2 10.279 2 0.9496 5 9 0.768 3 3.3099 3 0.9909 2 10 -- -- -- -- -- --

335
Appendix F-17
15 Variables, School Values, and School Rankings
School PrftMrgn Rank RetEquity Rank CurrntRto Rank LTL/Eqty Rank
1 0.092493 3 0.42933 1 0.201417963 5 0
2 -0.06162 9 -0.09354 7 0.55709903 2 0
3 0.095502 1 0.045937 4 0.070230768 7 0
4 0.024647 5 0.025117 5 1.218641741 1 0
5 -0.02149 7 -0.24718 8 0.080386 6 11.4853314 1
6 -0.12993 10 -0.12802 7 0.043446481 8 0
7 0.029084 4 0.077697 3 0.384021749 3 0
8 0.01825 6 0.229388 2 0.327998178 4 8.54514249 2
9 -0.02874 8 -0.07173 6 0.019940553 9 1.33369509 3
10 0.095077 2
Liab/Assts Rank Debt/Eqty Rank AsstMix Rank Rev/#totStd Rank
1 0.404387 4 0.678943 4 0.918549186 7 546724.714 8
2 0.251956 7 0.336819 8 0.859635831 9 487231.439 9
3 0.03164 9 0.032674 9 0.997777899 1 766696.484 5
4 0.051148 8 0.053905 6 0.937669205 6 669242.308 7
5 0.938492 1 15.25805 1 0.981346251 4 880468.197 2
6 0.370046 5 0.587418 5 0.983922799 3 804090.184 3
7 0.268031 6 0.366179 7 0.897070122 8 323413.248 10
8 0.911339 2 10.27888 2 0.949581729 5 728228.571 6
9 0.767979 3 3.309947 3 0.990856602 2 970584.861 1
10 766825.855 4
SchlAge Rank Tot#Studt Rank #StudUNEB Rank % Female Rank
1 2 9 700 4 103 5 42.8571429 7
2 14 2 431 8 67 8 54.5243619 2
3 2 9 254 9 67 8
4 5 6 208 10 68 7 44.7115385 6
5 3 8 1224 1 81 6
6 6 4 978 3 152 1 49.0797546 4
7 5 6 537 7 60 10 52.141527 3
8 9 3 560 5 113 3 100 1
9 6 4 1050 2 118 2 46 5
10 36 1 550 6 104 4
%Boarding Rank S/T Ratio Rank UNEB mean Rank
1 100 1 32.55814 8 4.58252427 9
2 42.69142 8 23.2973 6 4.70149254 8
3 16.93333 3 3.86567164 10
4 63.94231 7 11.88571 1 5.11764706 7
5 92.64706 5 37.66154 9 5.62962963 2
6 97.85276 3 28.34783 7 5.13157895 6
7 89.75791 6 18.51724 4 5.73333333 1
8 99.64286 2 16.23188 2 5.21238938 5
9 94.7619 4 5.58474576 3
10 20 5 5.46153846 4

336
Key to abbreviations used above: Seven Key Financial Ratios: PrftMrgn = Profit Margin RetEquity = Return on Equity CurrntRto = Current Ratio LTL/Eqty = Long-term Liabilities / Total Owners’ Equity Liab/Assts = Total Liabilities / Total Assets Debt/Eqty = Debt to Equity AsstMix = Asset Mix Six Contextual Variables: Rev/#totStud = Revenue per Student SchlAge = Age of School Tot#Studt = Number of Total Students #StudUNEB = Number of Students taking the UNEB exam at each school % Female = Percentage of students who are females %Boarding = Percentage of students who are boarding students S/T Ratio = Student to Teacher Ratio UNEB Variable: UNEB mean = mean UNEB score for students taking the exam at each school

337
Appendix F-18
UNEB scores—Comparisons between Sample and Population 1. Descriptive Statistics for 10 schools (sample)
N Minimum Maximum Mean Std. Deviation UNB10mean 10 3.87 5.73 5.1021 .57844 Valid N (listwise)
10
2. Descriptive Statistics for 59 schools (population)
N Minimum Maximum Mean Std. Deviation UNEB59mean 59 3.24 6.00 4.4335 .73809 Valid N (listwise)
59

338
3. Histogram showing the distribution of UNEB scores for 10 schools
6.005.505.004.504.003.50
UNEBmean
3.0
2.5
2.0
1.5
1.0
0.5
0.0
Fre
qu
ency
Mean = 5.1021Std. Dev. = 0.57844N = 10

339
4. Histogram showing the distribution of UNEB scores for 59 schools
6.005.505.004.504.003.503.00
UNEB59mean
12
10
8
6
4
2
0
Fre
qu
ency
Mean = 4.4335Std. Dev. = 0.73809N = 59
5. UNEB weighted average scores and rankings for the 10 revenue report schools WtdAve Ranking
1 4.582524 9 2 4.701493 8 3 3.865672 10 4 5.117647 7 5 5.62963 2 6 5.131579 6 7 5.733333 1 8 5.212389 5 9 5.584746 3
10 5.461538 4 Mean 5.1021

340
6. Observations and comments regarding UNEB score distributions, means, and rankings
follow:
a. The descriptive statistics show that the mean for the 10 school sample is higher
than the mean for the entire population of 59 UNEB schools by .6686 (5.1021 – 4.4335).
The standard deviation, a measure of variability, is also larger for the 10 school sample. This
is likely a result of a small and skewed sample.
b. The histogram graphs show that not only is the mean for the 10 school sample
higher, but its distribution is also skewed with one low outlier school.
c. Only 1 of the 10 schools has a UNEB mean score that is lower (3.865672) than the
population mean of 4.4335. The other nine schools lie in the top one-half of the population
distribution. In fact, 5 from the sample are in the top 10 of the population and 9 are in the top
21 of 59 scores. The tenth school is an outlier at the low end, ranking number 47 of 59.
d. The above observations indicate that overall, schools in the sample population
produce better UNEB test results than the population at large.
e. Rankings were used in overall analysis to assess the relative position of each
school for this quality proxy variable.

341
Appendix F-19
Correlations between UNEB Means, Financial Ratios, and Contextual Variables
Bivariate Pearson correlation statistics were calculated using SPSS software. A total of
15 variables were included in the correlation statistics: 7 key financial ratios, 1 other
financial ratio, 6 contextual ratios, and the UNEB mean scores. A one-tailed correlation
statistic yielded 22 relationships at the .05 significance level. These correlations are
discussed by category.
1. UNEB means with financial variables. These correlations directly address Research
Question #3. Only one was significant: UNEB mean and Total Liabilities/Total
Assets at .574.
2. UNEB means with contextual variables. One correlation of significance fell into this
category. UNEB mean and Total # students at .530.
3. Financial variables with financial variables. High correlations in this category
generally indicate that there is a structural correlation. Investigation of these
correlations reveals that there is generally a common factor in the calculation of the
ratio. Typically the numerator of the two ratios is identical or closely related or the
denominator of the two ratios is identical or closely related.
a. Return on Equity and Profit Margin; .689 correlation, significance level .020
(structural correlation: same numerator).
b. Total Liabilities/Equity and Total Long-term Liabilities/Equity; .994
correlation at .000 significance level (structural correlation: denominators are
identical; numerators are closely related as most schools have relatively few

342
current liabilities. Both ratios are retained because the first is a common
measure of leverage, and the second is a common measure of solvency.)
c. Total Liabilities/Total Assets and Long-Term Liability/Equity; .823
correlation at .003 significance level (structural correlation: numerators are
closely related as most schools have relatively few current liabilities).
d. Total Liabilities/Assets and Total Liabilities/Equity; .858 correlation at the
.002 significance level (structural correlation: numerators are identical and
denominators, assets, and equity, must have a mathematical relationship given
the accounting equation.
e. Asset Mix and Revenue per Student; .870 correlation at the .001 significance
level (high correlation, but non-structural; suggests further exploration of the
relationship).
4. Contextual variables with contextual variables. While these correlations revealed
several interesting and statistically significant correlations, these are beyond the scope
of this study. They will be identified but will not be explored in depth.
a. Total Number of Students and Number of UNEB Students; .562 correlation at
.045 significance level (structural correlation. The larger the school, the
greater potential for more students to sit for the UNEBs).
b. Total Number of Students and Student/Teacher Ratio; .873 correlation at .001
significance level. (This correlation actually has a negative connotation. This
means that the larger the school, the poorer or higher the Student/Teacher
ratio, i.e., more students for every teacher.)
343
c. Total Number of Students and Percent Boarding Students; .596 correlation at
the .05 level (The larger the school, the greater the percentage of students that
have boarding status.)
d. Number of UNEB Students and Percent Boarding Students; .610 correlation at
the .05 level. (Total Number of Students correlates with Number of UNEB
students as seen above. It is reasonable that they both correlate with %
boarding status.)
e. Age of school and Percent Boarding Students; .660 correlation at the .037
significance level (Newer schools are more likely to have boarding students.)
5. Financial variables with contextual variables. These are of great interest and merit
further exploration.
a. Current Ratio and Total Number of Students; -.653 correlation at .028
significance level.
b. Current Ratio and Student/Teacher Ratio; -.611 correlation at .05 level.
c. Current Ratio and Percent Boarding Students; -.673 correlation at .034
significance level.
d. Long-term Liabilities/Equity and Percent Females; .959 correlation at the
.000significance level.
e. Total Liabilities/Total Assets and Total Number of Students; .749 correlation
at the .010 significance level.
f. Total Liabilities/Total Assets and Percent Females; .652 correlation at the .05
level.

344
g. Total Liabilities/Equity and Total Number of Students; .565 correlation at the
.05 level.
h. Total Liabilities/Equity and Percent Females; .919 correlation at the .002
significance level.
i. Asset Mix and Percent Boarding Students; .659 correlation at the .038
significance level.
j. Revenue per Student and Number of UNEB students at a school; .532
correlation at the .05. level.(marginal correlation, no obvious explanation).

345
APPENDIX G
EXAMPLE OF COMPREHENSIVE FINANCIAL ANALYSIS: SCHOOL Y

346

347
APPENDIX G
TABLE OF CONTENTS
Choosing School Y ..............................................................................................349 Executive Summary of Comprehensive Financial Analysis of School Y ...........350 The Analysis Process ................................................................................351 Vertical Analysis of the Individual School...............................................357 Common Size Statements .........................................................................357 Horizontal Analysis ..................................................................................360 Other Elements for Analyses as Dictated by the Setting ..........................363 Further Description of School Y..........................................................................367 Findings and Commentary...................................................................................369 Conclusion ...........................................................................................................369
LIST OF TABLES
Table 5.1 (Reproduced from Chapter 5) Model for Financial Assessment Using Business Analysis Tools...........................................................352 Table G1: Ratio Analysis of the Individual School and Cross-sectional Analysis..............................................................................................352 Table G2: Supplemental Ratio Analysis of the Individual School and Cross-sectional Analysis....................................................................355 Table G3: Vertical Analysis of Income Statement .............................................358 Table G4: Balance Sheet, School Y....................................................................359 Table G5: Income Statement, School Y .............................................................360 Table G6: Horizontal Analysis by Common Category, School Y, Balance Sheet, Percentage Changes, Fiscal Year 2002 to 2003 ........361 Table G7: Horizontal Analysis by Common Category, School Y, Income Statement, Percentage Changes, Fiscal Year 2002 to 2003..363 Table G8: Revenue per Student ..........................................................................364 Table G9: UNEB Mean Scores, School Y in the Sample of 10 Schools............365 Table G10: UNEB Mean Scores, School Y in the Population of 59 UNEB Schools.............................................................................................365 Table G11: Six Contextual Elements Identified in This Study ...........................366

348

349
Appendix G
Example of Comprehensive Financial Analysis: School Y
Choosing School Y
Analysis of a single school from the sample is provided as an example of how the
financial analysis model identified in this research can be of benefit to an individual school.
School Y was chosen for the following reasons.
1. The auditor’s statement gives a clean opinion on the financial statements of this
school. Furthermore, this is the same auditor that prepared 2 other revenue reports of
the 10 used in this study. This is an indication that the auditor is familiar with
secondary schools in the Mukono District of Uganda. While a clean audit opinion
does not guarantee accuracy of the statements, it does give the reader reasonable
comfort in knowing that professionals have examined the statements and the
underlying accounting records of the school.
2. The revenue report for this school did not contain obvious errors, such as addition
errors.
3. The revenue report for this school is presented in a straight-forward manner and is
less ambiguous and confusing than other schools.
4. The financial rankings of this school generally were at middle-range, suggesting that
this may be a “typical” school.
5. Contextual rankings of this school are mostly at middle-range, but also include some
outliers which suggest that there may be areas of interest for further investigation.

350
Executive Summary of Comprehensive Financial Analysis of School Y
An analysis of School Y was performed using a model for assessment of financial
position developed for private secondary schools in the Mukono District of Uganda. School
Y has been compared to industry averages. Financial data was obtained from the 2003
revenue report filed with the Uganda Revenue Authority. Contextual data was obtained via a
2003 resources survey conducted through Brigham Young University. UNEB scores were
obtained from the MOES. A full report of findings is available. This executive summary
covers only those items of greatest importance.
Analyses using seven key financial statement ratios and six supplemental ratios show
that School Y is generally a mid-range financial performer. Two areas are noteworthy. First,
cash and current assets appear to be marginally sufficient to meet liabilities. In comparison
to the prior year, finance charges from short-term borrowing were greatly increased.
Attention should be given to better cash flow management. Second, School Y has no long-
term debt and therefore finances its assets primarily through owners’ capital. This fiscally
conservative policy, if maintained, leaves School Y in a favorable position regarding its long-
term financial viability. With no long-term debt, it does not have to worry about large loan
repayment requirements. However, if the school were to fall into difficult times financially,
the question must be addressed as to whether or not all partners could or would step up to
meet the school’s financial commitments.
Two other factors combine to make a striking scenario. School Y has the lowest
revenue per student of any school in the sample. It also has the highest UNEB scores in the
sample. School Y, therefore, appears to be the best educational buy in the District. This is a
noteworthy accomplishment, especially in light of the fact that the school is only five years

351
old. It would be important, however, to ascertain that all costs, fixed and variable, direct and
indirect, are being covered by the amounts charged to students. Long-term fiscal viability
dictates that all costs must be covered. The suggestion is made that a thorough investigation
be made of the pricing structure for student tuition, fees, and other charges so that the school
does not put itself in a difficult future financial position. Also, practices associated with
UNEB testing merit further investigation. Survey data indicates that School Y sent 16 of its
own students to other schools for O-level testing in 2003 while examining 50 students on its
own premises. Were the poorest students sent elsewhere? Is the UNEB score, therefore, an
unrealistic measure of quality of education offered by School Y?
Overall, School Y appears to be in a solid financial position currently. Its status as
“best educational value” will support its overall viability in this demand-driven market.
Sound financial practices, particularly in the area of cash management, are needed to sustain
its long-term fiscal viability.
The Analysis Process
Analysis of School Y was performed using the financial assessment model presented
in Chapter 5, Table 5.1. This table is reprinted here for the reader’s reference ease.
Ratio Analysis and Cross-sectional Analysis
The analysis of School Y was performed in the order suggested by the financial
assessment model. However, the first two operations, ratio analysis of the individual school
and cross-sectional analysis, which compares individual school ratios to industry standards
and other schools within the industry (shown as rankings), are presented side by side in Table
G.1 for the reader’s convenience. Interpretation and comments follow the statistical data.

352
Table 5.1 Model for Financial Assessment Using Business Analysis Tools Analysis Tool Application
1. Ratio analysis of the a. Calculate and study the results of the seven key ratios.
individual schools b. Other financial ratios may be explored if necessary.
2. Cross-sectional analysis a. Compare ratios between schools.
using the ratios of the b. Industry average ratios may be calculated.
individual schools
3. Vertical analysis of the a. Calculate financial statement components’ relative
individual schools percentages.
c. Investigate internal aberrations.
4. Common size statements a. Common categories may be developed for financial
statement summaries and comparisons with other
schools.
e. Industry average percentages may be calculated.
5. Horizontal analysis of a. Calculate activity level changes between fiscal years.
individual schools b. Investigate internal trends.
f. Comparisons may be made between schools.
g. Industry averages may be calculated.
6. Other financial analyses as
dictated by the setting

353
Table G.1 Ratio Analysis of the Individual School and Cross-sectional Analysis
School Y Ranking Industry Average
1 Profit Margin 0.0290844 4 of 10 0.011328249
2 Return on Equity 0.0776973 3 of 9 0.029666736
3 Current Ratio 0.3840217 3 of 9 0.322575829
4 Long-term Liabilities to Equity 0 4 of 4 2.373796555
5 Total Liabilities to Total Assets 0.2680314 6 of 9 0.443890786
6 Total Liabilities to Total Equity 0.3661788 7 of 9 3.433645263
7 Asset Mix 0.8970701 8 of 9 0.946267736
The following comments are offered on findings of the ratio and cross-sectional analysis.
1. Profit Margin. This indicates that the school has net income of about 3% of net
revenues. Positive income and a ranking of 4 out of 10, indicate that this school is
doing fairly well compared to the other schools. A high figure is desirable with this
ratio.
2. Return on Equity. A return of almost 8% on owner’s equity is respectable, even in a
global setting. Many investors would be pleased to receive an 8% annual return on
their investments, especially if this return could be sustained over a long period of
time. A high figure is desirable for this ratio.
3. Current Ratio. A current ratio of less than 1.0 indicates that the current liabilities
exceed current assets. This is referred to as negative working capital and is often a
cause for concern in a global context. Negative working capital indicates that the
entity may be in a scramble to come up with liquid assets to meet their obligations. In

354
comparison to the other schools in this study, this is one of the better/higher current
ratios, 3rd of 9 ranked schools. The author is concerned that although this value looks
“normal” for this sample, it is likely that almost every school in the sample is faced
with a challenge. Only one school had positive working capital. Working capital, as
measured by the current ratio, could be an area of near-universal financial concern for
secondary schools in the Mukono District. A high figure is desirable for this ratio.
4. Long-term Liabilities to Equity. This school has no long-term debt. Therefore, this
ratio is zero. Only three schools in the sample have long-term debt. School Y is in a
very positive solvency position. Survey responses indicate that the school has had
limited debt in the past, but it has been retired. A low figure is desirable for this ratio.
5. Total Liabilities to Total Assets. This relatively low ranking, 6th of 9, indicates that
this school has less debt, comparatively, than most schools in the District. Liabilities
represent claims against assets. Therefore, another way to view this ratio is that 27%
of the assets are leveraged. This relatively low figure indicates that the school is not
at great risk for default on debt. It may be a reflection of risk-averse owners. A low
ratio is desirable for this ratio.
6. Total Liabilities to Total Equity. If this ratio were inverted, it would show that equity
is approximately three times as large as the debt. This figure, 0.366179, is
substantially lower than the industry average of 3.4336. From a risk perspective, this
is a very good position to be in. This indicates that this school is able to finance its
assets and operations, for the most part, via owner financing. A low ratio is desirable
for this ratio.

355
7. Asset Mix. Percentage-wise, this school has fewer assets tied up in fixed assets (land,
buildings, etc.) than most other schools in the sample. The presumption is that this
leaves the school with more “working capital assets.” The industry average indicates
that about 95% of most school’s assets are in fixed assets. This lack of liquid assets is
actually a concern for the industry. This school seems to be in a better position than
most of the other schools.
The second suggested step in ratio analysis is the exploration of supplemental ratios. As
an illustration of possible ratios that could be included in this phase of the analysis, six other
financial ratios were calculated for School Y. The results of these calculations are shown in
Table G.2. Following the table, a discussion is provided for each of the six ratios.
Table G.2 Supplemental Ratio Analysis of the Individual School and Cross-sectional Analysis
School Y Ranking Industry Average
1 Fixed Asset Turnover 1.5231942 3 of 9 1.25061592 2 Depreciation Expense to Fixed Assets 0.1252541 2 of 10 0.148918529 3 Working Capital Turnover -7.362247 5 of 9 1.696336267 4 Cash Ratio 0.0068559 8 of 9 0.041478561 5 Long-term Liabilities to Fixed Assets 0 4 of 4 0.203335456 6 Cash Flow Sufficiency -0.01113 3 of 9 -0.001449377
1. Fixed Asset Turnover. This ratio compares revenues with fixed assets. It measures
the efficiency of the long-term capital investment (fixed asset investment). The
higher the ratio, the more efficiently the assets are being used. The numeric value
suggests that the revenues are about one and one-half times the value of the fixed
assets. The ranking of third out of the nine schools for which this ratio was
calculated, suggests that this is a better performance than most.

356
2. Depreciation to Fixed Assets. This efficiency ratio is calculated as total accumulated
depreciation to total gross fixed assets. It represents that portion of the fixed assets
that has been “used up.” A ranking of second of ten could be a concern, indicating
that the assets of this school may be old as compared to other schools in the sample.
However, it is important to remember that most of the schools in this sample are very
new/young schools. This particular school was established in 1998; it was only five
years old in 2003, the data collection year. A ratio of 0.125254 would indicate, by
extrapolation, that approximately 1/8 of the original cost of the fixed assets has been
used up in five years. Hence, the fixed assets should have about 35 years of useful
life left. This is not a precise analysis, but rather a rough estimate as indicated by the
numbers.
3. Working Capital Turnover. This ratio is a measure of efficiency. It compares
revenues with average working capital. The numbers shown are actually
meaningless. The negative sign comes from the fact that the school has negative
working capital. Its current liabilities exceed its current assets. This is an uncommon
situation in most industries. However, 9 of the 10 schools in this sample showed
negative working capital. This is seen as a very unhealthy situation for these nine
schools.
4. Cash Ratio. This is a liquidity ratio that compares cash and short-term securities (if
any) to current liabilities. In this setting, cash is the most prevalent of the current
assets, so for most of the schools in the sample, this figure is closely related to the
current ratio. However, in this school, the cash ratio is very tiny, suggesting that cash
availability could be a grave concern.

357
5. Long-term liabilities to fixed assets. This school does not have long-term liabilities.
This ratio, 4th of 4, matches this school with the other non-leveraged schools.
6. Cash flow sufficiency. This ratio compares cash to working capital. Both the
school’s position on the ratio and the industry as a whole seem to be extremely low.
Cash management could be a critical issue.
Vertical Analysis of the Individual School
A vertical analysis of the income statement for School Y is shown in Table G.3. In
vertical analysis, all figures on an income statement are expressed as a percentage of
revenues, which in this case is titled “school fees.” The largest expense category for this
school is salaries and wages at almost 30% of revenues. This appears to be reasonable, but
will be compared with the industry average in the common size statement phase of analysis.
The majority of students at this school are boarding students (482 of 537 students or
90%), so it is not unexpected that foodstuffs are the second largest expense category at 19%.
The remainder of expenses range from 6% for exam expenses down to .05 of 1% for burial
and condolences, none of which appears to be of particular concern. Total expenses claimed
97.1% of revenues, leaving a profit equal to 2.9% of revenues. There is nothing on this
vertical analysis of School Y that would alert the analyst to aberrations or financial
difficulties.
Common Size Statements
For purposes of comparison, percentage figures from individual schools are combined
into categories common to all schools in the industry. The individual school is then
compared with the industry average. Comparative figures are presented in Table G.4 for the
balance sheet of School Y.

358
Table G.3 Vertical Analysis of Income Statement, School Y Percent of Revenues Income School Fees 100 Expenses Food Stuffs 19.38244 Stationery & Printing 2.570263 Uniforms 3.441527 Burial & Condolences 0.048079 Transport & Travel 7.71479 Fire Wood 2.246176 Salaries & Wages 29.65955 Water 1.342754 General Repairs/Maint 0.83997 Staff Accommodations 1.387666 Games & Sports 1.137195 Students Med Expenses 2.841894 Electricity 1.779149 Entertainment 0.088903 Cleaning & Sanitation 1.101093 Staff Welfare 1.247172 Clubs & Seminars 0.882636 Exam Expenses 6.255495 Phone & Postage 0.527428 Lighting 0.405302 Security 1.112436 Advertising 1.429526 Compound Maintenance 0.830872 Bank Charges 1.209067 Audit Charges 0.575795 Repairs & Renovations 2.756158 Church Expenses 0.085506 Practical Materials 1.053302 Depreciation—Fixed Assets 3.139419 Total Expenses 97.09156 Profit/Loss 2.90844

359
Table G.4 Balance Sheet, School Y (All figures are expressed as a percentage of Total Assets.)
2003 Industry Averages
Quick Assets 6.058105 3.334239 Current Assets 10.29299 5.364229 Fixed Assets 89.70701 94.63577 Total Assets 100 100 Current Liabilities/Total Liabilities 100 74.01619 Long-term Liabilities/Total Liabilities 0 25.98381 Owners' Capital/Total Owners' Equity 100 114.3154 Retained Earnings/Total Owners' Equity -- -6.14962 Total Liabilities/Total Liabilities + Total Owners' Equity 26.80314 44.2894 Total Owners' Equity/Total Liabilities + Total Owners' Equity 73.19686 55.7106
This comparative presentation reveals that School Y has proportionately more liquid
assets and fewer fixed assets than the industry average. Its current liabilities are at the
highest possible level, 100% of liabilities. There is no long-term debt. This is the most
conservative of financing methods—owner financing with no long-term debt.
A common size income statement for School Y is presented in Table G.5, along with
industry average comparisons. All figures are expressed as a percentage of net revenues.
This comparison reveals that School Y’s salaries and wages expense, as a percentage of net
revenues, is slightly higher than the industry average. The catch-all category, other expenses,
is also slightly higher. However, the school had no bad debt expense, suggesting that School
Y has collected all of its accounts receivable or that it does not extend credit to its students—
all students must pay their tuition and fees in full at the time of enrollment. School Y’s net
income, as a percent of revenues, is more than double the industry average, a situation that
can only be seen as positive.

360
Table G.5 Income Statement, School Y (All figures are expressed as a percentage of Net Revenues.)
2003 Industry Averages
Net Revenues 100 100 Salaries & Wages 30.90672 27.324 Administrative Expenses 19.63199 22.75024 Depreciation Expense 3.139419 5.460212 Finance Charges 1.209067 3.588795 Other Expenses 42.20436 39.00687 Bad Debt Expense 0 0.57591 Total Expenses 97.09156 98.70602 Net Income 2.90844 1.299093
Horizontal Analysis
Horizontal Analysis examines the change in financial statement line items or
categories from one year to another. This is also known as trend analysis and may reveal
positive or negative changes in financial composition. Balance sheet figures represent
percentage changes between fiscal years 2002 and 2003. School Y’s changes are presented
in Table G.6 along with industry averages for comparative purposes. Commentary follows
the numeric presentation.
It appears that School Y is extremely stable in terms of change compared to the
industry averages. Secondary schools in the Mukono District of Uganda in 2003 represented
a high growth industry. Each year, new schools began operations. It is not unexpected, then,
that the industry averages would show substantial growth in total assets. In the fixed assets
category, it appears that other schools in the District were amassing assets at a very fast pace.
An industry average increase in fixed assets of over 40% in one year is rather staggering.
The implication is that on the average, schools in the Mukono District were building
classrooms, dormitories, libraries, etc., at the rate of 40% per year. School Y, by

361
Table G.6 Horizontal Analysis by Common Category, School Y, Balance Sheet, Percentage Changes from Fiscal Year 2002 to 2003 % Change 2002 to 2003 Industry Averages Assets Quick Assets 40.48068678 83.55921451 Current Assets 20.42393465 100.1387453 Fixed Assets -0.17063301 40.1850895 Total Assets 1.618128812 39.52306116 Current Liabilities -8.17163430 130.412956 Long-term Liabilities -- 18.33211415 Total Liabilities -8.17163430 67.81946198 Owners' Capital 5.746260272 3.38616507 Retained Earnings -- 84.69258818 Total Owners' Equity 5.746260272 10.27999126 Total Liabilities + Owners' Equity 1.618128812 39.52306126
comparison, appears to have changed little in fixed assets. Its miniscule decrease in net fixed
assets must reflect a gross increase in this category that was slightly more than offset by
depreciation taken on all fixed assets so that its overall decrease in this category was only
0.17 of one percent.
Quick assets and current assets did increase, by 40% and 20% respectively.
However, these are small increases compared to the industry averages and are calculated on
relatively small monetary value items. Again, this analysis suggests that this school is more
stable in its activity levels. It is interesting to note, however, that a review of contextual data
obtained via the survey shows that while overall assets changed little, there was a substantial
increase in student enrollments from 380 students in 2002, to 537 students in 2003.
On the flip side of the balance sheet—the liabilities and owners’ equity section—
several items are noted. (1) Current liabilities actually decreased by 8%. This compares well
with twenty percent increase in current assets. As a result, the working capital (current assets

362
– current liabilities), a figure that is not explicitly shown on the balance sheet, but is a key
figure for analysis purposes, increased. This is a positive trend. It suggests that the school is
in an improved financial position to meet its current liabilities as they come due. (2) Total
liabilities for the industry increased, a reflection that much of the increase in fixed assets of
other schools was financed through debt. School Y, however, has no long-term liabilities
and experienced a decrease of 8% in its current (and therefore total) liabilities. This is a
positive trend. (3) School Y does not show retained earnings. Investigation shows that the
school is owned by nine partners. In a partnership, it is common to directly increase or
decrease each partner’s account with their proportionate share of the profits or losses.
Although the individual partners’ accounts are not shown in this analysis, the notes to the
financial statements reveal that profits and losses are shared equally, regardless of the
partner’s actual investment in the school. (4) The overall increase in owners’ equity for
School Y was not as high as for the industry in general. However, this is not an area for great
concerned. Many newer schools were starting from a near zero position. It appears that the
owners of this school ascribe to financially conservative strategies for operations. A
sustained 6% annual growth in equity (in the absence of additional capital contributions) is a
positive indication of long-term fiscal viability.
Table G.7 presents the horizontal analysis of School Y’s income statement. It
identifies changes between fiscal year 2002 and fiscal year 2003. Industry averages—
average income statement changes for all 10 schools in the sample—are also presented.
Comments follow the numeric presentation.

363
Table G.7 Horizontal Analysis by Common Category, School Y, Income Statement, Percentage Changes from Fiscal Year 2002 to 2003 % Change from 2002 to 2003 Industry Averages Net Revenues 29.87891333 32.46944234 Salaries & Wages 25.82271656 36.95918422 Administrative Expenses 0.013493357 42.43206455 Depreciation Expense 23.89383748 42.47389961 Finance Charges 443.2353702 119.1621069 Other Expense 53.38194427 30.02820228 Bad Debt Expense -1.293085801 Total Expenses 30.38473616 33.50274015 Net Income 14.98726328 8.996823167
Addressing the internal changes, it is seen that School Y’s net revenues increased by
30% from 2002 to 2003. It is impressive that in response, or supporting this increase in
revenues, the largest expense category (as identified in the horizontal analysis above),
salaries and wages, was held to a lower percentage increase at 26%. This, in large measure,
allowed the net income to increase by 15%, a factor that compares well to the industry
average of 9%.
The horizontal analysis highlights one item of concern, the 443% increase in finance
charges. Granted, this percentage increase is calculated on a relatively small monetary value.
However, it does merit investigation. Likely, this is related to short-term financing to
provide cash to meet current obligations. The negative working capital position of School Y
puts it in a position of scrambling to secure its cash position.
Other Elements for Analyses as Dictated by the Setting
The research suggested that one other financial measure, revenue per student, could
be useful in evaluating the overall financial position of private secondary schools in the

364
Mukono District of Uganda. As discussed in Chapter 5, a low revenue per student figure
may indicate that the school is not covering its fixed as well as variable costs. This, if true,
will have a negative impact on long-term fiscal viability. Ultimately, all costs, fixed and
variable must be covered in order for a school to remain in operation.
A low revenue per student figure may also indicate that a school is attracting students
because of its relatively inexpensive services. If true, this could be a positive influence on
long-term fiscal viability, assuming that the school can continue to attract students based on
its tuition and fees charges. An extension of this demand-driven revenues concept indicates
that quality of education must also be taken into consideration. Low cost education is
generally only attractive as long as quality is acceptable (whatever acceptable means in the
consumers’ minds). This research uses UNEB scores as a measure for quality of eduation.
Comparing ranking of revenue per student (the greater the number, the lower the ranking,
therefore the lower the revenue per student) with UNEB score rankings (the lower the
number, the higher the ranking) addresses this question of cost of education to the student
versus quality of the education provided at this school.
Revenue per student was calculated for School Y and is shown in Table G.8. It is
presented with industry averages and relative ranking among the 10 sample schools.
Table G.8 Revenue per Student School Y Rank Industry Average Range of Values Low High 323,413.25 10 of 10 694,350.60 323,413.25 970,584.90

365
UNEB scores for School Y are presented in Table G.9 and Table G.10. These tables
show, respectively, School Y’s relative ranking within both the sample of 10 and the
population of 59 UNEB schools.
Table G.9 UNEB Mean Scores, School Y in a Sample of 10 Schools School Y Rank Industry Average Range of Values
Low High
5.73333 1 of 10 5.102055 3.87 5.73 Table G.10 UNEB Mean Scores, School Y in the population of 59 UNEB Schools School Y Rank Industry Average Range of Values
Low High
5.73333 5 of 59 4.4335 3.24 6
Tables G.8 and G.9, when taken together, offer a compelling perspective of School Y.
This school has the lowest revenue per student, making it the least expensive school for
students in the sample population. However, it has the highest UNEB scores of any school in
the sample. This means that School Y, based on information available, is a clear winner in
the category of best product at the best price. These two factors combined suggest that this
school, with proper supporting financial strategies, is well-positioned for long-term viability.
These factors also suggest that School Y is an example to be studied and exemplified by
other schools in the District.
School Y’s relative position as 5th of 59 schools in UNEB scores, as shown in Table
G.10, indicates that in the population there are four other schools that have higher rankings.
However, we have no revenue report data on those schools and are therefore unable to
conduct any type of financial analysis. Investigation of survey data shows that two of these

366
schools are government-aided schools, so they are not required to file revenue reports. The
other two are private schools but did not file revenue reports. Therefore, it is assumed that
these two private schools, although they exemplify excellent educational quality, are not
financially successful. They had no net income, which is the basis for filing of revenue
reports.
Comparisons of School Y with the other contextual elements identified in this
research are presented in Table G.11. These contextual elements may or may not be relevant
to the financial well-being of the school. Fiscal viability cannot be assessed in one measure.
Rather, fiscal viability is a concept that encompasses the prospects for long-term financial
health which is influenced by untold other variables, both quantitative (such as level of
working capital or cash flow) and qualitative (such as owners philosophies and management
strategies).
Table G.11 Six Contextual Elements Identified in This Study School Y Ranking Industry Average 1 Age of School 5 6 of 10 8.8 2 Total # Students in School 537 7 of 10 649.2 3 # Students taking UNEB at school 60 10 of 10 93.3 4 % Female Students 52.14153 3 of 7 55.61633 5 Student/Teacher Ratio 18.51724 4 of 9 22.82589 6 % Boarding Students 89.75791 6 of 8 85.16203
1. At five years old, School Y appears to be relatively new. However, it lies in the older
one-half of the sample population. This may suggest that in comparison to other
schools in the sample population, School Y has had a little more time to build
physical facilities, to establish its reputation, and to establish solid internal fiscal
policies and procedures.

367
2. The ranking for total number of students places the largest school first. Therefore,
School Y’s ranking of 7th shows that this school is one of the smaller schools in the
sample. It is 17% lower than the industry average. This may have some impact on
the financial measures as well as the quality of education. There may be some sort of
economies of scale. This can only addressed through further research.
3. The number of students taking the UNEB exam at this school is the smallest in the
sample. An investigation of the original survey responses for School Y shows that
the school actually sent 16 of its students to other schools for O-level testing in 2003.
There is no indication why this was done. Could it be that the school was only
licensed or set up to examine 60 students? Or did the administration of the school
recognize that 16 of their students might do poorly on the exam, and sent these
students sent elsewhere? The role of allowing or disallowing students to take the
exams at this school should be explored. This could have a very misleading effect on
the variable used as a proxy or measurement for quality of education in this LDC
setting.
4. This school ranked 3rd highest in percentage of female students at the school. This
was slightly less than the industry average. It should be noted that there was one all-
female school in the sample and there were no exclusively male schools. At 52%,
this school has a fairly equal gender mix.
5. A high ranking in the student/teacher category would reflect more students per each
teacher. School Y’s 4th place ranking suggests that it is in the highest one-half of the
sample, yet it is below the industry average. Basically, this school is near the middle
of the sample as far as student/teacher ratios.

368
6. The percentage of boarding students for School Y is lower (but not substantially) than
the industry average. This does not appear to be a critical factor.
Further Description of School Y
At this point in the analysis, it is apparent that School Y was, with the exception of
cash related issues, mid-to upper-range in the desirability of its financial and most of its
contextual rankings. School Y’s position as the least expensive school, as well as the best
quality school (as measured by UNEB scores), puts it in a top leadership position. In order to
better understand the setting and unique characteristics of this school, the author returned to
the original survey documents completed by the headmaster of School Y. The following
facts, both quantitative and qualitative, may help the reader to more fully appreciate School
Y’s circumstances.
School Y was established in 1998 and therefore was only five years old at the time of
this research. Its partnership ownership structure was unique among the 10 sample schools.
The revenue report shows that partners include four reverends, two females and three other
men. The headmaster is one of the partners. There are 15 members of the board of directors,
three of whom are employed at School Y. This hands-on, diversified but involved ownership
structure may, in part, account for the school’s excellent balance between costs and quality.
The school is situated 5-15 minutes walking distance from the nearest taxi drop off
areas. It lies on a mostly grassy, somewhat hilly six-acre parcel of land, some of which is
under cultivation for food crops. There is no tarmac on the property but there is a water
source. Rain water is captured in one tank. Water is hand-carried in jerry cans to points of
use; there is no running water. There are no flushing toilets. Wood is used for cooking,
paraffin for lamps. Electricity usage is limited by its high cost. All students receive

369
computer training, but the computers are available to students only two hours per week.
Furthermore, no computer paper or disks are available for use. There is an active sports
program.
Findings and Commentary
Important findings for this single school analysis are summarized as follows. The
seven key ratios and 6 supplemental financial ratios show that School Y is generally a
conservative mid-range performer. Only two areas are noteworthy. First, cash and current
assets appear to be insufficient to meet liabilities. Finance charges from short-term
borrowing have greatly increased. Attention should be given to better cash flow
management. Second, School Y has no long-term debt and finances its assets primarily
through owners’ capital. This fiscally conservative policy, if maintained, leaves School Y in
a favorable position regarding its long-term financial viability.
The most striking finding of this single school analysis is that School Y is the best
buy for the money. It ranks highest in UNEB scores and lowest in revenue per student (cost
to the student). This combination is undoubtedly a critical element of long-term fiscal
viability. It also places this school in a position to be used as a “model school” for future
analysis.
Conclusion
This research has addressed private school financial analysis and fiscal viability in an
LDC setting. It has explored theoretical as well as practical applications. A model for
assessment of financial position was identified. This appendix applies the financial
assessment model to actual data from one of the schools in the sample. A comparison is
made between the performance of “School Y” and industry standards developed in this study.