financial assurance for hardrock mine cleanup - csp2 assurance for hardrock mine... · financial...
TRANSCRIPT
Financial Assurance forHardrock Mine Cleanup
By James R. Kuipers, P.E., J Kuipers EngineeringSarah Zuzulock, M.S., CSP2
Western Mining Activist Network4th Bi-Annual Meeting
October 3-5, 2003 Vancouver BC Canada
What is Financial Assurance?
Financial Assurance is the basic concept of a company or corporation impacting public lands or resources (such as water) having to provide insurance that the funds are available for the necessary activities to mitigate or remediate any adverse impacts from those activities.

Who Requires Financial Assurance?
• Federal Agencies– Forest Service– Bureau of Land Management– Environmental Protection Agency
• State Agencies– Every state with significant hardrock mining
activity has promulgated mine cleanup statutes that include provisions for financial assurance
To What Mine Cleanup Activities Does Financial Assurance Apply?
• New and Operating Mines – NEPA and Operating Permits– Federal financial assurance laws apply to
federally administered lands (including tribal lands) and State laws apply to state and private lands.
• Abandoned Mines – CERCLA and other state and federal cleanup activities– CERCLA financial assurance provisions are
borrowed from RCRA
How is Financial Assurance Determined?
Two Primary Processes:
1. Mine Cleanup Planning / Cost Estimation
2. Financial Assurance Administration
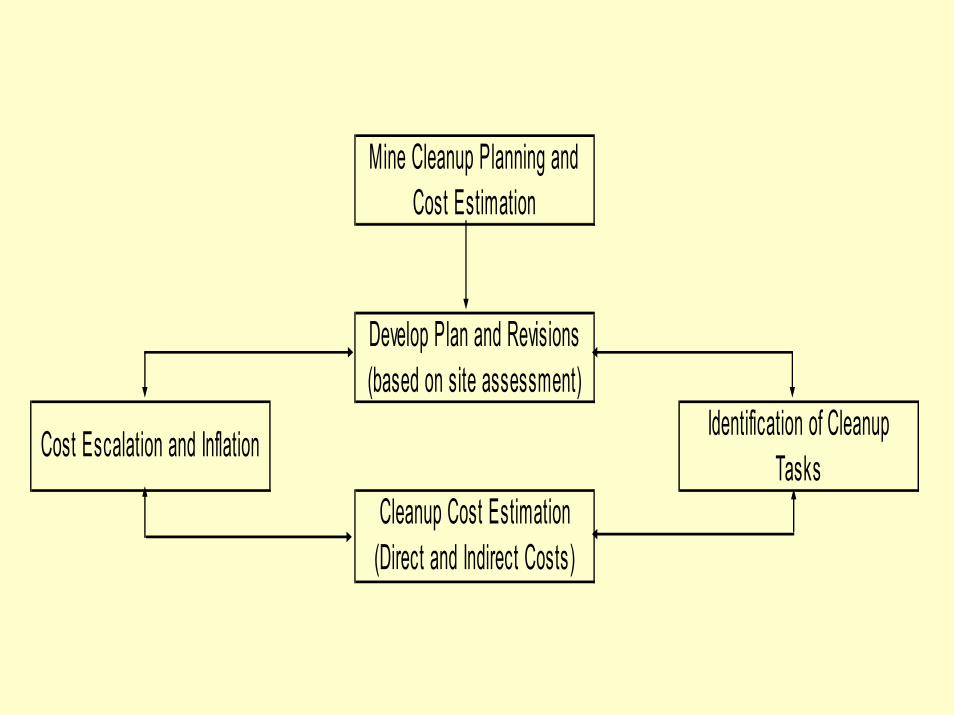
Mine Cleanup Planning and Cost Estimation
Develop Plan and Revisions (based on site assessment)
Cost Escalation and Inflation Identification of Cleanup Tasks
Cleanup Cost Estimation (Direct and Indirect Costs)
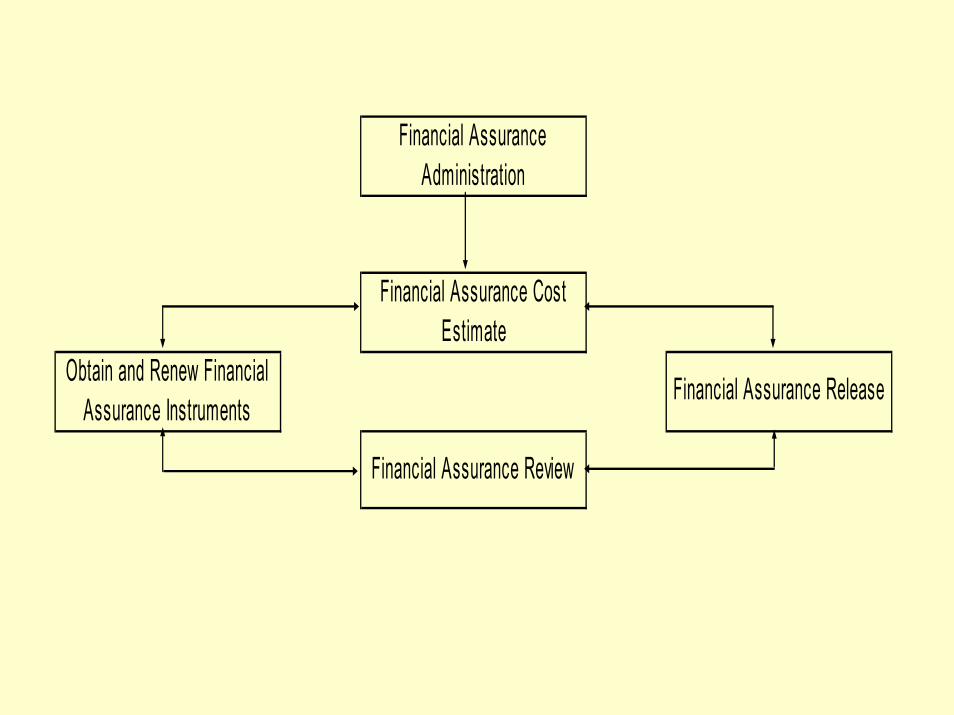
Financial Assurance Administration
Financial Assurance Cost Estimate
Obtain and Renew Financial Assurance Instruments
Financial Assurance Release
Financial Assurance Review

Figure 1. Cyclic Determination of Mine Cleanup Financial Assurance
Mine Cleanup Planning and Cost Estimation
Develop Plan and Revisions (based on site assessment)
Cost Escalation and Inflation Identification of Cleanup Tasks
Cleanup Cost Estimation (Direct and Indirect Costs)
Financial Assurance Administration
Financial Assurance Cost Estimate
Obtain and Renew Financial Assurance Instruments
Financial Assurance Release
Financial Assurance Review
Development
Permitting
Construction
Operation
Closure/Cleanup
Post Closure/Cleanup
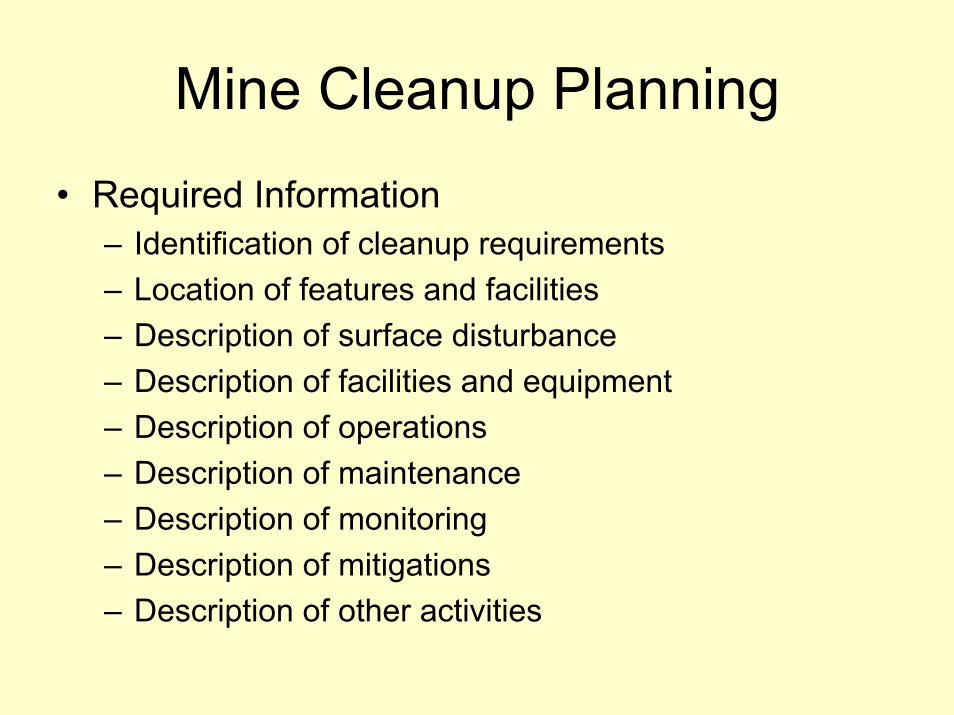
Mine Cleanup Planning
• Required Information– Identification of cleanup requirements– Location of features and facilities– Description of surface disturbance– Description of facilities and equipment– Description of operations– Description of maintenance– Description of monitoring– Description of mitigations– Description of other activities
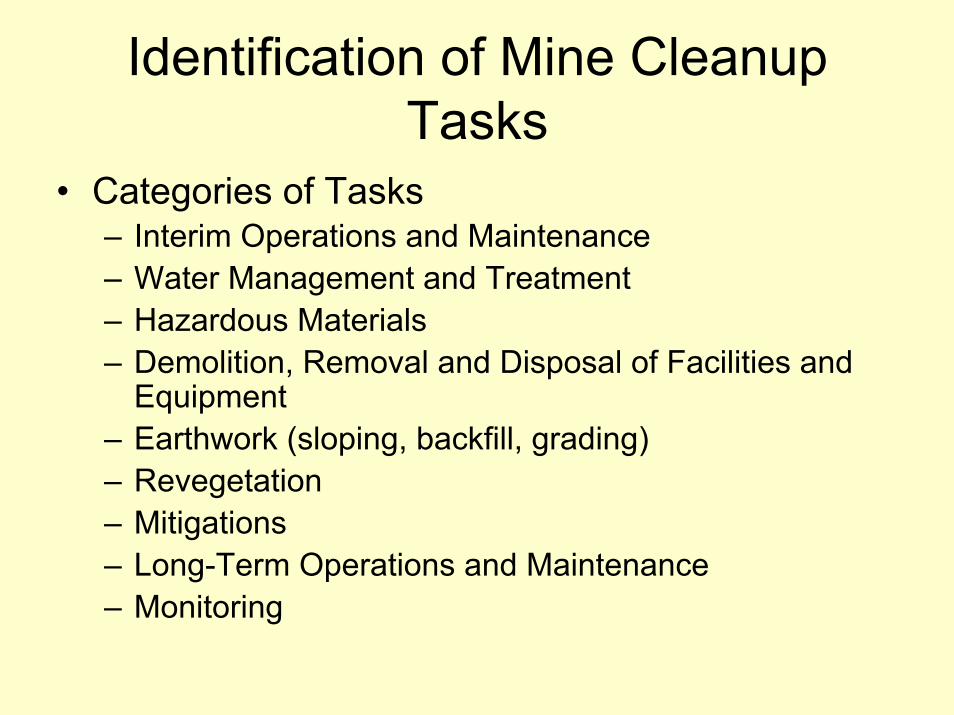
Identification of Mine Cleanup Tasks
• Categories of Tasks– Interim Operations and Maintenance– Water Management and Treatment– Hazardous Materials– Demolition, Removal and Disposal of Facilities and
Equipment– Earthwork (sloping, backfill, grading)– Revegetation– Mitigations– Long-Term Operations and Maintenance– Monitoring

Figure 2. Mine Cleanup Cost and Project Life
$$$'s
Actual Amount of Financial Assurance NeededCleanup Cost Estimate Originally Predicted
Perpetual Treatment
$$'s Increase due to change in mine plan
Walk Away$'s
Construction
Project Life
Post-Closure/Cleanup
Increase due to increased acid generation potential
Increase due to water treatment
requirements and additional cleanup measures
Permitting Operations Closure/Cleanup
Typical indirect cost gap between cost estimate and financial assurance
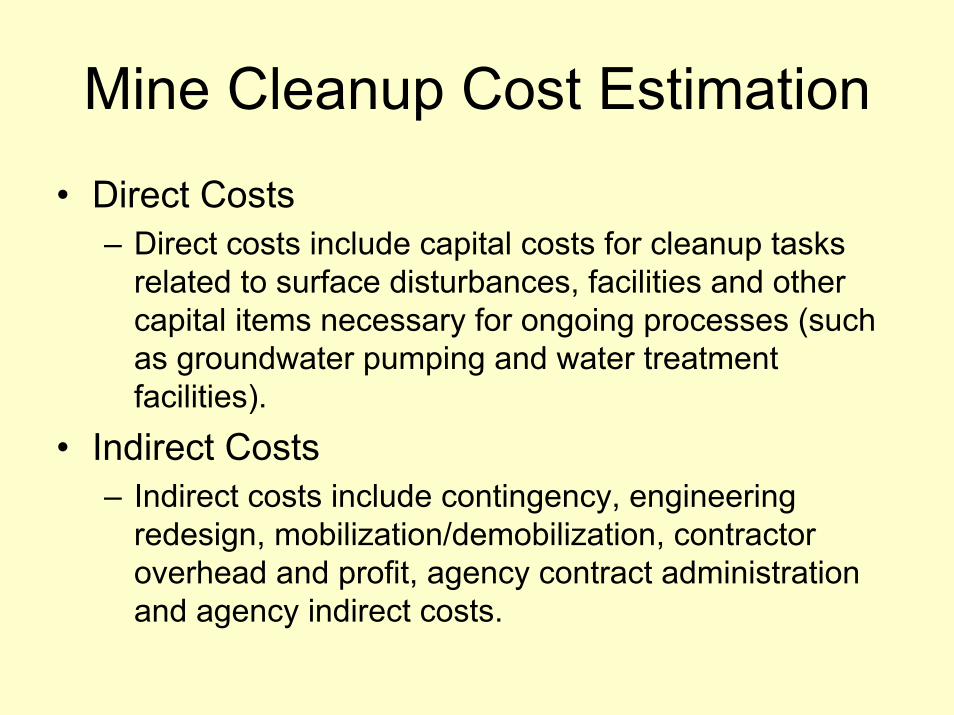
Mine Cleanup Cost Estimation
• Direct Costs– Direct costs include capital costs for cleanup tasks
related to surface disturbances, facilities and other capital items necessary for ongoing processes (such as groundwater pumping and water treatment facilities).
• Indirect Costs– Indirect costs include contingency, engineering
redesign, mobilization/demobilization, contractor overhead and profit, agency contract administration and agency indirect costs.
Cost Escalation and Inflation
• Application• Calculation• Risk and Uncertainty• Scheduling• Cash Flow Analysis• Estimate Checking
Financial Assurance Administration
• Financial Assurance Cost Estimation• Financial Assurance Instruments
– Cash or Equivalent Forms– Surety Bonds and Insurance– Self Guarantees
• Financial Assurance Review and Update• Financial Assurance Release• Approving and Renewing Instruments
Case StudyZortman and Landusky Mines
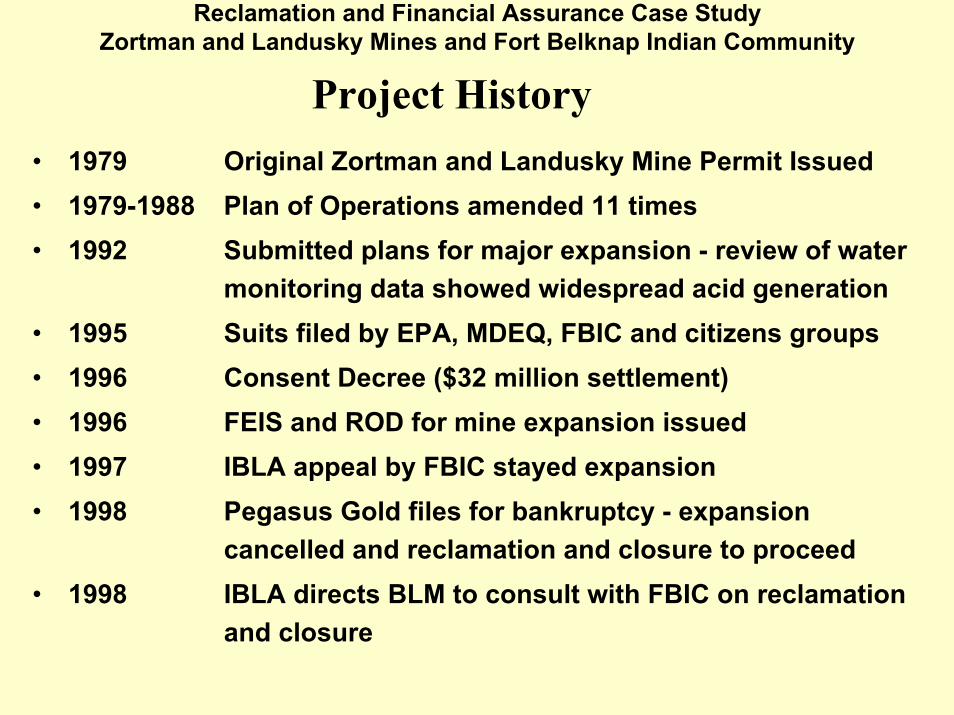
Reclamation and Financial Assurance Case StudyZortman and Landusky Mines and Fort Belknap Indian Community
Project History• 1979 Original Zortman and Landusky Mine Permit Issued• 1979-1988 Plan of Operations amended 11 times• 1992 Submitted plans for major expansion - review of water
monitoring data showed widespread acid generation• 1995 Suits filed by EPA, MDEQ, FBIC and citizens groups• 1996 Consent Decree ($32 million settlement)• 1996 FEIS and ROD for mine expansion issued• 1997 IBLA appeal by FBIC stayed expansion• 1998 Pegasus Gold files for bankruptcy - expansion
cancelled and reclamation and closure to proceed• 1998 IBLA directs BLM to consult with FBIC on reclamation
and closure
Case Study - Zortman and Landusky Mines
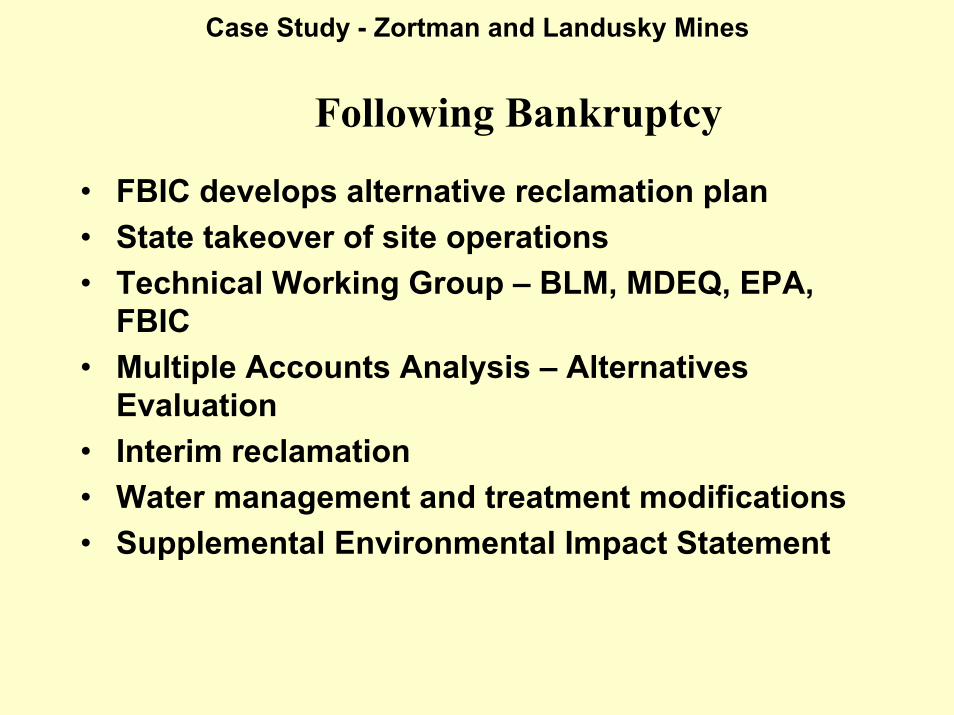
Following Bankruptcy
• FBIC develops alternative reclamation plan• State takeover of site operations• Technical Working Group – BLM, MDEQ, EPA,
FBIC• Multiple Accounts Analysis – Alternatives
Evaluation• Interim reclamation • Water management and treatment modifications• Supplemental Environmental Impact Statement
Case Study - Zortman and Landusky Mines
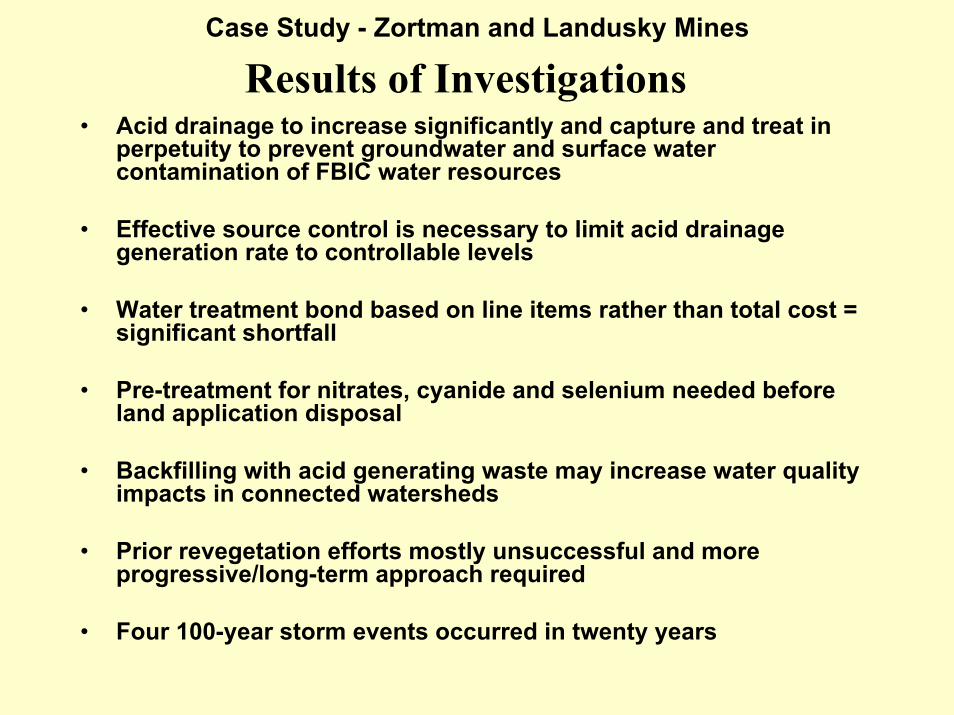
Results of Investigations• Acid drainage to increase significantly and capture and treat in
perpetuity to prevent groundwater and surface water contamination of FBIC water resources
• Effective source control is necessary to limit acid drainage generation rate to controllable levels
• Water treatment bond based on line items rather than total cost = significant shortfall
• Pre-treatment for nitrates, cyanide and selenium needed before land application disposal
• Backfilling with acid generating waste may increase water quality impacts in connected watersheds
• Prior revegetation efforts mostly unsuccessful and more progressive/long-term approach required
• Four 100-year storm events occurred in twenty years
Case Study - Zortman and Landusky Mines
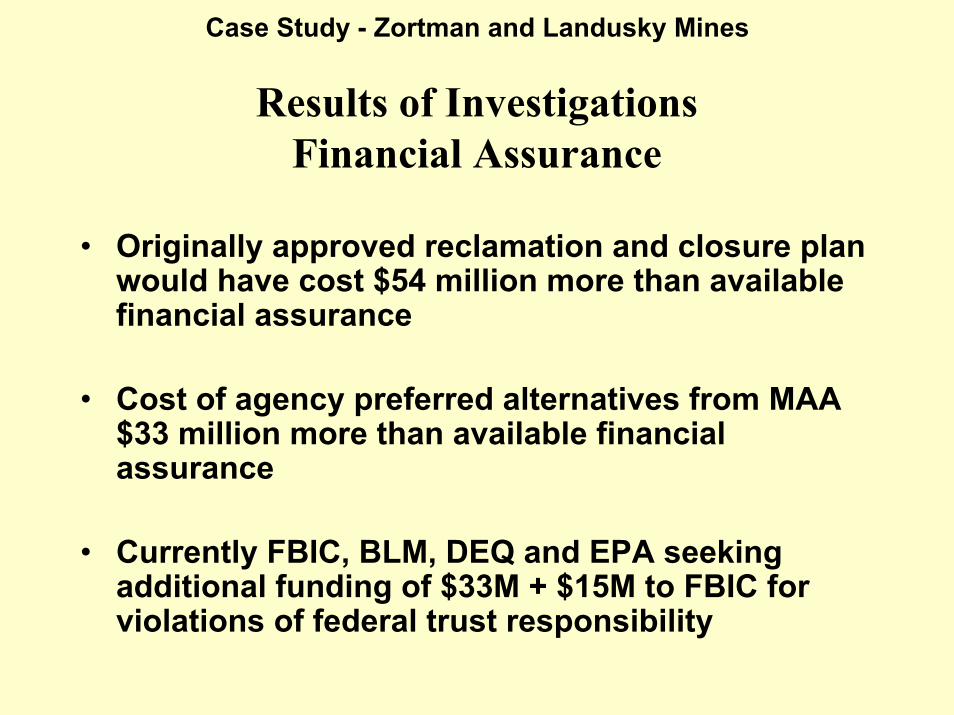
Results of InvestigationsFinancial Assurance
• Originally approved reclamation and closure plan would have cost $54 million more than available financial assurance
• Cost of agency preferred alternatives from MAA $33 million more than available financial assurance
• Currently FBIC, BLM, DEQ and EPA seeking additional funding of $33M + $15M to FBIC for violations of federal trust responsibility
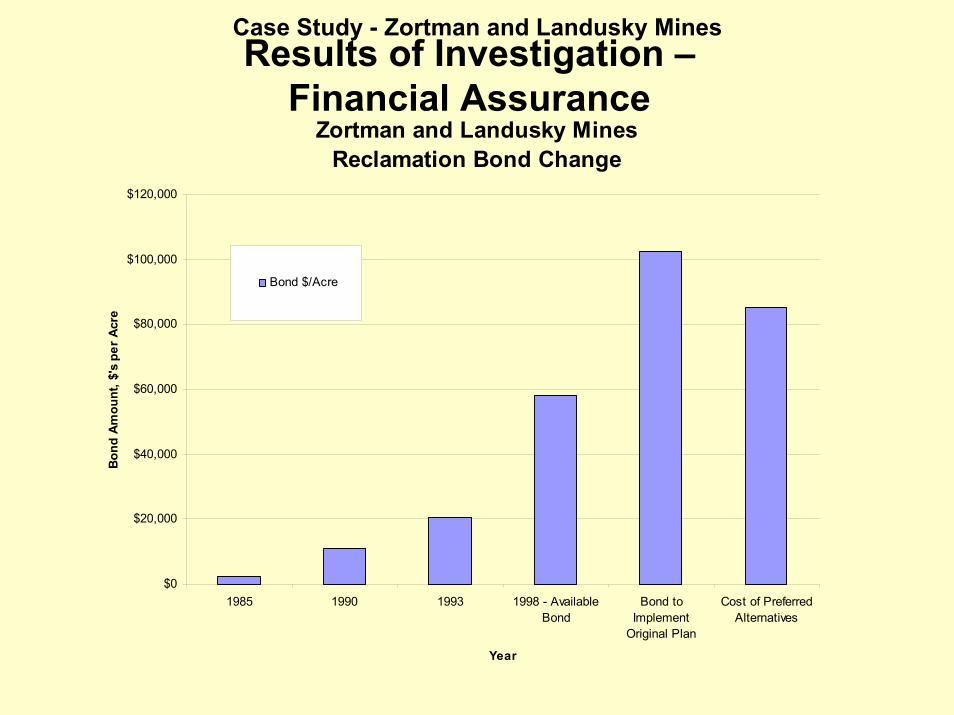
Results of Investigation –Financial Assurance
Case Study - Zortman and Landusky Mines
Zortman and Landusky Mines Reclamation Bond Change
$0
$20,000
$40,000
$60,000
$80,000
$100,000
$120,000
1985 1990 1993 1998 - AvailableBond
Bond toImplement
Original Plan
Cost of PreferredAlternatives
Year
Bond
Am
ount
, $'s
per
Acr
e
Bond $/Acre
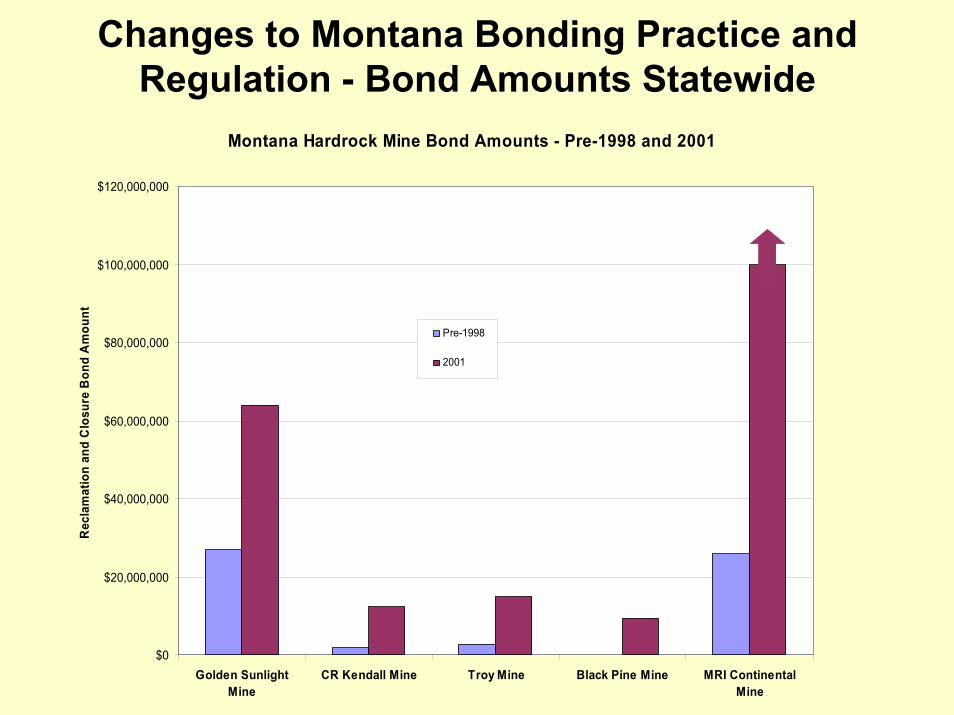
Changes to Montana Bonding Practice and Regulation - Bond Amounts Statewide
Montana Hardrock Mine Bond Amounts - Pre-1998 and 2001
$0
$20,000,000
$40,000,000
$60,000,000
$80,000,000
$100,000,000
$120,000,000
Golden SunlightMine
CR Kendall Mine Troy Mine Black Pine Mine MRI ContinentalMine
Rec
lam
atio
n an
d C
losu
re B
ond
Am
ount
Pre-1998
2001
Alaska Mine Statewide Review
• CSP2 is conducting a statewide review of all major mines on behalf of Alaskans for Responsible Mining (ARM)
• Purpose: To determine the potential tax-payer liability statewide in the event of mine bankruptcy or default on reclamation at closure
Alaska Mine Statewide Review
• Methods– Review the reclamation plan and associated
cost estimate for each mine– Develop multiple scenarios to address
reclamation plan deficiencies • Scenario 0 – Indirect costs evaluated• Scenario 1 – Unit costs ($/acre) for each task• Scenario 2,3,4 – Water treatment scenarios
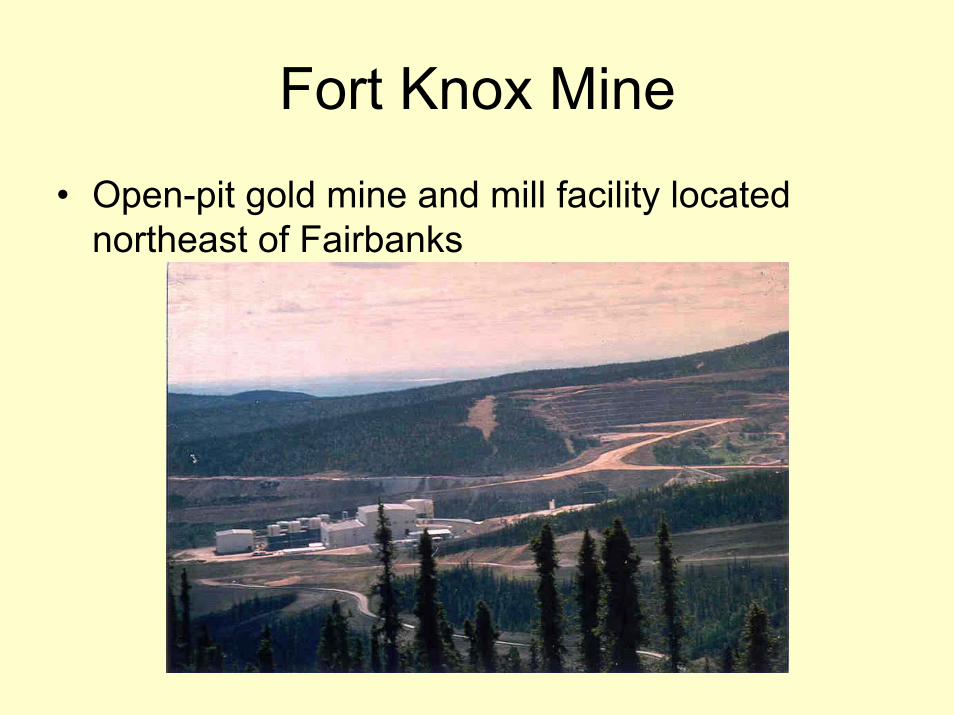
Fort Knox Mine
• Open-pit gold mine and mill facility located northeast of Fairbanks
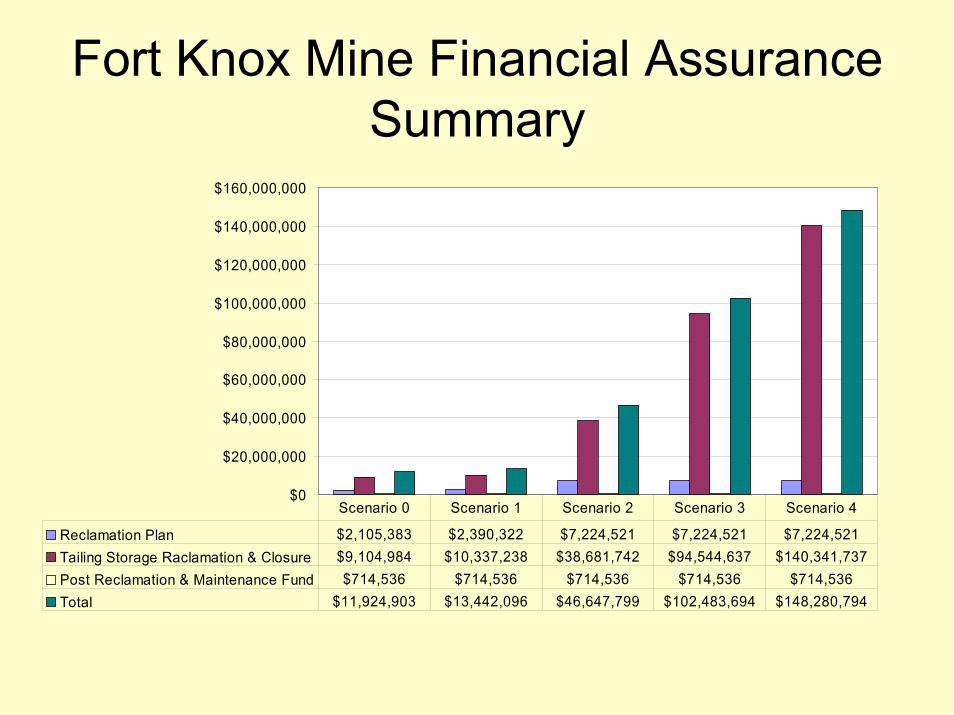
Fort Knox Mine Financial Assurance Summary
$0
$20,000,000
$40,000,000
$60,000,000
$80,000,000
$100,000,000
$120,000,000
$140,000,000
$160,000,000
Reclamation Plan $2,105,383 $2,390,322 $7,224,521 $7,224,521 $7,224,521Tailing Storage Raclamation & Closure $9,104,984 $10,337,238 $38,681,742 $94,544,637 $140,341,737Post Reclamation & Maintenance Fund $714,536 $714,536 $714,536 $714,536 $714,536Total $11,924,903 $13,442,096 $46,647,799 $102,483,694 $148,280,794
Scenario 0 Scenario 1 Scenario 2 Scenario 3 Scenario 4
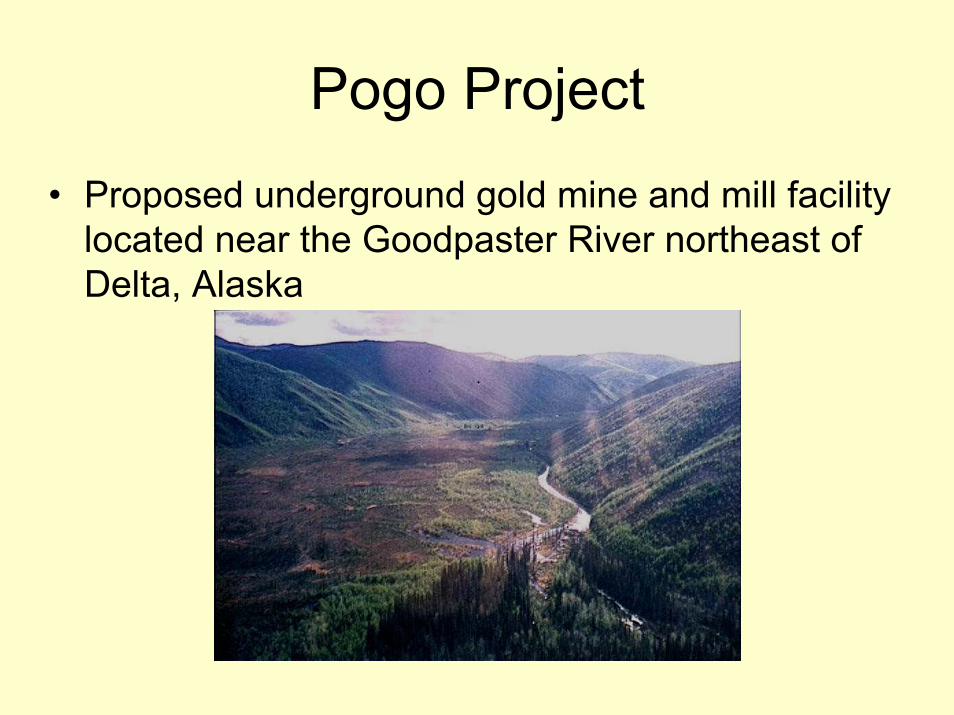
Pogo Project
• Proposed underground gold mine and mill facility located near the Goodpaster River northeast of Delta, Alaska
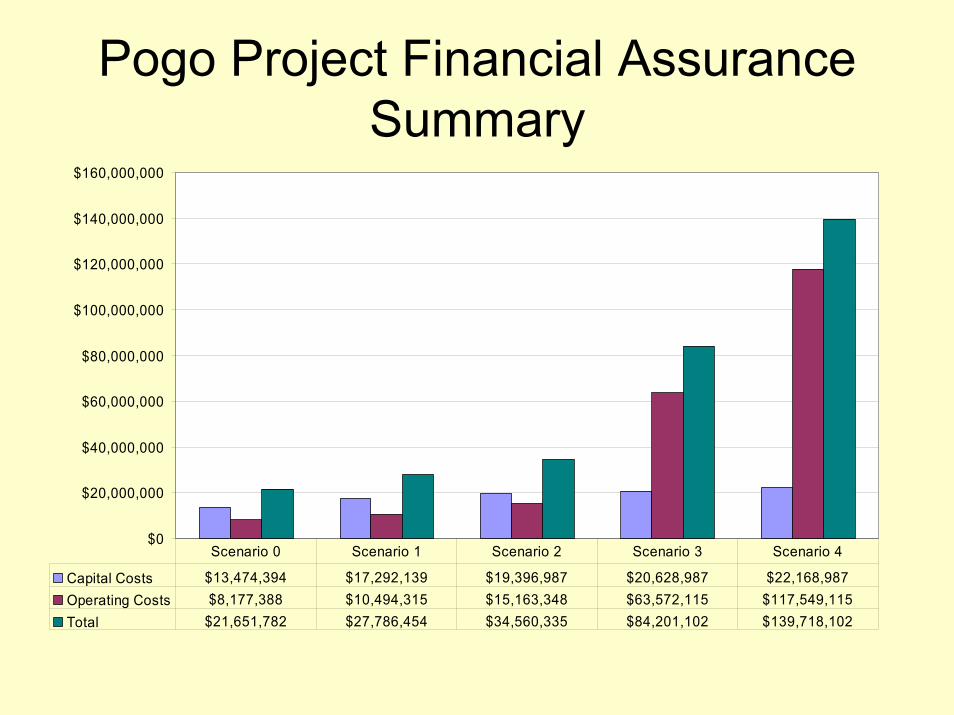
Pogo Project Financial Assurance Summary
$0
$20,000,000
$40,000,000
$60,000,000
$80,000,000
$100,000,000
$120,000,000
$140,000,000
$160,000,000
Capital Costs $13,474,394 $17,292,139 $19,396,987 $20,628,987 $22,168,987Operating Costs $8,177,388 $10,494,315 $15,163,348 $63,572,115 $117,549,115Total $21,651,782 $27,786,454 $34,560,335 $84,201,102 $139,718,102
Scenario 0 Scenario 1 Scenario 2 Scenario 3 Scenario 4
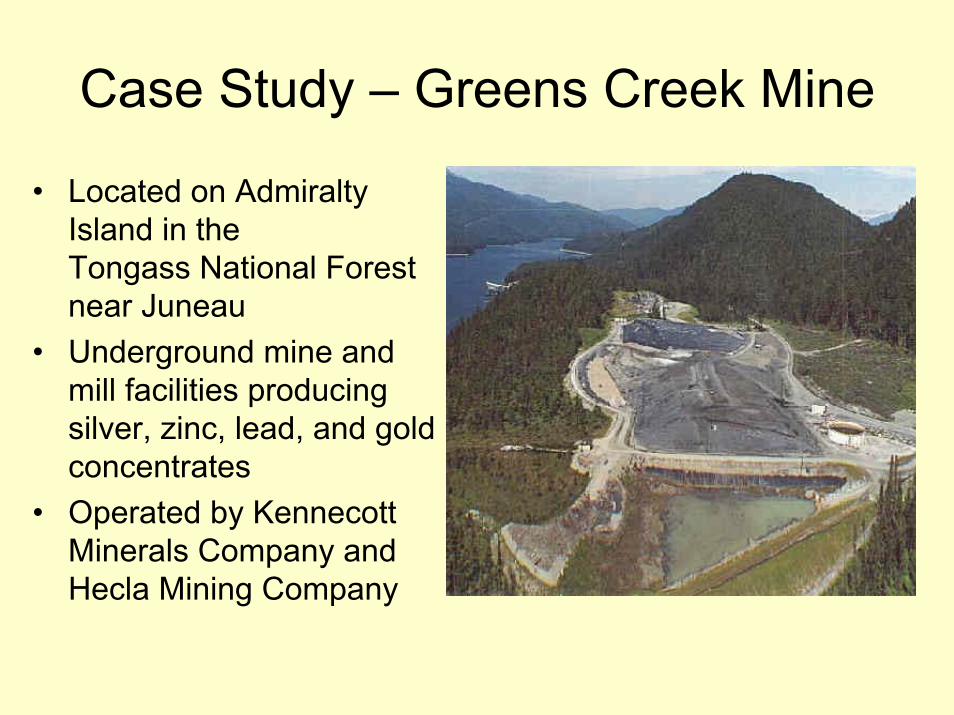
Case Study – Greens Creek Mine
• Located on Admiralty Island in the Tongass National Forest near Juneau
• Underground mine and mill facilities producing silver, zinc, lead, and gold concentrates
• Operated by Kennecott Minerals Company and Hecla Mining Company
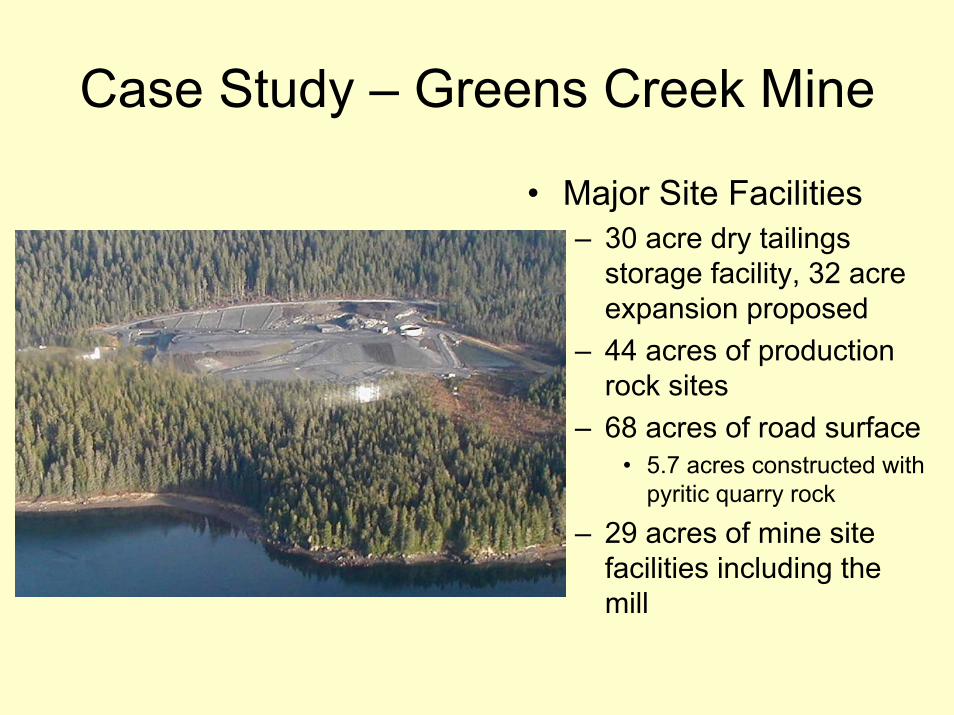
Case Study – Greens Creek Mine
• Major Site Facilities– 30 acre dry tailings
storage facility, 32 acre expansion proposed
– 44 acres of production rock sites
– 68 acres of road surface • 5.7 acres constructed with
pyritic quarry rock
– 29 acres of mine site facilities including the mill
Case Study – Greens Creek Mine
• Current financial assurance held by the USFS for the ADEC in the amount of $24,400,000
• Letter of credit for $18,400,000 and Surety Bond for $6,000,000
• Proposed tailings impoundment expansion is estimated to increase the financial assurance by $1,770,000 to a total of $26,170,000
Greens Creek – Scenario 0
• Labor, equipment, material costs, and acreages duplicate the Greens Creek Mine Reclamation Plan
• <0.5% difference when compared to Greens Creek generated numbers
• Scenario 0 estimated at $26,049,100
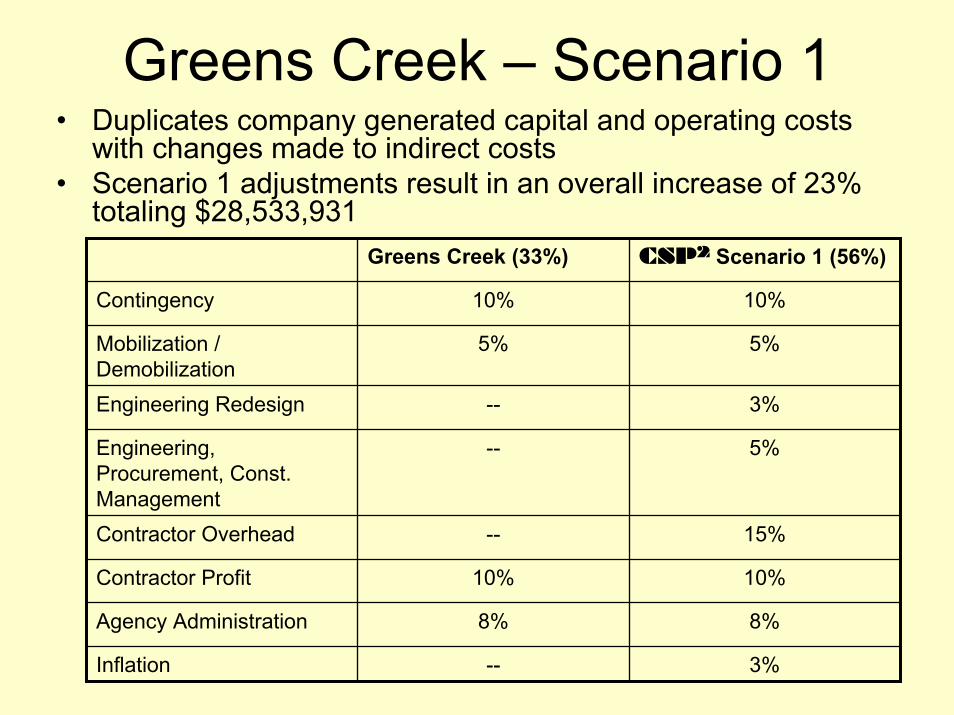
Greens Creek – Scenario 1• Duplicates company generated capital and operating costs
with changes made to indirect costs• Scenario 1 adjustments result in an overall increase of 23%
totaling $28,533,931
3%--Inflation
8%8%Agency Administration
10%10%Contractor Profit
15%--Contractor Overhead
5%--Engineering, Procurement, Const. Management
3%--Engineering Redesign
5%5%Mobilization / Demobilization
10%10%Contingency
CSP2 Scenario 1 (56%)Greens Creek (33%)
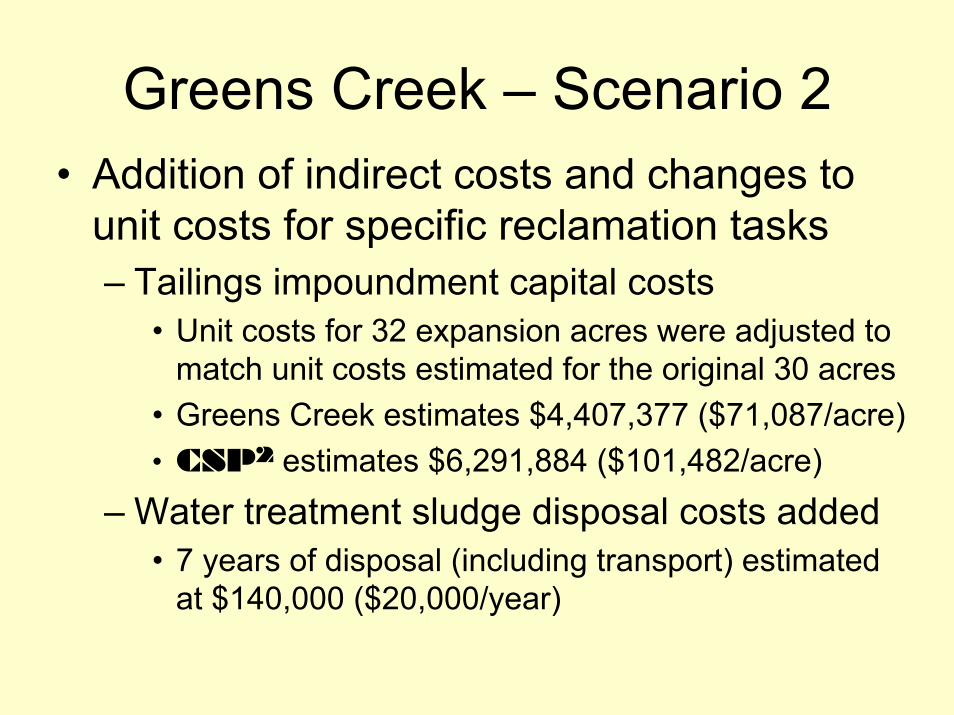
Greens Creek – Scenario 2• Addition of indirect costs and changes to
unit costs for specific reclamation tasks– Tailings impoundment capital costs
• Unit costs for 32 expansion acres were adjusted to match unit costs estimated for the original 30 acres
• Greens Creek estimates $4,407,377 ($71,087/acre)• CSP2 estimates $6,291,884 ($101,482/acre)
– Water treatment sludge disposal costs added• 7 years of disposal (including transport) estimated
at $140,000 ($20,000/year)
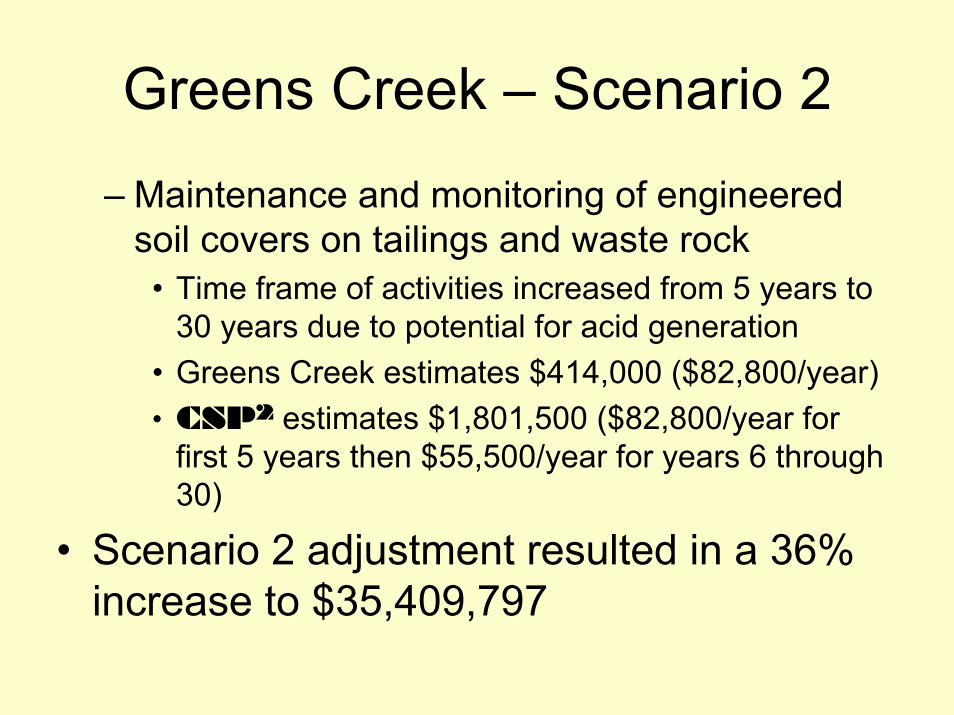
Greens Creek – Scenario 2
– Maintenance and monitoring of engineered soil covers on tailings and waste rock
• Time frame of activities increased from 5 years to 30 years due to potential for acid generation
• Greens Creek estimates $414,000 ($82,800/year)• CSP2 estimates $1,801,500 ($82,800/year for
first 5 years then $55,500/year for years 6 through 30)
• Scenario 2 adjustment resulted in a 36% increase to $35,409,797
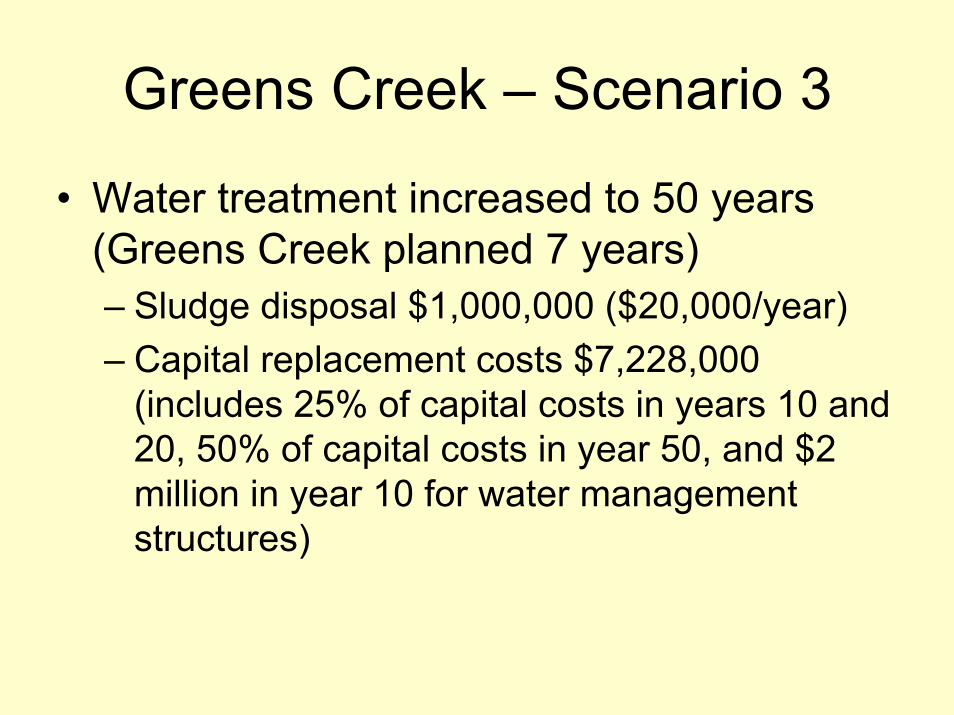
Greens Creek – Scenario 3
• Water treatment increased to 50 years (Greens Creek planned 7 years)– Sludge disposal $1,000,000 ($20,000/year)– Capital replacement costs $7,228,000
(includes 25% of capital costs in years 10 and 20, 50% of capital costs in year 50, and $2 million in year 10 for water management structures)
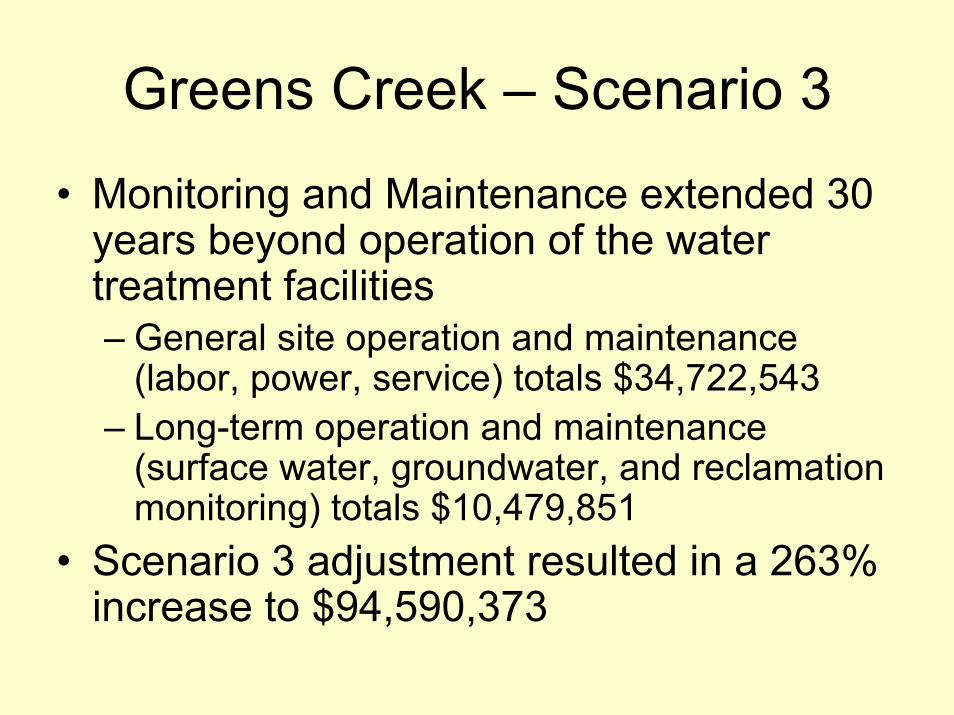
Greens Creek – Scenario 3
• Monitoring and Maintenance extended 30 years beyond operation of the water treatment facilities– General site operation and maintenance
(labor, power, service) totals $34,722,543– Long-term operation and maintenance
(surface water, groundwater, and reclamation monitoring) totals $10,479,851
• Scenario 3 adjustment resulted in a 263% increase to $94,590,373

Greens Creek – Scenario 4
• Water treatment increased to 100 years (Greens Creek planned 7 years)– Sludge disposal $2,000,000 ($20,000/year)– Capital replacement costs $7,228,000
(includes 25% of capital costs in years 10 and 20, 50% of capital costs in year 50, and $2 million in year 10 for water management structures)
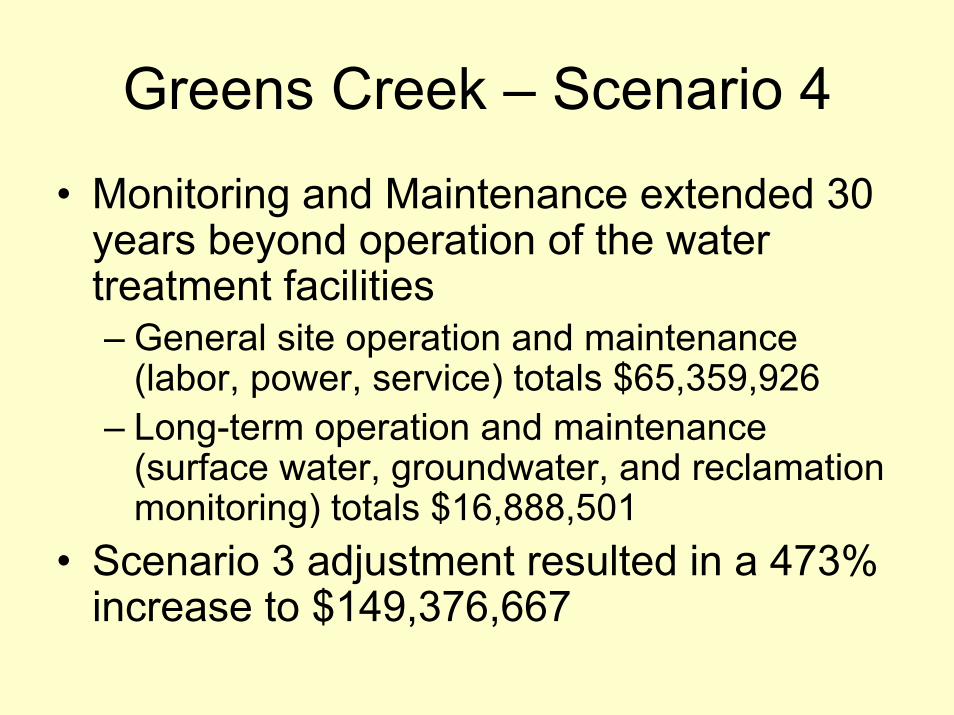
Greens Creek – Scenario 4
• Monitoring and Maintenance extended 30 years beyond operation of the water treatment facilities – General site operation and maintenance
(labor, power, service) totals $65,359,926– Long-term operation and maintenance
(surface water, groundwater, and reclamation monitoring) totals $16,888,501
• Scenario 3 adjustment resulted in a 473% increase to $149,376,667
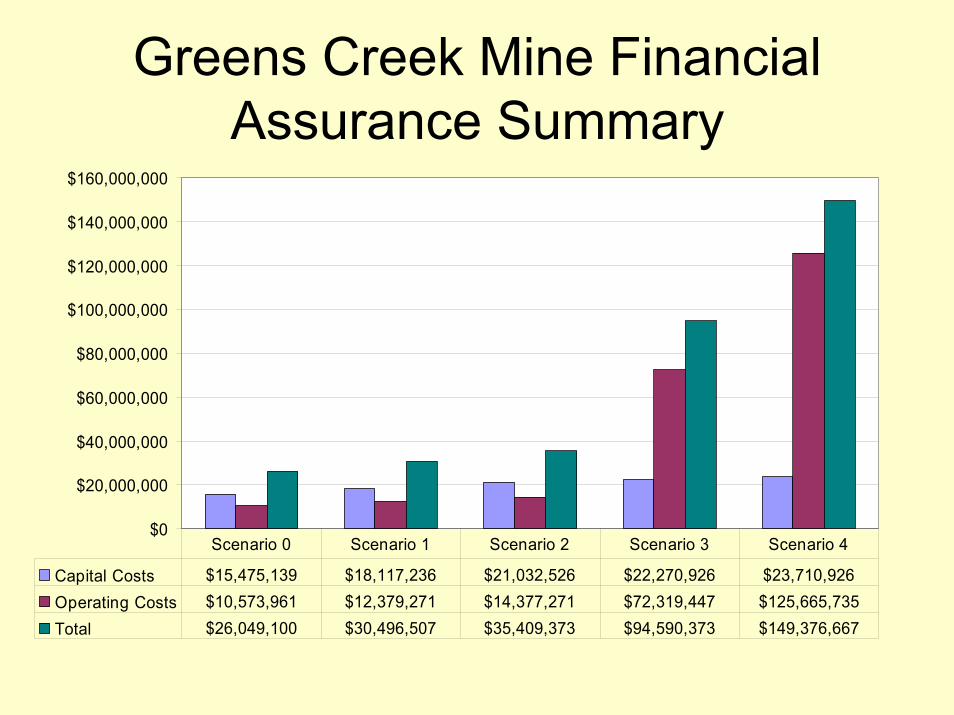
Greens Creek Mine Financial Assurance Summary
$0
$20,000,000
$40,000,000
$60,000,000
$80,000,000
$100,000,000
$120,000,000
$140,000,000
$160,000,000
Capital Costs $15,475,139 $18,117,236 $21,032,526 $22,270,926 $23,710,926Operating Costs $10,573,961 $12,379,271 $14,377,271 $72,319,447 $125,665,735Total $26,049,100 $30,496,507 $35,409,373 $94,590,373 $149,376,667
Scenario 0 Scenario 1 Scenario 2 Scenario 3 Scenario 4
Financial Assurance Cost Estimate Case Study
Chino and Tyrone MinesNew Mexico
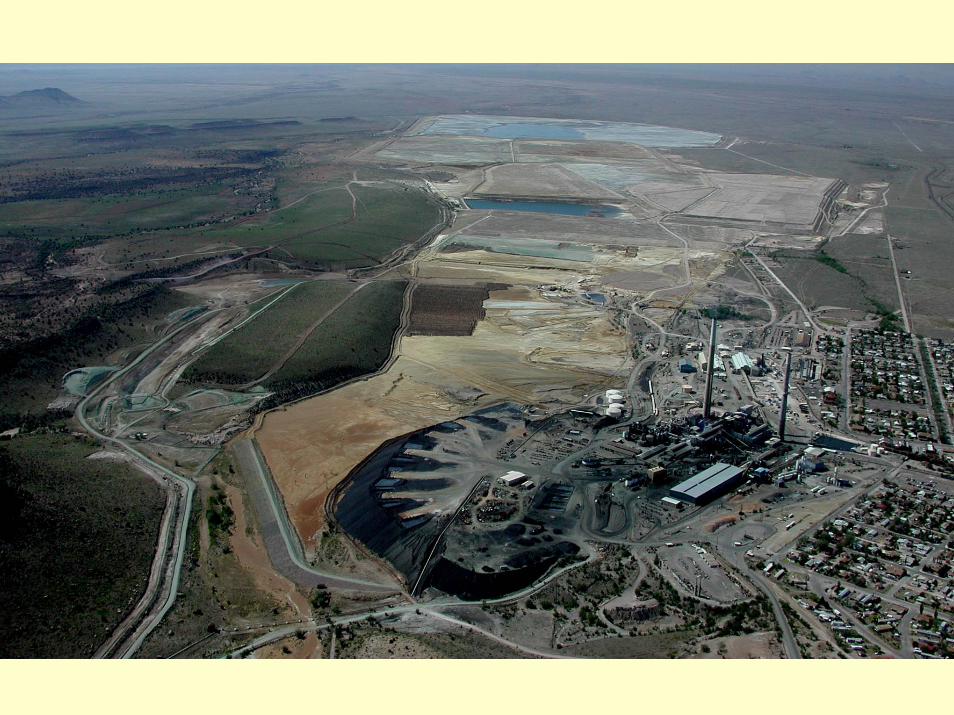
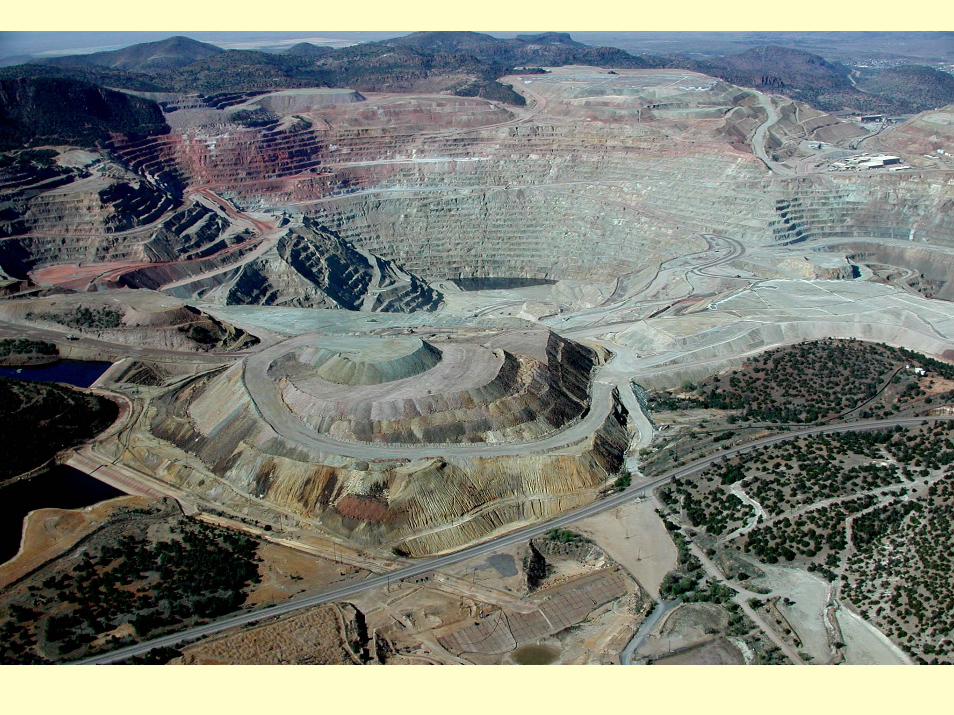
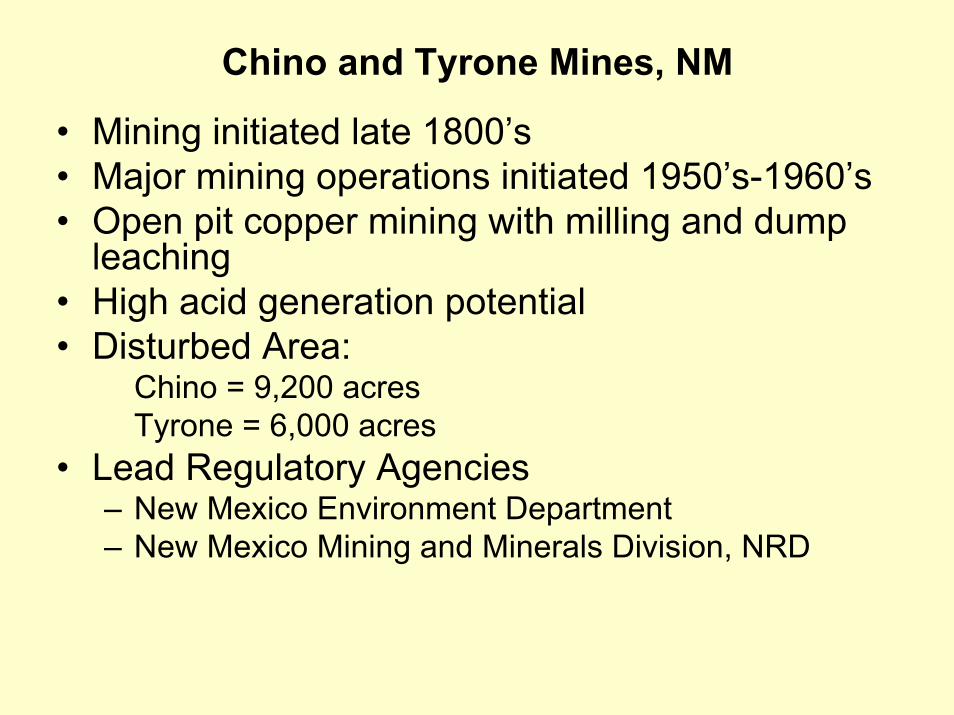
Chino and Tyrone Mines, NM
• Mining initiated late 1800’s• Major mining operations initiated 1950’s-1960’s• Open pit copper mining with milling and dump
leaching • High acid generation potential• Disturbed Area:
Chino = 9,200 acresTyrone = 6,000 acres
• Lead Regulatory Agencies– New Mexico Environment Department– New Mexico Mining and Minerals Division, NRD
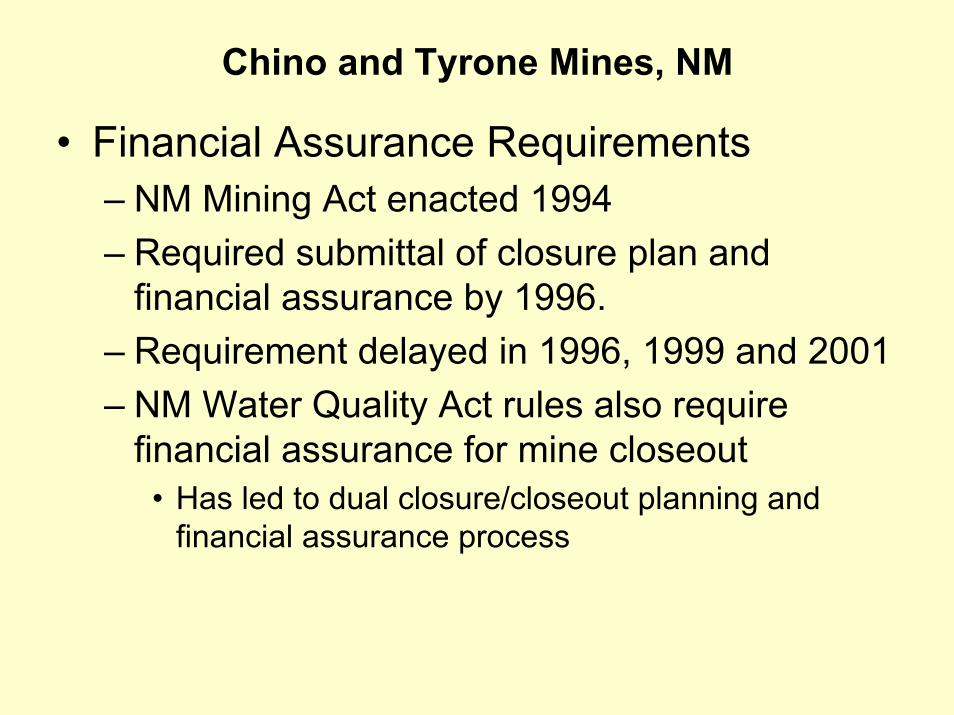
Chino and Tyrone Mines, NM
• Financial Assurance Requirements– NM Mining Act enacted 1994– Required submittal of closure plan and
financial assurance by 1996.– Requirement delayed in 1996, 1999 and 2001– NM Water Quality Act rules also require
financial assurance for mine closeout• Has led to dual closure/closeout planning and
financial assurance process

Chino and Tyrone Mines, NM
• Financial Assurance History– Prior to 1999 $1.8M– 1999 $114M– 2003 Chino $395M
• Agreed upon by Phelps Dodge and NMED & MMDTyrone $330-$440M
• $330M proposed by PD, $440M by NMED
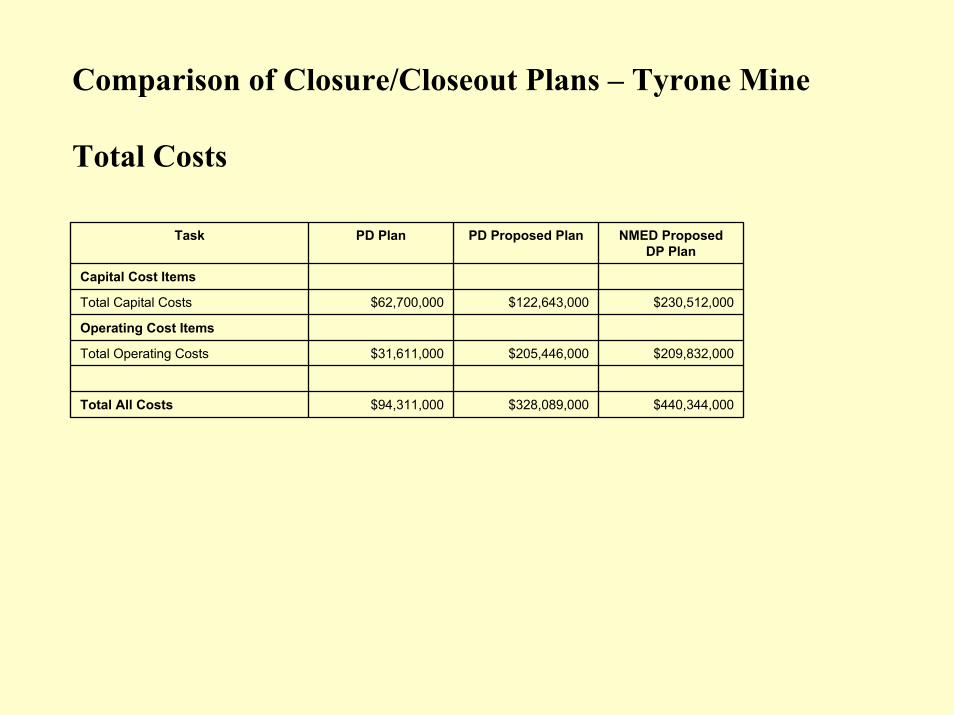
Comparison of Closure/Closeout Plans – Tyrone Mine
Total Costs
$440,344,000$328,089,000$94,311,000Total All Costs
$209,832,000$205,446,000$31,611,000Total Operating Costs
Operating Cost Items
$230,512,000$122,643,000$62,700,000Total Capital Costs
Capital Cost Items
NMED Proposed DP Plan
PD Proposed PlanPD PlanTask
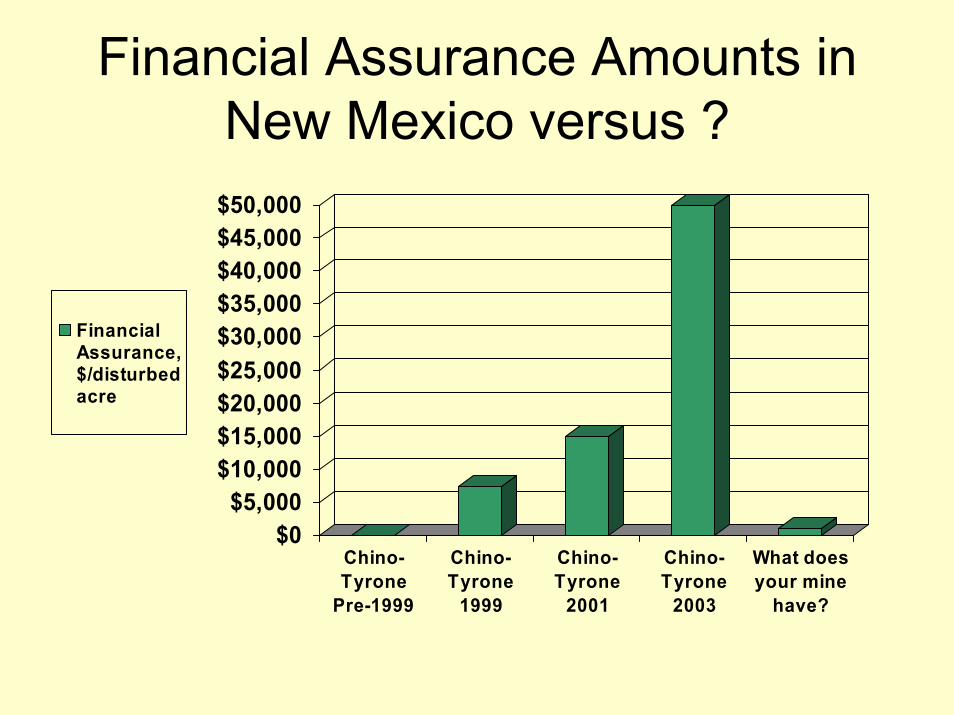
Financial Assurance Amounts in New Mexico versus ?
$0$5,000
$10,000$15,000$20,000$25,000$30,000$35,000$40,000$45,000$50,000
Chino-Tyrone
Pre-1999
Chino-Tyrone
1999
Chino-Tyrone
2001
Chino-Tyrone
2003
What doesyour mine
have?
FinancialAssurance,$/disturbedacre