financial management - cornu enterprisescornubused.com/pdf/financial management.pdf · financial...
TRANSCRIPT

Financial Management
Business Description
Business Offerings Sales & Marketing Management
Financial Management Goals and Outcomes
Personnel Management

B I Z B I T E C O N S U L T I N G G R O U P
Financial Management
Every effort was made to ensure that these materials comply with the requirements of copyright clearances and appropriate credits. BizBite Consulting Group will attempt to incorporate in future printings any corrections communicated to it.
Copyright 2003, 2004 BizBite Consulting Group
A division of CorNu Enterprise 1412-621 Discovery Street
Victoria, BC V8W 2X2
All Rights Reserved Printed in Canada

i
Table of Contents
A. Introduction to Financial Management .................................. 1
1. Planning For Business Success........................................ 2
2. Financial Data—the Heart of the Business ........................... 7
B. Financial Analysis of Operations ................................... 18
1. Job Costing Analysis Preparation.............................. 21
2. Financial Feasibility Study of the Business's Offerings ..... 30
3. Break-even Point (BEP) Analysis .................................... 37
C. Operational Financial Management ................................ 51
1. Inventory Management .. 54
2. Accounts Receivable (AR) and Credit Policy..................... 75
3. Preparing Pro-forma Cash Flow Statements .................... 112
D. Monitoring the Financial Health of the Business............... 127
1. Monthly Financial Performance Review and Analysis .................................. 131
2. Income Statement Analysis 139
3. Balance Sheet Analysis . 154
4. Testing the Financial Strength of Your Business.... 162
E. Financing, & Risk Management, Business Planning 196
1. A Guide to Finance ....... 199
2. Risk Management Strategies................................ 209
3. Business Plan Format Sample.................................... 223
Summary of Financial Management .............................. 231
Glossary ................................. 234
.

ii
BizBite Disclaimer
The personal experience of the author forms the bases for this material. BizBite Consulting Group (known as BizBite) makes no representations or warranties regarding the use of this material in whole or in part and assumes no liability for any claims, losses, or damages arising from the use of the material. The use of this material (in any way) should not be construed as taking professional advice from the author or BizBite.
Protection of Copyright
This material is the intellectual property of BizBite, a partnership registered in the province of British Columbia, Canada. International copyright law protects it.
The purchasers of this material may only use it for their personal use or, as a training tool, within their business. It is illegal to copy, modify, or transfer this material, any other BizBite materials, or BizBite may authorize any documentation pertaining to it except as in advance.
Any modification or merged portion of this or any other BizBite course, in whole or in part, is prohibited except as authorized in advance by BizBite. If you transfer possession of any copy, modification, or merged portions of any BizBite materials without authorization, you may be liable for prosecution and BizBite may take legal action against you and/or your company.

iii
Credit Page
The founders of BizBite Consulting Group and developers of BizBite's dynamic approach to business education are:
Graeme Robertson and Dr. Shirley Chapman The following people contributed to this document:
Content Specialist
JJ.. GGrraaeemmee RRoobbeerrttssoonn Graeme Robertson is a seasoned business management professional with over 30 years of experience. He has held senior positions in retail, wholesale, and distribution operations. Additionally, Mr. Robertson was Regional Manager for a national personnel/consulting firm and he has been actively engaged in business management consulting for over 20 years.
Designer and Developer
DDrr.. SShhiirrlleeyy CChhaappmmaann B. Ed. M.Ed. Ph.D.
Dr. Shirley Chapman is a veteran educator with over 30 years of experience. She is an expert in course/program design and development. Her experience covers public schools, colleges, and universities. Shirley is experienced in designing and developing training specifically for delivery via face-to-face, on-line (Internet), and manuals for organizations, colleges, and businesses. She is responsible for the page layout and format as well as the graphics in any materials that she designs.
Proofreader—Precision Proofreading—Deborah Wright [email protected] http://www.preproof.bc.ca

iv
Table of Contents
Major Headings Sub Headings
A. Introduction Financial Management
Planning for Business Success
Financial Data—the heart of the business
B. Financial Analysis of Operations Job costing analysis preparation
Financial feasibility study of the business' offering
Break-even point (BEP) analysis
C. Operational Financial Management
Inventory management
Accounts receivable & credit policy
Preparing pro-forma cash flow statements
D. Monitoring the Financial Health of the Business
Monthly financial performance review and analysis
Income statement analysis
Balance sheet analysis
Testing the financial strength of your business
E. Consideration in Financing, Business Planning, and Risk Management
A guide to finance
Business plan format sample
Risk management strategy
Glossary of Terms

Financial Management © 1
A. Introduction to Financial Management
Introduction
There are two parts to the introduction Financial Management
1. Planning For Business Success
2. Financial Data—the Heart of the Business

Financial Management © 2
1. Planning For Business Success
Introduction
The term financial management of a business means managing the invested money in the business. The invested money in any business will include:
Physical assets—such as facilities, furniture, equipment, machinery, or fixtures
These assets allow the business to function in a physical location.
Working capital—invested in inventory, intellectual property, delivering services.
The business revenue manages inventory, uses intellectual property, and delivers services in the process of earning for the business.
How well the business manages the money invested in the business determines:
How profitable the business will be
The return on investment (ROI) money to the owners
The long-term success of the business
The focus of Financial Management will be operational. That is, it will focus on what managers need to pay attention to on a daily and monthly basis to be good managers of the money invested in the business.
Many business managers assumed their positions without having formal training in business, accounting, or finance.

Financial Management © 3
We designed Financial Management for managers regardless of their background or training.
The intent here is not to train you to be an accountant but to introduce you to ideas and methods of financial management and controls that will help your business.
As well, this material will assist small businesspeople to:
Ask better questions of their accountant
Be better able to interpret the financial reporting their accountant provides
Make better business management decisions
How to use Financial Management
When you completed the internal business plan for your company, the final step was to prepare detailed financial projections. These financial projections show financial information related to the execution of the marketing plan but includes all of the fixed and variable costs of your business. Your accountant may have assisted you to complete this.
Financial Management will help you to do a better job of preparing some of the information for your accountant. It will help you to analyze and interpret the results.
FFoorr eexxaammppllee::
Financial management concepts
Financial management methodologies
How to apply some common financial management methods
How to use and interpret financial information
Some options and approaches that may be applicable to your business
Questions you should ask of your accountant

Financial Management © 4
It is important for any business to use historical financial statements for reference and guidance in preparing financial projections.
It is essential that the business owners refer frequently (at least monthly) to the company's business plan by comparing the pro forma reports to the current actual reports (supplied by the accountant) so make the inevitable adjustments.
This financial data provides a financial picture of where the business is as of the date of the reports and where the business expects to be at various time intervals in the future.
Additionally, there are a number of other reporting tools, methods, and procedures that are useful to the manager monitoring the business's financial health. We introduced several of these along with their uses and application. Compare this information to the way that you presently operate your business.
We recommend that you refer to your business plan at least quarterly. It is not as likely that the business will stray too far from the predicted path in less than a quarter. However, the exception to this would be if the company was making a big change in its direction involving things such as:
Completely new business style
A new division of the company
Introduction of major new offerings or perhaps the discontinuation of traditional offerings
A radical change in advertising and marketing the company
Any change that has the potential for a major impact on the company (ether positively or negatively) is cause for a frequent reference to the business plan as well as checking how any changes affect the use of the money invested in the business. This is financial management of the business.
More detail is provided in the section Financial Data—
The Heart of the Business.

Financial Management © 5
Types of business financial data
Business financial data and reports are tools that keep you on the right track when managing your business. Broadly speaking the data and reports fall into three categories:
Planning and organizational tools
Operational tools
Summary and analysis tools
The financial data included in the internal business plan is of a planning and organizational nature. It should show where your business is now and where the business expects to be at intervals in the future.
An internal business plan does not usually demand as much detail as the external business plan that is also a planning and organizational tool designed for presentation to a lender. Nevertheless, the financial information in your business plan should include:
Current audited financial statements if it is an existing business.
A 3-year financial projection, first year by quarters, or remaining years annually
The projection should include:
Pro-forma income statements (sometimes called operating statements)
Balance sheets Cash flow statement
Capital expenditure estimates Projection of any project
Current development costs such as:
Consulting fees Packaging design
Manufacturing
Design and preparation of marketing materials
Explanation of the use of any investment funds and the expected results from the application of those funds

Financial Management © 6
Financial Management will discuss in some detail operational methods, ideas, and tools that you will use on a daily basis in the financial management of your business.
It also will talk about summary and analysis tools, and the financial reports that you will use to measure and monitor the performance of your business.
Summary
The foregoing is only a general outline and overview of the purpose and use of financial data. Many business owners will require professional help in preparing, organizing, and interpreting their financial data. We strongly recommend this.
To be effective and relevant, review financial data regularly. Complete it in an organized way. Prepare a format—a schedule for reviewing financial information:
Monthly
Quarterly
Annually
This material offers suggestions. Discuss with your accountant what an appropriate review and analysis schedule would be for your business.
Laws of Business—on organization A business organization is a group of people brought together for the
sole purpose of creating and keeping customers. Again, the main purpose overrides all else.

Financial Management © 7
2. Financial Data—the Heart of the Business
"Wherever you see a successful business, someone once made a courageous decision."—Peter Drucker
Introduction
Before you turn a wheel, sell a widget, or accept a contract, it is essential that you decide how you will keep track of the business transactions. Good accounting for your business is important because of legal and tax requirements.
A good accounting system provides you with the tools you need on a daily basis to take the pulse of your business and make the positive business decisions that will keep it healthy and on track.
It should be tailored to your business needs and be simple enough so that it can be maintained on a daily basis. This is how you control your business, know where it has been, and know where it is going.
If you don't have the training or experience to assess your needs and set up an adequate bookkeeping system, hire a competent, certified accountant to do it. It will be money well spent.
Control is essential!
If you don't control your business, your business will control
you!

Financial Management © 8
How to use this information
Financial data will explain the basic business reports necessary to run any business. The purpose is to familiarize you with these reports and their function in managing the business.
We will not attempt to do an in-depth analysis of the reports.
You will learn some common definitions of terms found on financial statements.
You will study some common tests for the financial health of the business—the tests that you should perform on a monthly basis.
The intent is to increase your understanding of financial terms and enable the daily monitoring of business activities. Beyond this, you should consult with your certified accountant for in-depth clarification of actual business data.
The new business owner will find this useful background information in working on the preparation of the Pro-forma financial statements.
The information will help in dealing with your accountant in the set up of the business and in interpreting the reports, the accountant prepares for you.
Besides, it will be useful in closely monitoring the start and on-going growth of the business.
The existing business owner will likely have some level of knowledge of the information contained in this section. However, frequently small business owners have never had the benefit of formal business management training. In that event, this material should be helpful in better understanding the reports prepared by your accountant. Moreover, it will be useful in monitoring business performance and making sound business decisions on a daily basis.

Financial Management © 9
Business reports
Your business needs a specially designed accounting system. However, there is essential reporting that every business must have to effectively plan and direct the business. These key reports are the:
Balance sheet
Income statement
Cash flow statement
Additionally, the business needs to perform regularly a:
Deviation analysis
Break-even point (BEP) analysis
A review of capital expenditure estimates
Correctly used, these reports and analyses act as budgeting tools, an early warning system, a problem identifier, and a solution indicator.
Use regularly and consistently because they are the backbone of the business.
Several hours every month must be spent checking and analyzing these reports.
The reports need not be very complicated and the level of detail will vary with every business. They are a reflection of your business and they are working models of your business.
The more you work with these reports on a monthly basis, the greater your understanding and insight will be as to what your business needs to be healthy and profitable.
A discussion of the some of these reports will follow.
Making business decisions based on poor, incomplete, or superficial information can be disastrous.
A business manager has two prime objectives and they are:
1. To make a profit
2. To pay the bills as they become due

Financial Management © 10
The two key financial statements that convey this information are
1. The income statement (also called the profit & loss statement or the operating statement)
2. The cash flow statement
Capital equipment list
In addition to the above statements, every business should have a capital equipment list. A capital equipment list is a listing of the physical assets of the company.
Maintaining a capital equipment list is important because it helps to:
Maintain control over depreciable assets
Ensure that the reserve for replacement of capital equipment is maintained
Ensure that the reserve for replacement of capital equipment doesn't become a slush fund to cover all sorts of other expenses other than what it was created for
Facilitate the budgeting process as it comes time to replace equipment
None of these expected capital equipment items may wear out for at least several years. However, their cost is depreciable as their life is used up.
Assume that every asset in a company has a useable life and replaced at some point in the future.
An estimate is made of the expected life of the asset and a portion of the original value of the asset deducted each year. This deduction is called depreciation.
The depreciated value of an asset is the value after deducting the depreciation and it shows on the balance sheet.
The depreciation expense is the amount of depreciation deducted each year and shown on the income statement as a used up value.
EExxaammpplleess ooff ccaappiittaall eeqquuiippmmeenntt aarree::
Office furniture and equipment Manufacturing machinery
Store fixtures Company vehicles

Financial Management © 11
The capital equipment list can be very simple and should include columns to record the following information:
The date of purchase
Item description
Model numbers
Cost price including sales taxes and installation fees
As well, columns should be included to record recovery and disposal costs in the event that sold items either before or after it is fully depreciated or costs are incurred in disposing of it.
For some types of equipment, such as vehicles, provide columns for detailing the maintenance and repair costs that are incurred over the life of the asset.
Many computer software accounting programs provide for managing the asset management information.
Summary
In Financial Data, we have provided an overview of the financial reporting needed to monitor the financial health of your business.
We have discussed the relative importance of some of the reports and the need for keeping good records for capital assets.
As well, we have stressed the importance of seeking the advice of your accountant in the financial management of your business.
The main purpose of this financial data is to set the stage for the following sections:
Below are two sample forms:
1. Capital Equipment Record
2. Capital Expenditure Request
1. Financial analysis of operations
2. Operational financial management
3. Monitoring the financial health of the business
4. Consideration in financing, business planning, and risk management

Financial Management © 12
Capital Equipment Record
Asset Group: Equipment #: ___ Record Date: ____
Location: Dept: Req #: PO#: ____
Item Description: Make: ____________________
Model#__________________ Serial#_________________ Purchase Date: _______
Supplier: Phone: __
Address: Fax: ______________
E-Mail: ______________________________________
Contact: Title: __
Purchase detail: Purchase price ______________
GST _______________
PST ______________
Total Cost ______________
Install service fees _____________
Total installed cost __________
Accumulate depreciation __________
Depreciated value ___________
% Depreciated ___________
Company: ________________________
Address: _________________________
Phone: ___________________________
Fax: _____________________________
E-mail: __________________________
Contact: _________________________
Title: ____________________________
Installer/Service Provider:
Estimated Asset Life: Amortization Period:

Financial Management © 13
Maintenance/Repair Record
Date Maintenance/Repair Description
Vendor Cost GST PST Total
Totals
Record additional maintenance and repairs on additional pages
Asset Disposal and Expense
Date of Disposal: __________________
Disposal/selling price: _________
GST ________
PST _________
Total redeemed value _________
Less Disposal expense _________
GST _________
Total Disposal expense _________
Net Asset cost recovery _________
Asset purchaser: Name: ____________________________
Address: __________________________
Phone: ____________________________
Fax: ______________________________
E-mail: ___________________________

Financial Management © 14
Capital Expenditure Request
[Company Name]
ACE.# Date: _____
Authority for: Capital expenditure Major repairs ______
Department name: Dept.# ______
Request authority for the following:
Supplier name: ______
Description Estimated Cost
Labour Materials Sub-total PST GST
Final total
Justification for expenditure:
Safety Replacement equipment ___Necessary repairs ________
Cost saving Business expansion __________________________
Civic code requirements _____________________Other ___________________________
Payback period calculations:
Initial cost: _______________________________________________________________
Annual savings [details attached]: _____________________________________________
Payback period [cost + savings]: ______________________________________________
Estimated date required: _______________Charge to: ____[Dept.] ___________________
Requested by: _____________________________________________________________ [Title]

Financial Management © 15
Approved by: ____________________________________________________________ [Title]
Approved by: ____________________________________________________________ [Title]
a. Attach written estimates whenever possible.
b. Distribution: 1. To Controller for approval
2. To President for approval
3. To Accounting for coding
c. Upon completion of the project, return to Accounting Manager.
Date Completed: _________________Dept. Manager _____________________________
------------------------------------------------------------------------------------------------------------

Financial Management © 16
This Capital Expenditure Request Form is included as an example of how to use a company internal document to justify the need to purchase an asset. It is a good idea for any business to use a form like this to:
Think through the reason for the purchase
What will be accomplished by making the purchase
How long it will take to recover the cost of the purchase
This form is part of the homework done by a manager prior to purchasing capital equipment. Estimates, product information, and attach anything else pertaining to the purchase to this form including in the Capital Equipment list file.
In a small business, the owner or manager of the business would be using this form. In a larger business with several departments or divisions, the department or division manager would complete the form and submit it with all pertinent background information to senior management and the Controller.
After the purchase is approved and completed, the details of the purchase are recorded on the capital equipment form.
The Law of Money—of abundance There is an ample supply of money for all who want it.
To get your share, decide to be rich, and obey the Laws of Cause and Effect as they apply to money.

Financial Management © 17
Celebrate!!

Financial Management © 18
B. Financial Analysis of Operations
Introduction
In Financial Analysis of Operations, we will discuss three basic components of operational financial analysis:
1. Job costing analysis preparation
2. Financial feasibility of business offerings
3. Break-even point (BEP) analysis
In these segments, you will learn how to apply methodologies for internal analysis in any business. A brief outline of these segments follows:

Financial Management © 19
(1) Job costing analysis preparation
Job Costing Analysis Preparation presents in detail the steps any business would take to:
Determine the fixed costs of the business
Determine the variable costs of the business
Ensure that the business recovers both fixed and variable costs in the pricing of its offerings
Ensure that the business owner prices offerings at a level that will provide an adequate return on investment (ROI) after paying expenses
Based on an actual architectural service business, this sample shows the steps taken in the analysis of fixed costs and the variable costs relating to projects. Translating the analysis of the price of the offering is included in several examples.
(2) Financial feasibility of business offerings
Financial Feasibility of Business Offerings discusses the factors that the business owner should consider in:
Assessing the financial feasibility of new offerings
Assessing the financial feasibility of existing offerings
A few of the factors involved in assessing the financial feasibility of an offering are:
Changing market conditions
Customer and client analysis
Changes occurring in the competitive environment
How the offering relates to the offering mix
What it will cost to effectively market the offering
Changes that may be occurring to the ROI of the offering
The examples in this material will enable you to relate the ideas to your business. It will help you to determine if you will make a profit marketing your offerings to your chosen market segments.

Financial Management © 20
(3) Break-even point (BEP) analysis
The material discusses break-even point (BEP) analysis and the uses of various ways to the monitoring of your business performance.
A business manager will apply break-even analysis in one of its variations in many aspects of the business such as:
Testing the financial feasibility of a new business opportunity
Assessing the current financial viability of existing business segments
Pricing merchandise at a level that will fully recover costs and generate a projected ROI
There are several examples of several forms of break-even point (BEP) analysis and their possible use to your business.
When you finished this section, think about the many ideas by asking yourself if:
Your business would benefit from a detailed analysis of the fixed and variable costs
You are now realizing full-cost recovery in the pricing of your offerings (product and services)
You always analyze the financial feasibility of new ventures
You frequently test the financial viability of operations using break-even point (BEP) analysis
You are pricing for profit through the use of break-even point (BEP) analysis
The Laws of Business—of innovation Breakthroughs come from innovation—offering something better, cheaper,
faster, newer, or more efficient. All you need to break through is one good idea.

Financial Management © 21
1. Job Costing Analysis Preparation
Introduction
It is important for every business to determine accurately its fixed costs and variable costs. After that, the business must ensure that the revenue the business generates from the sale of its offerings counterbalances these costs.
In Job Costing Analysis Preparation, we will first demonstrate how a business analyzes and determines the fixed and variable costs.
Later in break-even point (BEP) analysis, we will discuss how the business uses information on fixed and variable costs to:
Test the profitability of the business
Project the viability and profitability of venturing into new markets
Project the viability and profitability of new offerings
Price offerings on a daily basis at levels that will ensure projected profits
In Job Costing Analysis Preparation, we will explain how a company analyzes its fixed and variable costs and then ensures that the business recovers those costs and an adequate profit margin in the pricing of its offerings in every segment of business activity.
For illustration purposes and simplicity, we will use a fee for service business. It is an architectural services company managed by the owner and five staff.
As you move through this example, ask yourself how the ideas and methods presented here would apply to your business.
Any type of business may use the ideas discussed. Every business situation will be different so be prepared to customize this process to meet your company's needs.

Financial Management © 22
The job costing process
Step #1—Research fixed costs
Begin by thoroughly researching the fixed costs of the business for at least the past two years.
The purpose is to arrive at a base figure that accurately represents the total annual fixed costs.
With some expenses, you may want to take an average of the cost over the two-year period. It is really for you to decide if periodic fluctuations in a cost warrant averaging the cost.
You should adjust the base fixed-cost figure to reflect any estimated growth or decline in fixed costs to arrive at your estimated annual fixed costs.
There may be many other items depending on the situation of each business. Whatever the base or total fixed cost figure is, you should review it every year and make any necessary adjustments using the same simple methodology.
The job costing process has six steps:
1. Research fixed costs
2. Determine revenue necessary to offset fixed costs
3. Calculating employee charge rate to recover costs
4. Segmenting services
5. Analyzing employee involvement and variable costs
6. Arriving at a price
Fixed-cost items would include:
Rent Mortgages Long-term loans
Heat Light Telephone
Building maintenance Administrative expenses

Financial Management © 23
Step #2—Determine revenue necessary to offset fixed costs
The second step is to express the total of the fixed costs in terms of how much money the office must generate to offset those fixed costs.
If the office functions on a 40-hour week, that translates to 40 x 52 weeks or 2,080 hours of operation per year.
Therefore, if you divide the estimated annual fixed costs by 2,080 hours, the result is the absolute minimum charge-out fee to recover those costs.
This is the absolute minimum amount of revenue that the business must generate to recover only the fixed costs.
As well, it is useful to know what the charge-out rate would be if salaries and benefits are removed from the formula.
These hourly charge figures represent how much the office must generate every hour that it is open to offset the operating costs.
No allowance has been made for profit or ROI (Return on investment). Therefore, the actual hourly rate charged for projects must be substantially more.
For example:
If the total fixed costs are $250,000, then the minimum hourly charge is $250,000/2,080 hours = $120.19/hour
For example: Estimated total fixed costs—(salaries + benefits)/total hours Assuming salaries + benefits are $150,000, the hourly rate would be: $250,000 – $150,000/2080 hrs = $48.08/hour

Financial Management © 24
Step #3—Calculating employee charge rate to recover costs
Now, calculate the basic recovery charge-out rate for every employee in the operation including his or her portion of benefit costs. If the total benefits are 15% of the salary expense, here is what your analysis would look like:
These figures represent how much the business must charge for each employee for every hour that the business is open.
Therefore, the charge-out rate on projects must be substantially higher to allow for variable costs, profit, and ROI.
The example assumes declining salary levels from the owner at $70,000 to the lowest employee at $30,000.
For example:
Employee #1 $70,000/2,080 hrs = $33.65 + 15% = $38.70/hour
Employee #2 $40,000/2,080 hrs = $19.23 + 15% = $22.12/hour
Employee #3 $35,000/2,080 hrs = $16.83 + 15% = $19.35/hour
Employee #4 $35,000/2,080 hrs = $16.83 + 15% = $19.35/hour Employee #5 $30,000/2,080 hrs = $14.42 + 15% = $16.59/hour

Financial Management © 25
Step #4—Segmenting services
Segment all service components provided by the business. In the case of this example, a company providing architectural services, the components might be:
Design
Municipal approval
Construction documents
Construction services
Perform a two-year review of each of these service components for each business segment and break them down into each cost item.
The office time contributed for each employee is partially offset by salary expense but the other items are all variable costs that must be recovered through the hourly charge-out rate for the project.
By analyzing the history, you can usually predict (quite accurately) the percentage of variable costs to each type of total project cost.
For example:
Time each employee contributed directly in office preparation
Time each employee contributed in meetings
Production materials Site services time
Travel costs Telephone attendance time
Telephone expense Additional insurance costs
For example: If a certain type of project:
Takes an average of 100 hours to complete
The variable costs average is about 25% of the total job cost
The average revenue generated is $10,000
In this scenario, calculate the variable cost recovery factor as follows: $10,000 x .25/100 hours = $25.00/hour

Financial Management © 26
Each year, review the project history so that any necessary adjustments are made to this factor.
Step #5—Analyzing employee involvement and variable costs
At this point, analyze how much of each employee's time is typically involved in each service component on each project.
Extend and total the salary and benefit cost that it represents
Now, you can calculate the typical percentage of revenue that it represents and the hourly rate recovery factor.
Step #6—Arriving at a price
To be able to arrive at a project charge out rate that will recover the fixed and variable costs you must look at the typical production of the company.
For example:
Total salaries + benefits/100 hours = salary/benefit hourly recovery factor
For the sake of illustration, this might work out to be $55.00/hour
For example: If the company is operating at or near capacity, has been completing 15–
18 projects a year, and the projected volume for the year is 20 projects, then take a middle-of-the-road approach and use 18 projects as your reference point.
With reference to how many of each project type are involved, calculate the total number of hours for all projects.
Multiply the total project hours x (salary/benefit recovery factor + variable cost recovery factor)
If total project hours were 1,500 hours, then the calculation would look like this: 1,500 project hours x ($55.00/hour + $25.00/hour) = project expense recovery
Therefore, the project expense recovery = 1,500 x $80.00 = $120,000

Financial Management © 27
How does this compare to the projected operating costs for the company that we estimated in step #2?
Recover the total operating expenses by the work that is completed.
Therefore, the project expense recovery factor must be increased so that based on the projected volume (total operating costs + gross profit) are achieved.
In the beginning, we said that fixed costs were $250,000.
To offset this, based on productivity, the project expense recovery rate (PERR) must be:
This factor is grossed upward to generate the gross profit margin you wish to achieve by dividing it by the difference between 100% and the % gross profit goal.
If you wish to achieve a gross profit of 15%, you would divide the PERR rate by 1.00 –.15 = .85 to arrive at the project hourly charge-out rate (PHCOR).
The calculation is:
Now, if you apply this rate to your projected 1,500 hours of project time, the result is $294,120.
All of your expenses are covered and also you have allowed for generating a gross profit of $44,115.
Of course, your analysis for your business will result in quite different figures but the methodology is the same. Completed this analysis periodically throughout the year ensures that the cost recovery and project goals are achieved.
$ 80 = PERR $120,000 $250,000
Therefore: PERR = $80 x $250,000 = $166.67/hour $120,000
PHCOR = PERR = $166.67 = $196.08/hour .85 .85

Financial Management © 28
Summary
In Job Costing Analysis Preparation, we have demonstrated how to calculate a job costing analysis for a business. The process illustrated here is the same for any business.
We used a fee-for-service business as an example because it made it easier to demonstrate the ideas involved.
However, in a business that sells products derive the revenue from the sale of products. In that situation, consider only the net revenue or gross profit derived from the sale of the products when computing the calculations.
Knowing the fixed and variable costs of the business is a key factor in performing break-even point (BEP) analysis (discussed later).
In Monthly Performance Review and Analysis, we will look at how a business would use the job cost analysis and break-even point (BEP) analysis to measure the current performance of the business.
The Laws of Money—of exchange Money is the medium for exchanging goods and services.
It replaces barter. What you earn in an open market shows the value others place on what you

Financial Management © 29
Anyone for a little surfing?
Celebrate!

Financial Management © 30
2. Financial Feasibility Study of the Business's Offerings
Introduction
Whether it is a new business or an existing business, the decision-making process regarding what offerings your business is going to market, or is marketing, are the same.
We have assumed that you have already completed:
Competition and your competitive edge
Market analysis
A customer/client profile analysis
Products and sources of supply
The marketing plan
The target market and target marketing plan
A financial feasibility study will determine if your offering mix or offering line is financially doable. It answers this question:
Will you make a profit with this offering line or offering mix to these designated market segments?
Note: We are using the term offerings to indicate either
products or services.
For detailed information about any of the above topics,
see The Business Plan

Financial Management © 31
How to use this information
Assume that you have already made tentative decisions about what offerings the business will sell. Take the last step to complete a financial feasibility study of the offerings before coming to a final decision about what offerings will sell. This feasibility analysis will determine if you can make a profit using this market segment with these offerings.
For a new business, project the offerings and the calculation estimates based on industry norms derived from your market research.
An existing business has the advantage of having historical data. Furthermore, it has a great deal of local knowledge about the market it serves. However, every time a business plan is prepared, it is important to go through the same process. It is important to:
Test the current offerings mix
Examine and consider new offerings that may be available or offered by competitors
Through the financial feasibility process outlined below, your business will decide at regular intervals (yearly business plan process) whether to:
Add new offerings
Expand, curtail or eliminate current offerings
This analysis is an important forerunner to the development of goals and results (objectives) and especially to the marketing strategy of the business plan.
The reason is to direct the major commitment of the resources of a company towards the marketing of whatever offering mix is selected.

Financial Management © 32
The analyzing process
Use this analyzing process to determine if it is financially doable to sell the offerings
To the various specified market segments
At the specified prices
No two businesses are the same. In addition, the relationship between business segments is often constantly changing.
Here is an example of three of the steps (2, 3, & 4) mentioned above and how decisions can be made because of the analysis.
The chart below provides the answers to the first five questions listed above:
The six steps of this analyzing process are:
1. List and describe the various offerings of your business (either the ones that you already have on hand or those that you tentatively have chosen.)
There is an example below that demonstrates the next three steps. (2, 3, and 4)
2. Describe the relationship, if any, between each market segment of your business
Describe the part each market segment plays in the business
Identify the relative importance of each market segment of your business
3. State the volume contribution of each market segment versus the time spent and expenses incurred
4. State the profit contribution of each market segment versus the time spent and expenses incurred
5. Show a break-even point (BEP) analysis of each market segment (See Break-even Point Analysis)
6. Draw conclusions about your offering mix and your market segments

Financial Management © 33
The five market segments in this example are retail, commercial, industrial, government and institutional.
The volume's contribution of each market segment is 25%, 45%, 15%, 5%, 10% respectively
What proportion of revenue does each market segment contribute to the business? (See number 1 in the chart below.)
What is the profit contribution of each market segment? (See number 2 in the chart below.)
What is the proportion of the expenses used by each market segment? (See number 3 in the chart below.)
Ret
ail
Com
mer
cial
Indu
stri
al
Gov
't
Inst
itutio
nal
1. Proportions of revenue
25% 45% 15% 5% 10%
2. Profits contributed
55% 30% 3% 5% 7%
3. Expenses used 30% 45% 10% 10% 5%
You, or your business manager, may well decide that the sales volume and profit contribution of the industrial, government, or institutional business is not worth the drain on the resources of the organization.
Because of the analysis, decide if it could cut back or eliminate these market segments.
In this example, the commercial business segment uses 45% of the expenses and only contributes 30% of the profit. However, in this type of business often volume buying required to service the commercial business segment lowers the overall cost of the offerings.
The commercial business segment enhances the profit margin of the retail market segment. If the company reduces the commercial business, it could have an adverse effect on the total profit of the company.
Therefore, the decision will likely be to retain the commercial market segment.

Financial Management © 34
As you can see from this simple example, the relationship between market segments can be complex and have many variable factors to consider. It is, therefore, very important that these relationships be analyzed frequently.
You have completed the market research—now you can make some final decisions about the specific offerings with which you will provide your customers. Make those decisions.
Complete this analysis more frequently than once a year. Add these other analyses to your business plan as addenda.
If you are an existing business, indicate the ones added, modified, or changed from the last business plan. (Use colour for this step.)
Uses of the analysis
There are several uses for the offering analysis. Use it to:
1. Assist you in developing goals and outcomes for your business plan
2. Make decisions about retaining or dismissing either market segments or specific offerings
3. Make decisions about adding or modifying offerings or market segments
4. Make decisions of which market segments and offerings your new business will have
5. Write your marketing plan
It should include all the details that are pertinent to the offerings like the:
Exact quality of offerings Name brands
Volume Sizes
Names of wholesalers Size of inventory

Financial Management © 35
Summary
In Financial Feasibility Study of the Business' Offering, we had discussed the process of determining what the targeted market segments are and marketing which offerings. This provides you a framework for making decisions about the offerings your business would market.
The process discussed here is one that all businesses should do at least once a year. As well, if you are contemplating:
A change of direction for the company
An expansion to new facilities or new markets
An addition of a major product line
The Laws of Money—of capital Your most valuable asset is your earning ability.
It's physical, it’s mental—it's your capital. And, your most precious resource is your time.

Financial Management © 36
Celebrate!!

Financial Management © 37
3. Break-even Point (BEP) Analysis
Introduction to break-even point (BEP) analysis
The break-even point (BEP) analysis is one of the most important tools in assessing the viability of pursuing new market segments as well as the relative return on investment (ROI) of various existing market segments.
A break-even point (BEP) is the point where the business' total costs will just equal its total revenue.
If you know the break-even point (BEP), you have a definite target to shoot for and can put a step-by-step strategic plan together to achieve the goal.
For example
Legend
Red bracket indicates the loss area
Pink bracket indicates total variable costs
Green bracket and line indicates total fixed costs
Orange bracket indicates profit area
YYeellllooww oval indicates the break-even point (BEP)

Financial Management © 38
A break-even point (BEP) analysis can evaluate possible prices.
Express the objective in dollars or units of product. A business should do a break-even point (BEP) analysis frequently. Then, it can be constantly aware of what has to be achieved before the business begins to make a profit.
Certainly, before embarking on new programs or focusing on new markets, take in account all the expected costs and complete a break-even point (BEP) analysis. Sometimes, what looks like an attractive business opportunity is not so great upon closer examination.
Increased sales do not necessarily mean increased profits. This is because a dramatic increase in sales, or the launch of a new program, may necessitate the purchase of additional equipment or the funding of additional internal or external resources.
The result could be that the bottom line or net profit to the company will stay much the same. In other words, the return on investment (ROI) is not worth the additional expense. Sometimes, this is only a short-term effect and, in the long run, making the investment may be a good decision.
Every business case is different and only the business owners or managers can make that decision. What often happens is the additional investment creates unused capacity in the business; thus, the significant increase amount of business required to break-even or reach profit goals.
The break-even point (BEP) analysis helps the business owner or manager to make intelligent decisions when considering new programs or any additional investment in the company.

Financial Management © 39
How to use this information
Some of the figures you need to calculate the break-even point (BEP) will have to be estimates. It is often a good idea to use very conservative sales figures and overstate the expenses somewhat.
Performing a break-even analysis
Calculating the break-even point (BEP) can be simple for a single offering business, but more complex for multi-line or multi-service businesses. Whatever the complexity, the basic technique is the same.
The basic break-even point (BEP) formula
Formulae Meaning of the formulae Example
S = FC + VC S = Break-even level of sales in dollars $221 = $55 + $166 FC = Fixed costs in dollars FC = $55 VC = Variable costs in dollars VC = $166 Examples of fixed costs are
Rent Management salaries Office and administrative expenses
Property tax and insurance Interest on loans Depreciation
Examples of variable costs are
Raw material Labour (wages) and payroll taxes Packaging materials Outgoing freight Sales commission Contract people
Advertising and promotion Expenses for parts Utilities Equipment maintenance Miscellaneous expenses (office supplies, garbage removal)
Note that both fixed and variable costs are part of operating expenses and they appear on the monthly operating statement (sometimes referred to as the profit and loss statement). A business selling offerings buys and sells inventory.
Inventory is not part of operating expense. It is part of cost of goods sold (CGS). The examples that follow show the application of a gross margin (GM) to the sales price in order to determine break-even point (BEP) s and profit goals.

Financial Management © 40
The methodology is valid in either a fee-for-service business with no inventory or a business selling offerings. However, in businesses with inventory, there are other issues related to accounting for inventory, inventory management, and offering turnover that will not be dealt with in this section.
Assignment of Costs
Complete the assignment of costs as detailed or generally as necessary. However, always complete it on the basis of percent (%) of sales (revenue).
In a business, that has several divisions or aspects to the business, (such as offering sales, a service department, and product installations) properly assign a fair share of the common overhead expenses. This assignment or pro-rating of common expenses is accomplished on the basis of the sales contribution of the different divisions.
If property tax and insurance were $40,000
And the total sales revenue were $600,000
Then, property tax & insurance represents
$40,000/$600,000 = .066 or 6.6% of sales
FFoorr eexxaammppllee
If the offering sales account is 45% of the total revenue
The service department is 30% of total revenue
And the product installations is 25% of total revenue
Then, divide the office and administrative expense of the company in the same proportions between those divisions.

Financial Management © 41
Take the same approach within a department in order to assign costs to a particular major offering group or a special project.
Examples of variable costs
1. In a manufacturing business where acquiring raw materials is necessary, these commodities probably fluctuate in price. Labour costs may vary, and sales commissions or shipping costs may change.
2. In retail or wholesale businesses, the cost of goods sold (CGS) could increase or a new labour agreement with warehouse staff would increase labour costs. If the public carrier you use has to increase their rates suddenly, it will obviously increase shipping costs and affect the profitability of the business.
3. In a service business, starting a new project or service may require a greater amount of the business' resources than expected. Without careful analysis of the internal and external costs that would be involved, the business could be in for a nasty surprise. Some typical factors to examine are:
The extra people necessary
The additional resources devoted to servicing the client in the office
The additional resources devoted to servicing the client in the field
The additional marketing costs to launch a new program
The possible increased liability exposure to the company
The possible current and future costs imposed by regulatory agencies
To what extent will the new program impact the financial resources and people resources of the company and, for what period?
Without developing careful estimates of the expected costs and applying a break-even point (BEP) analysis test, the business could embark on a new program that could prove to be disastrous for the business.
When doing these tests, develop at least three projections:
An optimistic result projection
An average result projection
A pessimistic result projection

Financial Management © 42
Variation of the break-even point (BEP) analysis
Considering all the variable costs can require detailed analysis and very thoughtful consideration. This is necessary if you really want to know the true profit picture of the business.
If you are calculating a projected break-even point (BEP), you may not know all of the variable costs, that being so, you may want to estimate various scenarios. In other words, prepare an optimistic, an average, and a pessimistic scenario. To perform these, a variation of the break-even formula may be used.
There are at least three variations of the break-even point (BEP) analysis. Open up the Break-even analysis in Microsoft Excel on your CD and work through the interactive sheets with these variations.
(1) When the gross margin (GM) is known
Formulae Definitions of the elements of the formula
Example
S = FC+VC/GM S = break-even level of sales in dollars
S = $2,579.55
FC+VC = fixed and variable costs in dollars
FC+VC = $227.00
GM = gross margin as a % of sales
GM = 8.8% (.088)
Therefore, if you know what gross margin (GM) you normally expect to generate, you can test to see whether you recovered your basic costs.
You may get this information from previous years' financial statements.
You may also obtain it by consulting industry standards for your type of business.
In the above example $2,579.55 (S) = $227 (FC+VC) divided by .088 (GM)
Alternatively, stated in another way:
.088 (GM) times $2,579.55 (S) = $227 (FC + VC)

Financial Management © 43
Then, based on this historical information and actual percentage to sales relationships of expense items, you can estimate how much gross margin (GM) those expenses will likely consume. Equipped with this information, you can now make any necessary adjustments to gross margins or expenses to ensure the profitability of the business.
If you are selling products, you may translate the dollar break-even point (BEP) into units of product by simply dividing by the unit cost of the product. (See the two examples below)
To arrive at sales objectives for your sales people, you now are able to calculate how many units they must sell before the company starts to make a profit
For some businesses, you may want to extend the exercise to show how many customers are needed to be profitable. See the example that follows.
Here are two examples of using the break-even point (BEP) analysis formula:
Example 1
Money needed per year/month for a break-even point (BEP)
FC + VC = fixed costs + variable costs $14,700 per year GM = gross margin 20.7% BEP = FC + VC/GM (per year) (BEP means break-even point (BEP)
$14,700/.207 = $71,014.50 (per year)
*BEP per mo. = BEP per year/12 $71,014.50/12 = $5,917.87 (per month)
In the example above, we illustrated: .088 (the GM) x $2,579.55 (Sales) = $227.00
(the sum of the FC+VC)

Financial Management © 44
Example 2
You need the number of customers per day for a break-even point (BEP). There may be hundreds of items, all at different prices. This example simply assumes, for illustration purposes, that the average per unit is $3.00 in order that you can determine an approximate number of sales necessary for BEP.
If the average unit selling price is $3.00
The average customer purchases two times per week $6.00
There are 4.3 weeks/month therefore, the average customer sales/month = 4.3 x $6.00 =
$25.80
BEP = FC/GM (per month) $5,917.87
Consequently, the customers needed for a break-even point (BEP) are: $5,917.87/$25.80 = $230 x 12 month = $2,760 per year/365 days =
7.6 customers
per day
We rounded off the above figures off for simplicity. In addition, the example is typical of a business that sells products rather than a fee-for-service business. In a fee-for-service business, the GM percentage would be much higher, perhaps 60% or more and the necessary sales would then drop significantly.
For example
$14,700 (expenses)/.60 (GM) = $24,500 (sales)

Financial Management © 45
(2) Profit planning formula
The break-even analysis can be adapted to profit planning by simply altering the formula slightly.
This formula shows that if you subtract the sum of the fixed costs and the variable costs from sales, the left over is the profit to the company.
Of course, if S - (FC + VC) = 0, then P in this formula is actually the break-even point (BEP) because the sales are exactly offset by the fixed costs and the variable costs.
In practice, use the profit-planning version of the formula when the GM is known or assumed to be at a certain level.
There are several uses of the profit planning formulae:
1. To illustrate the process, refer to our previous Example #1 where we show how a GM of 20.7% of sales is necessary for the business to break-even. Most people would not be satisfied with only breaking even. (GM = gross margin)
After all, they may have their life savings invested in the business and could probably get a better return on their money by making other investments or simply leaving the money in the bank and drawing interest on it.
The basic formula is P = S - (FC + VC)

Financial Management © 46
2. Let us assume that the owners of the business in Example #1 feel that they should earn a 10% return because that is comparable to what they could earn on their money elsewhere.
So now, rather than the GM being 20.7% of the selling price to equal the expenses, the GM will have to be approximately 31.0% of the selling price in order to offset the expenses and provide a profit of approximately 10%. In other words:
.31 of the selling price (S) = profit (P) + costs (FC + VC)
Formula Example
.31S = P + (FC + VC) .31 x $71,014 = P + $14,700
$22,014.49 = P + $14,700
P = $22,014.49 – $14,700
P = $7,314.49
(3) Pricing product to achieve profit margin goals
Now that you have established the gross margin (GM) necessary to cover costs and achieved the desired profit, how can you easily use this information to properly price products?
The following formula will illustrate this as it applies to the example above: S - .31S = C
The selling price (S) – .31S = cost of inventory (C)
S - .31S = C
.69S = C
.69 x $71,014.50 = C
C = $49,000
What we have shown here is that:
If the GM is 31%, the cost of inventory is $49,000/$71,014.50 = .69 or 69% of the selling price.
Accordingly, divide the cost price of any inventory item by .69; we will know the appropriate selling price to yield the desired GM of 31%.
The formula is S = C/.69

Financial Management © 47
The formula presented here is useful in maintaining selling prices at levels consistent with the levels of GM percentage yield desired. This approach is also consistent with the way the business operating statement shows the financial data.
The profit-planning formula is a useful tool in determining what sales are required to achieve a desired profit goal.
You can see how useful and important the break-even point (BEP) analysis and the related formula are to daily operations and to business planning. There are many ways to use this technique and we have only discussed a few here.
After consultation with your accountant, and performing a break-even point (BEP) analysis, you may decide to lease that expensive piece of equipment rather than buy it. Be creative and use the break-even point (BEP) analysis in areas of the business other than sales. You often have more control over expenditures than you do over sales.
A break-even point (BEP) analysis is helpful but do no follow it blindly. It is useful for analyzing costs and for evaluating alternatives. The prudent business owner or manager should also relate any analysis to a 'gut feeling' for the needs of the marketplace.
FFoorr iinnssttaannccee
If you were thinking of making a significant capital investment in the business, you might apply the above formulas to:
Project a worst-case business scenario
Project a best-case business scenario
Project a most probable case scenario for your future business

Financial Management © 48
Points to consider when using break-even analysis and related formulae
The break-even point (BEP) analysis does not consider the effect of price on the quantity that customers/clients will want (the demand curve).
It evaluates whether the company will be able to break-even with a particular price, on a specific offering, at a particular point in time.
It is usual to base the factors used in the formulae on historical data.
The marketplace is unpredictable and conditions can, and do, change very rapidly.
Thus, although break-even analysis and the related formulae are very useful tools, the business owner or manager must use them in relation to her/his best estimate of the changes in market conditions.
Sudden increases in operational costs can impact profitability.
Sudden increases in offering cost prices can necessitate big increases in pricing that may result in plummeting sales.
Unexpected consumer demand may result in shortages of supply or the need to commit greater resources to customer service. In either event, the impact on profitability could be significant.
Suddenly confronting the business with extremely strong price competition could drive prices down and affect profits.
It is a good idea to get in the habit of testing and monitoring the performance of the business on, at least, a quarterly basis.
Risk assessment and break-even analysis should be part of any business plan along with the development of contingency plans in case of the worst-case scenario occurring.

Financial Management © 49
Uses of the break-even point (BEP) analysis
The break-even point (BEP) analysis can to be used to:
Evaluate possible prices of the various product lines
Monitor the viability of existing business segments
Assess the viability of pursuing new market segments
Assess the relative return on investment (ROI) of various existing market segments
Test the effect of changing market conditions on business segments
Test the viability of any expansion plans such as adding new equipment or entering a new market
Assess after adding additional production equipment
Assess after increasing staff for any reason
Assess if there are sudden increases in fees, licences, or taxes from government or regulatory agencies
Assess after—increasing marketing costs to promote an offering.
Assess after—increasing marketing costs to service a new market.
Summary
In this material, you have learned how important break-even point (BEP) analysis is as a business-monitoring tool. We have discussed variations of the break-even point analysis and examples of how to use them within the business. We have shown you how to use break-even analysis and its variations to:
Test the feasibility of new business ventures and offering introductions
Test the effect of changes in market conditions
Price offerings at a profitable level
The Laws of Money—of time perspective The most successful people make their day-to-day decisions by
considering the longest time period. Delayed gratification is the key to financial success.

Financial Management © 50
Celebrate!!

Financial Management © 51
C. Operational Financial Management
Introduction
In Operational Financial Management, the focus will be on the following three topics:
1. Inventory management
2. Accounts receivable and credit policy
3. Preparing pro-forma cash flow statements
Operational Financial Management is particularly concerned with managing the flow of cash in and out of the business. It is also concerned with how to utilize the cash by the business to provide the best return on investment (ROI).
As you move through this section, think of how you presently manage your business in relation to these three subject segments. A brief outline of these segments follows:

Financial Management © 52
1. Inventory management
In Inventory Management, you will learn the different ways in which inventory is evaluated. Samples will provide you with examples that will help you in properly evaluating the inventory in your business.
Managing the product mix in a business can be a complex issue. Inventory Management will present ideas on how to manage the product mix to obtain the best return.
As well, you will learn the importance of maximizing inventory turnover. You will see ideas and examples that you can apply to your business.
2. Accounts receivable and credit policy
In this segment, you will learn the importance of designing a credit policy that will best serve the needs of the business and market it serves. You will learn that creative use of credit policy can be an important part of both:
The sales and marketing management of a company
The financial management of a company
We will discuss the effect on the business of effective credit policy and management.
You will learn about the typical accounts receivable (A/R) reporting tools and their use.
You will also learn methods of managing credit sales and the resulting accounts receivable (A/R).
Financial Management © 53
3. Preparing pro-forma cash flow statements
In Preparing Pro-forma Cash Flow Statements, we will present in detail the elements of a cash flow statement and its preparation. You will learn, step by step, how to prepare a cash flow statement and will be able to apply this directly to your business.
We will discuss the importance of using the pro-forma cash flow statement to:
Forecast the expected revenue and expense for the fiscal year
Plan for potential shortfalls in business revenue
Communicate financing needs to a lender
At the end of this material, we provide sample spreadsheets to assist you in preparing a cash flow statement for your business.
When you have finished, think carefully about the ideas presented. Consider how you operate now and what ideas would improve your business now or in the future.
The Laws of Business—of obsolescence Whatever is, is already becoming obsolete.
Change prevails—–it's unavoidable. A successful business adapts quickly; even better,
it helps create change.

Financial Management © 54
1. Inventory Management
Introduction
For any company that handles inventory, the inventory represents a major investment for the company. For many companies, the value of the inventory is the value of the company. It may be the largest asset of the company. Therefore, inventory deserves careful attention and proper management in order for it to yield the maximum return on investment (ROI) to the company.
The purpose of Inventory Management is to generate more awareness of common approaches to managing inventory. We will discuss some inventory management ideas in income statement analysis in relation to the cost of goods sold (CGS)—ideas such as inventory turnover and the evaluation of inventory.
Now, we will build on those ideas and discuss other ideas related to good inventory management.
We will focus on four important areas:
1. Inventory evaluation
2. Managing the product mix in inventory
3. Inventory investment
4. Inventory turnover
How to use this information
As you read this material, you should think about:
How you presently manage the inventory in your business
What you presently do to manage the amount of money invested in each product category
What do you now do to manage and control the quality of your inventory
What do you do now to promote inventory turnover

Financial Management © 55
a. Inventory evaluation
Evaluation of the inventory can vary with the industry and the type of business.
Natural resources, manufacturing, distribution, and retail—all of these industries may evaluate inventory differently.
Within these industries, evaluate some groups of products differently because of the nature of the product and the handling of it.
If your industry or business has special inventory evaluation concerns, you should consult your accountant for direction.
For the purpose of discussion in this segment, we will only be concerned with presenting the main approaches to inventory evaluation.
There are three methods of inventory evaluation:
a. First in first out (FIFO)
b. Last in first out (LIFO)
c. Weighted average
From an accounting point of view, it usually doesn't matter the choice of method as long as its use is consistent. However, each method can affect cost of goods sold (CGS) differently. In addition, the rate of inventory turnover and tax considerations may influence the choice of method.
For the purpose of illustration of these three methods, in the next three segments we will use the following example:
Acme Mercantile inventory records show the following information.
Beginning Inventory Units 1000 @ $1.00 ea. = $1,000 Purchase #1 Units 2000 @ $1.12 ea. = $2,240 Purchase #2 Units 2000 @ $1.22 ea = $2,440
Total Units 5000 Total value $5,680
Ending Inventory Units 2000
Units Sold 3000
This example indicates only two purchases; however, in practice, there may be many purchases.

Financial Management © 56
(1) First In first out (FIFO)
The FIFO method of inventory evaluation assumes that:
The first items (purchase for inventory) are the first items sold.
Therefore, using the assumed figures for Acme Mercantile, the following scenario illustrates how the FIFO method works.
If 3000 units are sold:
Units Sold 1st Units sold 1000 @ $1.00 ea.= $1,000 2nd units sold 2000 @ $1.12 ea. = $2,240 Cost of Units sold $3,240 Cost of units remaining in inventory $2,000 x $1.22 ea.= $2,440
(2) Last in first out (LIFO)
The LIFO method of inventory evaluation assumes that:
The last items purchased for inventory are the first items sold.
Therefore, using the assumed figures for Acme Mercantile, the following scenario illustrates how the LIFO method works.
If 3000 units are sold:
1st units sold 2,000 @ $1.22 ea. = $2,440 2nd units sold 1,000 @ $1.12 ea. = $1,120 Cost of units sold $3,560 ----------------------------------------------------------------------------------------- Cost of units remaining in inventory 1,000 x $1.22 ea = $1,220 1,000 x $1.00 ea = $1,000 Total cost of remaining units in inventory = $2,220

Financial Management © 57
(3) Weighted average
The weighted average method of inventory evaluation assumes that:
Unit cost of inventory is the total cost of inventory divided by the number of units.
Therefore, using the assumed figures for Acme Mercantile, the following scenario illustrates how the weighted average method works.
If 3000 units are sold:
Weighted average cost is $5,680/5,000 units = $1.136/unit Therefore, cost of units sold is 3,000 x $1.136 = $3,408 Total cost of units remaining in inventory is 2,000 x $1.136 = $2,272
In the three methods of inventory evaluation, you can see that:
The cost of units sold is different
The cost of the units remaining in inventory is different
The reason is that the evaluation assumption is different. None of the three methods are wrong, but the method chosen will affect the cost of goods sold (CGS) calculation and hence the profit calculation for the period.
1. The FIFO method is the most widely used. It produces values closer to current market values since it includes costs that are more current.
You could say that this method encourages the turnover of inventory because the better the turnover rate, the closer the inventory valuation will be to current market costs.
However, it still slightly underestimates current market value because it does include earlier costs.
2. The LIFO method generally results in undervalued inventory.
If you use this method, you are not allowing for the replacement cost of your inventory.
LIFO may not be acceptable by governments in some jurisdictions because, by undervaluing inventory, the CGS is overstated and this has the effect of lowering the taxable income of the company.
3. The weighted average method tends to produce values that are similar to FIFO because it blends the cost of all the items in inventory. However, this does depend on the type of business and the turnover rate.

Financial Management © 58
(4) Periodic and perpetual inventories
The inventory calculation examples (shown above) assume that on a periodic basis, the inventory is counted and evaluated. It is a legal requirement in most jurisdictions that at least once a year or in a 12-month period, there should be a complete physical inventory
In practice today, many businesses use a perpetual inventory system where the cost of blending existing inventory constantly with the cost of new items acquired for inventory.
Electronic inventory management systems and accounting software handles perpetual inventory systems with ease.
Many such systems will allow inventory calculations using the different methods of evaluation.
Sometimes, within a particular business, evaluating product categories differently can present a more accurate picture for tax purposes.

Financial Management © 59
Managing the product mix in inventory
The product mix is a term that refers to the product selection that a company stocks and the amount of those products that are stocked. The product mix in the inventory of a company is very important. If you don't have the right amount of each product at the right time, it can have a significant effect on the profitability of the company.
Managing the product mix involves:
Selecting main product lines that will complement each other in terms of quality range and price range
Selecting the right accessory and related products to go with the main products
Accurately projecting the required stock quantities at all times and determining the amount of additional stock required in peak or seasonal periods. Establishing minimum and maximum inventory levels for all items for each period of the fiscal year
Accurately determining the inventory value of each part of the product mix
Ensuring that units of product in all segments of the product mix are in saleable condition
Promoting the turnover of inventory to ensure that the majority of product units are fresh and as recently purchased as possible
Consciously and aggressively moving overage, damaged or poor quality inventory

Financial Management © 60
b. Inventory investment
Being constantly aware of the amount of money necessary to maintain established inventory levels is a key factor in managing inventory. Without awareness and exercising spending control, a business could easily spend profits or even the proceeds from gross sales on items other than inventory.
These points illustrate how important it is to maintain inventory levels at acceptable levels in all segments of the product mix.
Maintaining inventory levels of key products is vital to the success of your business.
To ensure that your business maintains inventory at required levels, you should prepare detailed inventory reports.
The frequency of preparing the reports may vary with some businesses. Businesses with higher turnover rates need to prepare the reports monthly, but many businesses would likely find that quarterly inventory reports are sufficient. These reports should show the inventory value of each item in inventory as well as the total value for the product segment of which it is a part. The report should show comparative figures to the previous period so identify changes in value. These reports will be labour intensive to produce by hand, but many accounting software programs or business managerial software programs will easily produce detailed inventory reports at the push-of-a-button. Consult your certified accountant on the accounting needs for your business.
In this event, the problems resulting could be:
Lack of funds to reinvest in inventory
Borrow money to reinvest in inventory. This increases expense and, therefore, can lower profits
Less inventory to sell of important product lines and, therefore, lower sales
Inability of the business to react to customer demand for new products
Loss of customer confidence in the business as a supplier
Loss of market share

Financial Management © 61
Based on the inventory reports, you need to budget money for monthly maintenance of the inventory investment in each product.
A portion of this money really represents a portion of the cost of goods sold (CGS).
To maintain inventory investment, replace the CGS each month.
Therefore, allocate that portion of your sales revenue represented by the CGS each month to replace the inventory investment.
It is a good idea to compare the % to sales of CGS from one period to another on the income statement.
In Income Statement Analysis, we will discuss the inventory section of the income statement. Revisit or visit that section and review the discussion about inventory, CGS, and the statement of inventory value.
c. Inventory turnover
The question of monitoring and controlling inventory turnover has come up a number of times in our discussions about inventory management. Inventory turnover affects all the items we have discussed so far—evaluation, product mix, and investment.
In reference to the examples above, we have referred to inventory turnover effecting the calculations and they will widely differ.
You will find little difference in the calculation methods in businesses with:
Higher turnover rates and low inventory values
You will find bigger differences in the calculation methods in businesses with:
Lower turnover rates and higher inventory values
In either case, it is evident that inventory turnover rates are a key factor in business profitability. To facilitate inventory turnover, every business should:
a. Use inventory identification methods—Inventory identification
b. Assign a length of time an item may be in inventory—Length of time in inventory
c. Produce inventory movement reports each month—Inventory
d. Produce monthly overage inventory reports—Overage inventory report
We will now discuss these four items:

Financial Management © 62
(1) Inventory identification
Identify every item in inventory needs as to:
An inventory ID number
When the item was brought into inventory
The cost price of the item
In addition to the product ID number, use a product code of some sort to mark the purchasing information on a tag attached to the item or use a stamp to stamp it on the package.
Many stores use this simple method so that without the aid of electronic scanners a clerk in the store can see at a glance how long the product has been on the shelf and the cost price. The clerk would use this information to:
Sell first the items that have been in inventory the longest.
Even if several items on a shelf are identical, it is important to have the most fresh, recently purchased inventory on hand.
To make on-the-spot price adjustments, if necessary, while still maintaining a minimum GM.
Knowing exactly how much profit there is in an item is an advantage when dealing with a customer.
For example:
Product codes may be alpha numeric and the variety of systems is unlimited. A typical example of using a code in a retail store is as follows.
Assign a number to each month of the year—#1 for Jan. #2 for Feb.—until each month of the year has a number.
Choose a word with 10 letters or perhaps two words that total 10 letters and assign each letter a number in sequence from 1–9 + a letter for 0 as follows:
B L A C K H O R S E
1 2 3 4 5 6 7 8 9 0
Purchasing an item of inventory at a purchase price of $24.90 the store would code the information as follows: #2–LCSE–99

Financial Management © 63
Clerks using a product code like this become very proficient at reading the code without any hesitation. It becomes second nature to them as they are working with it all the time.
Usually incorporated into the barcode is exactly the same kind of information you see on price tags in stores and on most packaging today
A barcode is a strip of lines of various widths that represent all the product and pricing information for that inventory item.
When the barcode is scanned (with a barcode scanner at the point of sale (POS) or read by a clerk), all of the product and price information on the code is retrieved.
Here is an example of a barcode:
Example:
Another device that is useful in identifying Inventory at the point of sale (POS) is colour coding. Colour codes can help a sales clerk to identify the oldest inventory and its purchase date.
If clothing stores did not promote high turnover of inventory, the overage inventory would soon choke it. This is why you frequently see inventory-on-sale at clothing stores.
For example:
Tracking the age of inventory in the retail clothing business can make a big difference in inventory turnover and the salability of inventory. Clothing inventory becomes obsolete very quickly because of:
Seasonal demand Changing styles in fashion

Financial Management © 64
Producing inventory movement reports at the push of a button on your computer works well in getting a global picture of the inventory in the store. However, at the POS, a clerk serving a customer in front of a rack of similar jackets will benefit from a quick visual method of determining the age of inventory.
A simply device that is used by some retailers is to colour code the tags on the inventory. Coloured price tags are readily available from store fixture and supply wholesalers.
A clerk looking at a rack filled with similar jackets would know at a glance that the jacket with a light yellow tag had been in inventory the longest. The clerk would then try to promote the sale of those items.
There are many ways to identify inventory. The system used will depend on the type of business and the inventory stocked. Be creative in your business. You should think of ways that you can do a better job of identifying your inventory in order to promote turnover.
(2) Length of time in Inventory
Assign each product group in inventory a maximum time in inventory. Assign a shorter or longer time for some items within a product group.
Even items that you think are very durable or won't become obsolete in a short time should be assigned a maximum time that you will keep them in stock.
It is important to maintain inventory in as good condition and appearance as possible as well as to promote inventory turnover.
Sitting on a shelf or hanging on a rack inventory will:
Become ingrained with a certain amount of dust
Become soiled from handling by customers
Acquire nicks or chips from jostling against other products
Not look fresh and new to customers
Assign each month of the year a colour. You might decide upon: Red January
Green February Light yellow March Blue April

Financial Management © 65
Once you have assigned a time limit to the inventory, use a visual method similar to that previous discussed to identify it.
In assigning a time limit to products, consider the following points:
Look at inventory movement standards for the product in your industry
Consider that it is your money that is invested in and tied up in the product as long as it sits in inventory
Consider how perishable the product is. Will it deteriorate in value over a short time such as vegetables?
Consider the seasonality of the product. That means to consider if it is an item that mainly sells in spring, summer, and fall or winter season
How soon will the product become obsolete? Is it likely to become out of fashion in 3–6 months?
Many industries consider that if a product has not sold for a year, the business has lost at least 30% of the value of the product by not turning over the money invested and reinvesting the money in new products.
Although a hammer would not be considered a perishable item or subject to changes in fashion, the store must turn the money invested in inventory in a timely fashion in order to be profitable.
For example: A hardware store has hammers that were purchased for $15.00 and sell at a 33⅓% GM at $22.50 each. If these hammers do not sell for a year, the store has: Not made the expected GP of $7.50 each on these hammers Not been able to apply this GP against operating expense Not been able to reinvest the store’s own money in other products

Financial Management © 66
In this business, the time assigned for the hammers should not be longer than six months.
Seasonality and fashion dictate stock considerations in the clothing industry. It is why regular selling prices yield 50% GM. The business needs to have enough GM at the regular price to be able to offer 15%, 20%, and 35% discounts off the regular price and still make some GP.
In this example, the clothing business would likely assign a time in inventory of no more than two months.
We urge you to use these two very different examples to think about your business and what time limits you would assign to items in your inventory.
As you can see, the time limits can be very different and for different reasons. However, whether your product is a bar of steel, wire mesh, clothing, or perishable grocery items, you need to think it through carefully and assign inventory time limits that meet the needs of your business.
For example:
A clothing store has purchased dresses for summer sale. The dresses arrived in stock in March. The purchase price was $35.00 each and, at a 50% GM, the regular retail price is $70.00 each
If these dresses do not sell within 30-60 days at regular price the store: Has not made the expected GP of $35.00 each on these dresses May miss the narrow window of opportunity when most customers will
buy summer clothing Must consider the prospect that the dresses may be out of season and out
of fashion within a couple of months Must start an aggressive on sale strategy to make sure within another 30—60 days, the dresses are sold.

Financial Management © 67
(3) Inventory movement reports
Inventory movement reports are very helpful in closely monitoring inventory. These days they are easy to access because any accounting software program should have the ability to produce these reports.
As well, many available business managerial programs will do a better job than an accounting software program in managing daily operations.
An inventory movement report should categorize inventory in product groups.
Within the main product, show the groups and products in sub-categories separately.
This is because when you view the report, you can focus your analysis on one group at a time and not get lost in a mass of unconnected information.
An inventory movement report should show on a per item basis:
Beginning inventory number units and value
The minimum and maximum inventory level for each item
The pack size for each item. That is, how the item comes packaged for shipment—is it supplied in cases of 6, 12 or 24 items per package
Number of inventory units sold of each item each month of the fiscal year-to-date and the value
Number of inventory units on hand of each item and the value
After each inventory category or product group, it is useful to know the total value in inventory of that group of products.
Produce different versions of an inventory movement report for various users of the information in the business. The following three examples will illustrate this:

Financial Management © 68
Example 1:
In this first example, a manager only wishes to view the movement history of an item. Therefore, the only information shown is the item description, ID# and the movement history. The movement history shows the manager the seasonal fluctuation in the movement of the item. A rat-tail file is an item of merchandise commonly found in hardware stores.
Inventory Movement Report
Product Group/Class Date:
Item description
Prod ID#
Jan Feb March April May June July August Sept Oct Nov Dec
8″ rat-tail file 1234567 6 15 24 30 20 26 15 12 18 30 22 10

Financial Management © 69
Example 2:
In this second example, the manager wishes to see the value of the inventory items in stock, the preset stock level information, and the established ordering point along with the inventory movement history. One reason for this might be that changes in demand are cause for considering adjustments to stock levels and ordering figures.
Inventory Movement Report
Product Group/Class: Date:
Item Description
Prod
ID#
Pack size
Min Inv
Max Inv
Order Pt
On Hand
Jan Feb Mar Apri May June July Aug Sept Oct Nov Dec
8″ rat-tail file
1234567
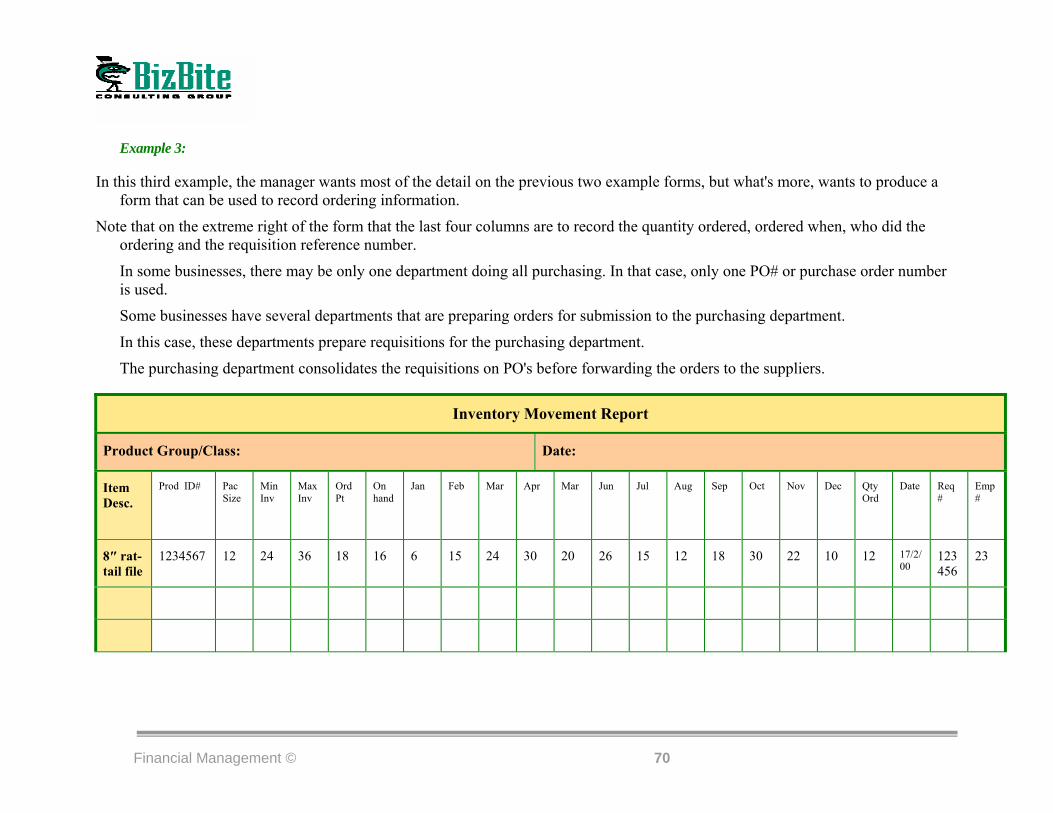
Financial Management © 70
Example 3:
In this third example, the manager wants most of the detail on the previous two example forms, but what's more, wants to produce a form that can be used to record ordering information.
Note that on the extreme right of the form that the last four columns are to record the quantity ordered, ordered when, who did the ordering and the requisition reference number.
In some businesses, there may be only one department doing all purchasing. In that case, only one PO# or purchase order number is used.
Some businesses have several departments that are preparing orders for submission to the purchasing department.
In this case, these departments prepare requisitions for the purchasing department.
The purchasing department consolidates the requisitions on PO's before forwarding the orders to the suppliers.
Inventory Movement Report
Product Group/Class: Date:
Item Desc.
Prod ID# Pac Size
Min Inv
Max Inv
Ord Pt
On hand
Jan Feb Mar Apr Mar Jun Jul Aug Sep Oct Nov Dec Qty Ord
Date Req #
Emp #
8″ rat-tail file
1234567 12 24 36 18 16 6 15 24 30 20 26 15 12 18 30 22 10 12 17/2/00
123456
23

Financial Management © 71
Using the information on this last example note the following:
Mar-June movement is 100 items divided by 4 months = 25 items/month average Sept-Dec movement is 80 items divided by 4 months = 20 items/month average Total items moved per year is 228 items divided by 12 months = 19 items average
Therefore, because the pack size is 12, the order point has been set at 18 in order to accommodate the minimum and maximum inventory movement. Another factor that will influence ordering is the length of time it typically takes to receive an order from a supplier.
Before choosing a business managerial software program, seek advice from your accountant as to what features and information would best serve the needs of your business.
Using the inventory movement report information
You should study the data presented on the inventory movement report and answer the following questions about each item:
Does the item move at a consistent rate each month?
Does the demand for the item vary in some months of the year?
Is the inventory investment too high or too low in relation to the inventory movement?
Could inventory turnover be improved by adjusting the inventory investment in certain periods of the fiscal year?
Based on sales and the time it takes to replace inventory, what is the minimum number of units that should be stocked, and how many more units (the maximum) is it necessary to stock at certain times of the year?

Financial Management © 72
Overage inventory reports
An overage inventory report is another report that the business managerial software and most accounting programs will produce.
Based on the length of time in inventory you have assigned to the item, the software will produce a report showing how many of each item you have in stock in excess of the assigned length of time in inventory.
As well, some overage inventory reports state information such as:
The earliest purchase date and quantity remaining of the original purchase.
The reports do vary in level of detail. Some software programs may be configured to provide additional information you may need.
What to do with the overage inventory report information
If your business has never regularly monitored overage inventory, you may be surprised at how much inventory is slow moving and could be classified as overage.
If you are able to produce an overage inventory report easily every month, you can scrutinize every listed item and make decisions as to:
Is the item necessary to have in inventory? Must you have it satisfy customers?
Do customers expect your business to have the item?
Is it the right product or is there a similar product that would sell better?
Was the item displayed or promoted properly?
Are the inventory level quantities realistic in relation to the product movement?
This report will typically include the following information: A listing of all overage items by product category
The number of units and the value of each overage item
The total value of the overage inventory by product category
The grand total value of all the overage inventory

Financial Management © 73
If, after considering the answers to all of these questions, your decision is to remove the product from inventory, then do so as quickly as possible.
Cull slow-moving or overage inventory from inventory constantly. Display this stock and its discounted price prominently to whatever degree necessary to move it.
Summary
In Inventory Management, we have discussed ideas and methods related to the management of inventory. You have learned how to:
Evaluate inventory
Manage the product mix
Manage the inventory investment
Manage and promote inventory turnover
Compare the ideas and methods presented here to the ways in which you manage inventory in your business now.
Ask yourself these questions: What ideas and methods would likely have the most positive effect on
your business?
What do you project that the financial effect could be?
What ideas and methods can be implemented now?
What ideas and methods will need to be phased in?
What ideas and methods will require assistance from your accountant?
You are better off to sell overage inventory at a loss and re-invest the money in inventory that will yield good turnover rates.
Laws of Money—of saving Financial freedom comes to those who save 10 percent of more of their income
all their lives. The way to do this is to ″pay yourself first.″

Financial Management © 74
Celebrate!!

Financial Management © 75
2. Accounts Receivable (AR) and Credit Policy
Introduction
Managing how accounts receivable (A/R) and credit policy in a company can have a major impact on the business. Here, we will discuss these important aspects of the financial management of the business. We will present common procedures and ideas in managing A/R and credit policy.
How to use this information
As you read this material, consider carefully the elements of the credit policy in your business. Think about how your present credit policy and the effect it has on your business. As well, think about how much of your business is charge sales and how important those accounts receivable (A/R) are to the business.
We have divided the material into two major parts:
A. Accounts receivable (A/R)
B. Credit policy
Ask yourself these questions: How do the ideas presented on A/R management compare to the A/R in your
business? Could a redesigned credit policy better serve the financial needs of the business? Could some of the ideas and procedures present help you design a better credit
policy? Would implementing some of the ideas presented improve the profitability of
your business?

Financial Management © 76
a. Accounts receivable (A/R)
Analyzing your accounts receivable (A/R) is an important part of monthly financial performance review and analysis.
Reports often refer to Accounts Receivable by the abbreviation, A/R.
Accounts receivables (A/R) are accounts with customers that the business has sold goods or services to on credit terms.
The amount of money represented by accounts receivable (A/R) can have a significant effect on the cash flow of the business because as long as those accounts remain unpaid, the money:
Until accounts receivable (A/R) is paid, the money is not part of the cash flow of the business.
Unpaid accounts receivable (A/R) can increase the need for the business to borrow money to finance operations.
The cost of borrowing this operating capital is an added expense to the business.
Essentially, financing the accounts receivable (A/R).
A manager must justify this expense by balancing the expense against the other possible benefits to the business of borrowing money to finance the shortfall in revenue created by accounts receivable (A/R).
Is unavailable for use by the business
Cannot be reinvested in inventory
Cannot be used to pay the monthly expenses of the business
Cannot be used to acquire capital equipment needed
Cannot be used to implement marketing programs

Financial Management © 77
Balancing these factors to arrive at a decision is not always easy. In addition to the cost of borrowing, there can be other possible expenses involved with moving larger volumes of product by increasing accounts receivable (A/R).
Consequently, a manager must weigh all the costs versus the benefits to having accounts receivable (A/R) and increasing accounts receivable.
This is an important factor in developing a credit policy for the company.
A company credit policy is a statement of the terms and conditions under which a company will allow customers to buy on credit. We will discuss credit policy later.
It is very important that a business be constantly aware of dollar value of unpaid accounts or accounts receivable (A/R). Controlling the amount of accounts receivable (A/R) and improving upon the rate of payment by customers can have a major effect on the cash flow and profitability of the business.
These benefits may be:
Increased turnover of inventory
Moving larger amounts of inventory may allow the business to buy products in larger volumes at lower prices
Buying at lower prices may result in a competitive advantage, which can result in increased sales
Some of these may be ::: Increased staffing expense
Increased shipping and handling expense
Increased advertising and promotion expense
Increased warehousing and storage expense

Financial Management © 78
To facilitate analyzing accounts receivable (A/R) it is useful to produce an Aged Accounts Receivable Report.
Named an Aged Accounts Receivable Report because it presents a history of purchases by a customer and how much remains unpaid.
An Aged Accounts Receivable Report is usually a spreadsheet with columns for each month of the year.
It includes the name of the account and the amount that remains unpaid each month. Delinquent accounts are customers who have not paid their accounts within the terms of the company's credit policy.
In a column on the far right does a space for the total amount of the money owe by the customer.

Financial Management © 79
Aged Accounts Receivable (A/R) Report #1
Date
Account Name CR. Limit Terms App.
Total Owing
Amt. +/-CR.
Current Month
30 days 60 days 90 days 120 days Prior Month
Acme Supply $5,000 60 days $8,700 +$3,700 $500 $700 $1,200 $1,800 $2,000 $2,500
Superior Service $500 30 days $600 +$300 $200 $100 $300
Quality Contractors
$500 60 days $900 +$400 $300 $500 $100
A-1 Builders $15,000 60 days $27,300 +$12,300 $8,000 $6,500 $5,800 $4,000 $3,000
Totals $37,500 +$16,700 $9,000 $7,700 $7,200 $1,800 $6,300 $5,500
Aged Accounts Receivable (A/R) Report #2 This example shows some of the same information as the report above but presents only the balances owing for each period and a total amount owing.
Some companies may provide a report that only shows this amount of detail to employees that deal with customers.
Name Current 30 Days 60 Days 90 Days 120 Days Prior Month Total Owing
Acme Supply $500 $700 $1,200 $1,800 $2,000 $2,500 $8,700
Superior Services $200 $100 $300 $600
Quality Contractors
$300 $500 $100 $900
A-1 Builders $8,000 $6,500 $5,800 $4,000 $3,000 $27,300
Totals $9,000 $7,700 $7,200 $1,800 $6,300 $5,500 $37,500

Financial Management © 80
The viewer of a report like this would want to acquire more knowledge about the accounts and the reasons for their purchasing and payment history.
If this were an example of the aged accounts receivable (A/R) report for your business, here are the following observations concerning the accounts.
Acme Supply—This delinquent account is getting further in debt to your company every month.
It is clear that only partial payment was received for each month’s purchases.
The reason for this should be determined immediately.
If the customer has kept the account more current in the past and is a valued account, you may wish to negotiate a regular payment schedule to retire the past months owing.
You may even wish to continue selling to the customer as long as they adhere to the payment schedule.
If the circumstances don’t warrant a negotiated repayment schedule, then the customer’s account should be suspended until the account is brought into line with the credit terms policy of your company.
If no effort was made to repay the amounts owing, it may be necessary to either sue the customer for the money or send the account to a collection agency.

Financial Management © 81
Superior Services—This delinquent account is not buying large amounts and in some months, there are no purchases.
This account may like to shop around for the best deal.
The amount 60 days past due is not large and likely not to be concerned about.
However, the $300 that is 120 days past due should be of concern.
As much as the $300 is important, it is important to know the reason why a relatively small amount was not paid.
When this situation exists, there is usually a story. The customer may be unhappy with the product or service that they bought. They may have expressed their dissatisfaction to someone in your business and they still are not satisfied.
Long before this account reaches the stage of being 120 days past due, a vigilant manager should be contacting the customer to determine their reasons for non-payment of the account.
Quickly identifying the reasons for a credit problem and resolving it maintain good customer relations and build the reputation of your business.
Quality Contractors—This delinquent account is a small builder that does small handyman projects and renovations.
This account typically pays the account off regularly but is always waiting for payment after a job is completed.
A job could take 30–60 days to complete so most of the time payment is made in about 60 days.
The account is loyal to your business so there should be little concern that payment is always 60 days after purchase.

Financial Management © 82
As part of assessing the value of this account to the business and deciding on a course of action, the manager would want to look also at the accounts purchasing history. The following is an example of a Customer Purchase History Report.
A-1 Builders—This delinquent account is similar to Quality Contractors, only the business is larger.
Most of their business is sub-contracting to larger general contractors.
A little extra communication and attention may be necessary with this type of account.
You need to know the reason for the non-payment of the amounts that are 120 days and prior months past due. It could be that there is some dissatisfaction with a product or service.
However, it may be that the general contractor has not paid them for some reason and so they are not paying you.
If the reason for non-payment is not directly related to product or services supplied by your company, then it must be made clear to A-1 Builders that you are not in the business of financing them and they must pay the account or risk suspension of credit privileges.

Financial Management © 83
A Customer Purchase History Report
Customer Purchase History Report Date
Account Name
Acct #
Jan Feb Mar Apr May June July Aug Sept Oct Nov Dec YTD PYTD
A-1 Builders 42351 $6,000 $7,000 $5,800 $6,500 $8,000 $33,300 $29,000

Financial Management © 84
These examples are just a few of the typical situations that a manager and a credit manager deal with every day. You can see that doing a good job of managing accounts receivable (A/R) requires:
In Testing the Financial Strength of Your Business, there is a discussion of common business management ratios.
Two useful ratios for monitoring accounts receivable (A/R) are the accounts receivable turnover formula and the average collection period formula.
Completing a detailed analysis of accounts receivable (A/R) on a monthly basis is important.
As part of the analysis, it is a good idea to test the effect on your business if accounts receivable (A/R) increased or decreased or if the average collection period was greater or less.
Good management of accounts receivable can have a major impact on::
The cash flow of a business
The amount of financing needed by the business
The cost of borrowing operating capital
Constant attention
Current knowledge of customers’ business and their changing needs
Being able to analyze and determine underlying reasons for the way customers pay their accounts
Application of good people skills and questioning techniques
Good decision-making skills

Financial Management © 85
Such an analysis may indicate that it is worth the expense of hiring a full-time person to manage accounts receivable (A/R) and collect delinquent accounts.
Other ratios of interest relative to accounts receivable (A/R) are the current ratio, the acid test, and the debt to asset ratio are found in Testing the Financial Strength of Your Business.
In using these ratios, the quality of the accounts receivable (A/R) is important.
The term quality means how collectable is the money from the receivables or how quickly the receivables are converted into cash.
If overage accounts receivable represent a significant amount of money, then inclusion of those accounts in calculating the ratio may not give a true picture of the financial position of the business.
Summary of accounts receivable (A/R)
In Accounts Receivable, we have discussed how selling offerings on credit and creating accounts receivable can benefit a business. We have discussed some of the problems that can be involved with accounts receivable and some common tests for monitoring them.
Effect management of accounts receivables is a balancing act for many businesses. In designing a credit policy, a manager is always striking a balance between:
Allowing enough purchase on credit to stimulate sales and promote inventory turnover
Maintaining positive cash flow and liquidity in the business

Financial Management © 86
b. Credit policy
A company's credit policy is a statement of the terms and conditions under which a company will allow customers to buy on credit.
The credit policy of a company influences many aspects of the business.
The credit policy can have the effect of stimulating or inhibiting sales.
It can result in increasing or decreasing inventory turnover.
It can have an effect on the cash flow of the company.
Indirectly, it can have an effect on the amount of borrowed operating capital a company requires. In other words, it influences the:
Sales and marketing of the business
The financial management of the business
Tailor the credit policy of the company to the needs of the company and the market it serves. Key considerations when designing a credit policy are:
Industry norms for the market served by the business
Competitive credit policies of businesses in your market
Your business's specific financial needs
Determine your business's specific financial needs by the results of your break-even analysis and estimates of what the business requires in order to achieve an acceptable level of profit and ROI.

Financial Management © 87
Three ways to use credit policy
Most small businesses have a very simple credit policy.
Often there hasn't been a lot of thought put into formulating the policy.
A small company could derive its credit policy from: What others in the industry seem to be doing
Adapt another company's policy
The basic reason to have a credit policy is to have some measure of control over the granting of credit.
The type of credit terms may vary slightly in the time period and percentage of interest due, but the terms usually relate to the cost of borrowing money.
This type of credit policy affords a measure of control. However, we will discuss using credit policy more creatively in the next three segments:
1. Credit policy used as a sales tool
2. Credit policy as a cash flow management tool
3. Credit policy as a profit generating tool
Example of common credit terms:
It is very common for a company to have credit terms on consumer credit sales as follows:
Normal credit terms require that full payment in 30 days.
Making a payment within 15 days after purchase, may provide a discount of 1% or 2%.
Interest on past due accounts is 1½% per month on the past due balance.
A written credit policy (as stated in the previous three points) is common on company statements as: Credit terms are 1%–15 days. Net 30 days; 1½% month interest on past due accounts

Financial Management © 88
(1) Credit policy used as a sales tool
Credit policy can be a powerful sales tool. A company may want to do this in order to:
Stimulate sales during slow seasonal periods
Increase sales of high-priced items
Keep a manufacturing plant operating in the off season
Buy market share by offering better credit terms than the competition
(2) Credit policy as a cash flow management tool
The strictness or flexibility of the credit policy has a direct impact on the cash flow of the company. Relating the strictness of the credit policy to:
The gross margin (GM) generated by the products sold by the business
The cash needed by the business to meet its monthly obligations
The length of time that the capital invested in accounts receivable (A/R) remains unpaid
Examples of businesses that do this are:
Companies that will take booking orders in the fall for shipment the following spring usually do so because they want to keep their manufacturing plant operating in the winter months.
If the company doesn’t manufacture products, it may want to qualify for discounts from the manufacturer and may be willing to pass on some of that discount to their customers.
Companies selling high-priced items such as furniture, jewelry, automobiles, or major appliances may advertise that no payment is necessary for six months or even a year. Larger volumes of merchandise are sold under these terms.

Financial Management © 89
(3) Credit policy as a profit generating tool
In certain instances, a profit-generation tool uses a credit policy.
This may be particularly so where the difference between bank interest and consumer credit rates are greater than normal.
In this case, a company may decide that it is worthwhile to maintain the total value of accounts receivable (A/R) at a certain level so as to:
Stimulate sales volume
Improve buying power of the company
Improve inventory turnover
Generate enough monthly interest income to offset a substantial portion of the operating costs of the credit department.
Examples of businesses that do this are::
A business that makes a low GM on its products may not allow purchases on credit or the time before payment is due is very short. The time allowed before payment is due may be as little as 5–10 days.
A major reason for this is that if large amounts of sold merchandise on credit, the business would have to borrow money to meet its monthly obligations.
If the company is making a low GM, it can’t afford to pay the interest charges on the borrowed operating capital for more than a very short period of time.
Businesses that make a large GM on their products can afford to extend credit for longer periods of time.
The reason for this is that the amount of borrowed money that may be necessary to meet monthly obligations is less.
In addition, a larger GM will allow the company to use a lesser portion of that GM to pay the interest charges on the borrowed capital and have enough left to meet the monthly obligations of the business.

Financial Management © 90
Therefore, the credit policy of a company can have the effect of offsetting a good portion of the operating expense of the credit department.
Note: In this example, 300 customers who owe $1,000 or 1,000 customers who owe $300 may represent the $300,000 in A/R.
Therefore, the amount of work involved for the credit department to manage $300,000 of A/R will depend upon the number of customers owing the money.
Each business needs to assess the most profitable ratio between total A/R, past due A/R, and the operating cost of the credit department.
For example:
The value of accounts receivable (A/R) to which interest may be applied is $300,000.
The credit policy states that the interest applied to past due accounts is 1½% per month
Therefore, the gross amount of interest income generated from A/R is: $300,000 x .015 = $4,500
In a small company, this amount of money may very well pay for two people to administer the credit policy of the company. In paying for itself, this cost of operating the credit department directly reflects the bottom line profit of the company.

Financial Management © 91
Six key elements to consider in granting credit
Deciding what customers are allowed to buy on credit and under what terms is a key part of developing a credit policy for your company.
You may decide to have one policy for all customers or you may decide to have different policies for certain groups of customers.
We will now discuss each of these six factors:
(1) Qualifications
All customers must be required to qualify for the privilege of buying on credit.
This means that they must prove that they have the ability to pay for their purchases within the terms of the credit policy of the company.
They also must show that other companies have granted them credit in the past and that they have honoured their commitments to those companies.
To qualify for purchasing on credit, a customer is required to fill out an application form.
This form will gather information about the customer and their credit history that the manager or credit manager will verify.
Carefully check the references given.
As well, you should check the applicant's history with a credit-reporting agency in your area.
Whatever your decision, consider the following key factors:
1. Qualification
2. Credit limit
3. Time frame for which credit is granted
4. Repayment incentives
5. Default and delinquent penalties
6. Payment instruments
Financial Management © 92
Carefully screening credit applicants is very worthwhile.
In spite of the most careful investigation, some accounts will default on their accounts and you will either sue for the money or send the account to an agency for collection.
In either case, it is costly to the business.
What's more, deducting the net amount collected after collection fees or legal fees will sometimes be a fraction of the owed money.
In all cases when the applicant fills out the application, there is a statement at the bottom of the application form, which:
Details the terms under which credit will be granted
Requests signed authorization by the applicant for the vendor to make any necessary investigations with references or credit granting agencies.
The applicant is required to acknowledge and sign that they understand the terms and conditions outlined in the statement.
Businesses usually use four types of forms for their customers:
a. The Personal Credit Application
b. The Commercial Credit Application
c. The Personal Guarantee
d. Joint Payment Agreement

Financial Management © 93
(2) Personal credit application
Typically use the personal credit application for individuals applying for credit rather than a company applying for credit.
However, if the individual is making an application for their company to buy on credit and their business is less than two years old, it is common practice for them to be required to fill out both a Commercial Credit Application and a Personal Credit Application.
The reason for this is that their business does not have enough credit history.
Personal credit applications may vary in the information required, but most include information such as:
The following are examples of:
A Personal Credit Application
A Business Credit Application A Personal Guarantee
Place of residence, past and present Employment history
Personal income Personal asset value
Bank reference Spousal relationship
Credit accounts with other companies

Financial Management © 94
A Personal Credit Application
[COMPANY]
Personal Credit Application
Last name: First name: SIN. No.
Address: Tel. No.
City: Postal code: How long:
Previous address: Postal code:
Marital status: Spouse's name
Date of birth: Monthly income: No. Dependants:
Employer: Address:
How Long:
Current Obligations Creditor Original Amt. Balance Due Monthly Payment Home: Leased-Monthly Rent $
Rented-Monthly Rent $ Mortgage Amt.
Owned-Market Value $ Held By _______
Automobile(s): Year Make Amt. Owing Value _
. $
. $
Bank: Address:
References where Charge Accounts operated:
1. Address:
2. Address:
3. Address:
The above data is for the purpose of obtaining credit and is warranted to be true

Financial Management © 95
I request credit from you to a maximum of $___________ at any one time for goods and/or services to be furnished by you, and I agree if credit is given, payment shall be made by the 15th of the month following the month in which credit is given. If payment is not made within one month of the month in which credit is given, the amount unpaid shall bear compound interest at the rate of eighteen percent (18%) per annum (1½% per month), effective the first day of the month following the month in which credit is given until paid. Either party may terminate this arrangement forthwith upon notice, whereupon all balances including interest shall become immediately due and payable.
I hereby authorize _____________________ (Company Name) to obtain such credit reports or other information as may be deemed necessary in connection with the establishment and maintenance of a credit account or for any other direct business requirement.
This consent is given pursuant to Section 12 of the Personal Information Reporting Act.
Signature of Applicant: ____________________________ Date: ________________
Schedule
Interest of (cost of borrowing) will be added to your account each month in accordance with your outstanding balance and calculated at eighteen percent (18%) per annum (1½% per month).
Balance is Mo. Cost Balance is Month Cost will be will be
(You may insert a table showing cost of borrowing, as some jurisdictions require.)
For office use only
Credit Department Department Manager's Approval
____ Approved Credit Limit | ________________________________
Charge Card # |Signature _________________________
Charge Card Expiry Date: |
Notes:

Financial Management © 96
(3) Commercial credit application
Use the commercial credit application for a company that is applying to purchase on credit.
The information required is similar to the personal credit application in some respects, but requires more detail on:
The type of company—proprietorship, partnership, corporation
The ownership structure of the company
Past history and experience of the owners
Bank references
Average bank balance on the deposit
Overdrafts or loans owing
Trade references—other companies the business buys from on credit.
The following is an example of a Commercial Credit Application.

Financial Management © 97
A Business Credit Application
[COMPANY]
Business Credit Application
Name Acct.: | ____ Proprietorship
Address: | ____ Partnership
City: Postal Code: | ____ Corporation
Mailing Address: | GST #
Postal Code: ________ | PST #
Type of Business: __________________________ Phone No. _________ ______________
Time in Bus. ________________________________________________________________
Names: Address: __________ _______
Owners: Address: ______________
Shareholders: Address: _______
____ Leased - Monthly $_____________
Premises ____ Owned - Market Value $ ____________ Mortgage $ _____________________
Mortgage held by: ______
______
Name of Bank: ______
Address: ______
References Address: ______
Address: ______
Trade Address: ______
Names Address: ______
Are Financial Statements Available To Us? ____ Yes ____ No
If No, Give Reason ______________
Number of invoices required ______Purchase orders required ___ Yes ___ No

Financial Management © 98
We request credit from you to a maximum of $ __________ at any one time for goods and/or services to be furnished by you, and we agree if credit is given, payment shall be made by the 15th of the month following the month in which credit is given. If payment is not made within one month of the month in which credit is given, the amount unpaid shall bear compound interest at the rate of eighteen percent (18%) per annum (1½% per month), effective the first day of the month following the month in which credit is given until paid. Either party may terminate this arrangement forthwith upon notice, whereupon all balances including interest shall become immediately due and payable.
Credit Dept. Copy ___________________Authorized Signature _____________________
For Office Use Only
Application Completed At Dept. No. ________ By: _________________________________ Print Name
Sales Dept. Recommendations, Present Jobs, Potential, etc.
Credit Department Dept. Manager's Approval
____ Approved Credit Limit:
____ Declined (See Below) _________________________________ Signature

Financial Management © 99
(4) Personal guarantee
A vendor (a company granting credit) in some instances requires a personal guarantee where:
The customer has exceeded their credit limit by a significant amount
The customer is expected to exceed their credit limit by a significant amount
The customer is not able to adhere to the credit terms for a period of time because they are waiting for funds from sources such as project progress payments, liquidation of assets, or additional investment capital.
The vendor is concerned that factors in the personal or business life of the customer may jeopardize the ability of the customer to pay their account.
The personal guarantee is a legal document that secures the interest of the vendor. It makes the customer personally responsible for the debt of their business no matter what type of business it is—Corporation, Limited Company, Partnership, or Proprietorship. It commits the customer to paying off the debt of their business from their personal assets.
The following is an example of a personal guarantee. The requirements of such a legal form may vary in the jurisdiction. Consult a lawyer as to the use of the proper form in your jurisdiction.

Financial Management © 100
A Personal Guarantee
TO: [Vendor] (hereinafter referred to as _________________)
I/WE, the undersigned (hereinafter called "the Guarantors") in consideration of your supplying _______________________________________ (hereinafter called "the Company) a body corporate, ________(Address)_______________________, with such goods as _______(Vendor)____________ may be willing to sell the Company from time to time, upon such terms of credit or for cash, as ______(Vendor)________ shall think fit, or in consideration of ______(Vendor)________________ not immediately requiring payment of such indebtedness as may be owed by the Company to ______( Vendor)________, JOINTLY AND SEVERALLY GUARANTEE payment to ______( Vendor)__________ of such present indebtedness as is owed by the Company to __________________(Vendor)_______ and payment to ________(Vendor)__________ of all future indebtedness of the Company for all goods that __________(Vendor)___________ may supply to the Company in the future.
AND I/WE AGREE that ________(Vendor)_________ shall be at liberty to accept the note or acceptances of the Company for the price of such goods, or any part thereof, to compromise the Company's liability to _______(Vendor)_________, to exercise or relinquish other securities as ___________(Vendor)___________ may think proper and to give the Company such extensions of time for payment for the said goods without notice to or communication with me/us and without prejudicing the rights of _______(Vendor)__________against me/us under this guarantee.
AND I/WE AGREE that _________(Vendor)_________ need not give me/us notice of default by the Company, nor shall _______(Vendor)___________ be bound to exhaust its recourse against the Company or any other persons or against any securities ________(Vendor)_________ may hold, before requiring payment from me/us.
ALL debts and liabilities, present and future, of the Company to me/us are hereby assigned to __________(Vendor)____________ and postponed to the liability of the Company to ______(Vendor)_______, and all securities received from the Company or held for the Company by me/us from this date shall be held or received in trust for ______(Vendor)__________.
AND I/WE AGREE that ________(Vendor)_________ shall have the right at any time to refuse further credit to the Company without notice to me/us, and without discharging or affecting my/our liability hereunder.
AND I/WE DECLARE AND AGREE that this Guarantee shall be a continuing Guarantee and shall extend to and be security for any sum or sums of money which shall or may at any time be due from the Company to ________ (Vendor) __________ and shall remain in force and cover all liabilities of the Company to _________ (Vendor) _________, inclusive of those liabilities incurred or arising down to the expiration of three (3) months after notice in writing of discontinuance of this Guarantee shall have been given by double registered mail, postage prepaid, addressed to _______ (Vendor) ______

Financial Management © 101
at its registered office and notwithstanding the discontinuance of this Guarantee as to one or more of the undersigned, I/WE agree that this Guarantee shall remain continuing as to the other or others of the undersigned.
THERE are no representations, collateral agreements, or conditions with respect to this Guarantee, affecting the liability hereunder of me/us to ________(Vendor)__________ except as are contained in writing in this Guarantee.
Dated at__________, British Columbia, this _______ day of ____, 200 _
Signed: ____________________ Guarantor: ______
in the presence of Guarantor: ______

Financial Management © 102
(5) Joint payment agreement
There are certain cases where a joint payment agreement may be necessary as additional security that the customer will pay their account.
In a case like this, the customer may still sign a personal guarantee. However, a personal guarantee or a promissory note still does not ensure prompt payment of the account. To collect an account using notes and guarantees can still involve a lengthy legal process.
The person or company that your customer is contracted for signs a joint payment agreement.
The joint payment agreement states that the signer of the agreement will only issue cheques jointly to your company and your customer in payment for the work performed by your customer.
The payee on the cheque will read 'Pay to the order of Your Company and Your Customer's Company'. When this is completed, your customer may not cash the cheque. Both you and your customer would go to the bank, endorse the cheque and the bank would then cash the cheque in your presence.
Joint Payment Agreement:
The following is an example of a joint payment agreement. The form may vary in some jurisdictions. You should consult a lawyer in your area to ensure that it conforms to the legal requirements in your area.
Situations where such an agreement is used are::
The customer is relying on the payment they will receive from a contract or a project to pay their account
The customer has a history of being delinquent in payment of their account
There is a concern that the customer may use the payment they receive from the contract to pay other debts before paying what they owe to your business

Financial Management © 103
A Joint Payment Agreement
Date: _____________
In consideration of the advance of materials and/or money necessary for the completion of the job known as _______________________,
located at __________,
which the undersigned Contractor has contracted to do for me, I hereby agree that all payments for said job will be remitted jointly to [company name] and the undersigned Contractor until total indebtedness due said [company name] from the undersigned Contractor relating to said job or contract is paid in full.
It is further agreed that in the event the undersigned should abandon said job or contract or transfer or make an assignment of it or any rights thereunder before said sum has been paid, said payments still due or unpaid or due the successor of the undersigned thereon, or the transferee or assignee of said contract or rights thereunder, shall be made payable to such successor, transferee or assignee and [company name] as aforesaid, until said sum or the balance thereof shall have been paid.
Owner or General Contractor By______________________________________ ________________________________________ Address _________________________________
Accepted and agreed to this _____ day of ____________ 200 ______________________
Contracted by _____________________________________________________________
Address: _________________________________________________________________

Financial Management © 104
(2) Credit limit
The customer applying for credit will state on the credit application form how much they expect to be purchasing on a monthly basis. After reviewing the credit application and checking the references given, the business makes a decision on the ability of the customer to adhere to the credit policy of the company.
Example:
A customer may state on the credit application that the amount of their account will be approximately $800/month. Therefore, they are asking for a credit limit of $1,000/month.
After reviewing the application and checking the references, the manager of the company granting credit may find that the customer does not have a credit limit over $500 with those references and has occasionally fallen behind in the payment of their account with those companies.
In this case, the decision of the manager might be that credit approval would be given, but only for a $500 credit limit because the customer's history indicates that amount is as much as can be handled.
Make exceptions if the vendor is willing to accept additional security for the amount of the account in the form of a personal guarantee, a note payable, or an assignment of assets as security.
After opening an account and charging a customer's limit if they demonstrate that:
They establish a history of paying their account on time
Communicate future purchasing needs and work closely with the credit department
If they expect to temporarily exceed their credit limit, they inform the credit department in advance and get approval
A business should value customers that view credit as a privilege and communicate their needs.

Financial Management © 105
(3) Time frame for which credit is granted
Granted the period for which credit depends on:
The GM the company makes on its products
The cash flow situation in the company
Whether or not using credit policy as a sales tool, a financial management tool, or a profit-making tool.
We have already dealt with various aspects of these points in the context of previous segments.
(4) Repayment incentives
At the outset of this section, we outlined a basic credit policy, which included an incentive for repaying the A/R owing earlier than the required time limit.
Some companies use repayment incentives more creatively than just offering 1-2% for repayment within 15 days.
Of course, as mentioned previously, the amount of incentive that can be offered will depend on the GM the company makes on its products.
Some illustrations of the use of repayment incentives are providing a graduated scale of progressive discounts.
Some companies take booking orders. A booking order is a term that means an order taken well in advance of the shipping date) for shipment several months later may offer a similar progressive repayment incentive.
For example:
Offer a discount of:
3% discount if payment is made within 15 days
2% discount if payment is made within 16–30 days
1% discount if payment is made within 31–45 days

Financial Management © 106
There are two major reasons for a credit policy like this on a special booking order. If bank interest rates on loans were 1% per month, a company may be quite willing to give a 15% discount for prepayment of the order because a company is:
1. Using the customer's money to finance their business
If the company were borrowing the money to buy or manufacture the products for the booking order, it would cost the company 4% for interest charges for the four months from November 1st to March 1st the following year.
2. Earning interest on the customer's money prior to paying the factory for the order
Let us assume that interest on deposits at the bank is at least 6% per annum. In the four months before shipping the booking order, the company earns approximately ½% per month if the customer's prepayment is only put on deposit in the bank, because in four months the company earns 4 x ½ = 2% on the customer's money.
On the other hand, higher rates of return are often available in other investment instruments.
In both of the above examples, there are very good reasons why some customers would find the repayment choices attractive.
The rate of inventory turnover of the products bought
How much of the products are bought
For example:
If a company is taking fall booking orders in October to be shipped March 1st the following year, they may offer a discount of: 15% discount if the order is prepaid 10% discount if payment is made upon receipt of the order 5% discount if payment is made within 15 days 3% discount if payment is made within 16–30 days 2% discount if payment is made within 30–45 days Gross amount is due in 60 days from date of shipment

Financial Management © 107
Ideally, the customer buying the product should only buy sufficient quantities as will be sold within the period before payment is due the supplier.
In this event, the customer is using the supplier's money to finance their business.
If the customer buys too much product, they may be paying the supplier out of the profits of future business rather than current business.
(5) Default or delinquency penalties
If a customer's account is past due, their account is termed a delinquent account. The account may be referred to as being in default. The amount that is past due is assessed interest charges.
By not paying the money owed, the customer is using the money of the business. The customer should pay a fair charge for the use of the money the same as they would if the borrowed money came from a bank.
In view of the above, companies will usually charge at least the same rate of interest as the bank.
However, it is more common that companies will charge a higher rate than the bank because the company could have made more money if they had the money to reinvest in the business.
Therefore, businesses will often charge 1½–2% per month on the past due portion of A/R.
This would translate to an annual interest rate of 18–24% per annum.
This is done because:
The unpaid money is unavailable for use by the business
The business would have to pay interest charges on the money if it were borrowed money

Financial Management © 108
(6) Payment instruments
In conducting daily transactions, most businesses have a choice of accepting the following payment instruments:
Other forms of payment that are emerging and becoming popular are:
Smart cards—a type of debit card that is preloaded electronically from your computer with small amounts of cash. Typically, it is used for small purchases.
Electronic transfer of funds using a computer
Cash or cheques incur little handling cost to the business.
However, accepting cheques does carry the risk. A few of those cheques are returned as NSF (Not Sufficient Funds).
In addition to the loss of the amount of the cheque, there is a charge to the business for the processing of bad cheques. This fee may be $10–$15 or more. If customers have an account, then place charges on the account.
There is a cost to the business of handling electronic transactions that needs recovering from the profit of the business. Typical charges are:
A monthly bank charge for the use of the electronic terminal and printer
A transaction fee that will vary with the volume of transactions
However, the transaction fee for most business will be at least 2% of the net value of the transaction before any added taxes.
If the business accepts payment by credit card, it is not receiving the same amount of money as it would from customers paying cash.
For this reason, some businesses will charge a customer the amount of the credit card transaction fee.
Cash Cheque
Money orders/bank drafts
Debit card Credit card

Financial Management © 109
However, in practice in daily transactions, most businesses will not charge for a transaction fee because:
Accepting credit cards tends to stimulate sales
Credit card purchases are not carried as A/R by the business
The amount of the purchase is guaranteed by the credit card company
However, many companies will take a different attitude towards customers paying A/R with a credit card. Some companies will not accept credit cards in payment of A/R for the following reasons:
By accepting the credit card, the business is actually accepting a discount of at least 2% on the sales
By not paying the A/R for a month or two, the customer has already used the company's money for that period and that has probably cost the business at least 1–2%.

Financial Management © 110
Summary
In the latter part of Accounts Receivable and Credit Policy, we have discussed the elements of a credit policy and using a credit policy in a business.
We have discussed in some detail how to screen applicants for credit and ways to protect your business against non-payment of accounts.
As you studied this material, you should have compared the ideas and examples to the way you manage credit policy in your business now.
The Laws of Money—of conservation
It's not how much you make but how much you keep that counts. Successful people save lots in prosperous times to have a financial cushion for bad
times.
You should ask yourself:
What ideas and methods are you using now?
What present methods and procedures can be improved?
What new ideas and methods would be useful to your business?

Financial Management © 111
Celebrate!!

Financial Management © 112
3. Preparing Pro-forma Cash Flow Statements
Introduction
A pro-forma cash flow statement is sometimes called a cash flow projection or simply a cash flow statement. We will use the term pro-forma cash flow statement here.
Effective cash flow management is essential to the continued health and survival of any business.
GGoooodd ccaasshh ffllooww mmaannaaggeemmeenntt aassssiissttss iinn:: Financial planning
Inventory purchases
Formulating credit and collection policies
Renewing business lines of credit
Making an effective presentation to your lender
Keeping on top of operating capital needs
Providing early indications of when expenses are getting out of line

Financial Management © 113
Function of pro-forma cash flow statements
A pro-forma cash flow statement compares projected income and expenses with actual income and expenses on a monthly basis throughout the fiscal year.
It is one of the most effective tools an owner or manager has to control their business.
When asked how they manage their cash flow, many small business people will admit that they really don't have a formalized plan.
They will often say that they sort of know or they have a feel for the seasonal changes in their business and cut back or make adjustments accordingly.
Comparing the actual cash flow of the business to a 12–month cash flow projection can reveal any sudden changes that have occurred in your expenses and the effect that may have on your current and future cash position.
Good cash flow management can take a lot of pressure off the business.
The cash flow projection is simply a budgeting tool that, if used properly, can smooth out the highs and lows in your business because of cyclical or seasonal changes.
It is not a cure-all, but it does help to give a sense of direction and, along with a written business plan, clears the mind for more productive and creative thinking.

Financial Management © 114
How to use this information
The pro-forma cash flow statement is just as important for the existing business. However, the existing business has the benefit of business history and, therefore, the projected figures should be a more accurate estimate of the expected business performance.
Consult the pro-forma cash flow statement every month to monitor and compare actual and projected results. This is an essential part of good business management and planning.
The business will use the pro-forma cash flow statement to forecast the effect on the business of:
Adding products or services to the business
Addition of personnel A change of location
Increases in taxes

Financial Management © 115
Preparing a pro-forma cash flow statement
We will take you step-by-step through the process of preparing a pro-forma cash flow statement. You will be using the following three spreadsheet forms in this process:
1. Projected cash and accounts receivable (A/R)
2. Projected accounts payable
3. Pro-forma cash flow statement
All the forms are worksheets and intended to primarily be used internally. However, review periodically these forms with a lender.
To simplify the illustration, the example used will be the format used for a fee-for-service business. That is a business where revenue is not derived from the sale of products but rather is generated from fees for work performed.
In these businesses, derive the total sales revenue from the services provided to the customers/clients.
In a business selling products, deduct the cost of the product and all the directly related expenses from the selling price in order to determine the net revenue or income derived from sales.
In other words, in a business selling products net sales revenue is the selling price less the cost of goods sold (CGS). See the details of doing this calculation on the income statement of the business. We will not be dealing with the income statement in this section.
A pro-forma cash flow statement (cash flow statement) is only concerned with the net cash receipts and expenditures of the business.
Examples of people in this type of business are:
Lawyers Accountants Health professionals
Security services Consultants Personnel services
Real Estate Delivery service

Financial Management © 116
Steps in preparing a pro-forma cash flow statement
There are ten steps in the pro-forma cash flow statement process. They are:
1. Estimate sales and fees-for-service.
2. Estimate your revenue received from accounts receivable.
3. Decide how much of your business will be for cash or thirty day terms.
4. Repeat the same process as 1–3 only for expense items.
5. Closing relating accounts payable planning to expected revenues.
6. Enter the estimated total cash received and estimated total expenses on the Cash Flow Worksheet.
7. Fill in all other estimated income and expense items on the Cash Flow Worksheet.
8. Calculate the total cash in, cash out for each month, and enter the surplus or deficit on the worksheet.
9. Enter the opening cash balance in the first month and carry this forward in each months calculation to arrive at the 'actual surplus or deficit'
10. Enter the amount of your business opening cash balance in the first month of your fiscal year and carry this forward through your calculations to arrive at the 'actual' projected surplus or deficit each month.

Financial Management © 117
You may find it necessary to print either the set of directions and/or the three spreadsheet forms (See below) hence, you can relate the instructions to the worksheet.
4. First, estimate the sales or fees-for-service for each month of the fiscal year by factoring in those seasonal variations, or changes that you expect in the business cycle.
The previous year's results can be a forecasting guide but you may want to apply other standards.
For example: Use conservative forecasts if you are in, or expect to be entering, a recession
period.
On the other hand, use an optimistic forecast if you are in a growth period or, expect to be entering a growth period.
However, the best approach (most of the time) is the middle-of-the-road. Enter these figures on a spreadsheet
(See example below–Projected Cash and Accounts Receivable)
Note:
The reference on the Projected Cash and Accounts Receivable Worksheet to 'Enter on line 1'
'Enter on line 2' refers to specific lines on the following Pro-Forma Cash Flow Statement where you enter the summary information.
Also, the reference on the Projected Accounts Payable Worksheet to 'Enter on line 22' refers to the specific line on the following Pro-Forma Cash Flow Statement where the summary information is entered

Financial Management © 118
5. Next, estimate your revenue received from the accounts receivable (A/R) for each month of the fiscal year.
To do this, include:
What you would usually expect to receive from the previous month's sales/fees?
What you would expect to receive from 60-day accounts?
What you expect to receive from all sales/fees prior to 60 days?
Total these figures and enter them on the Projected Cash and Accounts Receivable Spreadsheet.
6. Decide how much of your business will be for cash or thirty day terms, and how much will be carried for longer terms.
For example:
If, your business has been 10% cash/30 days and 90% longer credit terms it likely will remain the same if you don't plan to make changes to your credit policies.
If, however, this is obviously putting a strain on the business and you don't wish to increase your operating loan, you may well want to review your credit policies.
You have to decide whether the cost of carrying the additional business on account is worth it.

Financial Management © 119
7. Now, you do the same exercise for your expenses and prepare a spreadsheet if your business involves the purchase and resale of products. (See example below–Projected Accounts Payable)
8. Complete the accounts payable planning in close relationship to the revenues expected from sales/fees.
For example:
First, estimate the purchases you plan to make each month and enter the figures.
Then estimate the payments normally made on purchases made on the current month's purchases, the payments normally made on the previous month's purchases, the payments normally made on 60-day purchases and, finally, the payments usually made on purchases over 60 days.
Total the accounts payable and enter this on the spreadsheet.
For example:
Very favourable payment terms at very low or no interest can ease the burden on the business and the expense of each month's payment is reflected in the month that it will be paid.
If, however, a large purchase is made at a special price but must be paid for now, it may not be a good deal if the goods will not be used up for several months.
A very rough rule-of-thumb would be, don't buy more than you need for the next 60 days unless you are getting an additional 5% discount for each additional month you will carry the product.
For example, if you were not going to use the product up for 6 months, you would need at least a 20% discount to make the same net profit.

Financial Management © 120
9. Now that you have, your total cash received and cash payments estimated, go to your pro-forma cash flow statement, (See example below) and enter your totals.
10. Your next step is to fill in all the other items related to income and expense.
Under Income is: Under Expenses is: Other Operating Expenses:
Loan proceeds–this is the monthly amount received from the operating loan and will be filled in last
Sale of fixed assets
Other cash received
Rent
Management salaries
Other salaries and wages
Legal and audit fees
Utilities (heat, light, water)
Telephone
Repairs and maintenance
Licences and municipal taxes
Various insurances
Payments on purchases of fixed assets
Interest paid on loans (short-term loans, lines of credit, overdrafts)
Payments on mortgages/term loans
Income tax payments
Cash dividends paid
Payments on accounts payable
Other cash expenses
11. Enter all of this data and then you should calculate your total cash in and the total cash out for each month throughout the fiscal year and determine in which months there may be a cash surplus or deficit.
12. Enter the amount of your business opening cash balance in the first month of your fiscal year and carry this forward through your calculations to arrive at the 'actual' projected surplus or deficit each month.
This figure is, therefore, an estimate of the least amount you will require as an operating loan to run your business. For now, enter this amount under Loan Proceeds in the Cash In section in order to balance the statement.
Once this is completed, you are prepared (along with your financial statements and your business plan) to meet with your lender.

Financial Management © 121
Each month, you will enter the actual figures for the items listed on your worksheet. The items will vary somewhat with the business and this is only an example.
Communicate closely with your Lender and make them aware of any significant changes, particularly if it may affect your need for operating capital.
A well-informed Lender can be a powerful resource. However, frequently you hear small businesses complaining about the support of their Lender.
Usually, the real story is that business owners do not do their homework and provide their Lender with the needed detailed information.
Pro-forma cash flow statement
Now you have a projected pro-forma cash flow statement.
The pro-forma cash flow statement has columns to show the projected income and expense for each month of the fiscal year and blank columns beside each month's projection to record the actual figures.
The projected figures are your one-year operating budget. Careful analysis of any deviations from this budget can help to minimize expenses and maximize profits—referred to as doing a budget deviation analysis.
It only takes a few hours each month to review and it should be a regular part of your business management activity.
It is easy to forget to do some of these business planning and direction activities when times are good and the business is flying high. Nevertheless, budget deviation analysis is an essential part of effective business management.
Perform a budget deviation analysis on a monthly basis to be meaningful and useful. If a business has several projects on the go at one time, it may be a good idea to devise separate budgets for each project.
This is one of the best sources of current operating information for your business and, if the budgets have been prepared carefully and thoughtfully, the budget deviation analysis will tell you at a glance, which parts of your business, are getting out of control. Experience will teach you
Which deviations are significant
What magnitude of variance is important
Carefully examine any change, whether positive or
negative, and the reasons for it determined.

Financial Management © 122
If the change is negative, then implement a corrective plan of action. If the change is positive, then you should ask yourself:
With a little digging, you may discover something that, if controlled and directed, could have a major impact on the future profitability of the company.
While doing your pro-forma cash flow statement for the month, it is important to cast also your eye back upon previous months to identify any trends or offsets. A review and analysis of any monthly fluctuations will often reveal:
The negative deviation in one month is offset by a positive deviation in the following month
Seasonal fluctuations or business cycle factors that are, perhaps, because of the variable timing of projects
With experience, your budgeting and your analysis will become more exact and you will have greater control over the profitability of your business. All financial control documents should be adapted to the needs of your business in terms of the items included and the degree of detail, but the format should adhere to generally accepted accounting principles.
Your accountant will help you in this area but, you must be the one to decide what information is most useful to you in running the business, and what information reflected by the budget deviation analysis is most significant.
Sample spreadsheets
Below are three samples of:
1. Projected Cash Sales and Accounts Receivable
2. Projected Accounts Payable
3. Pro-forma Cash flow Statement (worksheet)
You have on your CD a file labeled Projected Spreadsheets. This Microsoft Excel file is interactive so follow the directions on the title page. Below are the same spreadsheets but they are not interactive.
What did I do right?

Projected Cash and Accounts Payable
Month Jan. Feb. Mar. Apr. May June July Aug. Sept. Oct. Nov. Dec.
Projected Sales $10,000Cash Sales (line 1) $9,500Coll. Of Sales 1 mo. Prior $5,000Coll. Of Sales 2 mo. Prior $2,000Coll. Of Sales Over 2 mo. $500Total Accts. Rec. (line 2) $27,000 0 0 0 0 0 0 0 0 0 0 0
Projected Accounts Receivable
Month Jan. Feb. Mar. Apr. May June July Aug. Sept. Oct. Nov. Dec.
Planned Purchases $2,000Pay On Current Mo. Purch. $1,000Pay On Purch. 1 Mo. Prior $200Pay On Purch. 2 Mo. Prior $200Pay On Purch. Over 2 Mo. $100Total Accts. Payable(line 22) $3,500 0 0 0 0 0 0 0 0 0 0 0

Pro-Forma Cash Flow StatementIncome (Cash Only)
Month January January February February March March April April May MayPlanned Actual Planned Actual Planned Actual Planned Actual Planned Actual
1.Cash2.Collection from Accounts Receivable3.Loan Proceeds4.Sale of Fixed Assets5.Other Cash Received6.Total Cash In 0 0 0 0 0 0 0 0 0 0
7.Rent (for premises, equipment, etc.)8.Management Salaries9.Other Salaries and Wages10.Legal and Audit Fees11.Utilities (heat, light, water)12.Telephone13.Repairs and Maintenance14.Licences and Municipal Taxes15.Insurance16.Other Operating Expenses17.Payments on Purchases of Fixed Assets18.Interest Paid on Loans(short-term loans, lines of credit, overdrafts)19.Payments on Mortgages/Term Loans20.Income Tax Payments21.Cash Dividends Paid22.Payments on Accounts Payable23.Other Cash Expenses24.Total Cash Out 0 0 0 0 0 0 0 0 0 025.Surplus or Deficit 0 0 0 0 0 0 0 0 0 0(subtract cash in minus cash out)26.Opening Cash Balance27.Closing Cash Balance 0 0 0 0 0 0 0 0 0 0

Financial Management © 125
Summary
In Preparing Pro-forma Cash Flow Statements, we have discussed what it is and how it is used. We have presented in detail how the pro-forma cash flow statement is prepared.
You have studied how that the pro-forma cash flow statement provides the business owner with a quick barometer of the financial health of a business. It gives the business owner a snapshot every month of the businesses:
Ability to meet current financial commitments
Changes and trends that are developing in business cash flow
These can give early warning signs that will trigger an in depth investigation into the reasons for the results. The business manager can then take remedial action.
You should have considered the importance of communicating with your banker. Keeping your lender informed about the performance of the business and its cash flow will help you to obtained needed financing.
The Laws of Money—Parkinson's Law Expenses always rise to meet income. It happens to most people. It's why most people aren't rich. To be rich, you must flout this law.

Financial Management © 126
Celebrate!!

Financial Management © 127
D. Monitoring the Financial Health of the Business
Introduction
In Monitoring the Financial Health of the Business, we will discuss what a business manager needs to do on a monthly basis to monitor the financial health of the business. You will learn about interpreting financial statements and using financial ratios to monitor your business performance.
TThhee ffoouurr sseeggmmeennttss aarree::
1. Monthly financial performance review and analysis
2. Income statement analysis
3. Balance sheet analysis
4. Testing the financial strength of your business

Financial Management © 128
It is very important for the business manager to learn how to work with and interpret financial information and reporting. Developing these skills enables the manager to:
Interact more effectively with accountants
Interact more effectively with lenders
Identify problem areas early and take remedial action
Maximize the ROI to investors
Make better business decisions
We have provided examples of several spreadsheets in Microsoft Excel in a separate file on your CD. This interactive worksheet file has formulae macros inserted into the spreadsheet so they will do your calculations for you. Open up the file named Income and Balance Spreadsheets and follow the directions on the title page.
a. Monthly financial performance review and analysis
Month l Financial Performance Review and Analysis emphasizes the need to do a monthly review of the financial performance of your business.
IItt ccoovveerrss::
The preparation necessary before doing the financial review
How to use the information resulting from the financial review
Covering how to organize the information in the financial review
In addition, it includes examples and tips on relating the information to your business.

Financial Management © 129
b. Income statement analysis
We will use an example of a typical income statement. Throughout this section, we have based the examples on the figures of Well Known Merchandise Inc. so there is some continuity and relationship to the various reports we will discuss.
c. Balance sheet analysis
The Balance Sheet Analysis segment discusses the components of a balance sheet, where the information comes from, and how the information is related.
IInn IInnccoommee SSttaatteemmeenntt AAnnaallyyssiiss,, yyoouu wwiillll lleeaarrnn:
What information the income statement presents
How the parts of the income statement are related
Ways in which the income statement information may be presented to best serve the needs of your business
What sort of information will you be looking for on the income statement?
How to interpret the importance of the information
How the information on the income statement is used
IInn tthhiiss mmaatteerriiaall,, yyoouu wwiillll lleeaarrnn::
What the figures on a balance sheet tell you
An introduction to simple tests of the balance sheet information to determine the strength or weakness of the business
How to interpret the results of the tests
How to use the results of your balance sheet analysis
You will find the figures for Well Known
Merchandise Inc. are presented in the following
section, Testing the Financial Strength of Your
Business.

Financial Management © 130
In addition, examples of conclusions are drawn from the balance sheet analysis.
As with the segment on Income Statement Analysis, we will use the figures of Well Known Merchandise Inc. and the figures are also in a following section, Testing the Financial Strength of Your Business.
We will discuss the use of ratio analysis in this segment as an introduction to this subject prior to covering the subject in more detail in the following section, Testing the Financial Strength of Your Business.
d. Testing the financial strength of your business
In Testing the Financial Strength of Your Business, you will learn many financial ratios to use in monitoring your business performance. The four ratios are:
1. Operational ratios
2. Liquidity ratios
3. Leverage ratios
4. Profitability ratios
We will discuss various ratios that fall into these categories, where they are used, and why they are used. In some cases, we will give examples of:
How these ratios are used in a business situation
The conclusions that might be drawn
The action that might be indicated
We will continue to use the figures of Well Known Merchandise Inc. as we did in Income Statement Analysis and Balance Sheet Analysis.
The Laws of Business—of quality Customers demand the very highest quality for the very lowest price.
Quality is whatever the customer thinks it is. And the customer decides how much it's worth.

Financial Management © 131
1. Monthly Financial Performance Review and Analysis
Introduction
A monthly performance review and analysis is an essential part of good business management. It is very important to get in the habit of doing a detailed review and analysis of your business each month.
You should set aside the same time each month and don't let anything interfere with the process!
The purpose of the review and analysis is to compare the results to your expectations written in your business plan.
Examine any deviations or exceptions to your plan closely to determine the reasons for any exceptions so you can take any remedial action if it is necessary.
For illustration purposes, we will use a professional services company—an architectural services company that has several different segments to the business. Each business segment involves different resources of the company, therefore, yields different gross profit margins, and thus has a different break-even point (BEP).
How to use this information
As you go through this section, think about your own business. Compare what you do now to assess the performance of your business to the ideas and methods presented in this section.

Financial Management © 132
Prior preparation for a monthly performance review and analysis
Before the financial review and analysis can begin, you will have:
Reviewed past years operating statements
Reviewed the business plan projections
Prepared pro-forma operating statements and cash flow projections
You will have analyzed your fixed costs and calculated the historical percentage of gross revenue that they represent
You will have reviewed past projects to arrive at an estimate of typical variable costs for different types of work
Prepared a job cost summary sheet that will take all of these factors into account including the varying contribution of people and resources within the company
You will know any generated net profit on each project and each business segment.
Now, you have the basic information necessary to do a monthly financial performance review.
Using a monthly financial performance review and analysis
Armed with these new systems in place and the new insights they provide, you will factor a portion of estimated fixed and variable costs into all of your pricing. You will price for profit and use pricing as part of your marketing strategy.
You will create more financial strength in the business by developing contingency funds for the replacement of capital assets or funding future growth.
Record and manage all capital assets managed by use of a capital asset register and any planned new acquisitions are justified by use of a capital expenditure justification form.
You could have a capital asset summary report each month but a quarterly review is probably sufficient in most cases.

Financial Management © 133
Financial Analysis
For quick review you can prepare a one- or two-page spreadsheet form that will record and present comparative analysis summaries in a historical context. Your secretary or office manager may prepare this. Deviation analysis of cash flow and income statements vs. forecasts can also be prepared in advance for your review.
Here is how your financial review spreadsheet might look. The following chart is an example of only a partial year.
The two abbreviated headings on the chart are:
YTD - Year-to-date
PY - Prior year

Financial Management © 134
Financial Review Spreadsheet
Jan Feb Mar April YTD PY
Current ratio
Acid test
Break-even analysis ratios for:
Service A
Service B
Service C
Service D
Service E
Business segment A
Business segment B
Business segment C
Business segment D
Total business

Financial Management © 135
Complete each month the calculations for the headings in the left column of each row of the spreadsheet and result recorded under the appropriate month. This allows you to see the changes that may be occurring in each business segment, each service the business provides, and the business as a whole.
We will discuss the current ratio, acid test, and other useful financial ratios in the next section.
In addition to calculating these business ratios each month and recording them on the spreadsheet, you should review and analyze your monthly cash flow statement and income statement to identify:
Cash flow deviations
Income statement deviations
When you analyze both of these reports, you are looking for deviations from your forecasted results. When you discover a deviation, always try to determine its reason.
Whatever the reason for the deviation, once it is identified you are better able to look for ways and means of changing the results.
For example:
If the profit result for a service, a business segment, or the business as a whole, is higher or lower than forecasted for the month, the reasons might be:
Product was purchased from a supplier at a lower or higher cost
Different office or plant procedures resulted in an improvement or decline in production efficiency
Rent, taxes, utilities, insurance fees or other fixed costs suddenly increase or decrease

Financial Management © 136
Significant historical variances
When you go through this exercise each month it is a good idea to also assess the potential financial or liability exposure of the business and take appropriate action.
You should keep in mind (as a very general rule of thumb) that most businesses, including professional services businesses, should generate gross revenues equal to 2–3 times their net expenses.
If they are consistently below this rate, it is not a healthy situation and that indicates remedial action is required. Of course, this is a very broad statement and some industry and seasonal variances will apply.
However, to bring it close to home, if your gross annual revenue is $400,000, then your net annual expenses should not be more than approximately $200,000.
If they are, you have only three alternatives and they are:
Cut expenses
Increase the volume of business without raising costs significantly
Increase the margin of profit on existing sales volumes
A combination of all of these approaches is probably the best solution.
In your break-even analysis for each month, if the ratio entered each month for the relationship between revenue and fixed costs + variable costs is consistently slipping below a ratio of 2:1, and then a more detailed analysis is in order.
For example:
If you have been replacing or acquiring assets recently, make sure that you are adequately covered by insurance.
Or, if you just took on an unusually large contract perhaps you should check with your insurance agent that you would be adequately covered.
Financial Management © 137
Summary
Monthly Financial Performance Review and Analysis explained how you would monitor the performance of the business on a monthly basis. It briefly discussed the assembled data to complete correctly a performance analysis and apply the common tests to the data. Every business will be different but the approach outlined here is common to most businesses.
Laws of Money—of three Financial security is like a three-legged stool:
it rests on savings, insurance, and investment. You must tend to all three to become financially independent and secure

Financial Management © 138
Celebrate!

Financial Management © 139
2. Income Statement Analysis
Introduction
The income statement of a business is another key tool that managers use to measure and analyze the health of their businesses. The income statement is commonly known as the operating statement or the profit and loss statement. In this discussion, we will use the term, income statement.
The income statement is a statement of the changes that have occurred from one period to another.
There will be no discussion of any complex statistical analysis here or forecasting methods in relation to the income statement. Consult your certified accountant on those matters.
Rather, we will discuss some of the things that you, as a manager, should be looking for when your accountant presents you with your monthly statements.
IItt sshhoowwss,, iinn ffiinnaanncciiaall tteerrmmss,, aa ssuummmmaarryy ooff::
The transactions that have occurred in the business during that period
The income generated by those transactions
The changes in valuation of the inventory carried by the business
The expenditures made by the business
The profit or loss to the business at the end of the period

Financial Management © 140
How to use this section
As you study the income statement analysis, consider how the ideas presented compare to how you now view the monthly statements your accountant gives you.
AAsskk yyoouurrsseellff tthheessee ssiixx qquueessttiioonnss::
1. How are my statements prepared? How are they presented?
2. What items on the income statement do you currently look at, and what do they mean to you?
3. What kinds of information do you usually get from your Income Statement?
4. What conclusions do you draw from the information on the income statement?
5. How do you use the information and conclusions to improve your business or what sorts of decisions do you make based on your conclusions?
6. How can the ideas presented in this section help you to do a better job of analyzing your Income Statement and making good business decisions?

Financial Management © 141
Income statement presentation
An income statement may be prepared for any period of time in the fiscal year. A fiscal year is an accounting period of 12 months.
The income statement is commonly prepared:
Monthly
Quarterly (3-month period)
Annually
However, it really could be prepared for any period of the year. It is important that you ask your accountant to prepare statements for your business in a form and with the level of detail that will be most useful to you in your business. Accounting software programs used in computerized accounting systems today will easily generate accounting reports in almost any form and level of detail that you wish.
A report covering the specific period is useful, but comparing the reports to previous reports or previous periods is much more useful. Accountants will often show comparisons to figures for the same period of the previous fiscal year. This is useful. However, it is much more useful if a manager can see on one page:
The figures for each of the previous months of the fiscal year
The total of the figures for the year-to-date (YTD)
A total for the prior-year-to-date (PYTD)
We call this type of presentation a spreadsheet.
A spreadsheet will have a column for each month of the fiscal year. If you wish, you can also have an additional column for each month for comparison to the forecasted (pro-forma) figures for the fiscal year. A direct comparison like this is useful when preparing monthly forecasts for the next fiscal year.
At the far right of the spreadsheet are the columns for the totals for the YTD and the PYTD.

Financial Management © 142
12345678910
11121314151617181920212223242526272829303132333435363738394041424344454647484950515253
A B C D E F G HIncome Statement
Well Known Merchandising Inc.Comparison of Dec. 31/99 to Dec. 31/98
1998 % / Sales 1999 % /Sales
Gross Sales 700,000 100.00% 800,000 100.00%Less: Discounts 30,000 4.29% 40,000 5.00% Allowances 9,000 1.29% 10,000 1.25%Net Sales 661,000 94.43% 750,000 93.75%
Cost of Goods SoldBeginning Inventory 160,000 22.86% 170,000 21.25%Purchases 450,000 64.29% 500,000 62.50%Less: Discounts 13,500 1.93% 15,000 1.88% Allowances 4,500 0.64% 5,000 0.63%Net Purchases 432,000 61.71% 480,000 60.00%Less: Ending Inventory 170,000 24.29% 150,000 18.75%Cost of Goods Sold 422,000 60.29% 500,000 62.50%
Gross Profit 239,000 34.14% 250,000 31.25%
Operating Expenses
Selling:Sales staff salaries 23,750 3.39% 25,000 3.13%Sales staff benefits 4,750 0.68% 5,000 0.63%Travel and entertainment 1,500 0.21% 1,500 0.19%Advertising and promotion 8,000 1.14% 9,500 1.19%Vehicle expense 2,300 0.33% 2,500 0.31%
Administration:Staff salaries 38,000 5.43% 40,000 5.00%Staff benefits 7,600 1.09% 8,000 1.00%Rent 20,000 2.86% 20,000 2.50%Utilities 2,300 0.33% 2,500 0.31%Janitor 1,500 0.21% 1,500 0.19%Building maintenance 2,500 0.36% 3,000 0.38%Office equipment 2,000 0.29% 1,500 0.19%Office supplies 1,600 0.23% 1,500 0.19%
General Mfg. Plant:Plant staff salaries 42,750 6.11% 45,000 5.63%Plant staff benefits 8,550 1.22% 10,000 1.25%Plant fuel oil 9,700 1.39% 10,500 1.31%Machinery maintenance 4,000 0.57% 3,000 0.38%Total Operating Expense 180,800 25.83% 190,000 23.75%Operating Profit 58,200 8.31% 60,000 7.50%
Non-Operating Expenses 2,500 0.36% 3,000 0.38%Profit before tax 55,700 7.96% 57,000 7.13%
Corporation tax 13,925 1.99% 14,250 1.78%Net Profit 41,775 5.97% 42,750 5.34%

Financial Management © 143
123456789
1011121314151617181920212223242526272829303132333435363738
3940
A B C D E FIncome Statement
Well Known Merchandising Inc.Comparison of Dec.31/99 to Dec.31/98
1998 % / Sales 1999 % / Sales
Net Sales 661,000 100.00% 750,000 100.00%Cost of Goods Sold 422,000 63.84% 500,000 66.67%Gross Profit 239,000 36.16% 250,000 33.33%
Operating ExpensesSelling 40,300 6.10% 43,500 5.80%Administration 75,500 11.42% 78,000 10.40%General 65,000 9.83% 68,500 9.13%Total Operating Expense 180,800 27.35% 190,000 25.33%
Operating Profit 58,200 8.80% 60,000 8.00%
Non-Operating Expenses 2,500 0.38% 3,000 0.40%Profit before tax 55,700 8.43% 57,000 7.60%
Corporation tax 13,925 2.11% 14,250 1.90%Net Profit 41,775 6.32% 42,750 5.70%
Statement of Earned SurplusWell Known Merchandise Inc.
Comparison of Dec. 31/99 to Dec. 31/98
1998 1999
Balance brought forward 15000 31,775Net profit fot the year 41775 42,750Total 56775 74,525
Less: Dividends paid 25000 20,000Balance carried forward to the Balance Sheet 31775 54,525

Financial Management © 144
The above Income Statement example is a summary form of the previous example, and in addition, it has a statement of earned surplus, attached to it.
This simple example indicates how earned surplus is calculated. Refer to Balance Sheet Analysis to see earned surplus on the balance sheet.
As well, in the section Testing the Financial Strength of Your Business you should refer to this example when you review the sub section Profitability Ratios.
The 0.214% beside the $1,500 indicates that the amount of the travel and entertainment expense spent in the period was 0.214% of the gross income (sales) of $800,000.
FFoorr eexxaammppllee::
The first item in a column on the income statement, in the part recording income, might be:
Gross income (sales) $800,000 100%
It is 100% of itself.
Lower down the column in the above income statement, in the part recording expense items for the period, might be a listing for travel and entertainment expense as follows:
Travel and entertainment expense $1,500 0.188%
Useful tip:
Have your accountant prepare income statement spreadsheets with all items expressed as a % of gross income (sales).
This allows the manager to quickly compare figures from one period to another as well as compare those figures to norms for the industry.
The % is usually listed beside each figure in a column.

Financial Management © 145
A manager, looking at a spreadsheet with several past months and the current month presented, can easily spot if the % to sales is in line with:
Forecasted amounts for the month
Forecasted amounts for the year
Comparison to rates of expenditure in the PYTD
Industry norms
The dollar value can be much higher or lower than any of these comparisons, but if the % to sales ratio is similar, it indicates the business is spending a normal amount in relation to the gross income (sales) of the business.
Consider asking your accountant for spreadsheet presentations such as we have described here. You will find it much easier to identify quickly anomalies on your Income Statement that need investigation.
What are you looking for on the income statement?
We said, at the beginning, that the income statement presented changes that have occurred from one period to another.
However, when you analyze your income statement:
What kinds of changes are you looking for on your income statement?
What items are more likely to change?
Where should you start in your analysis of the income statement?
First, you will be looking for changes in significant income or expense items. A 'significant' item is one where the total value of the item is significant as a % to sales. Sometimes even a small change in that item as a % to sales can have an effect on the profit of the company.

Financial Management © 146
FFoorr eexxaammppllee
% of Sales
A small company has gross income (sales) of $200,000/Year 100% The GM on sales is 30% so gross profit (GP)= $ 60,000/Year 30% Total expenses are $ 50,000/Year 25%
Therefore, net profit is $ 10,000/Year 5%
Assume that included in the total expenses is an item, which is normally $200/month
The total expense most years would then usually be 12 x $200 = $2,400/year 1.2
The manager compares total expenses YTD to the PYTD on the spreadsheet and finds there is little variation in % to sales ratio.
The manager then examines each item in the income statement YTD and PYTD columns and spots a variance in the % to sales ratio for the item that is normally 1.2% to sales.
The PYTD is 1.2% but YTD is 2.6%. A close look at the figures for each previous month reveals that this item was within a historically normal % to sales ratio for the first three months of the year and then suddenly doubled in cost.
In a small company, such an increase can have a big impact on the profit of the company. An increase of 1.4% (from 1.2% to 2.6%) to sales in this expense item represents an additional $2,800 of expense or 28% of the NP of the company.
In this example, the small company has a NP of $10,000/year. As a result, an increase of 1.4% (from 1.2% to 2.6%) to sales in this expense item represents an additional $2,800 of expense or 28% of the NP of the company.
The analysis indicates taking action immediately to:
Investigate the reason for the increase
If the expense item is a key product or service needed by the company to function, then alternative sources for the product or service need to be found or a better price negotiated on the item.

Financial Management © 147
Consider for a moment, what the effect would be if the expense item increases by the same dollar amount, but the sales of the company were now $400,000 rather than $200,000. Is it considered a significant increase in expense?
The answer is yes!
In this event, the % to sales increase is from .6% to 1.3%. While the dollars represented by the increase won't have the same impact on the NP of the company, enough items like this on an income statement will add up to a significant variance overall. Therefore, this variance should still be investigated and action taken.
This example illustrates how to analyze every item on the income statement, particularly variable cost items.
Expense items that are monthly expressions of fixed costs are not as likely to change.
However, you should always look at these items briefly just in case something extraordinary has happened.
However, arrange items like rent, utilities, and insurance for long periods of time and the monthly charges associated with these charges rarely change much from one period to another.
The items that are most subject to change are sales and the variable expense items. Scrutinize these items very carefully each month. Check even small variances and a satisfactory explanation for the variance determined.
In particular, pay attention to significant changes in:
Revenue items—sales, other income from items, for example, securities, sale of assets, or interest income. It is important to be aware of how much income has come from operations and how much from non-operating events.
In a certain period, you could have a situation where total revenue seemed to be in line with forecasts, but income from operations was actually down and the total revenue was inflated because of the inclusion of non-operating revenue.
Purchases
Discounts and allowances on sales or purchases
Gross profit (GP)
Gross margin (GM)
Variable expense items
Net profit (NP)

Financial Management © 148
Analyze your income statement spreadsheet in the order listed above. Acquire the habit of doing it the same way all the time and you will not only become very familiar with the procedure, but you will tend to be more thorough in your analysis.
What's more, it is a good idea to compare your company performance with industry standards for your area.
While the % to sales ratios will vary between companies, it does give you a perspective on how your company compares to others in your industry and perhaps the competition in your area.
Most libraries have small business profile information that is a good source for this information. (See The Business Plan for a list in the Appendix.)
The two items analyzed were because we will now discuss them in:
1. Inventory
2. Cost of goods sold (CGS)
Inventory and the cost of goods sold (CGS)
Inventory is a significant investment for most companies and has to be managed carefully to optimize the return on investment (ROI) to the company.
Selling and replacing the inventory is a must to ensure the business makes a profit.
Every time the total average inventory value is replaced, the inventory is said to have turned over. This is what is meant by the common business term—inventory turnover.
Maintaining and improving the inventory turnover rate is a focus of any business that handles inventory because even small changes in inventory turnover can have a significant effect on profits.
If your business handles inventory, you should be aware each month of the turnover rate for the month, the quarter and year-to-date (YTD), and how those ratios compare to the same periods in the prior year.

Financial Management © 149
The formula for calculating this ratio is:
Cost of goods sold (CGS) for the period/average inventory
This formula says to divide the CGS for a measured period by the average inventory.
The average inventory may be close to the same value for each period measured, but the CGS for the period would be quite different.
For instance, in this example, the CGS for a month might be $50,000 and the Average Inventory, $200,000.
So the inventory turnover rate for the month would be $50,000/$200,000 = .25 turnovers.
As we said, even fractional improvements can have a dramatic impact on profit. Consider in this example,
If inventory turnover was improved by .05 turnovers, that would mean that .05 x $600,000 = $30,000 more inventory, at cost value, was sold.
If the selling price of that inventory were $45,000 (a 33⅓% GM), the improvement in the company profit would be $15,000.
FFoorr eexxaammppllee::
If the CGS for the period is $600,000
And, the value of the average inventory stocked during the year is $200,000
Therefore, the annual inventory turnover rate is $600,000/$200,000 = 3 turnovers
For more information on calculating Inventory Turnover and other financial management ratios, see Testing the Financial Strength of Your Business.

Financial Management © 150
Calculate the cost of goods sold (CGS) as follows:
Beginning inventory for the period Plus Purchases for the period Less discounts and allowances on the purchases Minus Ending inventory for the period Equals Cost of goods (CGS) sold (CGS)
Discounts are supplier incentives—a % off the purchase price
Allowances are the value of the inventory returns to suppliers or perhaps a discount taken off the purchase price for reasons such as the inventory being obsolete, inferior, or damaged.
There may be an allowance for inventory shrinkage.
Inventory shrinkage is a term for shortages or losses of inventory due to spoilage of perishable goods, but it can be an allowance made for losses due to stealing by customers—an allowance for shoplifting.
FFoorr eexxaammppllee:: AAccmmee MMeerrccaannttiillee iinnvveennttoorryy rreeccoorrddss sshhooww tthhee ffoolllloowwiinngg iinnffoorrmmaattiioonn:
Inventory value January 1, 2000 is $ 600,000
Total purchases from Jan. 1/00 to Dec. 31/00 is $1,080,000 Less discounts and allowances $ 25,000
Net purchases $1,055,000
Total $1,655,000
Less ending inventory Dec. 31/00 $ 750,000
Cost of goods sold (CGS) $ 905,000
On your income statement, the CGS is subtracted from net sales. The result is your gross profit (GP).
Therefore, if we assume that Acme Mercantile net sales (NS) are $1,300,000
Then gross profit (GP) is $1,300,000 - $905,000 = $395,000 Therefore, gross margin (GM) is $395,000/$1,300,000 = .3038 or 30.38%

Financial Management © 151
From this example, you have seen:
How CGS is calculated
How NS, CGS, GP, and GM are related.
When you are analyzing your income statement, you should note the changes in inventory valuation.
Some factors to watch for are:
If purchases are much larger than usual because the company has taken advantage of a volume discount opportunity, the result could be inflated Ending Inventory values in ensuing months.
If the excess inventory isn't sold as quickly as expected, it will have the effect of decreasing the company's profitability until inventory levels are brought into line as a % to sales.
Stated another way, excess inventory levels lower inventory turnover rates and result in lower profits.
Another important factor to consider is the quality of the inventory and the value assigned to it.
FFoorr eexxaammppllee:: A company may have a significant quantity of poor quality inventory. If this remains recorded at the same value, as it would be in good
condition, the income statement will not give a true picture of the profitability of the company.
In this event, the inventory is said to be overvalued. An overvalued inventory will result in the ending inventory value being
higher than it should be The cost of goods sold (CGS) will be lower The net profit will be higher In other words, the result will be that overvalued inventory will result in
an overstated net profit. Conversely, if inventory is undervalued, CGS will be higher in value and the result is that net profit is understated

Financial Management © 152
A key point to be made here is that if you have inventory that is of poor quality or not as saleable for other reasons, it should be evaluated and written down to its correct value.
You should consult your certified accountant for direction in this matter because rules governing evaluation of inventory may vary in different jurisdictions.
Another way of monitoring inventory is by use of the days of sales in inventory ratio.
Summary
In Income Statement Analysis, we have discussed the income statement and the information that it provides.
As well, we have discussed:
Ways the income statement may be organized
What kinds of information you are looking for on the income statement
How some of the information on the income statement may be interpreted and used
You should compare the ideas presented here to the way you presently view your income statement and interpret the information on it.
Testing the Financial Strength of Your Business will provide more information business reports and measuring the performance of your business.
For more information on applying this method, see
Testing the Financial Strength of Your Business.
Laws of Money—of compound interest Allowing money to grow at compound interest will make you rich. The key to making this work is to put it away and never touch it.

Financial Management © 153
Celebrate!!

Financial Management © 154
3. Balance Sheet Analysis
Introduction
The purpose here is not to provide a detailed analysis of the balance sheet as it is beyond the scope of this material; however, discuss it in depth with your accountant.
However, it is important for small business owners to have a basic understanding of financial statements and be able to apply some simple tests to determine the strengths and weaknesses of the business.
Here are a few simple measuring tools:
1. Working capital
2. Historical comparisons
3. Ratio analysis
3.1. Current ratio
3.2. Acid test or quick ratio
We will discuss these tools briefly. However, we discuss these and other financial measurement tools in more detail in Testing the Financial Strength of Your Business.

Financial Management © 155
How to use this information
As you move through this material, think of your own business. Think of the financial statements that you receive from your accountant each month and how you review the material in those reports.
This material will introduce you to some basic measurement ideas and tools
Balance Sheet example
For the purpose of discussion, here is an example of a balance sheet.
The balance sheet below is not interactive.
Ask yourself:
What do the figures actually tell you about your business?
How do you analyze the data?
What tests do you apply to the data now?
What conclusions have you drawn from your analysis?
How have your conclusions benefited your business?
The figures used are those presented for Well
Known Merchandise Inc. in the following section,
Testing the Financial Strength of Your Business.

Well Known Merchandise Inc.Balance Sheet -
ASSETS Dec. 31/98 Dec.31/99 LIABILITIES Dec. 31/98 Dec.31/99
Current Assets Current Liabilities
Cash In Bank 11,000 14,000 Bank Overdraft 0 0Cash On Hand 2,000 3,500 Trade Accounts Payable 15,000 10,050
13,000 17,500 Other Accounts Payable 2,000 3,000Marketable Securities 15,000 15,000 Provision For Taxation 13,925 14,250Value @ Dec. 31/99) Reserves For Unbilled Expenses 2,000 2,000
Interest Due on Fixed Liabilities 700 700Customer Accounts 18,275 17,600 Total Current Liabilities 33,625 30,000Deposits 600 700Employee Accounts 2,000 1,200 Fixed Liabilities(Long Term)Other Receivables 700 500Less;Doubtful Accts 2,000 2,000 Development Bank Loan @ 10% 50,000 50,000Total Receivables 34,575 33,000 (repayable 2008-secured on current
and fixed assets)Inventory
Mortgage Loan @ 8% (repayable 10,000 10,000Finished Products 55,000 60,000 2005-secured on Fixed assets)Work In Progress 14,000 15,000Raw Materials 69,000 75,000 Total Fixed Liabilities 60,000 60,000Other Supplies 1,500 2,000Less:Inventory losses (Shrink/damage/pilferage) 2,000 2,000 Total Liabilities 93,625 90,000Total Inventory 137,500 150,000 Shareholders Equity
Total Current Assets 185,075 200,500 Capital Authorized400,000 common Shares
Deferred AssetsCapital issued: 150,000 150,000 150,000
Fuel Oil 4,000 4,500 Shares @ $1.00 eachTotal Deferred Assets 4,000 4,500Fixed Assets Capital Surplus 10,475 10,475
Land @ cost 20,000 20,000 Earned Surplus 31,775 54,525Buildings @ cost 40,000 40,000Plant, Machinery @ cost 26,000 30,000 Total Shareholders Equity 192,250 215,000Manufacturing tools@cost 6,500 7,000Vehicles @ cost 8,000 8,000Furniture&fixtures @ cost 6,000 6,000Less: Accum.Depreciation 12,700 14,000
93,800 97,000Goodwill 3,000 3,000Total Fixed Assets 96,800 100,000
Total Assets 285,875 305,000 Total Liabilities & Shareholders Equity 285,875 305,000

Financial Management © 157
a. Working capital
Calculate the working capital by subtracting current liabilities from current assets. Cash on hand is part of the working capital.
If the result of this calculation is a negative figure, it is something to be seriously concerned about.
It is not uncommon for businesses of any size to have this situation periodically but a low or negative working capital position is a major danger signal.
A business in this situation has a liquidity problem or is illiquid.
Because owner's equity is less than the debt, the creditors (in effect) own the business. Bankers would be reluctant to lend any more money to the business. Some of the possible solutions to this problem might be:
Seek more funds through long-term borrowing
Additional equity investment by the owner/s
Selling fixed assets and leasing them back from the buyer
Finding a way to finance some of the accounts payable through suppliers
Express this relationship between liabilities and assets as the working capital ratio. [Refer to Testing the Financial Strength of Your Business]
b. Historical comparisons
Comparing balance sheets quarterly and at year-end with those of the same periods in prior years can often reveal trends and weaknesses. You may discover a favourable change that, upon investigation, will lead to making positive changes in the way you do business.

Financial Management © 158
c. Ratio analysis
Ratio analysis is a term for techniques and formulae that allow the businessperson to make quick mathematical tests of the business. This simplifies comparisons with other similar companies in your area and with industry standards.
Two of the more useful ratios are the current ratio and the acid test, sometimes called the quick ratio.
(1) Current ratio
Current ratio measures the liquidity of the company or the company's ability to meet its obligations during the fiscal year.
Divide the current assets by the current liabilities.
For example:
If the sum of the current assets is $30,000 and the sum of the current liabilities is $45,000, then the current ratio is 0:67 or a negative, liquid situation.
A rule-of-thumb that many analysts use is a current ratio of 2:0, but this can vary with the business, the season, and what the figures used actually represent.
Varieties of ratios are discussed in Testing the
Financial Strength of Your Business.

Financial Management © 159
As well, the quality of the accounts receivable (A/R) is important. A high percentage of the accounts may be past due in excess of 90 days or they may be predominantly 30-day accounts with customers who have a history of prompt payment.
Therefore, having an aged analysis of accounts receivable (A/R) is important to have prior to calculating the current ratio.
(2) Acid test or quick ratio
The acid test or quick ratio is a measurement of the liquidity of the business but it is calculated by dividing the most liquid assets (such as cash, securities, and perhaps accounts receivable (A/R), if they are very current-by-current liabilities.
When acid test is applied, it may reveal quite a different picture than that revealed by the current ratio.
A common rule-of-thumb (used by analysts for a desirable ratio) is a ratio of 1:0.
However, do not consider this rules-of-thumb a rigid standard to go by; they are only guidelines.
It depends a great deal on the type of business, for example, the seasonality of the business. On the other hand, how closely the business compares to recognized industry cycles.
For example:
The composition of the inventory may be that it is either very easily moved in a short period or it may be dead stock that will be very difficult to sell.
For example:
To be considered liquid, some businesses may need a current ratio of 2.7:0, while another business may need a ratio of 1.5:0 or even less.

Financial Management © 160
Do your homework.
Always be aware of what is normal for your business and how your business compares. Your banker, accountant, and trade publications are good sources for this information. As well, many regional governments have available detailed business profile information.
Summary
There was an introduction to the balance sheet financial report in Balance Sheet Analysis. There are three common tests to apply to a balance sheet. Likely, you draw conclusions from these tests too.
Did you think about your business as you went through this material?
Apply the ideas presented here to your business.
In Testing the Financial Strength of Your Business, we will present many more ways to analyze and test the financial reports you receive from your accountant each month.
The Laws of Money—of investing Investigate before you invest.
Spend as much time studying an investment as you do earning the money you put into it.
Never let yourself be rushed.

Financial Management © 161
Celebrate!!

Financial Management © 162
4. Testing the Financial Strength of Your Business
Introduction
In Balance Sheet Analysis, we discussed how a business:
Analyzes its costs
Builds cost recovery and profit into its pricing
Monitors monthly business performance
Performs basic financial performance tests
In Testing the Financial Strength of Your Business, we will expand on what you have learned so far and present many other ways to test the performance of your business and make better business decisions.
How to use this information
Use the financial test methodologies illustrated here to test your own business.
You should apply these tests to your business on a regular basis—at least every fiscal quarter.
Compare the results of your tests to accepted standards of performance for businesses of your size, in the same industry.
You may pick up information on industry standards from your accountant or you can obtain it at most libraries.
As well, there are a number of government and industry publications detailing profiles of financial information for businesses of all kinds for various regions of the country.
WWhheenn yyoouu mmaakkee tthheessee ccoommppaarriissoonnss,, aasskk aafftteerr eeaacchh tteesstt::
How does your business compare to the norms for your industry and region of the country?
If you do not compare favourably, what remedial action is needed?
What are the things you are doing well?
What are the specific areas where you are not performing well?
What action would be necessary to improve the results?

Financial Management © 163
You may wish to consult with your accountant to help with a detailed analysis and the answering of these questions.
For the purpose of illustration, we will assume some financial figures for a fictitious company called Well Known Merchandise, Inc. The data is not seen as it would be on a real balance sheet or income statement, but is only used for illustration of the financial tests.
Below is financial data for Well Known Merchandise Inc.:
Current assets $35,000
Fixed assets $100,000
Beginning inventory $170,000
Ending inventory $150,000
Average inventory $160,000
Average accounts receivable (A/R) $20,000
Current liabilities $30,000
Long-term liabilities $60,000
Shareholder's equity $200,000
Number of common shares 200,000
Preferred share dividends $20,000
Net sales $750,000
Net credit sales $140,000
Average accounts payable $10,000
Total credit purchases $170,000
Cost of goods sold (CGS) $500,000
Net profit (net income) before interest and bank charges $60,000
Net profit (net income) $50,000
Interest and bank charges $10,000

Financial Management © 164
Common tests of business performance
Refer to these tests that we will discuss here to as business ratios. The term ratio refers to the proportional relationship between values.
The business ratios we will discuss are:
a. Operational ratios
b. Liquidity ratios
c. Leverage ratios
d. Profitability ratios
We will discuss various ratios that fall into these categories, where they are used, and why they are used.
In some cases, we will give examples of:
How these ratios are used in a business situation
The conclusions that might be drawn
The action that might be indicated
FFoorr eexxaammppllee::
A farmer may say that he has sheep and cows in the ratio of 10 to 3.
This means that he has 10 sheep for every 3 cows.
Or, he has 3½ times as many sheep as he has cows. Often, a ratio is expressed as a fraction.
The ratio of 6 to 10 may be stated as 6/10 or as 6:10.

Financial Management © 165
a. Operational ratios
We have divided this operational ratio information into the following headings:
Headings Related formula
a. Turnover on accounts receivable
Total net credit sales/average accounts receivable
b. Average accounts collected in person
Days in the period x, average accounts receivable/total net credit sales
c. Average days payable Days in the period x accounts payable/total credit purchases
d. Utilization of assets Total net sales/total assets
e. Sales to fixed assets ratio Net sales/average net fixed assets
f. Inventory turnover Cost of goods (CGS) sold (CGS)/average inventory
g. Days of sales in inventory Days in the period x average inventory/cost of goods (CGS) sold (CGS)
h. Sales of employees Net sales (for the year)/average number of employees
You may wish to print these ratios and their formulae. In addition, the Glossary lists them.
These ratios provide you with insight into how to use the business funds and assets within the business.
TThhee ooppeerraattiioonnaall rraattiiooss ddiissccuusssseedd hheerree rreellaattee ttoo::
Management of accounts receivable
Management of accounts payable
Management of inventory
Management of company assets
Management of employee productivity

Financial Management © 166
(1) Turnover on accounts receivable (A/R)
This ratio is a measurement of the liquidity of the accounts receivable (A/R) in the business. This tells you the rate at which credit sales are turned into cash.
A higher ratio is an indicator that the company does not have as much money tied up in accounts receivable (A/R) and that customers are paying their accounts quickly.
A lower ratio is an indicator that the company has a large amount of money tied up in accounts receivable (A/R) and that customers are slower in paying their accounts.
Assume that having a high turnover number is always a good thing. However, ratios show the balance that exists between the factors examined.
In the next ratio, we will demonstrate how the balance is important.
AAccccoouunnttss rreecceeiivvaabbllee ttuurrnnoovveerr ffoorrmmuullaa
Total net credit sales/average accounts receivable
This formula means that the total of the net credit sales for the year is divided by the average accounts receivable that was on the books in the year.
EExxaammppllee::
Well Known Merchandise Inc. has average accounts receivables of $20,000. Add the beginning and ending balance of the accounts receivable and divide by 2.
The total of the charge sales or net credit sales for the year was $140,000.
Therefore, applying our accounts receivable turnover formula: $140,000/$20,000 = 7
Alternatively, the net credit sales are 7 times the average accounts receivable and the ratio is 7:1

Financial Management © 167
(2) The average account collection period
The average account collection period is sometimes called receivable days outstanding or RDO for short. This is a measurement of the number of days it takes for customers to pay their accounts.
If the measurement indicates that customers pay their bills in a short period of time, it could mean that the credit and collection policies of your company are functioning very effectively.
However, it could mean that the credit policies of the company are restrictive and may be affecting sales.
Credit policies have to be flexible enough to both stimulate sales and meet competitive credit policies.
The key and the challenge for the credit department is to ensure the quality of the Accounts receivable (A/R) by only extending credit to customers with good credit histories.
Effective credit policies can:
Stimulate sales
Promote inventory turnover
Maintain cash flow
Improve profitability
It is important to the health of the business to strike a balance.

Financial Management © 168
In this illustration, it takes the customers of Well Known Merchandise Inc. 52 days to pay their accounts.
AAvveerraaggee aaccccoouunntt ccoolllleeccttiioonn ppeerriioodd ffoorrmmuullaa
Days in the period x, average accounts receivable/total net credit sales
The period is a year so the number of days is 365. Calculate the average accounts receivable by adding the beginning and ending balance for accounts receivable and dividing by 2.
The formula says to multiple the average accounts receivable by 365 and the result then divided by the total net credit sales.
EExxaammppllee::
Well Known Merchandise, Inc. has average accounts receivable of $20,000.
The charge sales, or net credit sales, are $140,000 for the fiscal year. Therefore, applying the average account collection period formula:
365 x $20,000/$140,000 = 52
What the formula says to multiple the average value of accounts receivable carried on the books of the company every day by 365 days in the year.
Divide the results by the total of the net credit sales for the year.
The result is the number of days that it takes for customers to pay their accounts.

Financial Management © 169
Consider the 52 days as good or bad. It really depends on the industry standards and the particular needs of the business at the time.
Assume that paying your bills promptly upon receipt of the invoice is desirable. However, as with many of these financial tests, it depends on the business situation and various factors need to be balanced.
Some of these factors are:
Maintaining the credit rating of the company
Taking advantage of supplier payment incentives
Improvement of cash flow in the company
Improvement of the return on investment (ROI) of cash resources in the company
Below are three examples of average days payable:
FFoorr iinnssttaannccee:: The management of a company may have low inventory turnover.
This means that the company will have money tied up in inventory.
As long as there is tied up money, it is not earning a return on that investment.
The company may decide to make regular credit terms more flexible or alternatively apply more flexible credit terms to some promotions during the year.
This action may improve inventory turnover and therefore favourably affect the cash flow, profitability, and average days payable of the company.

Financial Management © 170
Example 1:
Using money costs money If you borrow money to finance inventory, the lender will charge interest for the use of the money. This interest charge effectively reduces the profit margin realized on the sale of the merchandise.
Longer payment terms on purchases from a supplier can have a significant effect on profitability. The advantages are:
Not using the cash assets of the business
Re-deployment of the funds that would have been used
The merchandise purchase may be mostly sold before payment has to be made so, in effect, the supplier is financing your business
Therefore, negotiating an additional 30, 60 or 90 days terms on a purchase can have an impact on profit.
Example 2:
Taking advantage of supplier volume purchasing discounts and early payment incentives can have an impact on profitability.
A typical example is a supplier offering an additional 5 or 10% discount for a particular volume of merchandise purchase. Making a payment by the 15th of the month following the purchase could bring an additional incentive of 1½–2%.
If a business sells merchandise normally yielding a gross margin (GM) of 33⅓%, even improving the cost by 2% means an improvement of 3% in the gross margin at the selling price. As a result, the business now would make a gross margin of 36⅓% on the selling price.

Financial Management © 171
Example 3:
A company buys a volume of merchandise that would normally be valued at $10,000. The company's normal gross margin (GM) on selling price is 33⅓%.
The supplier offers a discount of 5% off the normal price for the volume purchase. Making a full payment by the 15th of the month following purchase, the supplier offers an additional incentive of 2%.
The calculation demonstrating profit improvement is as follows:
This last example demonstrates that taking advantage of the volume discount and payment terms improves the purchasing price by 6.9% (100% - 5% - 2% = 93.1%).
Purchasing at a 6.9% better price means that at the normally selling price that generated 33⅓% gross margin (GM), the gross margin is improved by 10.34% (069 divided by .0667 = .1034).
The average days payable is a measurement of how long it takes your company to pay its bills. These two illustrations point out why analyzing the average days payable is important and then taking action that is appropriate to the company's needs.
Regular purchase value $10,000 Less 5% discount $ 500 Total $ 9,500 Less payment incentive 2% $ 190 Total $ 9,310

Financial Management © 172
In this illustration, it takes the company, Well Known Merchandise Inc. 21.47 days to pay its bills.
Considering this good or bad depends on the industry and the particular company's needs. However, in this illustration, the company is paying its bills less than a month after purchase. In most cases, a company like this can gain significant profit advantages by negotiating better payment terms with its suppliers.
AAvveerraaggee ddaayyss ppaayyaabbllee ffoorrmmuullaa
Days in the period x accounts payable/total credit purchases
The period is a year so the number of days is 365. Calculate the average accounts payable by adding the beginning and ending balance for accounts payable and dividing by 2.
The formula says to multiply the average accounts payable by 365 and the result then divided by the total credit purchases.
EExxaammppllee::
Well Known Merchandise Inc. has average accounts payable of $10,000. The total inventory purchased on credit, or the total credit purchases, are $170,000 for the fiscal year.
Therefore, applying the average accounts payable formula: 365 x $10,000/$170,000 = 21.47
What the formula says to multiple the average value of accounts payable carried on the books of the company every day by 365 days in the year.
Divide the total of the total credit purchases for the year.
The result is the number of days that it takes for the company to pay its bills.

Financial Management © 173
(3) Utilization of assets
Measuring how efficiently assets are utilized in the generation of sales income is a measurement of the financial health of a business. It is a way of comparing the efficiency of the use of capital assets to others in your industry. The analysis is a measurement of the sales dollars that are generated for every dollar invested in assets.
The age of assets and the way they are valued can be an important consideration when doing this analysis.
For example:
You will get very different results in measuring asset utilization if:
The original or historical value of fixed assets is used
The depreciated or 'book value' of the assets is used
The replacement value of the assets is used
UUttiilliizzaattiioonn ooff aasssseettss ffoorrmmuullaa
Total net sales/total assets
The formula says the value of the total net sales of the company is divided by the value of all the assets of the company.
That is the total of the current assets and the fixed assets of the company.
EExxaammppllee::
In the case of Well Known Merchandise Inc., the current assets are valued at $35,000 and fixed assets are valued at $100,000 = 135,000. The total net sales of the company are $750,000.
Therefore, applying the utilization of assets formula: $750,000/$135,000 = 5.55.
This example calculation is saying that for each $1.00 of asset value, $5.55 is generated in net sales and the ratio is 5.55:1.

Financial Management © 174
Compare this analysis in your business to standards for your industry.
If the calculation results in a low ratio compared to others in your industry it might mean that your company is not using its assets as efficiently as it could.
Alternatively, it might mean that you have too much money invested in assets and would look for ways of trimming the fat.
Look carefully at how fixed assets are valued. As well, look at the condition of those fixed assets. Using undervalued fixed assets because you are using historical or depreciated values will ensure your calculations result in a higher ratio.
A higher ratio than industry norms can sometimes mean that your company is operating efficiently and getting the most out of the assets employed in the business.
However, it can mean that the assets employed in the business are overused or stretched to capacity. In this event, short-term gains in profit may result in additional wear and tear on production equipment.
When this equipment is replaced sooner than necessary, the replacement cost could lower profitability.
When you analyze the utilization of assets in your company, look for the underlying reasons why a ratio is high or low. It is a very good idea for any company to plan for the orderly replacement of assets by allocating at least a portion of the accumulated depreciation of assets to a reserve for the replacement of capital assets.
(4) Sales to fixed assets ratio
This measurement is similar to the utilization of assets formula but with the focus on how, efficiently fixed assets are utilized in the generation of sales income.
It is a way of comparing the efficiency of the use of capital assets to others in your industry.
The analysis is a measurement of the sales dollars that are generated for every dollar invested in fixed assets.
Again, higher ratio values could mean that the business is using fixed assets efficiently, but it can imply that fixed assets are being overused.

Financial Management © 175
In the event that fixed assets are overused, it could hasten the need to replace them and could, by doing so, prejudice future profits.
Apply this analysis to your business and to standards for your industry.
If the calculation results in a low ratio compared to others in your industry, it might mean that your company is not using its assets as efficiently as it could.
Alternatively, it might mean that you have too much money invested in assets. In that event, you should look for ways to dispose of redundant or superfluous assets.
Plus, look for ways to use assets more efficiently.
All of the other cautions and recommendations discussed in relation to the utilization of assets formula apply to the sales to fixed assets ratio.
SSaalleess ttoo ffiixxeedd aasssseettss ffoorrmmuullaa
Net sales/average net fixed assets
The formula says to divide the net sales after discounts, returns, and allowances into the average net fixed assets.
The average net fixed assets are an average of the beginning and ending balances for fixed assets.
EExxaammppllee::
Well Known Merchandise Inc. has net sales of $750,000 and fixed assets of $100,000. For this illustration, we will assume the beginning and ending balance for fixed assets was the same.
Therefore, applying the sales to fixed assets ratio: $750,000/$100,000 = 7.5.
This example calculation is saying that for each $1.00 of fixed asset value, $7.50 is generated in net sales and the ratio is 7.5:1.

Financial Management © 176
(5) Inventory turnover ratio
For any business selling merchandise, promoting inventory turnover has a major impact on profitability.
The ratio measuring inventory turnover is one of the most important to your business if your business sells products.
This is because the gross profit of your business increases every time the value of your inventory dollars is turned over.
The term turnover means each time the value of the inventory is sold or replaced.
(In a few cases, this calculation may not reflect average inventory throughout the year. In that event, dividing the total of the monthly inventory balances by 12 will give a more accurate average.)
The inventory turnover formula says that the value of the inventory at the beginning of a fiscal period is added to the value of all the purchases during the fiscal period after all discounts, allowances and returns are taken into account.
Then, from this total, the value of the ending inventory is subtracted to obtain the value of the cost of goods sold (CGS) during the fiscal period.
IInnvveennttoorryy ttuurrnnoovveerr ffoorrmmuullaa
Cost of goods sold (CGS)/average inventory
Calculate the cost of goods sold (CGS) as follows:
Beginning inventory + net purchases – ending inventory = CGS
Calculate the average inventory as follows:
Beginning inventory + ending inventory/2 = average inventory

Financial Management © 177
Divide the result of this calculation by the average inventory value for the fiscal period.
Turnover rates vary greatly in different industries.
Compare the turnover rate for your business with the standards for inventory turnover in your industry.
In general, the turnover rates are high in businesses that sell perishable goods like fresh vegetables, meat, or flowers.
Turnover rates will be high in businesses carrying seasonal products such as gardening products (in some climates). In addition, those products that are subject to rapid changes in fashion or that may become obsolete in a short period of time.
Turnover rates are usually lower in businesses handling durable goods such as machinery, tools, construction products, or heavy appliances.
If the inventory turnover rate for your business varies greatly from industry standards it may be an indication that:
Purchasing practices need improving
Marketing policies and strategies need to be analyzed
Very slow moving or obsolete (dead stock) has been allowed to accumulate and the value of this inventory is lowering your turnover rate
EExxaammppllee::
In the case of Well Known Merchandise Inc., the cost of goods sold is $500,000 and the average inventory is $160,000.
Therefore, applying the inventory turnover formula: $500,000/$160,000 = 3.12.
This example calculation is saying that the average inventory value turned over 3.12 times during the fiscal period.

Financial Management © 178
The inventory turnover formula is a good indicator of the general status of the inventory in your business.
However, a detailed examination of the inventory turnover of each product group is necessary on a regular basis.
Remove slow moving or dead stock from inventory constantly. Don't make this an annual task.
Selling off slow moving items, even below cost price, and reinvesting the proceeds in faster moving inventory can have a dramatic effect on turnover rates and profits.
(6) Days of sales in inventory ratio
The days of sales in inventory ratio tells the business owner how many days that the business could operate with the inventory that is on hand.
It is not likely that the business would go for long periods without replacing stock because business would suffer by not having the items customers need.
Rather, this measurement is a measure of the company investment in inventory. Along with the inventory turnover ratio, the days of sales in inventory can help to determine whether the business has too many dollars invested in inventory.
As with the inventory turnover rate, you may consider this measurement as high or low depending on the industry. Again, the measurement will vary with the type of merchandise.
DDaayyss ooff ssaalleess iinn iinnvveennttoorryy ffoorrmmuullaa
Days in the period x average inventory/cost of goods sold (CGS)
The formula says to multiply the days in the period (which is usually 365 days) by the average inventory, and then divided into the result of the cost of goods sold.
In the case of Well Known Merchandise Inc., the average inventory is $160,000 and the cost of goods sold is $500,000.
Therefore, applying the days of sales in inventory formula: 365 x $160,000/$500,000 = 116.8.
The example calculation is saying that the number of days of sales in inventory is 116.8.

Financial Management © 179
The major point of frequently applying the Inventory turnover formula and the days of sales in inventory formula to your business is:
To obtain a better return for the money invested in inventory
To improve the liquidity of the inventory investment
To improve the freshness and quality of the inventory
(7) Sales per employee ratio
The sales per employee ratio are a very general measurement of the productivity of the employees in the company. If your business is profitable and the performance of the business compares to norms in your industry, this ratio will tell you how much revenue needs to be generated for each employee in the business.
If your business is not profitable or if you apply this formula to your business and find that, you do not compare to industry standards, look for reasons why your productivity per employee is not up to par.
If you are considering the addition of an employee, apply this formula to your business. It will tell you how many more dollars in net sales will be necessary to offset the cost of the employee if you want to maintain your level of productivity.
SSaalleess ppeerr eemmppllooyyeeee ffoorrmmuullaa
Net sales (for the year)/average number of employees
This formula says to divide the average number of employees into the net sales for the year.
For the purpose of illustration, we will assume that Well Known Merchandise Inc. has six employees.
EExxaammppllee::
Well Known Merchandise Inc. has net sales of $750,000 and the average number of employees is 6.
Therefore, applying the sales per employee formula: $750,000/6 = $125,000
This formula says that each $125,000 in net sales may be attributed to each employee in the company.

Financial Management © 180
Ask if:
The additional employee is really necessary
The additional employee will generate the necessary additional revenue
The additional revenue, after expenses, will result in additional profit
b. Liquidity ratios
The ratios discussed in liquidity rations relate to the ability of the business to meet its financial obligations. They measure how quickly the business could convert assets into cash to meet short-term obligations or take advantage of opportunities that required the availability of quick cash. A typical example would be taking advantage of supplier early payment discounts.
We have divided liquidity ratios into three headings:
Headings Related Formulae
a. Current ratio Current assets/current liabilities
b. Acid test ratio Quick assets/current liabilities
c. Inventory to meet working capital ratio
Average inventory/(current assets + average inventory – current liabilities)
You may need to print these ratios and their formulae. The Glossary lists these formulae.

Financial Management © 181
(1) Current ratio
The current ratio measures the ability of the business to meet its short-term obligations. Consider short-term obligations as those that are due within the next 12-month period. The current ratio is a measurement of the working capital in the business. Businesses with a favourable current ratio will normally qualify for better credit terms with suppliers and lenders.
Consider current assets to be:
Cash
Notes receivable
Accounts receivable (A/R)
Marketable securities (stocks, bonds)
Inventory that may be immediately converted to cash
Accounts receivable (A/R) that can be readily converted to cash
Consider current liabilities to be:
Accounts payable
Notes payable within the next 12 months
Term loans payable
Lease amounts payable
Mortgage monthly payments
CCuurrrreenntt rraattiioo ffoorrmmuullaa
Current assets/current liabilities
This formula says to divide that the current assets by the current liabilities.

Financial Management © 182
A current ratio over 1 is usually acceptable in most businesses. However, you should consult business profiles for the norms in your industry and your size of business.
In many businesses, if the ratio is greater than 2, it may be an indication that the investment in inventory is too high and the capital (cash) in the business is being underemployed.
It is not a good sign if the current ratio is under 1, certainly not on a consistent basis. That would possibly indicate that the business will have difficulty meeting its short-term obligations and wouldn't be able to take advantage of special purchasing opportunities or suppliers' early payment discount terms.
EExxaammppllee::
Well Known Merchandise Inc. has current assets of _____ and current liabilities of _____.
Therefore, applying the current ratio formula: $35,000/$30,000 = 1.16
This formula says that the current assets exceed current liabilities by a ratio of 1 16:1

Financial Management © 183
(2) Acid test ratio
The acid test ratio is similar to the current ratio; however, the acid test ratio includes only those current assets that can be immediately converted to cash.
Therefore, prepaid items and inventories are not included in the calculation. The acid test ratio measures the company's ability to meet immediately the demands of creditors.
AAcciidd tteesstt rraattiioo ffoorrmmuullaa
Quick assets/current liabilities
This formula says to divide the quick assets by the current liabilities.
Quick assets are:
Cash Marketable securities (stocks, bond)
Notes receivable accounts receivable (All overage accounts excluded)
EExxaammppllee::
Well Known Merchandise Inc. has current assets of $35,000. For the purpose of simplicity in these illustrations, we haven’t made any judgments as to the liquidity of accounts receivable or inventory.
However, you should do this when doing the calculations for your business.
To illustrate the acid test ratio, let us assume that the quick assets of Well Known Merchandise Inc. are valued at $28,000.
Therefore, applying the acid test ratio formula: $28,000/$30,000 = .933.
This formula states that the acid test ratio is .933:1.
In other words, the company could meet the immediate demands of its creditors if all of the current obligations were suddenly due and payable.

Financial Management © 184
(3) Inventory to net working capital ratio
It is important not to have too much of the working capital of the business tied up in inventory, because it can be expected that only a portion of the inventory could be immediately converted to cash. The balance of the inventory would take some time to liquidate.
Too high a level of cash invested in inventory would indicate that:
The business is not making full use of suppliers' terms
Is not negotiating favourable terms with suppliers
The business may not be able to meet short-term obligations
Apply this formula to your business.
Compare the results to standards for a business of your size in your industry.
It is usually considered a bad sign if, consistently, average inventory value exceeds the sum of current assets minus current liabilities.
In this event, the company will have too much money tied up in inventory and won't be able to meet the current demands of its creditors.
IInnvveennttoorryy ttoo nneett wwoorrkkiinngg ccaappiittaall ffoorrmmuullaa
Average inventory/ (current assets + average inventory – current liabilities)
This formula says to divide the average inventory by the sum of the current assets plus average inventory minus the current liabilities.
EExxaammppllee::
Well Known Merchandise Inc. has an average inventory value of $160,000 current assets are $35,000. Current liabilities are $30,000.
Therefore, applying the inventory to net working capital formula: $160,000/($35,000+$160,000) – $30,000 = .969.
This formula says that the average inventory value is 96.9% of the working capital in the business.

Financial Management © 185
c. Leverage ratios
The ratios discussed here measure the degree to which:
The company uses outside capital sources to finance the business
The company uses the investment of shareholders to finance the business
These ratios are an indication of the ability of the business to repay its creditors and investors.
Two headings divide the leverage ratios:
Headings Related formulae
a. Debt asset ratio Current liabilities + long-term liabilities/(current assets + fixed assets)
b. Debt equity ratio Current liabilities + long-term liabilities/shareholders equity
(1) Debt to asset ratio
The debt to asset ratio measures how much of the assets of the business have been financed from outside lending sources.
This is a key ratio from the perspective of potential lenders.
They want to know how much of the capital in the business has come from the shareholders.
Low debt to asset ratios = better ability to repay creditors
DDeebbtt ttoo aasssseett rraattiioo ffoorrmmuullaa
Current liabilities + long term liabilities/ (current assets + fixed assets)
This formula says to divide the total liabilities by total assets (the sum of all current and fixed assets).
EExxaammppllee::
Well Known Merchandise Inc. has current liabilities of $30,000 and long-term liabilities of $60,000 for total liabilities of $90,000. Current assets are $35,000 and fixed assets are $100,000.
Therefore, applying the debt to asset ratio formula: ($30,000+$60,000)/ ($35,000+$100,000) = .667.

Financial Management © 186
Apply the debt to asset ratio to your business. Compare the result to standards for your industry and your size of business. If the ratio is high, look for ways of improving the ratio such as:
Reducing and/or eliminating slow moving and dead stock
Use some of the proceeds of stock reduction to generally pay down debt
Paying off notes and loans that are not directly financed from current revenues
Use some of the proceeds of stock reduction to reinvest in higher turnover inventory items
Reducing or eliminating overage receivables
Use some of the proceeds for debt reduction as with the proceeds from inventory reduction
If you are contemplating expansion of your business and are likely to require outside financing, you want to make your business as attractive to an investor as possible.
Lowering the debt to asset ratio is an important factor in making your business attractive to an investor.

Financial Management © 187
(2) Debt to equity ratio
Consider the debt to equity ratio as very important by most lenders. It measures the amount of shareholders' investment in relation to the liabilities of the business. Lenders prefer to see low debt to equity ratios because it means the business has been able to finance itself without a great deal of reliance on creditors. However, there is no rule of thumb for debt to equity ratios and the ratio will usually vary depending on whether the business is a young business or a mature business.
Apply the debt to equity ratio to your business. Compare the results to standards for your industry and the size and maturity of your business.
DDeebbtt ttoo eeqquuiittyy rraattiioo ffoorrmmuullaa
Current liabilities + long-term liabilities/shareholder’s equity
This formula says to divide the total liabilities (current liabilities + long-term liabilities) by the shareholders' equity.
Shareholder’s equity may take various forms (cash, bonds, stock, or property). There are a number of ways to structure the investment.
If the company incorporates, issue the stock to the participants on the basis of their investment. We will not deal with this here.
For the purpose of illustration of the debt to equity ratio, we will assume that the business is not a corporation and the partners are equal investors.
EExxaammppllee::
Well Known Merchandise has current liabilities of $30,000 and long-term liabilities of $60,000. The shareholders' equity is $200,000.
Therefore, applying the debt to equity ratio formula: $30,000 + $60,000/$200,000 = .45.
This formula says that the ratio of total liabilities of the business to the shareholders' equity is .45:1.
Alternatively, the total liabilities are 45% of the shareholder’s equity.

Financial Management © 188
d. Profitability ratios
The profitability ratios relate to how much net profit that is generated by the business in relation to the investment in the business and the assets that are employed.
Profit is, after all, the reason for the existence of most businesses. Business owners frequently invest and risk their life savings.
They spend long hours managing their businesses.
In most cases, at the end of the day, they do not want to ‘just make wages' for their efforts.
If the business does not generate an acceptable ‘bottom line' profit, the owners may be better off financially to invest their money and efforts in another enterprise.
Five headings divide profitability ratios:
Headings Related formula
a. Return on sale ratio Net profit after taxes/net sales
b. Return on shareholder's equity ratio
Net income/shareholder's equity
c. Number of times interest earned ratio
Net profit before interest and taxes/annual interest and bank charges
d. Return on total assets ratio Net profit before interest and taxes/annual interest and bank charges
e. Earning per share ratio Net income – preferred dividends/number of common shares
You many want to print these ratios and their formulae. The Glossary lists these formulae.

Financial Management © 189
(1) Return on sales ratio
The rate of sales ratio is a measurement of how much profit the business generates, after taxes, on each dollar of net sales. In other words, how much after tax net income (net profit) is generated for each dollar in net sales.
Consider this result as good or bad. It really depends on what is normal for businesses of the same size in the same industry. It may seem that 7 cents on the dollar is a low return. However, there are a number of industries where the return on sales is 1½–2 cents on the dollar.
Apply this formula to your business. How do the results compare to other businesses in your industry?
RReettuurrnn oonn ssaalleess rraattiioo ffoorrmmuullaa
Net profit after taxes/net sales
This formula says that after operating expenses, interest expenses, and taxes are paid; divide the net profit of the company by the net sales.
xxaammppllee::
Well Known Merchandise Inc. has generated a net profit of $50,000 and had net sales of $750,000.
Therefore, applying the return on sales ratio formula: $50,000/$750,000 = .067.
This formula says that after all expenses and taxes are paid, Well Known Merchandise Inc. earned a return on sales of $.067 per $1.00 of sales or, a ratio of .067:1.

Financial Management © 190
(2) Return on shareholder's equity ratio
The return on shareholder's equity ratio is a measurement of how much money, on an annual basis, the shareholders receive for every dollar they have invested in the business.
Apply this formula to your business. Compare the result to other businesses of similar size and shareholders' investment in your industry.
RReettuurrnn oonn sshhaarreehhoollddeerrss eeqquuiittyy ffoorrmmuullaa
Net income/shareholder’s equity
This formula says to divide the net income of the business (after all expenses and taxes are paid) by the shareholder’s equity
EExxaammppllee::
Well Known Merchandise Inc. has a net income of $50,000 and the shareholder’s equity in the business is $200,000.
Therefore, applying the return on shareholder’s equity formula: $50,000/$200,000 = .25
This formula says that at the end of the fiscal year shareholders of Well Known Merchandise Inc. received $.25 for each $1.00 invested in the business.
That is a 25% return on their investment for the year.
In most cases, consider 25% an excellent return. However, is that the case every year or do the results in that industry fluctuate greatly from year to year?

Financial Management © 191
(3) Number of times interest earned ratio
The number of times interest earned ratio measures the ability of the business to pay the interest on its borrowed capital.
The larger the value of this ratio the more confident lenders are in the ability of the business to handle their debts.
A low value for this ratio would tell lenders that the business could have a problem meeting its financial obligations.
Apply this formula to your business. Compare the results to other companies in your industry of similar size.
NNuummbbeerr ooff ttiimmeess iinntteerreesstt eeaarrnneedd ffoorrmmuullaa
Net profit before interest and taxes/annual interest and bank charges
This formula says to divide the net profit of the company (before interest and deducted taxes) by the total interest and bank charges.
EExxaammppllee::
Well Known Merchandise Inc. has a net profit before interest and bank charges of $60,000. Interest and bank charges for the year were $10,000.
Therefore, applying the number of times interest earned formula: $60,000/$10,000 = 6.
The formula says that the net profit of Well Known Merchandise Inc. was six times the value of the interest and bank charges that were paid during the year.
Lenders would likely consider Well Known Merchandise Inc. a limited risk and would be willing to loan further funds to the company.

Financial Management © 192
(4) Return on total assets
The return on total assets is a measurement of the efficiency of the business in using its assets to generate income. Seasonal variations in income need to be taken into account when the calculation is made. You may want to apply the formula using the total for assets owned and, again, excluding those assets the company leases.
Apply the formula to your business. Compare the result to norms for your industry and size of business.
RReettuurrnn oonn ttoottaall aasssseettss ffoorrmmuullaa
Net income (from operations)/average total assets
Net Income from operations does not include expenses that are not part of operations. Exclude expense items such as income taxes and interest charges.
An average total asset is the sum of average current assets + average fixed assets. It is important in this calculation to use the averages because the valuation of these assets could fluctuate during the year.
The formula says to divide the net income of the company by the average total assets.
For the purpose of the illustration, we will use the value for current assets and fixed assets of Well Known Merchandise Inc. to calculate the average total assets.
EExxaammppllee::
Well Known Merchandise Inc. has net income of $60,000. Current assets are $35,000 and fixed assets are $100,000. Therefore, assuming these are the averages, average total assets are $135,000.
Therefore, applying the return on total assets formula: $60,000/$135,000 = .4444
The formula says that the net income of Well Known Merchandise Inc. for the fiscal period was 44.44% of the average total asset value.
Financial Management © 193
(5) Earnings per share ratio
The earnings per share ratio are a measurement of the company earnings per share of common stock. The measurement is taken after taxes are paid and any dividends paid to preferred shareholders.
Preferred shareholders are usually investors outside the company or at least not part of the ownership of the company.
Typically, their investment is preferred as to a rate of return on any earnings generated but preferred shareholders can be guaranteed a rate of return for a period of time.
In some cases, it may involve an option to convert the preferred stock to shares of common stock on a pre-established conversion ratio.
Preferred shareholders do not usually have voting rights and have any say in the daily operations of the company.
Common shareholders have direct ownership of the company.
The common shareholders do have a say in the operations of the company and they share in the net income after tax profits that may be disbursed by the company.
EEaarrnniinnggss ppeerr sshhaarree ffoorrmmuullaa Net income—preferred dividends/number of common shares
This formula says to divide the number of common shares into the net income of the company, minus the preferred dividends.
EExxaammppllee:: Well Known Merchandise Inc. has a net income of $50,000 and pays preferred
dividends of $20,000. The number of common shares is 200,000, which represents the investment of the owners of $1.00 per share.
Therefore, applying the earnings per share formula: $50,000 – $20,000/200,000 = $.15.
This formula says to divide the net income of the company minus the preferred share dividends by the number of common shares
The result is that the earnings per common share were $.15/per share. This means that for every $1.00 the common shareholders have invested, they
earned 15 cents or 15%. This is not always disbursed to the common shareholders. Usually some of this money is held as retained earnings or reserves for capital
projects.

Financial Management © 194
Apply this formula to your business. Compare the result to other similar businesses in your industry.
Summary
In Testing the Financial Strength of Your Business, we discussed methods of testing and monitoring the financial strength of your business. You may not use all of these tests every time you do your monthly performance review; however, as you discover variances in your financial statements and reports, you will find these ratios useful in testing your business.
As you move through the material in this section, did you think of your own business? Did you think about how you now review your financial reports?
Did you apply some of the ratios to your business and ask yourself:
What tests should you apply to the data now?
What do the ratios actually tell you about your business?
How do you analyze the data?
What conclusions should you draw from your analysis?
How will your conclusions benefit your business?
This material has introduced you to some basic measurement ideas and tools that will help you make better business decisions. Using these methods will allow you to compare your business performance to other businesses in your industry.
Laws of Money—of accumulation Great financial achievement is an accumulation of hundreds of small efforts. You should build a momentum to your savings plan and let nothing get in its
way.

Financial Management © 195
Celebrate!!

Financial Management © 196
E. Financing, & Risk Management, Business Planning
Introduction
In this section, we will be discussing common types of business financing and factors that the business manager should consider when arranging financing for the business.
A business will frequently require financing to implement the business plan. A section of the business plan should present how the financing will be used or how the funds will be applied in the implementation of the business plan.
As well, we will discuss the format of a business plan and provide a sample of the elements of a business plan. An important part of a good business plan is risk analysis. Therefore, one of the sub-sections will discuss typical risks that must be considered when a business manager prepares a business plan.
The intent of this material is to discuss important factors that a business manager must consider when putting together the business plan after the completed basic research and analysis.
The following three segments provide an overview of the section:

Financial Management © 197
A guide to financing
In A Guide to Financing, we will discuss key issues that need to be addressed when a business seeks financing.
A Guide to Financing stresses the importance of determining the right type of financing for the business. As well, it stresses the importance of establishing good communication with your lender.
Risk management strategies
Risk management is an important part of business planning. In Risk Management Strategy, we detail many of the possible common risk management situations.
Many examples of risk situations are presented in detail and possible solutions are given.
TThhiiss mmaatteerriiaall iiss ddiivviiddeedd iinnttoo tthhrreeee mmaajjoorr ppaarrttss::
Financial considerations
Banking finances
Other types of finances

Financial Management © 198
Business plan format sample
The Business Plan Format Sample is included because interpreting financial statements and performance-monitoring methods are part of business planning. A business plan format is provided that can be used by many businesses.
Briefly discussed is risk management but dealt with more fully in the following segment.
TThhee mmaaiinn aarreeaass ccoovveerreedd aarree::
1. The key elements of the business plan
2. How the elements should be presented
3. The way the content of the material should be presented
4. The role of the financial statements and reports
Laws of Business—of the customer Customers always seek the very most at the lowest possible price. Proper
business planning demands that you focus on the self-interest of the customer.

Financial Management © 199
1. A Guide to Finance
Introduction
If you have completed a detailed business plan and it indicates that financing will be required to successfully carry on the business and meet the objectives of the plan, then you will need to adapt your business plan for use as a financing proposal to your lender/s.
Consider a few things when you do this. The difference between the business plan and the financing proposal is:
The intention of the business plan is to clarify understanding of the business. It also outlines the actions necessary to achieve the goals of the business.
The intention of the financing proposal is to show prospective lenders that you know what you are doing and are an attractive investment.
After A Guide to Finance, we will present a typical business plan format that most businesses use for either purpose.
Most bankers deal every day with small business people who do not understand money and the various types of financing.
Your job is to convince the banker that you have completed your homework.
Furthermore, that you understand what the bank requires to support and approve your financing proposal. To do this is a matter of the emphasis that is placed on aspects of the business plan.
It will save you a lot of trouble in the future and eliminate the two worst problems in this area encountered by small business:
Getting the wrong type of loan for the right reasons Working with a banker who will say ‘Yes' to your proposal but will
approve inadequate financing for the business
This can be dynamite!
Knowing what you need is the key!

Financial Management © 200
You need to know specifically why you are borrowing the money. You must know how to apply funding and how this funding will provide a payback that will enable the repayment of the loan. If you don't make this very clear to the banker, you may wind up getting the wrong type of financing or financing that is difficult for the business to sustain.
One of the reasons for including a detailed pro-forma cash flow is to show how much cash will currently be available at any time to meet expenses and loan payment obligations.
Be very sure that you do not commit to pay off a loan faster than the cash flow can handle.
First and foremost, fit the financing to the need.
How to use this information
A business will have the business history to show a lender. This can be both positive and negative.
An existing business only needs financing if it has to support current operations or needs financing for future projects or expansion.
In either case, the business needs to prepare a strong business plan with well thought out and detailed current and projected financial statements.
Again, it is important to understand and speak the language of the lender. The business will have to convince the lender that they have charge of the business and will be able to achieve the projected objectives.
A Guide to Finance will discuss key issues for an existing business seeking financing.
This material is divided into three major parts:
1. Financial considerations
2. Banking finances
3. Other types of finances

Financial Management © 201
Financing considerations
The chief consideration when considering financing for an enterprise is determining the debt vs. equity ratio that is right for the business.
How much capital are the owners of the business contributing to the business?
How much capital will be required from outside sources?
When you go to a banker for financing, you are going there for debt financing in the form of a loan that must be repaid over a predetermined period at a definite additional interest cost.
The investment made in the business by the owner of the business is the equity financing. This is money that will not be repaid unless all or a portion of the ownership of the business is sold.
When you debt finance you don't give up any part of the ownership of the business as you do with equity financing, but you will give up some measure of control over the affairs of the business for a length of time.
It is good to remember that, with debt, you pay interest for a time, but equity can yield profits forever.
The banker wants to know the existing debt vs. equity ratio and what it will be if the proposed financing is approved. A high debt vs. equity ratio indicates high risk.
Debt money is rented money and must be repaid no matter how well the business does.
Do not commit to a more costly or wrongly structured loan.
The cash flow may not be sufficient to meet the payments. In this event, you could lose the business.
Highly leverage businesses, that is, businesses with a higher debt vs. equity ratio, must earn more money to survive.
Don't be fooled by get rich quick schemes that recommend the use of borrowed money.
Many small business people are taken in by loan sharks, and then find themselves on a treadmill that they can't get off.

Financial Management © 202
If you have insufficient capital and very long-term debt that is almost impossible to pay off, you will spin your wheels forever.
Call this problem over trading.
Consult your accountant for advice on typical debt vs. equity ratios for your type of business and as the old cliché says, ″don't bite off more than you can chew.″
If a short-term loan goes sour, the banker knows it will probably be detected quickly and perhaps remedial action can be taken.
However, a long-term loan is often for much larger amounts, so the exposure is greater. The business may be sliding down hill over a long length of time and this is difficult to detect until it is too late to do anything about it.
When a pro-forma cash flow is prepared, you gain two essential pieces of information that help determine what kind of financing you need:
1. The sum of the negative cash flow gives an indication of the basic amount of money required (in some combination of debt and equity) to exactly offset the difference between revenue and expense.
2. The projected cash receipts show how much money will be generated to repay any debt that will be incurred.
It is very important to make sure to arrange sufficient financing to ensure that the venture will be successful and profitable, but not over-financed to the extent that the business cannot comfortably service the debt.
Bank financing
Banks typically divide their lending into three main categories. A bouquet of flowers can represent these categories. Place a single flower in a vase or place three flowers in a vase as a bouquet. It will depend on the business how many flowers are used at any one time.
a. Short term financing—this usually takes the form of paying off the notes within one year, often in one lump sum. (Blue flower)
b. Intermediate term financing—this is usually for one to five years and is normally repaid on a monthly basis. (Red flower)

Financial Management © 203
c. Long term financing—this is for periods of five or more years and probably the best examples of this are financing real estate or major pieces of capital equipment where the expected useful life of the asset is many years. Therefore, the repayment schedule is over many years to fit the life of the asset. (Yellow flower)
All of these loans may be secured or unsecured.
A secured loan is a backed up loan with collateral such as liens against the property, savings accounts, investments; or a co-signer with a better credit rating.
If you default on the loan, the bank will take the assets and the proceeds applied against the amount outstanding on the loan.
On the other hand, no bank wants to be a second hand dealer and they will usually try to help the borrower to overcome short-term problems. However, a lien does add weight to the loan contract and makes it very hard for the borrower to consider even defaulting on the loan.
An unsecured loan is a loan not backed by any sort of collateral.
These are virtually all short-term loans and only individuals with a solid track record of credit worthiness receive them.
The bank backs the loan because of its confidence in the individual's reputation and capability of repaying the loan. Long-term loans are never unsecured.
Now, let us look at how and under what circumstances these three basic forms of banking financing are used by the small business.
a. Short-term financing
b. Intermediate term financing
c. Long-term financing

Financial Management © 204
(1) Short term financing
Short-term needs use short term financing.
Examples of this might be seasonal inventory loans or short run production loans where paying out the loans out of the proceeds comes from the specific transactions involved.
Financing them over a longer period could have a serious effect on the business.
If the practice continued, it would gradually weaken the business by negatively affecting the debt vs. equity ratio and eroding the assets of the company.
A prime rule of financing is never pay for an exhausted asset, a service, or a benefit.
A typical example of doing this would be borrowing money to pay suppliers for sold inventory.
Banks are usually reluctant to do this because it clearly indicates mismanaged finances.
However, in some businesses accounts receivable (A/R) days outstanding (RDO) may normally run 60 to 90 days, in which case either appropriate terms should be arranged with suppliers or a line of credit established at the bank.
This can be a very useful tool if used properly. It allows you to bridge the fluctuations that may occur in sales and/or the payment of receivables and allows you to keep suppliers current and take advantage of all early payment discounts that trade suppliers may offer.
The main thing to avoid, as a small businessperson, being caught paying for last year's short term borrowing next year. The accumulative affect of this can be devastating.

Financial Management © 205
(2) Intermediate term financing
Use intermediate term financing to finance needs of three to five years in duration.
Typical examples are loans for equipment that has a short life span or perhaps will be obsolete or upgraded within five years.
In addition, use intermediate financing for companies needing additional working capital during periods of rapid expansion.
In this case, convert the debt constantly from a portion of the earnings on sales or services.
In this way, it is possible to use the bank's money, but most businesses should not plan to be able to do this.
For one thing, it requires a banker with vision who will be willing to accept the additional risk of gambling on the long-term success of the enterprise and it requires a business with high enough profit margins to handle the additional interest cost on top of operational expense.
(3) Long term financing
Long term financing is for long-term needs such as land, buildings, and major pieces of capital equipment like manufacturing machinery.
These fixed assets have very long useable lives and Pay these over a long period because these are fixed assets have a long useable life.
It is usually unwise to pay off this kind of debt too fast unless you are extremely well capitalized or unexpectedly benefit from a windfall profit.
In any event, paying it off may not be the best use of additional funding.
There may be tax implications to consider or perhaps better investments for that capital that would generate more profits.
Before paying off any long-term debt, consult your accountant and your banker and think through the ramifications of all the options available to you.

Financial Management © 206
Other types of financing
The intention of this discussion is not to be a complete treatment of debt financing, but rather is an overview or guide to the types of financing normally available to businesses. We will make a brief mention of other types of financing.
For many businesses credit with their suppliers, or trade credit, is the biggest source of credit and the bank is the most important single financing source.
Small businesses do not often use several other sources of credit but used by intermediate and large businesses are factoring, discounting receivable, stocks, and bonds.
There are other debt instruments but we will not deal with them here. If you want more information on these other options, you should discuss the matter with your banker and accountant.

Financial Management © 207
Summary
Properly financing your business is one of the most important considerations of the businessperson. Prepare your business plan and carefully analyze what the cost of accomplishing each and every stage of that plan will be. Then, based upon the cash flow of the business, determine the proportions of debt vs. equity funding that will be required to make the business viable.
Know exactly what the borrowed funds will be used for, how they will be applied, and in each instance for what time.
Break this down in terms of short term, intermediate term, and long term financing.
When you go to the banker, make sure that:
You get the money that you know that you need to run the business successfully and profitably.
Listen to advice on modifying the amount of money needed, but think it through and if you don't feel the arguments are sound, see another banker.
Remember that you're the one that knows your business best and ultimately must make it successful.
Take your time. Do your homework. Consider all of your options before making a decision. Don't be rushed into making a decision on financing that you will regret later.
Fit the financing to the need. The loan period should always fit the expected use and application of the funds.
Never commit to a loan with payments that will be difficult for the cash flow to handle after paying all current expenses.
Laws of Money–—of attraction As you accumulate money you begin attracting more money to yourself.
Thinking about money as you save makes you a magnet; you attract more money into your life.

Financial Management © 208
Celebrate!

Financial Management © 209
2. Risk Management Strategies
It is very important for the business owner or manager to think through as thoroughly as possible the potential risks that the business may encounter. Then, the company needs to develop preventative strategies and contingency plans to deal with these problems if they occur.
This is an important part of the business plan. It is impossible, in this discussion, to identify all of the risks a business may encounter, as some risks will vary with the business. However, many risks are common to every business.
We will deal with some of these here and put forth some suggested solutions.
When you review the business plan, give special attention to this area of the plan to make sure that conditions have not changed and the business takes all of the variables into account that it can.
Each heading is divided into two smaller parts:
1. Risks
2. Suggested solutions
RRiisskk mmaannaaggeemmeenntt ssttrraatteeggyy iiss ddiivviiddeedd iinnttoo ffiivvee mmaajjoorr hheeaaddiinnggss::
Personnel Assets
Administration Business fluctuations
Competitive activity

Financial Management © 210
Personnel
What if a key employee leaves the company?
Risks
Impact on workload and office efficiency
Loss of proprietary knowledge
Loss of client and project knowledge
Loss of continuity of relationship with a client or project
Expense of replacing and training a new employee
Suggested solutions
Cross training of staff to build more depth and flexibility.
Develop a staff training and development program for the company.
Use of staff contracts (Non-Disclosure, Employment Contract, or Commission Sales Agreements) to protect against theft of knowledge, customers, etc.
Involve the staff in their colleagues' projects for the protection of project knowledge and client relationships.
Develop an incentive program strategy to further involve and retain good staff.
Develop a roster of professionals available to do contract work.
This can provide more flexibility of staffing, provide back up in case of emergency and have the effect of lowering overall annual salary expense.

Financial Management © 211
What safety policy and procedures program is in place?
Risks
WCB (Workmen's Compensation Board) requires that every company have a safety policy and procedure program.
Failing to do this can result in fines of $2,500 or more for first offences.
Exposing the company to legal liability by not having a safety policy and procedures program in place
Suggested solutions
WCB puts out a booklet on how to start and maintain a safety program.
They also put out a number of other booklets on safety in the workplace that can be helpful in putting the program together.
Form a safety committee even in a small company. It should consist of one person from management and one from each area of the company.
Field or grass roots personnel must be involved in the safety process.
Regular, documented meetings are required.
For some companies the establishing and running of a safety program is too time consuming and they do contract out most of the process. However, the company must participate in the running of the program.

Financial Management © 212
Assets
How often is the company insurance policies reviewed?
Risks
Property and equipment evaluations change and the existing insurance may not cover current replacement cost.
Changing legislation or claim awards may make present insurance coverage inadequate.
Suggested solution
Regularly review the company's insurance policies with your agent to ensure that any new personnel, site conditions, equipment, requirements of legislation, etc., are covered.
What measures are in place to protect the Intellectual Property and administrative records of the company?
Risks
A fire or other disaster could wipe out or severely damage key business records.
Inefficient or inadequate protection of computer data could lead to significant losses to the company due to damage to the relationship with a client or perhaps even a lawsuit.
In the extreme, at some point you may even have a disgruntled employee that sabotages your data.
Suggested solutions
A hard copy, microfilm, computer disk, or some form of back-up record must be made of all business records. These should then be stored in a fire- proof vault, preferably at a remote location.
All computer data on Intellectual Property, back up current projects and past projects daily and a copy kept in a secure, fireproof location.
Regularly maintain the computer network system and periodically perform an assessment of the integrity of the system.

Financial Management © 213
What has the company done to protect itself against the financial impact of having to replace worn-out equipment or suddenly needing new equipment?
Risks
Existing capital equipment will eventually wear out or become obsolete.
The replacement of these assets may put a strain on the financial resources of the company.
Remaining competitive may demand that the acquisition of certain equipment.
Maintaining security, efficiency and reducing potential liability of the operation may demand acquisition of new equipment.
Suggested solutions
All capital assets should be tracked in a register that records the initial cost, expected useful life of the asset, the annual rate of depreciation, any maintenance or repairs that are done and the recovered value in the event that it is sold.
A three- to five-year projection should be made of the total value of assets that will reach the end of their useful life each year.
Of course, completing a yearly review and making adjustments to the next year that account for inflation.
A reserve or contingency fund for the replacement of capital equipment should be set up.
Each month credit an amount equal to the accumulated depreciation on capital assets to this reserve.
Depending on the value of the assets projected to need replacing, estimated new equipment needs and the rate of inflation, you may wish to increase the contributions to the reserve.
Taking this approach protects the business against unbudgeted capital costs and ensures that the business has the resources it needs when it needs them.
As well, these reserves build financial strength into the business and increase the options when a need arises.

Financial Management © 214
Administration
What if there are new government taxes or regulations that make it more costly to do business?
Risks
Additional taxes may be required that have not been included in estimates.
New requirements for bonding or liability insurance could be brought in and have to be accounted for in pricing.
Professional associations could make new demands on members that will add to the cost of doing business.
Additional employee benefit legislation could increase costs.
FFFooorrr eeexxxaaammmpppllleee:::
The contingency fund for replacement of capital equipment may or may not actually be depleted to satisfy the need. Rather, leveraging the money may depend on the asset, its expected useful life, and the borrowing rate at the time.
Depending on the situation, it may be better for the liquidity of the company to lease the resource rather than buy it. In addition, tax consideration can affect the decision on when and how to acquire an asset. The small business owner or manager should discuss with their accountant or business consultant these questions.

Financial Management © 215
Suggested solutions
Client contracts must include clauses that allow for the addition of charges for unforeseen government imposed charges or costly compliances.
Quotations should always be time limited and include a disclaimer that allows for the adding of charges not included in the quote.
Pricing reviews should include a factoring in of the projected rate of inflation in salary and benefit expense.
It is a good idea to have a policy of undertaking salary reviews effective on employee anniversary dates rather than performing this for everyone at the same time. This tends to spread the impact of salary and benefit expense over the whole year.
Business fluctuations
How would you handle a dramatic increase in your business?
Risks
Existing staff may not be able to cope with the workload.
Efficiency suffers and the potential for costly errors increases.
Demands on financial resources may greatly exceed budget projections.
New or additional equipment may be required to meet the growing demands of the business—equipment for which there is no budgeted funds.
Suggested solutions
Cross training, career development programs, involving employees in a number of projects and using contractors can alleviate the problem if the expected surge in business is temporary.
Having a roster of contractors to draw on is a good way to deal with the expected problem if it is to last six months to two years.
You buy the expertise you need without making a long-term commitment. The downside is that contract employees don't have the same commitment to the organization as that of full-time employees.
Older or semi-retired professionals are often a good source of contract employees.

Financial Management © 216
It may be a good idea to hire a new graduate to do junior work.
Even a 3rd year student (post-secondary) may take some of the pressure off for a few months if you can arrange for this option between semesters.
This approach may free the hands of more experienced employees for more important work.
Establishing and maintaining a good relationship with your bank manager is essential if any business is going to weather the periodic ups and downs.
A key part of this is preparing a cash flow projection and arranging for an operating line of credit.
If you communicate your monthly results to the bank, usually there is no problem adjusting the line of credit if circumstances warrant it.
Building in proper capital equipment reserves into the business for a sudden demand upon the business for additional resources will not usually have a severe financial impact.
To maintain greater liquidity in the business, in certain circumstances it may be advisable to lease rather than buy equipment.
For short-term needs, renting may be an option but rates are usually much higher than leasing.
How would you handle a dramatic decrease in your business?
Risks
Key, terminating long-term employees may be a danger. It may have taken years to build this team of people. These key employees, who may take proprietary knowledge with them, may wind up working for a competitor.
Valuable, hard-to-replace, knowledge, and expertise could be lost to the business
Possible disruption of client relationships with key employees
The company may have recently depleted cash reserves by making major investments in facilities or equipment. The lack of liquidity created by this move could now threaten the business.
The company may be committed to long-term financing agreements that are now very difficult for the business to handle
Financial Management © 217
Suggested solutions
Again, the solution to the personnel problem is similar to the previous situations described.
Maintaining flexibility in the workforce is crucial to the success of the small business.
Incentive programs and career development programs can help to retain key employees.
Involving the staff in the decision-making process builds their commitment to the business. Their employment becomes more than a job to them.
Use employment contracts as a way of controlling the loss of proprietary knowledge.
Reviewing semi-annually the business plan, preparing annual cash flow projections, and completing a detailed analysis of operations every month, can identify most problems before they reach crisis proportions.
Properly structuring financing to fit the current and future needs of the business is an important way of avoiding a negative impact on the business if business declines.
Maintaining the flexibility and liquidity of the business is very important when structuring the financing of the business.
Before making a major capital investment or committing to financing arrangements for facilities or equipment, a manager should review the business plan and prepare a detailed analysis of current and projected business results.
Discuss the results of this analysis with the accountant or business manager to determine the best course of action.

Financial Management © 218
What if there is a drastic change in client demands or the general needs of the marketplace for your services?
Risks
The business may suddenly find that it does not have the properly qualified or trained staff to cope with new market demands.
Changing technology may dictate the acquiring of new staff or new equipment in order to remain competitive.
Suggested solutions
Ongoing career development programs for employees are a good way of minimizing the effects of changing technology or changing market demands on the business.
If the older staff is not supported in their efforts to broaden their knowledge and upgrade their skills, the value of their expertise may deteriorate.
Rather than an expense to the business, this support is really an investment that will be returned to the business tenfold.
This support also builds loyalty among staff by demonstrating your belief that they are valuable members of the team.
Hiring a contractor may temporarily best satisfy a sudden requirement for new technological skills.
Depending on the skills required, sometimes acquiring a new graduate trained in the latest skills is the best and cheapest approach.

Financial Management © 219
Competitive activity
How will your competitors react to a new or aggressive marketing strategy?
Risks
Competitors may feel that their market share is threatened and take retaliatory action through various strategies; for example, sharp pricing, providing additional services at no extra cost, or aggressive advertising.
They may even purposely target some of your best clients with special deals in order to get back at you.
It is not unusual with a initial new marketing strategy to have a decline in business as the marketplace adjusts and becomes aware of the new direction of the business
During this time, a few customers, particularly those that don't fit the new approach of the business, may be lost, or perhaps picked-off by a competitor.
Whenever there is a change in strategy there may be misinformation or rumors circulated as to the dependability or viability of the business.
Suggested solutions
Make sure before embarking on a new marketing strategy to complete t a detailed market analysis.
Know what your return on investment or ROI is on all of the current market segments of your business.
Analyze what your market share is in each market segment; what market share is realistically available to you; and how much it will cost the business to achieve that level of performance.
Now do the same analysis for the new markets you intend to exploit.
Now you have a better idea of what you may be leaving behind, the potential for growth of the new marketing approach and the cost of the program to the business.

Financial Management © 220
Make sure that your marketing strategy includes an effective media plan to get the message out on your new approach to existing customers, potential customers and your competitors.
Take charge; don't allow rumors in the marketplace to affect adversely your strategy.
This also can defuse potential problems with competitors.
Occasionally, you can even build goodwill with competitors and customers by referring some existing clients to them not best served by the new business approach.
This is all part of a well-thought-out marketing strategy.
What if new competitors enter the market and dilute the potential market share available?
Risks
The problems that arise in this situation are the same as explained previously when there is a decline or even a dramatic downturn in business.
Current completed projects may affect significantly the cash flow of the business.
Key personnel may be at risk.
There may be an effect of the ability of the business to sustain its financial commitments
Suggested solutions
A detailed marketing analysis is necessary.
Before making any changes to the approach of the business, it needs to be determined if the affect on the market of the new competitors is temporary or long term.
Is the total market potential static or extremely slow growing is it likely to resume a steady growth pattern in the near future, or will it perhaps be rapidly expanding in a few months?
Decide whether the pie is shrinking, growing, or staying the same.
Decide whether you should go after a larger share of the pie, try to make the Pie expand, or go after a new pie.

Financial Management © 221
Obviously, it is essential again to know what the ROI is on existing market segments and analyze the expected ROI for any potential market segments. (ROI—return on investment)
At least temporarily, the same remedial steps apply regarding personnel, assets, and financing (previously discussed).
It is important to position the business and to have the maximum number of options in a given situation to realize the best possible ROI on the people and resources in the company.
Summary
In Risk Management Strategies, we have discussed a number of common problems that can suddenly confront the businessperson. We have discussed some of the risks that might be associated with the problems and present possible solutions.
Planning for risk management is an important part of business planning. Anticipating potential risks and planning, and budgeting for the handling of the problems will minimize the impact on the business.
Think about how you do your business planning now.
Ask yourself:
Do you do a good job of risk management and planning for contingencies?
What have you learned from this section that you can use to improve your business now?
How would you change your business plan to protect better your business?
Laws of Business—of purpose
The purpose of a business is to create and keep a customer. This takes precedence over making a profit.
Profits will follow when customers are created and kept.

Financial Management © 222
Celebrate!!

Financial Management © 223
3. Business Plan Format Sample
Business plans will vary in format and approach depending on the type of company, its stage of development and what you are trying to accomplish with the plan; e.g., attract investors, approaching a lending institution or as a blueprint for planned growth.
The following sample business plan format is one that could be useful for many businesses:
Introductory page
Company name, address, phone number, fax, email, and URL
Key contact people and their phone numbers
A brief paragraph or two about the nature of the market area
FFoorr eexxaammppllee::
Geographical location, major economic factors, general demographical information, style of doing business in the area and any significant factors that you think affect your region differently in the way you approach the marketplace

Financial Management © 224
Executive summary
Highlights of a business plan
Summarize in point form your key results or outcomes over the next three years for each of the key segments of your business
State for each segment:
What part it plays in your business now
Where you expect it to be in each of the next three years
The profit/loss you expect over the next three years
Note the additional resources (in general) that will be required to achieve these goals and the ROI (return on investment) that you project
State the competitive position and advantages to be gained by your plans.
Table of contents page
List section titles and page numbers
Detailed business plan
A detailed business plan has five subheadings:
Industry descriptions
Major market activity planned in each business segment
Business goals 1-year actual—3-year forecast
Market strategy
Assessment of risks

Financial Management © 225
(1) Industry descriptions
Industry outlook in your region and the potential for growth in each of the key business segments
Note apparent industry trends or new products, competitive activity you see developing in your area.
State your sources.
Describe the potential size of the market over the next three years, rate of growth and changing customer needs or trends.
Try to assess competitive activity, for example:
Who are the big players in each business segment?
What competitive strengths/weaknesses do they have?
Relative market share (state yours also)
Estimate of profitability, if known
Note if there are:
Population shifts
Changes in consumer trends
Business prospects of key industries
Other major economic factors that will affect your key business segments

Financial Management © 226
(2) Major market activity planned in each business segment
State major objectives for each segment in point form.
Describe the target markets for each segment and state the reason chosen, developing needs and trends, and other relative information.
Outline your competitive advantage
Are your premises adequate to handle the projected growth in each business segment?
Are they physically located in the best place to serve your target markets?
Detail the projected staff and equipment requirements to support the growth in each business segment over the next three years.
Note any current market action in any of the business segments and the results.
For example:
What niche will you fill in the market?
How will you exploit these opportunities?
Why will you achieve success?
By what means and what do you estimate your share of the market will be over the next three years?

Financial Management © 227
(3) Business goals 1 year actual–3 year forecast
Prepare a detailed spreadsheet income and expense budget for each business segment reflecting the already stated changes expected in each segment.
For the first year only, a monthly forecast of income and expense is useful in projecting cash flow and the timing support of needed marketing support funds.
It is important to know exactly what it is costing to do business in each segment.
It helps keep priorities straight, to be aware of the drain on resources of less profitable segments and to estimate the funding necessary to bring less profitable segments up to speed.
State your assumptions and the basis for those assumptions in making the forecast for each business.
(4) Market strategy
In detail, describe the action plan in each business segment to accomplish the goals and activities that you wrote based on your market research and analysis.
How will you prioritize your efforts in each business segment to reflect the needs and potential of your region in the first year and over the next three years?
For the next three years, will your pricing strategy as it exists now meet the economic needs of each business?
If not, why and what changes do you anticipate being necessary due to the cost of doing business, competition, and other changes.
Prepare a 12-month advertising plan, for the first year only, in spreadsheet form.
It is pointless to do it in detail beyond 12 months but add comments separately to detail the expected changes to the plan to back up your budget figures for the business.
Note how you will measure the results of your strategy.
What methods are in place now or that will be in place to measure customer responses (logging of jobs received, ad responses, phone inquires, and other customer responses).

Financial Management © 228
(5) Assessment of risks
You always have to take a step back after you prepare a business plan and give some thought to the following:
How will the competition react to the new approach?
What if there is a sudden downturn in the economy?
What if some new form of legislation adversely affects the business?
What if there is some unforeseen competitive activity?
What if there are drastic shifts in client demands that you, for which, are not prepared?
Try to foresee any pitfalls, problems, and possible reaction after you have committed resources to your new business plan and marketing strategy.
Examine also, things like:
If sales doubled or tripled, could you handle it?
What if sales suddenly dropped by 50 %, what would you do?
What if your key person, who accounts for a major portion of your revenue, quits, what would you do?
For many small businesses, particularly service businesses, they can stop now.
It is wise to prepare contingency plans.

Financial Management © 229
However, for larger businesses an organizational plan in graphic form would usually be included and if the business is applying to a lender for an operating loan, include a detailed financial plan:
Take your business plan and design it as a spreadsheet so it is visual. It could be complete with months and specific dates, activities/tasks, and those who are responsible for each of them.
You could have one set of spreadsheets that include your marketing plan or have two spreadsheets.
Post the spreadsheets on the wall of the office for easy viewing and monitoring.
As the year progresses, you might cross off the completed outcomes, tasks, or deadlines. It is always good to know when something is completed and how much remains.
The Law of Money—of accelerating acceleration
The faster you move toward financial freedom, the faster it moves toward you.
It's an offshoot of the Law of Attraction: what you want wants you.
The past 2–3 years balance sheets and income statements
Financial forecasts both balance sheets and income statements
Cash flow forecasts
Capitalization
Term loan required
Line or credit required
Details of current financing, if any
All references and documentation required by the lender

Financial Management © 230
Celebrate!!

Financial Management © 231
Summary of Financial Management The central point of the foregoing discussions on financial management is that you only control your business to the degree that you have control over the financial information upon which you base your business decisions.
It is imperative that any businessperson takes the time to think out carefully and in detail, the objectives of the business and the implementation plan (prepare a business plan).
Although we have spent some time on historical financial reports, the emphasis is on operating financial data.
On a daily basis, these financial reports, tests, and methods provide the early warning system you need to monitor your business and make the judgments and decisions that will keep your business on the tracks in a profitable direction.
Often businesspeople complain that they just don't have the time to do the business planning and analysis (that we have discussed) because they are too busy coping with the pressures of daily business. That is the clearest indication that they are desperately in need of help!
Having a business plan and setting aside specific times for analysis of the business actually liberates the manager and frees up time for implementation of effective business strategies.
FFoorr eexxaammppllee::
Inventory management report
Credit management reports
Income statements and cash flow statements
Deviation analysis
Analyzing fixed and variable costs
Break-even point analysis
Tests of the financial strength of the business
Planning is the key to business success!

Financial Management © 232
Final celebration!!

Financial Management © 233
Certificate

Financial Management © 234
Glossary
Accounts receivable (A/R)—Accounts receivables (A/R) are accounts with customers that the business has sold goods or services to on credit terms.
Accounts Receivable Turnover Formula——total net credit sales/average accounts receivable
Acid test ratio formula—quick assets/current liabilities
Amortization—the process of gradually paying off a liability over time. For example, a mortgage is amortized by periodically paying off part of the face value amount of the mortgage.
Angel investors—The term angel investor is usually used in reference to an investor who is a family member or friend who will not be involved in the operation of the business. An Angel Investor also may be lending money with little security other than their trust in the ability of the debtor to repay the funds.
Assets—items of value owned by people or a business. The valuable resources or properties and property rights owned by an individual or business enterprise
Average account collection period formula—days in the period x, average accounts receivable/total net credit sales
Average days payable formula——days in the period x accounts payable/total credit purchases
Balance sheet—an itemized statement that lists the total assets and the total liabilities of a business to portray its net worth at a particular point in time
Booking order—is a term that means an order taken well in advance of the shipping date
Booking orders—are orders that are place with suppliers for future deliver. Usually the delivery date is several months in the future. Some supplier will offer booking order programs at substantial discounts off regular prices, or special payment terms, to maintain production levels during slow periods of their Fiscal Year.
Break-even point (BEP)—the sales quantity where the firm's total costs will just equal its total revenue

Financial Management © 235
Break-even point (BEP) analysis—It is a method used to determine the point at which business will neither make a profit nor incur a loss. In other words, profits derived from revenue will equal the fixed and variable costs of the business.
Break-even point (BEP) formulae—the basic formula is: S = FC + VC In this formula S = sales and FC + VC = fixed costs + variable costs.
Business plan—describes the business and identifies the core business' activities. It presents the goals, the expected outcomes and the plan of action the business will execute in achievement of the goals
Business style—describes the sum total of how the business functions and how it presents itself to the market
Capital assets—Physical property such as land, buildings, machinery, and almost all property owned by the business other than goods that are purchased for sale.
In virtually all cases, a capital asset is an asset whose resources are used over time and whose value is depreciated over the life of the asset until it reaches a valuation of zero. The only exception to this rule is land, as land may not be depreciated.
Capital equipment list—is a listing of the physical assets of the company
Capital equipment—Capital equipment is that equipment that you use to manufacture a product, provide a service, or use to sell, store and deliver merchandise. It is not equipment which will be sold in the normal course of business, but rather, it is equipment which will be used, wear out or be consumed by the business over a period of time in excess of one year.
Cash flow statement—The cash flow statement is designed to show how well the company is managing its cash. In other words, how liquid is the company at that point in time. It does this by subtracting cash disbursements for the period in question from the cash receipts. Is also called the pro-forma cash flow statement
Cash flow—the actual movement of cash within a business
Commercial credit application—is used for a company that is applying to purchase on credit

Financial Management © 236
Corporation—is a business organization chartered by the province, owned by one or more stockholders, and authorized to act as a private individual. It is an artificial legal entity created by government grant and endowed with certain powers.
Cost of goods sold (CGS)—is an item that appears on the Operating Statement, sometimes called either the Income Statement or the Profit and Loss Statement. Adding inventory purchases during the accounting period to the beginning inventory, then subtracting the ending inventory for the period derives the CGS.
Credit policy—is a statement of the terms and conditions under which a company will allow customers to buy on credit
Current liabilities—the accounts payable, notes payable, bank loans, accrued expenses such as wages and salaries, taxes payable, current portions due of long-term debt and any other obligations that are coming due within the year
Current ratio formula—current assets/current liabilities
Days of sales in inventory formula—days in the period x average inventory/cost of goods sold (CGS)
Debt financing—is financing for defined period of time at a specified rate of interest. Debt financing does not affect ownership of the business but it may influence business decisions.
Debt to asset ratio formula—current liabilities + long term liabilities/(current assets + fixed assets)
Debt to equity ratio formula——current liabilities + long term liabilities/shareholders equity
Depreciable assets—are assets that, for accounting purposes, may be 'written down' or reduced in value on the books over their useful life.
Depreciation—depreciation is a bookkeeping charge the purpose of which is to write off the original cost of the asset (less any salvage value), over time, by equitably pro-rating the depreciation charges over the expected useful life of the asset.

Financial Management © 237
Deviation analysis—The deviation analysis is a financial report, which may be prepared by your accountant. It presents in detail significant variances that may have occurred in the accounts of the business from one reporting period to another.
Earnings per share formula—net income – preferred dividends/number of common shares
Equity financing—is financing obtained from investors who for the period of their investment will have a degree of ownership (equity) in the business
Equity—the monetary value of a property or business, which exceeds any claims and/or liens against it by others
Fixed costs—fixed costs are those costs not associated with, or the result of, the acquisition and sale of business offerings
Formula for calculating the CGS ratio—cost of goods sold (CGS) for the period/average inventory
Gross margin (GM)—the money left to cover the expenses of selling the offerings and operating the business. GM is also known as the gross profit.
Gross profit margin—the difference between revenue and the cost of goods or services sold
Gross sales—the total amount charged to all customers/clients during a time period
Grossed upward—is a term used to describe the practice of increasing the result of a calculation to a predetermined level. For example, a store may wish to have their entire prices end in .77 so prices of various items might be $10.77, $24.77, etc. If after calculating the normal gross margin the selling price were $24.49, the price would be grossed upward to the nearest 77 cents by assigning a price of $22.77.
Illiquid—A business is illiquid if it is unable to cover its expenses on a consistent basis

Financial Management © 238
Income statement (also called the profit & loss statement or the operating statement)—statement of the changes that have occurred from one financial measurement period (fiscal measurement period as in a fiscal year) to another
The income statement provides a summary of the transactions made and the income generated from those transactions. It also summarizes the changes in Inventory value and the expenditures made by the business for that fiscal period. Finally, the income statement presents the profit or loss made by the business for the fiscal period.
Income statement analysis—
Inventory movement report—illustrates the quantities of Inventory of an item or a product group that have sold (moved) during a period or periods of time during the fiscal year.
Inventory shrinkage—is a term for shortages or losses of inventory due to spoilage of perishable goods, but it can be an allowance made for losses due to stealing by customers—an allowance for shoplifting
Inventory to net working capital formula—average inventory/ (current assets + average inventory – current liabilities)
Inventory turnover—the rate at which the initial or beginning inventory investment is sold. If the beginning inventory investment is replaced three times during the fiscal year, the inventory turnover is said to be three or sometimes expressed as three turns per year.
Inventory turnover formula—cost of goods sold (CGS)/average inventory
Joint payment agreement—is an agreement made with an end user of products or services to insure that any payment that is made is made to all parties that have indirectly or directly supplied goods or services. A joint payment agreement states that the signer of the agreement will only issue cheques jointly to your company and your customer in payment for the work performed by your customer.
Liability—is money owed to individuals or companies

Financial Management © 239
Line of credit—is a financing method whereby a lender, usually a bank, will allow the person or business to overextend their account by an agreed amount. In other words if a person or business had a $50,000 line of credit on their bank account they would be allowed to exceed the balance of their account by up to $50,000. There would be an interest charge for the amount that the account was in a negative position.
Liquidity—describes how readily a business could convert assets to cash
Market segments—A relative homogeneous group of customers who will respond to marketing mix in a similar way
Marketing mix—The controllable variables the business puts together to satisfy this target group. It has four components: product, place, price, and promotion.
Market—Is a place where buyers and sellers come together. The number of people and their total spending—actual or potential—for your offering(s), within the geographic limits of your distribution capability
Net worth—the difference between the assets and liabilities of a business or individual. It may also be referred to as the owner's equity in a given business as it represents the excess of the total assets over the total amounts owing to outside creditors (total liabilities) at a given moment in time.
Number of times interest earned formula—net profit before interest and taxes/annual interest and bank charges
Offerings—the products and services that a business provides its clients' customers
Overage inventory report—is a report that shows the quantities and the value of designated inventory items of a product group that has been in inventory for a period of time beyond the assigned maximum time in inventory
Partnership—a business owned by two or more individuals. It is a legal relationship created by the voluntary association of two or more persons to carry on as co-owners of a corporation for profit. It is a type of business organization in which two or more persons agree on the amount of their contributions, both capital and effort and, on the distribution of profits, if any, of the organization.

Financial Management © 240
Personal credit application—is typically used for individuals applying for credit rather than a company applying for credit
Point of sale (POP)—to describe anything that occurs at the point where goods are displayed or a transaction is made.
Product mix—the particular assortment of product lines and individual product items chosen as the offerings of the company
Profit—A business' earnings after paying all expenses. The excess of the selling price over all costs and expenses incurred making the sale.
Profit formulae—P = S - (FC + VC)
Pro-forma cash flow statement—is sometimes called a cash flow projection or simply a cash flow statement. We will use the term pro-forma cash flow statement here
Pro-forma—is a term meaning a projection or estimate of what may result in the future from actions in the present. A pro-forma financial statement is one that shows how the actual operations of the business will turn out if certain assumptions are realized.
PY—abbreviation meaning Prior Year
Return on investment (ROI)—is how much profit is generated by the business in relation to the investment in the business. (See Profitability Ratios)
Return on sales ratio formula——net profit after taxes/net sales
Return on shareholders equity formula—net income/shareholders equity
Return on total assets formula—net income (from operations)/average total assets
Sales per employee formula—net sales (for the year)/average number of employees
Sales to fixed assets formula—net sales/average net fixed assets
Sales—is the revenue received for the offerings sold
Secured loan—a loan for which a balancing amount of cash, property or other assets are offered as security in the event the loan is defaulted on

Financial Management © 241
Sole proprietorship or proprietorship—is a business owned by one person. Legally, the owner is the business and personal assets are typically exposed to the liabilities of the business.
Statement of earned surplus—a statement that shows the amount of money derived from operations to date that is retained in the company after taxes and dividends are paid out.
Term loan—a loan advanced by the lender for a defined period of time after which the loan must be repaid in full
Total costs—is the sum of the total fixed and total variable costs
Total fixed costs formulae—estimated total fixed costs—(Salaries + Benefits)/total hours
Total fixed costs—is the sum of those costs that are fixed, no matter how much is produced. These expenses that remain constant no matter what the sales or fees from services are.
Trade credit—is the amount of purchases on account with suppliers
Unsecured loan—a loan for which no collateral is offered as security in the event that the loan is in default
URL—is an abbreviation for uniform resource locator. The term refers to the address of a World Wide Web information page.
Utilization of assets formula—total net sales/total assets
Variable costs—Variable costs are business costs related to the acquisition and resale of offerings or the production of goods and services
Working capital ratio—a measurement of the ability of the business to cover its expenses. It is calculated by subtracting current liabilities from current assets
YTD—abbreviation meaning Year To Date

Financial Management © 242
Acknowledgement All of the Universal Laws quoted at the end of each module come from
Brian Tracy (1992). The Universal Laws of Success and Achievement. Chicago: Nightingale-Conant Corporation.
They are from the supplement to the eight-audiocassette program