financial market development and integration:a look at · pdf filefinancial market development...
TRANSCRIPT

POST-GRADUATE STUDENT RESEARCH PROJECT
Financial Market Development and Integration:
A look at the Indian story
Prepared by
Sumit Kaur
Student of PGDM Program (Finance) 2012–2014
S. P. Jain Institute of Management and Research, Mumbai
Supervised by
Dr. R. K. Pattnaik
Professor
S. P. Jain Institute of Management and Research, Mumbai
March 2014
2
Financial Market Development and Integration: A look at the
Indian story
Prepared by Sumit Kaur*
Abstract
In India, there has been a conscious effort by the RBI and the Government of India to develop
and integrate various financial market segments in a phased manner. In this paper, the authors
analyse the macro-economic dependence, current liquidity, volatility, efficiency, and integration
level of four key financial market segments—money, government securities, forex and equity.
The effectiveness of monetary policy transmission at the current level of financial market
integration is discussed in the wake of the USD/INR depreciation episode in 2013. The
regression analysis suggests behavioural dependence of the macroeconomic variables on
financial indicators of government securities and forex market. The liquidity analysis indicates
that money, government securities, and forex market are highly liquid. Money and government
securities market are found to be less volatile, albeit highly susceptible to shocks. On the other
hand, the strong influence of exogenous factors on forex and equity markets has made them
highly volatile. Gradual financial reforms have enhanced the market efficiency of the country‘s
forex market. Temporal cross-correlation studies highlight an evolutionary pattern in financial
market integration—correlation between different market segments has increased over time.
Such inter-market and macro-economic behavioral relationship analyses have become important
in today‘s fragile macroeconomic scenario characterized by weak domestic performance and
uncertainty in foreign investor sentiment.
* Sumit Kaur is a PGDM (Finance) student from S.P. Jain Institute of Management & Research. The author would
like to express gratitude to Dr. R.K. Pattnaik, Professor at S.P. Jain Institute of Management & Research for his
valuable comments and support with this paper. The views expressed in the paper are those of the author and do not
necessarily reflect the opinion of the National Stock Exchange of India Ltd. The author can be contacted at

3
Financial Market Development and Integration: A look at the
Indian story
1. Introduction
May you live in interesting times.
–Ancient Chinese proverb
Post the 2008 financial crisis, the Chinese proverb quoted in the epigraph received much
attention because the only thing that is interesting is ―uncertainty‖. The definition of uncertainty
has evolved and become more complicated over the years due to development and increasing
integration among various financial market segments, domestically and internationally—a result
of globalisation and economic liberalisation.
The development of an economy is largely influenced by financial markets—they competitively
allocate financial resources that are mobilised from savers and investors among users in the
economy. India‘s central bank, the Reserve Bank of India (RBI), has proactively shaped the
development of financial markets in India through its series of economic policy reforms—
market-determined interest and exchange rates, current account convertibility, monetary policy
dealing with price-based instruments, auction-based allocation in the government securities
market (GSM), and phased capital account. Such a closely monitored development of the
financial market is essential in an emerging and developing economy such as India to avoid
financial instability, which is likely to occur otherwise (Gopinath, 2008).
1.1 Objectives
Though the Indian financial markets were not significantly impacted during the 2008 global
economic crisis, its aftermath increased the academic and policy interest in the operational
efficiency of our financial system, of which financial markets are important components.
Developments on the macro-economic front of an economy significantly impact its financial
system, and hence, it is imperative to assess the depth of this relationship for a complete
understanding of the financial system. The present study has been conducted to fulfil the
following objectives:
a) Assess the behavioural relationship between the macro-economic environment and the
instruments of financial markets.

4
b) Analyse the liquidity, efficiency, and volatility of the four key financial markets—money,
GSM, forex, and equity.
c) Evaluate the level of integration among these financial market segments over a decade
(2003–2013).
1.2 Organisation of the Paper
The rest of this paper has been organised into the following sections.
a) Literature Review
i. Conceptual framework: The various stages and the steps involved for the development
of financial markets of a country are broadly outlined in this section.
ii. Behavioural relationship between macro-economic and financial environment: This
section discusses how developments on the macro-economic front in India impact its
financial markets, depicted through changes in key macro-economic and financial
variables during 2003–2013.
iii. Stylised facts on financial markets developments: This section outlines the phased
development (since 1990) and the current defining statistics of the four financial
markets that are the focus of this study.
iv. Financial market integration in an economy: This section discusses the importance,
the associated benefits and risks, and the measures for the integration of financial
markets.
b) Research Methodology: This section outlines the research methodology employed in this
study.
c) Empirical Analysis
i. Behavioural relationship between macro-economic and financial environment: The
relationship between macro-economic fundamentals and financial market variables is
evaluated in this section.
ii. Liquidity, volatility, and efficiency of four financial markets: The depth, stability, and
efficiency of the financial markets that are the focus of this study are assessed using
corresponding indicators and statistical variables.

5
iii. Cross-correlation analysis to evaluate level of market integration: The co-movement
of various indicators is analysed to understand the level of integration and impulse
transmission from one financial market to another. This assessment is done for a
decade (2003–2013) and on a temporal basis (pre-crisis, crisis, and post-crisis). The
analysis also includes a comparative assessment of cross-correlation studies
conducted at different timeframes to understand the evolution of market integration.
d) Way Forward
i. Summing up: This section reinforces the need for the integration of financial markets
and includes a brief discussion on its current level.
ii. Recommendations: This section presents the author‘s views for the further
development of financial markets in India.
2. Literature Review
2.1 Conceptual Framework
The development of a country‘s financial markets is one of the key priorities for the think tanks
of the country‘s central bank. The development of financial markets can be broadly classified
into three stages (Rangarajan, 1997):
Bank-oriented stage: Banks and other financial institutions play the most significant role
in financial capital formation.
Early capital stage: Issues of equity and debentures take over banks in capital formation.
Highly capital-oriented stage: The capital market becomes the key source for long-term
financing.
In tandem with the changing internal and external environments, the Indian financial markets
have undergone significant transformations over the course of time (discussed in brief later on).
Depending on the inherent nature of an economy, one of the three segments of the debt market—
the government securities market (GSM), the Public Sector Undertaking (PSU) bonds market, or
the corporate debt market—would be predominantly more active than the other segments in the
country. For instance, the corporate debt market would be the most predominant segment in
those economies whose government did not run fiscal deficits or who are not allowed to issue
6
bonds in the domestic market. However, since both these factors are absent in the case of India,
GSM garners the lion‘s share in the country‘s debt market (Reddy, 2007). GSM‘s dominance in
the domestic debt market can also be attributed to the RBI‘s conscious role in its development
through a series of steps that can be categorised as follows:
Instrument development
Institutional development
Strengthening of market transparency and efficiency
2.1.1 Motivation for development of domestic financial market segments
In response to the 1997 Asian crisis, the development of the domestic bond market became
significant not only for fund channelization but also for the diversification of the external sector
risk in the financial system (Reddy, 2002). In general, governments are motivated by different
factors for developing the domestic bond market. For instance, the Singaporean government
viewed it as a means of financial intermediation for credit allocation, while the Hungarian
government was motivated to reduce monetisation of the government deficit and increase
competitiveness in the banking sector (that possessed wide spreads between deposits and
advances) to encourage foreign investment. Whatever be the motivation factor, the macro-
economic fundamentals of an economy do impact the performance of its domestic financial
markets to a certain extent.
International financial market integration refers to an increase in capital flows and a tendency for
prices and returns on internationally-traded financial assets to equalise on a common-country
basis. The validity of various international parity conditions—purchasing power parity (PPP),
covered interest parity (CIP), uncovered interest parity (UIP), and real interest parity (RIP)—
provides a direct test to analyse the degree of international market integration. On the other hand,
indirect tests include the measurement of the degree of correlation between national savings and
investments (Jain and Bhanumurthy, 2005). This paper, however, deals only with the analysis of
the integration levels of domestic financial markets.

7
2.2 Behavioural Relationship between Macro-Economic and Financial
Environment
Post the 1991 balance of payments crisis, the Indian economy really opened up to the outside
world. The end of the License Raj, the liberalisation of the economy in terms of bold economic
reforms, and globalisation for true economic developments were the key changes of this era.
India reaped the benefits of these reforms in the truest sense during the 2003–2008 global bull-
run. The Indian economy was growing at a stupendous rate of 8.7% on average (Table 1),
wholesale price index (WPI) and consumer price index (CPI) inflation were at normal levels, the
government had negative primary deficit, the current account deficit was just 0.3% of the gross
domestic product (GDP), foreign inflows—foreign direct investments (FDIs), foreign
institutional investments (FIIs), and non-resident Indian (NRI) deposits—were high, the import
cover was at 14 months, and there was a net increase in the foreign exchange reserves of the
economy. Truly, it was the golden period of the Indian economy (refer Table 1).
The 2008 financial crisis, whose epicentre was the U.S., had repercussions on the entire world.
India‘s initial reaction to the global meltdown was that since it was a closely-monitored and
decently regulated economy, it should remain insulated from the crisis, unlike many other
countries of the world. However, this was only the partial truth. By this time, the Indian economy
had integrated well enough with the global economy to feel the effects of this slowdown. The
export sector of the Indian economy was significantly impacted because both the key markets for
exports—the U.S. and Europe—were reeling under the effects of the crisis. Slowly and steadily,
the Indian economy also started feeling the impact of the crisis. The GDP growth rate dropped to
6.7%, WPI and CPI levels were high, reserve money fell to 6.4%, the CAD/GDP and
government deficits increased, and there was a decline in the net capital inflows, which
ultimately resulted in a fall in the foreign reserves.
The true impact of these developments was felt when the financial indicators in the domestic
economy started showing signs of distress. Short-term borrowing rates shot up, the turnover of
the GSM dropped, and the overall liquidity of the system was impacted. In order to address these
developments, the Indian authorities made adjustments in the policy rate (the repo rate decreased
from 6.8% to 5.0%) to increase, or rather to sustain the money supply in the system.
Circumstances improved over the next couple of years, only to deteriorate once again in 2012–

8
2013. This time, though, the crisis was more due to domestic reasons. However, the impact of
the fragile global economy cannot be neglected. What remained constant during both these
difficult times was that distress in the macro-economic indicators was quickly translated to
distress in the financial indicators. Thus, it would not be incorrect to comment that there is
moderate correlation/co-movement between the macro-economic indicators and the financial
indicators of the Indian economy. This study includes an empirical analysis to test this
hypothesis.
2.3 Financial Market Development since 1990 Reforms
2.3.1 Money market
The money market—the market for short-term funds—has securities with maturities ranging
from overnight to one year; therefore, its financial instruments are considered the closest
substitute for money. In order to achieve the ultimate goals of monetary policy—growth and
price stability—the RBI had to modify its operational and intermediate objectives multiple times,
primarily in response to the prevailing economic and financial environment (Mohanty, 2012).
The money market comprises various segments—call money, market repo, and Collateralised
Borrowing and Lending Obligation (CBLO)—with average daily turnover as depicted in Figure
1.
The call money market—an uncollateralised market—was earlier characterised by an
administered ceiling interest rate that was determined by the Indian Banks‘ Association (IBA) to
prevent abnormal increases in the call rates (which was seen earlier when call money rates rose
sharply and touched 25–30% during the early 1970s). However, regular borrowings by banks
and lending by non-banking institutions kept this market highly volatile, hindering appropriate
risk management and instrument pricing (Mohan, 2007). With the introduction of the CBLO, the
interference in the call money market was reduced, leading to a fairly stable market. This is
evident from the reduction in the call money market‘s market share (%) over the years (Figure
1).
The key developments of the late 1980s—the setting up of the Discount and Finance House of
India (DHFI), the introduction of certificates of deposit (CDs), commercial papers (CPs), and
inter-bank participation certificates, and the freeing of the call money rate—were unable to meet
9
their objectives of market development due to the structural rigidities in the system.
Subsequently, the Internal Working Group (1997) and the Narasimham Committee (1998) made
the following recommendations (Mohanty, 2012):
Introduction of auction system for T-bills
Gradual move towards a loan-based system from a cash credit system
Abolishment of ad-hoc T-bills, leading to the end of the automatic monetisation of fiscal
deficit (1997)
Developed and introduced by the Clearing Corporation of India Limited (CCIL) in January 2003,
the CBLO was meant to help banks and non-banks manage their daily liquidity requirements.
Being a collateralised instrument (government securities acted as collateral), its rate were lower
than the call money rate, which was why its share in the money market transactions rose
considerably from 22.4% in 2004–2005 to 53.2% in 2012–2013. In April 2004, the liquidity
adjustment facility (LAF) window was augmented by the issuances of the Market Stabilisation
Scheme (MSS) to insulate domestic monetary conditions from the impact of large capital flows
(Gopinath, 2008).
Market repo—which is backed by collaterals (such as Central and State government securities)
and operates outside the RBI‘s LAF—allows banks, primary dealers, non-banking entities
maintaining Subsidiary General Ledger (SGL) accounts, non-bank financial companies
(NBFCs), mutual funds, housing finance companies, and insurance firms to manage their short-
term liquidity mismatches.
The money market in India has had a long and chequered history. While the call money market
has emerged as a pure inter-bank market, the CBLO market has been helpful to both banks as
well as non-bank participants. The LAF has had a smoothening effect on liquidity and has
created a corridor of weighted average call between repo and reverse-repo (Figure 2). Slowly, the
weighted average call emerged as the target rate. The RBI recognised and made the repo rate
the short-term signalling rate or policy rate. Thus, the integration of various money market
segments and effective policy signal transmission has been possible due to the stability of the
call money rates.
Research studies on the integration of Indian money markets with global markets as a result of
financial liberalisation have mostly reported negative results. This indicates the presence of a
10
country risk premium, and/or binding regulations on capital movements, and/or binding
restrictions on interbank borrowing and lending (Buigut, 2011). Empirical investigations and the
Vector Error Correction Model (VECM) have hinted at some degree of co-integration between
Indian and U.S. interest rates—linkages that are less direct than the covered interest rate
arbitrage (Buigut, 2011). The Indian money markets have evolved up to this stage gradually. An
earlier study using CDs as the domestic borrowing rate and the USD LIBOR as the foreign
interest rate concluded that the covered interest parity (CIP) deviations for India were much
higher than those reported for the markets belonging to the Organisation for Economic Co-
operation and Development (OECD) (Varma, 1997).
2.3.2 Government securities market
Due to the automatic monetisation of the Central government budget deficits, the interest rates
on government securities were administratively kept low (to ensure low-cost government
borrowings). Consequently, the GSM remained underdeveloped. Earlier, financial intermediaries
such as banks and insurance companies (the Life Insurance Corporation of India, for instance)
acted as key players in the GSM, thereby making it a captive market. 1992 and 1997 were two
key years in the Indian GSM. 1992 saw the introduction of the auction-based system for
allocation of government securities to enable the creation of a market-determined yield curve
(through price discovery). The abolition of automatic monetisation through ad hoc treasury bills
and the introduction of the Ways and Means Advances (WMA) in 1997 provided operational
autonomy. Subsequently, in 2006, the RBI was prohibited from participating in the government
securities primary market (FRBM Act 2003). Accordingly, since 1 April, 2006, there has been
neither private placement of auctioned market borrowings nor devolvement.
The decline in SLR requirements—38.5% of net demand and time liabilities (NDTL) in 1992 to
25% of NDTL in 1997—also helped in shaping the GSM. Currently, the statutory liquidity ratio
(SLR) stands at 23% of the NDTL for banks. Reforms for the successful completion of
government securities (G-Sec) auction and the RBI‘s open market operations through the
introduction of primary dealers have helped in the market borrowing programmes of the Central
and state governments. The secondary GSM was developed and shaped with the introduction of
long-term securities, such as those with 30-year maturity period (Mohan, 2004).The investor
base in the GSM has widened from the mandated investment requirements to voluntary G-Sec
11
holdings. This has, in turn, helped in reducing the commercial banks‘ share in the GSM (Mohan,
2007). Effective December 2007, the Government Securities Act, 2006 facilitated lien marking,
pledging of securities to raise loans against government securities, stripping, etc. Other measures
included the introduction of ‗when-issued‘ trading and ‗short selling‘ of government securities
(Gopinath, 2008).
Currently, however, the GSM is quite illiquid at the long end. Two prime reasons for this could
be the presence of dominant investors in the form of institutional investors (who need to invest in
government securities due to statutory reasons) and the limited presence of FIIs in dated
securities (despite the progressive shift from banks to non-banks as the investor base). However,
it should be remembered that earlier highlighted measures did help in evolving and maturing
GSM. This can be ascertained from the fact that, with passage of time, there has been smooth
financing of the government debt (both Central and State government) despite high and
increasing fiscal deficits (Mohan, July 2007). Consequently, there has been greater recourse
mandate by the Twelfth Finance Commission to conduct market borrowing for the state
government (refer Appendix 5 for GSM statistics).
2.3.3 Forex market
Although it originated around 1978, the Indian forex market was quite limited in its early days
due to the fixed exchange rate regime. Post the 1991 economic reforms, the Indian forex market
evolved and developed as the result of a series of developmental reforms. The key reforms were
the introduction of the market-based exchange rate regime in 1993 and the adoption of current
account convertibility in 1994.
Additionally, capital account has also experienced substantial liberalisation over the years.
Coherently, all these reforms were aimed at developing the institutional framework by
dismantling controls and increasing instrument effectiveness and transparency for conducting
foreign exchange business. The spot market within the over-the-counter (OTC) segment of the
forex market was most active, as shown in Appendix 6.
Over the course of time, the forex market witnessed increased liquidity and greater market
efficiency (reflected in the low USD/INR bid-ask spread in Appendix 7). Owing to the gradual
opening of the capital account, forward premiums are typically aligned with the interest rate

12
differential, leading to manifold increases in market efficiency (Gopinath, 2008). However, the
high intermediation costs currently charged by the banks reduce the transparency for players in
the forex market. Under its recommendations, the RBI hinted at the usage of an instructive guide
for the further opening of the capital account—a mixture of strategic controls (for instance, by
defining a pecking order of flows, such as FDI-portfolio investment-debt, and a credible
framework to aid foreign investors in developing their strategies) and tactical controls (for
instance, steps that would be situation specific and hence would be introduced as and when
situation arose and would be withdrawn when it abated) (Padmanabhan, 2011).
One of the key challenges currently impacting the efficiency of the Indian forex market is the
speculation being done on the non-deliverable forward (NDF) markets. Ideally, both the on-shore
and off-shore NDF markets are influenced by the same set of economic and geo-political
developments at home and abroad (Padmanabhan, 2011). However, in the recent past (due to the
INR depreciation in 2013), it was observed that the two rates were responding differently—the
NDF rate was more pessimistic, which consequently increased pressure on the on-shore
USD/INR rate as well. As the Indian authorities look forward to the progress of capital account
liberalisation, this challenge needs to be addressed carefully, without impacting the liquidity of
the forex market. The impact of this volatility needs to be analysed in terms of two sets of market
participants—the real sector (exporters, importers, and foreign currency borrowers) and banks or
authorised dealers. For the first set of participants, non-hedging techniques (such as advance
payment and invoicing in home currency) were available only theoretically. Hence, derivative
products (such as exchange-traded futures and options) were introduced to enable small and
medium enterprises (SMEs) to cover foreign currency exposure at competitive costs. Thus, forex
inclusion of SMEs and the synchronisation of the regulations for the OTC and exchange-traded
markets are the two key challenges that the Indian forex market—a critical segment of the
country‘s finance—currently faces, owing to capital account restrictions (Padmanabhan, 2012).
2.3.4 Equity market
With the establishment of the Securities and Exchange Board of India (SEBI) in 1992, reforms to
enhance regulatory effectiveness and competitiveness as well as modern technological
infrastructure to reduce informational asymmetries and transaction costs were undertaken.
Foreign equity investments in the form of FIIs were allowed from 1992 onwards and Indian

13
companies were allowed to raise foreign capital in the form of American depositary receipts
(ADRs), global depository receipts (GDRs), foreign currency convertible bonds (FCCBs),
external commercial borrowings (ECBs), and investments through NRIs and overseas corporate
bodies (OCBs). The establishment of the National Stock Exchange (NSE) in 1994 further
increased the competitiveness and led to the development of volumes in the equity market in
India. During 2000–2001, index futures, index options, and options and futures on individual
securities were introduced to shape the Indian capital market. Currently, the Indian capital
market is one of the most active and growing capital markets in the world. Futures and options of
about 223 individual stocks and 4 stock indices were traded on the NSE as of March 2011. Large
cap stocks/futures and index futures of Indian equity are fairly liquid and efficient.
2.3.5 Deep and diverse Indian equity market
With more than 5,000 listed companies, the Indian equity market is globally ranked second, with
the U.S. equity market being the top runner. The diverse nature of stocks allows investors to gain
exposure to a wide range of sectors such as automotive, banking, and pharmaceuticals, to name a
few. The S&P CNX Nifty (Nifty 50), one of the most widely quoted indices, comprises stocks
covering the entire spectrum—financial, industrial, and energy companies—thereby offering
investors exposure to the key drivers of domestic growth, i.e., domestic consumption and
infrastructure capital expenditure (capex). One of the peculiarities of the Indian equity market
that reduces its depth is that more than 55% of the equity market is held by promoters (principals
of companies), thereby reducing the overall free float of the stock. In order to address this
peculiarity, the SEBI mandated all listed companies to raise public shareholdings to 25% by mid-
2013. Another peculiarity is the higher proportion of FII holdings than domestic holdings, which
renders stock prices quite volatile and vulnerable to global developments (Hubbis, 2013).
2.4 Integration of Financial Markets in an Economy
The development of financial markets occurs in its true sense only if they are well-integrated, for
it is only then that the monetary policy impulses are effectively transmitted to the entire economy
(Mohan, 2007). In an integrated financial market system, the central bank‘s short-term policy
rate changes would be transmitted to the market rates (short-term as well as long-term), money
market, bond market, and credit market. Technically, financial market integration means the
14
unification of the markets for the convergence of risk-adjusted returns on assets with similar
maturity across all the markets. Factors such as deregulation (freeing pricing of financial assets),
globalisation (transnational movement of capital, especially the savings of one nation to
supplement the domestic savings of another nation), IT advances (electronic payment and
communication systems that decrease arbitrage opportunities across financial centres), and
changes in the operating framework of a monetary policy (shift to price-based instruments such
as short-term policy interest rate, impacting the interest rate term structure) have significantly
influenced the integration of the various market segments in India. Financial market integration
is witnessing a new wave of confidence in recent years; besides individual nations, some
economic regions (such as the Arab countries) are also actively discussing the possibility of
having integrated financial markets (Atyeh, 2012).
2.4.1 Associated benefits and risks
Multiple factors reinforce the integration of financial markets. Integration not only allows the
government machinery to transmit key price signals, but also promotes domestic savings and
investments. In turn, these create opportunities for the financial sector of a nation to emerge as a
financial centre at the regional or the international level. Integrated financial markets enhance
equal access to financial services (for the public as well as for companies, and institutions) by
innovative and cost-effective intermediation, informational efficiency, and market discipline.
Global financial integration is beneficial for international risk-sharing, consumption smoothing,
and enhancement of the depth and breadth of domestic financial markets. This competitive
environment discourages the exorbitant profits that are associated with monopolistic/cartelised
markets by decreasing costs and increasing market efficiencies. International studies such as
(Ayuso and Blanco, 1999) confirm that a higher degree of financial market integration leads to
higher efficiency of financial markets and thereby leads to higher availability of better risk-return
combinations to investors. A number of prior studies (such as Kaminsky and Schmukler, 2002)
were conducted to evaluate and understand the level of integration of international financial
markets in various economies of the world.
However, on the flip side, integrated financial markets pose grave risks, which could lead to
catastrophic developments if they are not analysed prudently. Highly integrated domestic and
international financial markets run the risk of contagion due to informational asymmetry from

15
one market to the other markets, with the possibility of systemic instability (Mohan, 2007). Such
volatility risks and surprising reversals in capital flows in the context of highly open capital
accounts are likely to occur at significant costs (Jain and Bhanumurthy, 2005). Macroeconomic
stability could also be jeopardised due to the pro-cyclical nature of short-term capital flows, with
high chances of abrupt reversals. Capital flow volatility leads to exchange rate instability (similar
to the recent episode of INR depreciation in July 2013), fluctuations in official reserves, or in
extreme situations, currency crises (such as the East Asian crisis). High capital inflows can result
in inflationary pressures, rapid monetary expansion, widening of the current account deficit, and
real exchange rate appreciation. Hence, a phased progressive integration of financial markets is
required for the economic stability of a country (Mohan, July 2007). In light of the global
financial crisis of 2008, great emphasis is being laid on two elements of macro-prudential
regulation (Gopinath, 2010):
The existence of common/correlated exposures, arising either because institutions are
exposed to the same/similar asset classes or because of indirect exposures associated with
linkages among them (counter-party relationships, for instance).
Collective homogeneous actions on the part of institutions, leading to risk
amplification owing to interconnectedness (the pro-cyclicality element). Key channels of
risk propagation include maturity mismatches and leverage.
Both these elements require an assessment of the market integration levels for appropriate
regulatory steps to be devised.
2.4.2 Measures for financial market integration
Financial market integration has been possible in India due to five key measures.
Free pricing: Some of the milestones that led to the development and integration of
financial markets in the country include the freedom given to banks to decide deposit and
credit interest rates; the withdrawal of the call money ceiling rate (10%); the substitution
of the administered interest rates with auction systems for G-Secs; the substitution of ad-
hoc T-bills with WMA; the shift from a single fixed exchange rate regime to a market-
determined floating exchange rate regime; the gradual liberalisation of capital account;
and the usage of derivatives for hedging.

16
Widening participation: The following changes helped in increasing the liquidity and
efficiency of financial markets in India: enhanced presence of foreign banks;
participation of FIIs in the Indian equity market; transformation of the call money market
into a pure inter-bank market; granting of permission to (a) authorised dealers to borrow,
lend, and invest in foreign currencies, (b) exporters to substitute rupee credit with foreign
currency credit, and (c) Indian companies to raise funds through ADRs, GDRs, FCCBs,
and ECBs—a step towards integrating domestic and international capital markets;
availability of options, forwards, and swaps in domestic and foreign currencies to manage
long-term exposures; application of capital adequacy norms; and integration of credit and
equity markets.
New instruments: The introduction of repo (for short-term liquidity adjustment) and
LAF (for liquidity management and overnight market signalling mechanism), inter-bank
participation certificates, CDs, CPs, market repos, CBLOs, and auction-based multiple
maturity T-bills enabled the development of the Indian money market. Floating rate
bonds (FRBs), long-term loans with embedded put-call options, and forward rate
agreements (FRAs) also facilitated the deepening of the financial markets by allowing
participants to diversify their risks.
Institutional measures: Inter-market linkages were strengthened by allowing institutions
such as the Discount and Finance House of India (DFHI) and the Securities Trading
Corporation of India (STCI) to participate in multiple markets. The establishment of the
CCIL as the central counter-party helped in increasing investor confidence, and thus, the
liquidity of the markets.
Technology, payment, and settlement infrastructure: Technological enhancements
such as the Delivery-versus-Payment system (DvP), the Negotiated Dealing System
(NDS), the advanced Negotiated Dealing System-Order Matching (NDS-OM), and the
Real Time Gross Settlement system (RTGS) as well as the substitution of the floor-based
open outcry trading system with the electronic trading system improved settlement
processes and encouraged market integration.

17
Financial market integration occurs either horizontally (inter-linkage of various domestic market
segments) or vertically (inter-linkage of domestic and regional/international markets). The level
of financial integration is primarily measured using the following parameters.
Institutional/regulatory measures: These measures can further be classified into de jure
and de facto measures. De jure measures include the legal restrictions on capital and
trade inflows. De facto measures include the measures based on prices or quantities.
Price-based measures include cross-market spreads, tests of common trends in interest
rate term structure and volatility, and correlations among several interest rates.
Quantity measures: For measuring the integration level of domestic markets, liquidity
and turnover data are used, whereas global integration levels are measured through time
analysis of capital inflows. Typically, gross capital inflows tend to be a better measure
than net inflows, as the latter measure is likely to subdue the level of integration due to
the amount of outflows. However, this indicator suffers from fluctuations in short-term
market conditions. ‗Gross stocks of foreign assets and liabilities/GDP‘ is a more robust
measure as it is less volatile and comparatively less prone to measurement errors.
Bhoi and Dhal (1998) evaluated the degree of integration of the Indian financial markets post
liberalisation. The study indicated that interest rates converged to a fair degree among the short-
term markets—money, credit, and gilt; however, the capital market‘s behaviour remained
isolated.
Currently, different financial markets are integrated at different levels and channels. The money
market and the foreign exchange market are intrinsically integrated due their short-term nature
and the presence of commercial banks. This linkage occurs in multiple ways—hedging facilities
for corporates, bank borrowings in overseas markets, passage for overseas merchant payment
transactions, and acceptance of foreign currency deposits. The GSM and the call money market
are linked as government securities are largely funded by short-term borrowings. The presence of
foreign institutional investors (FIIs) in the foreign exchange market and the equity market links
these two segments. The RBI‘s increasing use of short-term monetary measures to meet the
demand-supply gap (in order to curb volatility) has linked the money market, the GSM, and the
foreign exchange market. Two major studies (Mohan, 2007; Ray and Prabhu, 2013) studied this
cross-correlation behaviour to determine the level of market integration. In the light of the recent
18
financial market developments (INR depreciation against USD in 2013), it has become important
to re-evaluate the analysis of cross-correlation behaviour (which is a timeframe-based study) in
this paper.
3. Research Methodology
Indian financial markets can be broadly classified into organised and unorganised markets. Due
to the lack of reliable and high frequency data on unorganised markets, the empirical analysis of
this segment is not covered in this paper. Moreover, it is expected that the activities in such
markets are on a declining trend. Organised markets can be classified into short-term and long-
term markets; the notable segments of both these are highlighted below (Bhoi and Dhal, 1998):
a. Short-term markets: Money market, credit market, gilt market, and forex market
b. Long-term markets: Equity and term lending market, corporate debt market, pension
funds market, insurance market, housing finance market, mutual funds market, and hire
purchase and leasing finance market
Owing to issues of data availability, we considered the money market, the government securities
market, the forex market, and the equity market for purposes of analysing the integration levels
of the financial markets in the Indian context. The following financial instruments were used as
indicators for their respective financial markets:
a. Weighted average call money rate: Money market
b. 10-year GOI bond yield: Government securities market
c. USD/INR nominal exchange rate: Forex market
d. Nifty index level: Equity market
The quantitative analysis was based on quarterly/monthly data for the period 2003–2013, which
was obtained from the RBI databases and reports on currency and finance. These time series
were checked for stationarity using the Dickey Fuller (DF) test in Stata 12 (Appendix 8).
Financial time series are often non-stationary since means, variances, and co-variances change
over time; such time series are known as trends, cycles, random walks, or a combination of these.
Due to their non-stationary nature, such data cannot be predicted, modelled, or forecast. Hence, it
is important to check for stationarity in data, as the results obtained using non-stationary time
19
series could indicate a spurious relationship. In such situations, non-stationary data series are
transformed into stationary data series—time series that revert around a constant long-term mean
and have a constant variance independent of time. Whether it is auto-correlation analysis
(correlation assessment with itself) or cross-correlation analysis (correlation assessment with
another time series), a stationarity check is important because almost all methods for identifying
correlations assume the data series to be stationary and linear (Horvatic et al., 2011). For time
series that are non-stationary, other complex techniques such as the Johansen and Juselius
methodology and co-integration methods can be used to identify a long-run equilibrium/co-
integrating relationship (Jain and Bhanumurthy, 2005). We utilised the results from similar prior
studies to conduct a qualitative analysis on such series.
The majority of work on the integration of financial markets focuses on the operating efficiency
indicator as opposed to the allocative efficiency indicator of financial markets. For instance, in
the assessment of a money market‘s operating efficiency, the prime line of argument would be
whether the interest rates of the key money market instruments moved together with a reference
rate. One of the simplest empirical approaches to quantify operational efficiency is the simple
measure of correlation coefficient. This method, however, fails if the time series are non-
stationary (Bhoi and Dhal, 1998).
In addition to a decade-long correlation study, a temporal assessment of the cross-correlation of
the financial markets during the pre-crisis period (2004–2008), the crisis period (2009–2010),
and the post-crisis (2011–2013) period was conducted. We did not employ complex correlation
models such as Structural Vector Autoregression (SVAR) to analyse the microstructure and
monetary policy transmission of financial markets in the four financial market segments that are
the focus of study, namely, money market, government securities market, forex market, and
equity market (Ray and Prabhu, 2013). However, for the qualitative analysis, we utilised the
results obtained from these complex methods.
To assess the behavioural relationships among macro-economic indicators and financial
variables, multiple regressions were run with various plausible influencing variables. Quarterly
data points from 2004–2012 were used for regression. The performance variable of each of the
four financial markets (money, GSM, forex, and equity) was regressed with their ―possible‖

20
influencing independent variable to arrive at a regression equation that was statistically
significant.
The liquidity of a market was estimated from its annual turnover growth rate. If this annual
turnover growth rate was higher than the nation‘s nominal GDP growth rate, it was characterised
as a liquid market. The market‘s depth was analysed from its annual average daily turnover. The
volatility of a market was assessed by calculating the deviation of its data-points from the mean
of the series. For this, descriptive statistics—mean and standard deviation from the mean—of the
time series sample was calculated and data-point deviations were calculated in terms of standard
deviations. The efficiency level of a market was estimated from its bid-ask spreads.
Domestic market integration was estimated by evaluating the cross-correlation coefficient among
the following variables:
Money market: Weighted average call money rate and CBLO rate
GSM: 10-year government bond yield
Forex market: USD/INR spot exchange rate
Equity market: Nifty Index
4. Empirical Analysis
4.1 Behavioural Relationship: Instruments of financial markets and macro-
economic environment
Of the four financial markets, only the GSM and forex markets yielded statistically significant
regression equations (Appendix 9).
4.1.1 Government securities market
All the three independent and statistically-significant variables—Fiscal Deficit/GDP (FD/GDP),
Lagged Yield Value (of the 10-year GOI bond), and WPI Change—are stationary (Appendix 8).
The regression equation in Equation 1 shows that both the macro-economic variables (FD/GDP
and WPI Change) do impact the 10-year GOI yield. Interestingly however, the yield is also auto-
correlated, i.e., the lagged yield value has a strong influence on the subsequent yield value. The
signs of the macroeconomic variables in the regression equation confirm that a higher FD/GDP
or WPI directly increases the bond yields.
21
10-year GOI yield = 2.4264 + 0.0334 × (FD/GDP) + 0.6557 × Lagged Yield Value + 0.0759
× WPI Change (1)
4.1.2 Forex market
According to the regression equation in Equation 2, the USD/INR Nominal Exchange Rate is
autocorrelated (dependent on the lagged USD/INR Nominal Exchange Rate Value) and is
dependent on the CAD/GDP macroeconomic variable (which is stationary). Although the results
from this test relate with the theoretical underpinnings (CAD/GDP negatively impact exchange
rate), they are only indicative in nature as both the Nominal Exchange rate (dependent variable)
and the Lagged Nominal Exchange rate (an independent variable) are non-stationary in nature.
USD/INR Nominal Exchange Rate = 10.3127 + 0.7586 × Lagged Nominal Exchange Rate
Value - 0.3393 × (CAD/GDP) (2)
Regression analysis was conducted for all the four financial market segments. However, the
money and the equity markets did not produce any statistically significant results, reinforcing the
conclusions of earlier studies (Hubbis, 2013).
4.2 Liquidity, Volatility, and Efficiency Assessment
4.2.1 Liquidity
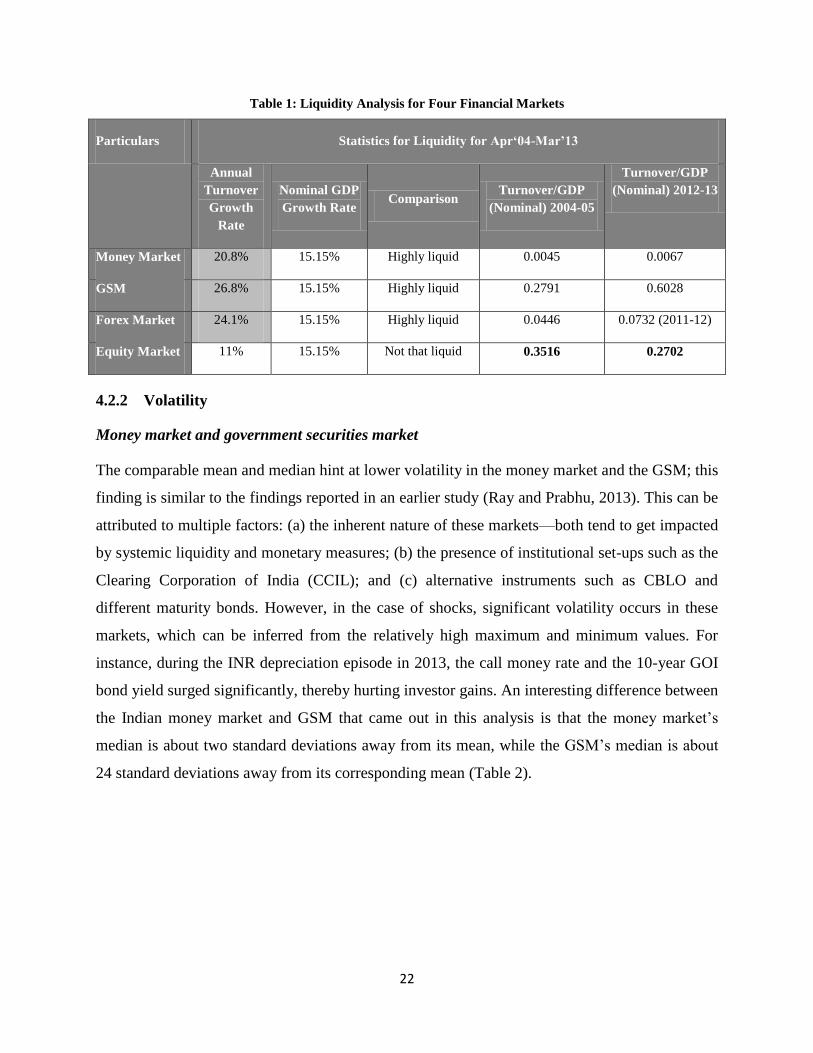
The empirical data in Table 1 suggests that the money market, the government securities market,
and the forex market in India are highly liquid in nature. Surprisingly, the equity market turned
out to have lesser liquidity despite the presence of domestic and foreign institutional and retail
investors. This observation is further reinforced by the comparative assessment of the
Turnover/GDP ratio (Table 1). Except for the equity market, the Turnover/GDP ratio increased
for the other three financial markets.
22
Table 1: Liquidity Analysis for Four Financial Markets
Particulars Statistics for Liquidity for Apr‘04-Mar’13
Annual
Turnover
Growth
Rate
Nominal GDP
Growth Rate Comparison
Turnover/GDP
(Nominal) 2004-05
Turnover/GDP
(Nominal) 2012-13
Money Market 20.8% 15.15% Highly liquid 0.0045 0.0067
GSM 26.8% 15.15% Highly liquid 0.2791 0.6028
Forex Market 24.1% 15.15% Highly liquid 0.0446 0.0732 (2011-12)
Equity Market 11% 15.15% Not that liquid 0.3516 0.2702
4.2.2 Volatility
Money market and government securities market
The comparable mean and median hint at lower volatility in the money market and the GSM; this
finding is similar to the findings reported in an earlier study (Ray and Prabhu, 2013). This can be
attributed to multiple factors: (a) the inherent nature of these markets—both tend to get impacted
by systemic liquidity and monetary measures; (b) the presence of institutional set-ups such as the
Clearing Corporation of India (CCIL); and (c) alternative instruments such as CBLO and
different maturity bonds. However, in the case of shocks, significant volatility occurs in these
markets, which can be inferred from the relatively high maximum and minimum values. For
instance, during the INR depreciation episode in 2013, the call money rate and the 10-year GOI
bond yield surged significantly, thereby hurting investor gains. An interesting difference between
the Indian money market and GSM that came out in this analysis is that the money market‘s
median is about two standard deviations away from its mean, while the GSM‘s median is about
24 standard deviations away from its corresponding mean (Table 2).

23
Table 2: Descriptive Statistics for Volatility Analysis
Particulars
Descriptive Statistics for Volatility (Apr’03-Jul’13)
Mean Median Maximum Minimum Std. Dev. Skewness Kurtosis
Money Market
(Weighted Average
Call Rate)
6.08% 6.05% 14.07% 0.73% 0.0199 0.4041 1.0409
GSM (10-year GOI
Bond Yield) 7.40% 7.64% 9.35% 5.11% 0.0100 -0.9098 0.0706
Forex Market
(USD/INR Exchange
Rate)
46.55 45.58 59.59 39.37 4.1973 0.8903 0.7308
Equity Market
(Nifty Level) 3,942.07 4,301.36 6,096.11 963.20 1,551.93 -0.3725 -1.2587
Forex market and equity market
Both these markets were found to be significantly impacted by exogenous factors such as the
significant presence of foreign players. There was high volatility in these markets (depicted by
relatively high standard deviation values). With the increasing openness of the Indian economy,
it is becoming imperative for Indian policy makers to contain the Current Account Deficit (CAD)
to reduce this volatility and bring stability to the market. Table 3 depicts the percentage change
in the absolute values of these reference indicators.
Table 3: Descriptive Statistics for Volatility Analysis—Absolute Number Change
Particulars
Descriptive Statistics for Volatility (Apr’03-Jul’13): Changes in Absolute Values
Mean Median Maximum Minimum Std.
Dev.
Skewness Kurtosis
Money Market 6.28% 0.60% 764% -69.83% 0.7063 10.2937 111.2248
GSM 0.30% 0.11% 13% -25.52% 0.0455 -1.3900 8.8785
Forex Market 0.21% -0.04% 7% -4.27% 0.0205 0.7961 1.4338
Equity Market 1.68% 2.63% 20% -23.69% 0.0641 -0.5341 1.9505

24
4.2.3 Efficiency
Due to the unavailability of data related to the bid-ask spread in the public domain, the efficiency
analysis was qualitative in nature; it was primarily based on the results reported in the extant
literature.
Forex market
With economic reforms and technological advancements, the bid-ask spread in the forex market
has declined over the years. The lower the spread, the more efficient market is said to be. With
the presence of a floating exchange rate regime (where the rate is determined by the market
forces of demand and supply), market efficiency in the forex market is becoming an important
concern for the Indian central bank. Transactional and operational costs are taken into
consideration while assessing market efficiency. The current bid-ask spread is:
Spot market: ¼ of 1 paisa–1 paisa
Swap market: 1–2 paisa
Until the 1990s, the USD/INR spread was high and volatile due to low liquidity in the market,
caused by unidirectional participation. Post the economic reforms in 1991, the depth and
liquidity of the forex market increased, leading to higher efficiency (in other words, a decline in
the bid-ask spread). Table 4 presents the results of a regression study conducted by the RBI to
estimate the rupee-dollar bid-ask spread (SPD) using ‗1-month ATM rupee-dollar option price
volatility‘ (IV, which is a proxy for expected volatility) and daily turnover (VOL) in the forex
market (spot, forward, and swap) as the dependent variables. This empirical work reinforces that
the rupee-dollar volatility impacts its bid-ask spread. Trading volume, on the other hand, has a
negative yet smaller impact on the spread—an increase in the trading volume decreases the
spread, thereby increasing the market efficiency. The high intercept value of the regression
equation indicates spread flatness due to low volatility in the forex market.

25
Table 4: Efficiency Analysis for USD/INR
Particulars Independent
Variable
Dependent
Variables Regression Equation
t-value at 1%
significance
Forex
Market Rupee-dollar
bid-ask
spread (SPD)
1-month ATM rupee-
dollar option price
volatility (IV); daily
turnover (VOL)
Log SPD = -4.46 – 0.01 log VOL +
3.29 IV
R2 = 0.15 and DW = 2.10
(-31.63), (-
0.94), and
(5.18)
Source: Report on Currency and Finance, Volume III, RBI (2003–2008)
4.3 Cross-Correlation Analysis for Assessing Level of Market Integration
The degree of co-movement among the various financial market segments appears to have
increased since 1996. Earlier empirical studies suggested that the capital market was the least
integrated with the other market segments (Bhoi and Dhal, 1998). A low degree of correlation of
the equity market with risk-free instruments was found, indicating greater volatility of stock
returns (Mohan, 2007).
A study of the integration of financial markets requires an examination of the cross-correlation
coefficients or the degree of association of the various rates in the financial markets. The results
of the decade-long (2003–2013) cross-correlation analysis that we conducted is presented in
Table 5.

26
Table 5: Cross-Correlation Analysis (2003–2013)
Particulars Call Money Rate 10-year G-o-I Bond USD/INR Spot
Exchange
Nifty Index
Call Money Rate 1.0000 0.5635 0.2470 0.3948
10-year GoI Bond 0.5621 1.0000 0.1137 0.7866
USD/INR Spot
Exchange
0.2470 0.1097 1.0000 0.2384
Nifty Index 0.3948 0.7911 0.2384 1.000
4.3.1 Money market integration
The money market is medium-level integrated with the GSM due to the role played by
commercial banks and the capital-raising requirements of government. Due to the differences in
the maturity profiles of various instruments, these markets are not highly integrated with each
other despite having similarities. Owing to their short-term nature and the role played by
commercial banks, the money and forex markets have low-medium integration. The presence of
institutional players makes money and equity markets medium-level integrated as well. Within
the money market, a strong correlation occurs among the various instrument rates—call money,
CBLO, and market repo (Ray and Prabhu, 2013).
4.3.2 GSM integration
A high-level correlation occurs between the GSM and the equity market. This can be understood
from the relationship between the level of economic activity and the government‘s revenue-
generating capacity. In a situation when the business fundamentals are strong, the government is
expected to earn higher tax revenues, thereby reducing its capital demand from the debt market.
In this manner, the government‘s debt rating is likely to improve and receive higher market
participation, leading to high positive activity in the GSM. Simultaneously, strong business
fundamentals are likely to result in the enhanced performance of the equity market, which is
known as the Efficient Market Hypothesis (EMH). The level of integration is low between the

27
GSM and the forex markets because of the differences in the inherent nature of these markets—
the GSM is functional at the long-end while the forex market primarily operates at the short-end.
4.3.3 Forex market integration
A certain level of integration is present between the forex market and the equity market because
of the role played by FIIs in them. The forex market is positively correlated with all the other
focused financial markets; however, the degree of correlation is low. This can be attributed to the
excessive capital inflows to India during the period of the study due to various plausible
factors—interest rate differential between India and foreign countries, better yield-seeking
behaviour of foreign investors, and the resilient macroeconomic fundamentals of India.
4.3.4 Temporal cross-correlation analysis
Pre-crisis period
The pre-crisis period (2004–2008) involved periods of liquidity surplus (April 2005–November
2006, when the RBI had to suck liquidity out of the system) and liquidity deficit—December
2006–November 2008, when liquidity was injected into the system (Ray and Prabhu, 2013). The
extant literature suggested that money market instruments—call money rate, CBLO rate, and
market repo rate—all showed high levels of correlation before the financial crisis. Domestic
inter-market integration during this period can be assessed from the results of the correlation
study (Table 6), the salient features of which are presented below:
The call money market depicted moderate levels of correlation with the GSM and the
equity market, and low but negative correlation with the forex market.
The forex market depicted a negative correlation with all the other three markets. The
negative correlation was strongest in the case of the equity market, while it was lowest in
the case of the money market.
The GSM depicted a strong positive correlation with the equity market. The period of
study involved the global bull run, during which time the Indian macroeconomic
fundamentals were strong enough to pull foreign capital inflows—both the GSM as well
as the equity market benefited and moved in tandem with each other.

28
Table 6: Pre-crisis Cross-Correlation Analysis
Particulars (Pre-
Crisis: Apr’03-
Jul’08)
Call Money Rate 10-year GoI Bond USD/INR Spot
Exchange
Nifty Index
Call Money Rate 1.0000 0.5316 -0.2139 0.4976
10-year G-o-I Bond 0.5316 1.0000 -0.5376 0.7964
USD/INR Spot
Exchange -0.2139 -0.5376 1.000 -0.8080
Nifty Index 0.4976 0.7964 -0.8080 1.000
Crisis period
The global financial crisis of 2008 impacted financial markets across the world. The Indian
financial markets were also affected, though not immediately and as drastically as other markets.
As shown in Table 7, the cross-correlation among the various financial markets changed as a
result of the crisis. Some of these changes are highlighted below.
Money market: The call money market‘s correlation declined with the key indicators of
the GSM and the equity market. Its positive correlation with the GSM decreased from
approximately 0.53 in the pre-crisis period to approximately 0.38 in the crisis period.
This can be attributed to the increased uncertainty within the inter-bank market (call
money is now a purely inter-bank rate) due to the bank failures that were happening
globally. Hence, the call money rate did not remain a function of the macro-economic or
the financial fundamentals of an economy. Owing to monetary easing (through lowering
of repo and reverse repo) and fiscal stimulus (by increasing government expenditure),
perhaps the transmission mechanism weakened between these two markets.
Consequently, they depicted a lower degree of positive correlation (as compared to the
earlier period). The call money market‘s correlation with the forex market became even
more negative in this period. However, the most significant change came with the equity
market—from a medium-level positive correlation, it went to a feeble negative
correlation. This can also be attributed to the uncertainty in the financial domain during

29
the crisis due to which equity wealth was eroded (leading to a decline in the indices),
while the yields for money market instruments rose. The weakening of degree of
correlation between the short-term (call money) instruments and the long-term (10-year
GOI bonds) instruments severely impacted the equity market.
GSM: A key change occurred in the correlation of the GSM with the forex market—from
0.53 in the pre-crisis period to 0.75 in the crisis period. A plausible explanation for this
change is the fluctuation in the currency exchange rates due to increasing government
debt levels (which might have witnessed revision due to the expansionary economic
policy to avoid the trickling down of the global meltdown in the country). While this
change is quantitatively significant, the change in correlation with the equity market was
small—from approximately 0.79 in the pre-crisis period to approximately 0.68 in the
crisis period.
Forex market: The cross-correlation of the forex market with the equity market
remained negative, although it weakened slightly (from -0.80 to -0.76).
Table 7: Crisis Period Cross-Correlation Analysis
Particulars (During
Crisis: Aug’08-
Dec’10)
Call Money Rate 10-year GoI Bond USD/INR Spot
Exchange
Nifty Index
Call Money Rate 1.0000 0.3860 -0.2817 -0.0895
10-year G-o-I Bond 0.3860 1.0000 -0.7586 0.6898
USD/INR Spot
Exchange -0.2817 -0.7586 1.0000 -0.7656
Nifty Index -0.0895 0.6898 -0.7656 1.000
Post-crisis period
Money market: Post the 2008 financial crisis, the money market instruments (primarily
the call money rate) returned to its moderate degree of correlation with the GSM
instruments. This can be attributed to multiple factors such as the increased monetary
policy rates, high fiscal deficit (due to measures taken to mitigate the impact of the global
financial crisis), and persistent inflation. Weighted average call money rate, which was a

30
significant policy development during this period, became the operating target of the
monetary policy and the repo rate became the policy rate since May 2011. This improved
the transmission mechanism of interest rates from short-end to long-end. With the call
money rate becoming the operating target, the correlation with the forex market gradually
increased in the positive direction. However, so far, this correlation seems to be on the
weaker side. Therefore, the measures taken by the RBI in mid-2013 to curb volatility in
the USD/INR exchange rate possibly did not yield significant results. The money and
equity markets remained negatively correlated, though the degree of correlation increased
from feeble to medium.
GSM: The cross-correlation between the GSM and the forex market decreased (in
quantity) from approximately 0.75 to approximately 0.35. The correlation between the
GSM and the equity market witnessed a sharp turn from 0.68 (during the crisis period) to
0.71 (during the post-crisis period). One plausible reason for this change could be the
reversal of capital flows from India in 2013, i.e., the rupee depreciation episode. Investor
sentiments in the equity market are typically guided by the debt segment return. In the
event of rupee depreciation, foreign currency risk becomes high, resulting in the reversal
of flows.
Forex market: The correlation between the forex and the equity markets as well as that
between the forex and money markets took a shift from a strong negative correlation to a
weak positive correlation. One plausible explanation for this change could be the
depreciation in INR value (after the Quantitative Easing (QE) announcement by the U.S.
in February 2013), which was followed by certain monetary measures—such as reducing
the systemic liquidity by raising level of raising Marginal Standing Facility (MSF)—that
increased the money market bond yields significantly and hence led to the change in the
co-movement.
Table 8: Post Crisis Cross-Correlation Analysis
Particulars (Post
Crisis: Jan’11-
Jul’13)
Call Money Rate 10-year GoI Bond USD/INR Spot
Exchange
Nifty Index
Call Money Rate 1.0000 0.5113 0.3355 -0.5868
10-year GOI Bond 0.5113 1.0000 -0.3518 -0.7153

31
Particulars (Post
Crisis: Jan’11-
Jul’13)
Call Money Rate 10-year GoI Bond USD/INR Spot
Exchange
Nifty Index
USD/INR Spot
Exchange 0.3355 -0.3518 1.0000 0.1105
Nifty Index -0.5868 -0.7153 0.1105 1.000
Table 9: Comparison of Cross-Correlation Results with Earlier Studies
Correlation Among Financial Markets (Apr’93-Mar’00)
Particulars (Pre-
Crisis: Apr’03-
Jul’08)
Call Money Rate 10-year GoI Bond USD/INR Spot
Exchange
Natural Logarithm
of BSE Sensex
Call Money Rate 1.00 0.46 -0.04 -0.10
10-year G-o-I Bond 0.46 1.00 -0.06 -0.05
USD/INR Spot
Exchange -0.04 -0.06 1.00 -0.30
Natural Logarithm
of BSE Sensex -0.10 -0.05 -0.30 1.00
Correlation Among Financial Markets (Apr’00-Dec’06)
Particulars (Pre-
Crisis: Apr’03-
Jul’08)
Call Money Rate 10-year GoI Bond USD/INR Spot
Exchange
Natural Logarithm
of BSE Sensex
Call Money Rate 1.00 0.79 0.06 0.01
10-year G-o-I Bond 0.79 1.00 0.06 -0.11
USD/INR Spot
Exchange 0.06 0.06 1.00 -0.56
Natural Logarithm
of BSE Sensex 0.01 -0.11 -0.56 1.00
4.4 Evolution of Financial Market Integration
Using the results of a cross-correlation study from an earlier timeframe (Mohan, 2007) and the
results of this study, the pattern of evolution of the integration of financial markets can be
estimated.
Money market and GSM remained medium-level positively correlated. However, their
level of correlation was dependent on domestic and external macro-economic
developments.
Forex market‘s correlation with money and government securities market evolved from
faint to medium correlation level.

32
Similarly, the correlation between the money market and equity market also increased
with the passage of time.
The correlation between the GSM and the forex market followed a bell-shaped curve—
from a faint correlation during 1993–2000, to a strong correlation during 2001–2010,
followed by a decrease in correlation levels since 2011.
The correlation levels between the GSM and the equity market increased and remained
consistently strong during the period of this study.
Prior literature (Ray and Prabhu, 2013) suggested that monetary policy shocks (such as those to
the policy rate, which is the repo rate in India) do not impact the forex market in the initial few
days. However, within a month, the positive impact of such monetary policy shocks became
evident, i.e., the increase in the policy rate led to the appreciation of the domestic currency
exchange rate. Similarly, such positive policy shocks had a positive impact on the equity market
(an increase in the stock market). In the case of the GSM, a positive shock in the repo rate
resulted in an initial negative effect (for about 3–6 days), which later experienced mean
reversion. The absence of impulse responses in the equity market due to monetary policy shocks
could be attributed to the high alignment of the domestic stock market with the international
stock markets—a direct consequence of the role played by FIIs. It is interesting to note that in
India, there is an asymmetry in the monetary policy transmission to the short end of the financial
markets—the transmission is faster in liquidity deficit conditions than in liquidity surplus
conditions (Ray and Prabhu, 2013).
4.4.1 Financial market integration and INR depreciation
In response to global cues (QE tapering) and weak domestic macroeconomic fundamentals, INR
depreciated against USD since May 2013. In response to this, the RBI tightened the short-term
liquidity of the system through a series of measures, such as the rise in the MSF rate and the
tightening of LAF amount (0.5% of NDTL), leading to a sharp decline in bond prices. These
steps had a limited impact on the USD/INR rate; on the other hand, it severely impacted the
short-term bond market. A plausible explanation for this could be the weak correlation between
the money and the forex markets. This episode shows that low integration among the various
financial market segments hinders the effective transmission of monetary policy.

33
4. Way Forward
Financial markets in India have registered considerable development with the onset of financial
sector reforms starting in the 1990s. It is pertinent to note that the development in these markets
has been in a gradual and calibrated manner, sequenced in line with the reforms in the real
sector. The impact of these reforms has been evident in the price discovery process, the easing of
restrictions, and the lowering of transaction costs. Apart from these, there has been evidence of
greater domestic market integration. The development of financial markets is an on-going
process and should not be considered as an event. It is important, therefore, that the authorities
and market participants should play proactive and complementary roles to sustain the future
large investment needs of a growing country such as India.
The results of this study show that the money, foreign exchange, government securities, and
equity markets in India have developed into reasonably deep, resilient, and liquid markets over
time. The integration of the financial markets has been helpful in the effective transmission of
monetary policy through the interest rate channel, the credit channel, and the foreign exchange
channel.
Trickling down and translation of economic growth into the development of the financial market
has been a hot topic among researchers. The extant literature suggests that real GDP growth is
not necessarily and directly translated to real equity market returns, not even in developed
countries. On similar lines, the regression analysis between India‘s GDP growth and the BSE 30
equity returns produces a flat regression line, indicating no direct relationship between these two
parameters (Hubbis, 2013). The presence of such phenomena makes it imperative for policy
makers to enhance the level of integration of the financial markets so that fundamental
macroeconomic changes are reflected in all markets. The financial market integration level was
found to vary across financial market segments—the money market was fairly integrated, while
the GSM is moderately integrated. The forex and equity markets were correlated to a certain
extent due to the presence of common players. Understanding the level of inter-market
integration becomes helpful for policy makers in designing policies to generate the required
monetary impulse.
34
Going ahead, the authorities should focus on the derivative segment of the forex and equity
markets, in terms of both potential market participants as well as product development. With
regard to the GSM, further development is required to increase transparency (level of
disclosures); additionally, the development of newer instruments and regulatory incentives to
increase the size of the trading books could be undertaken. In the money market segment, our
recommendation is to develop a market mechanism for participants to take a medium-long term
perspective on interest rate and liquidity.
We close this paper with the following excerpt from the Committee on Financial Sector
Assessment (Government of India and Reserve Bank of India, 2009, Chapter 4, page 296):
―Stability in financial market augurs well for financial soundness. In fact, markets are the major
conduits for transmission of impulses which could either enhance or impact the stability of the
financial system as a whole. While financial market reforms need to be accorded appropriate
priority, given the risks arising from cross-sectoral spillover of financial markets to other
segments of financial spectrum, there is a need to be careful and nuanced in approaching
financial markets reforms in the interest of financial stability.‖
Bibliography
Atyeh, M. H. (2012). The Theoretical Considerations of Financial Markets Integration: The case of Arab
countries. Journal of Economics and Sustainable Development, ISSN 2222-1700 (Paper) ISSN 2222-
2855 (Online), 3(1).
Ayuso, J. and Blanco R. (1999). Has financial market integration increased during the nineties?
Research Department, Banco de Espana.
Bhoi, B.K. and Dhal, S.C. (1998). Integration of Financial Markets in India: An empirical evaluation. RBI
Occasional Papers, 19(4), 345–380.
Buigut, S. (2011). International Financial Integration of the Indian Money Markets. International Journal
of Economics and Finance, 3(4).
Committee on Financial Sector Assessment, R. (2009). India's Financial Sector - An Assessment.
Mumbai: RBI and GoI.
Database on Indian Economy. http://www.rbi.org.in
Gopinath, S. (January 2008). Financial Markets in India: Recent Developments and Challenges. Cairo:
RBI and FIMMDA-PDAI. http://rbidocs.rbi.org.in/rdocs/Speeches/PDFs/85236.pdf

35
Gopinath, S. (January 2010). Financial markets – some regulatory issues and recent developments.
Mumbai: RBI and FIMMDA–PDAI. http://rbidocs.rbi.org.in/rdocs/Speeches/PDFs/SMRM040109.pdf
Handbook of Statistics on Indian Economy. http://dbie.rbi.org.in/DBIE/dbie.rbi?site=home
Horvatic, D., Stanley, H. E., and Podobnik, B. (2011). Detrended Cross-correlation Analysis for Non-
stationary Time Series with Periodic Trends. EPL Journal, 94, 18007.
Hubbis. (April 2013). Equity Markets. Featured Article. The Guide to Investing in India 2013.
Jain, S. and Bhanumurthy, N.R. (December 2005). Financial Markets Integration in India. Asia Pacific
Development Journal, 12(2). www.unescap.org/pdd/publications/apdj_12_2/jain.pdf
Kaminsky, G. and Schmukler, S. (2002). Short and Long-Run Integration: Do capital controls matter.
World Bank Discussion Paper.
Mohan, R. (March 2004). A Decade of Reforms in Government Securities Market in India and the Road
Ahead. Mumbai: Reserve Bank of India. http://rbidocs.rbi.org.in/rdocs/Speeches/PDFs/60551.pdf
Mohan, R. (May 2007). Development of Financial Markets in India. Mumbai: Reserve Bank of India.
http://rbidocs.rbi.org.in/rdocs/Speeches/PDFs/77375.pdf
Mohan, R. (September 2007). Recent Financial Market Developments and Implications for Monetary
Policy. RBI and IIF. http://rbidocs.rbi.org.in/rdocs/Speeches/PDFs/80014.pdf
Mohanty, D. (December 2012). Money Market and Monetary Operations in India. Mumbai: RBI.
http://rbidocs.rbi.org.in/rdocs/Speeches/PDFs/SMMIED171212.pdf
Padmanabhan, G. (August 2011). Forex market development: Issues and challenges—Thoughts of a
returning forex market regulator. Singapore: RBI and Forex Association of India.
http://rbidocs.rbi.org.in/rdocs/Speeches/PDFs/EDGPS110811.pdf
Padmanabhan, G. (August 2012). Changed Contours of the Indian Forex Markets: New realities and
priorities. Goa: Reserve Bank of India and Forex Association of India.
http://rbidocs.rbi.org.in/rdocs/Speeches/PDFs/RSFA20082012.pdf
Rangarajan, C. (1997). Activating Debt Markets in India. Mumbai: Reserve Bank of India and SBICAP
Debt Market Seminar. http://rbidocs.rbi.org.in/rdocs/Speeches/PDFs/2507.pdf.
Ray, P. and Prabhu, E. (May 2013). Financial Development and Monetary Policy Transmission Across
Financial Markets: What Do Daily Data Tell for India? Mumbai: Department of Economic and Policy
Research, Reserve Bank of India. http://rbidocs.rbi.org.in/rdocs/Publications/PDFs/WPS070513FDTP.pdf
RBI. (2003-08, Volume III). Development of Financial Markets and Role of the Central Bank - Reports
on Currency and Finance. Chapter 4, p. 296.
Reddy, D. Y. V. (March 2002). Developing Bond Markets in Emerging Economies: Issues and Indian
Experience. Bangkok: RBO, FIMMDA, PDAI, and Thai BDC.
http://rbidocs.rbi.org.in/rdocs/Speeches/PDFs/26957.pdf
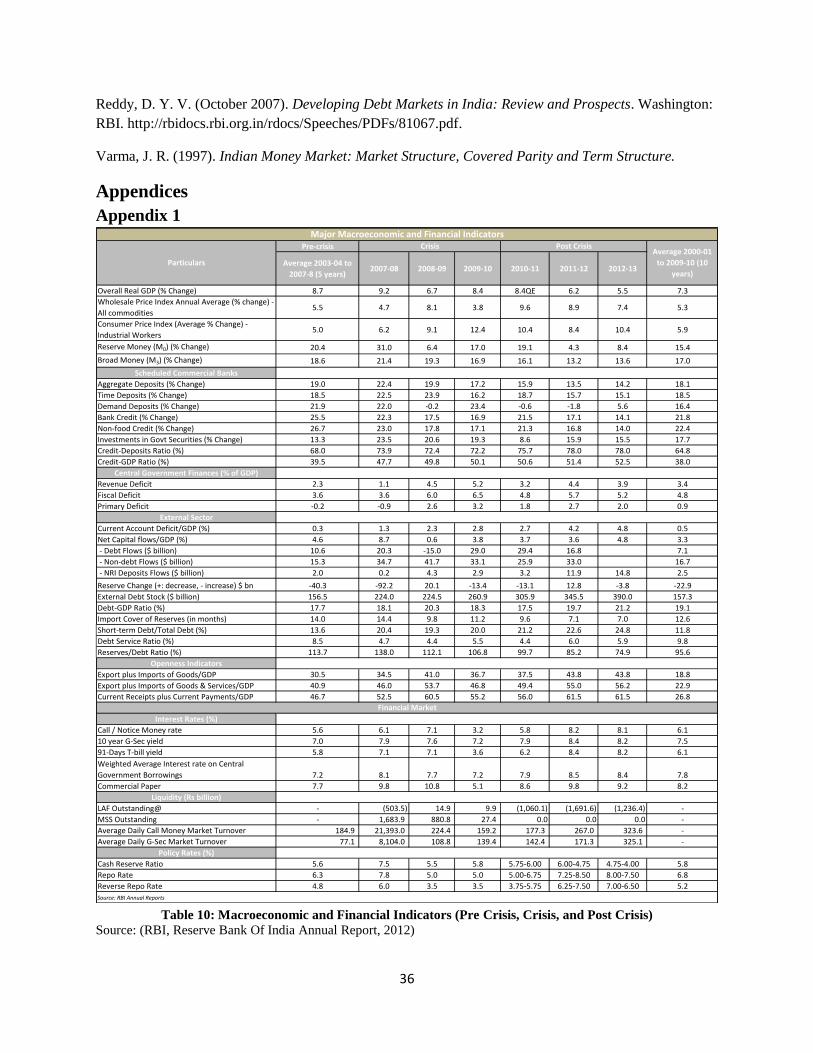
36
Reddy, D. Y. V. (October 2007). Developing Debt Markets in India: Review and Prospects. Washington:
RBI. http://rbidocs.rbi.org.in/rdocs/Speeches/PDFs/81067.pdf.
Varma, J. R. (1997). Indian Money Market: Market Structure, Covered Parity and Term Structure.
Appendices
Appendix 1
Table 10: Macroeconomic and Financial Indicators (Pre Crisis, Crisis, and Post Crisis)
Source: (RBI, Reserve Bank Of India Annual Report, 2012)
Pre-crisis
Average 2003-04 to
2007-8 (5 years)2007-08 2008-09 2009-10 2010-11 2011-12 2012-13
Overall Real GDP (% Change) 8.7 9.2 6.7 8.4 8.4QE 6.2 5.5 7.3
Wholesale Price Index Annual Average (% change) -
All commodities5.5 4.7 8.1 3.8 9.6 8.9 7.4 5.3
Consumer Price Index (Average % Change) -
Industrial Workers5.0 6.2 9.1 12.4 10.4 8.4 10.4 5.9
Reserve Money (M0) (% Change) 20.4 31.0 6.4 17.0 19.1 4.3 8.4 15.4
Broad Money (M3) (% Change) 18.6 21.4 19.3 16.9 16.1 13.2 13.6 17.0
Scheduled Commercial Banks
Aggregate Deposits (% Change) 19.0 22.4 19.9 17.2 15.9 13.5 14.2 18.1
Time Deposits (% Change) 18.5 22.5 23.9 16.2 18.7 15.7 15.1 18.5
Demand Deposits (% Change) 21.9 22.0 -0.2 23.4 -0.6 -1.8 5.6 16.4
Bank Credit (% Change) 25.5 22.3 17.5 16.9 21.5 17.1 14.1 21.8
Non-food Credit (% Change) 26.7 23.0 17.8 17.1 21.3 16.8 14.0 22.4
Investments in Govt Securities (% Change) 13.3 23.5 20.6 19.3 8.6 15.9 15.5 17.7
Credit-Deposits Ratio (%) 68.0 73.9 72.4 72.2 75.7 78.0 78.0 64.8
Credit-GDP Ratio (%) 39.5 47.7 49.8 50.1 50.6 51.4 52.5 38.0
Central Government Finances (% of GDP)
Revenue Deficit 2.3 1.1 4.5 5.2 3.2 4.4 3.9 3.4
Fiscal Deficit 3.6 3.6 6.0 6.5 4.8 5.7 5.2 4.8
Primary Deficit -0.2 -0.9 2.6 3.2 1.8 2.7 2.0 0.9
External Sector
Current Account Deficit/GDP (%) 0.3 1.3 2.3 2.8 2.7 4.2 4.8 0.5
Net Capital flows/GDP (%) 4.6 8.7 0.6 3.8 3.7 3.6 4.8 3.3
- Debt Flows ($ billion) 10.6 20.3 -15.0 29.0 29.4 16.8 7.1
- Non-debt Flows ($ billion) 15.3 34.7 41.7 33.1 25.9 33.0 16.7
- NRI Deposits Flows ($ billion) 2.0 0.2 4.3 2.9 3.2 11.9 14.8 2.5
Reserve Change (+: decrease, - increase) $ bn -40.3 -92.2 20.1 -13.4 -13.1 12.8 -3.8 -22.9
External Debt Stock ($ billion) 156.5 224.0 224.5 260.9 305.9 345.5 390.0 157.3
Debt-GDP Ratio (%) 17.7 18.1 20.3 18.3 17.5 19.7 21.2 19.1
Import Cover of Reserves (in months) 14.0 14.4 9.8 11.2 9.6 7.1 7.0 12.6
Short-term Debt/Total Debt (%) 13.6 20.4 19.3 20.0 21.2 22.6 24.8 11.8
Debt Service Ratio (%) 8.5 4.7 4.4 5.5 4.4 6.0 5.9 9.8
Reserves/Debt Ratio (%) 113.7 138.0 112.1 106.8 99.7 85.2 74.9 95.6
Openness Indicators
Export plus Imports of Goods/GDP 30.5 34.5 41.0 36.7 37.5 43.8 43.8 18.8
Export plus Imports of Goods & Services/GDP 40.9 46.0 53.7 46.8 49.4 55.0 56.2 22.9
Current Receipts plus Current Payments/GDP 46.7 52.5 60.5 55.2 56.0 61.5 61.5 26.8
Interest Rates (%)
Call / Notice Money rate 5.6 6.1 7.1 3.2 5.8 8.2 8.1 6.1
10 year G-Sec yield 7.0 7.9 7.6 7.2 7.9 8.4 8.2 7.5
91-Days T-bill yield 5.8 7.1 7.1 3.6 6.2 8.4 8.2 6.1
Weighted Average Interest rate on Central
Government Borrowings 7.2 8.1 7.7 7.2 7.9 8.5 8.4 7.8
Commercial Paper 7.7 9.8 10.8 5.1 8.6 9.8 9.2 8.2
Liquidity (Rs billion)
LAF Outstanding@ - (503.5) 14.9 9.9 (1,060.1) (1,691.6) (1,236.4) -
MSS Outstanding - 1,683.9 880.8 27.4 0.0 0.0 0.0 -
Average Daily Call Money Market Turnover 184.9 21,393.0 224.4 159.2 177.3 267.0 323.6 -
Average Daily G-Sec Market Turnover 77.1 8,104.0 108.8 139.4 142.4 171.3 325.1 -
Policy Rates (%)
Cash Reserve Ratio 5.6 7.5 5.5 5.8 5.75-6.00 6.00-4.75 4.75-4.00 5.8
Repo Rate 6.3 7.8 5.0 5.0 5.00-6.75 7.25-8.50 8.00-7.50 6.8
Reverse Repo Rate 4.8 6.0 3.5 3.5 3.75-5.75 6.25-7.50 7.00-6.50 5.2
Major Macroeconomic and Financial IndicatorsCrisis
Financial Market
Particulars
Average 2000-01
to 2009-10 (10
years)
Post Crisis
Source: RBI Annual Reports
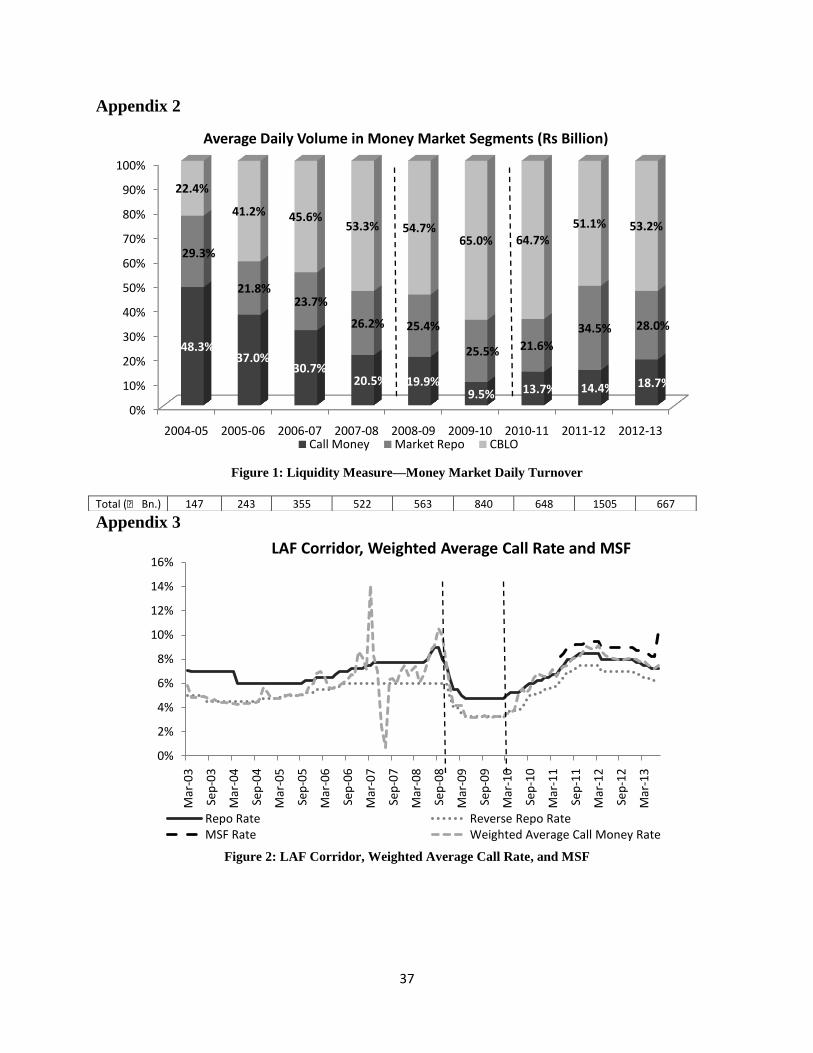
37
Appendix 2
Figure 1: Liquidity Measure—Money Market Daily Turnover
Appendix 3
Figure 2: LAF Corridor, Weighted Average Call Rate, and MSF
0%
10%
20%
30%
40%
50%
60%
70%
80%
90%
100%
2004-05 2005-06 2006-07 2007-08 2008-09 2009-10 2010-11 2011-12 2012-13
48.3%37.0%
30.7%20.5% 19.9%
9.5% 13.7% 14.4% 18.7%
29.3%
21.8%23.7%
26.2% 25.4%
25.5% 21.6%
34.5% 28.0%
22.4%
41.2% 45.6%53.3% 54.7%
65.0% 64.7%
51.1% 53.2%
Average Daily Volume in Money Market Segments (Rs Billion)
Call Money Market Repo CBLO
0%
2%
4%
6%
8%
10%
12%
14%
16%
Mar
-03
Sep
-03
Mar
-04
Sep
-04
Mar
-05
Sep
-05
Mar
-06
Sep
-06
Mar
-07
Sep
-07
Mar
-08
Sep
-08
Mar
-09
Sep
-09
Mar
-10
Sep
-10
Mar
-11
Sep
-11
Mar
-12
Sep
-12
Mar
-13
LAF Corridor, Weighted Average Call Rate and MSF
Repo Rate Reverse Repo RateMSF Rate Weighted Average Call Money Rate
Total (₹ Bn.) 147 243 355 522 563 840 648 1505 667

38
Appendix 4
Figure 3: Secondary GSM—Outright Transactions
Figure 4: Domestic GSM—Repo Transactions
Figure 5: Yield Curve of Government Securities
Yield-turnover relationship of GSM alludes the market turnover becoming increasingly less sensitive to interest rate cycles – depth and
liquidity in market (Gopinath, Financial Markets in India: Recent Developments and Challenges, January 2008).
0
10,000
20,000
30,000
40,000
50,000
60,000
70,000
2004 2005 2006 2007 2008 2009 2010 2011 2012 2013
Am
ou
nt
in R
s. B
illio
n
Outright Transactions in Govt. Securities - Domestic Secondary Bond Market
Central Govt State Govt
0
10,000
20,000
30,000
40,000
50,000
60,000
2004 2005 2006 2007 2008 2009 2010 2011 2012 2013
Am
ou
nt
in R
s. B
illio
n
Repo Transactions in Govt. Securities - Domestic Secondary Bond Market
Central Govt State Govt
0.0
2.0
4.0
6.0
8.0
10.0
1 4 7 10 13 16 19 22 25 28
Yie
ld
Yield Curve of Government Securities
Mar-04 Mar-06 Mar-08

39
Appendix 5
Figure 6: Classification of Forex Market
Figure 7: OTC Forex Market Turnover
Forex Market
Over the Counter (OTC)
market
Spot
Cash (T+0) Tom (T+1) Spot (T+2)
Forwards Swaps
Exchange-traded Currency Futures
-
2,000
4,000
6,000
8,000
10,000
12,000
14,000
16,000
2004-05 2005-06 2006-07 2007-08 2008-09 2009-10 2010-11 2011-12
Turnover in OTC Forex Market
Spot Forward Swap
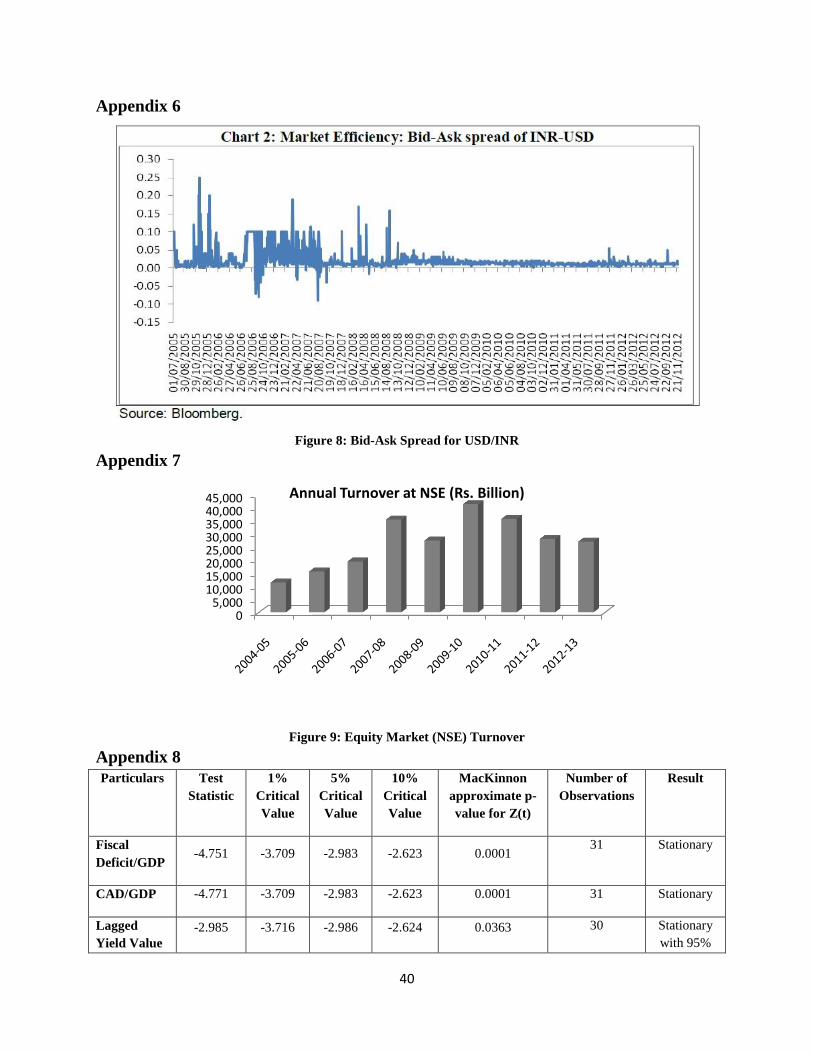
40
Appendix 6
Figure 8: Bid-Ask Spread for USD/INR
Appendix 7
Figure 9: Equity Market (NSE) Turnover
Appendix 8
Particulars Test
Statistic
1%
Critical
Value
5%
Critical
Value
10%
Critical
Value
MacKinnon
approximate p-
value for Z(t)
Number of
Observations
Result
Fiscal
Deficit/GDP -4.751 -3.709 -2.983 -2.623 0.0001
31 Stationary
CAD/GDP -4.771 -3.709 -2.983 -2.623 0.0001 31 Stationary
Lagged
Yield Value
-2.985 -3.716 -2.986 -2.624 0.0363 30 Stationary
with 95%
05,000
10,00015,00020,00025,00030,00035,00040,00045,000 Annual Turnover at NSE (Rs. Billion)
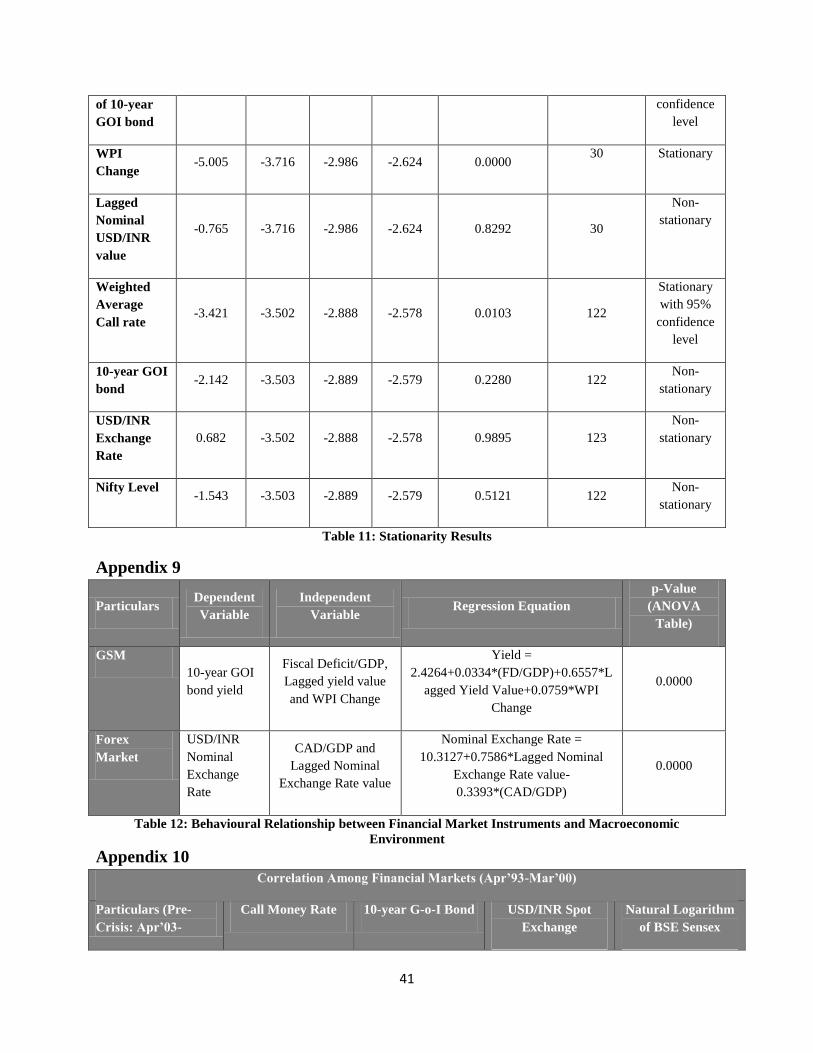
41
of 10-year
GOI bond
confidence
level
WPI
Change -5.005 -3.716 -2.986 -2.624 0.0000
30 Stationary
Lagged
Nominal
USD/INR
value
-0.765 -3.716 -2.986 -2.624 0.8292 30
Non-
stationary
Weighted
Average
Call rate -3.421 -3.502 -2.888 -2.578 0.0103 122
Stationary
with 95%
confidence
level
10-year GOI
bond -2.142 -3.503 -2.889 -2.579 0.2280 122
Non-
stationary
USD/INR
Exchange
Rate
0.682 -3.502 -2.888 -2.578 0.9895 123
Non-
stationary
Nifty Level -1.543 -3.503 -2.889 -2.579 0.5121 122
Non-
stationary
Table 11: Stationarity Results
Appendix 9
Particulars Dependent
Variable
Independent
Variable Regression Equation
p-Value
(ANOVA
Table)
GSM
10-year GOI
bond yield
Fiscal Deficit/GDP,
Lagged yield value
and WPI Change
Yield =
2.4264+0.0334*(FD/GDP)+0.6557*L
agged Yield Value+0.0759*WPI
Change
0.0000
Forex
Market
USD/INR
Nominal
Exchange
Rate
CAD/GDP and
Lagged Nominal
Exchange Rate value
Nominal Exchange Rate =
10.3127+0.7586*Lagged Nominal
Exchange Rate value-
0.3393*(CAD/GDP)
0.0000
Table 12: Behavioural Relationship between Financial Market Instruments and Macroeconomic
Environment
Appendix 10
Correlation Among Financial Markets (Apr’93-Mar’00)
Particulars (Pre-
Crisis: Apr’03-
Call Money Rate 10-year G-o-I Bond USD/INR Spot
Exchange
Natural Logarithm
of BSE Sensex
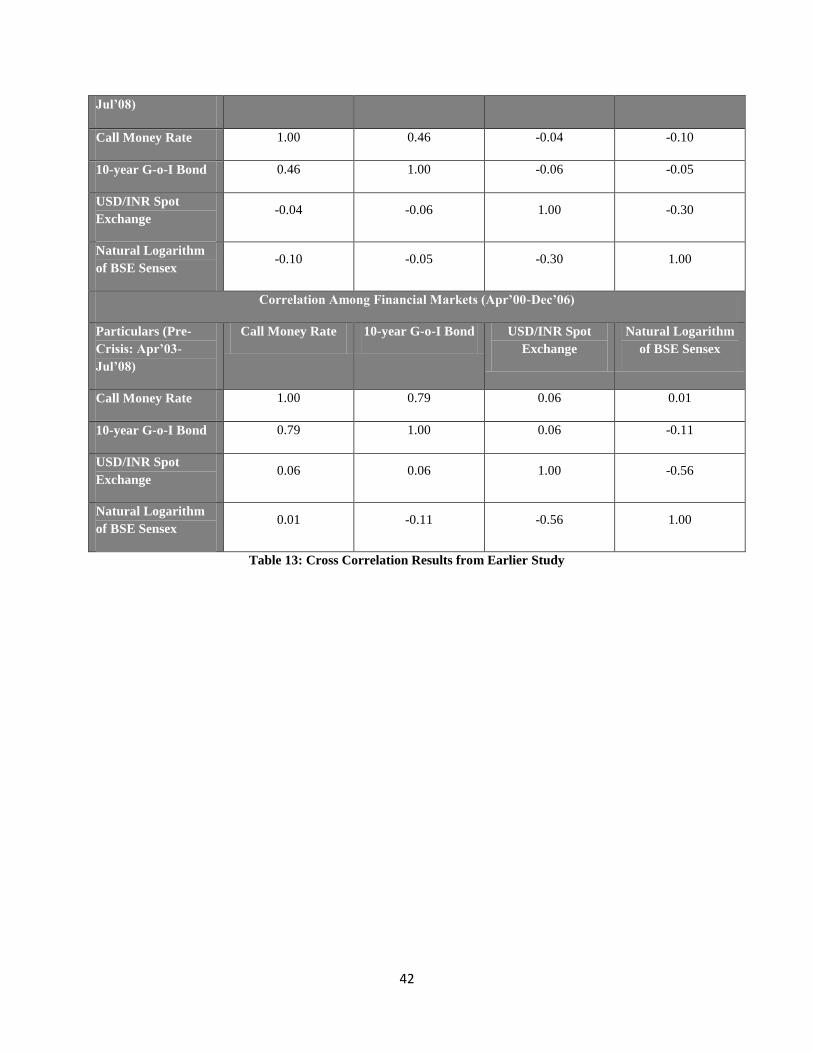
42
Jul’08)
Call Money Rate 1.00 0.46 -0.04 -0.10
10-year G-o-I Bond 0.46 1.00 -0.06 -0.05
USD/INR Spot
Exchange -0.04 -0.06 1.00 -0.30
Natural Logarithm
of BSE Sensex -0.10 -0.05 -0.30 1.00
Correlation Among Financial Markets (Apr’00-Dec’06)
Particulars (Pre-
Crisis: Apr’03-
Jul’08)
Call Money Rate 10-year G-o-I Bond USD/INR Spot
Exchange
Natural Logarithm
of BSE Sensex
Call Money Rate 1.00 0.79 0.06 0.01
10-year G-o-I Bond 0.79 1.00 0.06 -0.11
USD/INR Spot
Exchange 0.06 0.06 1.00 -0.56
Natural Logarithm
of BSE Sensex 0.01 -0.11 -0.56 1.00
Table 13: Cross Correlation Results from Earlier Study