financial performance: 2013-2014 quarters 3 and 4; and 2014-2015 quarter 1:
DESCRIPTION
Financial Performance: 2013-2014 Quarters 3 and 4; and 2014-2015 Quarter 1: Presentation to the Portfolio Committee on Rural Development and Land Reform 1 0 September 2014. PRESENTATION OUTLINE Executive Summary DRDLR’s Performance per Programme and per Economic Classificatio n - PowerPoint PPT PresentationTRANSCRIPT

Financial Performance: 2013-2014 Quarters 3 and 4; and 2014-2015 Financial Performance: 2013-2014 Quarters 3 and 4; and 2014-2015 Quarter 1: Quarter 1:
Presentation to the Portfolio Committee on Rural Development and Presentation to the Portfolio Committee on Rural Development and Land ReformLand Reform
10 September 201410 September 2014

2
PRESENTATION OUTLINEPRESENTATION OUTLINE
1.1.Executive SummaryExecutive Summary2.2.DRDLR’s Performance per Programme DRDLR’s Performance per Programme and per Economic Classificationand per Economic Classification3.3.Agricultural Land Holding AccountAgricultural Land Holding Account4.4.Deeds Registration Trading AccountDeeds Registration Trading Account5.5.KwaZulu-Natal Ingonyama Trust BoardKwaZulu-Natal Ingonyama Trust Board

1. Total spending to the 3rd Quarter of the 2013-2014 financial year amounted to R7.5 billion, representing 79.8% of the Final 2013-2014 Appropriation of R9.4 billion.
2. Spending for the 4th Quarter of 2013-2014 amounted to R1.9 billion, representing 20.1% of the Final 2013-2014 Appropriation, resulting in a 99.9% overall spending for the year and leaving a balance available at the end of the financial year of R5.7 million.
3. It is important to note that the 4th Quarter spending did not spike to abnormal levels, as the percentage spent of 20.1% was within the linear target of 25.0% per quarter.
4. The expenditure for the 1st Quarter of the 2014-2015 financial year amounted to R2.1 billion, representing 22.4% of the 2014-2015 Appropriation of R9.4 billion, and reflected a 2.6% or R248.1 million under spending of the linear target of 25.0%.
5. With regard to the Agricultural Land Holding Account (ALHA), the entity’s expenditure to the 3rd Quarter of the 2013-2014 fiscal year amounted to R1.3 billion, representing 79.3% of their R1.6 billion allocation. During the 4 th Quarter the entity reflected expenditure of R348.3 million or 20.6%, which was within the linear target of 25.0% per quarter. Total spending for the 2013/2014 fiscal year amounted to R1.6 billion or 100.0%, leaving a balance of R198 thousand.
6. ALHA’s expenditure for the 1st Quarter of 2014-2015 amounted to R160.2 million, representing 37.3% of the 1st Quarter transfer to the amount of R428.9 million from the department to the entity. The total 2014-2015 allocation for transfer to the entity amounts to R1.9 billion and is transferred to the entity quarterly on their request.
Executive summaryExecutive summary
3

7. The Deeds Trading Account generates its own revenue. During the financial year 2013-14 it received transfer from the Department amounting to R214, 8 million to augment the budget E – Cadastre Project.
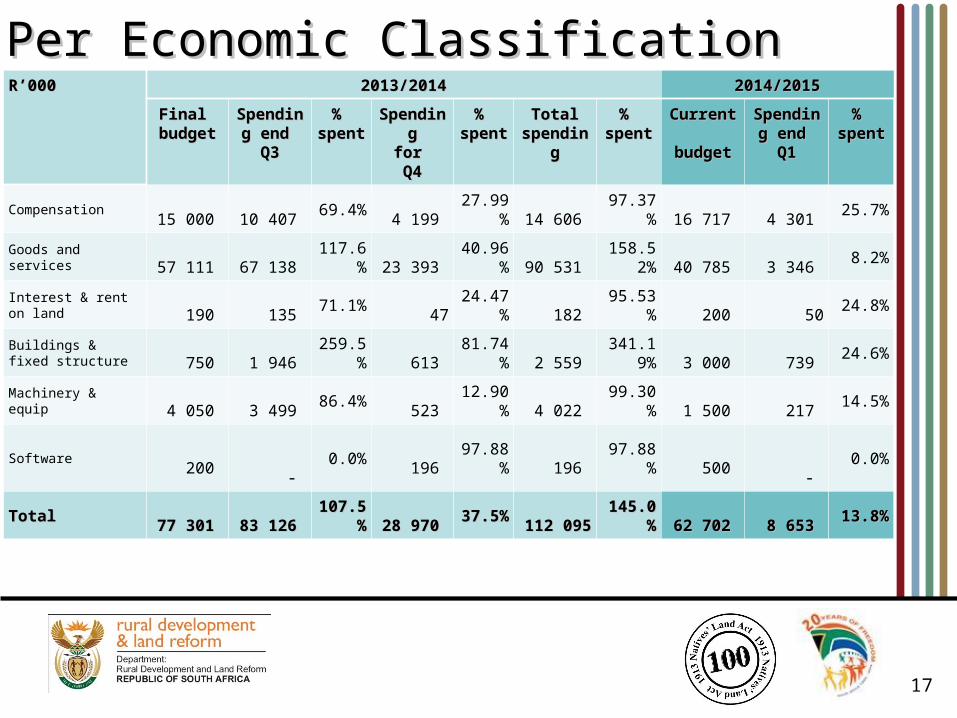
8. As far as the KwaZulu-Natal Ingonyama Trust Board is concerned, spending to the 3 rd Quarter of the 2013/2014 fiscal year amounted to R83.1 million, representing 107.5% of their 2013/2014 budget of R77.3 million. Expenditure during the 4 th Quarter amounted to R29.0 million, resulting in a R112.1 million total spending for the 2013/2014 financial year, and a R34.8 million over spending of their budget. The Board furthermore indicated that the full transfer from the department amounting to R14.5 million had been utilised.
9. The Board’s financial performance for the 1st Quarter of the 2014/2015 fiscal year amounted to R8.7 million, representing 13.8% of their R62.7 million budget for the year. The Board is allocated a total transfer of R17.3 million from the department for the 2014/2015 financial year, which is to be transferred quarterly on request. No transfer of funds had been made by the end of the 1st Quarter, but the amount of R 6.7 million (39.0%) has since been transferred in the 2nd Quarter, leaving a balance available for transfer of R10.6 million for the rest of the financial year.
Executive summary – cont.Executive summary – cont.
4

5
R’000R’000 2013/20142013/2014 2014/20152014/2015
Final Final budgetbudget
Spending Spending end end Q3Q3
% % spentspent
SpendingSpendingfor for Q4Q4
% % spentspent
Total Total spendingspending
% % spentspent
Current Current budgetbudget
SpendingSpendingendendQ1Q1
% % spentspent
1. Administration 1 268 553 933 269 73.6% 334 215 26.3% 1 267 484 99.9% 1 169 693 263 687 22.5%
2. Geo-spatial & Cad Serv 787 206 634 183 80.6% 151 686 19.3% 785 869 99.8% 774 865 130 708 16.9%
3. Rural Development 1 704 760 1 243 148 72.9% 458 494 26.9% 1 701 642 99.8% 2 011 619 349 989 17.4%
4. Restitution 2 836 838 2 306 998 81.3% 529 705 18.7% 2 836 703 100.0% 2 680 742 747 439 27.9%
5. Land Reform 2 862 383 2 431 945 85.0% 430 414 15.0% 2 862 359 100.0% 2 818 386 623 881 22.1%
Total Total 9 459 740 9 459 740 7 549 543 7 549 543 79.8%79.8% 1 904 513 1 904 513 20.1%20.1% 9 454 056 9 454 056 99.9%99.9% 9 455 305 9 455 305 2 115 704 2 115 704 22.4%22.4%
Per ProgrammePer Programme

6
Per Economic ClassificationPer Economic ClassificationR’000R’000 2013/20142013/2014 2014/20152014/2015
Final Final budgetbudget
Spending Spending end end Q3Q3
% % spentspent
SpendingSpendingfor for Q4Q4
% % spentspent
Total Total spendingspending
% % spentspent
Current Current budgetbudget
Spending Spending end end Q1Q1
% % spentspent
Compensation 1 770 730 1 310 884 74.0% 448 418 25.3% 1 759 302 99.4% 2 180 929 483 672 22.2%
Goods and services 2 149 364 1 688 024 78.5% 456 541 21.2% 2 144 565 99.8% 1 348 982 407 559 30.2%
Interest & rent on land - 4 616 - 1 144 - 5 759 - - 2 400 -
Payments fin assets - 597 - 5 930 - 6 528 - - 411 -
Provincial & local gov. 3 483 992 28.5% 2 373 68.1% 3 364 96.6% 1 183 52 278 4419.1%
Dept. agencies & acc. 2 224 524 1 979 744 89.0% 244 775 11.0% 2 224 519 100.0% 2 068 518 436 436 21.1%
Foreign gov & int. org. 1 773 1 772 100.0% - - 1 772 100.0% 1 450 - -
Public corp. & priv. ent 147 812 113 243 76.6% 34 566 23.4% 147 808 100.0% 1 5 604 560386.8%
Non-profit institutions 2 849 1 425 50.0% 1 425 50.0% 2 849 100.0% 3 020 - -
Households 2 981 892 2 372 269 79.6% 609 595 20.4% 2 981 864 100.0% 3 808 508 701 644 18.4%
Buildings & fixed struc 78 971 4 077 5.2% 74 890 94.8% 78 967 100.0% 3 772 10 401 275.7%
Machinery & equip 50 409 38 482 76.3% 10 344 20.5% 48 827 96.9% 37 488 10 659 28.4%
Biological assets 256 256 100.0% - - 256 100.0% - - -
Land & subsoil 47 677 31 875 66.9% 15 800 33.1% 47 675 100.0% - 4 642 -
Software - 1 288 - (1 288) - - - 1 454 - -
Total Total 9 459 740 9 459 740 7 549 543 7 549 543 79.8%79.8% 1 904 513 1 904 513 20.1%20.1% 9 454 056 9 454 056 99.9%99.9% 9 455 305 9 455 305 2 115 704 2 115 704 22.4%22.4%

7
R’000R’000 2013/20142013/2014 2014/20152014/2015
Final Final budgetbudget
Spending Spending end end Q3Q3
% % spentspent
SpendingSpendingfor for Q4Q4
% % spentspent
Total Total spendingspending
% % spentspent
Current Current budgetbudget
Spending Spending end end Q1Q1
% % spentspent
Compensation 532 270 391 892 73.6% 139 342 26.2% 531 233 99.8% 684 696 150 559 22.0%
Goods and services 630 862 477 220 75.6% 153 297 24.3% 630 517 99.9% 442 211 96 089 21.7%
Interest & rent on land - 33 - 1 - 34 - - - -
Payments fin assets - - - 1 235 - 1 235 - - 389 -
Provincial & local gov. 118 9 8.0% 5 3.9% 14 11.9% 121 2 1.5%
Dept. agencies & acc. 5 417 2 402 44.3% 3 015 55.7% 5 416 100.0% 3 402 - -
Public corp. & private entities 51 870 37 352 72.0% 14 517 28.0% 51 869 100.0% - - -
Households 29 363 11 424 38.9% 17 936 61.1% 29 360 100.0% 21 883 10 144 46.4%
Buildings & fixed structure 2 511 1 853 73.8% 657 26.1% 2 509 99.9% 3 500 1 281 36.6%
Machinery & equip 16 142 11 041 68.4% 4 256 26.4% 15 297 94.8% 13 880 5 223 37.6%
Software - 45 - (45) - - - - - -
Total Total 1 268 553 1 268 553 933 269 933 269 73.6%73.6% 334 215 334 215 26.3%26.3% 1 267 484 1 267 484 99.9%99.9% 1 169 693 1 169 693 263 687 263 687 22.5%22.5%
1. Administration1. Administration

8
R’000R’000 2013/20142013/2014 2014/20152014/2015
Final Final budgetbudget
Spending Spending end end Q3Q3
% % spentspent
SpendingSpendingfor for Q4Q4
% % spentspent
Total Total spendingspending
% % spentspent
Current Current budgetbudget
Spending Spending end end Q1Q1
% % spentspent
Compensation 359 463 265 820 73.9% 91 605 25.5% 357 425 99.4% 465 805 98 150 21.1%
Goods and services 170 929 115 206 67.4% 54 814 32.1% 170 019 99.5% 182 296 29 778 16.3%
Interest & rent on land - - - 6 - 6 - - 62 -
Payments fin assets - - - 2 017 - 2 017 - - 5 -
Provincial & local government 13 2 14.3% 1 7.2% 3 21.6% 20 - -
Dept. agencies & acc. 242 209 241 741 99.8% 467 0.2% 242 208 100.0% 113 194 1 903 1.7%
Foreign governments & international org. 1 773 1 772 100.0% - - 1 772 100.0% 1 450 - -
Non-profit institutions 2 849 1 425 50.0% 1 425 50.0% 2 849 100.0% 3 020 - -
Households 2 047 1 607 78.5% 432 21.1% 2 038 99.6% 80 190 237.8%
Machinery & equip 7 923 5 368 67.8% 2 163 27.3% 7 531 95.1% 7 546 619 8.2%
Software - 1 242 - (1 242) - - - 1 454 - -
Total Total 787 206 787 206 634 183 634 183 80.6%80.6% 151 686 151 686 19.3%19.3% 785 869 785 869 99.8%99.8% 774 865 774 865 130 708 130 708 16.9%16.9%
2. Geo-spatial and Cadastral Services2. Geo-spatial and Cadastral Services

9
R’000R’000 2013/20142013/2014 2014/20152014/2015
Final Final budgetbudget
Spending Spending end end Q3Q3
% % spentspent
SpendingSpendingfor for Q4Q4
% % spentspent
Total Total spendingspending
% % spentspent
Current Current budgetbudget
Spending Spending end end Q1Q1
% % spentspent
Compensation 420 834 313 572 74.5% 104 877 24.9% 418 449 99.4% 553 194 114 089 20.6%
Goods and services 833 139 740 594 88.9% 91 238 11.0% 831 833 99.8% 400 782 182 545 45.5%
Interest & rent on land - - - - - - - - 88 -
Payments fin assets - - - 586 - 586 - - - -
Dept. agencies & acc. 265 276 94 056 35.5% 171 218 64.5% 265 274 100.0% - 5 596 -
Public corp. & priv. ent 95 941 75 891 79.1% 20 048 20.9% 95 939 100.0% - 5 604 -
Households 182 2 817 1548.0% (2 639) (1449.9)% 178 98.0% 1 051 608 30 759 2.9%
Buildings & fixed struc 76 460 2 224 2.9% 74 234 97.1% 76 458 100.0% 252 9 120 3619.0%
Machinery & equip 12 672 13 737 108.4% (1 069) (8.4)% 12 668 100.0% 5 783 2 188 37.8%
Biological assets 256 256 100.0% - - 256 100.0% - - -
Total Total 1 704 760 1 704 760 1 243 148 1 243 148 72.9%72.9% 458 494 458 494 26.9%26.9% 1 701 642 1 701 642 99.8%99.8% 2 011 619 2 011 619 349 989 349 989 17.4%17.4%
3. Rural Development3. Rural Development

10
R’000R’000 2013/20142013/2014 2014/20152014/2015
Final Final budgetbudget
Spending Spending end end Q3Q3
% % spentspent
SpendingSpendingfor for Q4Q4
% % spentspent
Total Total spendingspending
% % spentspent
Current Current budgetbudget
Spending Spending end end Q1Q1
% % spentspent
Compensation 222 265 161 233 72.5% 55 681 25.1% 216 914 97.6% 235 977 61 113 25.9%
Goods and services 272 997 205 282 75.2% 65 486 24.0% 270 768 99.2% 124 686 67 490 54.1%
Interest & rent on land - 4 583 - 795 - 5 378 - - 2 201 -
Payments fin assets - 474 - 1 601 - 2 075 - - 10 -
Provincial & local gov. 475 2 0.4% 472 99.3% 474 99.7% 21 1 143 5443.6%
Households 2 288 663 1 900 619 83.0% 388 040 17.0% 2 288 659 100.0% 2 314 679 609 801 26.3%
Machinery & equip 4 761 2 929 61.5% 1 831 38.5% 4 759 100.0% 5 379 1 039 19.3%
Land & subsoil 47 677 31 875 66.9% 15 800 33.1% 47 675 100.0% - 4 642 -
Total Total 2 836 838 2 836 838 2 306 998 2 306 998 81.3%81.3% 529 705 529 705 18.7%18.7% 2 836 703 2 836 703 100.0%100.0% 2 680 742 2 680 742 747 439 747 439 27.9%27.9%
4. Restitution4. Restitution

11
R’000R’000 2013/20142013/2014 2014/20152014/2015
Final Final budgetbudget
Spending Spending end end Q3Q3
% % spentspent
SpendingSpendingfor for Q4Q4
% % spentspent
Total Total spendingspending
% % spentspent
Current Current budgetbudget
Spending Spending end end Q1Q1
% % spentspent
Compensation 235 898 178 367 75.6% 56 913 24.1% 235 280 99.7% 241 257 59 761 24.8%
Goods and services 241 437 149 722 62.0% 91 706 38.0% 241 428 100.0% 199 007 31 656 15.9%
Interest & rent on land - - - 342 - 342 - - 49 -
Payments fin assets - 123 - 491 - 614 - - 6 -
Provincial & local gov. 2 877 978 34.0% 1 895 65.9% 2 874 99.9% 1 021 51 132 5008.1%
Dept. agencies & acc. 1 711 622 1 641 545 95.9% 70 075 4.1% 1 711 621 100.0% 1 951 922 428 937 22.0%
Public corp. & priv. ent 1 - - - - - - 1 - -
Households 661 637 455 802 68.9% 205 827 31.1% 661 629 100.0% 420 258 50 750 12.1%
Buildings & fixed struc - - - - - - - 20 - -
Machinery & equip 8 911 5 407 60.7% 3 164 35.5% 8 571 96.2% 4 900 1 590 32.4%
Total Total 2 862 383 2 862 383 2 431 945 2 431 945 85.0%85.0% 430 414 430 414 15.0%15.0% 2 862 359 2 862 359 100.0%100.0% 2 818 386 2 818 386 623 881 623 881 22.1%22.1%
5. Land Reform5. Land Reform

12
Agricultural Land Agricultural Land Holding AccountHolding Account

Per ProvincePer Province
13
R’000R’000 2013/20142013/2014 2014/20152014/2015
Final Final budgetbudget
Spending Spending end end Q3Q3
% % spentspent
SpendingSpendingfor for Q4Q4
% % spentspent
Total Total spendingspending
% % spentspent
Q1Q1TransferTransfer
SpendingSpendingforforQ1Q1
% % spentspent
Eastern Cape 201 825 88 034 43.6% 113 791 56.4% 201 825 100.0% 67 506 8 944 13.2%
Free State 216 797 198 942 91.8% 17 657 8.1% 216 599 99.9% 113 471 5 610 4.9%
Gauteng 134 066 104 565 78.0% 29 501 22.0% 134 066 100.0% 39 882 6 741 16.9%
KwaZulu-Natal 238 771 174 079 72.9% 64 692 27.1% 238 771 100.0% 36 000 38 769 107.7%
Limpopo 192 038 182 124 94.8% 9 914 5.2% 192 038 100.0% 11 764 2 015 17.1%
Mpumalanga 323 301 290 375 89.8% 32 926 10.2% 323 301 100.0% 46 820 20 984 44.8%
Northern Cape 96 245 89 432 92.9% 4 813 7.1% 96 245 100.0% 28 112 2 772 9.9%
North West 242 067 187 108 77.3% 54 959 22.7% 242 067 100.0% 66 695 73 320 109.9%
Western Cape 52 009 31 940 61.4% 20 069 38.6% 52 009 100.0% 18 687 1 026 5.5%
Total Total 1 697 119 1 697 119 1 346 599 1 346 599 79.3%79.3% 348 322 348 322 20.6%20.6% 1 696 921 1 696 921 100.0%100.0% 428 937 428 937 160 181 160 181 37.3%37.3%
The total 2014/2015 ENE allocation for transfer to ALHA amounts to R1.9 billion and is transferred quarterly at the beginning of each quarter.

14
Deeds Registration Deeds Registration Trading AccountTrading Account

15
R’000R’000 2013/20142013/2014 2014/20152014/2015
Final Final budgetbudget
Spending Spending end end Q3Q3
% % spentspent
SpendingSpendingfor for Q4Q4
% % spentspent
Total Total spendingspending
% % spentspent
Current Current budgetbudget
Spending Spending end end Q1Q1
% % spentspent
Total RevenueTotal Revenue (559 695)(559 695) (640 738)(640 738) 114.5%114.5% 40 858 40 858 (7.3)%(7.3)% (599 880)(599 880) 107.2%107.2% (613 994)(613 994) (127 222)(127 222) 20.7%20.7%
Compensation 353 969 257 994 72.9% 90 202 25.5% 348 196 98.4% 463 970 97 757 21.1%
Goods and services 205 420 167 921 81.7% (22 804) (11.1)% 145 117 70.6% 262 710 15 048 5.7%
Total current spendingTotal current spending 559 389 559 389 425 915 425 915 76.1%76.1% 67 398 67 398 0.0%0.0% 493 313 493 313 88.2%88.2% 726 680 726 680 112 805 112 805 15.5%15.5%
Buildings & fixed structure 580 - - - - - - 10 540 380 3.6%
Machinery & equipment 34 766 2 876 8.3% 217 0.6% 3 093 8.9% 133 001 - -
Total assetsTotal assets 35 346 35 346 2 876 2 876 8.1%8.1% 217 217 -- 3 093 3 093 8.8%8.8% 143 541 143 541 380 380 0.3%0.3%
TotalTotal 594 735 594 735 428 791 428 791 72.1%72.1% 67 615 67 615 -- 496 406 496 406 83.5%83.5% 870 221 870 221 113 185 113 185 13.0%13.0%
(Surplus) / Deficit(Surplus) / Deficit (306)(306) (214 823)(214 823) - - 108 256 108 256 - - (106 567)(106 567) - - 112 686 112 686 (14 417)(14 417) - -
Per Economic ClassificationPer Economic Classification

16
KwaZulu-NatalKwaZulu-Natal
Ingonyama Trust BoardIngonyama Trust Board
17
Per Economic ClassificationPer Economic ClassificationR’000R’000 2013/20142013/2014 2014/20152014/2015
Final Final budgetbudget
Spending Spending end end Q3Q3
% % spentspent
SpendingSpendingfor for Q4Q4
% % spentspent
Total Total spendingspending
% % spentspent
Current Current budgetbudget
Spending Spending end end Q1Q1
% % spentspent
Compensation 15 000 10 407 69.4% 4 199 27.99% 14 606 97.37% 16 717 4 301 25.7%
Goods and services 57 111 67 138 117.6% 23 393 40.96% 90 531 158.52% 40 785 3 346 8.2%
Interest & rent on land 190 135 71.1% 47 24.47% 182 95.53% 200 50 24.8%
Buildings & fixed structure 750 1 946 259.5% 613 81.74% 2 559 341.19% 3 000 739 24.6%
Machinery & equip 4 050 3 499 86.4% 523 12.90% 4 022 99.30% 1 500 217 14.5%
Software 200 - 0.0% 196 97.88% 196 97.88% 500 - 0.0%
Total Total 77 301 77 301 83 126 83 126 107.5%107.5% 28 970 28 970 37.5%37.5% 112 095 112 095 145.0%145.0% 62 702 62 702 8 653 8 653 13.8%13.8%

Thank YouThank You
18