financial projection based on business model canvas computer
TRANSCRIPT

Financial Projection Based on Business Model Canvas
Diogo Miguel Ferreira de Jesus
Dissertation for the degree of Master in
Computer Engineering and Information Systems
Jury
President: Professor Luis Eduardo Teixeira Rodrigues
Supervisor: Professor Miguel Leitão Bignolas Mira da Silva
Co-Supervisor: Professor Artur Miguel Pereira Alves Caetano
Members: Professor José Luis Brinquete Borbinha
November 2012


i
Acknowledgements
First of all, I would like to thanks to Professor Miguel Mira da Silva by the help, guidance and
availability during the last year.
I also like to thanks to my family and friends for the support during the realization of this master thesis.
Besides this last year, I would also like to thank everyone for their support along my academic career.

ii
Resumo
A era digital mudou a forma como as pessoas pensam e fazem negócios. Com esta (rev-) evolução
nasceram novos conceitos, entre eles os novos modelos de negócio digitais que podem ser definidos como uma
organização cria, entrega e captura valor. Este conceito leva-nos para o tema da modelação financeira, para
representar e fazer projeções financeiras dentro dos modelos de negócio. Combinando estes dois conceitos, nós
argumentamos que ambos os conceitos são inseparáveis e que uma boa projeção financeira leva-nos a um
modelo de negócio mais concreto e realista. Contudo, quase nenhum modelo se foca nesta relação, em
particular o business model canvas. Para tentar resolver este problema, esta tese propõe uma extensão
financeira a esta framework.
Palavras-chave: modelo de negócio canvas, projeções financeiras, modelação.

iii
Abstract
The digital era changes how people think about commerce and the way of doing business. With this (re-)
evolution born new concepts and among them are new digital business models that can be defined as how an
organization creates, delivers and captures value. This concept takes us to the financial modelling theme, in order
to represent and make financial projections inside business models. Combining this two concepts, we argue that
this concepts are inseparable and a good financial projection leads us to a more concrete and realistic business
model. However, almost any model focuses in this relation, particularly business model canvas. In order to trying
to solve this problem this thesis proposes a financial analysis extension to this framework.
Keywords: business model canvas, financial projections, modeling.


v
Table of contents
Acknowledgements _________________________________________________________________ i
Resumo _________________________________________________________________________ iii
Abstract _________________________________________________________________________ v
Figures Index ____________________________________________________________________ ix
Tables Index _____________________________________________________________________ xi
Acronyms ______________________________________________________________________ xiii
1 INTRODUCTION ................................................................................................................................ 3
1.1 RESEARCH METHODOLOGY .................................................................................................................... 4
2 RELATED WORK ................................................................................................................................ 7
2.1 DIGITAL BUSINESS MODELS HISTORY ....................................................................................................... 7
2.2 BUSINESS MODELS ............................................................................................................................... 8
2.3 BUSINESS MODEL CANVAS .................................................................................................................. 10
2.3.1 Business Model Canvas Building Blocks ................................................................................ 10
2.3.2 iTunes example ..................................................................................................................... 13
2.4 PROFIT AND LOSS STATEMENT .............................................................................................................. 14
2.5 COSTUMER DEVELOPMENT FRAMEWORK ............................................................................................... 15
2.6 SOFTWARE TOOLS .............................................................................................................................. 17
2.6.1 LeanLaunchLab ..................................................................................................................... 17
2.6.2 Strategyzer ............................................................................................................................ 18
3 PROBLEM........................................................................................................................................ 19
3.1 FINANCIAL MODEL UNEXPLORED .......................................................................................................... 20
3.2 LACK OF EVOLUTIONARY VIEW .............................................................................................................. 21
3.3 LACK OF STRATEGICAL ANALYSIS ........................................................................................................... 21
4 PROPOSAL ...................................................................................................................................... 23
4.1 FINANCIAL ANALYSIS PROJECTION ......................................................................................................... 24
4.2 EVOLUTIONARY VIEW ......................................................................................................................... 26
5 PROTOTYPE .................................................................................................................................... 29
5.1 ITUNES EXAMPLE ............................................................................................................................... 29
6 DEMONSTRATION .......................................................................................................................... 33

vi
6.1 OOPS!BOOKING ................................................................................................................................. 34
6.2 ITIL MATURITY MODELS ..................................................................................................................... 36
6.3 PORTAL DOS SERVIÇOS ........................................................................................................................ 39
6.4 LAURUS LIVING.................................................................................................................................. 44
6.5 TRACK STUDENT ................................................................................................................................ 49
6.6 INTERNS4U ....................................................................................................................................... 53
7 EVALUATION .................................................................................................................................. 59
7.1 BUSINESS MODELING OF PRE-ESTABLISHED COMPANIES ........................................................................... 59
7.2 BUSINESS MODEL CHANGE BASED ON FINANCIAL CONCLUSIONS ................................................................ 60
7.3 EXPERTS EVALUATION ......................................................................................................................... 65
8 CONCLUSION .................................................................................................................................. 67
REFERENCES ........................................................................................................................................... 69

1
Figures Index
FIGURE 1 DESIGN SCIENCE RESEARCH PROCESS MODEL [11]. ............................................................................... 5
FIGURE 2 BUSINESS MODEL CANVAS. .................................................................................................................. 10
FIGURE 3 ITUNES BUSINESS MODEL. .................................................................................................................... 14
FIGURE 4 PROFIT AND LOSS EXAMPLE. ................................................................................................................ 15
FIGURE 5 VISUAL REPRESENTATION OF CUSTOMER DEVELOPMENT MODEL [9]. ............................................... 17
FIGURE 6 GRAPHICAL EXPLANATION OF ATTACHMENT NUMBER TO BUSINESS MODEL CANVAS ELEMENTS. ... 24
FIGURE 7 ILLUSTRATIVE EXAMPLE OF THE PROPOSAL FOR THE EVOLUTIONARY VIEW (ADAPTED FROM [4]). .. 26
FIGURE 8 EXAMPLE OF ITUNES IN THE PROTOTYPE. ............................................................................................ 30
FIGURE 9 ITUNES P&L RESULTS. ........................................................................................................................... 30
FIGURE 10 ITUNES P&L FINANCIAL ANALYSIS....................................................................................................... 31
FIGURE 11 OOPS!BOOKING BUSINESS MODEL. .................................................................................................... 34
FIGURE 13 OOPS!BOOKING FINANCIAL ANALYSIS. ............................................................................................... 35
FIGURE 12 OOPS!BOOKING P&L RESULTS. ........................................................................................................... 35
FIGURE 14 ITIL MATURITY BUSINESS MODEL. ...................................................................................................... 36
FIGURE 15 ITIL MATURITY P&L RESULTS. ............................................................................................................. 37
FIGURE 16 ITIL MATURITY FINANCIAL ANALYSES. ................................................................................................ 38
FIGURE 17 PORTAL DE SERVIÇOS INITIAL BUSINESS MODEL. ............................................................................... 39
FIGURE 18 PORTAL DE SERVIÇOS P&L RESULTS. .................................................................................................. 40
FIGURE 19 PORTAL DE SERVIÇOS INITIAL FINANCIAL ANALYSIS. .......................................................................... 41
FIGURE 20 PORTAL DE SERVIÇOS FINAL BUSINESS MODEL. ................................................................................. 42
FIGURE 21 PORTAL DE SERVIÇOS FINAL P&L. ....................................................................................................... 42
FIGURE 22 PORTAL DE SERVIÇOS FINAL FINANCIAL ANALYSIS. ............................................................................ 43
FIGURE 23 LAURUS LIVING INITIAL BUSINESS MODEL. ........................................................................................ 44
FIGURE 24 LAURUS LIVING INITIAL P&L RESULTS. ................................................................................................ 45
FIGURE 25 LAURUS LIVING INITIAL FINANCIAL ANALYSES. .................................................................................. 46
FIGURE 26 LAURUS LIVING FINAL BUSINESS MODEL. .......................................................................................... 47
FIGURE 27 LAURUS LIVING FINAL P&L RESULTS. .................................................................................................. 47
FIGURE 28 LAURUS LIVING FINAL FINANCIAL ANALYSES...................................................................................... 48
FIGURE 29 TRACK STUDENT INITIAL BUSINESS MODEL. ....................................................................................... 49
FIGURE 30 TRACK STUDENT P&L RESULTS (FOR INITIAL BUSINESS MODEL). ....................................................... 50
FIGURE 31 TRACK STUDENT FINANCIAL RESULTS (FOR INITIAL BUSINESS MODEL). ............................................ 50
FIGURE 32 TRACK STUDENT FINAL BUSINESS MODEL. ......................................................................................... 51
FIGURE 33 TRACK STUDENT P&L RESULTS (FOR FINAL BUSINESS MODEL). ......................................................... 51
FIGURE 34 TRACK STUDENT FINANCIAL RESULTS (FOR FINAL BUSINESS MODEL). .............................................. 52
FIGURE 35 INTERNS4U INITIAL BUSINESS MODEL. ............................................................................................... 53

2
FIGURE 36 INTERNS4U P&L RESULTS (FOR INITIAL BUSINESS MODEL). ............................................................... 54
FIGURE 37 INTERNS4U FINANCIAL RESULTS (FOR INITIAL BUSINESS MODEL). .................................................... 55
FIGURE 38 INTERNS4U FINAL BUSINESS MODEL. ................................................................................................. 56
FIGURE 39 INTERNS4U P&L RESULTS (FOR FINAL BUSINESS MODEL). ................................................................. 56
FIGURE 40 INTERNS4U FINANCIAL RESULTS (FOR FINAL BUSINESS MODEL). ...................................................... 57
FIGURE 41 DIFFERENCE BETWEEN INITIAL AND FINAL PORTAL DOS SERVIÇOS BUSINESS MODEL. .................... 61
FIGURE 42 DIFFERENCE BETWEEN INITIAL AND FINAL LAURUS LIVING’S BUSINESS MODEL. .............................. 62
FIGURE 43 DIFFERENCE BETWEEN INITIAL AND FINAL TRACK STUDENT’S BUSINESS MODEL. ............................ 63
FIGURE 44 DIFFERENCE BETWEEN INITIAL AND FINAL INTERNS4U’S BUSINESS MODEL. .................................... 64
3
1 Introduction
Business is always changing and one of the biggest changes in recent years came with the advent of
several new digital businesses. The new digital business firm is defined as an organization “that
derives a significant portion (at least 10%) of its revenues from transactions conducted over the
Internet” [1]. This evolution requires a change on how people think about commerce, companies and
the way of doing business (particularly processes and channels).
With those changes, the importance of IT (Information Technology) in business is strongly increased.
To understand it is important to define the capabilities that IT can bring to organizations.
The identified capabilities are the following [2]:
Expanded capability because digital business is by definition online and will therefore, place
greater demands on the IT infrastructure;
Stronger gravity (meaning, infrastructure drops from business-unit to firm-wide provision) to
garner potential economies of scope and scale;
Greater externally (meaning, looking outward more often), due to the increased demand for and
supply of commodity IT services;
Increased cooperation within industries to gain potential economies of scale.
Business model term does not have a generally accepted definition. This term is relatively new and it
leads to “diversity in the available definitions poses substantive challenges for delimiting the nature
and components of a model” [3]. Despite the definition is not consensual among all authors (this
subject will be addressed in the Related Work section) it can be defined as “a business model
describes the rationale of how an organization creates, delivers and captures value” [4]. In other
words, with this definition we are principally concerned about how our firm makes money.
Financial modeling is defined as a “representation in mathematical terms the relationships among the
variables of a financial problem so that it can be used to (…) make projections” [5]. This concept was
born “to support management decision making” [6]. Basically, “modeling is a proven and well-
accepted engineering technique” [7] that is a “simplification of reality” [7], that when correctly applied
is able to “build models of complex systems that we cannot comprehend such a system in its entirety”
[7] to “better understand the system” [7]. When this concept is applied to financial area, help us
understand the financial part.
Relating both previous concepts, we are reaching the problem that this thesis aims to solve: the lack
of modeling an accurate financial analysis in business model. This is particularly important problem
because “in all businesses in the United States one fourth is one year old or less, and the median age

4
of all firms is about seven years” [8]. If we focus on the life expectancy of these firms just “fifty four
percent survives one year and half” and “one quarter survive six years” [8]. In terms of new
products/services launched by existing firms, nine out of ten fail [9].
To address the problem this thesis proposes an extension of the canvas framework with a financial
analysis [10]. With this approach we have a business model of a firm with a financial profitability
projection.
This thesis was demonstrated with six different case studies that consisted in modeling six different
digital business firms‟ organizations. The evaluation was performed using the received feedback from
one partner of each organization and an interview realized to three different specialists. The reached
main conclusions are the following ones:
The financial analysis and business model concepts are not separable and we should not think
them separately. When we compare this proposal with the canvas, we understand that we can
have a great business model, but we do not know if it will be profitable;
The quantification of the elements presents in a business model helps design it. If we are at one
brainstorming group discussing the ideal business model for a company, and we need to
quantify elements, we understand that with this quantification we will produce a business model
closer to reality.
Additionally is important to refer that a paper which summarizes the whole work developed in this
thesis was accepted on International Business Information Management Association (IBIMA) that
occurs between 12th and 13th of November in Barcelona.
This thesis is organized in eight sections; they are: introduction (Section 1): introduces the concept
and summarizes the thesis as a whole; related work (Section 2): explains the context; problem
(Section 3): identifies the problem this paper wants to solve; proposal (Section 4): explains the
proposal for the already identified problem; prototype (Section 5): is a real materialization of the
proposal; results (Section 6): demonstrates an application of the proposal in several case-studies;
evaluation (Section 7): evaluates the proposal; conclusion (Section 8): aims at extracting the main
conclusions of the proposal‟s application.
1.1 Research Methodology
The chosen research methodology for this thesis is Design Science Research Methodology (DSRM).
Historically, the DSRM born from the necessity of create a scientifically accepted framework for
research in Information Systems (IS). This necessity has foundations in fact that IS is an “applied
research discipline, in the sense that we frequently apply theory from other disciplines, such as
economics, computer science, and the social sciences, to solve problems at the intersection of IT and
organizations” [11]. This approach is “rather than justifying the research paradigm on an ad hoc basis
with each new paper” [11].

5
The mainly objective of the creation of this methodology is not only the creation of a mental process
that allows to produce more rigorous scientific works, but also allows the creation of a mental model
that enables the researchers to better communicate. Without this evolution, “IS research faces the
potential of losing influence” [11].
Figure 1 Design Science Research Process Model [11].
The figure above graphically describes the whole research process. As can be seen, it has six
different activities that are the following ones [11]:
Identify problem and motivate. In this step is necessary identify the problem and justify
its importance, as well as motivated the audience for it;
Define objectives of a solution. Define the objectives of the solution from problem
definition and the knowledge about what is possible and feasible or not;
Design and development. This step has as main objective the construction of the
artifact. The artifact is any designed object in which a research contribution is embedded
in the design;
Demonstration. This step as has main objective the use of artifact in order to
demonstrate that it solves one or more instances of the problem;
Evaluation. This step as has main objective prove the effectiveness of the solution. Is
important to measure this step in order to justify that the artifact really supports a solution
for the identified problem; and
Communication. Communicate all important achievements of the research as well as
the problem, solution and artifact;
Adapting this research methodology to this thesis, the artifact is the extended business model canvas,
the demonstration was realized using six different organizations and the evaluation was performed

6
using interviews to the partners of the companies used on demonstration and with two specialists of
the business models subject.

7
2 Related Work
The related work section is organized by decreasing importance order and is divided in five
subsections, which represents the most important contributions for this work, which are the following
ones:
Digital Business Models History. The digital business models history finds a relation between
two different (but complementary worlds): the digital influence of the way of doing business.
Nowadays these two different expertise areas are closely related because technology
changes the way of doing and thinking about business. On other hand, the technology
adapted itself to meet the new business requirements and to add value to the organizations;
Business Model. “The reason that many organizations failed is that they have no idea of what
they wanted to accomplish”. Following this line of reasoning, “This brought the concept of the
business model to the center attention, and research into this subject has become topical and
relevant”. The fact is that “the lack of effective business models has been a pervasive
problem in starting Internet business” [12];
Canvas Framework. It is the second main contribution for the developed work. Consequently,
to try to solve the identified problem. This is the language used to modeling a firm Business
Model. It is the framework that will be extended in this work, so it can be considered the
“basis” of all developed work;
Profit and Loss Statement. This statement is used to indicate how the revenue (the direct
earnings on sales) is transformed into net income (when all earnings and all expenses are
taken into account). This financial indicator is very helpful and is important to “specialize” the
“financial part” (cost structure and revenue streams) of Canvas Framework;
Customer Development Framework. It is helpful to understand what steps a firm needs to
accomplish to launch a new product/service. This contribute is not direct, but it is very helpful
to fulfill the Canvas Framework; and
Important related applications. This subsection has as main objective give an overview about
important applications that actually exists in the market.
2.1 Digital Business Models History
Digital business is a direct consequence from “the shift that the business world experienced from the
traditional way of doing business to the new way of digital business, which is engulfed with high-level
of complexity and rapid change” [13]. This term can be defined as “the carrying out of business
activities that led to an exchange of value, where the parties interact electronically, using network or
telecommunications technologies” [13].
Is important to understand that this definition includes information (that has no market value per se),
and not only goods and services [13]. The information concept is central is this new digital way of

8
doing business whether we are talking about the way it is processed or managed (here can be our
competitive advantage to our competitors).
The evolution of the way of doing business needs to be viewed in an evolutionary context because
the customer needs change and service providers have to be adapted. This adaptation, in the current
environment means that the providers need to be technological adapted. As [14] says: “technology
changes, economic laws do not”. However, [15] suggests that for e-business not only are new rules
valid, but many old rules are still applicable. For example, as [16] supports the idea that the most
important rule in new business models is that in value chains and dynamic markets the physical
location („place‟) is no longer so relevant nowadays. It means that the evolution of technology
potentiates the evolution of business and both evolve together.
2.2 Business Models
The term „Business Model‟ despite widely used, doesn‟t have a definition unanimously accepted in the
scientific community and in business environment in general. Using a top-down approach that is,
starting of one more general definition to one more specific one, this concept “at its heart performs
two important functions: value creation and value capture” [17]. This discussion will be separated in
three different parts: the classification, the components and the definitions of Business Model.
From the Business Model classification point of view, despite some authors do not consider the
importance of this separation because “they do not help us to understand the causal mechanisms that
can explain the success of specific business model” [18] we will classify them in two categories [19]:
The revenue model, which refers to the specific manner in which an organization/network is
able to generate income;
The integrated model, which refers to the strategy and the configuration of the organization
and/or the network, design to exploit business opportunities.
This separation of the business model concept into two distinct categories: one more centered in the
organization inside, other more concerned about the strategy, the network and the environment itself,
is important to discuss what components will be presented in our business model. Once more this
division is not consensual and it‟s strongly dependent from the classification described above. If we
try to design a business model more in terms of our value network, these components will be helpful
[20]:
Mission. Determining the overall vision, strategic objectives and value proposition, as well as
the basic features of a product or service;
Structure. This has to do with the actors and the role they play within specific business
environment (a value chain or web), the specific market segments, customers and products;

9
Process. The concrete translation of the mission and the structure of the business model into
more operational terms; and
Revenues. The investments needed in the medium and long-term, cost structures and
revenues.
On the other hand, if we try to design a business model more in therms of the organization itself, it‟s
important to take a closer look at these components [21]:
Product innovation and the implicit value proposition;
Customer management, including the description of the target customer, channels, customer
relations;
Infrastructure management, the capabilities and resources, value configuration, web or
network, partnerships; and
Financial aspects, the revenue models, cost structure and profit.
Since we organized the business model concept into two different categories and described briefly the
type of components that may be part of business model design, it is imperative to define precisely the
business model term. To define the referred term is important to look out for various definitions, from
many authors and then, adopt one of those. Following the historical timeline, for [15] the concept is
defined as “an architecture for the product, service and information flows, including a description of
the various business actors and their roles, a description of potential benefits for the various business
actors, and a description of the sources of revenues”. Later, the term was defined as “A blueprint for
how a network of organizations co-operates in creating and capturing value from technological
innovation” [22]. As for the author [23] the concept is “a Business Model describes the way a
company or network of companies aims to make money and create customer value” which evolved
his theory some years later to “a Business Model is a blueprint for a service to be delivered describing
the service definition and the intended value for the target group, the sources of revenue, and
providing an architecture for the service delivery, including a description of the resources required,
and the organizational and financial arrangements between the involved business actors, including a
description of their roles and the division of costs and revenues over the business actors” [18].
The definition of the term adopted by this document and the definition that must be present in the rest
of this document is the follows: “a business model describes the rationale of how an organization
creates, delivers and captures value” [4]. This definition does not consider the strategical issue, but
focuses on the company: it is more related with the “revenue model” classification described above.
Table 1 Research about the term "Business Model"
in Google [19].
May 2000 107 000

10
June 2004 2 130 000
July 2006 602 000 000
2.3 Business Model Canvas
The Canvas Framework is one of the most important related works of this document, in the sense that
is the foundation of the model to be proposed later on. It was developed by [4] based on his Ph.D.
thesis in Lausanne University (Swizerland). Basically the Canvas Framework is “a shared language
that allows you to easily describe and manipulate business models to create new strategic
alternatives”. It is divided in nine building blocks “that show the logic of how a company intends to
make money” [4]. His work is very useful and valuable because with this language, it describes
Business Model in a very intuitive, simple way to use and easily understandable.
Figure 2 Business Model Canvas.
Following are described the nine building blocks of Canvas Framework: Customer Segments,
Customer Relationships, Channels, Value Proposition, Key Activities, Key Resources, Key Partners,
Cost Structure and Revenue Streams. Each building block is responsible for answering to a set of
questions like it is shown below.
2.3.1 Business Model Canvas Building Blocks
Customers, or Customer Segments are the central part of every organization. Consequently, of
every Business Model. As [4] says customers are the “heart” of every Business Model. He groups
them in segments to better identify their needs, behaviours and attributes. Is a central task of every
Business Model designing, think about whom will buy the product/service that one specific
organization offers. Basically, the advantage of a clear definition of Customer Segments is the “strong
understanding of specific customer needs”.

11
This building block is responsible for answering this set of questions [4]:
For whom are we creating value?
Who are our most important customers?
The channel is “how a company communicates with and reaches its Customer Segments to deliver a
Value Proposition” [4]. Succinctly is the bridge between the Customer Segments and the Value
Proposition. This building block is critical because one Organization can have the Customer
Segments well defined and have a valuable Value Proposition for the right segment: but simply is not
able to reach them.
This building block is responsible for answering this set of questions [4]:
Through which Channels do our Customer Segments want to be reached?
How are we reaching them now?
How are our Channels integrated?
Which ones work best?
Which ones are most cost-efficient?
How are we integrating them with customer routines?
Every customer needs a reason to choose one Organization above other: and in first approach it can
be because the preferred one has one Value Proposition better, or more related with customer needs.
However, the customers need a reason to continually opt by the same Organization (and nowadays is
almost impossible to not have competition): and this reason is given by Customer Relationships.
Basically this building block “describes the types of relationships a company establishes with specific
Customer Segments” [4].
This building block is responsible for answering this set of questions [4]:
What type of relationship does each of our Customer Segments expect us to establish and
maintain with them?
Which ones have we established?
How costly are they?
How are they integrated with the rest of our Business Model?
The value proposition is what the Organization offers, whether is a product or a service. This is
fundamental for every Organization: “it solves a problem or satisfies a customer needs”. In
comparative terms with other companies this building block is very important too: “is that reason why
customers turn to one company over another” [4]. The relation with other blocks is very important,
particularly with Customer Segments: is recommended that each Customer Segment has one Value
Proposition different from each other.
This building block is responsable for answering this set of questions [4]:

12
What value do we deliver to the customer?
Which one of our customers‟ problems are we helping to solve?
Which customer needs are we satisfying?
What bundles of products and services are we offering to each Customer Segment?
Revenue Streams is one of two building blocks that are in the bottom of the model, and here are the
explanations for it: the revenue streams block “represents the cash a company generates from each
Customer Segments”, that is, in other words, the result of interaction between the Customer Sements
and Value Propostion blocks. This block maps all of right side of Canvas Framework: the customers
need a channel to reach the product/service of the company, and between them a Customer
Relationship was born. This sentence explicits how a company makes money. Basically “if customers
comprise the heart of a business model, Revenue Streams are its arteries” [4]. This block is very
important to do a traceability of other building blocks.
This building block is responsable for answering this set of questions [4]:
For what value are our customers really willing to pay?
For what do they currently pay?
How are they currently paying?
How would they prefer to pay?
How much does each Revenue Stream contribute to overall revenues?
Key Activities represents the processes that the company needs to perform to make its business
work. These activities are transverse to all of the other blocks and are a fundamental part of what
organization does every day. For simplicity of the model is important to just represent here the most
important activities (each one that produces value for the customer) and doesn‟t represent the internal
processes of the company (the called “management and support processes”).
This building block is responsable for answering this set of questions [4]:
What Key activities do our Value Propositions require?
Our Distribution Channels?
Customer Relationships?
Revenue Streams?
Key Resources represents all important resources of the company. These resources can be
transverse to all Organizations, but this block is very dependent of the type of business that the
company is inserted. In a global perspective “Key Resources can be physical, financial, intellectual, or
human” [4].
This building block is responsable for answering this set of questions [4]:
What Key Resources do our Value Proposition require?

13
Our Distribution Channels?
Customer Relationships?
Revenue Streams?
Key Partners gives the concept of value network and strategy to the model, in the sense that refers
external entities of the company. There is the „space‟ to represent all the synergies that are important:
“Building Block describes the network of suppliers and partners that make the business model work”
[4]. In the great majority of the cases, this block has a strongly relationship with Key Resources and
Key Activities blocks because usually the partners perform activities related to outsourcing.
This building block is responsable for answering this set of questions [4]:
Who are our Key Partners?
Who are our Key Suppliers?
Which Key Resources are we acquiring from partners?
Which Key Activities do partners perform?
Cost Structure block is for Key Resources, Key Activities and Key Partnerships as Revenue Streams
is for other blocks. The meaning of this block is “describes all costs incurred to operate business
model” [4].
This building block is responsable for answering this set of questions [4]:
What are the most important costs inherent in our business model?
Which Key Resources are most expensive?
Which Key Activities are most expensive?
2.3.2 iTunes example
Following is showed one concrete usage of the described framework:

14
Figure 3 iTunes Business Model.
Doing an analysis of this model is important to refer two fundamental points:
The lack of a financial details in the model (it is very useful for business model trace of a firm,
but it is inaccurate from the financial point of view);
The lack of conclusions (the model is useful to think about the business model of the firm but
is very difficult to answer a simple question: this business model will be lucrative or not?)
Despite these considerations this model is the best one in the business model area, is well structured
and is relatively easy to fulfill (is more complicated to take conclusions from it). Another important
point is that this model offers a good global view of a firm.
2.4 Profit and Loss Statement
The Profit and Loss Statement (P&L), or Income Statement, “reflects the effect of management‟s
operating decisions on business performance and the resulting accounting profit or loss for the
owners of the business over a specified period of time” [10]. It is a high-level approach to the financial
issues of a company: gives a clear idea, without going into details, whether the Organization makes or
loses money in a specified period of time. It is a fundamental difference to the economical elements
because most of them represent a single period in time. The fact of the P&L is a high-level tool, when
used correctly “can stimulate questions about the effectiveness of management strategies as well as
the quality of operational decisions” [10].
The model compromises a set of financial items that can be described as below [10]:
Revenues: the expected revenue for the product/service sold by the company;
Cost of Sales: the expected direct cost of producing the product/service that company
provides;

15
Gross Margin: the revenues less cost of sales. This is one high-level indicator about the
earnings of the company;
Operating Expenses: the expenses that the company needs to work every day;
Operating Earnings/Loss: the gross margin less operating expenses. This indicator is
closer to reality;
Income Taxes: the taxes that company needs to pay. This item depends on which country
the company establishes their activity;
Net Profit or Loss: the operating earnings/loss less income taxes. This item is the closest
item to the reality of the P&L. Basically is an important indicator for investors and for
partners.
To illustrate the above explanations, the figure below summarizes this information and gives a
concrete example (with the values: revenues = 1000€, cost of sales = 500€, operating expenses =
200€ and income taxes = 120€):
This model is designed to make previsions and to help investors to decide about the earnings
prospects of any company. However, this has one problem as any model/frameworks that want to
make previsions: it depends on estimates. It is very important to consider that the results provided by
this method should be interpreted with some degrees of freedom, to predict future failures.
2.5 Costumer Development Framework
The Customer Development Framework is a proposal of a process to create a product/service
centered in the customer proposed by Steve Blank. This work presentation is based on two steps (like
the book itself): describing the traditional phases of product development model and its problems and
then propose the customer development model.
Figure 4 Profit and Loss example.

16
For [6] when one company prepares its product/service there are several things that it needs to take
in account. First, and the most important, the product/service is not an end in itself: is important to
have someone who will need it, and then, will pay for it. This is, particularly, the most important
conclusion of Steve Blank‟s work, and the most important contribute for this document and the reason
that is related work. Basically, and relating the contribution of Customer Development Framework for
the work presented in this document, it helps to understand that we can have a well-structured
business model, but it is not an end on itself: is important to make sure that someone will pay for the
product/service that the company wants to offer. The following description of this related work follows
the structure of [9].
Nowadays, the traditional way of building a new product/service has the following steps [9]:
Conception/Seed: when the company has the idea and thinks about how to build it;
Product Development: the respective departments go to theirs “virtual corners” work. The
company starts to specializing itself;
Alpha/Beta tests: the engineering does some user groups test;
Launch/First Sell: the focus of entire process. The company realizes it first sell.
However, this set of steps, despite the fact of being the usually process that companies follow, has a
lot of questions that aren´t answered, or the answer come too late (when the companies have
committed to a specific path, product and plan). These questions are an important contribute for this
document because they are centered in a fundamental part of every company and consequently in a
central part of every business model: the customers. The questions which this process doesn‟t
answer (which in practice represents a problem/limitation) are the following [9]:
Where is our market?
Who are our customers?
How do we build the right team?
How do we scale the sells?
Is easy to conclude that the usual process to launch a product/service forgets the most important
thing of all: the clients. To answer these questions, or better, to suppress the failures that this model
presents, Steve Blank build a process that is called “Customer Development Framework”, and its
principal phases are the following ones [9]:
Customer Discover: find who are the company customers for the product/service and if that
value proposition will solve some important problem for them;
Customer Validation: verify if the customer segment identified in the last step really exists;
Customer Creation: create final customers search and reach them by the company selling
channels; and
Company Criation: transition departments from informal to formal.

17
Figure 5 Visual representation of Customer Development Model [9].
This process, rather than the previous and the traditional one, allows any company to perceive it has
or not clients for the proposed product/service.
2.6 Software Tools
Over last year, business model canvas has been the target for some computer applications and
extensions. This is the result of the growing importance of this framework in the scientific community.
From all these applications there are two particularly interesting: LeanLaunchLab [24] and
Strategyzer [25].
2.6.1 LeanLaunchLab
LeanLaunchLab is a web-based application that is not centered on the business model canvas itself,
it is more focused on the theory of customer discovery and the process of setting up a business. This
application is a merger between the canvas and the Steve Blank theory (customer development
framework) and basically is a platform that provides guidance to company creation.
This application is divided in five different (but inter-related) parts:
Canvas. This is the first part of the LeanLaunchLab and is a simple business model
canvas as defined by Osterwalder. It resumes the information present in the platform in a
graphical form;
The Plan. It resumes the plan of action to understand customers‟ needs. This part is sub-
divided in three different subcategories that represents the state of each action:
o “To do” that represents what is scheduled, but has not been begun;
o “In progress” that is what is being executed;
o “Done” that represents what is already finished.
Each action is divided in four steps and represents a hypothesis that the user wants
to test:
o Step 1: hypothesis formulation;
o Step 2: the description of what experiments will be made;
o Step 3: the metrics that will measure the experiment;

18
o Step 4: definition of each activity will be performed into the context of this
hypothesis;
Tasks. This step serves to manage each activity described in step four of the plan. The
tasks that are present in this part are associated to one action that is in “To Do” state.
There are two types of tasks: one which are performed or not;
Interviews. LeanLaunchLab assumes that interviews are a unique valid form of test a
hypothesis. Thus, this part helps to manage the necessary interviews to prove a
particular hypothesis; and
Journal. An important part of the company creation process is the communication. This
part is not more than a blog that user can manage to communicate with others to publish
their achievements.
Despite the usefulness of this platform, it not solves the problem of this thesis because it not provides
any financial information about the future company. For instance, is possible with this approach have
a good business idea, a good customer acceptance (prove the majority of the hypothesis) and that
company become unprofitable because it has never been proved that even customers buying, it will
be lucrative. However, this is a very good approach that could be used simultaneously with other
tools.
2.6.2 Strategyzer
Strategyzer is a web-based application that provides to the user a very intuitive interface to fill the
business model canvas. This interface is loyal to the interface of [4] that uses post-it notes to
complete the model. This platform allows associating a number (quantification) of each element of
each building block. The main features of Strategyzer are the following ones:
Rapidly sketch out business ideas with the business model canvas;
Collaborate on business models together with your team, clients, board, or anyone else; and
Test the numbers and quickly test if the rough estimates indicate an idea worth pursuing.
With this information, this platform produces a report that relates these numbers. However, this
information does not provide financial indicators, delegating to the user the ability of interpretation the
results. Fundamentally this is the main difference between this application (and the theory behind it)
and the proposal of this thesis.

19
3 Problem
The adopted definition of business model for this thesis is “describes the rationale of how an
organization creates, delivers and captures value”. This concept born, and become important, with the
increasing importance of new digital firms enhanced by the digital boom and make clear the necessity
of describe our firm in a simple way in order to know what the firm does, how and for whom does it. It
results of the necessity of increase the responsiveness of companies, in order to take competitive
advantage over the other firms, in the new digital era. This leads to a new way of think about business
that meets the needs of more exigent consumers.
However, this evolution of business forced by technological evolutions proved to be ineffective. To
illustrate this, we know that “in all businesses in the United States one fourth is one year old or less,
and the median age of all firms is about seven years” [8]. If we focus on the life expectancy of these
firms just “fifty four percent survives one year and half” and “one quarter survive six years” [8]. In
terms of new products/services launched by existing firms, nine out of ten fail [9]. This ineffectiveness
of business can be explained in a simple way: when the creation of new businesses, business owners
does not know if their business idea will be profitable or not. Actually, some of them never even think
in basic things before starting their business: for instance, for whom will they sell their value
proposition or how many customers they need to achieve to make their business gainful. With this, the
absence of a tool that provides earnings and evolutionary estimations is a huge problem in this area
nowadays.
Adapting this general problem (lack of effectiveness) to the described new tool (business models) we
have here a great opportunity to improve the decision making of open or not certain business.
Besides describes how companies deliver their value, business model must be capable of providing
concrete results in useful time.
To instantiate this problem, in order to control the complexity of the problem this thesis adopt business
model canvas as reference framework because it is widely used and it “was developed for use in
practice” [26]. Therefore, the problem that is generically described can be identified, discussed and
realized in business model canvas.
The first concrete problem (and transverse to other ones) is the lack of quantification of the elements
that are present in the business model. When who is designing a business model is important to
quantify the elements in order to be understandable the order of magnitude of every element. For
instance, if we are talking about a customer segment, is important to say how many people are we
expecting for each segment or if we are talking about a value proposition is important to say by how
much it will be sold.

20
The concrete identified problems in business model canvas are the following ones (organized from
the most important to the less important) and are fully addressed in 3.1, 3.2 and 3.3 subsections:
Financial model unexplored (subsection 3.1). This is the direct consequence of the inability
of business model canvas of provide financial expectations;
Lack of evolutionary view (subsection 3.2). This problem is that every business evolves,
every business model evolves, but any framework leads with time factor; and
Lack of strategic analysis (subsection 3.3). No organization can exist alone: needs
suppliers, service providers and with them strategically partners. Despite the fact that some
frameworks are concerned about strategy, business model canvas does not.
The next three subsections explain minutely the three problems introduced above.
3.1 Financial Model Unexplored
A business model describes what the organization does in order to generate income. This description
can be more complex or more simplistic, but always needs to relate whole organization in order to
provide the company values proposition (whether a product or a service). However, the fundamental
part of every business model is how the company generates income.
Adapting this problem to business model canvas we have two building blocks that are responsible to
assemble all information about costs and revenues (cost structure and revenue streams). These two
building blocks are not a financial analysis, they are just revenues and costs information‟s filled by
who is completing the model, and are not necessarily related with the rest of the information present
in the others seven blocks.
This thesis argues that this is a double problem: beyond business model canvas does not provide
financial expectations, this information cannot be separated from the rest of the model because it can
lead to a different business model. It means that the financial analysis is not an attachment to the
business model, it is part of it and the model that is being designed will change depending on the
analysis. For instance, if we are designing a business model that we see that it will not be profitable,
we can change the selling price of our value proposition or the expected number of each customer
segment in order to make it profitable. This simplistic alteration is per-si, another business model.
Clarifying the problem in one sentence, this thesis consider that the business model canvas does not
provide an accurate financial analysis, and because this, is not able to provide a real projection for
earnings expectations. Moreover, with this analysis, who is completing the model will be taken to a
different and more accurate business model.

21
3.2 Lack of evolutionary view
The concept of time is one of the most important elements in business models. While time goes,
people‟s needs change, taking with them companies and of course, business models. However, “the
relationship between business models and time is little discussed” [21], despite the fact that business
models evolve rapidly [27] and [28]. This lack of integration of time in business models prevents an
evolutionary analysis of the model and this can be very useful to make previsions.
Business model canvas has the same problem: the model is static in time. When a business model is
complete it represents the model in that instant of time. If you need to change the business model
basically you are designing a new one and not evolving the present one. It means that there is no link
between both models.
Concluding is important to consider time factor in business models. Do not consider time as important
factor is a challenge both the evolution of the model itself as the evolution of the business.
3.3 Lack of Strategic Analysis
Even though the chosen definition of business model does not reflect it, strategy plays a central role
in business models: “a business model is a unique configuration of elements that consist of the
strategy, technologies and the coordination of the organization” [19]. In business models context,
strategy is important “to protect competitive advantage resulting from new business model design”
[29]. However, these concepts cannot be separated because “that can be used to prevent the
business model/strategy from being undermined through imitation by competitors or disintermediation
by customers” [29].
In business model canvas the relation with strategy and external entities is done by the partners‟
building block, which is little taking into account the real importance of strategically issues in an
organization nowadays. With business model canvas we are able to design an organization, but the
model closes in the model that is being designed, and does not take into account external factors. It is
particularly important because “Strategy analysis is this an essential step in designing a competitively
sustainable business model” [29].
In conclusion, an accurate strategic analysis is an important factor to perform a good business model.
Nowadays we live in network and this element cannot be forgotten. Business model canvas has one
building block to deal with this issue, but it is insufficient.

22

23
4 Proposal
This thesis proposes an extension to business model canvas in order to suppress the failures (except
the lack of strategic analysis one) appointed in previous section. The selection of which main faults
addressed has been selected taking into account the order of importance assigned to each. Thus,
bearing in mind the order assigned in the previous section, the strategic analysis is not addressed and
is future work of this thesis. The need of not address all the problems identified is related to control
complexity of this proposal.
The first proposed alteration is to attach to each element of business model canvas a number in order
to quantify it. This means that are so important identify correctly the name of any element as realize it
by a number. For instance, if we are talking about customer segments, is important to quantify how
many customers we are expecting from each segment. Following we have the numbers associated to
each building block:
Customer segments: expected number of customers for each particularly segment;
Value proposition: expected amount of money that each customer pays for each value
proposition (service or product);
Key activities: expect amount of money spent to perform each value proposition;
Key resources: expect amount of money (yearly) spent by company to carry out its
normal activity; and
Partners: the amount of money spent to each strategically association.
Building blocks that are not present are because they do not have any associated number.
Another important extension to the business model canvas is to aggregate the relationships between
building blocks. This information enables us to take conclusions by relating building blocks with each
other. For example, if we defined our customer segments (and attach to them a number) is important
to relate each segment to the associated value proposition. Following we have the relations
associated to building blocks:
Customer segments and value proposition: customer segments always need to be
related with at least one value proposition;
Channels with value proposition and customer segments: channels, as are the interface
through which the company sells its value proposition to customers, relates this two
building blocks;
Key activities and value proposition: as key activities are represented by the amount of
money spent to perform each value proposition is necessarily related to this building
block. We know the number of value propositions sold by the relation that value
proposition has with customer segments; and

24
Key resources and value proposition: represents to each value proposition what
resources are important.
The last transverse proposed alteration is related to the extinction of the lasts two businesses model
canvas building blocks: cost structure and revenue streams. This change is a natural consequence of
the attachment of numbers and the addiction of relationships between blocks because enables us to
extract the information that is supposedly to be present in these two blocks on the rest of the business
model. With this simplification we assume that every relevant revenue and cost must be a direct
consequence of the information that is present on the others seven blocks. Moreover, it enables us to
extract the information present in canvas in a deterministic form.
Figure 6 Graphical explanation of attachment number to business model canvas elements.
The figure above explains graphically the proposal explained above.
4.1 Financial Analysis projection
With the addition of numbers into business model canvas we are able to draw some financial
projections. These conclusions are extremely important because they give us some financial
indicators (EBIDTA – Earnings Before Interests Taxes and Depreciation, Gross Margin, Break Even
Point, Quantity Critical Point, Security Margin and Sales Costs Coefficient) that give an overall idea
about what we can expect from a business. The selected framework to represent these projections
are P&L statement (section 2.4) that is widely known approach to represent financial conclusions.
This analysis mainly serves to replace the cost structure and revenue streams building blocks from
the original business model canvas and represents them in a more tangible way. With this approach
25
we are able to produce more detailed information (from the financial point of view) about the relations
between the elements inserted in the model.
Following there are present how each item of P&L statement is calculated in order to realize the
relationship between it and business model canvas:
Income (sum of sales revenue and other income):
o Sales Revenue: each customer segment value multiplied by the value of the
associated value proposition; and
o Other Income: a direct value defined by who is completing the business model;
Cost Structure (sum of cost of sales, marketing, research and development and general
and administrative):
o Cost of Sales: each key activity value identified as being cost of sales multiplied
by the number of customers that who will buy the associated value proposition;
o Marketing: each key activity value identified as being as marketing multiplied by
the number of customers that who will buy the associated value proposition;
o Research and Development: the sum of all Key Resources identified as being
as research and development;
o General and Administrative: the sum of all Key Resources identified as being
as general and administrative, wages and salaries, outside services, meals and
entertainment, rent, telephone, utilities, technological licenses and patents; and
o Taxes: a direct value defined by who is completing the business model.
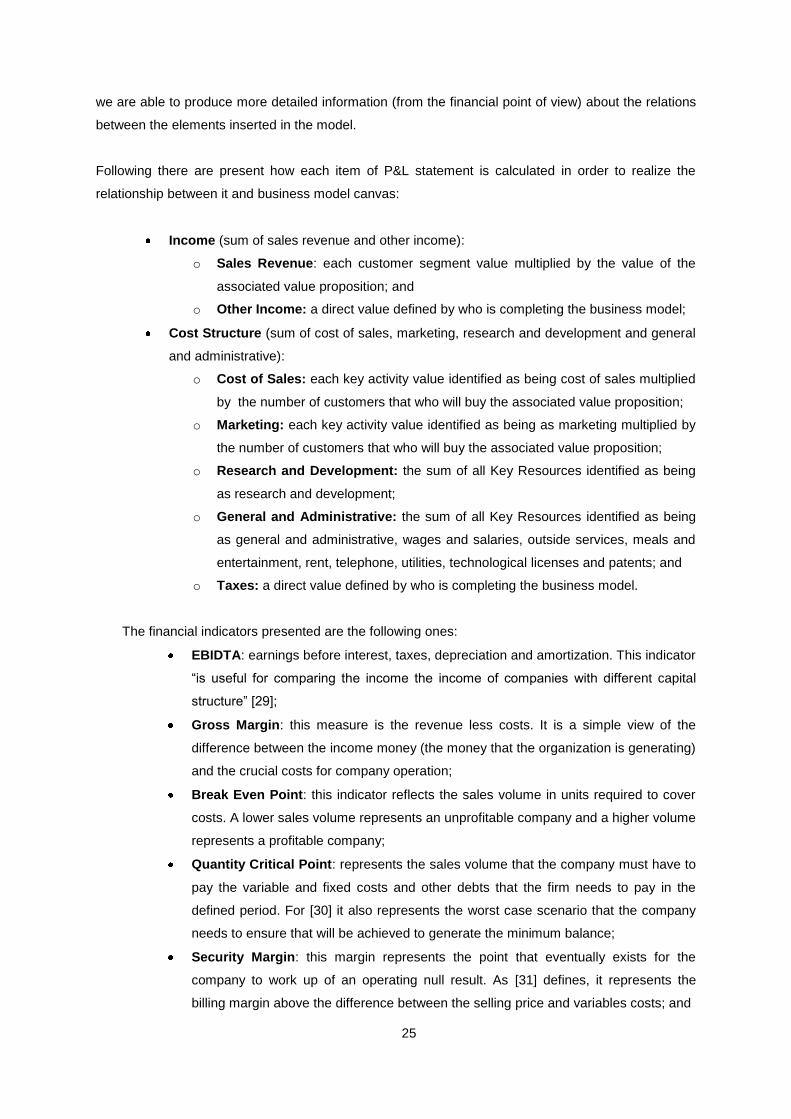
The financial indicators presented are the following ones:
EBIDTA: earnings before interest, taxes, depreciation and amortization. This indicator
“is useful for comparing the income the income of companies with different capital
structure” [29];
Gross Margin: this measure is the revenue less costs. It is a simple view of the
difference between the income money (the money that the organization is generating)
and the crucial costs for company operation;
Break Even Point: this indicator reflects the sales volume in units required to cover
costs. A lower sales volume represents an unprofitable company and a higher volume
represents a profitable company;
Quantity Critical Point: represents the sales volume that the company must have to
pay the variable and fixed costs and other debts that the firm needs to pay in the
defined period. For [30] it also represents the worst case scenario that the company
needs to ensure that will be achieved to generate the minimum balance;
Security Margin: this margin represents the point that eventually exists for the
company to work up of an operating null result. As [31] defines, it represents the
billing margin above the difference between the selling price and variables costs; and
26
Sales Costs Coefficient: this indicator represents the value that remains from selling
a product/service after paying the variables costs associated to the product/service
sold. In accordance with [31] this coefficient must be interpreted as the part of the
selling value that will pay the variable cost in its production, helps to pay the fixed
costs and is crucial to profit generation.
A financial analysis is important for a business model because enabling us to understand if a
business will be profitable or not. Moreover, with this approach this thesis wants to prove that these
concepts are closely related to each other because with an accurate financial analysis it leads to a
different business model. It means that these concepts are not separable and we should not think
them separately. If who is fulfilling the model receives feedback from financial analysis it can lead to a
different (and supposedly closer to the reality) business model.
4.2 Evolutionary View
Any business model is static on time. The business environment changes, people changes and the
company needs to adapt it, and particularly, needs to adapt how it is making money. This evolutionary
views of business model, as described on problem section, is little discussed in business models [21].
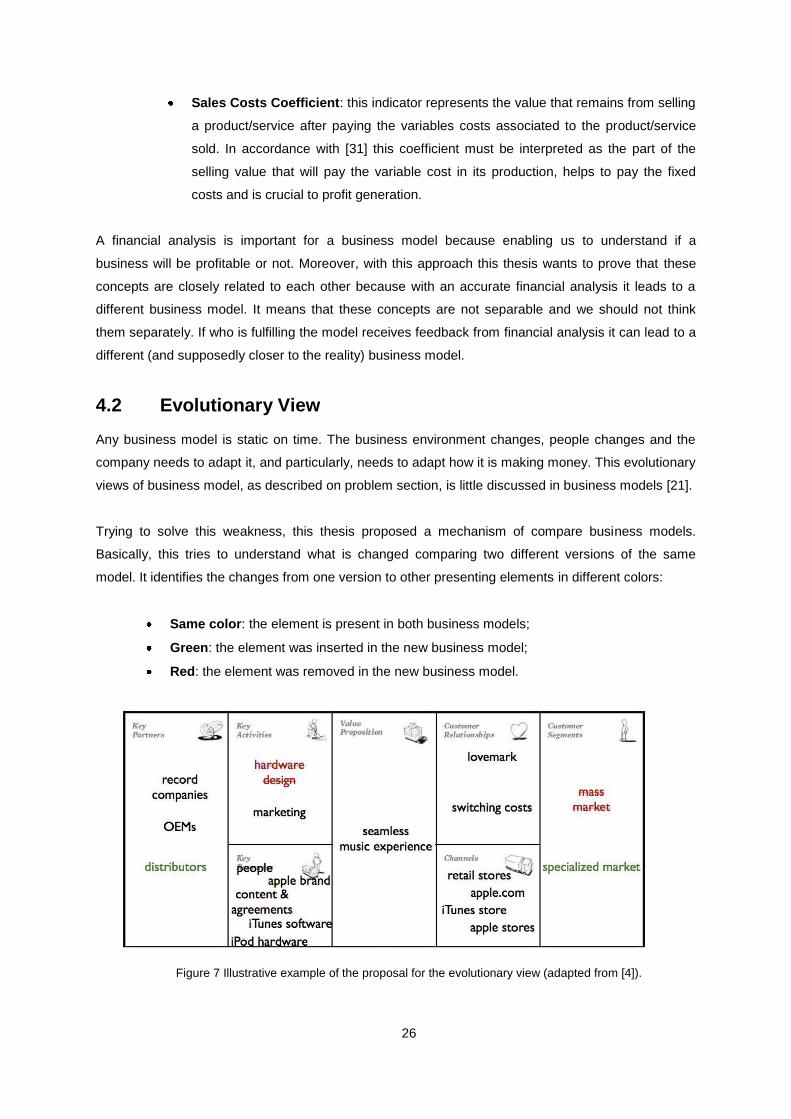
Trying to solve this weakness, this thesis proposed a mechanism of compare business models.
Basically, this tries to understand what is changed comparing two different versions of the same
model. It identifies the changes from one version to other presenting elements in different colors:
Same color: the element is present in both business models;
Green: the element was inserted in the new business model;
Red: the element was removed in the new business model.
Figure 7 Illustrative example of the proposal for the evolutionary view (adapted from [4]).

27
The above figure is an illustrative example from the proposal for the evolutionary view. In this concrete
example, the iTunes business model [4] changed the following elements:
Customer Segments: delete the mass market segment and add a new one called
“specialized market”;
Key Activities: delete the hardware design activity;
Key Partners: add a partnership with “distributors”; and
Everything else is unchanged.
This graphical comparison enables who is completing the model to understand the changes that a
business model suffered.
Other extension to business model canvas is the attachment of a growth expected year percentage.
Allows associating an expected growth per year to the P&L statement results and have associated a
risk. It means that the higher is the given percentage, higher is the risk. This is used when is
calculated the third year expected money and is a simplistic approach to the expected evolution of the
modeled company.

28

29
5 Prototype
For the proposed changes have a real utility is important to materialize them in a tool that can be used
for everyone. The construction of a prototype is the way found to effectively show and materialize the
proposal of this thesis. However, is important to note that this prototype is not an end on itself: it is just
one form of implement the proposal.
The prototype has three fundamental parts (that each one is one different tab):
The design of the business model that is where the user inserts the information about
their model. Each building block has a button that when clicks open a new pop-up window
that allows inserting the information about the new element that user wants to insert. This
pop-up window not also has the information showed in business model, but also
information about the relationship of that particular element with the other elements of the
business model. This information is very useful for conclusions drawn by the others two
parts of this prototype;
The P&L statement that is where the P&L is reached. Basically this tab of the prototype
shows the P&L statement from two different ways: the graphical one and the traditional
and both shows the same information but in different forms; and
The financial analysis has two different parts: the first one shows the financial indicators
and the second one shows the evolutionary view of the company (first by a graph, and
then by the numbers that support the graph).
To conclude is important to say that this prototype is web-based1 and is available for everyone since
registered. This tool was built with Outsystems platform [32].
5.1 iTunes Example
In order to illustrate the real usage of this platform was chosen the iTunes case study (provided by
[4]). For this specific case the business model is not important on itself: it is only one example of how
the prototype can be used. This case-study was chosen because it is from the main reference of this
thesis and is a widely known platform that basically sells music at a really low cost price.
1 Available at www.financial-canvas.com

30
Figure 8 Example of iTunes in the prototype.
The figure 8 is the design business model tab of this case study and the numbers associated to each
element are just examples (does not have any real basis). This figure shows that iTunes has one
customer segments that are called “mass market” that are one universe of 1 billion of people that will
buy a “seamless music experience” for 0.99 Euros each unity. This sell will be made from “retail
stores”, “apple.com” and “iTunes store” and on the other hand the established customer relationships
is made from “lovemark” and “switching costs”. However, in order to produce the described value
proposition, iTunes needs two perform two different activities: marketing (that will cost 0.1 euro of
each sold unity) and hardware design (that will cost the same as marketing). To perform these
activities iTunes has six different resources: “people” (that costs 600 000 Euros per year), “apple
brand” (that costs 1 million Euros per year), “iPod hardware” (that costs 20 million Euros per year),
“iTunes software” (that costs 1 million Euros per year) and “content & agreements” (that costs 1
million Euros per year). Relatively to market, iTunes will need to assign contracts with two different
key partners (“record companies” and “OEMs”) that have zero costs.
Figure 9 iTunes P&L results.
With the values provided in the figure 8 the P&L result is the presented in the figure 9. This result is
for the first year of operation and as can be seen are very encouraging. The blue line represents the
income and the red one represents the outcome. As can be easily perceived, the income exceeds the
outcome.
31
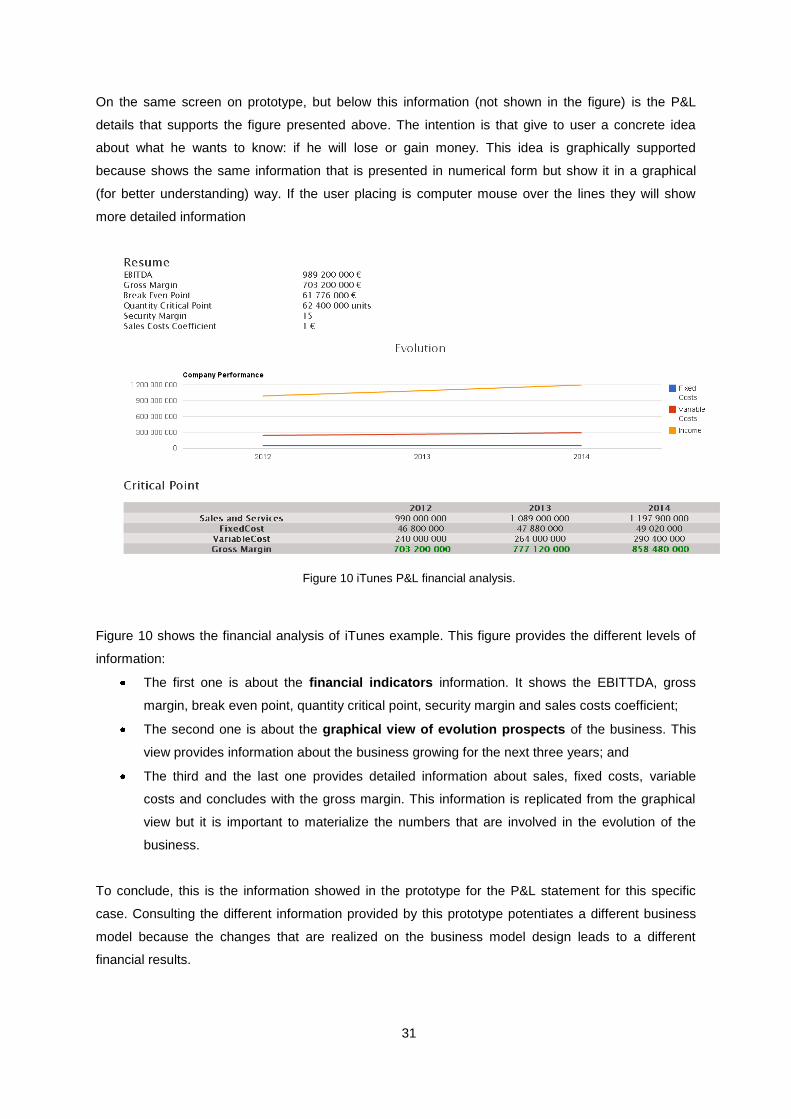
On the same screen on prototype, but below this information (not shown in the figure) is the P&L
details that supports the figure presented above. The intention is that give to user a concrete idea
about what he wants to know: if he will lose or gain money. This idea is graphically supported
because shows the same information that is presented in numerical form but show it in a graphical
(for better understanding) way. If the user placing is computer mouse over the lines they will show
more detailed information
Figure 10 iTunes P&L financial analysis.
Figure 10 shows the financial analysis of iTunes example. This figure provides the different levels of
information:
The first one is about the financial indicators information. It shows the EBITTDA, gross
margin, break even point, quantity critical point, security margin and sales costs coefficient;
The second one is about the graphical view of evolution prospects of the business. This
view provides information about the business growing for the next three years; and
The third and the last one provides detailed information about sales, fixed costs, variable
costs and concludes with the gross margin. This information is replicated from the graphical
view but it is important to materialize the numbers that are involved in the evolution of the
business.
To conclude, this is the information showed in the prototype for the P&L statement for this specific
case. Consulting the different information provided by this prototype potentiates a different business
model because the changes that are realized on the business model design leads to a different
financial results.

32
33
6 Demonstration
The demonstration of this thesis, for the selected research methodology consists on “demonstrate the
use of the artifact to solve one or more instances of the problem” [11] selecting an “appropriate
activity” [11]. To demonstrate in practice the proposal of this thesis the referred appropriate activity is
realize a significant number of case studies that consists in modeling, using the proposal and the
implemented prototype in order to experience this artifact with real cases.
This demonstration includes seven case studies that represents new digital business models because
these organizations “derives a significant portion (at least 10%) of its revenues from transactions
conducted over the Internet” [1]. However, these cases studies are separated in two different
categories with the intent of demonstrate different usages of the proposal:
The first two case studies intent to demonstrate the usage of the proposal for business
modelling and achieve financial conclusions. These case studies are conducted with
interviews to startup partners and only one iteration of proposal application was
performed;
The last four case studies intent to demonstrate that if we use the calculated financial
analysis as a feedback to improve our business model we reach to a different business
model from the initial. If we change our business model based on financial analysis, it will
prove that this concepts are not separable and the final model will be closer to the reality,
and with that, better. These case studies are conducted with interviews to startup partners
and n-iterations was performed. For a question of simplicity and clarity of the
demonstration only the initial and the reached model are presented;
The selection of case studies focused on quality of those cases and not in quantity. Furthermore, the
success of these case studies should not be generalized. The businesses of the organizations that
are cases-study target are following briefly described:
Oops!booking consists in a really last-minute deals for hotels, tours, restaurants and
events. This digital organization (their transactions are all conducted over the internet)
supports their business in the best last time offer;
ITIL Maturity Models consists in a consultant for ITIL applications over the internet. To
take advantage of its unique channel (internet) it wants to reach customers all over the
world;
Portal dos Serviços is a startup that aims to be a trusty intermediary between health
care service providers and private clients. This trusty in the service provided by this
startup is reached by one main reason: accuracy in providers selection;
Laurus Living is a startup that provides comprehensive services for planning, facilitating
and help foreigners that live in Portugal or want to move in;
34
Track Student consists in a web-platform that approximate students (since the beginning
of the university) and companies, sharing students educational profile. It differs from other
existing platform such as LinkedIn by their specialization; and
Interns4u is a web-platform that aims to create and promote internships for students in
professional environment, particularly startups and small-medium companies.
To conclude, this demonstration is organized in six subsections that each one is one different
organization and is organized by the other that they are presented above. Each subsection has a
more detailed presentation of each business, an image that illustrates each business model and a
little discussion of it.
6.1 Oops!booking
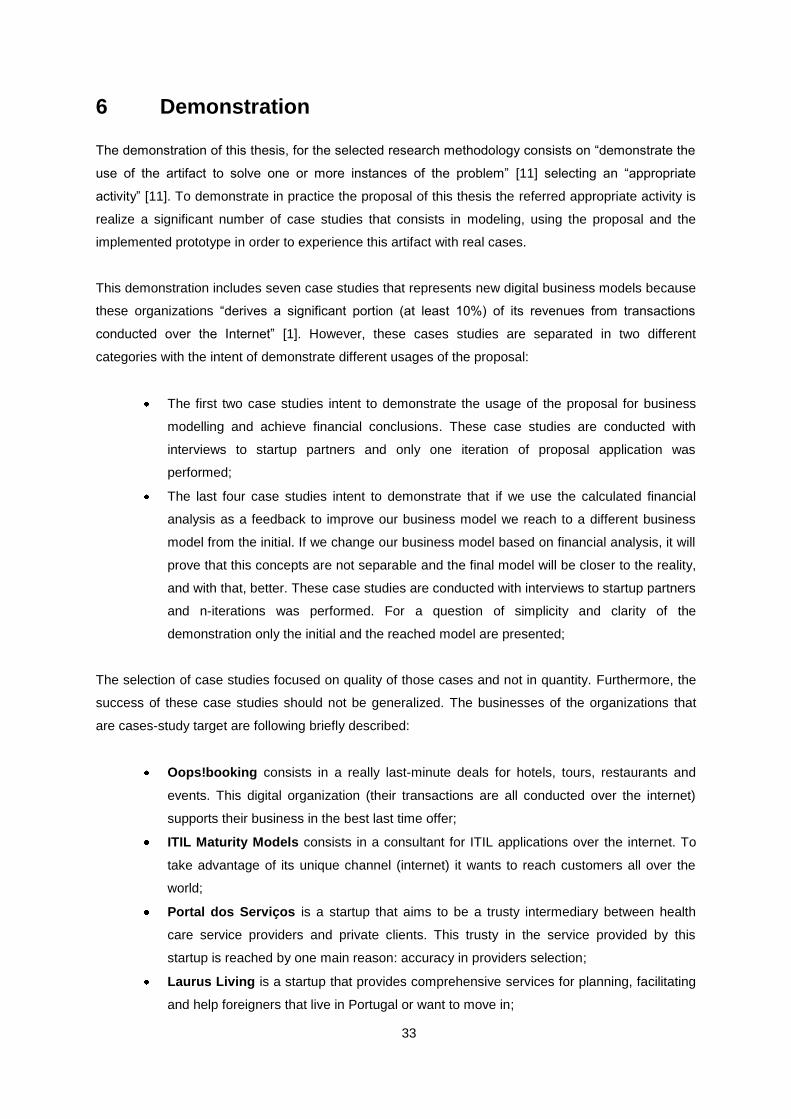
Oops!booking is a really last-minute deals for hotels, tours, restaurants and events. This organization
is a new digital business model because it only reaches customers over the internet and is based on
a pre-established agreement with well positioned strategic partners.
Figure 11 Oops!booking business model.
As can be seen in figure 11, Oops!booking has three different customer segments: “airport
passengers without accommodation reserved” (expected number: 6 000), “mobile phone users” (1
000) and “web app users” (expected number: 1 000). For all segments, this company proposes to sell
a value proposition called “commission * room price” (expected value: 10.5 €) that consists in the
average of each expected commission. In order to reach its customers, Oops!booking has three
different channels: “Touch screen Kiosks”, “Mobile App” and “Web App”. On other hand, to reach
customer loyalty this business provides deals without contract (“no contract”) and allows that its
clients perform their check-in 4 hours before the airplane departure.
35
Figure 12 shows the result of processing the business model canvas for Oops!booking for the first
year. As we can see, actually this company has an estimate value of 20 000 € and an EBITDA value
of 22 000 €. Looking at the evolution of the company (with a 10% of growth per year) we observe that
this company has a solid growth potential. However, as like the most of the new digital firms, the
business biggest cost is related to the development of the platform. When this development is paid,
the return will be higher, and the prospects will be better than showed in the above figure.
Figure 13 Oops!booking financial analysis.
The figure 13 presents the Oops!booking financial conclusions resulting from its business model. As
can be seen, with the values proposed in figure 10 have the following financial main conclusions:
The company‟s EBITDA is 34 000 €. This value is more useful when compared between
different compared between different firms or different business models inside the same
firm (as occurred with others case studies of this thesis). Isolated this value represents
the company‟s ability to generate resources;
The gross margin is 381 000 (negative) to the first year. Despite this is negative, the
prospects to the following year are encouraging;
Figure 12 Oops!booking P&L results.
36
The break even point in value is 444 000 € and in quantity is 42 286 units. The first value
(break even in value) represents the quantity of money that the company needs to
generate in order to pay the initial investment. The second value (break even in quantity)
represents the number of value propositions that need to be sold in order to correspond
of above mentioned value;
The security margin is -1. This financial indicator shows the security that eventually exists
for the company to work up an operating return null. This value represents that this
company operates very close to the critical point and may at any time go in to damage
area; and
The sales costs coefficient is -6 €. This value means that after variable costs paid, this
company has a lack of 6 € to pay fixed costs.
The conclusions of these results are discussed in the next section with the Oops!booking partners.
However is important to reaffirm that this case study is about an established company and a matured
idea, which gives credibility and practical realism to the mentioned values.
6.2 ITIL Maturity Models
ITIL Maturity Models consists in a consultant for ITIL applications over the internet. ITIL Maturity
basically is a web based tool available to assess and recommend changes in ITIL processes.
Particularly this company is specialist in improve companies performance by:
Assess ITIL v3 processes;
Use roadmaps to improve performance.
Figure 14 ITIL Maturity business model.

37
Figure 14 shows the ITIL Maturity business model. It divides the customer in two segments: “IT
clients” (expected value: 400 units) and “IT providers” (expected value: 5 units) and define the value
proposition as “advertising for clients” (expected value: 15 €), “licenses for clients” (expected value:
100 €), “licenses for providers” (expected value: 500 €) and “advertising for providers” (expected
value: 15 €). To reach its customers‟, this model defines a single channel (“web”) and on the other
hand it establishes “promotions” to maintain customers.
Relatively to the cost structure of the business model, this company needs to perform three activities:
“maturity evaluation”, “benchmarking” and “roadmaps” (all without any cost). To realize that the next
two resources are indispensable: “domain register” (expected cost: 17 €) and “human resources”
(expected cost: 10 000 €). From the strategical analysis point of view the partnership with INOV
(without any cost) is fundamental.
Figure 15 ITIL Maturity P&L results.
Figure 15 shows the result of the ITIL Maturity business model. This result demonstrates that this
company actually has an estimate value of 32 132 € and an EBITDA of 38 558 €. Looking at the
business model of this company (Figure 11) we can see that it has already paid the development
costs of its web platform. Therefore, this company has paid the biggest initial cost of a web-based
company and we can conclude one important issue: as ITIL Maturity has minimal costs, this business
offer reduced risk because if it fails, its partners almost do not lose money.

38
Figure 16 ITIL Maturity financial analyses.
The figure 16 presents the ITIL Maturity Models financial conclusions resulting from its business
model. As can be seen, with the values proposed in figure 14 have the following financial main
conclusions:
The company‟s EBITDA is 47 458 €. This value is more useful when compared between
different compared between different firms or different business models inside the same
firm (as occurred with others case studies of this thesis). Isolated this value represents
the company‟s ability to generate resources;
The gross margin is 34 967 €. This value represents a good return of invest, if it is taking
in account the lower costs of initial investment;
The break even point in value is 13 608 € and in quantity is 22 units. The first value
(break even in value) represents the quantity of money that the company needs to
generate in order to pay the initial investment. The second value (break even in quantity)
represents the number of value propositions that need to be sold in order to correspond
of above mentioned value;
The security margin is 3. This financial indicator shows the security that eventually exists
for the company to work up an operating return null. This value represents that this
company operates very far from critical point and may is relatively save from go in to
damage area; and
The sales costs coefficient is 1 €. This value means that after variable costs paid, this
company has a surplus of 1 € to pay fixed costs.
The conclusions of these results are discussed in the next section with the ITIL Maturity Models
partners. However is important to reaffirm that this case study is about an established company and a
matured idea, which gives credibility and practical realism to the mentioned values.

39
6.3 Portal dos Serviços
Portal dos Serviços is a startup that aims to be a trusty intermediary between health care service
providers and private clients. Customers have access to medical treatment from various specialties
through a web-platform. This company provides a virtual interaction with the doctors, what allows the
existence of medical treatments at home. To achieve user confidence and loyalty in the provided
services, Portal dos Serviços is particularly rigorous in the quality of providers‟ selection.
Figure 17 Portal de Serviços initial Business Model.
Figure 17 explicit the Portal de Serviços business model. As can be seen, the main customers are
private clients and liberal professionals. Private clients is perceived as the customers that access the
web-platform and liberal professionals are customers that are differentiated from others by working on
own account and establish a different connection with Portal de Serviços, working this as a
continuous health service provider (similar to a private health insurance). To these different
customers, Portal de Serviços provides different services:
For private clients the provided services are: immediate care, extended time, scheduling
24/7/365, provider choice, price/h up to 40% cheaper, free FAQ‟s, wide range of services
and providers with quality. The sum of the cost of all of these services is around 6€,
which is the price of each medical treatment. The distribution of the 6€ by each value
proposition was calculated by the weight that the interviews to potential customers
pointed;
For liberal professionals the provided services are: more clients, fewer costs,
notoriety/advertising, price unfocused, lowest loss of invoicing, extended time 8-24h and
volume generation. The sum of all of the cost of all of these services is around 6€, which
is the price of each medical treatment. Similarly to the other client segments, the
distribution of the 6€ by each value proposition was calculated by the weight that the
interviews to potential customers pointed.

40
To reach both customer segments these companies has 7 different channels: internet (web-platform),
tablet, widgets, word of mouth, press, social networks and citizen store. On other hand, to maintain
customer loyalty and customer satisfaction, Portal de Serviços provide 5 types of customer
relationships: customer loyalty extended choice, flexible hours, self-service and providers information.
In order to deliver the listed value propositions, this company needs to perform the following set of
activities: platform design, platform management, providers‟ accreditation, marketing and portal
visibility. In this group of activities the first one, platform design, only need to be performed in an initial
phase of the business. In order to accomplish these activities the following resources are necessary:
brand register, brand image, platform operation and quickness, platform management, contents
management, provider‟s management and quality management. Finally, to maintain a strategically
position in the market is important to maintain a partner relationships with the following set of partners:
providers, web-providers, SIBS and advertising companies.
Figure 18 Portal de Serviços P&L results.
The model and the numbers presented in figure 17 have as a result the P&L conclusions represented
in figure 18. As can be expected for a digital business startup, Portal de Serviços has large
expenditure at this early stage of its activity (initial costs). It can be explained by the high platform
design, content and providers‟ management costs.

41
Figure 19 Portal de Serviços initial financial analysis.
Figure 19 represents the Portal de Serviços financial results for the initial business model (figure 21).
As can be seen, this company has an EBITDA of 11 509 € which represents its capacity of generate
resources in its operational activities. The Gross Margin for the first year (year of the model) is 131
064 € (negative) and the break even point (in value) is around 152 847 €. To be feasible, this
business needs to sell 12 902 medical treatments to its customers (Quantity Critical Point). Relatively
to Security Margin and Sales Costs Coefficient, the results are not so encouraging: the security
margin is -1, which represents that with this business model Portal de Serviços will be financially
under the critical point. Sales Costs Coefficient is negative (-6 €), which means that the company
cannot pay its variable costs (100% of brand image cost), carrying a negative result to pay their fixed
costs. It is also important to underline that these results are in accordance with this company‟s
financial plan.
The results achieved in this first iteration of the uses of the proposal were globally attractive: with
these costs and these revenues the company will have positive operating results around the second
year and half of operation. However, this company had a specific problem to establish itself: the break
even point (actually 150 000 €) is higher than what investors were willing to pay (around 100 000 €).
There was a need to change the business model to reach an approximate value that would be
accepted by investors, both in costs and in profit.
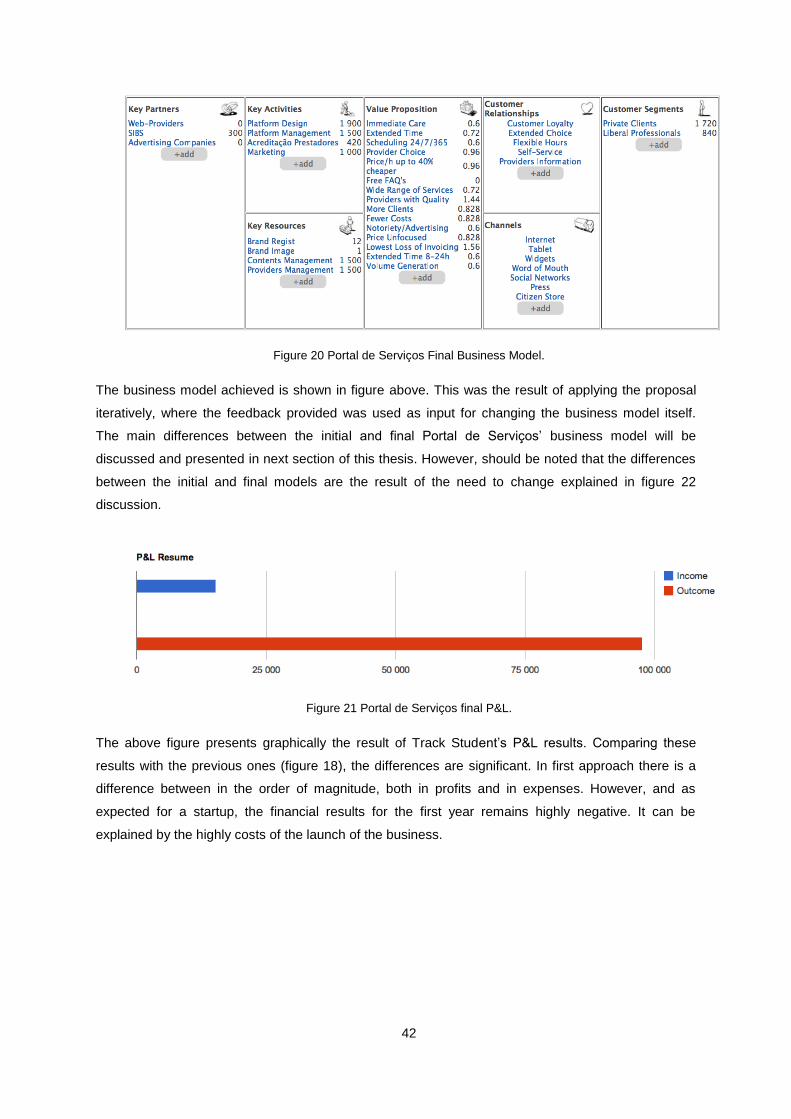
42
Figure 20 Portal de Serviços Final Business Model.
The business model achieved is shown in figure above. This was the result of applying the proposal
iteratively, where the feedback provided was used as input for changing the business model itself.
The main differences between the initial and final Portal de Serviços‟ business model will be
discussed and presented in next section of this thesis. However, should be noted that the differences
between the initial and final models are the result of the need to change explained in figure 22
discussion.
Figure 21 Portal de Serviços final P&L.
The above figure presents graphically the result of Track Student‟s P&L results. Comparing these
results with the previous ones (figure 18), the differences are significant. In first approach there is a
difference between in the order of magnitude, both in profits and in expenses. However, and as
expected for a startup, the financial results for the first year remains highly negative. It can be
explained by the highly costs of the launch of the business.
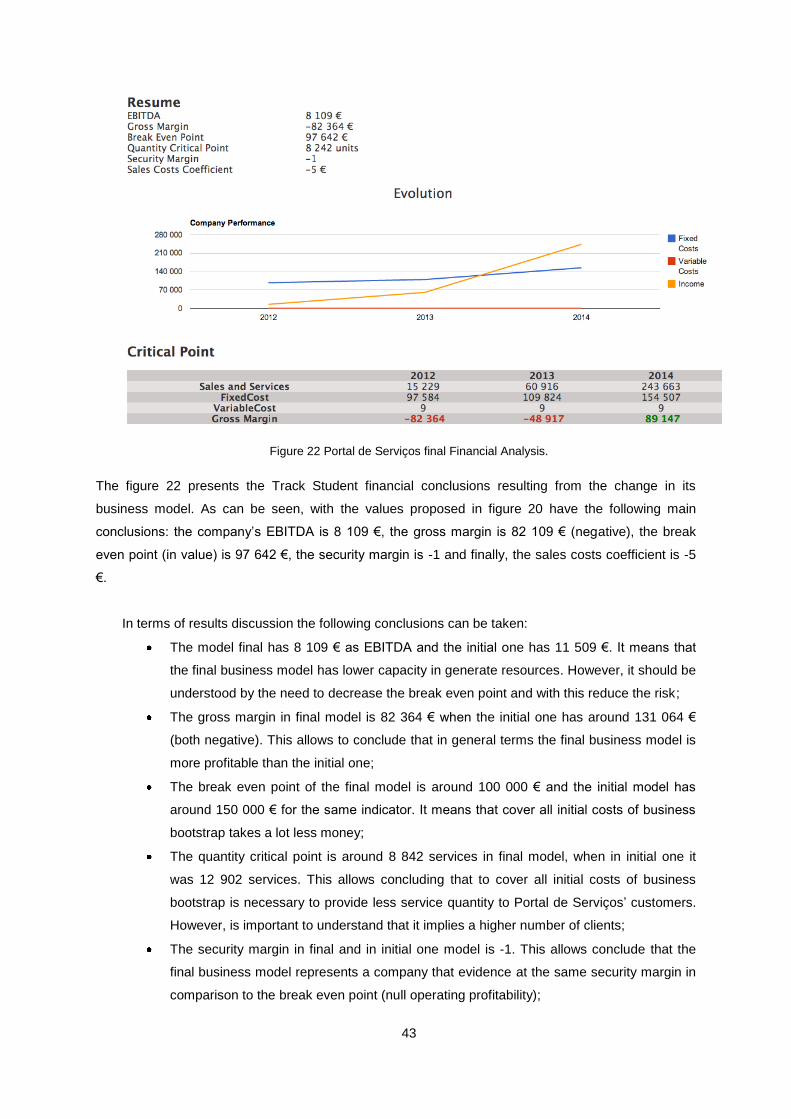
43
Figure 22 Portal de Serviços final Financial Analysis.
The figure 22 presents the Track Student financial conclusions resulting from the change in its
business model. As can be seen, with the values proposed in figure 20 have the following main
conclusions: the company‟s EBITDA is 8 109 €, the gross margin is 82 109 € (negative), the break
even point (in value) is 97 642 €, the security margin is -1 and finally, the sales costs coefficient is -5
€.
In terms of results discussion the following conclusions can be taken:
The model final has 8 109 € as EBITDA and the initial one has 11 509 €. It means that
the final business model has lower capacity in generate resources. However, it should be
understood by the need to decrease the break even point and with this reduce the risk;
The gross margin in final model is 82 364 € when the initial one has around 131 064 €
(both negative). This allows to conclude that in general terms the final business model is
more profitable than the initial one;
The break even point of the final model is around 100 000 € and the initial model has
around 150 000 € for the same indicator. It means that cover all initial costs of business
bootstrap takes a lot less money;
The quantity critical point is around 8 842 services in final model, when in initial one it
was 12 902 services. This allows concluding that to cover all initial costs of business
bootstrap is necessary to provide less service quantity to Portal de Serviços‟ customers.
However, is important to understand that it implies a higher number of clients;
The security margin in final and in initial one model is -1. This allows conclude that the
final business model represents a company that evidence at the same security margin in
comparison to the break even point (null operating profitability);

44
The sales costs efficient in final model is -5 € when in initial one was -6 €. Although there
is an improvement in this indicator is important to understand that this result is not
satisfactory. It means that this business carries a negative value to pay variable costs
after paying the fixed ones.
The previous discussed differences between the initial and final business models are the
interpretation of the results. The evaluation will be addressed in the next section and presents the
Portal de Serviços‟ co-partner opinion.
6.4 Laurus Living
Laurus Living is a Portuguese startup that provides comprehensive services for planning and
facilitating foreigners‟ integration either they live in Portugal, or just simply considering a move to
Portugal. This company argues that the migration process has two different phases that are: the first
one is an overview about how is live in Portugal and the second is an in-depth understanding of the
legal and bureaucratic features, so as cultural and language barriers. In order to help foreigners in
their accommodations, Laurus Living provides 5 different services with the aim of be the foreigners
trust advisor to facilitate their lives in Portugal.
Figure 23 Laurus Living initial business model.
Figure 23 explicit the Laurus Living business model. As can be seen, this business has only one
customer segment that is foreigners that belong to the upper middle class in their respective
countries. To them, this company sells four different value propositions:
Portuguese live made easy (that is the added value for anyone who is currently in
Portugal and use Laurus Living services);

45
Expert solutions for who wants to live in Portugal (that is the promise that this
company will find the best accommodation for who wants to live in Portugal
accordingly to their objectives and expectations);
Enjoy live in Portugal (is the promise of a successfully adaption); and
Customer service 24/7 (is the help desk line that is available 24 hours per day and 7
days per week).
In order to reach their customers, Laurus Living defined 4 different channels: internet (a website
with free information, contacts and superficial advice), advisers (the company human resources
that are “the face” of the company for the final client), client network (that is usually known as word
of mouth) and finally direct contact (for example by phone, fax or e-mail). On other hand this
company wants to maintain a customer relation based on a personal relation to give a trusty
image and a long-term retention to maintain this reliable likeness.
To realize the above explained set of value propositions this company needs the following
processes: relational marketing, customization, facilitation of premium services, management
partnerships and customer service. These last two processes have zero cost because these costs
are embedded in key resources. The key resources needed to perform these processes are
human resources (staff) and a premium platform for services and activities (a web-platform to help
the company‟s management). Strategically this company maintains four different kinds of
partnership relations: with service providers, IS companies, local government and other
organizations.
Figure 24 Laurus Living initial P&L results.
The model and the numbers presented in figure 23 have as a result the P&L conclusions represented
in figure 24. As can be expected for a digital business startup, Laurus Living has large expenditure at
this early stage of its activity (initial costs). It can be explained by the high customization (which
means personalized service) of the offered services and the human resources associated cost.

46
Figure 25 Laurus Living initial financial analyses.
Figure 25 represents the Laurus Living financial results for the initial business model. As can be seen,
this company has an EBITDA of 2 576 800 € which represents its capacity of generate resources in its
operational activities. The Gross Margin for the first year (year of the model) is 1 580 000 € and the
break even point (in value) is around 1 068 000 €. To be feasible, these companies need to sell 32
value propositions in order to reach the quantity break even point. Security margin and sales costs
coefficient are both one: to security margin it represents that with this business model this firm will be
financially above the critical point and to sales costs coefficient it represents that the company can
pay its variable costs (100% of brand image cost), carrying a positive result (of 1 €) to pay its fixed
costs. It is also important to underline that these results are in accordance with this company‟s
financial plan.
The results achieved in this first iteration of the uses of the proposal were highly attractive: with these
costs and these revenues the company always will have positive operating results. However, these
are not realistic values because any IT-based company (or in any other industry) can be established
without any risk and without any break even point greater than zero. Taking this into account, this
model has been target of several iterations of this thesis proposal and the final business model is
following presented.

47
Figure 26 Laurus Living final business model.
The business model achieved is shown in figure above. This was the result of applying the proposal
iteratively, where the feedback provided was used as input for changing the business model itself.
The main differences between the initial and final Laurus Living‟s business model will be discussed
and presented in next section of this thesis. However, should be noted that the differences between
the initial and final models are the result of the need to change explained in figure 28 discussion.
Figure 27 Laurus Living final P&L results.
The above figure presents graphically the result of Track Student‟s P&L results. Comparing these
results with the previous ones (figure 24), the differences are significant. In first approach can be
argued that this result is worse than the previous one, and in monetary terms, it is. However, to model
a business in a faithful way we should not only seek for the best result: we should persuade the best
result in a realistic way. Was this need to be realistic that led to the necessity of change the initial
business model. Concluding this consideration, the P&L presented in figure 27 is worse (in a financial
way) than the presented in figure 24, but it is better (in a realistic way) from the other.
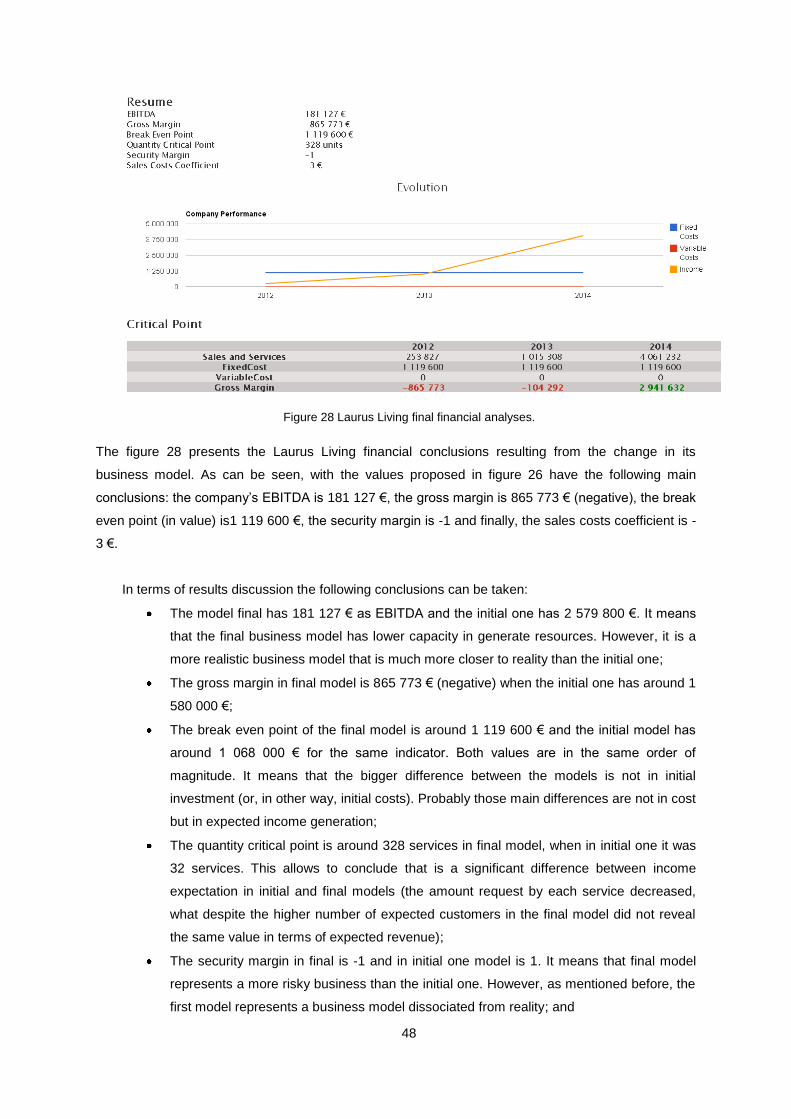
48
Figure 28 Laurus Living final financial analyses.
The figure 28 presents the Laurus Living financial conclusions resulting from the change in its
business model. As can be seen, with the values proposed in figure 26 have the following main
conclusions: the company‟s EBITDA is 181 127 €, the gross margin is 865 773 € (negative), the break
even point (in value) is1 119 600 €, the security margin is -1 and finally, the sales costs coefficient is -
3 €.
In terms of results discussion the following conclusions can be taken:
The model final has 181 127 € as EBITDA and the initial one has 2 579 800 €. It means
that the final business model has lower capacity in generate resources. However, it is a
more realistic business model that is much more closer to reality than the initial one;
The gross margin in final model is 865 773 € (negative) when the initial one has around 1
580 000 €;
The break even point of the final model is around 1 119 600 € and the initial model has
around 1 068 000 € for the same indicator. Both values are in the same order of
magnitude. It means that the bigger difference between the models is not in initial
investment (or, in other way, initial costs). Probably those main differences are not in cost
but in expected income generation;
The quantity critical point is around 328 services in final model, when in initial one it was
32 services. This allows to conclude that is a significant difference between income
expectation in initial and final models (the amount request by each service decreased,
what despite the higher number of expected customers in the final model did not reveal
the same value in terms of expected revenue);
The security margin in final is -1 and in initial one model is 1. It means that final model
represents a more risky business than the initial one. However, as mentioned before, the
first model represents a business model dissociated from reality; and

49
The sales costs efficient in final model is -3 € when in initial one was 1 €. This indicator
means that after paying the variable costs, this final business model carrying out -3 € to
pay the fixed costs.
The previous discussed differences between the initial and final business models are the
interpretation of the results. The evaluation will be addressed in the next section and presents the
Portal de Serviços‟ co-partner opinion.
6.5 Track Student
Track Student consists in a web-platform that approximate students (since the beginning of the
university) and companies, sharing student‟s educational profile. It differs from other existing platform
such as LinkedIn by their specialization.
Figure 29 Track Student initial business model.
Figure 29 explicit the Track Student business model. As can be seen, the main customers are
companies in general and human resources companies. This business aims to be an intermediary
between students and companies but students are perceived as users and not as customers. To
these customers, Track Student sells students profiles by its web-platform and a Smartphone
application. In order to maintain their customer loyalty, this company provides reliability, trust,
motivation, best place to link formal and informal connections as customer relationship.
On other hand, to provide students profiles this company has as main activity the development and
maintenance of its platform and to realize their human needs and financial resources. Strategically,
Track Student needs to assign partnership contracts with universities.
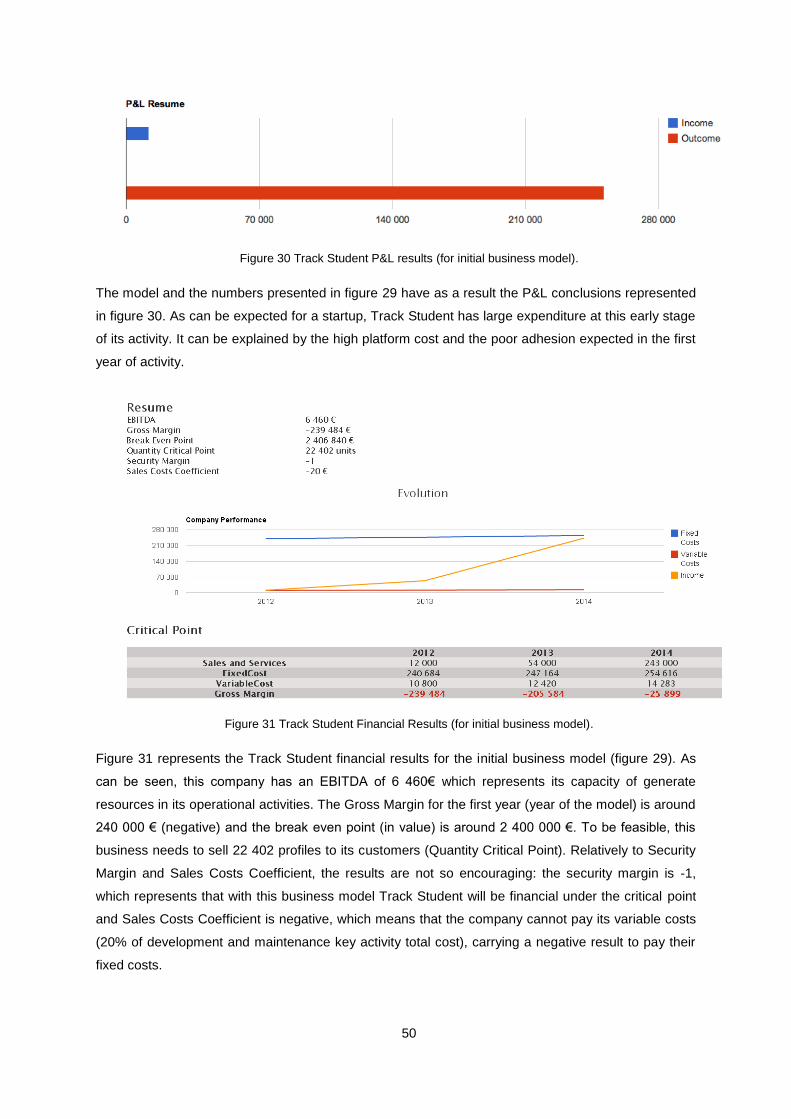
50
Figure 30 Track Student P&L results (for initial business model).
The model and the numbers presented in figure 29 have as a result the P&L conclusions represented
in figure 30. As can be expected for a startup, Track Student has large expenditure at this early stage
of its activity. It can be explained by the high platform cost and the poor adhesion expected in the first
year of activity.
Figure 31 Track Student Financial Results (for initial business model).
Figure 31 represents the Track Student financial results for the initial business model (figure 29). As
can be seen, this company has an EBITDA of 6 460€ which represents its capacity of generate
resources in its operational activities. The Gross Margin for the first year (year of the model) is around
240 000 € (negative) and the break even point (in value) is around 2 400 000 €. To be feasible, this
business needs to sell 22 402 profiles to its customers (Quantity Critical Point). Relatively to Security
Margin and Sales Costs Coefficient, the results are not so encouraging: the security margin is -1,
which represents that with this business model Track Student will be financial under the critical point
and Sales Costs Coefficient is negative, which means that the company cannot pay its variable costs
(20% of development and maintenance key activity total cost), carrying a negative result to pay their
fixed costs.
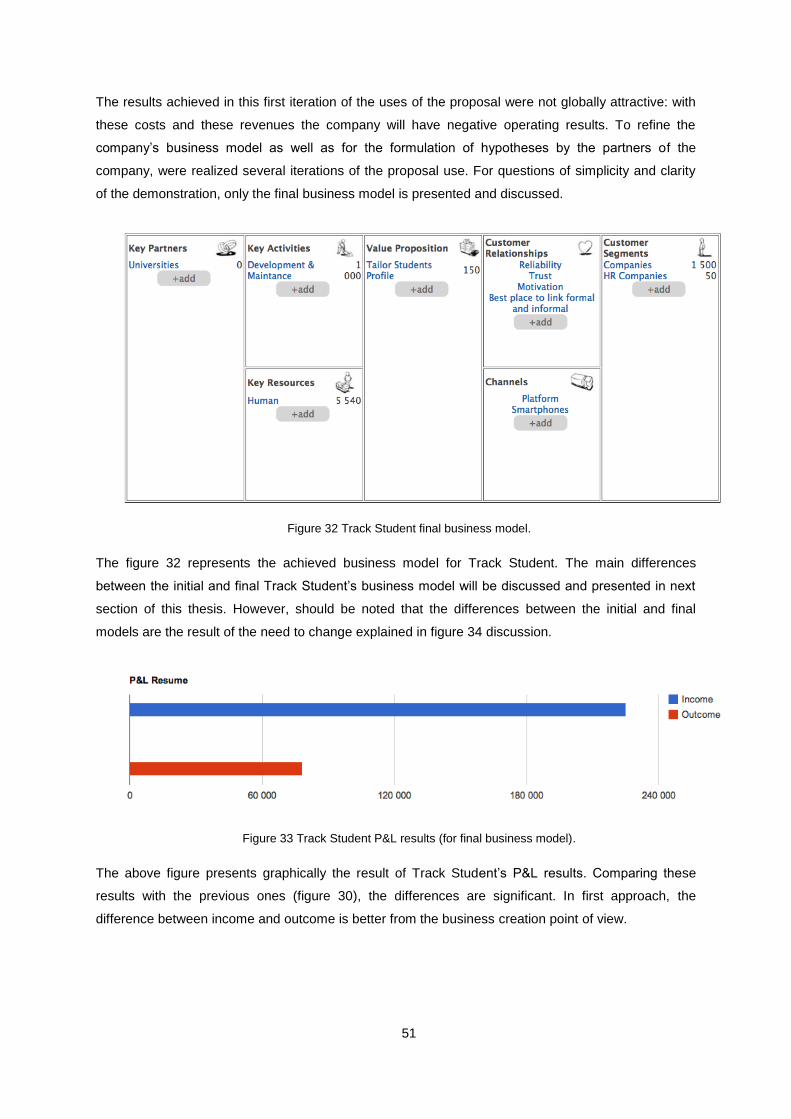
51
The results achieved in this first iteration of the uses of the proposal were not globally attractive: with
these costs and these revenues the company will have negative operating results. To refine the
company‟s business model as well as for the formulation of hypotheses by the partners of the
company, were realized several iterations of the proposal use. For questions of simplicity and clarity
of the demonstration, only the final business model is presented and discussed.
Figure 32 Track Student final business model.
The figure 32 represents the achieved business model for Track Student. The main differences
between the initial and final Track Student‟s business model will be discussed and presented in next
section of this thesis. However, should be noted that the differences between the initial and final
models are the result of the need to change explained in figure 34 discussion.
Figure 33 Track Student P&L results (for final business model).
The above figure presents graphically the result of Track Student‟s P&L results. Comparing these
results with the previous ones (figure 30), the differences are significant. In first approach, the
difference between income and outcome is better from the business creation point of view.

52
Figure 34 Track Student Financial Results (for final business model).
The figure 34 presents the Track Student financial conclusions resulting from the change in its
business model. As can be seen, with the values proposed in figure 32 have the following main
conclusions: the company‟s EBITDA is 219 460 €, the gross margin is 146 520 €, the break even
point (in value) is 76 900 €, the security margin is 2 and finally, the sales costs coefficient is 1 €.
In terms of results discussion the following conclusions can be taken:
The model final model has 219 460 € as EBITDA and the initial one has 6 460 €. It
means that the final business model represents a business with a higher capacity in
generate resources performing its current activities;
The gross margin in final model is 146 520 € positive when the initial one has around 240
000 € negative. This allows to conclude that in general terms the final business model is
more profitable than the initial one;
The break even point of the final model is 76 900 € and the initial model has around 2
400 000 € for the same indicator. It means that cover all initial costs of business
bootstrap takes a lot less money;
The quantity critical point is around 512 units in final model, when in initial one it was 22
402 units. This allows concluding that to cover all initial costs of business bootstrap is
necessary to sell much less quantity to Track Student‟s customers. However, is important
to understand that it implies a higher number of clients;
The security margin in final model is 2 when in initial one was -1. This allows to conclude
that the final business model represents a company that evidence at a higher security
margin in comparison to the break even point (null operating profitability);
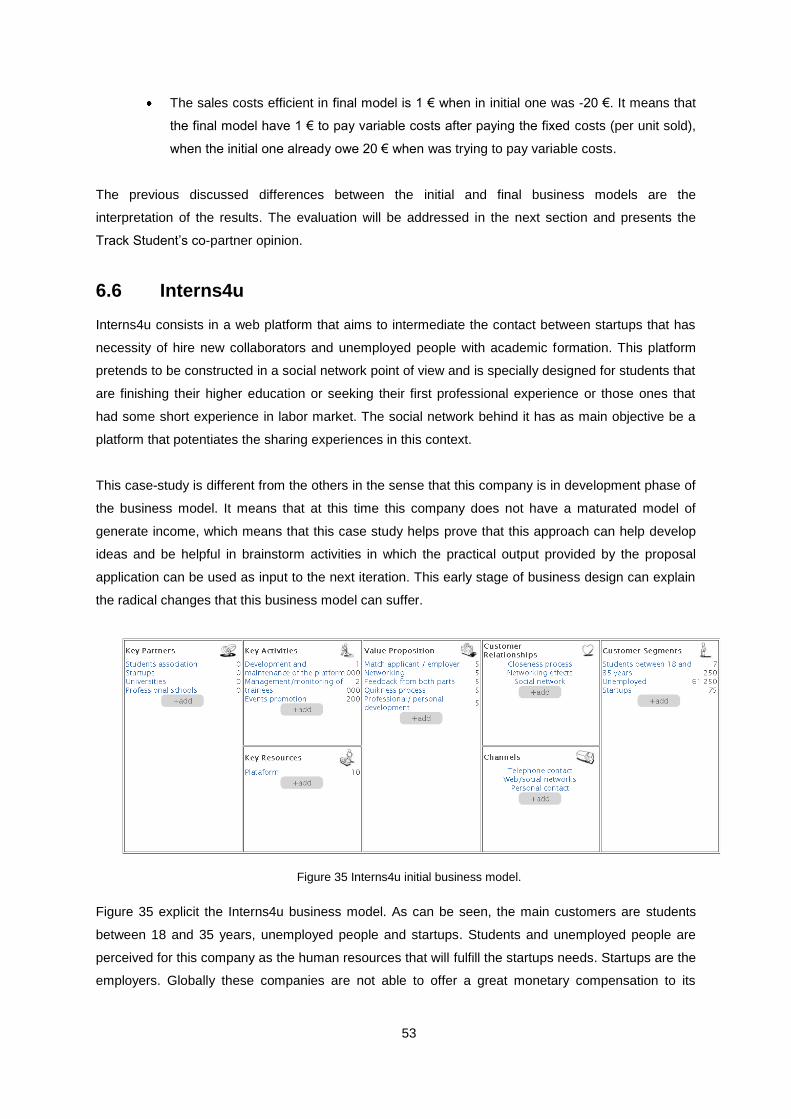
53
The sales costs efficient in final model is 1 € when in initial one was -20 €. It means that
the final model have 1 € to pay variable costs after paying the fixed costs (per unit sold),
when the initial one already owe 20 € when was trying to pay variable costs.
The previous discussed differences between the initial and final business models are the
interpretation of the results. The evaluation will be addressed in the next section and presents the
Track Student‟s co-partner opinion.
6.6 Interns4u
Interns4u consists in a web platform that aims to intermediate the contact between startups that has
necessity of hire new collaborators and unemployed people with academic formation. This platform
pretends to be constructed in a social network point of view and is specially designed for students that
are finishing their higher education or seeking their first professional experience or those ones that
had some short experience in labor market. The social network behind it has as main objective be a
platform that potentiates the sharing experiences in this context.
This case-study is different from the others in the sense that this company is in development phase of
the business model. It means that at this time this company does not have a maturated model of
generate income, which means that this case study helps prove that this approach can help develop
ideas and be helpful in brainstorm activities in which the practical output provided by the proposal
application can be used as input to the next iteration. This early stage of business design can explain
the radical changes that this business model can suffer.
Figure 35 Interns4u initial business model.
Figure 35 explicit the Interns4u business model. As can be seen, the main customers are students
between 18 and 35 years, unemployed people and startups. Students and unemployed people are
perceived for this company as the human resources that will fulfill the startups needs. Startups are the
employers. Globally these companies are not able to offer a great monetary compensation to its
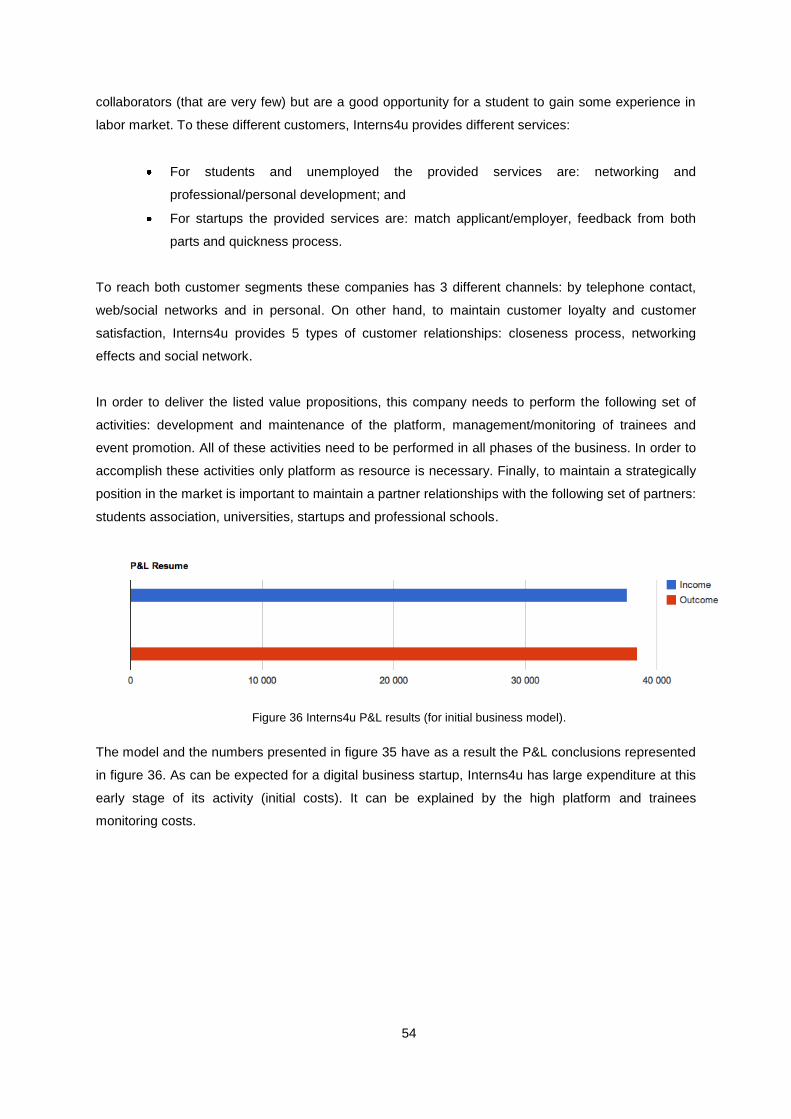
54
collaborators (that are very few) but are a good opportunity for a student to gain some experience in
labor market. To these different customers, Interns4u provides different services:
For students and unemployed the provided services are: networking and
professional/personal development; and
For startups the provided services are: match applicant/employer, feedback from both
parts and quickness process.
To reach both customer segments these companies has 3 different channels: by telephone contact,
web/social networks and in personal. On other hand, to maintain customer loyalty and customer
satisfaction, Interns4u provides 5 types of customer relationships: closeness process, networking
effects and social network.
In order to deliver the listed value propositions, this company needs to perform the following set of
activities: development and maintenance of the platform, management/monitoring of trainees and
event promotion. All of these activities need to be performed in all phases of the business. In order to
accomplish these activities only platform as resource is necessary. Finally, to maintain a strategically
position in the market is important to maintain a partner relationships with the following set of partners:
students association, universities, startups and professional schools.
Figure 36 Interns4u P&L results (for initial business model).
The model and the numbers presented in figure 35 have as a result the P&L conclusions represented
in figure 36. As can be expected for a digital business startup, Interns4u has large expenditure at this
early stage of its activity (initial costs). It can be explained by the high platform and trainees
monitoring costs.
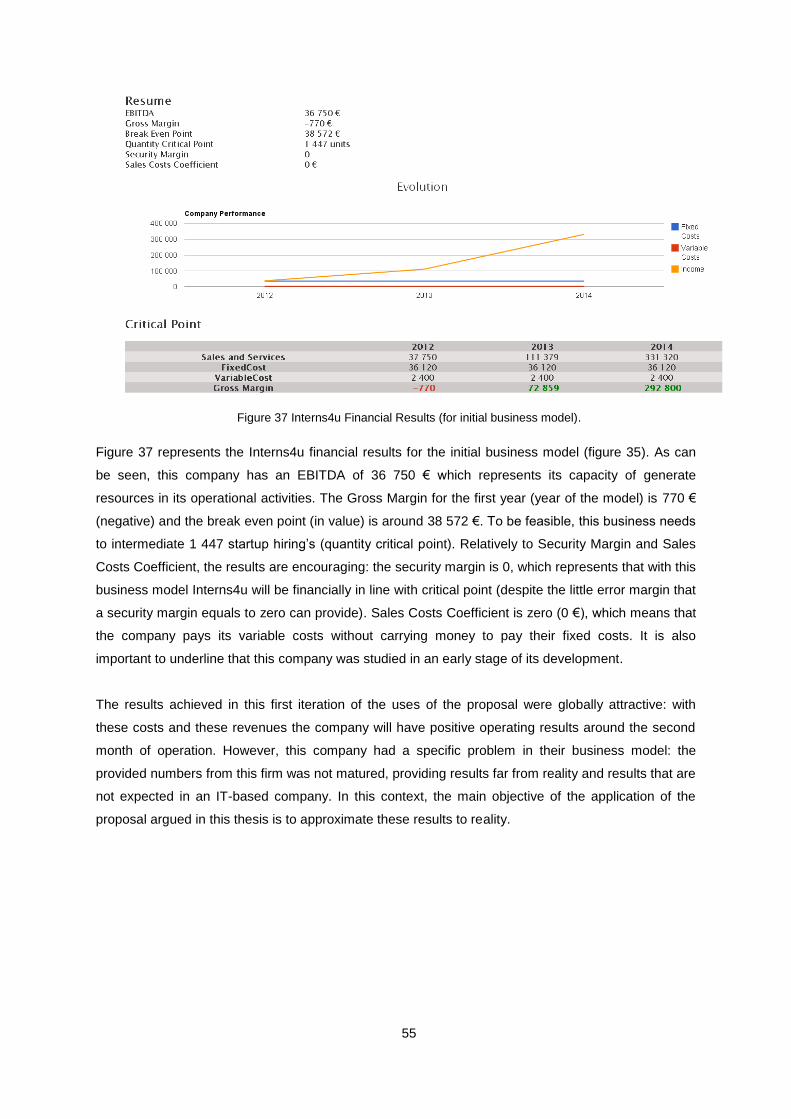
55
Figure 37 Interns4u Financial Results (for initial business model).
Figure 37 represents the Interns4u financial results for the initial business model (figure 35). As can
be seen, this company has an EBITDA of 36 750 € which represents its capacity of generate
resources in its operational activities. The Gross Margin for the first year (year of the model) is 770 €
(negative) and the break even point (in value) is around 38 572 €. To be feasible, this business needs
to intermediate 1 447 startup hiring‟s (quantity critical point). Relatively to Security Margin and Sales
Costs Coefficient, the results are encouraging: the security margin is 0, which represents that with this
business model Interns4u will be financially in line with critical point (despite the little error margin that
a security margin equals to zero can provide). Sales Costs Coefficient is zero (0 €), which means that
the company pays its variable costs without carrying money to pay their fixed costs. It is also
important to underline that this company was studied in an early stage of its development.
The results achieved in this first iteration of the uses of the proposal were globally attractive: with
these costs and these revenues the company will have positive operating results around the second
month of operation. However, this company had a specific problem in their business model: the
provided numbers from this firm was not matured, providing results far from reality and results that are
not expected in an IT-based company. In this context, the main objective of the application of the
proposal argued in this thesis is to approximate these results to reality.

56
Figure 38 Interns4u final business model.
The business model achieved is shown in figure above. This was the result of applying the proposal
iteratively, where the feedback provided was used as input for changing the business model itself.
The main differences between the initial and final Interns4u‟s business model will be discussed and
presented in next section of this thesis. However, should be noted that the differences between the
initial and final models are the result of the need to change explained in figure 40 discussion.
Figure 39 Interns4u P&L results (for final business model).
The above figure presents graphically the result of Interns4u P&L results. Comparing these results
with the previous ones (figure 36), the differences are significant. In first approach there is a
difference between in the order of magnitude, both in profits and in expenses. In a first approach the
results of figure 36 can be more encouraging, and in monetary terms that is right. However, the
results presented in that figure are results of a business model far from reality. As can be expected,
figure 39 represents that this firm has a first year that outcome is higher than income, largely because
the high costs of the platform development (as perceptible for an IT-based company).

57
Figure 40 Interns4u Financial Results (for final business model).
The figure 40 presents the Interns4u financial conclusions resulting from the change in its business
model. As can be seen, with the values proposed in figure 38 have the following main conclusions:
the company‟s EBITDA is 2 538 €, the gross margin is 20 683 €, the break even point (in value) is 55
033 €, the security margin is -1 and finally, the sales costs coefficient is -5 €.
In terms of results discussion the following conclusions can be taken:
The model final model has 2 538 € as EBITDA and the initial one has 36 750 €. It has
occurred because in the initial phase of this case study the prospective of potential
customers was over optimistic. This decrease of customers explain the decrease of
potential for revenue generation;
The gross margin in final model is 20 683 € (negative) when the initial one has around 77
€ (negative). In initial business model there are many costs which are not taken into
account. These costs potentiates a lower gross margin for the first year of exploration;
The break even point of the final model is 55 033 € and the initial model has around 38
752 € for the same indicator. It means that the final business model needs a higher initial
investment than the initial one;
The quantity critical point is around 642 units in final model, when in initial one it was 1
447 units. Despite the break even point in value was increase, the quantity critical point
was decrease as a result of the consolidation of the value propositions that this company
will sell to its potential customers; and
The security margin in final model is -1 when in initial one was 0. This allows to
concludes that the final business model represents a company that evidence a higher
security margin in comparison to the break even point (null operating profitability); and

58
The sales costs efficient in final model is -5 € when in initial one was 0 €. The final
business model has, in fact, more risky than the initial one. This indicator shows that after
paying variable costs this business carries out -5 € to pay fixed costs.
The previous discussed differences between the initial and final business models are the
interpretation of the results. The evaluation will be addressed in the next section and presents the
Interns4u‟s co-partner opinion.

59
7 Evaluation
The evaluation is a fundamental part of this thesis because “has as main objective prove the
effectiveness of the solution” [11]. In this chapter the objective is to justify that the artifact really
supports a solution for the previous identified problem.
Rather than an evaluation based on quantity, this thesis was evaluated in a qualitative point of view,
using interviews. These interviews were performed personally, and cover three different groups of
testimonials:
The first one is based on three testimonials from the companies‟ founders of two first
case studies presented in previous section (Oops!booking and ITIL Maturity Models);
The second one is based on four opinions from the companies‟ founder of the next four
case studies. These four opinions differ from the previous three because different case
studies were performed. Oops!booking and ITIL Maturity Models are pre-established
companies, with a solid basis and experienced but without a business model modeled
with business model canvas and otherwise the others four are companies that were
finalists from startups‟ competition but looking to establish themselves in the market. Is
important to note that all of these four companies were designed from root applying
business model canvas: which suggests that these companies already have matured
ideas about its business model; and
The third and the last one are based testimonials from three specialists.
Each of one group of testimonials has one dedicated section to address it.
7.1 Business Modeling of Pre-Established Companies
Pedro Carmo de Oliveira is Master in Software Engineering/Management of Technology by Instituto
Superior Técnico and after some work experience founded Oops!booking. When invited to discuss
the case-study achieved results (Fig.12), he considers that there are extremely useful because “is
easier to verify if a business is feasible or not and what is the best integration of all canvas
components”. Furthermore, when speech about the new financial information provided he thinks that
with this new information he is able to “better understand with the graphical conclusions the financial
consequences of canvas in the particular case of Oops!booking”. In relation to prove that if the
financial analysis provided leads to a change of the business model he considers that “with this
analysis we are able to better understand my company business model and it is a great tool to
support our business plan”.
Ruben Pereira and Carlos Mendes are actually Ph.D. students in Information Systems in Instituto
Superior Técnico. With their ITIL experience they decided to create the ITIL Maturity Model together.

60
For Ruben Pereira, and when invited to discuss the results of the case study previous presented, he
considers that the result was “encouraging because it is able to catalyze people to bring successful
projects”. Continuing he refers that this “attachment of financial analysis to business model canvas
provides a more useful tool to design a business”. In relation to prove that if the financial analysis
leads to a change of business model he argues that “this financial analysis is an added value for the
framework, despite that it does not solve all problems related to the analysis of business projects, but
however it is a considerable advance because the financial component is the critical factor in
entrepreneurship evaluation projects”.
In the opinion of Carlos Mendes the achieved result “needs to be more flexible in order to be able to model
the largest possible number of firms”. However he considers that the financial analysis attachment to
canvas is “more useful” because “help design and redesign the business model in order to test the entire
firm hypothesis to achieve profit”. Concluding his interview, Carlos argued that “this financial projection
allows testing the most effective way for a company to generate gain”.
7.2 Business Model Change Based on Financial Conclusions
Following there are discussed the achieved results for the case studies in which were more than one
iteration of application of the proposal. The main intent of these cases is prove that with the approach
argued in this thesis the final business model will be different from when is applied the business
model canvas (without any extension). In order to illustrate the concrete changes between those
initials and finals business models, all of these four cases have a figure that materializes those
changes. Each of these figures is composed by:
Red lines: that are model components that belongs to the initial model but not in the final;
Green lines: that are model components that belongs to the final model but not in the
initial; and
Black lines: that is model components that belong to initial and final models.

61
Figure 41 Difference between initial and final Portal dos Serviços business model.
Figure 41 illustrates the difference between the initial and final Portal dos Serviços business model.
Those changes are motivated (as mentioned in previous section) by the necessity of decrease the
break even point in value.
Paulo Quendera is Mechanical Engineer from Instituto Superior Técnico and nowadays is partner and
co-founder of Portal de Serviços. At the end of the case study with his company, an interview was
conducted with the intent to collect his testimony concerning the proposal of this thesis. When invited
to comment the added value that can be achieved using this approach he says that “the result shows
a tendency in line with the projections given by our business plan by which presents itself as a good
basis for business analysis, measuring the values that in the beginning does not are previously
quantified”.
Since the business model used and described in this paper as initial had some degree of maturity,
what difficult the necessity of realize changes on it, but in other hand values any change that takes
place. When invited to discuss the differences between the canvas without and with this extension
and the utility that this way of thinking could have been useful during the creation of his startup he
considers that “the financial analysis is the last thing you usually consider in a project, so sometimes
we invest all the time to develop it instead of concerns about it financial viability”. When questioned
about if with this approach we will obtain the same business model than without it, the answer the
following: “at the same time that the project is being developed, we are able to realize some financial
traceability and understand which processes contributes most to the increase of costs and it can be
changed even in draft form”.
Relatively to the evaluation of Paulo Quendera to the presented proposal, he concludes that “the
business model associated with a financial projection optimizes the development phase of the project
and does not delegate all financial concerns to the financial analysis stage.”

62
Figure 42 Difference between initial and final Laurus Living‟s business model.
Figure 42 illustrates the difference between the initial and final Laurus Living business model. Those
changes are motivated by the necessity of adapt the already existent business model to reality and to
put it in accordance with the Laurus Living financial plan.

63
Vasco Rosa da Silva is graduate in Economics by Instituto Superior de Economia e Gestão. Despite
his successful career (worked in consultants, banks and telecommunications industry) Laurus Living
is the first tentative to create a company. Relatively to the result of the application of this thesis
proposal to Laurus Living, Vasco says that it was a “stimulant initiative” because “is very practical,
very simple, and very intuitive” and produce “fast results, with relevant value for who needs to make
decisions”. For him this approach “can lead to a model closer [when compared to business model
canvas without this extension] to reality”. In Laurus Living particular case he defends that it was “very
useful to align Laurus Living‟ business model to the financial plan”.
Figure 43 Difference between initial and final Track Student‟s business model.
Figure 43 illustrates the difference between the initial and final Portal dos Serviços business model.
Those changes are motivated (as mentioned in previous section) by the necessity of mature the
business model itself and to discover opportunities to make it more profitable.
Miguel Frade is Master in Business Administration by Católica Lisbon School of Business and
Economics and is co-founder of Track Student. In his words this approach “was very useful to test
hypothesis and simulate different scenarios than expected”. In other hand, “it leads to who is fulfilling
the model to a different set of questions that were potential unexplored and not addressed before in a
startup development process”. Relatively to the Track Student‟s case in particular he is “delighted”
with the results because the “business model previously designed worked as expected”.
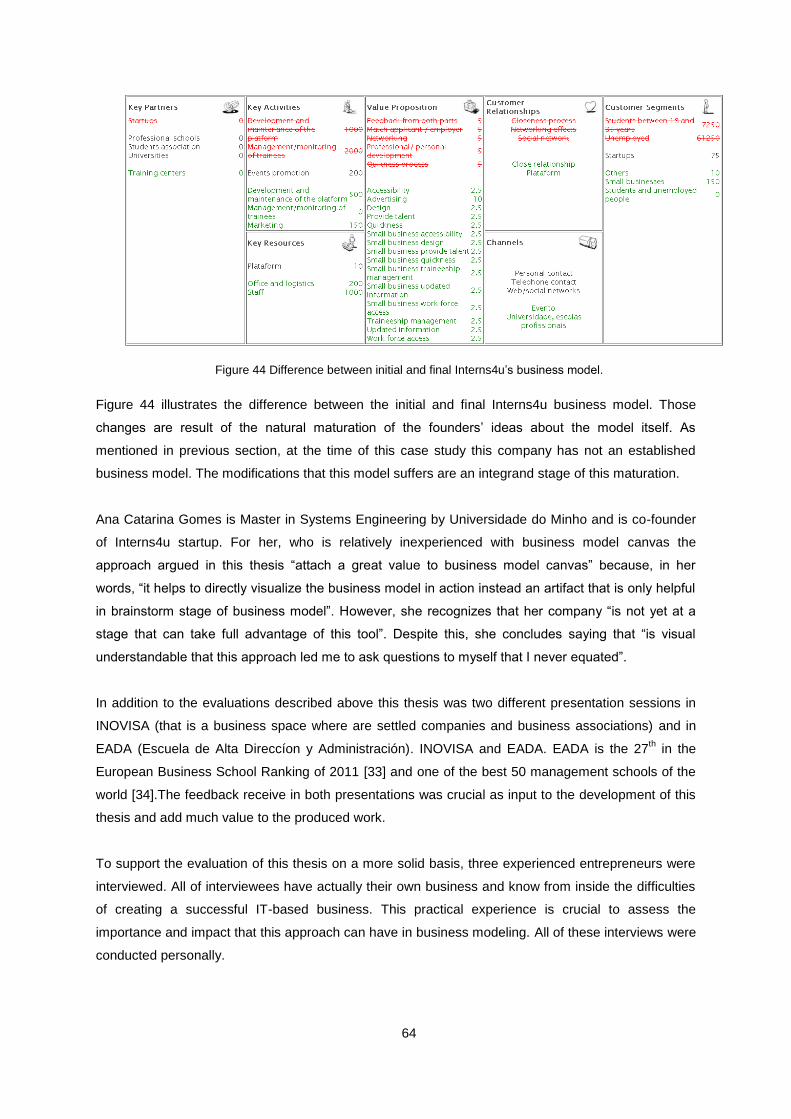
64
Figure 44 Difference between initial and final Interns4u‟s business model.
Figure 44 illustrates the difference between the initial and final Interns4u business model. Those
changes are result of the natural maturation of the founders‟ ideas about the model itself. As
mentioned in previous section, at the time of this case study this company has not an established
business model. The modifications that this model suffers are an integrand stage of this maturation.
Ana Catarina Gomes is Master in Systems Engineering by Universidade do Minho and is co-founder
of Interns4u startup. For her, who is relatively inexperienced with business model canvas the
approach argued in this thesis “attach a great value to business model canvas” because, in her
words, “it helps to directly visualize the business model in action instead an artifact that is only helpful
in brainstorm stage of business model”. However, she recognizes that her company “is not yet at a
stage that can take full advantage of this tool”. Despite this, she concludes saying that “is visual
understandable that this approach led me to ask questions to myself that I never equated”.
In addition to the evaluations described above this thesis was two different presentation sessions in
INOVISA (that is a business space where are settled companies and business associations) and in
EADA (Escuela de Alta Direccíon y Administración). INOVISA and EADA. EADA is the 27th in the
European Business School Ranking of 2011 [33] and one of the best 50 management schools of the
world [34].The feedback receive in both presentations was crucial as input to the development of this
thesis and add much value to the produced work.
To support the evaluation of this thesis on a more solid basis, three experienced entrepreneurs were
interviewed. All of interviewees have actually their own business and know from inside the difficulties
of creating a successful IT-based business. This practical experience is crucial to assess the
importance and impact that this approach can have in business modeling. All of these interviews were
conducted personally.

65
7.3 Experts Evaluation
Ana Paula Pereira is Master in Electrical and Computer Engineering by Instituto Superior Técnico.
Founded two different companies which even today are in operation and has some publications in
Cutter Consortium [35]. In her opinion “a P&L analysis adds value because sometimes I just only want
to show that‟s calculations instead of the business model” and it is an “innovative approach”. When
invited to discuss the impact of this proposal on the model she says that “this analysis can lead to a
better business model because it can tune the model with the reality”.
João Perre Viana is an experienced entrepreneur and is invited teacher in management universities
all over Europe (concretely, EADA and Kyiv-Mohyla Business School). In business already had
developed projects in more than 10 countries and is founder of several companies. He considers that
this proposal “complements the whole process of creating the business model” and the financial
analysis provided “take the model closer to the reality”. In conclusion, “in order to quantify business
elements, a financial analysis is an acid test that allows reducing the natural associated risk”.
António Lucena de Faria in addiction to an experienced entrepreneur is founder and CEO of Fábrica
de Startups S.A., an incubator of startups, in addition to other companies that founded. He considers
that “this approach allows obtaining a tangible and useful result to obtain a first overview about a
business”. This analysis, which attach a P&L statement to a business model enables us to “obtain a
different business model and earlier understand the profitability of the project and it prevents to
understand only at the end that the project has no future”.

66

67
8 Conclusion
The business model term is increasingly important and actually is widely important. This concept
brings to the center of the discussion relevant topics such as if a business will be lucrative or not and
how can we model our organization in order to make it profitable. This may seem obvious, but a wide
range of business as failed because it could not answer simple questions like these.
These concerns become increasingly important with the advent of the new digital business firms. With
the technological evolutions that are observed nowadays, never become so easy to start a business
that has the channel over a technological platform. However, despite this facility almost all business
created since this new digital era proved to be inefficient.
The main objective of this thesis is proving that an accurate financial analysis leads to a different
business model. In order to do that this thesis has foundation on a well accepted modeling language
and framework and tried to improve that with a financial projections mechanism.
The extension to business model canvas proposed to help who wants to model their business was
tested on practice with six different new digital business organizations. To evaluate and validate these
extension two company partners of these organizations and three specialists on business models
subject were interviewed.
The conclusion reached in this work is that a financial analysis attached to a business model (in a
design phase) leads to a different business model. It means, in a first approach that this concepts are
not separable and we should not think them separately. In other words, when this proposal is
compared with the business model canvas, we understand that a great (in a design point of view)
business model does not mean that it will be profitable. Summarizing, a financial projection is a very
important component of any business model.
Other conclusion that can be reachable from this thesis is that the quantification of the elements
presents in a business model helps to design it. Basically, this quantification (for instance, how many
customers are we expecting for that customer segment or what will really cost for clients this value
proposition) helps to understand if the intent of be profitable with that specific quantity of elements is
feasible or not.
The last conclusion that we can reach from this thesis is that with the merge of business model
concept and financial projections some complex questions can be answered. For example, when a
need business is started some strategically choices needs to be made and with this approach is
possible to know what is the most valuable channel of the business or if all value propositions are
being sold at the right price.
Despite the previous presented conclusions is important to note some constraints and limitations of
the proposal of this thesis. The main limitations of this work are the lack an association between pre-
68
established pricing models and the business model canvas and the second one are the constraints
imposed to the model in order to make it computable. With business model canvas can be reached
several conclusions (depending on the way that is related the information provided in building blocks)
and with this approach we reduce the range of potential findings to specialize the model in financial
conclusion.
Future work of this thesis is based on provide a structured and reasoned strategic approach. This
point, although it has not been addressed in the course of this thesis represents a great opportunity to
companies to take advantage from competitors. As [36] argues “strategy is an integrated and
coordinated set of commitments and actions designed to exploit core competencies and gain
competitive advantage”. With this new insight business model canvas may become a model not only
to define the organization internally but also to position it strategically to achieve the primary objective:
generating wealth.
69
References
[1] Zott, R.A.: „Value Creation in E-Business‟, Strategic Management Journal, 2001, 22, pp. 520 [2] Weill, P., and Vitale, M.: „What IT Infrastructure Capabilities are Needed to Implement E-Business Models?‟, MIS Quarterly Executive, 2002, 1, (1), pp. 34 [3] Morris, M., Schindehutte, M., and Allen, J.: „The entrepreneur‟s business model: toward a unified perspective‟, Journal of Business Research, 2005, 58, pp. 735 [4] Osterwalder, A., and Pigneur, Y.: „Business Model Generation: A Handbook for Visionaries, Game Changers, and Challengers‟ (Wiley, 2010. 2010) [5] Sengupta, C.: „Financial Modeling Using Excel and VBA‟ (John Wiley & Sons, 2004. 2004) [6] Shim, J.: „Handbook of Financial Analysis Forecasting and Modeling‟ (CCH, 2001. 2001) [7] Booch, G., Rumbaugh, J., and Jacobson, I.: „Unified Modeling Language User Guide, The (2nd Edition) (The Addison-Wesley Object Technology Series)‟ ({Addison-Wesley Professional}, 2005. 2005) [8] Van de Ven, A.H., Hudson, R., and Schroeder, D.M.: „Designing New Business Startups: Entrepreneurial, Organizational, and Ecological Considerations‟, Journal of Management, 1984, 10, (1), pp. 87-108 [9] Blank, S.: „The Four Steps to the Epiphany‟ (Cafepress.com, 2005. 2005) [10] Helfert, E.A.: „Financial analysis tools and techniques: a guide for managers‟ (McGraw-Hill, 2001, 10th edn. 2001) [11] Peffers, K., Tuunanen, T., Rothenberger, M.A., and Chatterjee, S.: „A Design Science Research Methodology for Information Systems Research‟, Journal of Management Information Systems, 2008, 24, (3), pp. 78 [12] Pateli, A.G., Giaglis, G.M., and George, A.G.P.: „A Framework for Understanding and Analysing e-Business Model‟, Eur. J. Inf. Syst., 2003, 13, (4), pp. 12 [13] Jones, S., Wilikens, M., Morris, P., and Masera, M.: „Trust requirements in e-business‟, Commun. ACM, 2000, 43, (12), pp. 81-87 [14] Varian, C.S.a.H.R.: „Information Rules: A Strategic Guide to the Network Economy‟ (Bons: Harvard Business School Press, 1999. 1999) [15] Timmers, P.: „Business Models for Electronic Markets‟, Electronic Markets, 1998, 8, pp. 3-8 [16] Vitalle, P.W.a.M.R.: „Place to Space. Migrating to E-business Models‟ (Boston: Harvard Business School Press, 2001. 2001) [17] Chesbrough, H.: „Business model innovation: it's not just about technology anymore‟, Strategy & Leadership, 2007, 35, (6), pp. 12-17 [18] Bouwman, H., Vos, H.d., and Haaker, T.: „Mobile Service Innovation and Business Models‟ (Springer Publishing Company, Incorporated 2010. 2010) [19] Jansen, W., Steenbakkers, W., and Jäegers, H.: „New Business Models for the Knowledge Economy‟ (Gower Publishing Limited, 2007. 2007) [20] R., A., and H-D., Z.: „Preface: Introduction to Special Section - Business Models‟, Electronic Markets, 2001, 11, (1), pp. 9
70
[21] Osterwalder, A., Pigneur, Y., and Tucci, C.: „Clarifying business models: Origins, present, and future of the concept‟, Communications of the Association for Information Systems, 2005, 16, (1), pp. 1-25 [22] Chesbrough, H., and Rosenbloom, R.S.: „The role of the business model in capturing value from innovation: evidence from Xerox Corporation's technology spin-off companies‟, Industrial and Corporate Change, 2002, 11, pp. 26 [23] Haaker, T., Faber, E., and Bouwman, H.: „Balancing customer and network value in business models for mobile services‟, Int. J. Mob. Commun., 2006, 4, (6), pp. 645-661 [24] LeanLaunchLab. "Test and innovate on your business model using the business model canvas, lean startup, and customer development." Internet: www.leanlaunchlab.com/, accessed 24 May 2012 [25] Business Model Foundry GmbH. "Strategyzer: Your Business Model Toolbox on Strategyzer." Internet: https://strategyzer.com/, accessed 24 May 2012 [26] Zolnowski, A., Semmann, M., and Böhmann, T.: „Metamodels for Representing Service Business Models‟, in Editor (Ed.)^(Eds.): „Book Metamodels for Representing Service Business Models‟ (Sprouts: Working Papers on Information Systems, 2011, edn.), pp. 13 [27] Hamel, G.: „Leading the Revolution: How to Thrive in Turbulent Times by Making Innovation a Way of Life‟ (Penguin Group, 2003. 2003) [28] Linder, J., and Cantrell, S.: „Changing Business Models: Surveying the Landscape‟, in Editor (Ed.)^(Eds.): „Book Changing Business Models: Surveying the Landscape‟ (accenture Institute for Strategic Change, 2000, edn.), pp. 15 [29] Teece, D.J.: „Business Models, Business Strategy and Innovation‟, International Journal of Strategic Management, 2010, 43, pp. 22 [30] Marcos António de Sousa, C.S.a.F.B.F.: „Cost-Volume-Profit analysis as management tools: a multi case study in large industrial companies‟, Accounting and Organizations, 2011, 5, (12), pp. 25 [31] Rayburn, L.G.: „Cost accounting: using a management approach‟ (Irwin MacGraw-Hill, 1996, 6 edn. 1996) [32] Outsystems. "OutSystems offers a complete application development and management platform to develop, deploy, manage and change custom enterprise web applications." Internet: www.outsystems.com, accessed 4 March 2012 [33] Financial Times. "European Business School Rankings 2011" Internet: rankings.ft.com/businessschoolrankings/european-business-school-rankings-2011, accessed 20 May 2012 [34] Financial Times. "Masters in Management 2011" Internet: http://rankings.ft.com/businessschoolrankings/masters-in-management-2011, accessed 20 May 2012 [35] Cutter Consortium. http://www.cutter.com, accessed 2 July 2012 [36] Hitt, H.a.I.: „Management of Strategy: concepts and cases‟ (Thomson South-Western, 2007, Seventh edn. 2007)

71