financial report nine-month 2021
TRANSCRIPT
FinancialReport
NINE-MONTH
2021

The purpose of Idorsia is to discover, develop and commercialize innovative medicines to help more patients. We have more ideas, we see more opportunities and we want to transform the horizon of therapeutic options.
ContentsContents
16Unaudited InterimConsolidated Financial Statements
4 Financial Review
Contents navigation
> Contents
Financial Review
Unaudited Interim Consolidated Financial Statements
3

Financial Review
Idorsia measures and reports its non-GAAP operating performance, which management believes more accurately reflects the underlying business performance. The Group believes that these non-GAAP financial measurements provide useful supplementary information for investors. These non-GAAP measures are reported in addition to, not as a substitute for, US GAAP financial performance.
Rounding differences may occurnm = not meaningful
Idorsia’s key numbers
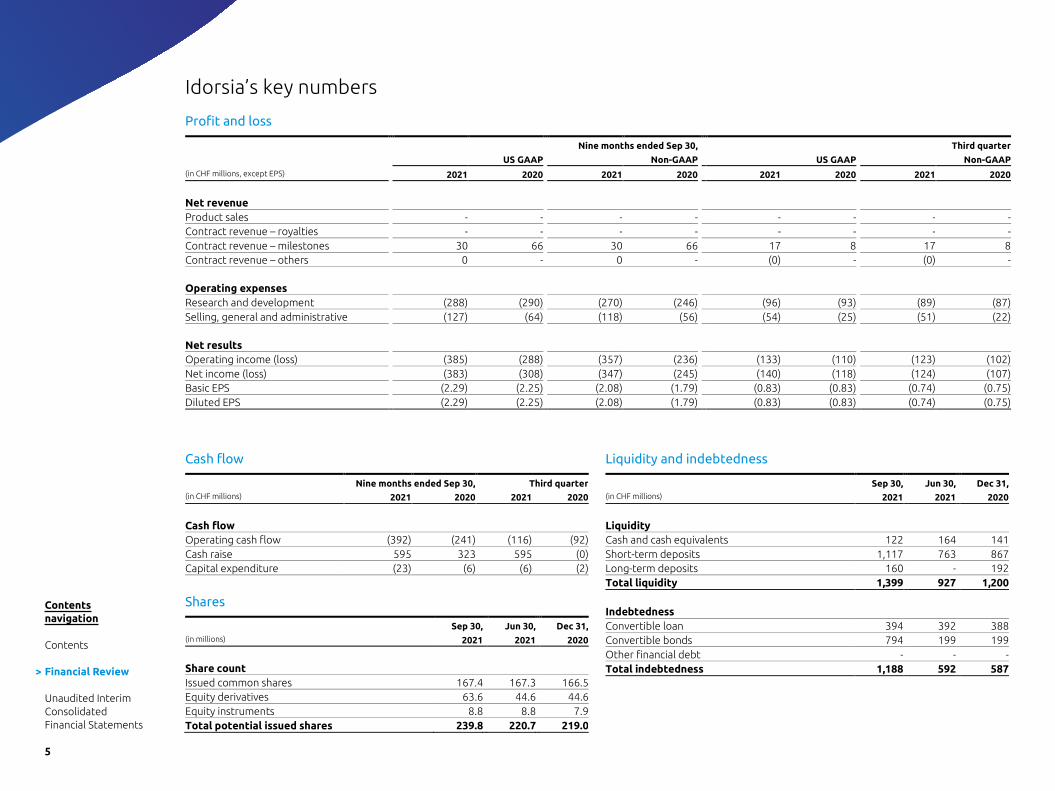
Profit and loss
Nine months ended Sep 30, Third quarter
US GAAP Non-GAAP US GAAP Non-GAAP
(in CHF millions, except EPS) 2021 2020 2021 2020 2021 2020 2021 2020
Net revenue Product sales - - - - - - - - Contract revenue – royalties - - - - - - - - Contract revenue – milestones 30 66 30 66 17 8 17 8 Contract revenue – others 0 - 0 - (0) - (0) - Operating expenses Research and development (288) (290) (270) (246) (96) (93) (89) (87) Selling, general and administrative (127) (64) (118) (56) (54) (25) (51) (22) Net results Operating income (loss) (385) (288) (357) (236) (133) (110) (123) (102) Net income (loss) (383) (308) (347) (245) (140) (118) (124) (107) Basic EPS (2.29) (2.25) (2.08) (1.79) (0.83) (0.83) (0.74) (0.75) Diluted EPS (2.29) (2.25) (2.08) (1.79) (0.83) (0.83) (0.74) (0.75)
Cash flow
Nine months ended Sep 30, Third quarter (in CHF millions) 2021 2020 2021 2020
Cash flow Operating cash flow (392) (241) (116) (92) Cash raise 595 323 595 (0) Capital expenditure (23) (6) (6) (2)
Shares
Sep 30, Jun 30, Dec 31, (in millions) 2021 2021 2020
Share count Issued common shares 167.4 167.3 166.5 Equity derivatives 63.6 44.6 44.6 Equity instruments 8.8 8.8 7.9 Total potential issued shares 239.8 220.7 219.0
Liquidity and indebtedness
Sep 30, Jun 30, Dec 31, (in CHF millions) 2021 2021 2020
Liquidity Cash and cash equivalents 122 164 141 Short-term deposits 1,117 763 867 Long-term deposits 160 - 192 Total liquidity 1,399 927 1,200 Indebtedness Convertible loan 394 392 388 Convertible bonds 794 199 199 Other financial debt - - - Total indebtedness 1,188 592 587
Contents navigation
Contents
> Financial Review
Unaudited Interim Consolidated Financial Statements
5
Revenue
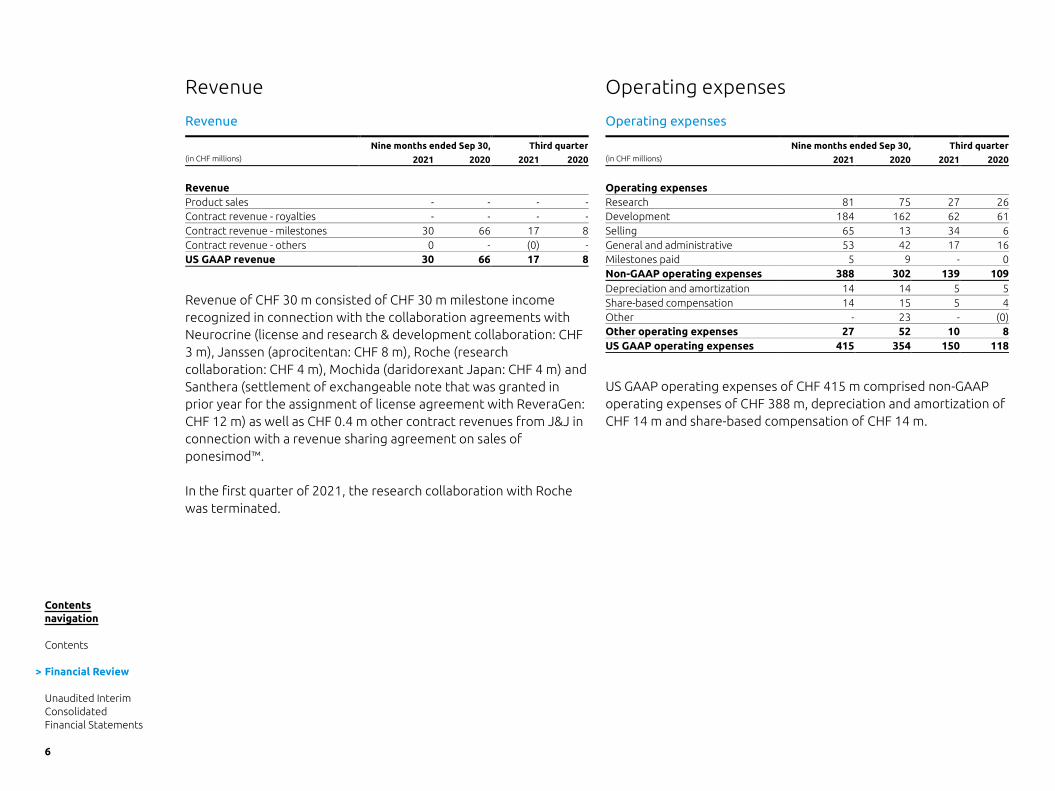
Revenue
Nine months ended Sep 30, Third quarter (in CHF millions) 2021 2020 2021 2020
Revenue Product sales - - - - Contract revenue - royalties - - - - Contract revenue - milestones 30 66 17 8 Contract revenue - others 0 - (0) - US GAAP revenue 30 66 17 8
Revenue of CHF 30 m consisted of CHF 30 m milestone income recognized in connection with the collaboration agreements with Neurocrine (license and research & development collaboration: CHF 3 m), Janssen (aprocitentan: CHF 8 m), Roche (research collaboration: CHF 4 m), Mochida (daridorexant Japan: CHF 4 m) and Santhera (settlement of exchangeable note that was granted in prior year for the assignment of license agreement with ReveraGen: CHF 12 m) as well as CHF 0.4 m other contract revenues from J&J in connection with a revenue sharing agreement on sales of ponesimod™.
In the first quarter of 2021, the research collaboration with Roche was terminated.
Operating expenses
Operating expenses
Nine months ended Sep 30, Third quarter (in CHF millions) 2021 2020 2021 2020
Operating expenses Research 81 75 27 26 Development 184 162 62 61 Selling 65 13 34 6 General and administrative 53 42 17 16 Milestones paid 5 9 - 0 Non-GAAP operating expenses 388 302 139 109 Depreciation and amortization 14 14 5 5 Share-based compensation 14 15 5 4 Other - 23 - (0) Other operating expenses 27 52 10 8 US GAAP operating expenses 415 354 150 118
US GAAP operating expenses of CHF 415 m comprised non-GAAP operating expenses of CHF 388 m, depreciation and amortization of CHF 14 m and share-based compensation of CHF 14 m.
Contents navigation
Contents
> Financial Review
Unaudited Interim Consolidated Financial Statements
6

Revenue
Revenue
Nine months ended Sep 30, Third quarter (in CHF millions) 2021 2020 2021 2020
Revenue Product sales - - - - Contract revenue - royalties - - - - Contract revenue - milestones 30 66 17 8 Contract revenue - others 0 - (0) - US GAAP revenue 30 66 17 8
Revenue of CHF 30 m consisted of CHF 30 m milestone income recognized in connection with the collaboration agreements with Neurocrine (license and research & development collaboration: CHF 3 m), Janssen (aprocitentan: CHF 8 m), Roche (research collaboration: CHF 4 m), Mochida (daridorexant Japan: CHF 4 m) and Santhera (settlement of exchangeable note that was granted in prior year for the assignment of license agreement with ReveraGen: CHF 12 m) as well as CHF 0.4 m other contract revenues from J&J in connection with a revenue sharing agreement on sales of ponesimod™.
In the first quarter of 2021, the research collaboration with Roche was terminated.
Operating expenses
Operating expenses
Nine months ended Sep 30, Third quarter (in CHF millions) 2021 2020 2021 2020
Operating expenses Research 81 75 27 26 Development 184 162 62 61 Selling 65 13 34 6 General and administrative 53 42 17 16 Milestones paid 5 9 - 0 Non-GAAP operating expenses 388 302 139 109 Depreciation and amortization 14 14 5 5 Share-based compensation 14 15 5 4 Other - 23 - (0) Other operating expenses 27 52 10 8 US GAAP operating expenses 415 354 150 118
US GAAP operating expenses of CHF 415 m comprised non-GAAP operating expenses of CHF 388 m, depreciation and amortization of CHF 14 m and share-based compensation of CHF 14 m.
Research and development (“R&D”) expenses
Nine months ended Sep 30, Third quarter (in CHF millions) 2021 2020 2021 2020
R&D expenses Research 81 75 27 26 Development 184 162 62 61 Milestones paid 5 9 - 0 Non-GAAP R&D expenses 270 246 89 87 Depreciation and amortization 11 12 5 4 Share-based compensation 7 9 2 2 Other - 23 - (0) US GAAP R&D expenses 288 290 96 93
Non-GAAP research expenses amounted to CHF 81 m, comprising biology (CHF 20 m), chemistry (CHF 25 m) and preclinical activities (CHF 36 m).
Non-GAAP development expenses amounted to CHF 184 m, comprising CHF 112 m for clinical activities (including CHF 70 m study costs, mainly driven by late stage studies for daridorexant, cenerimod, clazosentan, selatogrel, lucerastat, aprocitentan), CHF 58 m for chemical and pharmaceutical development activities (including CHF 21 m for drug substance and CHF 15 m for drug product) and CHF 14 m related to inventory build up.
Milestones paid of CHF 5 m related to the clazosentan filing in Japan.
Selling, general and administrative (“SG&A”) expenses
Nine months ended Sep 30, Third quarter (in CHF millions) 2021 2020 2021 2020
SG&A expenses Selling 65 13 34 6 General and administrative 53 42 17 16 Non-GAAP SG&A expenses 118 56 51 22 Depreciation and amortization 2 3 1 1 Share-based compensation 7 6 3 2 Other - - - - US GAAP SG&A expenses 127 64 54 25
Non-GAAP SG&A expenses amounted to CHF 118 m, comprising CHF 65 m for commercial activities, CHF 26 m for information systems and CHF 27 m for other support functions.
Contents navigation
Contents
> Financial Review
Unaudited Interim Consolidated Financial Statements
7

Operating results
Non-GAAP and US GAAP operating results
Nine months ended Sep 30, Third quarter (in CHF millions) 2021 2020 2021 2020
Operating results Contract revenues 30 66 17 8 Operating expenses (388) (302) (139) (109) Non-GAAP operating income (loss) (357) (236) (123) (102)
Operating results Contract revenues 30 66 17 8 Operating expenses (415) (354) (150) (118) US GAAP operating income (loss) (385) (288) (133) (110)
The CHF 28 m difference between the non-GAAP and the US GAAP operating loss related to depreciation and amortization of CHF 14 m and share-based compensation of CHF 14 m.
Financial results
Financial results
Nine months ended Sep 30, Third quarter (in CHF millions) 2021 2020 2021 2020
Financial results Interest income (expense), net (3) (1) (3) (0) Other financial income (expense), net
17 (6) 3 (4)
Non-GAAP financial income (expense) 13 (7) (0) (5)
Accretion expense (6) (6) (2) (2) Gain (loss) on securities (4) (7) (4) (3) US GAAP financial income (expense)
3 (20) (6) (10)
Non-GAAP financial income mainly consists of currency exchange rate gains on USD funds held to cover future USD expenses. The CHF 10 m difference between the non-GAAP and the US GAAP financial result includes the non-cash accretion expense of CHF 6 m relating to the convertible debt and an unrealized loss of CHF 4 m on securities.
Contents navigation
Contents
> Financial Review
Unaudited Interim Consolidated Financial Statements
8

Operating results
Non-GAAP and US GAAP operating results
Nine months ended Sep 30, Third quarter (in CHF millions) 2021 2020 2021 2020
Operating results Contract revenues 30 66 17 8 Operating expenses (388) (302) (139) (109) Non-GAAP operating income (loss) (357) (236) (123) (102)
Operating results Contract revenues 30 66 17 8 Operating expenses (415) (354) (150) (118) US GAAP operating income (loss) (385) (288) (133) (110)
The CHF 28 m difference between the non-GAAP and the US GAAP operating loss related to depreciation and amortization of CHF 14 m and share-based compensation of CHF 14 m.
Financial results
Financial results
Nine months ended Sep 30, Third quarter (in CHF millions) 2021 2020 2021 2020
Financial results Interest income (expense), net (3) (1) (3) (0) Other financial income (expense), net
17 (6) 3 (4)
Non-GAAP financial income (expense) 13 (7) (0) (5)
Accretion expense (6) (6) (2) (2) Gain (loss) on securities (4) (7) (4) (3) US GAAP financial income (expense)
3 (20) (6) (10)
Non-GAAP financial income mainly consists of currency exchange rate gains on USD funds held to cover future USD expenses. The CHF 10 m difference between the non-GAAP and the US GAAP financial result includes the non-cash accretion expense of CHF 6 m relating to the convertible debt and an unrealized loss of CHF 4 m on securities.
Income tax
Income tax
Nine months ended Sep 30, Thrird quarter (in CHF millions) 2021 2020 2021 2020
Income tax Income tax benefit (expense) (3) (2) (1) (1) Non-GAAP tax benefit (expense) (3) (2) (1) (1) Other tax benefit (expense) 2 1 0 2 US GAAP income tax benefit (expense)
(1) (0) (0) 1
Both US- and non-GAAP tax expense included an increase of the valuation allowance of CHF 50 m, mainly related to deferred tax assets arising from operating losses which can be carried forward for 7 years.
Net results, EPS and shares
Net results
Nine months ended Sep 30, Third quarter (in CHF millions) 2021 2020 2021 2020
Non-GAAP operating income (loss)
(357) (236) (123) (102)
Financial income (expense) 13 (7) (0) (5) Income tax benefit (expense) (3) (2) (1) (1) Non-GAAP net income (loss) (347) (245) (124) (107) US GAAP operating income (loss) (385) (288) (133) (110) Financial income (expense) 3 (20) (6) (10) Income tax benefit (expense) (1) (0) (0) 1 US GAAP net income (loss) (383) (308) (140) (118) Net loss attributable to noncontrolling interests
- 0 - 0
US GAAP net income (loss) attributable to Idorsia's shareholders
(383) (308) (140) (118)
The CHF 36 m difference between the non-GAAP and the US GAAP net loss was mainly due to depreciation and amortization of CHF 14 m, share-based compensation of CHF 14 m, the financial accretion expense of CHF 6 m relating to the convertible debt and an unrealized net loss of CHF 4 m on securities.
Contents navigation
Contents
> Financial Review
Unaudited Interim Consolidated Financial Statements
9
Shares
Issued Potentially dilutive equity instruments
Total potential
issued shares
(in millions) Derivatives Awards
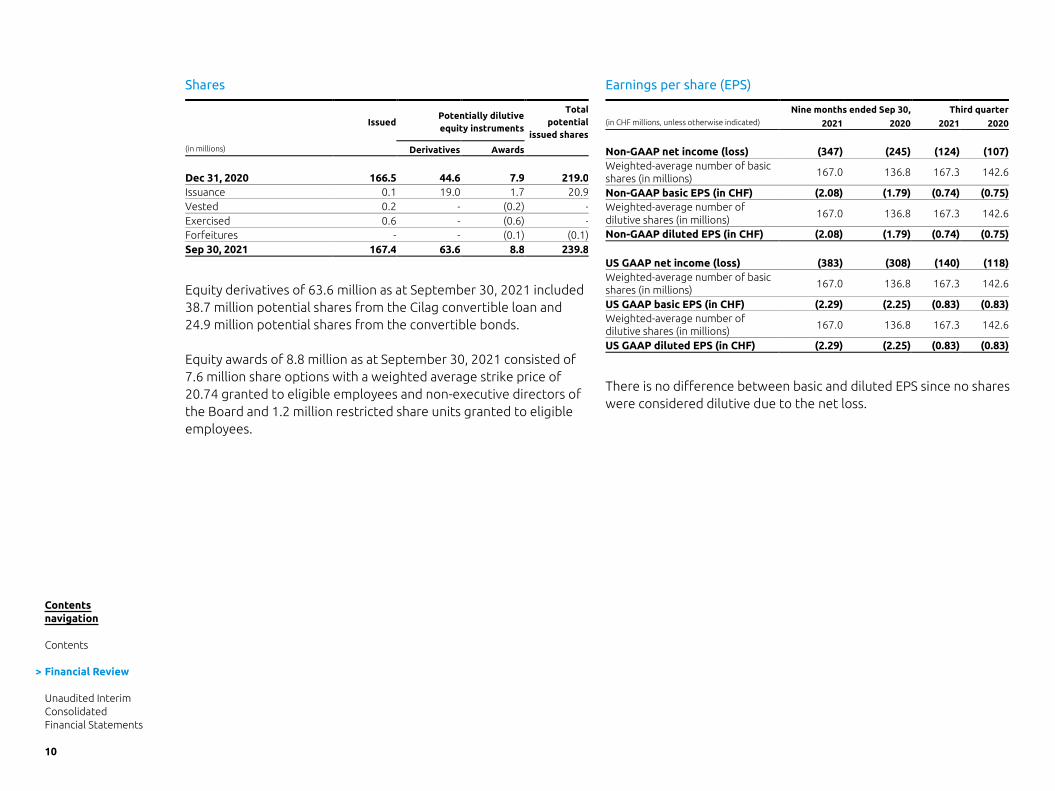
Dec 31, 2020 166.5 44.6 7.9 219.0 Issuance 0.1 19.0 1.7 20.9 Vested 0.2 - (0.2) - Exercised 0.6 - (0.6) - Forfeitures - - (0.1) (0.1) Sep 30, 2021 167.4 63.6 8.8 239.8
Equity derivatives of 63.6 million as at September 30, 2021 included 38.7 million potential shares from the Cilag convertible loan and 24.9 million potential shares from the convertible bonds.
Equity awards of 8.8 million as at September 30, 2021 consisted of 7.6 million share options with a weighted average strike price of 20.74 granted to eligible employees and non-executive directors of the Board and 1.2 million restricted share units granted to eligible employees.
Earnings per share (EPS)
Nine months ended Sep 30, Third quarter (in CHF millions, unless otherwise indicated) 2021 2020 2021 2020
Non-GAAP net income (loss) (347) (245) (124) (107) Weighted-average number of basic shares (in millions)
167.0 136.8 167.3 142.6
Non-GAAP basic EPS (in CHF) (2.08) (1.79) (0.74) (0.75) Weighted-average number of dilutive shares (in millions)
167.0 136.8 167.3 142.6
Non-GAAP diluted EPS (in CHF) (2.08) (1.79) (0.74) (0.75) US GAAP net income (loss) (383) (308) (140) (118) Weighted-average number of basic shares (in millions)
167.0 136.8 167.3 142.6
US GAAP basic EPS (in CHF) (2.29) (2.25) (0.83) (0.83) Weighted-average number of dilutive shares (in millions)
167.0 136.8 167.3 142.6
US GAAP diluted EPS (in CHF) (2.29) (2.25) (0.83) (0.83)
There is no difference between basic and diluted EPS since no shares were considered dilutive due to the net loss.
Contents navigation
Contents
> Financial Review
Unaudited Interim Consolidated Financial Statements
10
Shares
Issued Potentially dilutive equity instruments
Total potential
issued shares
(in millions) Derivatives Awards
Dec 31, 2020 166.5 44.6 7.9 219.0 Issuance 0.1 19.0 1.7 20.9 Vested 0.2 - (0.2) - Exercised 0.6 - (0.6) - Forfeitures - - (0.1) (0.1) Sep 30, 2021 167.4 63.6 8.8 239.8
Equity derivatives of 63.6 million as at September 30, 2021 included 38.7 million potential shares from the Cilag convertible loan and 24.9 million potential shares from the convertible bonds.
Equity awards of 8.8 million as at September 30, 2021 consisted of 7.6 million share options with a weighted average strike price of 20.74 granted to eligible employees and non-executive directors of the Board and 1.2 million restricted share units granted to eligible employees.
Earnings per share (EPS)
Nine months ended Sep 30, Third quarter (in CHF millions, unless otherwise indicated) 2021 2020 2021 2020
Non-GAAP net income (loss) (347) (245) (124) (107) Weighted-average number of basic shares (in millions)
167.0 136.8 167.3 142.6
Non-GAAP basic EPS (in CHF) (2.08) (1.79) (0.74) (0.75) Weighted-average number of dilutive shares (in millions)
167.0 136.8 167.3 142.6
Non-GAAP diluted EPS (in CHF) (2.08) (1.79) (0.74) (0.75) US GAAP net income (loss) (383) (308) (140) (118) Weighted-average number of basic shares (in millions)
167.0 136.8 167.3 142.6
US GAAP basic EPS (in CHF) (2.29) (2.25) (0.83) (0.83) Weighted-average number of dilutive shares (in millions)
167.0 136.8 167.3 142.6
US GAAP diluted EPS (in CHF) (2.29) (2.25) (0.83) (0.83)
There is no difference between basic and diluted EPS since no shares were considered dilutive due to the net loss.
Cash flow and liquidity
Operating cash flow
Nine months ended Sep 30, Third quarter (in CHF millions) 2021 2020 2021 2020
Operating cash flow US GAAP net income (loss) (383) (308) (140) (118) Deferred contract revenue and accrued income
(7) (2) (2) (4)
Deferred taxes (2) (1) (1) (2) Depreciation and amortization 14 14 5 5 Accretion of convertible debt 6 6 2 2 Share-based compensation 14 15 5 4 Other non cash items 4 7 4 3 Funds from operations (354) (270) (126) (110) Net change in receivables (1) 2 0 6 Net change in trade and other payables
2 2 3 4
Net change in other operating assets and liabilities
(38) 24 7 8
Change in working capital (38) 29 10 18 Operating cash flow (392) (241) (116) (92)
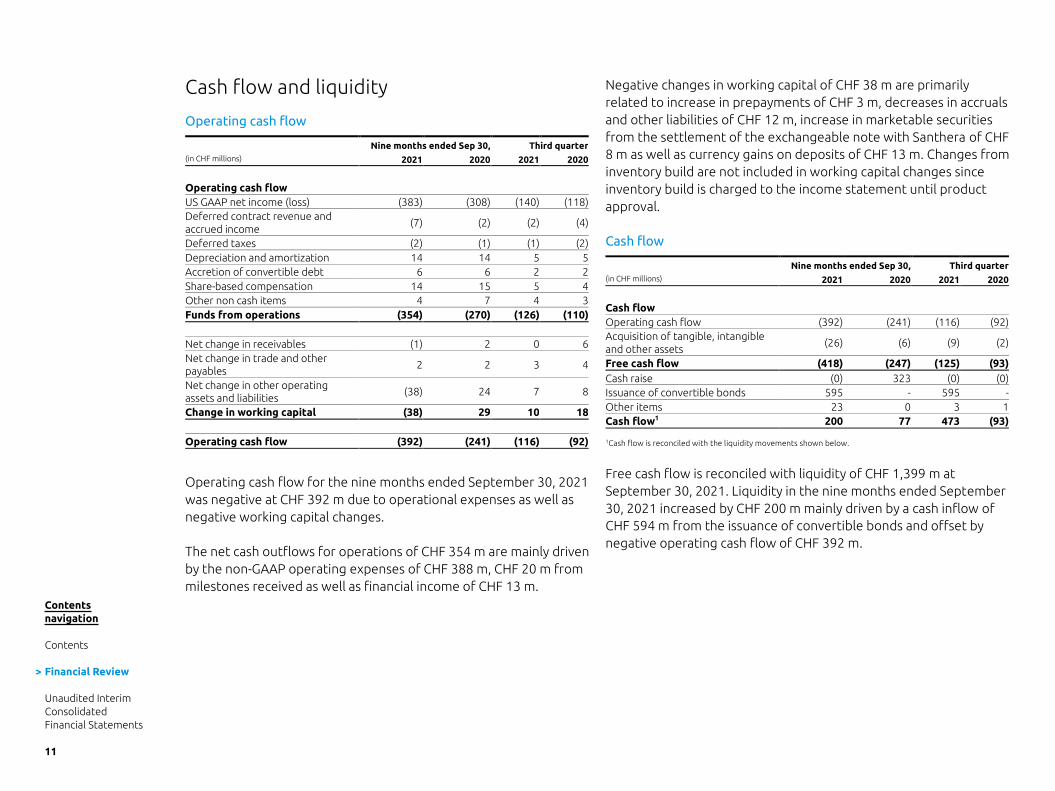
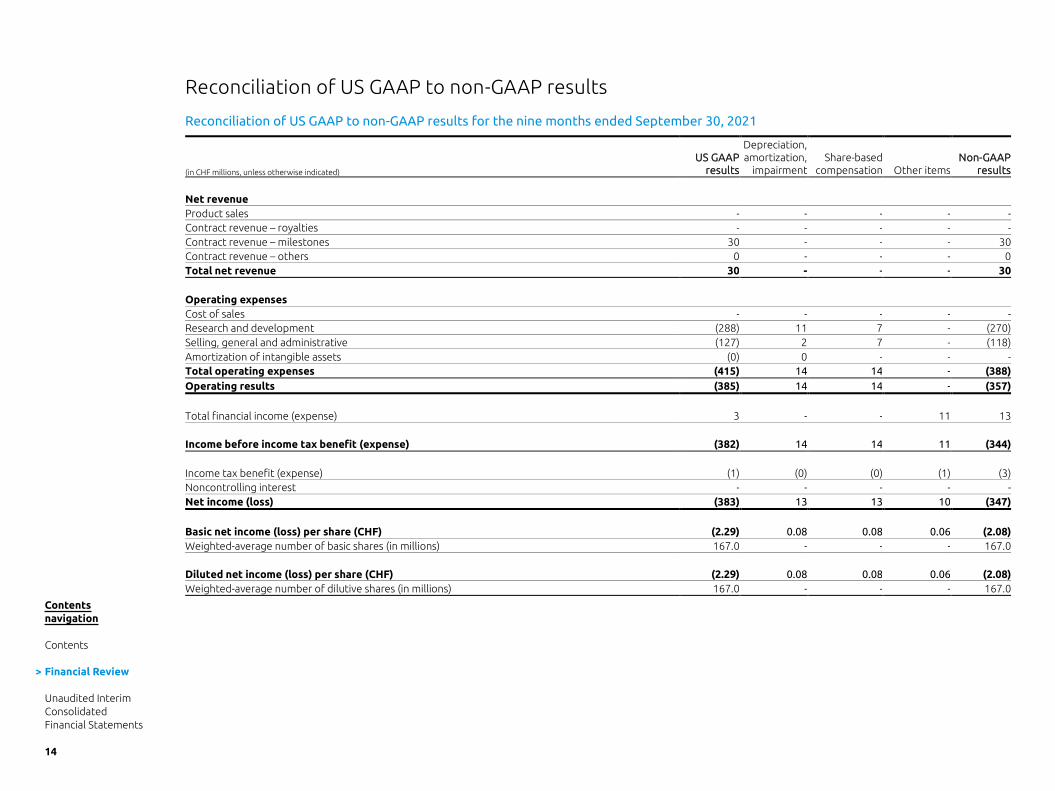
Operating cash flow for the nine months ended September 30, 2021 was negative at CHF 392 m due to operational expenses as well as negative working capital changes.
The net cash outflows for operations of CHF 354 m are mainly driven by the non-GAAP operating expenses of CHF 388 m, CHF 20 m from milestones received as well as financial income of CHF 13 m.
Negative changes in working capital of CHF 38 m are primarily related to increase in prepayments of CHF 3 m, decreases in accruals and other liabilities of CHF 12 m, increase in marketable securities from the settlement of the exchangeable note with Santhera of CHF 8 m as well as currency gains on deposits of CHF 13 m. Changes from inventory build are not included in working capital changes since inventory build is charged to the income statement until product approval.
Cash flow
Nine months ended Sep 30, Third quarter (in CHF millions) 2021 2020 2021 2020
Cash flow Operating cash flow (392) (241) (116) (92) Acquisition of tangible, intangible and other assets
(26) (6) (9) (2)
Free cash flow (418) (247) (125) (93) Cash raise (0) 323 (0) (0) Issuance of convertible bonds 595 - 595 - Other items 23 0 3 1 Cash flow1 200 77 473 (93) 1Cash flow is reconciled with the liquidity movements shown below.
Free cash flow is reconciled with liquidity of CHF 1,399 m at September 30, 2021. Liquidity in the nine months ended September 30, 2021 increased by CHF 200 m mainly driven by a cash inflow of CHF 594 m from the issuance of convertible bonds and offset by negative operating cash flow of CHF 392 m.
Contents navigation
Contents
> Financial Review
Unaudited Interim Consolidated Financial Statements
11

Liquidity
(in CHF millions) Liquidity
Liquidity Dec 31, 2020 1,200 Liquidity movements Q1 (135) Liquidity Mar 31, 2021 1,065 Liquidity movements Q2 (138) Liquidity Jun 30, 2021 927 Liquidity movements Q3 473 Liquidity Sep 30, 2021 1,399
As of September 30, 2021, liquidity consisted of cash and cash equivalents of CHF 122 m, short-term deposits of CHF 1,117 m and long-term deposits of CHF 160 m.
Liquidity of CHF 1,399 m at September 30, 2021 was mainly held in Swiss francs (CHF 1,180 m) and in US dollars (equivalent of CHF 211 m).
Credit facility with Cilag Holding AG
The Group had a credit line of CHF 243 m from Cilag which was terminated as a result of the issuance of the CHF 600 m convertible bonds. This credit facility was undrawn by Idorsia.
Contents navigation
Contents
> Financial Review
Unaudited Interim Consolidated Financial Statements
12

Liquidity
(in CHF millions) Liquidity
Liquidity Dec 31, 2020 1,200 Liquidity movements Q1 (135) Liquidity Mar 31, 2021 1,065 Liquidity movements Q2 (138) Liquidity Jun 30, 2021 927 Liquidity movements Q3 473 Liquidity Sep 30, 2021 1,399
As of September 30, 2021, liquidity consisted of cash and cash equivalents of CHF 122 m, short-term deposits of CHF 1,117 m and long-term deposits of CHF 160 m.
Liquidity of CHF 1,399 m at September 30, 2021 was mainly held in Swiss francs (CHF 1,180 m) and in US dollars (equivalent of CHF 211 m).
Credit facility with Cilag Holding AG
The Group had a credit line of CHF 243 m from Cilag which was terminated as a result of the issuance of the CHF 600 m convertible bonds. This credit facility was undrawn by Idorsia.
Balance sheet
Balance sheet
Sep 30, Jun 30, Dec 31, (in CHF millions) 2021 2021 2020
Assets Liquidity1 1,399 927 1,200 Tangible assets 219 200 196 Other assets 59 60 39 Total assets 1,678 1,187 1,435 Liabilities and equity Financial debt 1,188 592 587 Deferred revenue 24 28 31 Other liabilities 239 205 232 Total liabilities 1,451 825 850 Total equity 227 361 585 Total liabilities and equity 1,678 1,187 1,435 1 Liquidity includes cash, cash equivalents, short- and long-term deposits
Tangible assets (CHF 219 m) mainly consisted of real-estate, R&D equipment and right-of-use assets.
Other assets (CHF 59 m) comprised prepayments of CHF 16 m, receivables of CHF 13 m, marketable securities of CHF 11 m and other assets of CHF 19 m.
Financial debt (CHF 1,188 m) comprised the debt component (CHF 394 m) of the outstanding convertible loan (nominal amount of CHF 445 m) and CHF 794 m relating to the convertible bonds (nominal amount of CHF 800 m).
Deferred revenue (CHF 24 m) related to the collaborations with Janssen (CHF 10 m), Mochida (CHF 10 m) and Neurocrine Biosciences (CHF 3 m).
Other liabilities (CHF 239 m) included current and noncurrent liabilities of CHF 111 m and CHF 128 m respectively. Current liabilities mainly comprised accrued expenses of CHF 85 m, payables of CHF 14 m and a short-term lease liability of CHF 11 m. Noncurrent liabilities mainly comprised a lease liability of CHF 56 m, pension obligations of CHF 61 m, deferred tax liabilities of CHF 3 m and other noncurrent liabilities of CHF 7 m.
Contents navigation
Contents
> Financial Review
Unaudited Interim Consolidated Financial Statements
13
Reconciliation of US GAAP to non-GAAP results
Reconciliation of US GAAP to non-GAAP results for the nine months ended September 30, 2021
(in CHF millions, unless otherwise indicated)
UUSS GGAAAAPP rreessuullttss
Depreciation, amortization,
impairment Share-based
compensation Other items NNoonn--GGAAAAPP
rreessuullttss Net revenue Product sales - - - - - Contract revenue – royalties - - - - - Contract revenue – milestones 30 - - - 30 Contract revenue – others 0 - - - 0 Total net revenue 30 - - - 30 Operating expenses Cost of sales - - - - - Research and development (288) 11 7 - (270) Selling, general and administrative (127) 2 7 - (118) Amortization of intangible assets (0) 0 - - - Total operating expenses (415) 14 14 - (388) Operating results (385) 14 14 - (357)
Total financial income (expense) 3 - - 11 13 Income before income tax benefit (expense) (382) 14 14 11 (344) Income tax benefit (expense) (1) (0) (0) (1) (3) Noncontrolling interest - - - - - Net income (loss) (383) 13 13 10 (347)
Basic net income (loss) per share (CHF) (2.29) 0.08 0.08 0.06 (2.08) Weighted-average number of basic shares (in millions) 167.0 - - - 167.0 Diluted net income (loss) per share (CHF) (2.29) 0.08 0.08 0.06 (2.08) Weighted-average number of dilutive shares (in millions) 167.0 - - - 167.0
Contents navigation
Contents
> Financial Review
Unaudited Interim Consolidated Financial Statements
14
Reconciliation of US GAAP to non-GAAP results
Reconciliation of US GAAP to non-GAAP results for the nine months ended September 30, 2021
(in CHF millions, unless otherwise indicated)
UUSS GGAAAAPP rreessuullttss
Depreciation, amortization,
impairment Share-based
compensation Other items NNoonn--GGAAAAPP
rreessuullttss Net revenue Product sales - - - - - Contract revenue – royalties - - - - - Contract revenue – milestones 30 - - - 30 Contract revenue – others 0 - - - 0 Total net revenue 30 - - - 30 Operating expenses Cost of sales - - - - - Research and development (288) 11 7 - (270) Selling, general and administrative (127) 2 7 - (118) Amortization of intangible assets (0) 0 - - - Total operating expenses (415) 14 14 - (388) Operating results (385) 14 14 - (357)
Total financial income (expense) 3 - - 11 13 Income before income tax benefit (expense) (382) 14 14 11 (344) Income tax benefit (expense) (1) (0) (0) (1) (3) Noncontrolling interest - - - - - Net income (loss) (383) 13 13 10 (347)
Basic net income (loss) per share (CHF) (2.29) 0.08 0.08 0.06 (2.08) Weighted-average number of basic shares (in millions) 167.0 - - - 167.0 Diluted net income (loss) per share (CHF) (2.29) 0.08 0.08 0.06 (2.08) Weighted-average number of dilutive shares (in millions) 167.0 - - - 167.0
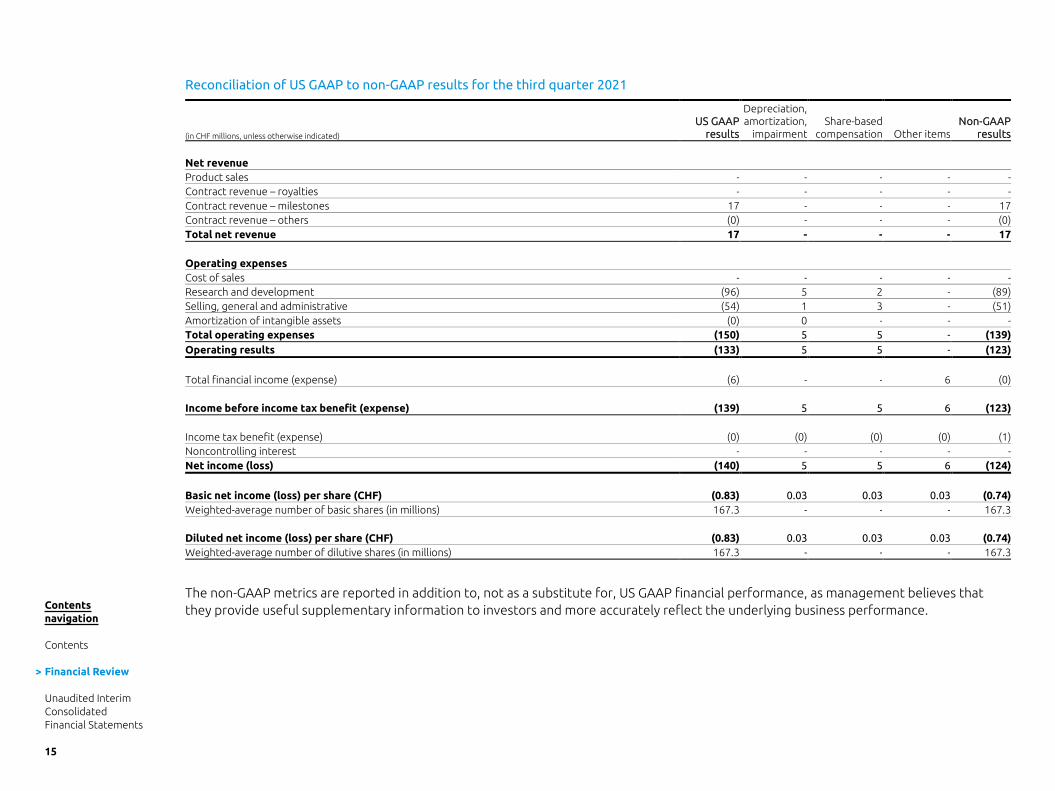
Reconciliation of US GAAP to non-GAAP results for the third quarter 2021
(in CHF millions, unless otherwise indicated)
UUSS GGAAAAPP rreessuullttss
Depreciation, amortization,
impairment Share-based
compensation Other items NNoonn--GGAAAAPP
rreessuullttss Net revenue Product sales - - - - - Contract revenue – royalties - - - - - Contract revenue – milestones 17 - - - 17 Contract revenue – others (0) - - - (0) Total net revenue 17 - - - 17 Operating expenses Cost of sales - - - - - Research and development (96) 5 2 - (89) Selling, general and administrative (54) 1 3 - (51) Amortization of intangible assets (0) 0 - - - Total operating expenses (150) 5 5 - (139) Operating results (133) 5 5 - (123)
Total financial income (expense) (6) - - 6 (0) Income before income tax benefit (expense) (139) 5 5 6 (123) Income tax benefit (expense) (0) (0) (0) (0) (1) Noncontrolling interest - - - - - Net income (loss) (140) 5 5 6 (124)
Basic net income (loss) per share (CHF) (0.83) 0.03 0.03 0.03 (0.74) Weighted-average number of basic shares (in millions) 167.3 - - - 167.3 Diluted net income (loss) per share (CHF) (0.83) 0.03 0.03 0.03 (0.74) Weighted-average number of dilutive shares (in millions) 167.3 - - - 167.3
The non-GAAP metrics are reported in addition to, not as a substitute for, US GAAP financial performance, as management believes that they provide useful supplementary information to investors and more accurately reflect the underlying business performance.
Contents navigation
Contents
> Financial Review
Unaudited Interim Consolidated Financial Statements
15

Unaudited Interim Consolidated Financial Statements
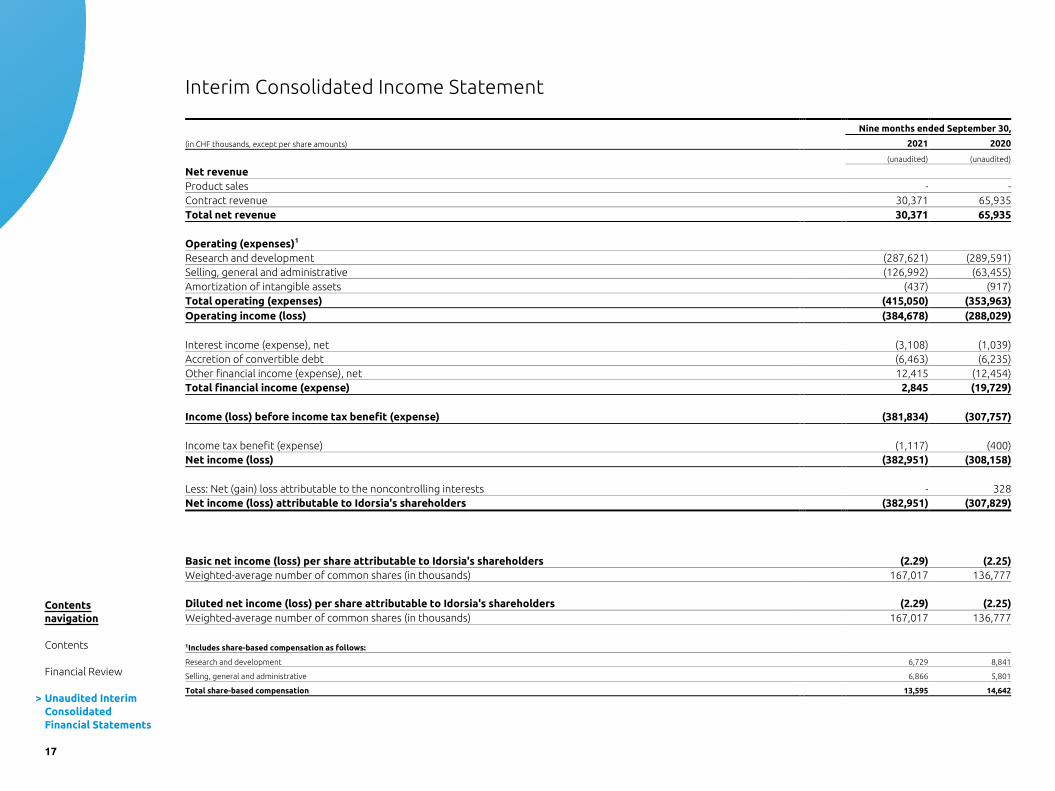
Interim Consolidated Income Statement
Nine months ended September 30,
(in CHF thousands, except per share amounts) 2021 2020
(unaudited) (unaudited)
Net revenue Product sales - - Contract revenue 30,371 65,935 Total net revenue 30,371 65,935 Operating (expenses)1 Research and development (287,621) (289,591) Selling, general and administrative (126,992) (63,455) Amortization of intangible assets (437) (917) Total operating (expenses) (415,050) (353,963) Operating income (loss) (384,678) (288,029) Interest income (expense), net (3,108) (1,039) Accretion of convertible debt (6,463) (6,235) Other financial income (expense), net 12,415 (12,454) Total financial income (expense) 2,845 (19,729) Income (loss) before income tax benefit (expense) (381,834) (307,757) Income tax benefit (expense) (1,117) (400) Net income (loss) (382,951) (308,158) Less: Net (gain) loss attributable to the noncontrolling interests - 328 Net income (loss) attributable to Idorsia's shareholders (382,951) (307,829)
Basic net income (loss) per share attributable to Idorsia's shareholders (2.29) (2.25) Weighted-average number of common shares (in thousands) 167,017 136,777 Diluted net income (loss) per share attributable to Idorsia's shareholders (2.29) (2.25) Weighted-average number of common shares (in thousands) 167,017 136,777 1Includes share-based compensation as follows:
Research and development 6,729 8,841
Selling, general and administrative 6,866 5,801
Total share-based compensation 13,595 14,642
Contents navigation
Contents
Financial Review
> Unaudited Interim Consolidated Financial Statements
17

Interim Consolidated Statement of Comprehensive Income
Nine months ended September 30,
(in CHF thousands) 2021 2020
(unaudited) (unaudited)
Net income (loss) (382,951) (308,158) Other comprehensive income (loss), net of tax:
Foreign currency translation adjustments 133 (351) Change of unrecognized components of net periodic benefit costs 233 (158)
Other comprehensive income (loss), net of tax 367 (509) Comprehensive income (loss) (382,584) (308,666) Less: Comprehensive (gain) loss attributable to noncontrolling interests - 328 Comprehensive income (loss) attributable to Idorsia's shareholders (382,584) (308,338)
Contents navigation
Contents
Financial Review
> Unaudited Interim Consolidated Financial Statements
18
Interim Consolidated Statement of Comprehensive Income
Nine months ended September 30,
(in CHF thousands) 2021 2020
(unaudited) (unaudited)
Net income (loss) (382,951) (308,158) Other comprehensive income (loss), net of tax:
Foreign currency translation adjustments 133 (351) Change of unrecognized components of net periodic benefit costs 233 (158)
Other comprehensive income (loss), net of tax 367 (509) Comprehensive income (loss) (382,584) (308,666) Less: Comprehensive (gain) loss attributable to noncontrolling interests - 328 Comprehensive income (loss) attributable to Idorsia's shareholders (382,584) (308,338)
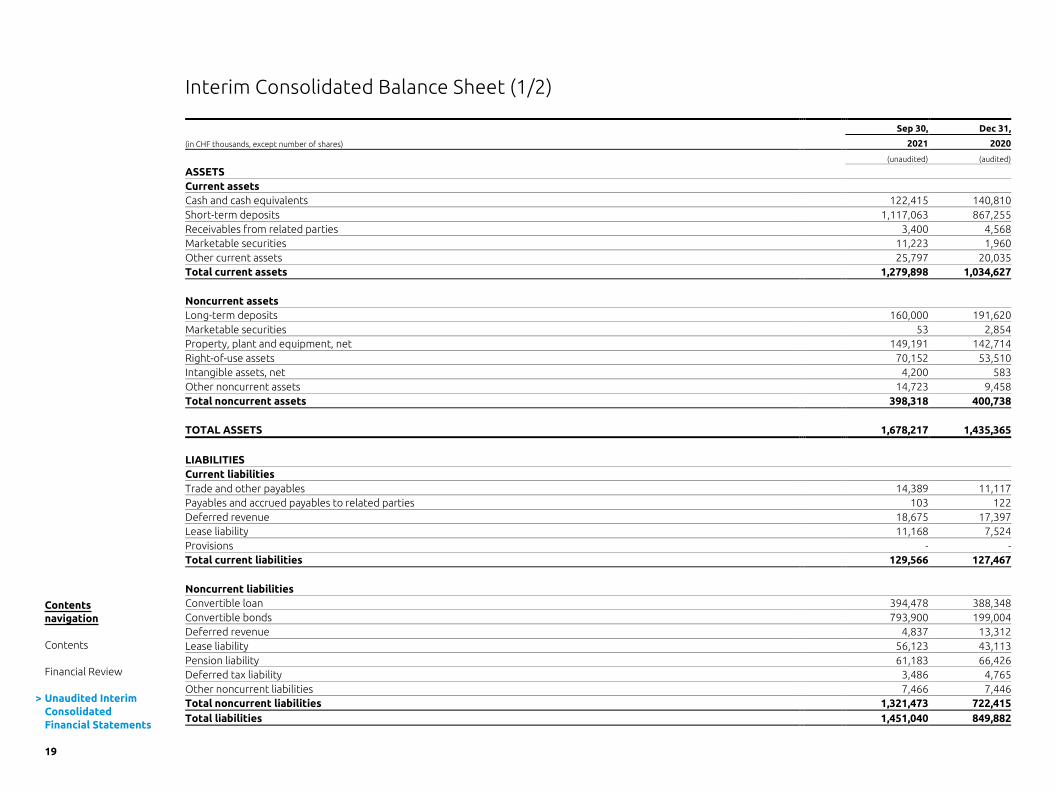
Interim Consolidated Balance Sheet (1/2)
Sep 30, Dec 31,
(in CHF thousands, except number of shares) 2021 2020
(unaudited) (audited)
ASSETS Current assets Cash and cash equivalents 122,415 140,810 Short-term deposits 1,117,063 867,255 Receivables from related parties 3,400 4,568 Marketable securities 11,223 1,960 Other current assets 25,797 20,035 Total current assets 1,279,898 1,034,627 Noncurrent assets Long-term deposits 160,000 191,620 Marketable securities 53 2,854 Property, plant and equipment, net 149,191 142,714 Right-of-use assets 70,152 53,510 Intangible assets, net 4,200 583 Other noncurrent assets 14,723 9,458 Total noncurrent assets 398,318 400,738 TOTAL ASSETS 1,678,217 1,435,365
LIABILITIES Current liabilities Trade and other payables 14,389 11,117 Payables and accrued payables to related parties 103 122 Deferred revenue 18,675 17,397 Lease liability 11,168 7,524 Provisions - - Total current liabilities 129,566 127,467 Noncurrent liabilities Convertible loan 394,478 388,348 Convertible bonds 793,900 199,004 Deferred revenue 4,837 13,312 Lease liability 56,123 43,113 Pension liability 61,183 66,426 Deferred tax liability 3,486 4,765 Other noncurrent liabilities 7,466 7,446 Total noncurrent liabilities 1,321,473 722,415 Total liabilities 1,451,040 849,882
Contents navigation
Contents
Financial Review
> Unaudited Interim Consolidated Financial Statements
19

Interim Consolidated Balance Sheet (2/2)
Sep 30, Dec 31,
(in CHF thousands, except number of shares) 2021 2020
(unaudited) (audited)
EQUITY Idorsia's shareholders' equity Common shares (par value CHF 0.05 per share, issued and outstanding 167,361,570 and 166,482,328 in 2021 and 2020 respectively; total number of authorized shares, including issued, authorized and conditional, 295,041,430 and 261,241,430 in 2021 and 2020 respectively) 8,368 8,324 Additional paid-in capital 1,986,973 1,962,739 Accumulated profit (loss) (1,730,435) (1,347,484) Accumulated other comprehensive income (loss) (37,729) (38,096) Total Idorsia's shareholders' equity 227,177 585,483 Equity attributable to noncontrolling interests - - Total equity 227,177 585,483 TOTAL LIABILITIES AND EQUITY 1,678,217 1,435,365
Contents navigation
Contents
Financial Review
> Unaudited Interim Consolidated Financial Statements
20

Interim Consolidated Balance Sheet (2/2)
Sep 30, Dec 31,
(in CHF thousands, except number of shares) 2021 2020
(unaudited) (audited)
EQUITY Idorsia's shareholders' equity Common shares (par value CHF 0.05 per share, issued and outstanding 167,361,570 and 166,482,328 in 2021 and 2020 respectively; total number of authorized shares, including issued, authorized and conditional, 295,041,430 and 261,241,430 in 2021 and 2020 respectively) 8,368 8,324 Additional paid-in capital 1,986,973 1,962,739 Accumulated profit (loss) (1,730,435) (1,347,484) Accumulated other comprehensive income (loss) (37,729) (38,096) Total Idorsia's shareholders' equity 227,177 585,483 Equity attributable to noncontrolling interests - - Total equity 227,177 585,483 TOTAL LIABILITIES AND EQUITY 1,678,217 1,435,365
Interim Consolidated Statement of Cash Flows
Nine months ended September 30,
(in CHF thousands) 2021 2020
(unaudited) (unaudited)
Cash flow from operating activities Net income (loss) (382,951) (308,158) Adjustments to reconcile net income (loss) to net cash provided from operating activities:
Depreciation and amortization 13,680 14,305 Share-based compensation 13,595 14,642 Accretion of convertible debt 6,463 6,235 Fair value changes on securities 4,131 6,775 Deferred revenue and accrued income (7,198) (2,454) Deferred taxes (1,954) (1,167)
Changes in operating assets and liabilities: Other receivables (1,324) 2,349 Trade and other payables 2,186 2,191 Accrued expenses (7,364) (8,156) Provisions - 23,156 Changes in other operating cash flow items (31,342) 8,994
Net cash flow provided by (used in) operating activities (392,078) (241,287) Cash flow from investing activities Purchase of marketable securities (3,500) - Purchase of short-term deposits (664,164) (611,164) Proceeds from short-term deposits 619,167 595,690 Purchase of long-term deposits (160,000) (180,000) Purchase of noncontrolling interests - (1,536) Purchase of property, plant and equipment (19,332) (5,556) Purchase of intangible assets (3,476) (70) Net cash flow provided by (used in) investing activities (231,305) (202,637) Cash flow from financing activities Issuance of new shares, net (24) 323,123 Proceeds from exercise of share options 9,858 6,251 Proceeds from issuance of convertible bonds, net 594,771 - Net cash flow provided by (used in) financing activities 604,605 329,374 Net effect of exchange rates on cash and cash equivalents 383 (247) Net change in cash and cash equivalents (18,394) (114,797) Cash and cash equivalents at beginning of period 140,810 263,007 Cash and cash equivalents at end of period 122,415 148,210
Contents navigation
Contents
Financial Review
> Unaudited Interim Consolidated Financial Statements
21

Interim Consolidated Statement of Changes in Equity
Idorsia's shareholders Noncontrolling
interests Common shares Additional Accum. other Equity attrib. to
(in CHF thousands, except number of shares) Shares Amount paid-in capital
Accum. profit (loss)
comprehensive income (loss)
noncontrolling interests
Total equity
At January 1, 2020 131,241,148 6,562 1,083,677 (894,268) (23,527) (8,098) 164,346 Comprehensive income (loss):
Net income (loss) (307,829) (328) (308,158) Other comprehensive income (loss) (509) (509)
Comprehensive income (loss) (308,666) Exercise of share options 352,540 18 6,233 6,251 Share-based compensation transactions 61,036 3 14,613 14,616 Issuance of new shares 11,000,000 550 323,493 324,043 Acquisition of noncontrolling interests 9,406 (8,426) 8,426 9,406 At September 30, 2020 (unaudited) 142,654,724 7,133 1,437,422 (1,210,523) (24,034) - 209,998
Comprehensive income (loss):
Net income (loss) (136,962) - (136,962) Other comprehensive income (loss) (14,062) (14,062)
Comprehensive income (loss) (151,024) Exercise of share options 19,744 1 349 350 Share-based compensation transactions 7,860 0 3,755 3,756 Issuance of new shares 23,800,000 1,190 521,213 522,403 Acquisition of noncontrolling interests - - - - At December 31, 2020 (audited) 166,482,328 8,324 1,962,739 (1,347,485) (38,096) - 585,483
Comprehensive income (loss):
Net income (loss) (382,951) - (382,951) Other comprehensive income (loss) 367 367
Comprehensive income (loss) (382,584) Exercise of share options 556,008 28 9,830 9,858 Share-based compensation transactions 323,234 16 14,428 14,444 Issuance of new shares - - (24) (24) At September 30, 2021 (unaudited) 167,361,570 8,368 1,986,973 (1,730,435) (37,730) - 227,177
Contents navigation
Contents
Financial Review
> Unaudited Interim Consolidated Financial Statements
22

Curious to learn more? Reach out to us.
Investor RelationsIdorsia Pharmaceuticals LtdHegenheimermattweg 914123 AllschwilSwitzerland
Phone +41 58 844 10 [email protected]© Idorsia Pharmaceuticals Ltd 2021www.idorsia.com
All trademarks are legally protected.Concept and design: Markenfels AG
Be preparedfor more