financial results for second quarter fy2018 (for the year ... · forward-looking figures shown in...
TRANSCRIPT

Copyright © 2018 IHI Corporation All Rights Reserved.
Financial Results for Second Quarter FY2018
(for the year ending March 31, 2019)
November 1, 2018

Copyright © 2018 IHI Corporation All Rights Reserved.
Table of Contents
1. Consolidated Results for Second Quarter FY2018
Summary of Financial Results..................................................................................................................................................................................................................4
Financial Results by Segment.....................................................................................................5
Non-operating Income / Expenses............................................................................................8
Extraordinary Income / Losses..........................................................................................9
Balance Sheets.......................................................................................................................................................................................................10
Cash flows.....................................................................................................................11
Supplementary Information......................................................................................................................................12
2. Forecasts of the Consolidated Results for FY2018
Summary of Forecast for FY2018........................................................................................................15
Forecasts for FY2018 by Segment........................................................................................................16
3. Financial Results by Segment
Resources, Energy and Environment..........................................................................................19
Social Infrastructure and Offshore Facility....................................................................................................................21
Industrial System and General-Purpose Machinery..........................................................................................23
Aero Engine, Space and Defense.........................................................................................................25
<Appendices> .......................................................................................... 27
Copyright © 2018 IHI Corporation All Rights Reserved. 3
1. Consolidated Results for Second Quarter FY2018

Copyright © 2018 IHI Corporation All Rights Reserved. 4
1. Consolidated Results for Second Quarter FY2018
Summary of Financial Results
Note: Average exchange rates for FY2018.2Q US$ 1.00= ¥109.79
(In billion yen)
¥4.3 billion of income taxes for prior periods is included in FY2018.2Q.
In FY2017, the closing date of the fiscal year of certain overseas consolidated subsidiaries has been
changed from December 31 to March 31. As a result, for the six months ended September 30, 2017, those
overseas consolidated subsidiaries have a nine-month accounting period. The effect of these changes was
an increase of ¥57.9 billion in net sales and an increase of ¥1.4 billion in operating profit in FY2017.2Q.
28.4
▲ 9.3 ▲ 20.3
6.8Profit attributable to
owners of parent
Ordinary profit 19.5
21.5
Net sales 773.4
49.1 29.5
Profit before income taxes 18.2 51.8 33.5
FY2017.2Q
699.5 ▲ 73.9
Operating profit 34.6 45.2 10.5
▲ 10.9Income taxes
FY2018.2Q Change
Orders received 715.1 649.3 ▲ 65.7

Copyright © 2018 IHI Corporation All Rights Reserved. 5
1. Consolidated Results for Second Quarter FY2018
Financial Results by Segment
Orders received & Order backlog
(In billion yen)
FY2017.2Q FY2018.2Q Change FY2017 FY2018.2Q Change
Resources, Energy and
Environment207.4 141.9 ▲ 65.5 648.5 578.0 ▲ 70.5
Social Infrastructure and
Offshore Facility67.5 54.1 ▲ 13.3 206.1 200.6 ▲ 5.4
Industrial System and General-
Purpose Machinery246.3 237.2 ▲ 9.0 161.0 188.9 27.9
Aero Engine, Space and
Defense181.1 198.1 16.9 533.0 529.7 ▲ 3.2
Total Reportable Segment 702.4 631.5 ▲ 70.9 1,548.7 1,497.4 ▲ 51.3
Others 38.4 39.2 0.8 18.4 24.9 6.5
Adjustment ▲ 25.7 ▲ 21.3 4.3 - - -
Total 715.1 649.3 ▲ 65.7 1,567.1 1,522.3 ▲ 44.7
Overseas orders received
/ order backlog411.8 294.5 ▲ 117.2 625.4 577.2 ▲ 48.1
% of Overseas orders received
/ order backlog58% 45% ▲ 13% 40% 38% ▲ 2%
Order backlogOrders received

Copyright © 2018 IHI Corporation All Rights Reserved. 6
1. Consolidated Results for Second Quarter FY2018
Financial Results by Segment
(In billion yen) Net sales & Operating profit
Regarding the effect to each segment caused by changes of the closing date of the fiscal year of certain
overseas consolidated subsidiaries in the previous fiscal year, please refer to segment information found in
the consolidated financial report.
FY2017.2Q FY2018.2Q Change FY2017.2Q FY2018.2Q Change
Resources, Energy and
Environment253.9 194.6 ▲ 59.3 ▲ 5.0 11.5 16.6
Social Infrastructure and
Offshore Facility66.6 60.7 ▲ 5.9 5.6 4.0 ▲ 1.5
Industrial System and General-
Purpose Machinery227.1 209.9 ▲ 17.1 7.4 8.1 0.7
Aero Engine, Space and
Defense215.4 224.4 8.9 29.5 23.9 ▲ 5.6
Total Reportable Segment 763.2 689.7 ▲ 73.4 37.5 47.7 10.2
Others 30.1 30.4 0.3 ▲ 0.2 0.4 0.7
Adjustment ▲ 19.8 ▲ 20.7 ▲ 0.9 ▲ 2.6 ▲ 3.0 ▲ 0.3
Total 773.4 699.5 ▲ 73.9 34.6 45.2 10.5
Overseas sales 444.0 367.2 ▲ 76.8
% of overseas sales 57% 52% ▲ 5%
Operating profitNet sales

Copyright © 2018 IHI Corporation All Rights Reserved. 7
1. Consolidated Results for Second Quarter FY2018
Financial Results by Segment
(In billion yen)
Analysis of change in operating profit from the previous period
There are cases that the aggregated amount of each segment or factor doesn’t match to the total due to rounding off.
Resources, Energy and
Environment▲ 0.3 14.8 0.1 2.0 0.1 16.6
Social Infrastructure and
Offshore Facility▲ 0.3 ▲ 1.1 ▲ 0.2 ▲ 1.5
Industrial System and
General-Purpose Machinery2.4 0.8 ▲ 0.9 ▲ 1.6 0.7
Aero Engine, Space and
Defense▲ 7.7 3.6 ▲ 0.8 ▲ 0.7 ▲ 5.6
Total Reportable Segment ▲ 5.9 18.1 ▲ 0.7 0.2 ▲ 1.5 10.2
Others 0.3 0.4 0.1 0.7
Adjustment 1.0 ▲ 1.4 ▲ 0.3
Total ▲ 5.6 19.5 ▲ 0.7 ▲ 1.2 ▲ 1.4 10.5
TotalChange in
net sales
Change in
construction
profitability
Change in
foreign
exchange rate
Change in
SG&A
Impact of
change of FY
period

Copyright © 2018 IHI Corporation All Rights Reserved. 8
1. Consolidated Results for Second Quarter FY2018
(In billion yen)
Non-operating Income / Expenses
Change of the rate(US$) FY2017.2Q +0.54yen (beginning 112.19yen→end 112.73yen) FY2018.2Q +7.33yen (beginning 106.24yen→end 113.57yen)
NoteChange
Share of profit of entities
accounted for using equity method0.0 5.1 5.1
Net interest expenses
(incl. dividend income)0.0 ▲ 0.3
FY2017.2Q FY2018.2Q
Non-operating Income / Expenses ▲ 15.0 3.9
Others ▲ 15.3 ▲ 3.2
Foreign exchange gains / losses 0.3 2.4
FY2017.2Q:Payments for contract adjustments for civil
aero engines ▲6.4
Expenses for delayed delivery ▲4.7
▲ 0.2
2.0
19.0
12.0

Copyright © 2018 IHI Corporation All Rights Reserved. 9
1. Consolidated Results for Second Quarter FY2018
Extraordinary Income / Losses
(In billion yen)
Note
Gain on sales of shares of subsidiaries and
associates4.1
Sale of equity interest in operating companies
related to the Small power systems Business
Gain on transfer of business ▲ 1.5
2.6
Impairment loss ▲ 1.5Impairment loss on fixed assets related to the
Small power systems Business
Settlement-related expenses related to boiler
facilities in customer’s commercial operation▲ 2.9 2.9
1.3
3.9Extraordinary Income / Losses ▲ 1.3 2.6
Extraordinary Losses ▲ 2.9 ▲ 1.5
FY2017.2Q FY2018.2Q
1.5 -
Change
Extraordinary Income 1.5 4.1
- 4.1
-
- ▲ 1.5

Copyright © 2018 IHI Corporation All Rights Reserved. 10
1. Consolidated Results for Second Quarter FY2018
(In billion yen)
Balance Sheets
(*2) Interest-bearing debt includes the amount of lease obligations.
(as of March 31, 2018: ¥18.2 billion / as of September 30, 2018: ¥16.7 billion)
(*1)
Balance Sheets as of March 31, 2018 is partly adjusted due to the application of the “Partial Amendments to
Accounting Standard for Tax Effect Accounting”.
(*3)
D/E ratio = Interest-bearing debt / net assets
As of
March 31, 2018
As of
September 30, 2018Change
Total assets (*1) 1,633.4 1,655.5 22.0
(Trade receivables) (400.3) (358.3) (▲ 42.0)
(Inventories) (428.5) (459.8) (31.3)
(Investment securities) (99.2) (117.8) (18.5)
Total liabilities (*1) 1,283.2 1,274.7 ▲ 8.5
(Trade payables) (304.9) (275.6) (▲ 29.2)
(Advance received) (177.8) (175.5) (▲ 2.2)
(Provision) (110.2) (99.0) (▲ 11.1)
(Interest-bearing debt) (*2) (322.2) (364.6) (42.3)
Total net assets 350.2 380.7 30.5
Shareholders’ equity 313.2 336.5 23.2
Accumulated other comprehensive
income11.3 15.8 4.5
Non-controlling interests and others 25.6 28.3 2.7
Total liabilities and net assets (*1) 1,633.4 1,655.5 22.0
D/E ratio(times) (*3) 0.92 0.96 0.04
Equity ratio 19.9% 21.3% 1.4%
Copyright © 2018 IHI Corporation All Rights Reserved. 11
1. Consolidated Results for Second Quarter FY2018
(In billion yen)
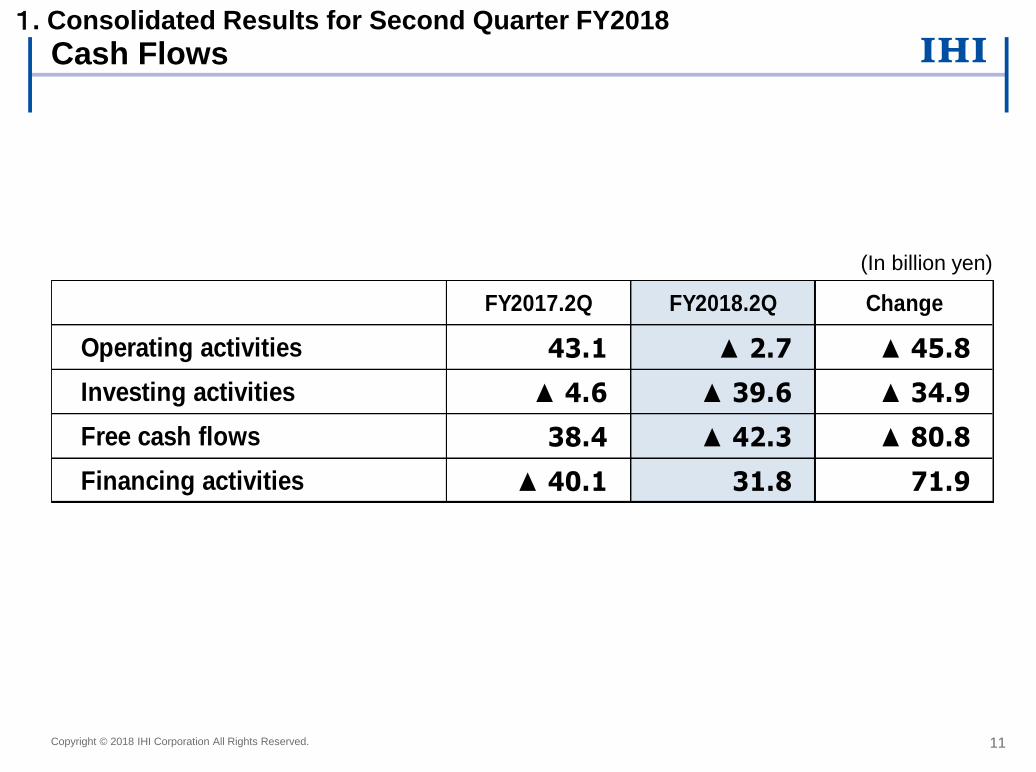
Cash Flows
FY2017.2Q FY2018.2Q Change
Operating activities 43.1 ▲ 2.7 ▲ 45.8
Investing activities ▲ 4.6 ▲ 39.6 ▲ 34.9
Free cash flows 38.4 ▲ 42.3 ▲ 80.8
Financing activities ▲ 40.1 31.8 71.9

Copyright © 2018 IHI Corporation All Rights Reserved. 12
1. Consolidated Results for Second Quarter FY2018
(In billion yen)
Supplementary Information
(1)R&D/CAPEX/Depreciation & Amortization
FY2017.2Q FY2018.2Q
15.0 15.3
20.5 23.9
21.9 20.6
R&D
CAPEX
Depreciation & Amortization
Copyright © 2018 IHI Corporation All Rights Reserved. 13
1. Consolidated Results for Second Quarter FY2018
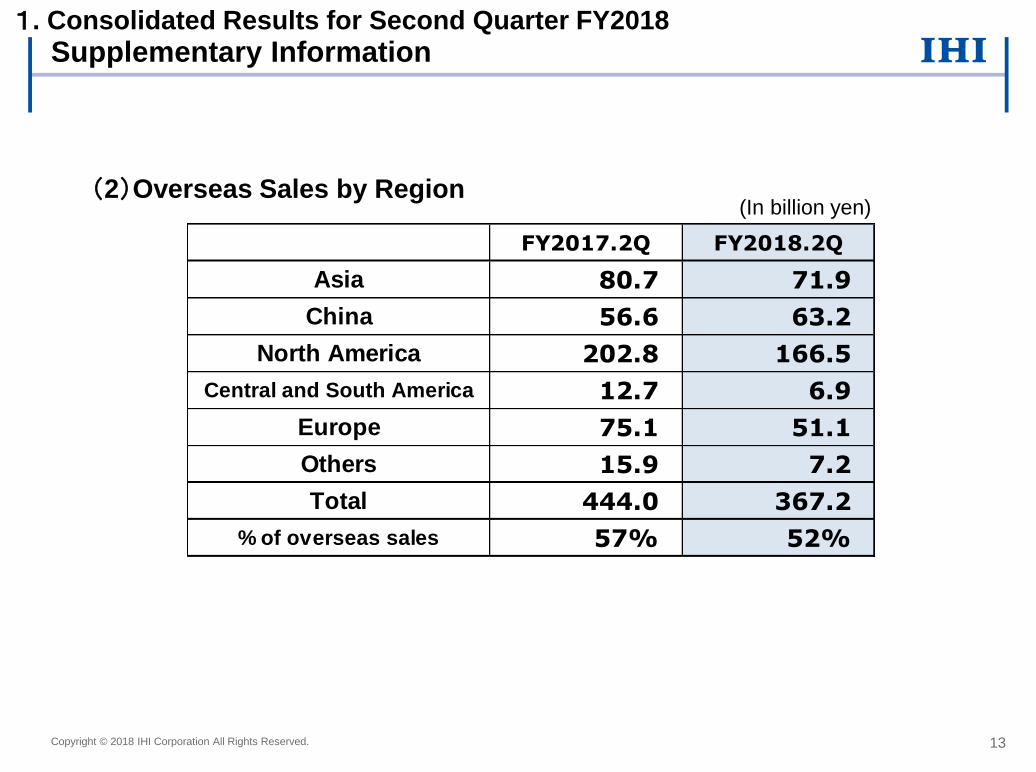
Supplementary Information
(2)Overseas Sales by Region (In billion yen)
FY2017.2Q FY2018.2Q
80.7 71.9
56.6 63.2
202.8 166.5
12.7 6.9
75.1 51.1
15.9 7.2
444.0 367.2
57% 52%
Central and South America
Europe
Others
Total
% of overseas sales
North America
Asia
China

Copyright © 2018 IHI Corporation All Rights Reserved. 14
2. Forecasts of the Consolidated Results for FY2018

Copyright © 2018 IHI Corporation All Rights Reserved. 15
(In billion yen)
Summary of Forecasts for FY2018 2. Forecasts of the Consolidated Results for FY2018
<assumed exchange rate>
US$ 1.00 = ¥105 (assumed in August , ¥105)
Euro 1.00 = ¥130 (assumed in August , ¥130)
<For reference> Sensitivity to foreign exchange rates by currency
1 yen per US$ corresponds to 0.5 billion yen, and per Euro, 0.0 billion yen in operating profit.
Change
In August In NovemberVs. Forecast
in August
Orders received 1,500.0 1,500.0 1,505.0 0.0
Net sales 1,500.0 1,500.0 1,590.3 0.0
Operating profit 85.0 85.0 72.2 0.0
Ordinary profit 65.0 65.0 21.4 0.0
Profit attributable to
owners of parent32.0 32.0 8.2 0.0
FY2018
Forecast FY2017
Actual

Copyright © 2018 IHI Corporation All Rights Reserved. 16
(In billion yen)
Forecasts for FY2018 by Segment 2. Forecasts of the Consolidated Results for FY2018
Orders received
FY2018 Forecast
(In August)
FY2018 Forecast
(In November)Change
Resources, Energy and
Environment380.0 380.0 0.0
Social Infrastructure and
Offshore Facility140.0 140.0 0.0
Industrial System and General-
Purpose Machinery470.0 470.0 0.0
Aero Engine, Space and
Defense490.0 490.0 0.0
Total Reportable Segment 1,480.0 1,480.0 0.0
Others 70.0 70.0 0.0
Adjustment ▲ 50.0 ▲ 50.0 0.0
Total 1,500.0 1,500.0 0.0

Copyright © 2018 IHI Corporation All Rights Reserved. 17
(In billion yen)
Forecasts for FY2018 by Segment 2. Forecasts of the Consolidated Results for FY2018
Net sales & Operating profit
Net salesOperating
profitNet sales
Operating
profitNet sales
Operating
profit
Resources, Energy and
Environment390.0 20.0 390.0 20.0 0.0 0.0
Social Infrastructure and
Offshore Facility150.0 12.0 150.0 12.0 0.0 0.0
Industrial System and General-
Purpose Machinery440.0 22.0 440.0 22.0 0.0 0.0
Aero Engine, Space and
Defense500.0 44.0 500.0 44.0 0.0 0.0
Total Reportable Segment 1,480.0 98.0 1,480.0 98.0 0.0 0.0
Others 70.0 3.0 70.0 3.0 0.0 0.0
Adjustment ▲ 50.0 ▲ 16.0 ▲ 50.0 ▲ 16.0 0.0 0.0
Total 1,500.0 85.0 1,500.0 85.0 0.0 0.0
FY2018 Forecast
(In November)Change
FY2018 Forecast
(In August)

Copyright © 2018 IHI Corporation All Rights Reserved. 18
3. Financial Results by Segment

Copyright © 2018 IHI Corporation All Rights Reserved. 19
3. Financial Results by Segment
Resources, Energy and Environment
<Results by business segment>
【 Orders received 】
Orders received decreased owning to a reverse effect of
receiving a large-scale overseas project in the Boilers
Business in FY2017.
【 Net sales 】
Net sales decreased owing to a pull back from the progress
of large-scale projects in the Process plants Business in
FY2017, in addition to the effect of the financial reporting
periods unification (hereinafter “FRPU”) in FY2017.
【 Operating profit 】
Operating profit significantly increased mainly because the
issue regarding deterioration of profitability in the Process
plants Business in FY2017 is being brought under control
and the profitability in the Boilers Business improved.
(In billion yen, accumulated amount)
Orders received
Net sales
Operating profit
<FY2018 Forecast (vs. In August)> The forecasts of orders received, net sales and operating
profit remain unchanged.
1Q 1H 3Q Fullyear
1Q 1H InAug.
InNov.
207.4
378.0
55.5 141.9
380.0 380.0
FY2017 FY2018 Full year(Forecast)
1Q 1H 3Q Fullyear
1Q 1H InAug.
InNov.
253.9
490.4
84.3
194.6
390.0 390.0
FY2017 FY2018 Full year(Forecast)
1Q 1H 3Q Fullyear
1Q 1H InAug.
InNov.
▲ 5.0
▲ 14.8
▲ 0.1
11.5
20.0 20.0
FY2017 FY2018 Full year(Forecast)
Copyright © 2018 IHI Corporation All Rights Reserved. 20
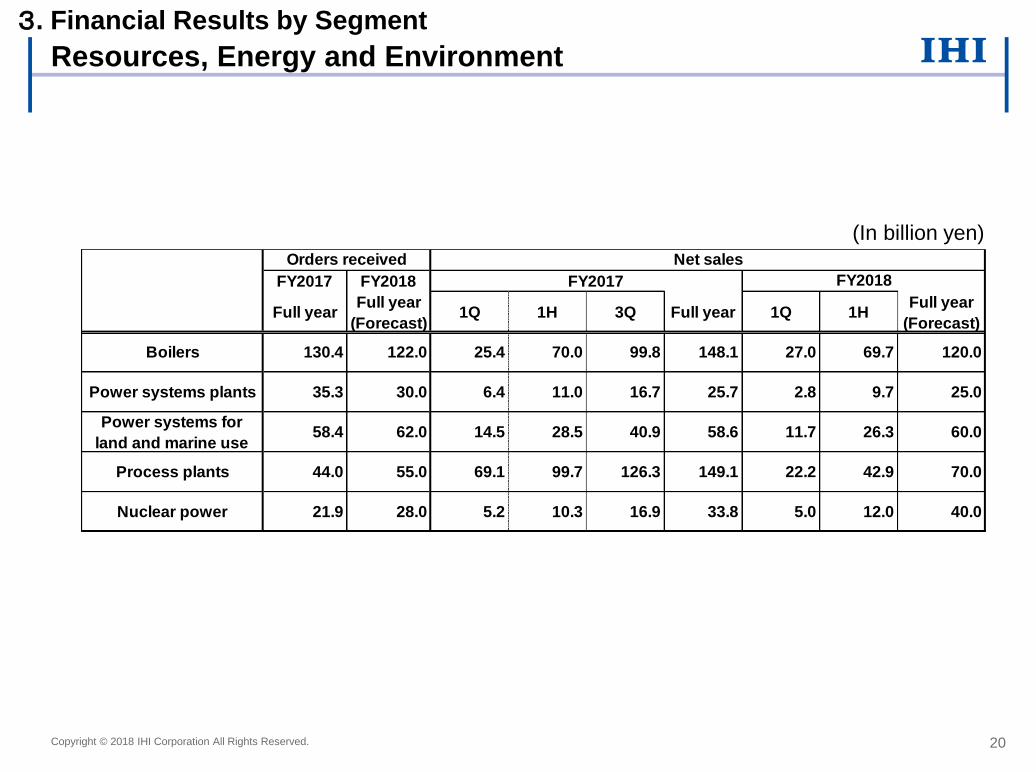
3. Financial Results by Segment
Resources, Energy and Environment
(In billion yen)
FY2017 FY2018 FY2017
Full yearFull year
(Forecast)1Q 1H 3Q Full year 1Q 1H
Full year
(Forecast)
Boilers 130.4 122.0 25.4 70.0 99.8 148.1 27.0 69.7 120.0
Power systems plants 35.3 30.0 6.4 11.0 16.7 25.7 2.8 9.7 25.0
Power systems for
land and marine use58.4 62.0 14.5 28.5 40.9 58.6 11.7 26.3 60.0
Process plants 44.0 55.0 69.1 99.7 126.3 149.1 22.2 42.9 70.0
Nuclear power 21.9 28.0 5.2 10.3 16.9 33.8 5.0 12.0 40.0
Orders received Net sales
FY2018

Copyright © 2018 IHI Corporation All Rights Reserved. 21
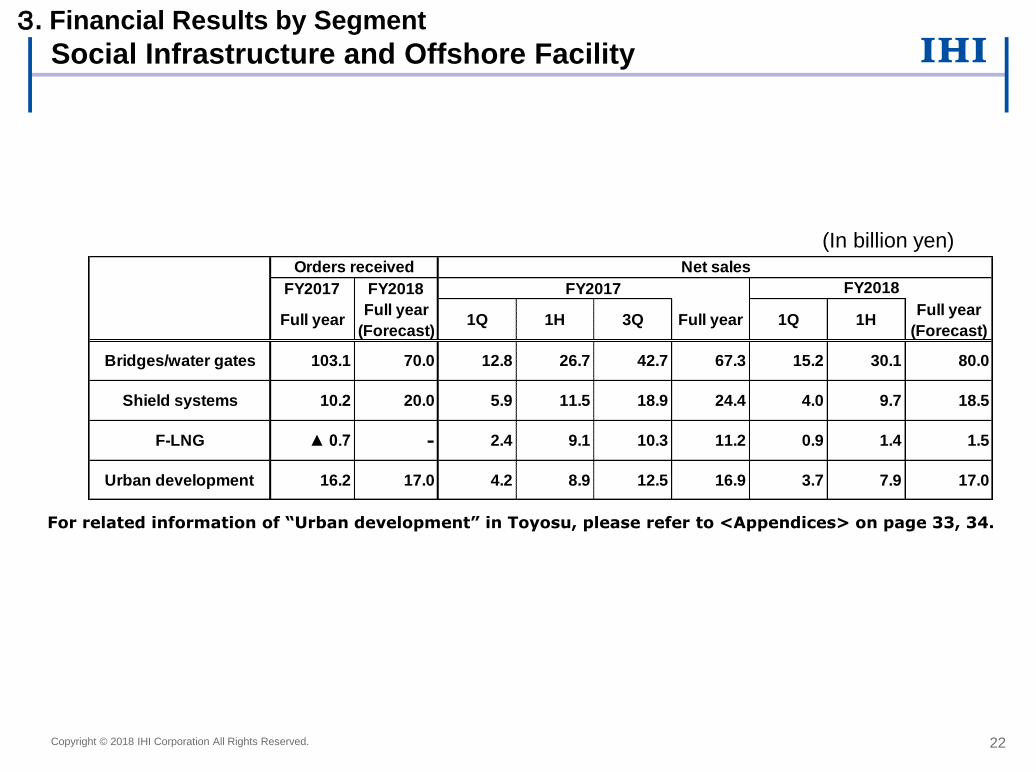
3. Financial Results by Segment
<Results by business segment>
【 Orders received 】
Orders received decreased from the previous corresponding
period in the Bridges/water gates Business.
【 Net sales 】
Net sales decreased in the F-LNG/Offshore structures
Business and the Shield systems Business, while increased
in the Bridges/water gates Business.
【 Operating profit 】
Operating profit decreased in the F-LNG/Offshore structures
Business owning to a pull back from FY2017, and in the
Transport systems Business.
(In billion yen, accumulated amount)
Orders received
Net sales
Operating Profit
Social Infrastructure and Offshore Facility
<FY2018 Forecast (vs. In August)>
The forecasts of orders received, net sales and operating
profit remain unchanged.
1Q 1H 3Q Fullyear
1Q 1H InAug.
InNov.
67.5
163.9
26.5 54.1
140.0 140.0
FY2017 FY2018 Full year(Forecast)
1Q 1H 3Q Fullyear
1Q 1H InAug.
InNov.
66.6
154.5
28.5 60.7
150.0 150.0
FY2017 FY2018 Full year(Forecast)
1Q 1H 3Q Fullyear
1Q 1H InAug.
InNov.
5.6
13.9
0.7
4.0
12.0 12.0
FY2017 FY2018 Full year(Forecast)
Copyright © 2018 IHI Corporation All Rights Reserved. 22
3. Financial Results by Segment
(In billion yen)
For related information of “Urban development” in Toyosu, please refer to <Appendices> on page 33, 34.
Social Infrastructure and Offshore Facility
FY2017 FY2018
Full yearFull year
(Forecast)1Q 1H 3Q Full year 1Q 1H
Full year
(Forecast)
Bridges/water gates 103.1 70.0 12.8 26.7 42.7 67.3 15.2 30.1 80.0
Shield systems 10.2 20.0 5.9 11.5 18.9 24.4 4.0 9.7 18.5
F-LNG ▲ 0.7 - 2.4 9.1 10.3 11.2 0.9 1.4 1.5
Urban development 16.2 17.0 4.2 8.9 12.5 16.9 3.7 7.9 17.0
Orders received Net sales
FY2017 FY2018

Copyright © 2018 IHI Corporation All Rights Reserved. 23
3. Financial Results by Segment
<Results by business segment>
【 Orders received 】
Orders received decreased due to the effect of FRPU in FY2017.
Without the effect, the orders received increased in the
Logistics/industrial systems Business, the Vehicular
turbochargers Business, the Thermal and surface treatment
Business and so on.
【 Net sales 】
Net sales decreased due to the effect of FRPU in FY2017.
Without the effect, the net sales increased in the Thermal and
surface treatment Business, the Vehicular turbochargers
Business and so on.
【 Operating profit 】
Operating profit increased from the previous corresponding
period, due to an increase of net sales in the Thermal and
surface treatment Business and the improvement of profitability
in the Parking Business and so on, despite the effect of FRPU in
FY2017.
(In billion yen, accumulated amount)
Orders received
Net sales
Operating Profit
Industrial System and General-Purpose Machinery
<FY2018 Forecast (vs. In August)>
The forecasts of orders received, net sales and operating
profit remain unchanged.
※ The effect of FRPU of 920 thousand units is included in FY2017.
1Q 1H 3Q Fullyear
1Q 1H InAug.
InNov.
246.3
474.0
115.3
237.2
470.0 470.0
FY2017 FY2018 Full year(Forecast)
1Q 1H 3Q Fullyear
1Q 1H InAug.
InNov.
227.1
459.0
104.8 209.9
440.0 440.0
FY2017 FY2018 Full year(Forecast)
1Q 1H 3Q Fullyear
1Q 1H InAug.
InNov.
7.4
18.9
4.0
8.1
22.0 22.0
FY2017 FY2018 Full year(Forecast)
<Number of vehicular turbochargers delivered>
2Q Full Year
FY2017 4,330 7,900
FY2018 3,540 7,200
(1,000 Units)

Copyright © 2018 IHI Corporation All Rights Reserved. 24
3. Financial Results by Segment
Industrial System and General-Purpose Machinery
(In billion yen)
For details of “Vehicular turbochargers”, please refer to <Appendices> on page 32.
FY2017 FY2018
Full yearFull year
(Forecast)1Q 1H 3Q Full year 1Q 1H
Full year
(Forecast)
Transport machineries 25.2 39.0 3.2 10.5 17.8 28.3 5.0 7.9 25.0
Parking 51.3 47.0 7.8 17.1 28.9 42.8 7.7 17.9 46.0
Thermal and
surface treatment50.3 42.0 13.2 23.0 32.6 43.8 11.1 21.0 40.0
Vehicular
turbochargers220.1 195.0 69.1 117.9 166.4 220.5 51.6 99.3 195.0
Rotating machineries 48.1 54.0 8.2 18.8 29.8 43.5 10.6 21.5 50.0
Orders received Net sales
FY2017 FY2018

Copyright © 2018 IHI Corporation All Rights Reserved. 25
3. Financial Results by Segment
<Results by business segment>
【 Orders received 】
Orders received increased from the previous corresponding
period in the aero engines for Japan Ministry of Defense.
【 Net sales 】
Net sales increased in the Civil aero engines Business.
【 Operating profit 】
Operating profit decreased mainly due to the effect of sales
increase in the new PW1100G engine, despite the decrease of
the cost of dealing with defects in the Civil aero engines
Business.
(In billion yen, accumulated amount)
Orders received
Net sales
Operating profit
Aero Engine, Space and Defense
<FY2018 Forecast (vs. In August)> The forecasts of orders received, net sales and operating
profit remain unchanged.
1Q 1H 3Q Fullyear
1Q 1H InAug.
InNov.
181.1
463.8
38.6
198.1
490.0 490.0
FY2017 FY2018 Full year(Forecast)
1Q 1H 3Q Fullyear
1Q 1H InAug.
InNov.
215.4
463.7
117.5
224.4
500.0 500.0
FY2017 FY2018 Full year(Forecast)
1Q 1H 3Q Fullyear
1Q 1H InAug.
InNov.
29.5
60.1
9.0
23.9
44.0 44.0
FY2017 FY2018 Full year(Forecast)
<Number of civil aero engines delivered>
2Q Full Year
FY2017 682 1,206
FY2018 749 1,700
(Units)

Copyright © 2018 IHI Corporation All Rights Reserved. 26
3. Financial Results by Segment
(In billion yen)
Aero Engine, Space and Defense
For details of “Civil aero engines”, please refer to <Appendices> on page 31.
FY2017 FY2018
Full yearFull year
(Forecast)1Q 1H 3Q Full year 1Q 1H
Full year
(Forecast)
Civil aero engines 319.1 340.0 69.7 141.3 216.6 281.0 73.1 152.5 325.0
FY2017
Net salesOrders received
FY2018

Copyright © 2018 IHI Corporation All Rights Reserved. 27
<Appendices> ・Progress in large overseas projects ・Topics in the Second Quarter under review ・Aero engines ・Vehicular turbochargers ・Urban development

<Project Brief> ・Contract: Lump Sum Turnkey EPC Agreement for the Elba Island
Natural Gas Liquefaction Facility and the Southern LNG
Expansion Facility
・Job Site: Elba Island, Chatham County, Savannah, Georgia, USA
・Scope: Engineering, Procurement, Construction, and
Commissioning of 2.5 MTPA Liquefaction facility
Progress in Large Overseas Projects
Expected Completion Image
Elba Liquefaction Project
<Status> As of the end of September 2018, installation works of MMLS #1~8 and
mechanical, electrical, and process control works of BOP are ongoing.
Progress of Engineering is 100%, Procurement is 97.5%, Construction
is 76.7%, Commissioning is 6.8%, and Overall Project is 77.3%.
<Key milestones> March 2016: Contract Award
November 2016: FERC Approval for the commencement of
construction
February 2017: Delivery commencement of MMLS #1 module
In 2018.4Q: Substantial Completion of MMLS #1 and BOP
In 2019: Substantial Completion of all facilities
28 Copyright © 2018 IHI Corporation All Rights Reserved.
As of end of September 2018
MMLS: Movable Modular Liquefaction System
This project has totally 10 MMLSs and 1 MMLS consists 79 modules.
<Project Brief>
・Contract: Full turn key contract for ultra-supercritical
boiler for Jimah East Power Sdn. Bhd. (IPP)
・Site: Jimah, Negeri Sembilan, Malaysia
・Scope: Engineering, Procurement, Construction
and Commissioning of Ultra-supercritical boiler
<Status> As of end of September 2018, erections of #1 boiler
insulation materials and ESP and #2 pressure parts, piping
and ESP are in progress. #1 commissioning activities started.
For boiler portion, 98% of engineering, 98% of procurement,
80% of erection and 39% of commissioning activities were
completed. As total 93% was completed.
<Key Milestones> Aug 2014: EPC Contract Oct 2018: Initial Firing(#1)
Jan 2017: Boiler Erection Start(#1) Apr 2019: Initial Firing(#2)
Jul 2017 : Boiler Erection Start(#2) Jun 2019: COD (#1)
Apr 2018: Hydro Test(#1) Dec 2019: COD (#2)
Nov 2018: Hydro Test(#2)
Expected Completion Image
Jimah East Power coal fired power plant
As of end of September 2018

Copyright © 2018 IHI Corporation All Rights Reserved. 29
IHI’s group company JIM TECHNOLOGY CORPORATION (“JIMT”) acquired 51% of
the shares of Hong Kong-based Terratec Ltd. (“Terratec”) from its shareholder
Terratec Group Inc. in October.
This capital alliance with Terratec enables JIMT, which has delivered more than 3,500
shield tunneling machines in Japan and overseas and which is particularly strong in
large-diameter shield tunneling machines, to deliver complete shield tunneling
machine systems that include subsequent equipment handled by Terratec. In addition,
JIMT will further strengthen its competitiveness through Terratec’s know-how in tunnel
boring operations, after-care service capabilities, and by overseas sales network
synergies in countries such as India, Thailand and Turkey, where Terratec has a high
market share.
The IHI Group intends to extract synergistic effects from this capital alliance at an
early stage, aiming to transform itself into a leading company in the global market for
shield tunneling machines.
Topics in three months under review
Conclusion of absorption-type merger contract
with regard to the integration of businesses related to waste treatment facilities
IHI Group Acquires Shares of Hong Kong-Based Terratec
<Large-diameter shield tunneling machine>
In September, IHI’s group company IHI Enviro Corporation (“IKE”), and Kobelco Eco-Solutions Co., Ltd. (“SKS”) concluded an
absorption-type merger contract with regard to the integration of IKE’s waste treatment facilities and other businesses, with said
contract scheduled to come into effect on January 1, 2019.
Since establishing a comprehensive business alliance relationship in March 2017, the two companies had conducted their
activities with the aim of expanding various businesses. However, in a business environment characterized by significant changes
caused by Japan’s declining population, it was decided that by concentrating the management resources of the two companies, a
more substantial presence could be built in this business field. The SKS Group, which will become the vehicle for the integrated
entity, will merge IKE’s strengths and special characteristics in an appropriate fashion to generate synergies, thus contributing to
the creation of a more environmentally aware society and local community.

As part of the global expansion of its business, IHI’s group company IHI Transport
Machinery Co., Ltd. established a new joint venture company to operate a mechanical
parking structure business with Qingdao Huatong Energy Investment Co., Ltd., and
Qingdao Huatong Science & Industry Investment Co., Ltd., two affiliates of state-
operated enterprise the Qingdao Huatong State-owned Capital Operation(Group) Co.,
Ltd. in Tsingtao-city, Shandong. The joint venture company will offer as its main model
the “super square parking structure” (horizontally elongated rotary carousel parking
structure) that offers excellent space efficiency and which does not exist in China, and
work to develop the business.
Copyright © 2018 IHI Corporation All Rights Reserved. 30
Building of a New Production Base for Civil Aero Engines
Topics in three months under review
IHI recently concluded a land purchase and sale agreement with Saitama Prefecture in order to
build a new production base in Tsurugashima-city, Saitama. IHI will build a maintenance plant for
civil aero engines, with the aim of further expanding the rapidly growing Civil aero engine
Business. Operations are scheduled to begin before the end of 2019. This is the first new
production base to be decided since the opening, 21 years ago, of the Soma Works (Soma-city,
Fukushima).
For the new plant IHI will introduce new technologies such as IoT and AI for use in an advanced
manufacturing system for aircraft engines. By generating synergies with the business operations
of the Mizuho Aero-Engine Works, IHI will build a production system with world-class efficiency,
providing an integrated aircraft engine service. In addition, by leveraging the superior access to
the airport, IHI will be able to provide high-quality engine services with shorter times to
completion to a variety of airline companies, both in Japan and overseas.
Operating under the new production system that will include the new base, IHI will strive to
achieve world-class levels of competitiveness in the Aero engine Business. In addition to
contributing to the development of the regional economy through the effective use of this new
base, going forward IHI will continue to provide a range of aircraft engines with superior
environmental performance, and to support the reliable, safe and comfortable operation of
aircraft throughout the world.
<Super Square Parking>
Establishing joint venture company of mechanical parking structure business in China
<Image of the new factory>

Copyright © 2018 IHI Corporation All Rights Reserved. 31
Aero engines
(1)Net sales of civil aero engines
(Note) The number of civil aero engine delivered is the number handed over to the airframe maker,
and differs from the number of factory shipments.
(2)Number of civil aero engines delivered (Units)
V2500 4,168 4,551 4,980 5,468 5,969 6,469 6,896 7,236 7,508 7,608Airbus
A319/320/321
GE90 1,071 1,223 1,399 1,589 1,806 2,039 2,257 2,457 2,617 2,667Boeing
B777
CF34 2,604 2,919 3,242 3,548 3,820 4,156 4,471 4,821 5,085 5,205For regional jet
(70 to 110 seats)
GEnx 118 259 468 751 1,035 1,295 1,542 1,666Boeing
B787/B747-8
PW1100G 16 148 398 722Airbus
A320Neo
Passport20 13 44Bombardier
Global7000/8000
Total 7,843 8,693 9,739 10,864 12,063 13,415 14,675 15,957 17,163 17,912
Main loading’09 ’10 ’11 ’12 ’13 ’14 ’15 ’16 ’17
Actual(accumulated)
’18/2Q
( In billion yen)
Actual Forecast
1Q 1H 3Q Full Year 1Q 1H Full Year
Net sales 169.8 226.0 267.0 299.1 291.5 69.7 141.3 216.6 281.0 73.1 152.5 325.0
’15’14’12 ’13 ’16FY2017 FY2018

Copyright © 2018 IHI Corporation All Rights Reserved. 32
Vehicular turbochargers
<Net sales by region>
( In billion yen)
Forecast
1Q 1H 3Q Full Year 1Q 1H Full Year
33.9 35.3 37.5 34.6 38.9 10.1 19.6 29.6 39.8 10.7 21.6 38.0
24.8 29.8 27.5 21.6 15.8 2.8 5.7 8.7 11.7 2.6 5.4 11.0
18.1 23.4 24.3 24.9 48.5 21.5 38.3 53.3 71.9 17.5 34.4 69.0
1.3 1.6 1.8 2.4 3.3 0.7 1.9 4.9 8.4 2.8 5.5 12.0
0.0 0.0 0.7 3.4 6.1 1.1 2.8 5.1 7.4 2.1 4.2 9.0
43.2 60.2 75.6 74.3 61.7 32.7 49.2 64.7 81.1 15.6 27.9 56.0
0.0 0.0 0.0 0.0 0.0 0.0 0.0 0.0 0.0 0.0 0.0 0.0
121.6 150.7 167.7 161.6 174.6 69.1 117.9 166.4 220.5 51.6 99.3 195.0Total
China
North America
Central and South
America
Europe
Others
Japan
Asia
’12FY2018
’13 ’14 ’15FY2017
’16
Actual

Copyright © 2018 IHI Corporation All Rights Reserved. 33
Urban development
(1)Lease revenue in Toyosu
(2)Lease revenue and expense in Toyosu(FY2018.2Q )
( In billion yen)
Forecast
FY2017
1Q 1H 3Q Full Year 1Q 1H Full Year
Lease
revenue9.2 9.1 9.3 10.1 9.3 2.3 4.6 6.9 9.2 2.3 4.6 9.3
Actual
’15FY2018
’16’12 ’13 ’14
( In billion yen)
Depreciation Others
FY2018.2Q 4.6 1.9 1.2 1.5
Lease
revenue
Lease expense Lease
income

Toyosu
1-chome
Plan
Shibaura
Institute of Technology
City Towers
Toyosu
The Symbol
The
Toyosu
Tower
Toyosu Kita
Elementary
District 3-1
1.4 ha (Share of IHI : 18%)
The Dai-ichi Life
Insurance Company
(Head Office)
IHI Head office Urban Dock
Park City Toyosu
Urban Dock
LaLaport Toyosu
District 4-1
1.0ha
Toyosu
Residence
Royal
Parks
Toyosu
District 4-2
1.9 ha
Toyosu
3-Chome
Park
Traffic
Circle
District 3-2
1.6 ha (Share of IHI : 33%)
Toyosu Park
2.4 ha
(Relocated from
station front)
Yurikamome Line
(Opened in March 27, 2006)
Development Plan for
Toyosu 1 to 3 chome Area
Toyosu Front
(IHI, Mitsubishi Estate Company, Ltd. and
Mitsubishi UFJ Trust and Banking Corporation)
15 floors above ground , Approx. 75m high
Gross floor area : 106,861㎡
Completed in August 2010
Property
of IHI Approx. 5ha
Toyosu Center Building Annex
33 floors above ground, Approx. 150m high
Gross floor area : 105,448㎡
Completed in August 2006
Toyosu Center Building
37 floors above ground , Approx. 165m high
Gross floor area : 100,069㎡
Completed in October 1992
Kindergarten, Nursery school,
Café, Marriage ceremonial hall.
Site area : 19,492㎡
Completed in March 2010 to February 2011
Toyosu Station,
Yurakucho Line
Office Leasing
As of November 2018
Toyosu Foresia
(IHI & Mitsubishi Estate Company, Ltd.)
16 floors above ground, Approx. 75m high,
Gross floor area : 101,503㎡
Completed in July 2014
Urban Dock LaLaport Toyosu ANNEX
(Mitsui Fudosan Co., Ltd.)
5 floors above ground, Approx. 25m high
Store floor space : 24,721㎡
Opened in October 2006
Complex building A・C,
(IHI and Mitsui Fudosan)
36 floors above ground, Approx. 178m high
Gross floor area : 185,000㎡
Scheduled for completion in April 2020
Ha
ru
mi
S
tr
ee
t
Toyosu IHI Building
25 floors above ground, Approx. 125m high
Gross floor area : 97,617㎡
Completed in February 2006
Land Leasing
Category 1 Urban Redevelopment Project ※1
Sold, Donated, Exchanged
District 2
2.6ha
(Partially owned
by IHI)
※1 One of the way to redevelop that was defined by Urban Renewal Act.
Civic Center : Opened in September
2015
Fire department office : Completed in
June 2016
Building A
Building B
Building C
Civic Center
Office Leasing (Leased land)
District 1
2.7 ha

Forward-looking figures shown in this material with respect to IHI’s performance outlooks and other matters are based on management’s
assumptions and beliefs in light of the information currently available to it, and therefore contain risks and uncertainties. Consequently, you should
not place undue reliance on these performance outlooks in making judgments. IHI cautions you that actual results could differ materially from
those discussed in these performance outlooks due to a number of important factors. These important factors include political environments in
areas in which IHI operates, general economic conditions, and the yen exchange rate including its rate against the US dollar.