financial reviewop income margin $2.1b 14.2% $2.0b 16.0% net income margin $1.5b 10.5% $1.4b 11.7%...
TRANSCRIPT
FINANCIAL REVIEWDAN SCHMECHELCHIEF FINANCIAL OFFICERSeptember 5, 2019

Current Position
It’s been a busy 2 years
We’ve delivered
We’ve invested
We are well set up for the future

8%
10%
14%13%
11%12%
13%12%
Q3 17 Q4 17 Q1 18 Q2 18 Q3 18 Q4 18 Q1 19 Q2 19
Quarterly Adjusted EPS Growth
We Delivered EPS
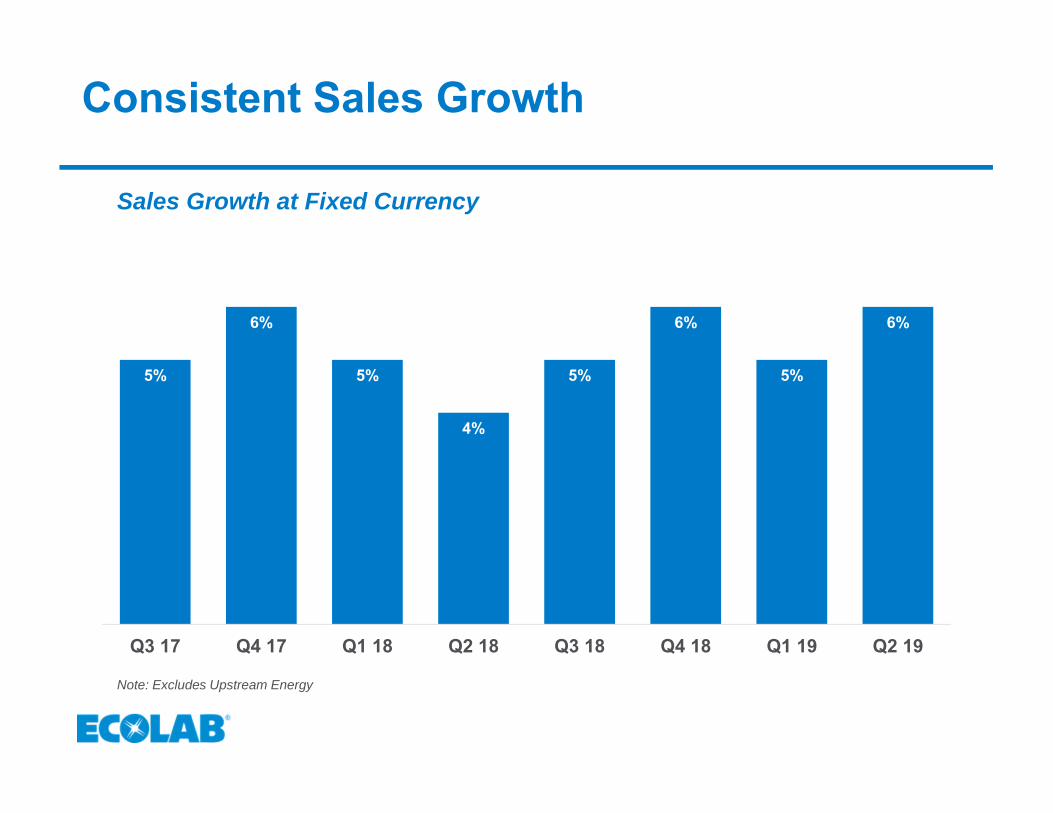
5%
6%
5%
4%
5%
6%
5%
6%
Q3 17 Q4 17 Q1 18 Q2 18 Q3 18 Q4 18 Q1 19 Q2 19
Sales Growth at Fixed Currency
Note: Excludes Upstream Energy
Consistent Sales Growth

(1.2)pp(1.0)pp
(0.6)pp (0.5)pp
+0.3pp +0.3pp
+0.7pp
+1.4pp
Q3 17 Q4 17 Q1 18 Q2 18 Q3 18 Q4 18 Q1 19 Q2 19
Adjusted OI Margin Improvement at Fixed Currency
Improving OI Margin
Note: Excludes Upstream Energy

12.2%
12.8%
2017 2018
Added 110 bpsEfficiency Initiative (Net) (40) FX (10)Delivered 60 bps
Improving ROIC

400 300
1,020
400
750
458 250
250
500 500 700 673 673
-
250
500
750
1,000
1,250
1,500
2019 2020 2021 2022 2023 2024 2025 2026 2027 … 2041 … 2046 2047
$M
Balance Sheet Management
Capital Structure and Coverage
Debt Maturity ($M)
$0.8
$7.6 $6.5 $6.9 $6.5 $6.5 $6.7
$7.3 $7.0
0.5x
2.9x
2.4x2.5x
2.2x 2.2x 2.2x2.4x
2.2x
0.0x
0.5x
1.0x
1.5x
2.0x
2.5x
3.0x
(1,000)
1,000
3,000
5,000
7,000
9,000
11,000
13,000
2010 2011 2012 2013 2014 2015 2016 2017 2018
Fixed Debt ($B)Floating Debt ($B)Net Debt / Adj. EBITDA Strong balance sheet provides
operating and strategic flexibility
Target A-range metrics ~2x net debt / Adj. EBITDA
Taking full advantage of low interestrate environment Extended weighted average
maturity from 8.5 years to 9.3 years Maintained weighted average
coupon at 3.3%

Total Investments >$600M
2014 2015 2016 2017 2018
DigitalSAPGlobal HR
$110M$90M
$80M
$200M
$180M
Digital Investment Growing

Enhance Customer Value
and Revenue
Increase Field
Productivity
Drive Operational
Performance
- Digital offerings- Total site performance- Enterprise optimization
- Predictive analytics- Remote monitoring- Ecolab on your phone
- eCommerce- Live order management- Safe deliveries
Digital: Strategic Value Pillars

Customer contract growth and profitability
Pricing strategy and execution
Global visibility and efficiency
Corporate Account Finance support
Efficient channel management
Delivering Enhanced Business Support and Efficiency Gains
Building a Better Finance Tool Kit with SAP
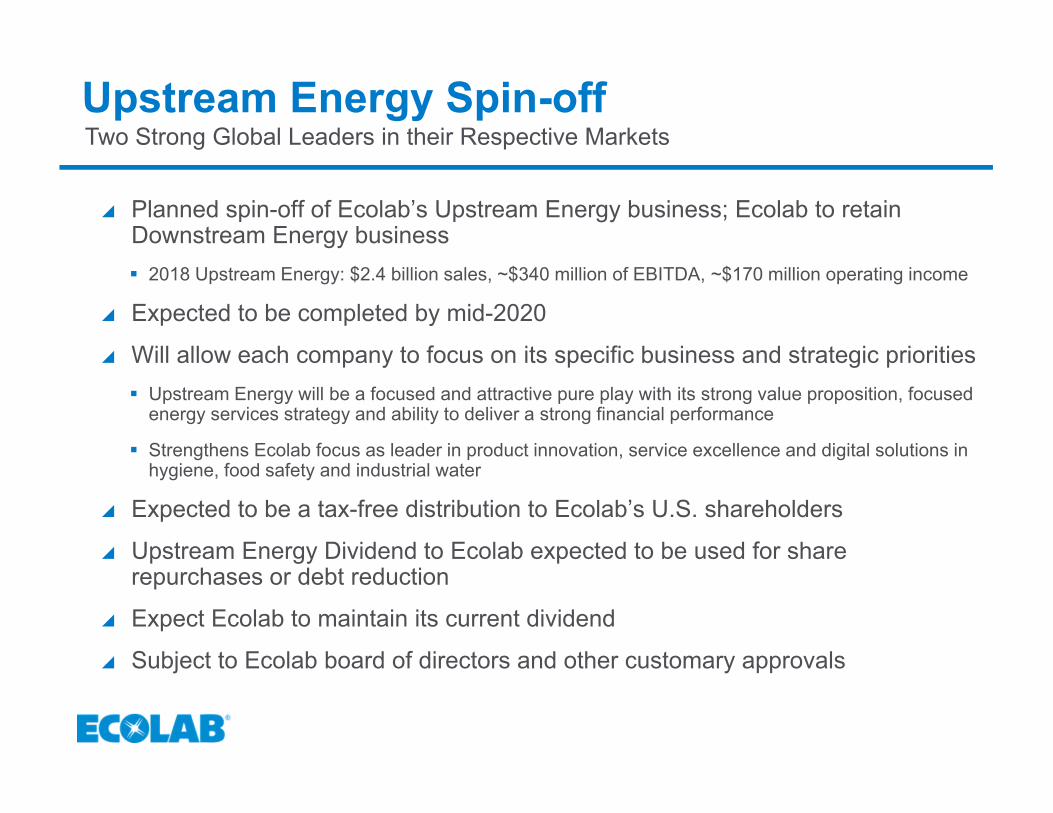
Upstream Energy Spin-offTwo Strong Global Leaders in their Respective Markets
Planned spin-off of Ecolab’s Upstream Energy business; Ecolab to retainDownstream Energy business 2018 Upstream Energy: $2.4 billion sales, ~$340 million of EBITDA, ~$170 million operating income
Expected to be completed by mid-2020
Will allow each company to focus on its specific business and strategic priorities Upstream Energy will be a focused and attractive pure play with its strong value proposition, focused
energy services strategy and ability to deliver a strong financial performance
Strengthens Ecolab focus as leader in product innovation, service excellence and digital solutions inhygiene, food safety and industrial water
Expected to be a tax-free distribution to Ecolab’s U.S. shareholders
Upstream Energy Dividend to Ecolab expected to be used for sharerepurchases or debt reduction
Expect Ecolab to maintain its current dividend
Subject to Ecolab board of directors and other customary approvals
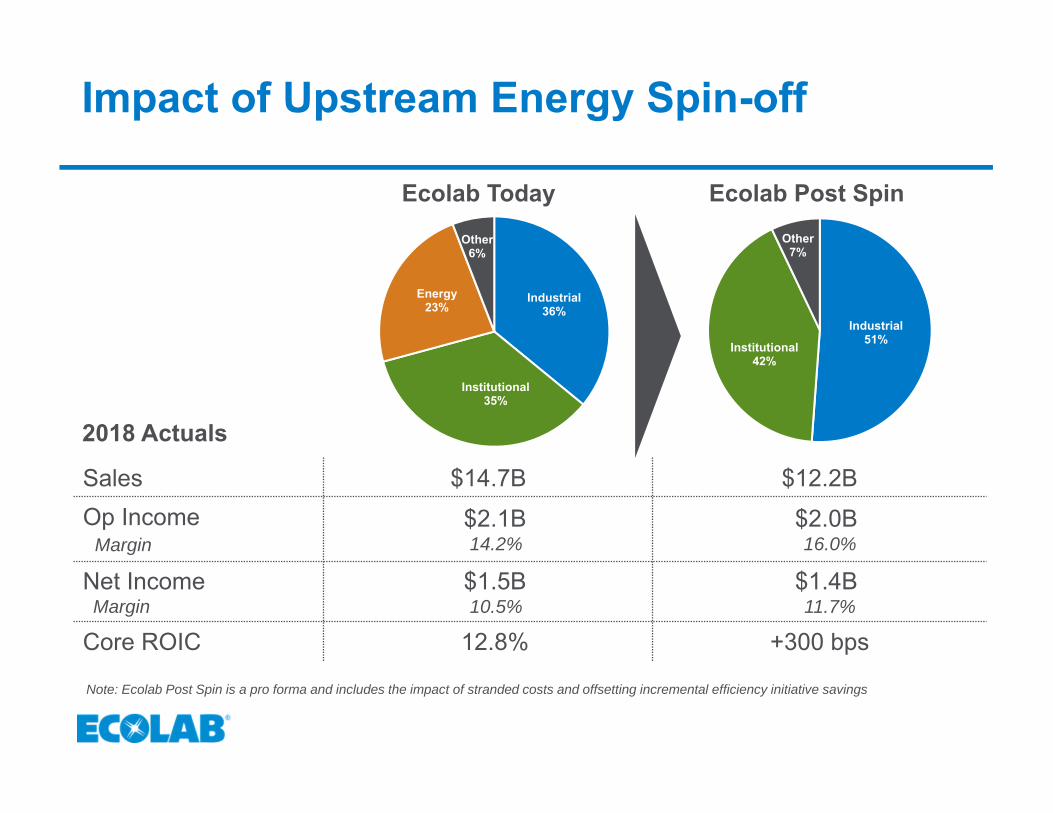
Impact of Upstream Energy Spin-off
Sales $14.7B $12.2BOp Income
Margin$2.1B 14.2%
$2.0B16.0%
Net Income Margin
$1.5B 10.5%
$1.4B 11.7%
Core ROIC 12.8% +300 bps
Industrial36%
Institutional35%
Energy23%
Other6%
Industrial51%Institutional
42%
Other7%
Ecolab Today Ecolab Post Spin
2018 Actuals
Note: Ecolab Post Spin is a pro forma and includes the impact of stranded costs and offsetting incremental efficiency initiative savings
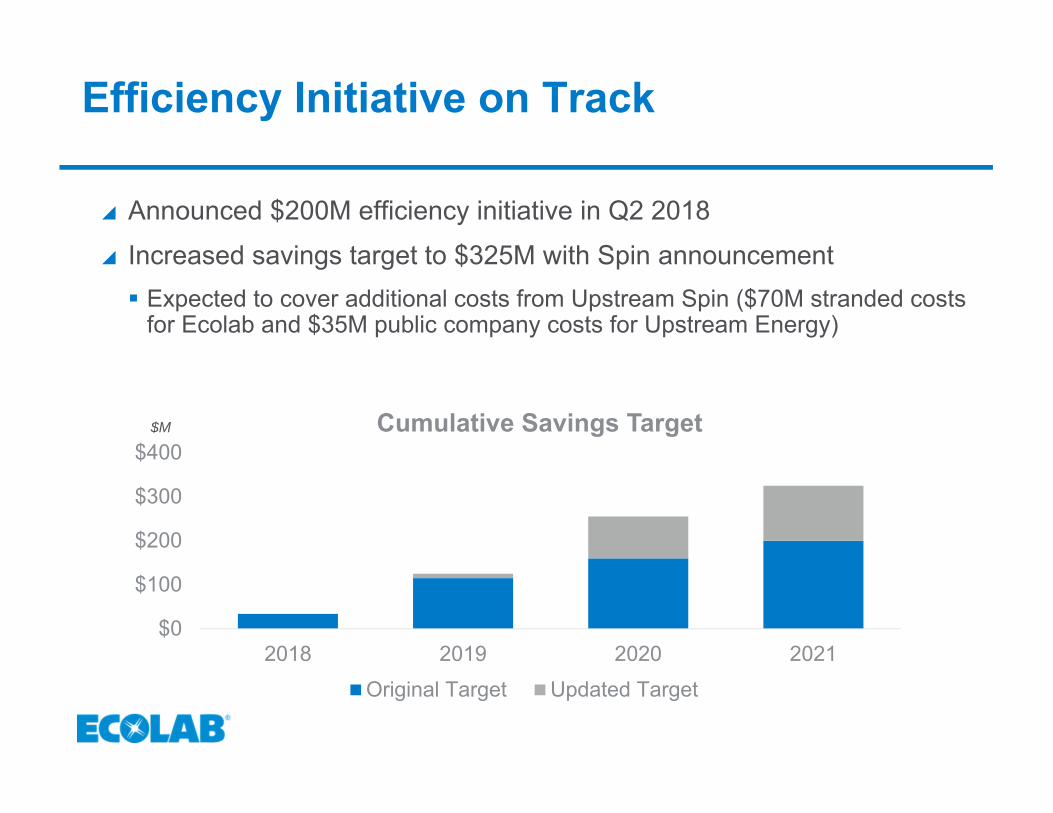
Announced $200M efficiency initiative in Q2 2018 Increased savings target to $325M with Spin announcement Expected to cover additional costs from Upstream Spin ($70M stranded costs
for Ecolab and $35M public company costs for Upstream Energy)
$M
$0
$100
$200
$300
$400
2018 2019 2020 2021
Cumulative Savings Target
Original Target Updated Target
Efficiency Initiative on Track
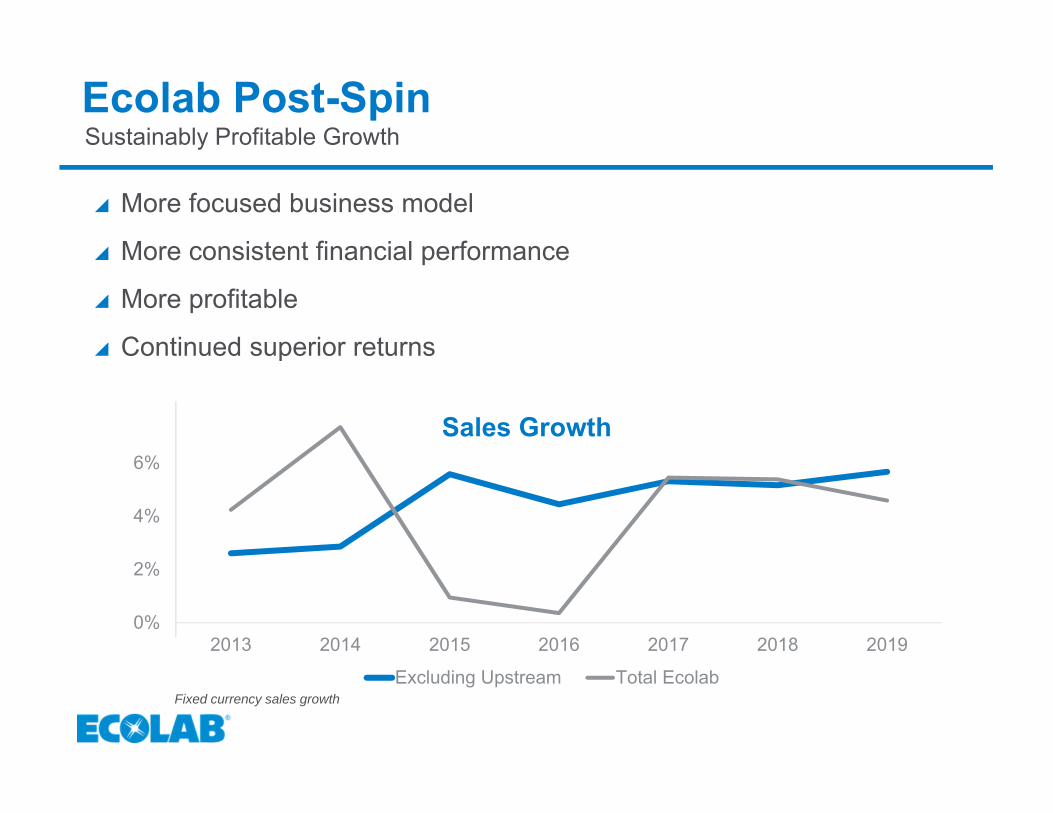
More focused business model
More consistent financial performance
More profitable
Continued superior returns
0%
2%
4%
6%
8%
2013 2014 2015 2016 2017 2018 2019
Excluding Upstream Total Ecolab
Sales Growth
Fixed currency sales growth
Ecolab Post-SpinSustainably Profitable Growth

High quality growth
Consistent financial performance
Low capital intensity
Improving margins
Strong returns
Ecolab Model

Strong, Consistent GrowthOutperforming our Markets and the S&P 500
$0.00
$1.00
$2.00
$3.00
$4.00
$5.00
$6.00
2004 2005 2006 2007 2008 2009 2010 2011 2012 2013 2014 2015 2016 2017 2018
2012 EPS include the Nalco merger2013 EPS include the Champion acquisition
EPS (adjusted)
Adjusted Earnings
Two decades of consistent, double digit EPS growth
11% 11%12%
20 yrs 10 yrs 1 yr
ECL
+11% EPS CAGR (1.8x S&P 500)
EPS CAGR

0.0%
2.0%
4.0%
6.0%
8.0%
2013 2014 2015 2016 2017 2018
Dispensing Capex All Other Capex
Strong Free Cash Flows
Free Cash Flows ($ millions) Driven by top-line growth and continued
margin expansion
90%+ Free Cash Flow Conversion Focus on working capital
Low Capital intensity Capex ~6% of Sales Includes product dispensing equipment
to support growth
Clear cash priorities Grow dividend in line with EPS growth Acquisitions Share repurchase
$0
$400
$800
$1,200
$1,600
2013 2014 2015 2016 2017 2018
Average conversion ratio of 94%
Capex % of Sales
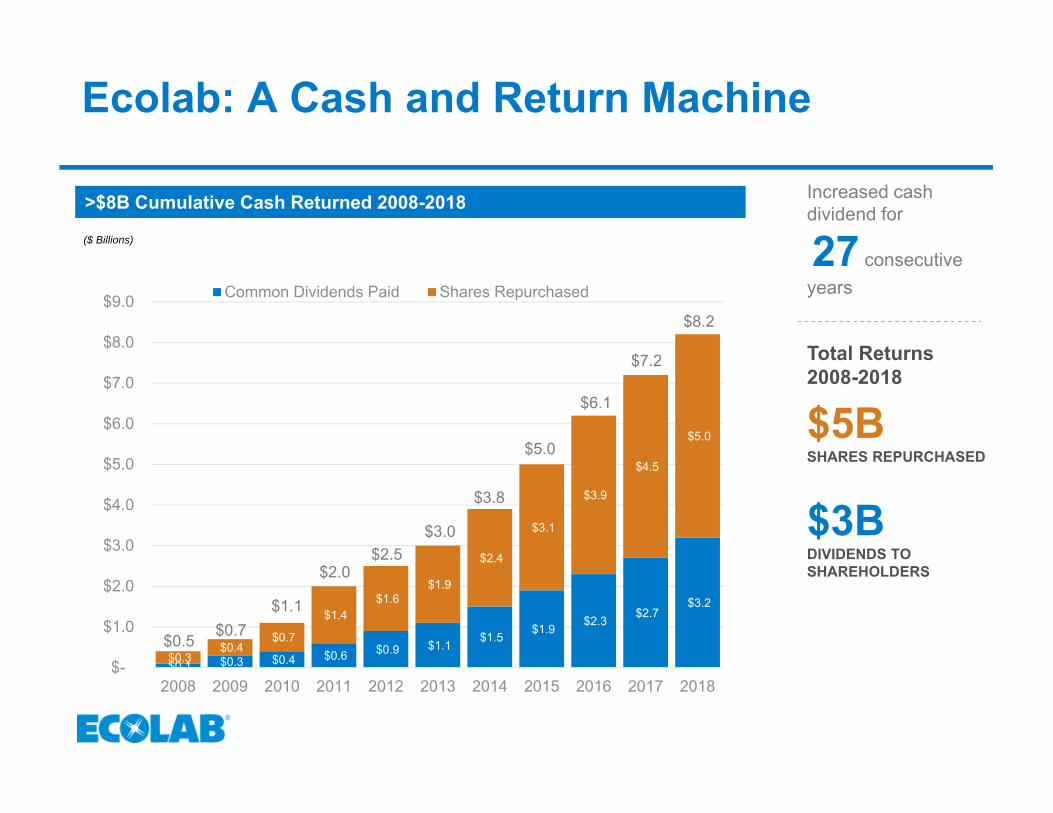
Ecolab: A Cash and Return Machine
>$8B Cumulative Cash Returned 2008-2018 Increased cash dividend for
27 consecutiveyears
Total Returns2008-2018
$5B SHARES REPURCHASED
$3B DIVIDENDS TO SHAREHOLDERS
($ Billions)
$0.1 $0.3 $0.4 $0.6 $0.9 $1.1 $1.5 $1.9 $2.3 $2.7 $3.2
$0.3 $0.4
$0.7
$1.4 $1.6
$1.9
$2.4
$3.1
$3.9
$4.5
$5.0
$0.5 $0.7$1.1
$2.0 $2.5
$3.0
$3.8
$5.0
$6.1
$7.2
$8.2
$-
$1.0
$2.0
$3.0
$4.0
$5.0
$6.0
$7.0
$8.0
$9.0
2008 2009 2010 2011 2012 2013 2014 2015 2016 2017 2018
Common Dividends Paid Shares Repurchased

EPS GROWTH
~2x net debt / adjusted EBITDA
RETURNS: IMPROVE ROIC ANNUALLY
LEVERAGE1. Grow dividend in line with
EPS growth2. Acquisitions3. Share repurchase
CASH PRIORITIES
15% +100bps
Consistent Financial ObjectivesPositioned to Drive Sustainable, Profitable Growth

Business Strategy
Finance Strategy
Right Focus, Right Teams, Right Tools
ConsistencyPredictabilityTransparency
Rigorous operating discipline Business aligned commercial Finance teams Focus on top-line growth and profitability Drive consistent and transparent financial performance
Steward strong financials, cash flow, returns Clear cash priorities, making critical investments Strong balance sheet and cash flow fundamentals M&A activity continues to be part of the story
Powerful, proven strategy to drive top-line growth Global leader with small share of $130B+ market Serving fundamental, global and increasingly complex
customer needs
Finance Partnership with the BusinessGreat Business Model, Strong Execution
ECOLAB CLOSING COMMENTS
DOUG BAKER
CHAIRMAN AND CEO
September 5, 2019

There is still HUGE upside
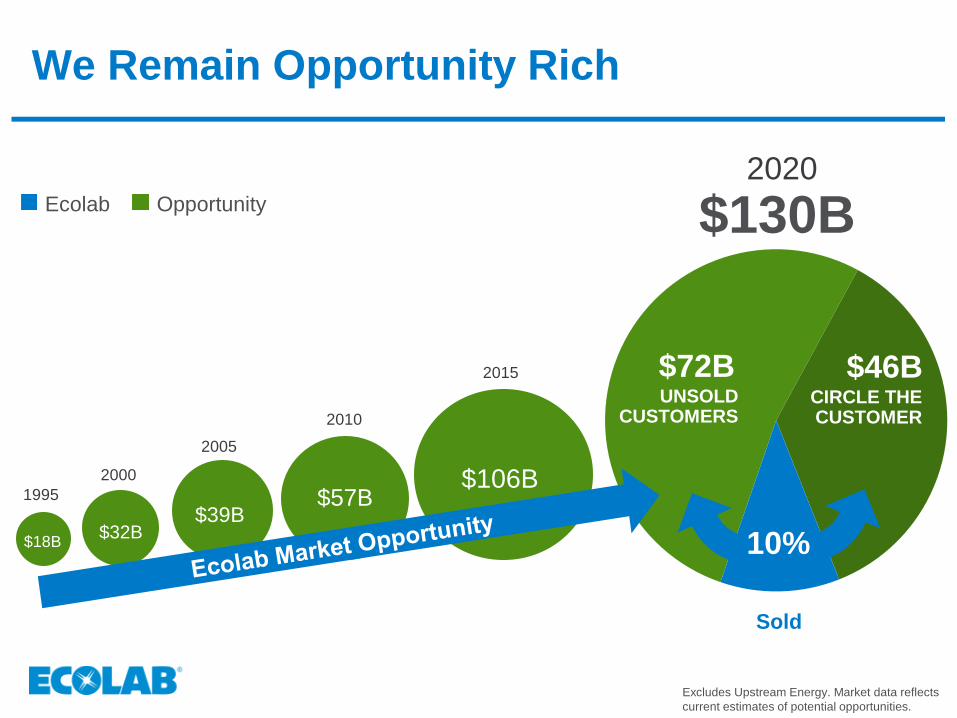
Excludes Upstream Energy. Market data reflects
current estimates of potential opportunities.
Ecolab Opportunity $130B
10%
$72BUNSOLD
CUSTOMERS
$46BCIRCLE THE CUSTOMER
$106B
$39B$32B
$18B
$57B1995
2000
2005
2010
2015
2020
We Remain Opportunity Rich
Sold

Perfectly Positioned
GLOBAL LEADER
19 trillionBTUs of energy
188 billion gallons of water
CLEAN
WATER
SAFE
FOOD
ABUNDANT
ENERGY
HEALTHY
ENVIRONMENTS
54 millionpounds of waste
2.4 billionpounds of CO2e
Annually saving customers:

Execution Strategy Adjustments
Historical
Make where we sell
Best in class technology
Great talent
Global execution
Future
Make where we sell
Best in class technology
Great talent
Global / Local execution
▪ Key market enablement
▪ Decisions and accountabilitycloser to customerDigital!

Team
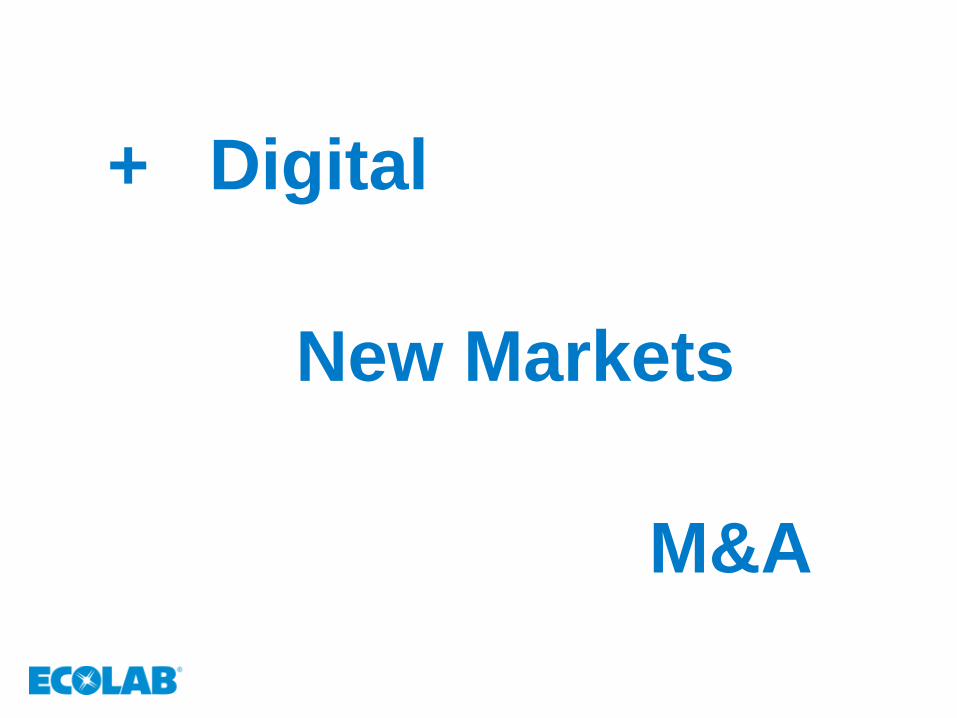
New Markets
+ Digital
M&A
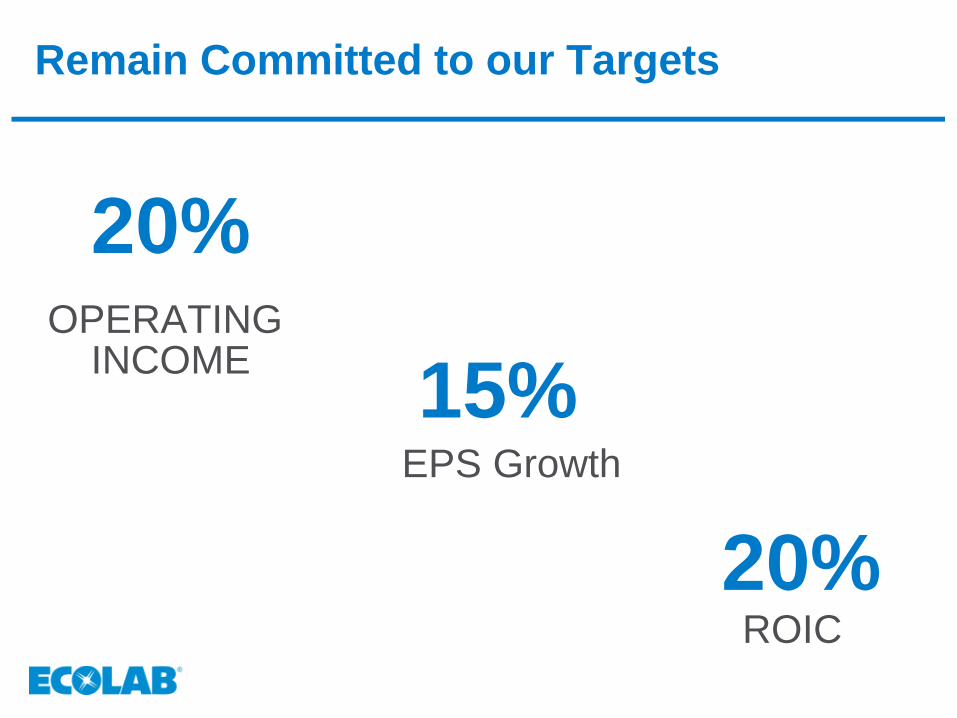
Remain Committed to our Targets
OPERATING INCOME
ROIC
15%EPS Growth
20%
20%