financial risks, growth, earnings and stock returns relationship
TRANSCRIPT
International Review of Business Research Papers
Vol. 8. No.7. November 2012. Pp. 79 – 93
Financial Risks, Growth, Earnings and Stock Returns Relationship: The Case of Indonesia
Khristina Purnamasari1, Irene Herdjiono2 and Evelyn Setiawan3
The objective of this study is to give empirical findings whether financial risks and growth opportunity have a significant influence on returns to earnings relation. The sample of this study is 22 commercial banks listed in the Indonesian Stock Exchange during 2008-2010. The results show that the impact of solvency risk on returns to earnings relation is negatively significant. The growth opportunity factor is also significant, which suggests that this is an important factor that determines investor’s valuation of the bank share prices in response to the earnings changes. The other two financial risk factors are not significant.
Field of Research: Financial Accounting, Banking
1. Introduction
Investors will use all of the information available in the market to analyze firms’ performance, make predictions and make investment decisions (Quinn, 2008 and Scott, 2001). Earnings is become one of the most important information. Firm’s earnings will reflect managements’ performance, estimate the ability of representative earnings, and assess investment or loan risk (FASB, 1985). Earnings come with information contents that are useful in predicting stock prices (Suaryana, 2005). Based on the efficient market hypothesis (Fama, 1970), stock prices will react instantaneously if there are new information relating to them. Beaver (1968) find a correlation between changes in accounting earnings to stock prices, which stock prices will move according to investor’s belief in company ability to generate profits. The difference between investors’ expected earnings and firms’ actual earnings is called abnormal returns (Scott, 2001). Investors will buy stocks when the actual returns are higher than the expected returns (good news). The stock prices will go up and result on positive abnormal returns. Otherwise, there will be negative abnormal returns when the actual returns are lower than the expected returns (Ball and Brown, 1968). Relationships between earnings and stock returns have an important role to determine the firms’ sustainability, especially in the banking sectors. The higher the banks’ earnings, the more people want to buy the stocks, and the higher the prices will be. However, bank operations are risky, that make conditions mentioned above
1 Student, Department of Accounting, Pelita Harapan University of Surabaya ([email protected])
2 Lecturer, Department of Accounting, University of Merauke ([email protected])
3 Lecturer, Department of Accounting, Pelita Harapan University of Surabaya

Purnamasari, Herdjiono & Setiawan
80
not always be met. In addition, banks’ growth opportunities are also become one of the important considerations in making investment decisions. The previous empirical studies reveal divergent views of researchers on the issue about the relationship between earnings and stock returns. These inconsistencies and the limited studies on this area in Indonesia become motivation to conduct this study. The objective of this study is to analyze the relationship between earnings and stock returns in Indonesian commercial banking. As a highly regulated institution, bank has unique characteristics which can be an interesting research topic. Furthermore, this study also aimed to give empirical findings whether credit risk, liquidity risk, solvency risk, and growth opportunity have significant influences on returns to earnings relation. This study finds some surprising result. The solvency risk has a negatively significant influence on the earnings to returns relation. Since the average solvency risk for commercial banks in Indonesia is reached 1015% in year 2008, 762% in 2009, and 878% in 2010, investors are less confident with the Indonesian banks’ risk. This study also demonstrated that growth opportunity is negatively related to earnings and stock return relationship. These results do not support Mayangsari (2004); Mulyani et al. (2007), and Ambarwati (2008) that find a positive relation between stock returns to the announcement of earnings and various proxies of growth opportunities. This study is organized as follows: section two is a literature review. The model, data and research methodology are presented in the section three. Analysis results are interpreted in the third section. Finally, the conclusion, originality and timeliness will be presented in the last section.
2. Literature Review
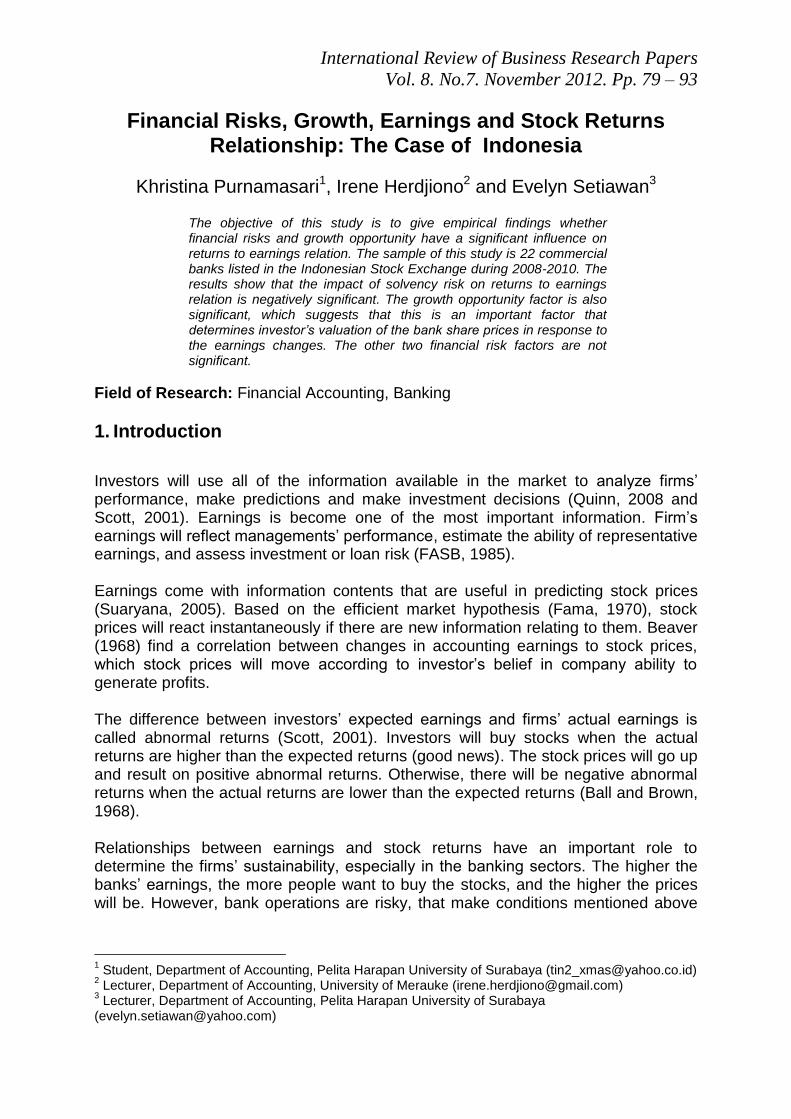
Efficient market is defined as a market where important current information is almost freely available to all participants. In an efficient market, actual price of individual stocks already reflect the effects of information based both on events that have already occurred and on events which the market expects to take place in the future, and it is impossible to make abnormal returns (Fama, 1965). Abnormal return is the difference between the actual return of a stock and the expected return. Expected return is investor’s estimation of the value of a stock, before the firm’s earnings announcement. Actual return is the actual gain or loss of an investor, which can be different from the expected return (Scott, 2001). The relationship between actual return, expected return, and abnormal return is shown in figure 1.
Purnamasari, Herdjiono & Setiawan
81
RMt = Return on market portfolio for period t
Rjt = Return on firm j’s shares for period t
ϵjt (abnormal return) = 0.0006
0.001
0.0009
Slope = βj = 0.80
0.0015
RMt
Actual return
Expected
return
Rjt
Intercept = αj = 0.0001
Figure 1:The Relationship Between Actual Return, Expected Return, And Abnormal Return
Cumulative Abnormal Return (CAR) is the sum of all investor’ returns from his/her investments (Jogiyanto, 2000). CAR is often used to investigate the events that affect stock price (Suaryana, 2005). CAR shows the different market reactions to earnings announcement (Mulyani et al., 2007; Mayangsari, 2004). The different reactions of stock markets are due to a number of different reasons, such as beta risk, capital structure, persistence, earnings quality, growth opportunities, the similarity of investor expectations and the informativeness of price (Scott, 2001). Cheng and Nasir (2010) investigate seven risk factors that affect earnings response coefficients in China commercial banks. The study finds that the liquidity risk contains the information beyond earnings change which contributed significantly to the returns to earnings relation. In Thailand, investors look at the interest risk significantly in the earnings response valuation among the other financial risks variables (Soh et al., 2009), whereas in Australia and Malaysia, investors price credit risk significantly in the earnings response valuation (Cheng and Nasir, 2008; Cheng and Ariff, 2007). There are inconsistent results from the study about earnings and stock returns relationship, but such relationship in Indonesian commercial banking has not yet been studied. Mayangsari (2004) find that earning persistence, growth opportunities, beta risk, and capital structure significantly influence earnings and stock returns relationship in the Indonesian unregulated company. The finding in this study is consistent with Mulyani et al. (2007) that study the same relationship in Indonesian manufacturing company and Ambarwati (2008) who does a literature review. In contrast, Palupi (2006) shows that earnings predictability, firms’ size, growth opportunities, and firms’ failure have no significant effect to the returns to earnings relations in all Indonesian listed firms, except banking sector. 2.1. The Earnings And Stock Returns Relationship
Earnings are one of the most important factors in financial reporting. Information related to earnings probably attracts the highest rate of attention from investors and
Source : Scott, 2001:15

Purnamasari, Herdjiono & Setiawan
82
other external parties since earnings will determine firms’ future performance (Moradi et al., 2010). The majority of previous studies on the returns to earnings relation have provided evidence that earnings and related information about earnings explain stock returns (Cheng and Nasir, 2008). The degree of earnings informativeness will affect investors’ reactions to the information, thus the stock price. If the reported earnings are not particularly informative to investors, there will be a small, or no stock price change. In contrast, a large stock price change associated with a dollar change in earnings, reflecting investors’ belief that earnings are largely permanent (Lev and Zarowin, 1999). H1 : There is a relationship between earnings and stock returns. 2.2. The Effect Of Liquidity Risk On The Earnings And Stock Returns
Relationship Liquidity risk refers to the availability of company resources to meet short-term cash requirements (Subramanyam and Wild, 2010). Diverse banks’ operations, such as transaction deposits, maturing loan requests, and saving accounts, are highly related to liquidity risk, as they are fully liable to make available liquidity when stipulated by the third party (Akhtar et al., 2011). When withdrawal exceeds new deposits significantly over a short period, banks get into liquidity trouble. In the banking sector, liquidity risk management is very important. The reaction of stock prices to earnings will be affected by liquidity risk. This is because the liquidity risk will show banks’ operating activities, their ability to generate profits in the future, and working capital requirements and measures (Subramanyam and Wild, 2010). Therefore, the lower the liquidity risk means the lower the opportunity for profit (Al-Khouri, 2011). H2 : Liquidity risk affects the relationship between earnings and
stock returns.
2.3. The Effect Of Credit Risk On The Earnings And Stock Returns Relationship
Credit risk remains the dominant problem confronting banks. Credit risk is defined as the probability of loss due to a debtor’s non–payment of a loan or other line of credit such as interest (Cheng and Nasir, 2010). This risk arises because the banks have not been able to analyze the risk of debtor default correctly. As the result, the banks tend to have a high loan loss allowance and non performing loans (Cheng and Nassir, 2008). Nevertheless, banks need to identify, monitor and control credit risk as well as ensure capital adequacy to anticipate the risk (Hadad et al., 2007). Cheng et al. (2001) identified credit risk factor of banks as a significant influence on returns to earnings relation and which is an important factor that enters the revaluation of bank share prices. This study’s result is in accordance to Scott (2001), which states that bank’s stock values are negatively affected by non-performing loans.
Purnamasari, Herdjiono & Setiawan
83
H3 : Credit risk affects the relationship between earnings and stock returns.
2.4. The Effect Of Solvency Risk On The Earnings And Stock Returns
Relationship
Solvency refers to a company's long-run financial viability and its ability to cover long-term obligations (Subramanyam and Wild, 2010). This risk is measured by comparing all of bank’s financial obligations with all of its equity, which is called debt to equity ratio (Cheng and Nasir, 2010). The higher the debt to equity ratio leads to the lower the stock price and investors’ returns. This is because a large portion of banks’ income will flow to creditors than to shareholders (Ambarwati, 2008). Investors will accept lower profits so that they have lower interest to invest, which will make a declining stock price. Solvency risk will affect banks’ unexpected earnings. The high percentage of debt will weaken the relationship between earnings and stock returns, and vice versa (Ambarwati, 2008). Banks must manage their solvency risk properly, so they can generate greater earnings, get more investors’ trust, and increase their stock price. H4 : Solvency risk affects the relationship between earnings and
stock returns.
2.5. The Effect Of Growth Opportunity On The Earnings And Stock Returns Relationship
Growth opportunity is related to banks’ current high profitability that capable to be extending in the future. Another source of growth is capital that can be easily attracted by the banks. Growth opportunity will affect future earnings. The extent of current good news in earnings suggests growth opportunity, the stock returns will be high (Scott, 2001). Collins and Kothari (1989) find that banks with high growth opportunity tend to have high stock prices and stock returns. In contrast, Gombola et al. (1998) and Smith and Watt (1992) state that high growth opportunity is associated with high level of information asymmetry, that is growth firms experience poorer post-issue long-term price performance. Issuance of new shares of the company, which is used as a proxy of growth opportunities, is considered as the act of management to take advantage of the overvalued stock price. Therefore, when management announced the issuance of new shares, investors will tend to decrease their expectation of the bank, which will affect the stock price and stock return. H5 : Growth opportunity affects the relationship between earnings
and stock returns.
Purnamasari, Herdjiono & Setiawan
84
3. Methodology
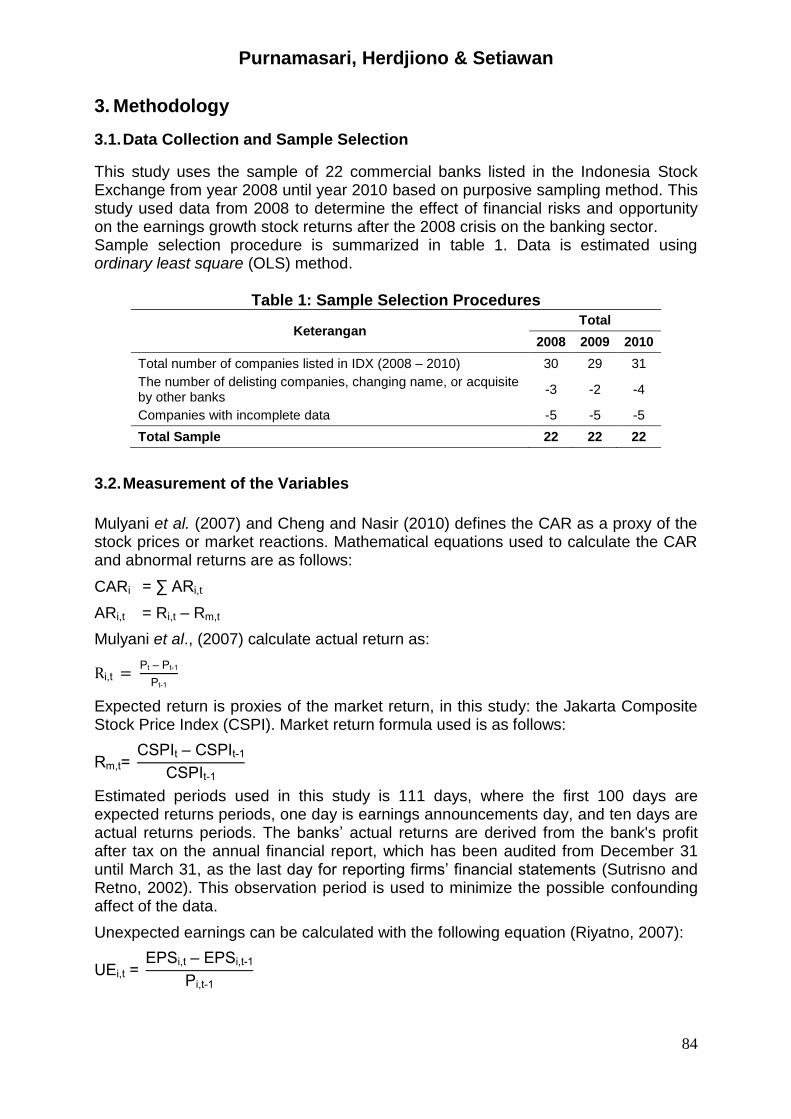
3.1. Data Collection and Sample Selection
This study uses the sample of 22 commercial banks listed in the Indonesia Stock Exchange from year 2008 until year 2010 based on purposive sampling method. This study used data from 2008 to determine the effect of financial risks and opportunity on the earnings growth stock returns after the 2008 crisis on the banking sector. Sample selection procedure is summarized in table 1. Data is estimated using ordinary least square (OLS) method.
Table 1: Sample Selection Procedures
Keterangan Total
2008 2009 2010
Total number of companies listed in IDX (2008 – 2010) 30 29 31
The number of delisting companies, changing name, or acquisite by other banks
-3 -2 -4
Companies with incomplete data -5 -5 -5
Total Sample 22 22 22
3.2. Measurement of the Variables
Mulyani et al. (2007) and Cheng and Nasir (2010) defines the CAR as a proxy of the stock prices or market reactions. Mathematical equations used to calculate the CAR and abnormal returns are as follows:
CARi = ∑ ARi,t
ARi,t = Ri,t – Rm,t
Mulyani et al., (2007) calculate actual return as:
i,t t – t-
t-
Expected return is proxies of the market return, in this study: the Jakarta Composite Stock Price Index (CSPI). Market return formula used is as follows:
Rm,t= It – It
It
Estimated periods used in this study is 111 days, where the first 100 days are expected returns periods, one day is earnings announcements day, and ten days are actual returns periods. The banks’ actual returns are derived from the bank's profit after tax on the annual financial report, which has been audited from December 31 until March 31, as the last day for reporting firms’ financial statements (Sutrisno and Retno, 2002). This observation period is used to minimize the possible confounding affect of the data.
Unexpected earnings can be calculated with the following equation (Riyatno, 2007):
i,t = i,t – i,t
i,t
Purnamasari, Herdjiono & Setiawan
85
Where:
CARi = cumulative abnormal return
ARi,t = abnormal return stock i in period t
Ri,t = actual return stock i in period t
Rm,t = expected return in period t
Pt = stock price in day t
Pt-1 = stock price in day t-1
CSPIt = Composite Stock Price Index in day t
CSPIt-1 = Composite Stock Price Index in day t-1
UEi,t = unexpected earning stock i in period t
EPSi,t = earnings per share stock i in period t
EPSi,t-1 = earnings per share stock i in period t-1
Pi,t-1 = stocks’ closing price in the end of the year
Liquidity risk, credit risk, and solvency risk is calculate by using the same formulation as Cheng and Nasir (2010), while growth opportunity is proxies by market to book value ratio, as used in Jaswadi (2003).
i uidit isk = et oans
otal sset
redit risk = oan oss eserve
ross oans
olvabilit risk = otal liabilities
otal e uit
arket to book value ratio = arket value of e uit
ook value of e uit
3.3. Empirical Models
The hypotheses are tested using five equation models as follows:
Equation used to test the 1st hypothesis : CARi = a1 + a2*UEi + ei
Equation used to test the 2nd hypothesis : CARi = a1 + a2*UEi i + a3LRi + ei
Equation used to test the 3rd hypothesis : CARi = a1 + a2*UEi + a4CRi + ei
Equation used to test the 4th hypothesis : CARi = a1 + a2*UEi + a5SRi + ei
Purnamasari, Herdjiono & Setiawan
86
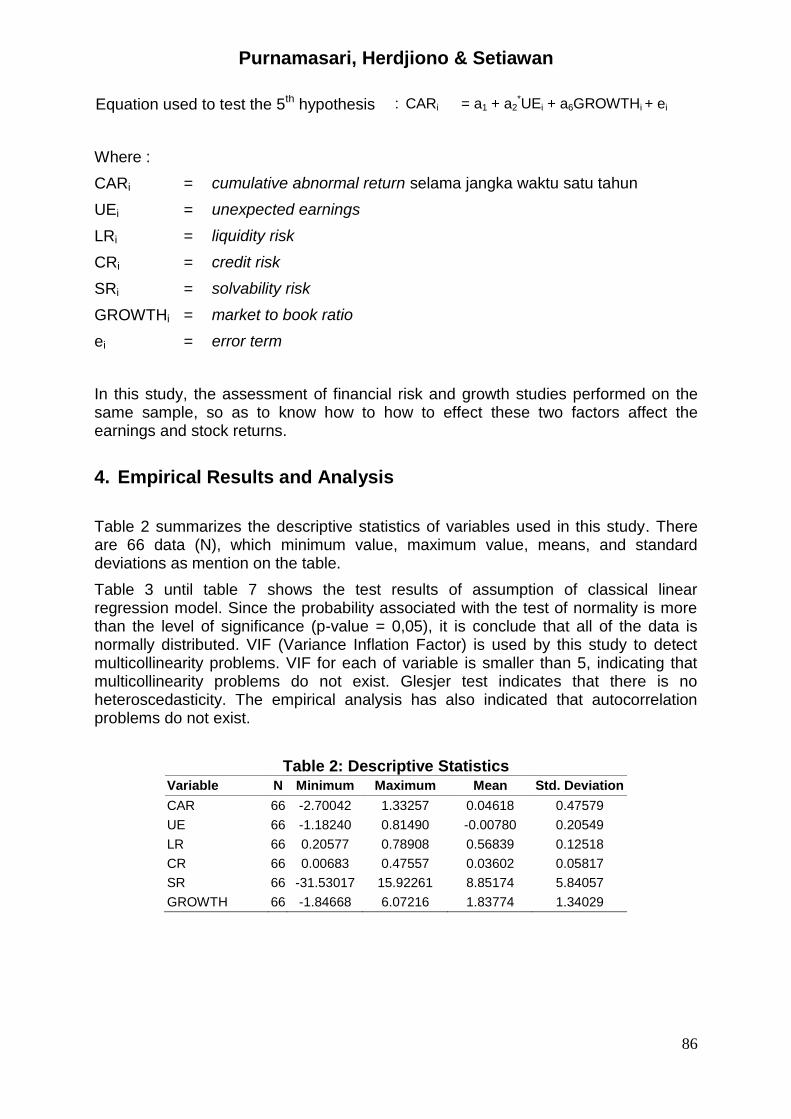
Equation used to test the 5th hypothesis : CARi = a1 + a2*UEi + a6GROWTHi + ei
Where :
CARi = cumulative abnormal return selama jangka waktu satu tahun
UEi = unexpected earnings
LRi = liquidity risk
CRi = credit risk
SRi = solvability risk
GROWTHi = market to book ratio
ei = error term
In this study, the assessment of financial risk and growth studies performed on the same sample, so as to know how to how to effect these two factors affect the earnings and stock returns.
4. Empirical Results and Analysis
Table 2 summarizes the descriptive statistics of variables used in this study. There are 66 data (N), which minimum value, maximum value, means, and standard deviations as mention on the table.
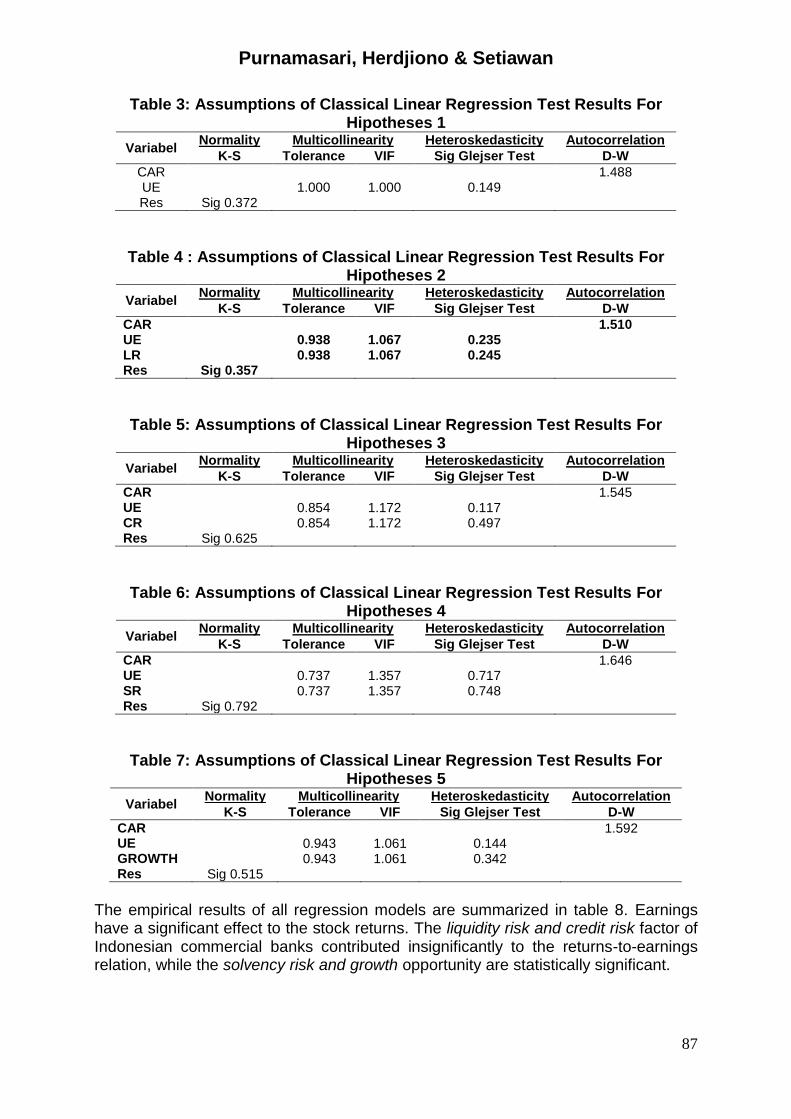
Table 3 until table 7 shows the test results of assumption of classical linear regression model. Since the probability associated with the test of normality is more than the level of significance (p-value = 0,05), it is conclude that all of the data is normally distributed. VIF (Variance Inflation Factor) is used by this study to detect multicollinearity problems. VIF for each of variable is smaller than 5, indicating that multicollinearity problems do not exist. Glesjer test indicates that there is no heteroscedasticity. The empirical analysis has also indicated that autocorrelation problems do not exist.
Table 2: Descriptive Statistics Variable N Minimum Maximum Mean Std. Deviation
CAR 66 -2.70042 1.33257 0.04618 0.47579
UE 66 -1.18240 0.81490 -0.00780 0.20549
LR 66 0.20577 0.78908 0.56839 0.12518
CR 66 0.00683 0.47557 0.03602 0.05817
SR 66 -31.53017 15.92261 8.85174 5.84057
GROWTH 66 -1.84668 6.07216 1.83774 1.34029
Purnamasari, Herdjiono & Setiawan
87
Table 3: Assumptions of Classical Linear Regression Test Results For Hipotheses 1
Variabel Normality Multicollinearity Heteroskedasticity Autocorrelation
K-S Tolerance VIF Sig Glejser Test D-W
CAR 1.488 UE 1.000 1.000 0.149 Res Sig 0.372
Table 4 : Assumptions of Classical Linear Regression Test Results For Hipotheses 2
Variabel Normality Multicollinearity Heteroskedasticity Autocorrelation
K-S Tolerance VIF Sig Glejser Test D-W
CAR
1.510 UE
0.938 1.067 0.235
LR
0.938 1.067 0.245
Res Sig 0.357
Table 5: Assumptions of Classical Linear Regression Test Results For
Hipotheses 3
Variabel Normality Multicollinearity Heteroskedasticity Autocorrelation
K-S Tolerance VIF Sig Glejser Test D-W
CAR
1.545 UE
0.854 1.172 0.117
CR
0.854 1.172 0.497 Res Sig 0.625
Table 6: Assumptions of Classical Linear Regression Test Results For Hipotheses 4
Variabel Normality Multicollinearity Heteroskedasticity Autocorrelation
K-S Tolerance VIF Sig Glejser Test D-W
CAR
1.646 UE
0.737 1.357 0.717
SR
0.737 1.357 0.748 Res Sig 0.792
Table 7: Assumptions of Classical Linear Regression Test Results For Hipotheses 5
Variabel Normality Multicollinearity Heteroskedasticity Autocorrelation
K-S Tolerance VIF Sig Glejser Test D-W
CAR
1.592 UE
0.943 1.061 0.144
GROWTH
0.943 1.061 0.342 Res Sig 0.515
The empirical results of all regression models are summarized in table 8. Earnings have a significant effect to the stock returns. The liquidity risk and credit risk factor of Indonesian commercial banks contributed insignificantly to the returns-to-earnings relation, while the solvency risk and growth opportunity are statistically significant.
Purnamasari, Herdjiono & Setiawan
88
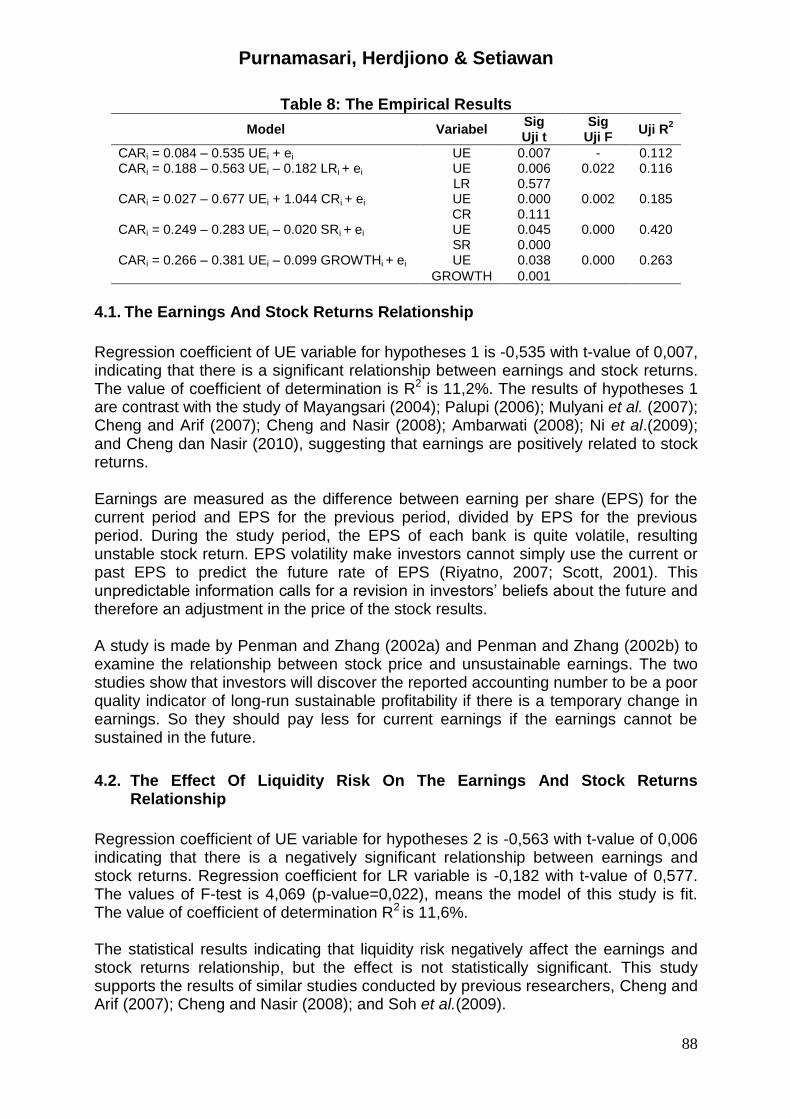
Table 8: The Empirical Results
Model Variabel Sig Uji t
Sig Uji F
Uji R2
CARi = 0.084 – 0.535 UEi + ei UE 0.007 - 0.112 CARi = 0.188 – 0.563 UEi – 0.182 LRi + ei UE 0.006 0.022 0.116
LR 0.577 CARi = 0.027 – 0.677 UEi + 1.044 CRi + ei UE 0.000 0.002 0.185
CR 0.111 CARi = 0.249 – 0.283 UEi – 0.020 SRi + ei UE 0.045 0.000 0.420
SR 0.000 CARi = 0.266 – 0.381 UEi – 0.099 GROWTHi + ei
UE 0.038 0.000 0.263
GROWTH 0.001
4.1. The Earnings And Stock Returns Relationship
Regression coefficient of UE variable for hypotheses 1 is -0,535 with t-value of 0,007, indicating that there is a significant relationship between earnings and stock returns. The value of coefficient of determination is R2 is 11,2%. The results of hypotheses 1 are contrast with the study of Mayangsari (2004); Palupi (2006); Mulyani et al. (2007); Cheng and Arif (2007); Cheng and Nasir (2008); Ambarwati (2008); Ni et al.(2009); and Cheng dan Nasir (2010), suggesting that earnings are positively related to stock returns. Earnings are measured as the difference between earning per share (EPS) for the current period and EPS for the previous period, divided by EPS for the previous period. During the study period, the EPS of each bank is quite volatile, resulting unstable stock return. EPS volatility make investors cannot simply use the current or past EPS to predict the future rate of EPS (Riyatno, 2007; Scott, 2001). This unpredictable information calls for a revision in investors’ beliefs about the future and therefore an adjustment in the price of the stock results. A study is made by Penman and Zhang (2002a) and Penman and Zhang (2002b) to examine the relationship between stock price and unsustainable earnings. The two studies show that investors will discover the reported accounting number to be a poor quality indicator of long-run sustainable profitability if there is a temporary change in earnings. So they should pay less for current earnings if the earnings cannot be sustained in the future.
4.2. The Effect Of Liquidity Risk On The Earnings And Stock Returns Relationship
Regression coefficient of UE variable for hypotheses 2 is -0,563 with t-value of 0,006 indicating that there is a negatively significant relationship between earnings and stock returns. Regression coefficient for LR variable is -0,182 with t-value of 0,577. The values of F-test is 4,069 (p-value=0,022), means the model of this study is fit. The value of coefficient of determination R2 is 11,6%. The statistical results indicating that liquidity risk negatively affect the earnings and stock returns relationship, but the effect is not statistically significant. This study supports the results of similar studies conducted by previous researchers, Cheng and Arif (2007); Cheng and Nasir (2008); and Soh et al.(2009).
Purnamasari, Herdjiono & Setiawan
89
Liquidity is an important factor used to measure the size of available cash and near cash assets to meet the withdrawal demand. Failure to provide adequate liquidity to meet the demands of depositors or creditors can cause a shut down of a bank (Al-Khouri, 2011). Lack of liquidity has the important effects on bank’s wealth, because investors worried about the performance and capabilities of its securities trading (Shams et al., 2011). A negative sign of the liquidity risk coefficient shows that the lower the bank liquidity risk factor the banks have, the lower the ability to fund their financial needs. It also has the mean for banks that having the same unexpected earning and the one with lower liquidity risk, the higher the investor’s valuation of the bank share prices in response to the earnings changes (Cheng and Nasir, 2010; Al-Khouri, 2011). In this study, the liquidity risk factors are not significant and this may due to the investor are not concern about the risk and the 22 commercial banks are very well managed by their managers (Cheng and Nasir, 2010). Investors are more likely to see the profit generated by the banks, than the liquidity risk (Saputra et al., 2002). During 2008 to 2010, the average Indonesian banks can perform quite well. This is seen in the ability of the Indonesian banking in facing internal problems both in the level of debt, make loans to external parties, and the resistance will market pressures. Indonesian Banking Regulation is also getting better, so investors do not make liquidity risk as a consideration to do an investment. 4.3. The Effect Of Credit Risk On The Earnings And Stock Returns
Relationship
Table 8 shows that the regression coefficient of UE and CR for hypotheses 3 are -0,677 (with t-value of 0,577) and 1,044 (with t-value of 1,111), respectively. The value of F-test of this model is 0,002 while the value of coefficient of determination is 18,5%. The coefficient for credit risk is positive and insignificant at α=5% (p-value= 0,05), means that credit risks have no effect on the earnings and stock returns relationship. The results support statements from Cheng and Nasir (2008); Soh et al. (2009); Cheng and Nasir (2010). But the results of this study are contrast with Cheng and Nasir (2009), which discovers that Australian investors priced the credit risk significantly in the earnings response valuation. Credit risk in this study is measured by loan loss reserve (LLR)/ gross loan. The positive sign of the credit risk coefficient shows that the higher the bank credit risk factor means that the banks have a higher provision for default (Cheng and Nasir, 2008). The study conduct by Gibson (2000) also finds that loan loss reserve is sensitive to pre-provision of bank income. Mean of credit risk variable, as shown in table 1, is 0,036 with standard deviation of 0,058. This number is indicate that in the study periods, most of Indonesian commercial banks have a low credit risk. Lower credit risk means lower non performing loans, lower investor risk, and lower investor attention about the risk. Given that the stock market tends to be penetrated by young investors who tend to

Purnamasari, Herdjiono & Setiawan
90
look for high risk high return investments. Therefore, investors are paying less attention to credit risk from banks in Indonesia. Based on the condition, it can be said that credit risk have no effect on the earnings and stock return relationship. The results of this study support Steiger (2010), which states that as soon as a company’s financial situation improves, the credit risk is no longer an important determinant of stock returns. Credit risk is only important for a shareholder when a company is in imminent danger of bankruptcy, in which case a shareholder usually loses his whole investment. 4.4. The Effect Of Solvency Risk On The Earnings And Stock Returns
Relationship
As mention on the table 8, regression coefficient of UE variable is -0,283 and SR variable is -0,020. The t-value for both variables is 0,045 and 0,000, respectively while the p-value is 0,000. Those empirical results indicating that there is a significant relationship between earnings and stock returns, and solvency risk have an effect on that relationship.
The results of this study are contrast with Cheng and Arif (2007); Cheng and Nasir (2008); Soh et al. (2009); and Cheng and Nasir (2010). The previous studies stated that solvency risk factor does not effect the returns-to-earnings relation. But this study find that solvency risk have a negatively significant influence on that earnings to returns relation.
Solvency risk refers to the capital cushion of a bank has to offer to protect its depositors and borrowers from decline in assets value (Cheng and Nasir, 2010). This risk is measured with debt to equity ratio. Generally speaking, the higher a bank's solvency risk, the greater the probability that the bank will default on its debt obligations.
In the study periods, Indonesian commercial banks have a very high debt to equity ratio. The average solvency risk for commercial banks in Indonesia is reached 1015% in year 2008, 762% in 2009, and 878% in 2010. This condition makes investors worried about the ability of banks to meet all its obligations (Cheng and Nasir, 2010).
In addition, a high level of debt also means high interest expense to pay, and makes the proportion of income is flowing more to creditors than to shareholders (Ambarwati, 2008). Investors will accept lower profits so that they have lower interest to invest, which will make a declining in stock price. The results of this study is linear with Dhaliwal and Reynolds (1994), who present evidence that firms with higher debt-equity ratios have lower returns-to-earnings relation.
4.5. The Effect Of Growth Opportunity On The Earnings And Stock Returns
Relationship
The results of t-test and regression coefficient for UE and GR variable are -0,381 (t-value = 0,038) and -0,099 (t-value = 0,001). The value of F test for this last hypotheses is 0,000 and coefficient of determination, R2, is 26,3%.
Purnamasari, Herdjiono & Setiawan
91
The results indicate that earnings are negatively related to the stock price. Furthermore, the results of this test show that growth opportunity is also negatively related to earning and stock return relationship. It is means that investor will consider the bank’s growth opportunity in addition to its earnings, to make an investment judgment. These results do not support Mayangsari (2004); Mulyani et al. (2007), and Ambarwati (2008) that find a positive relation between stock return to the announcement of earnings and various proxies of growth opportunities. Growth opportunities are measured with market to book value ratio. Gombola et al. (1998) and Smith and Watt (1992) state that high growth opportunities are associated with high level of information asymmetry, that is growth firms experience poorer post-issue long-term price performance. Therefore, investors will suggests greater overpricing for growth firms than low growth firms. Management will take advantage of the moment by issuing new shares. This will lead to more negative market reaction.
5. Conclusion
This study is aimed to give empirical findings whether credit risk, liquidity risk, solvency risk and growth opportunity have a significant influence on returns to earnings relation. The sample of this study is 22 commercial banks listed in the Indonesian Stock Exchange during 2008-2010. The findings in this paper suggest that earnings are negatively related to stock return. The negative sign is caused by EPS volatility that make investors react negatively to the bank’s earning. The solvency risk and growth opportunity factor of banks contributed significantly to the earnings to returns relation, which suggests that this is an important factor that enters the investors’ revaluation of bank share prices. Two other bank risk factors, liquidity risk and credit risk, are not significant. This study has several limitations. This study only measure three financial risk and growth opportunity of banks, while the other factors is ignored. Based on the result of this study, the future research can use this study as a reference for applying another method of earnings to returns research. For example, future research can use external factors, such as market risk and interest risk, and internal factor, such as earning persistence and capital structure, to get more accurate results. The data used is for year 2008, which can be bias because of global crisis effect, so the future study can used another year data. The future study also can make a comparison about the effect of financial risk and growth opportunity before, in, and after the global crisis.
References Akhtar, MF, Ali, K, and Sadaqat, S 2011, ‘Liquidity Risk Management: A Comparative
Study Between Conventional And Islamic Banks Of Pakistan’, Interdisciplinary Journal of Research in Business, Vol.1 (1), pp. 35-44.
Al-Khouri, R 2011, ‘Assessing Risk and Performance of the GCG Banking Sector’. International Research Journal of Finance and Economics, vol.65, pp. 72-81.
Ambarwati, S 2008, ‘ arnings Response oefficient’, Akuntabilitas, vol. 7 (2), pp. 128-134.
Purnamasari, Herdjiono & Setiawan
92
Ball, R and Brown, P 1968, ‘An mpirical valuation of Acoounting Incone Numbers’, Journal of Accounting Research (Autum), pp. 159-178.
Beaver 1968, ‘The Information ontent of Annual arnings Announcements’, Journal of Accounting Research, pp. 49-67.
Cheng, Ariff and Shamser 2001, ‘Accounting arnings and hare Revaluation: Further xploration’, Capital Market Review. Vol.9, pp. 21-48.
Cheng and Ariff 2007, ‘Abnormal Returns of Bank tock and Their Factor-Analyzed Determinants’, Journal of Accounting-Business and Management, Vol 14, pp 1-15.
Cheng and Nassir 2008, ‘The ffect of Financial Risks on the arnings Response in Australia Bank tocks’, Journal of Money, Investment and Banking Issue, ISSN 1450-288X issue 6 , pp. 17-26.
Cheng and Nasir 2010, ‘ arning Response oefficients And The Financial Risks Of hina ommercial Banks’, International Review of Business Research Papers, vol. 6, no. 3, pp. 178-188. Retrieved: August 2010.
Collins, DW, and Kothari, SP 1989, ‘An Analysis of the Intertemporal and ross-sectional Determinants of arnings Response oefficient’, Journal of Accounting and Economics, vol. 11 (2), pp. 143-182.
Dhaliwal, D and Reynolds 1994, ‘The ffect Of The Default Risk Of Debt On The arning Response oefficient’, The Accounting Review, vol. 69 (2), pp. 412-419.
Fama, EF 1965, ‘Random Walks in tock Market rices’, Financial Analysts Journal, vol. 21 (5), pp. 55-59.
Fama, EF 1970, ‘ fficient apital Markets : A Review of Theory and mpirical Work’, Journal of finance, vol. 25, pp. 383-417.
FASB 1985, Account Standards, Original Pronouncement, As of Juni, New York, McGraw Hill.
Gibson, S 2000, ‘On the Information ontent of Bank Loan-Loss Disclosures: A Theory and vidence from Japan’, International Review of Finance, vol.1(1), pp.53-80.
Gombola, Hei Wai Lee, and Feng Ying Liu 1998, ‘Further vidence on Insider elling Prior to Seasoned Equity Offering Announcements: The Role of Growth Opportunities’, Annual Conference of Easter Finance Association
Hadad, MD, Santoso, W, Santoso, B, Besar, D, and Rulina, I 2007, ‘Rating Migration Matrices: Empirical Evidence In Indonesia’, IFC Bulletin, No 31, pp. 260-276.
Jaswadi 2003, ‘Dampak arnings Reporting Lags Terhadap Koefisien Respon Laba, Makalah SNA VI, pp. 487-506
Jogiyanto 2000, Teori Portofolio dan Analisis Investasi, Yogyakarta, Edisi 2 BPFE. Lev, B, and Zarowin, P 1999, ‘The Boundaries of Financial Reporting and How to
Extend Them’, Journal of Accounting Research, vol. 37 (2), pp. 353-385. Mayangsari, S 2004, ‘Bukti mpiris engaruh pesialisai Industri Auditor Terhadap
arning Response oefficient’, Jurnal Riset Akuntansi Indonesia, vol. 7, no. 2, pp. 154 - 178.
Moradi, M, Salehi, M, and Erfanian, Z 2010, ‘A Study Of The Effect Of Financial Leverage On Earnings Response Coefficient Through Out Income Approach: Iranian Evidence’, International Review Of Accounting, Banking and Finance, Vol 2 (2), pp. 104-116.
Mulyani, Asyik, and Andayani 2007, ‘Faktor - Faktor Yang Mempengaruhi Earnings Response oefficient ada erusahaan Yang Terdaftar Di Bursa fek Jakarta’, JAAI Volume, vol. 11, no. 1, pp. 35-45.
Purnamasari, Herdjiono & Setiawan
93
Palupi, MJ 2006, ‘Analisis Faktor-Faktor Yang Mempengaruhi Koefisien Respon Laba : Bukti Empiris ada Bursa fek Jakarta’, Jurnal Ekubank, vol. 3, pp. 9-25.
Panman, SH, and Zhang, XJ 2002a, ‘Accounting onvervatism, The Quality of arnings, and tock Return’, The Accounting Review, vol. 77, no. 2, pp. 237-264.
Panman, SH, and Zhang, XJ 2002b, ‘Modeling Sustainable Earnings and P/E Ratios with Financial Statement Analysis’, University of California Working Paper June 2002 (available from www.ssrn.com).
Quinn, P 2008, ‘Kebebasan Berserikat dan erundingan Bersama’, ILO Working Paper, pp. 1-96.
Riyatno 2007, ‘ engaruh kuran Kantor Akuntan ublik Terhadap arnings Response oefficients’, Jurnal Keuangan dan Bisnis, pp. 148-162.
Saputra, K, Elly, and Leng, P 2002, ‘Pengaruh Risiko Sistematis dan Likuiditas Terhadap Tingkat Pengembalian Saham Badan-Badan Usaha yang Go-Public di Bursa Efek Jakarta pada Tahun 1999’, Jurnal Manajemen & Kewirausahaan , vol 4(1), pp. 15 - 25.
Scott, W 2001, Financial of Accounting Theory, Third edition, New Jersey, Prentice-Hall International, Inc.
Shams, MF, Zamanian, G, Kahreh, ZS, and Kahreh, MS 2011, ‘The Relationship between Liquidity Risk and Stock Price: An Empirical Investigation of the Tehran Stock Exchange’, European Journal of Economics, Finance and Administrative Sciences, vol 30, pp. 7-20.
Smith C and Watts R 1992, ‘The Investment Opportunities et and orporate Financing, Dividend, and ompensation olicies’, Journal of Financial Economics, vol. 32, pp.263-292.
Soh, WN, Cheng, and Nasir 2009, ‘The ffect of Financial Risk on the arnings Response in Thailand Bank tock’, International Research Journal of Finance and Economics’, issue 31 , pp. 55-65.
Steiger, F 2010, ‘The Impact of Credit Risk and Implied Volatility on Stock Returns’, Working Paper
Suaryana, A 2005, ‘Pengaruh Konservatisme Laba Terhadap Koefisien Respon Laba’, Jurusan Akuntansi Fakultas Ekonomi Universitas Udayana, pp. 1-20.
Subramanyam, Halsey, and Wild 2007, Financial Statement Analysis 10th edition, Boston, McGraw Hill.
Sutrisno, B and Retno 2002, ‘Informasi Laba erusahaan Hubungannya Dengan Dinamika Perubahan Harga Saham Pada Perusahaan Manufaktur Di Bursa fek Jakarta Tahun 200 ’, eprints.ums.ac.id/67/1/budi-s__JPIPS.doc