financial sectfinancial sector reforms in nepal- what works what does notor reforms in nepal- what...
DESCRIPTION
Financial sector reforms in Nepal- What works what does notTRANSCRIPT

ASIAN DEVELOPMENT BANK
AsiAn Development BAnk6 ADB Avenue, Mandaluyong City1550 Metro Manila, Philippineswww.adb.org
Finance Sector Reform in Nepal—What Works, What Doesn’t
This paper analyzes the outcomes and impact of the financial sector reform programs in Nepal. Since its first reform in 1985, Nepal’s financial sector grew rapidly with expanded credit. The reforms’ developing financial regulatory framework, improving the central bank’s autonomy, and establishing key sector infrastructure contributed to this growth. However, restructuring the three state-owned banks was not fully successful due to the country’s complex political situations. Continuing efforts to restructure the state-owned banks, enhance the central bank’s independence, and maintain sound financial sector policies are crucial to the financial sector’s further growth and the economy’s sustainable development.
About the Asian Development Bank
ADB’s vision is an Asia and Pacific region free of poverty. Its mission is to help its developing member countries reduce poverty and improve the quality of life of their people. Despite the region’s many successes, it remains home to approximately two-thirds of the world’s poor: 1.6 billion people who live on less than $2 a day, with 733 million struggling on less than $1.25 a day. ADB is committed to reducing poverty through inclusive economic growth, environmentally sustainable growth, and regional integration.
Based in Manila, ADB is owned by 67 members, including 48 from the region. Its main instruments for helping its developing member countries are policy dialogue, loans, equity investments, guarantees, grants, and technical assistance.
FiNANce SectoR ReFoRm iN NepAl— WhAt WoRkS, WhAt DoeSN’tMayumi Ozaki
adb SOUTH aSia wOrking paper SerieS
No. 28
July 2014

ADB South Asia Working Paper Series
Finance Sector Reform in Nepal— What Works, What Doesn’t
Mayumi Ozaki
No. 28 July 2014
Mayumi Ozaki is financial sector specialist (rural and microfinance), Public Management, Financial Sector, & Trade Division, South Asia Department of the Asian Development Bank
ASIAN DEVELOPMENT BANK

Asian Development Bank 6 ADB Avenue, Mandaluyong City 1550 Metro Manila, Philippines www.adb.org © 2014 by Asian Development Bank July 2014 ISSN 2313-5867 (Print), 2313-5875 (e-ISSN) Publication Stock No. WPS146819-2 The views expressed in this publication are those of the author and do not necessarily reflect the views and policies of the Asian Development Bank (ADB) or its Board of Governors or the governments they represent. ADB does not guarantee the accuracy of the data included in this publication and accepts no responsibility for any consequence of their use. By making any designation of or reference to a particular territory or geographic area, or by using the term “country” in this document, ADB does not intend to make any judgments as to the legal or other status of any territory or area. ADB encourages printing or copying information exclusively for personal and noncommercial use with proper acknowledgment of ADB. Users are restricted from reselling, redistributing, or creating derivative works for commercial purposes without the express, written consent of ADB. Unless otherwise noted, “$” refers to US dollars. Printed on recycled paper

CONTENTS
TABLES AND FIGURES .............................................................................................................................................. iv
ABSTRACT ...................................................................................................................... .................................................. v
ABBREVIATIONS ................................................................................................................. ......................................... vi
I. INTRODUCTION .................................................................................................................................................. 1
II. FINANCE SECTOR HISTORY .......................................................................................................................... 1
A. First Phase (1930–1985) .............................................................................................................................. 1
B. First Finance Sector Reform (1985) ....................................................................................................... 2
C. Second Phase (1985–2000) ...................................................................................................................... 3
D. Second Finance Sector Reform (2000) ............................................................................................... 6
III. SECOND FINANCE SECTOR REFORM (2002) ..................................................................................... 11
A. Legal Reform and Central Bank Strengthening ................................................................................ 11
B. Bank Restructuring and Privatization.................................................................................................. 12
IV. FINANCE SECTOR REFORM—WHAT WORKS, WHAT DOESN’T ........................................... 20
A. Political Environment during Reform ................................................................................................. 20
B. Finance Sector Performance since 2002 ........................................................................................... 21
C. Lessons from the Reform ........................................................................................................................ 23
V. CONCLUSION AND RECOMMENDATIONS ..................................................................................... 26
REFERENCES ........................................................................................................................................................ 28
APPENDIXES
1. Rastriya Banijya Bank Financial Highlights, 2001–2013 ................................................................ 29
2. Nepal Bank Limited Financial Highlights, 2003–2013 .................................................................. 30
3. Summary of Agricultural Development Bank Limited Restructuring Program,
Completed as of July 2013 ........................................................................................................................ 31
4. Agricultural Development Bank Limited Financial Highlights, 2001–2012 ............................ 32

TABLES AND FIGURES
TABLES
1. Chronology in Nepal Finance Sector Liberalization, 1984–1998 ........................................................... 4
2. Financial Institution Growth, 1985–2000 ...................................................................................................... 5
3. Key Reform Programs by Organization ........................................................................................................ 10
4. Nepal Rastra Bank Reengineering Components ....................................................................................... 11
5. Chronology of Political Events and Finance Sector Reform Programs ............................................ 20
6. Growth of Financial Institutions, 2000–2013 ............................................................................................. 21
7. Banking Sector Aggregate Indicators ............................................................................................................ 21
8. Selected Banking Sector Aggregate and Three State-owned Banks’ Indicators .......................... 22
FIGURES
1. Financial Deepening Indicators, 1985–2000 ................................................................................................ 5
2. Per Capita Deposit and Credit, 1985–2000 .................................................................................................. 6
3. Rastriya Banijya Bank Total Assets, Loans Outstanding, Deposits, and Equity,
2001–2013 ............................................................................................................................................................... 14
4. Rastriya Banijya Bank Capital Adequacy Ratio, Nonperforming Loan Ratio, and Return on Assets, 2001–2013 ................................................................................................................... 14
5. Nepal Bank Limited Total Assets, Loans Outstanding, Deposits, and Equity, 2001–2013 ................................................................................................................................................................15
6. Nepal Bank Limited Capital Adequacy Ratio, Nonperforming Loan Ratio, and
Return on Assets, 2001–2013 ............................................................................................................................15
7. Agricultural Development Bank Limited Total Assets, Loans Outstanding, Deposits,
and Equity, 2003–2013 ....................................................................................................................................... 18
8. Agricultural Development Bank Limited Capital Adequacy Ratio, Nonperforming
Loan Ratio, and Return on Assets, 2003–2013 .......................................................................................... 19
9. Growth in Financial Deepening Indicators ................................................................................................. 22

ABSTRACT Nepal is a small landlocked country with a per capita gross national income of $700 in 2012. Despite the small size of its economy, Nepal has a relatively diversified finance sector. Before reaching its current state, the finance sector went through two major reform programs. The first reform program began in 1985 when the country faced an economic crisis, which prompted the government to initiate a structural adjustment program with the International Monetary Fund. The second reform program was initiated in 2002 and was trigged by a political crisis—in particular the Maoist insurgencies in the late 1990s—which compelled the Government of Nepal to embark on broader economic reforms. International development agencies played a role in these reforms. Overall, the reform programs contributed to the finance sector’s growth and improved governance. The government decided to restructure and privatize the three major state-owned banks: Agricultural Development Bank Limited, Nepal Bank Limited, and Rastriya Banijya Bank. However, privatization of these state-owned banks has yet to be completed. Nepal Rastra Bank’s supervisory capacity has generally improved, but its independence and enforcing authority is still weak. The report identifies key success factors and constraints in Nepal’s finance sector reforms. It finds continuous donor engagement and dialogues, strengthening of the central bank’s independence, and maintenance of sound finance sector policies to be key for successful reform outcomes.
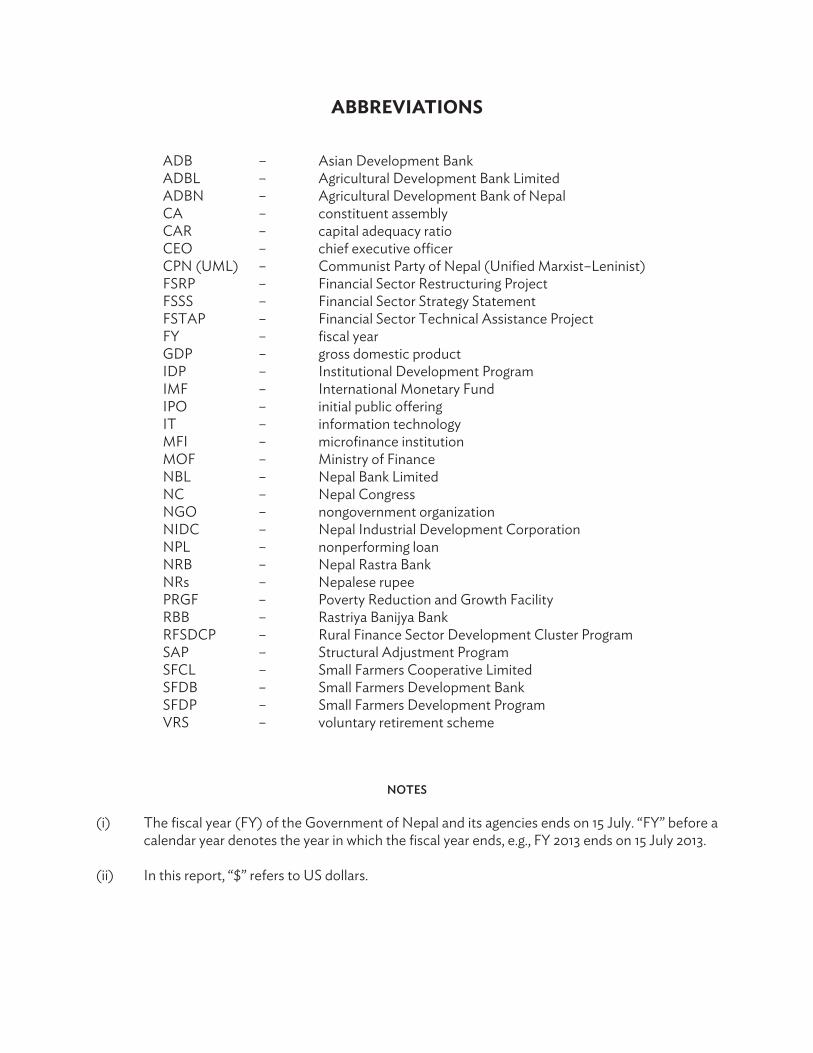
ABBREVIATIONS
ADB – Asian Development Bank ADBL – Agricultural Development Bank Limited ADBN – Agricultural Development Bank of Nepal CA – constituent assembly CAR – capital adequacy ratio CEO – chief executive officer CPN (UML) – Communist Party of Nepal (Unified Marxist–Leninist) FSRP – Financial Sector Restructuring Project FSSS – Financial Sector Strategy Statement FSTAP – Financial Sector Technical Assistance Project FY – fiscal year GDP – gross domestic product IDP – Institutional Development Program IMF – International Monetary Fund IPO – initial public offering IT – information technology MFI – microfinance institution MOF – Ministry of Finance NBL – Nepal Bank Limited NC – Nepal Congress NGO – nongovernment organization NIDC – Nepal Industrial Development Corporation NPL – nonperforming loan NRB – Nepal Rastra Bank NRs – Nepalese rupee PRGF – Poverty Reduction and Growth Facility RBB – Rastriya Banijya Bank RFSDCP – Rural Finance Sector Development Cluster Program SAP – Structural Adjustment Program SFCL – Small Farmers Cooperative Limited SFDB – Small Farmers Development Bank SFDP – Small Farmers Development Program VRS – voluntary retirement scheme
NOTES (i) The fiscal year (FY) of the Government of Nepal and its agencies ends on 15 July. “FY” before a
calendar year denotes the year in which the fiscal year ends, e.g., FY 2013 ends on 15 July 2013. (ii) In this report, “$” refers to US dollars.

1. INTRODUCTION 1. Nepal is a low-income country with a per capita gross national income of $700 in 2012. Despite the small size of its economy, Nepal has a relatively diversified finance sector. 2. In 2013, the sector comprised of 31 commercial banks, 86 development banks, 59 finance companies, and 31 microfinance development banks. In addition, 15 savings and credit cooperatives and 31 microfinance nongovernment organizations (NGOs) are licensed by the central bank. The insurance sector has one public insurer and 24 private insurers. The capital market has the Nepal Stock Exchange, the country’s only stock exchange market. 3. The sector started in 1937 when Nepal Bank Limited (NBL), the country’s first bank, was opened. Since then, the sector grew rapidly. Before it reached its current size, the sector went through two major reforms. The first reform came in 1985 when the country faced an economic crisis, which was trigged by unprecedented budget and current account deficits. 4. The second program was initiated in 2002. The reform was trigged by a political crisis, in particular the Maoist insurgencies in the late 1990s, which compelled the Government of Nepal to embark on broader economic reforms. 5. The two finance sector reform programs had both successful and unsuccessful outcomes. Both reform programs had focused on strengthening the Nepal Rastra Bank (NRB) and the central bank, and restructuring and privatizing the state-owned banks. Overall, the reform programs contributed to the sector’s growth and improved governance, but the programs failed to fundamentally transform the distressed state-owned banks. 6. This paper identifies key factors in the success and failure of the two reform programs—especially the restructuring of state-owned banks—and derives lessons for ongoing programs. The reform programs’ main focus was strengthening NRB and restructuring and privatizing the three banks—Agricultural Development Bank Limited (ADBL), NBL,1 and Rastriya Banijya Bank (RBB). Accordingly, this report mainly discusses the strengthening of NRB and the three banks’ restructuring programs and their outcomes. II. FINANCE SECTOR HISTORY A. First Phase (1930–1985) 7. The finance sector regulation and supervision started in 1956 when the government established NRB under Nepal Rastra Bank Act, 1955. At the initial phase, NRB’s main function was credit control through directed credit programs and interest rate controls, among others. 8. From the late 1950s to 1960s, the government expanded the finance sector by opening new banks and financial institutions. The government opened the Nepal Industrial Development
1 NBL was established as a fully government-owned bank but was privatized in 1997. Currently, the government’s stake in
NBL is 40.49%. In 2012, NRB, the central bank, took over management control of NBL according to Section 86C (Action Against the Problematic Commercial Bank or Financial Institution) of the NRB Act, 2002. Due to its history and current management arrangement, NBL is referred to as a public bank or state-owned bank in this document.

2 ADB South Asia Working Paper Series No. 28
Corporation (NIDC) in 1959, RBB in 1966, and the Agricultural Development Bank of Nepal (ADBN) in 1968.2 RBB was established to provide banking access to the general public. ADBN was established under the Agricultural Development Bank Act, 1967 to provide credit for agricultural development, small-scale irrigation projects, and agriculture-based cottage and small industries. 9. Until the mid-1980s, there were only four banks3 and a few insurance companies, all owned by the government. The government was substantially involved in the banks’ management and operations. It imposed interest rate controls, selective credit policies, and control on entry and exit of financial institutions. Due to the lack of competition and government control, Nepal’s financial system was highly repressed.
B. First Finance Sector Reform (1985) Structural Adjustment Program 10. Prior to 1985, economic policies were centered on state-led protectionist strategies. The government controlled the exchange rate and restricted the quantity of foreign exchange, which greatly constrained export growth. Other government controls such as import licensing, high import tariffs, overvaluation of the domestic currency, and direct price control negatively affected industrial growth. Due to these government controls, by the mid-1980s the government faced unprecedented budgetary deficit in parallel with current account deficit. 11. The structural rigidity, slow economic growth, and state-led policy distortions had gradually deepened the fiscal and economic crisis since the late 1970s. From 1980 to 1983, the government expenditure rose from 14.9% to 20.7% of the gross domestic product (GDP), while the revenue growth during the same period was marginal, from 8.1% to 8.4%. This naturally resulted in deficit financing. From 1984 to 1985, the total outstanding public debt amounted to 40.5% of the GDP. The high public debt led to insufficient commercial credit availability and limited private sector growth. The fiscal problems contributed to high inflation and a worsening current account balance. 12. The deepening economic crisis compelled the government to seek help from international donors. In 1985, the government entered into its first stand-by credit agreements with the International Monetary Fund (IMF)and initiated reforms under the Economic Stabilization Program. In the same year, the government signed an agreement with the World Bank for the Structural Adjustment Program (SAP). The key focus of SAP was market-oriented reforms to reduce government interventions in the economy. SAP had two phases: SAP I (1986–1989) and SAP II (1989–1992). The finance sector reform was implemented under SAP II. 13. Before SAP, the finance sector was dominated by two banks—RBB and NBL— accounting for more than 70% of total assets in the finance sector. But the banks, being state-owned, had serious portfolio problems due to the government’s interventions. Weak supervision of NRB was an added problem.
2 ADBN changed its name to ADBL in July 2005 when it was incorporated under the Company Act of 1991 as part of the
restructuring program. In this document, sometimes the name of ADBL is used when referring to ADBL even for its pre-2005 status.
3 ADBN, NIDC, NBL, and RBB.

Finance Sector Reform in Nepal—What Works, What Doesn’t 3
14. Accordingly, the objectives of SAP’s finance sector reform were to correct serious portfolio problems of RBB and NBL and strengthen their financial and operational performances. The reform also aimed to strengthen NRB’s capacity to improve the finance sector’s legal and regulatory environment. 15. SAP II was closed in July 1992. Most of the finance sector reform conditions were implemented, though with some delays. The reform developed and improved key finance sector legislations and infrastructure. Technical assistance was provided to NRB to improve bank supervision and inspection functions. The fourth amendment of the Commercial Bank Act and eighth amendment of the NRB Act were both gazetted in October 1989, while the amendment of the NIDC Act was enacted in January 1990. A Credit Information Bureau was established in 1989, and 100 large defaulters were blacklisted and denied further access to credit. 16. The first reform was not fully successful in reforming RBB and NBL, SAP’s primary objective. In 1990, the government adopted the Commercial Bank Problem Analysis and Strategy Study’s recommended restructuring actions for RBB and NBL, including recapitalization. 17. But without changes in the ownership and management, the reform did not improve the culture, management, operational standards, and portfolio quality at RBB and NBL. Even after the reform, they continued to be poorly managed. At the time of the reform, the government was not certain about the future roles of the two banks—whether they would continue to take social and development mandates, or a more commercial orientation and status; and whether they would continue to be state-owned or become privatized. This lack of clear agreement with the government about the future status of RBB and NBL contributed to the unsatisfactory outcomes of their restructuring. C. Second Phase (1985–2000) 18. Despite the ambiguous impacts of the restructuring of RBB and NBL, the first finance sector reform marked the important beginning of the liberalization of Nepal’s finance sector. SAP helped the government adopt more liberalized policies to the economy in general, and the finance sector in particular. From the late 1980s to 1990s, the government implemented various liberalization measures and increased the private sector’s role in the finance sector (Table 1).

4 ADB South Asia Working Paper Series No. 28
Table 1: Chronology in Nepal Finance Sector Liberalization, 1984–1998
Year Reform Actions1984 Amendment of the Commercial Bank Act, 1974
Removal of entry barriers for private commercial banks Opening of joint venture banks Interest rate deregulation Approval for ADBL to carry out commercial lending activities
1985 Enactment of the Finance Companies Act1988 Reform in the treasury bill issuance process
NRB’s introduction of prudential norms 1989 Establishment of the Credit Information Bureau
Removal of price and volume control of commercial bank loans 1991 Establishment of Citizen Investment Trust1992 Amendment of the Security Exchange Act
Separation of operation and regulation in the capital market Establishment of the Security Exchange Board
1993 Abolishment of the statutory liquidity ratioEstablishment of five regional rural development banks
1996 Enactment of the Development Bank Act 1998 Enactment of the Financial Intermediary Act
ADBL = Agricultural Development Bank Limited, NRB = Nepal Rastra Bank. Source: Asian Development Bank estimates.
19. The most notable liberalization measure was removing the entry barriers for private and foreign banks and financial institutions. In 1984, the government amended the Commercial Bank Act to open the sector for foreign ownership through joint venture banks. Following this amendment, NRB gave licenses to three joint venture banks during 1984–1987. 20. Prior to the reform, NRB set interest rates for all banks and financial institutions. In 1984, NRB started interest rate deregulation. Initially, commercial banks were given partial relaxation to fix loan interest rates from 1.0% to 1.5% above the deposit rates. In 1986, this range was eliminated, allowing banks to offer higher interest rates to any level above the fixed minimum level. In 1989, the interest rate was completely deregulated. In 1988, NRB further introduced a set of prudential norms, including capital adequacy requirement, loan classification, loan loss provisioning, interest income recognition, single borrower limit, and account disclosure norm. 21. The liberalization measures induced private sector entry and rapid sector expansion. The number of commercial banks grew from 3 in 1985 to 14 in 2000. Additional banks were all private banks (Table 2). From 1994 to 2000, the total banking credit increased from NRs23 billion to NRs96 billion, which is equivalent to 53% credit growth per annum. Access to banking services also improved from 42,000 populations to 36,000 populations per branch during the same period.

Finance Sector Reform in Nepal—What Works, What Doesn’t 5
Table 2: Financial Institution Growth, 1985–2000 Category of Financial Institutions 1985 1990 1995 2000 Commercial banks (state-owned) 3 3 3 2 Commercial banks (private, locally owned) – – 2 5 Commercial banks (private, joint venture) – 3 6 7 Development banks 2 2 3 7 Finance companies – – 21 45 Microcredit development banks – – 4 7 Savings and credit cooperatives – – 6 19 NGOs (financial intermediaries) – – – 7 Total 5 8 45 99
– = none. NGO = nongovernment organization. Source: Nepal Rastra Bank.Banking and Financial Statistics, No. 58. Mid-July 2012 22. Not only the number of institutions but M24 to GDP and credit to GDP standard indicators to measure financial deepening—also showed growth trends from the mid-1990s (Figure 1). M2 to GDP grew from 28% in 1985 to 51% in 2000. Credit to GDP also grew from 12% to 31% during the same period.
Figure 1: Financial Deepening Indicators, 1985–2000
(%)
Source: Nepal Rastra Bank. 2003. Quarterly Economic Bulletin. Mid-July 2003.
23. Similarly, the overall per capita deposit and credit amount in Nepalese rupees grew substantially between1985 and 2000 (Figure 2). Per capita credit grew from NRs311 in 1985 to NRs5,067 in 2000. Per capita deposit also grew from NRs513 to NRs6,766 during the same period. These indicators suggest that the financial liberalization measures from the mid-1980s clearly contributed to the expansion and deepening of the finance sector. 4 A measure of money supply that includes cash and checking deposits (M1) as well as near money, which includes savings
deposits, money market mutual funds and other time deposits.

6 ADB South Asia Working Paper Series No. 28
Figure 2: Per Capita Deposit and Credit, 1985–2000 (NRs)
Source: Nepal Rastra Bank. 2003.Quarterly Economic Bulletin. Mid-July 2003. 24. The first finance sector reform mainly focused on legislative reforms and additional sector infrastructure. Institutional reforms, particularly the restructuring of state-owned banks, were largely untouched. The weak performance of the state-owned banks continued to be an issue throughout the 2000s.
D. Second Finance Sector Reform (2000) i Political Background 25. Since the late 1970s, Nepal experienced major democracy movements. On 9 November 1990, the King abrogated the constitution of 1962 and promulgated the new constitution. The 1990 constitution legalized political parties and ended almost 30 years of absolute monarchy in politics. But the political system, particularly public administration, was unprepared for this change. Public administration, especially for implementing development projects, remained to be slow. 26. Weak public administration and slow economic growth was further disrupted by Nepal’s Maoist insurgency. In 1996, the Maoists launched an armed rebellion, seeking to establish a communist government. The Maoist movement, which started in the mid-western region as a small revolutionary group, quickly gained momentum. By 2001, the movement was present in all of Nepal’s 75 districts and the tense struggle between the government and Maoists escalated. The Maoists attacked district government offices and local infrastructure, severely disrupting businesses and public services.
Finance Sector Reform in Nepal—What Works, What Doesn’t 7
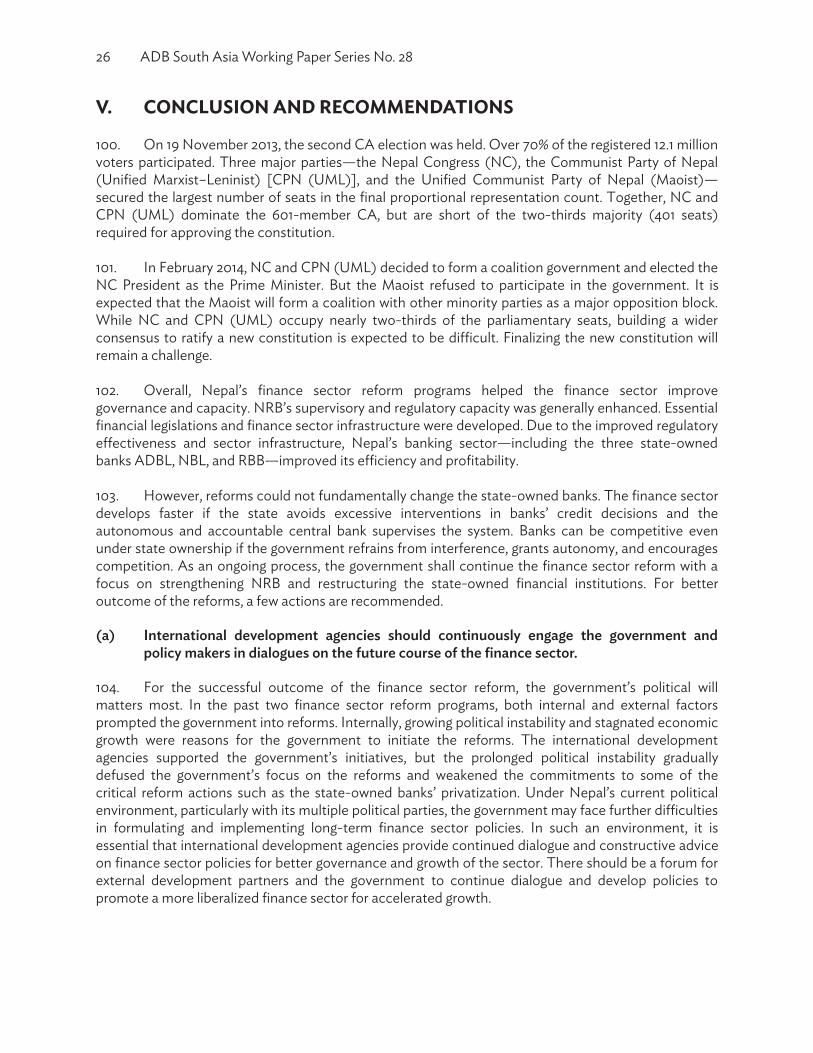
27. From the late 1990s, the ruling government was under intense pressure to find a peaceful way out with the Maoists on one hand, and initiate political and economic reforms to sustain growth and maintain public confidence in the government on the other. However, the government lacked sufficient skills and resources to implement reforms on its own. ii. Financial Sector Assessment and Financial Sector Strategy Statement (2000)
28. Amid the political problems, the World Bank initiated the Financial Sector Assessment Study5 with IMF in 1999. 29. By 2000, Nepal’s finance sector had mushroomed, but the dominance of state-owned financial institutions continued. The poor performance of state-owned institutions posed a serious risk to the sector. 30. The government influenced all aspects of the state-owned banks’ operations, including the appointment of a chief executive officer (CEO) and management, lending decisions, and planning and budgeting. The state-owned banks’ board of directors was occupied with people who had little or no banking background. The CEO and higher management were appointed not based on experiences but on political affiliations. Politically driven management appointments resulted in low staff morale and productivity and promoted highly politicized employee unions. The unions exercised strong influence over the board and management, undermining commercial orientation and return on equity considerations. Years of such political interference deteriorated the state-owned banks’ governance and management. Lack of the central bank’s sufficient autonomy and effective supervision worsened the situation. 31. To promote access to finance, the government continued supply-driven policies. In 1974, the government introduced a priority sector lending program, which required all commercial banks to lend 12% of their total portfolio to priority sector borrowers, of which 3% must be lent as microcredit to the poor (deprived sector lending scheme). The government phased out the priority sector lending program in 2005, but maintained the deprived sector lending scheme. In 2012, the government reintroduced the priority sector lending program, which mandated the banks to increase lending to the agriculture and energy sector to 10% of their total loan portfolio. In 2014, the target was increased to 12%.6
5 World Bank. 2002. Nepal – Financial Sector Study. Washington, D.C. 6 The government and NRB justify directed lending schemes on the grounds that the schemes will support increased
lending to the agriculture and power sectors, which in turn will support economic growth. The deprived sector lending scheme was introduced to meet the microcredit demand for the so-called “deprived” population. The schemes are expected to increase credit to the target sectors and group. To date, there is no published data to prove the schemes’ impact. Rather, the schemes, particularly the deprived lending scheme, have created distortive effects. The scheme has discouraged microfinance institutions (MFIs) to develop other financial services. It has inhibited MFIs’ deposit-taking, which has constrained the depth of financial intermediation, especially in rural areas where households have limited access to commercial banks. The scheme fuelled a rapid increase in MFI loan portfolios, resulting in MFIs’ unsatisfactory capital adequacy and debt to equity ratios.

8 ADB South Asia Working Paper Series No. 28
32. The government’s interventionist policies negatively affected the state-owned banks’ performances by driving them to fulfill policies and mandates rather than focusing on profitability. In 2003, the commercial banks’ aggregate capital adequacy ratio (CAR) of capital funds to risk weighed assets was –5.49%. The state-owned banks were particularly performing poorly—the CAR of RBB, NBL, and ADBL were all negative and technically insolvent. In the same year, the overall banking sector’s nonperforming loan (NPL) ratio was 27%. The public banks’ NPL ratios were substantially higher than the banking sector average. At state-owned banks, loan classification and provisioning were extremely lenient and loans overdue up to 5 years were still classified as doubtful. There is no published data on the overall commercial banks’ profitability., However in 2003, RBB and NBL reported net losses of NRs4.8 billion and NRs0.3 billion, respectively. 33. Limited autonomy in regulatory enforcement by NRB was an added problem. The NRB Act of 1955 did not provide autonomy from the Ministry of Finance (MOF), legal protection to supervisors, nor operational independence, which resulted in a general inability to enforce corrective measures necessary to prevent and resolve problems at state-owned banks. 34. Based on the inputs from the Financial Sector Assessment, the government approved the Financial Sector Strategy Statement (FSSS) and publicly announced it in November 2000.FSSS committed specific reform agenda, including (i) reforming finance sector legislation, (ii) strengthening bank supervision and inspection, (iii) restructuring and privatizing NBL and RBB, (iv) establishing a banking training institute, (v) strengthening the Credit Information Bureau, (vi) establishing an asset reconstruction company, (vii) restructuring and strengthening ADBL, and (viii) establishing and strengthening rural development banks. 35. Following FSSS, the World Bank approved a $16 million Financial Sector Technical Assistance Project (FSTAP) in December 2002. FSTAP’s development objective was to focus on (i) helping restructure and reengineer NRB; (ii) commencing commercial banking reform in RBB and NBL by introducing stronger bank management that would protect the financial integrity of the two banks and take on a conservator role to prepare the banks for the next steps of restructuring; and (iii) supporting a better environment for finance sector reform in areas such as enhanced credit information, better financial news reporting, and better training for staff in financial institutions.7 36. In July 2003, the government, with support from IMF and the World Bank, finalized the 10th Five Year Plan/Poverty Reduction Strategy Paper (the plan). The plan promoted the structural reform agenda to support private sector-led growth and expanded opportunities for the poor. 37. The plan included agendas on (i) expenditure management; (ii) finance sector reform; (iii) fiscal reform; (iv) measures aimed at improving the competitiveness of the private sector, including foreign trade and labor reform; (v) governance, including civil service reform and decentralization; and (vi) the promotion of the private sector’s involvement in infrastructure development. 38. Based on the government’s commitment to the plan’s reform agenda, IMF approved the $72 million Poverty Reduction and Growth Facility (PRGF) Agreement for Nepal in November 2003.
7 World Bank. 2002. Project Appraisal Document to Nepal for a Financial Sector Technical Assistance Project. Washington,
D.C.

Finance Sector Reform in Nepal—What Works, What Doesn’t 9
39. The government entered an agreement with the World Bank for a $68.5 million loan and grant for the Financial Sector Restructuring Project (FSRP) in March 2004. The key project development objectives were to (i) improve corporate governance through provision of management support to RBB and NBL, (ii) improve market structure by reducing the state-owned segment of the banking system, and (iii) sustain and deepen the banking reforms. The first and second objective pertained to improving RBB and NBL’s operating capacity and commercial viability, moving them as swiftly as possible into the private sector; and thereafter, developing the government’s oversight and supervisory capacity over them and other banking institutions 40. The FSRP’s third objective involved strengthening NRB through an ongoing program of bank supervision improvement, accounting and auditing development, human resource reengineering, information technology (IT) upgrading, and other support.8 41 Complementing the World Bank’s FSRP, the Asian Development Bank (ADB) approved a loan and grant of $57 million for the Rural Finance Sector Development Cluster Program (RFSDCP) in October 2006. The project aimed to establish regulatory framework and supervisory authority for rural finance institutions, reform and restructure the ADBL and other government-owned rural finance institutions, and develop finance sector infrastructure.9 42. The government’s FSSS in 2000, PRGF in 2003, and subsequent projects by the World Bank and ADB (Table 3) marked the start of the second finance sector reform program. At that time, the government needed economic reforms to break sluggish growth. Growth was expected to generate employment and appease political instability and social unrest. The government welcomed the donor funding not only because it provided necessary technical and funding support for the reforms, but also because the government regarded it as a support to its policy and legitimacy.
8 World Bank. 2010. Implementation Completion and Results Report to the Government of Nepal for a Financial Sector
Restructuring Project. Washington, D.C. 9 ADB. 2006. Report and Recommendation of the President to the Board of Directors: Proposed Loan to Nepal for the
Rural Finance Sector Development Cluster Program. Manila.

10 ADB South Asia Working Paper Series No. 28
Table 3: Key Reform Programs by Organization
Finance Sector Reform Phase
IMF World Bank ADB
First (1985)
Economic Stabilization Program Currency devaluation Public expenditure
restriction Commercial bank credit
restriction Industrial licensing
liberalization Export promotion Import control
Structural Adjustment Program Strengthening RBB and NBL Amending Income Tax Act,
Commercial Bank Act, NRB Act, and NIDC Act
Establishing Credit Information Bureau
n/a
Second (2002–2006)
Poverty Reduction and Growth Facility/ Government of Nepal’s 10th Five-Year Plan The government made commitments for: restricting and privatizing
RBB and NBL; improving accounting and
auditing standards; strengthening legislative
and institutional framework for loan recovery; and
restructuring ADBL and NIDC.
Financial Sector Technical Assistance Project Reengineering NRB Restructuring RBB and NBL Capacity building in the finance
sector Financial Sector Restructuring Program NRB reengineering Voluntary retirement schemes
in RBB and NBL Hiring of sales (privatization)
advisors
Rural Finance Sector Development Cluster Program Establishing microfinance
regulatory and supervisory framework
Restructuring and privatizing ADBL
Restructuring Small Farmers Development Bank
Establishing National Banking Training Institute
Strengthening Debt Recovery Tribunal
Developing microfinance credit information services
n/a = not applicable. ADB = Asian Development Bank, ADBL = Agricultural Development Bank Limited, IMF = International Monetary Fund, NBL = Nepal Bank Limited, NIDC = Nepal Industrial Development Corporation, NRB = Nepal Rastra Bank, RBB = RastriyaBanijya Bank. Source: Asian Development Bank estimates.

Finance Sector Reform in Nepal—What Works, What Doesn’t 11
III. SECOND FINANCE SECTOR REFORM (2002) A. Legal Reform and Central Bank Strengthening 43. The lack of autonomy and weak supervision capacity of NRB was considered a core problem of the finance sector. Accordingly, strengthening the capacity of NRB and legislative reforms was the main component of the second finance sector reform program. 44. Based on the analysis of the Financial Sector Assessment Study, FSRP provided support for NRB reengineering (Table 4).
Table 4: Nepal Rastra Bank Reengineering Components Component ActivitiesHuman resource development Human resource development planning and implementation
Organizational development Education and training Voluntary retirement scheme
Building supervisory capabilities and prudential norms and regulations
Preparation of manuals and modalities of inspection and supervision for the Inspection and Supervision Department
Formulation and implementation of other relevant regulations Implementation of manuals for the Inspection and Supervision Department Logistic support program
Legislative Reform Program Enactment of new Nepal Rastra Bank Draft Act Formulation of Deposit-taking Institutions Act Formulation of Asset Management Company Act Formulation of Credit Information Institution Act Formulation of Credit Rating Institution Act Formulation of Bankruptcy Act Formulation of Mergers and Acquisition Act
Capacity Building Program Banking Operations Department Nonbank Operations Department Foreign Exchange Department Inspection and Supervision Department Public Debt Department Accounts and Expenditure Department
IT automation Installation of fully integrated Management Information System and computerized general ledger system
IT = information technology. Source: Nepal Rastra Bank. Financial Sector Reform Project, http://bfr.nrb.org.np/fsrp/fsrpindex_old.php 45. NRB reengineering continued until September 2009. Various consultant experts, including chartered accountants, human resource advisors, and IT experts supported the reengineering.
46. As a result of the reengineering activities, NRB’s onsite supervision capability generally improved during the project period as reported by the banks. Offsite reports were issued within 45 days. Onsite supervision was done annually and reports were issued within 30 days. NRB also implemented a policy of annually conducting onsite supervision at each bank and publishing an annual supervision report, which included major findings and directives given to commercial banks during the onsite examinations.

12 ADB South Asia Working Paper Series No. 28
47. NRB intervention to enforce prudential regulations and relevant banking legislation was enhanced to some extent. NRB issued a Directive on Prompt Corrective Action for troubled banks and took over the management of four troubled financial institutions. State-owned banks remained outside the purview of the directive. 48. The reengineering actions to improve supervisory capacity was incomplete because the contract of the firm that provided a team of consultants was prematurely terminated by NRB in mid-2007 due to the firm’s non-compliance to the contract. 49. Additionally, the Commission for the Investigation of Abuse of Authority charged the NRB governor and an NRB executive with corruption in 2007 in relation to the recruitment of a consulting firm under the project, which was largely regarded as a politically motivated accusation. The corruption charges for the governor and executive were cleared and the governor was reinstated to the position in 2009. However, the incident demoralized NRB staff from proceeding with further reform actions. 50. Due to these incidents, majority of the reform actions for the supervisory capacity building were incomplete. Although some regulatory changes were made to improve NRB’s autonomy, NRB supervisory capacity could not be fully enhanced and regulatory enforcement remained weak.
B. Bank Restructuring and Privatization
i. RBB and NBL
51. The World Bank’s FSTAP and FSRP supported the restructuring of state-owned commercial banks NBL and RBB. The objective of the restructuring was to improve the two banks’ corporate governance and reduce government ownership in the finance sector. FSRP placed an external management team at each bank. 52. The management team was to (i) take management and financial control of the day-to-day running of the banks; (ii) help stabilize the operational and financial position of the banks; (iii) help strengthen the accounts of the banks; (iv) conduct training programs, the voluntary retirement scheme (VRS) program, and branch restructuring and improvement programs; (v) adopt appropriate remuneration packages for bank staff; and (vi) prepare the banks for privatization. 53. The external management team was placed at RBB on 22 July 2002 and had carried out a series of organizational and operational restructuring. In the organizational restructuring, VRS programs were conducted and staff size was reduced from over 5,000 employees in 2002 to below 2,600 employees by 2009. To improve profitability, RBB reduced the number of bank branches from over 200 to 123during the same period. They upgraded the core banking system and installed new systems in a total of 64 branches. The computerization of RBB branches met targets, with 95% of deposits and 98% of loans automated and online.10 54. The management team also carried out various operational restructuring. These include development and implementation of standard credit manuals, loan recovery guidelines, problem loan guidelines, loan write-off policies, and inspection manuals. Management and strategic plans were also prepared. Statutory audits, which were lacking for several years, were completed within 6 months and
10 Para. 3.2.2. World Bank. 2012. Implementation Completion and Results Report for a Financial Sector Technical Assistance
Project. Washington, D.C.

Finance Sector Reform in Nepal—What Works, What Doesn’t 13
quarterly financials were published within 1 month as per the NRB guidelines. A new accounting manual, audit manual, budget manual, and charts of accounts were prepared and implemented. Statutory compliance to the central bank—in particular, Basel II11 compliance—was enhanced. 55. At NBL, the external management team was fielded on 16 January 2003 and had carried out similar restructuring activities. They conducted operational and business process restructuring, including VRS, branch reduction, and system upgrading. In addition, they standardized business processes, prepared various manuals, and strengthened accounting and auditing. Staff size was reduced through VRS from 5,652 to 2,960 in three phases. Branches were rationalized, reducing the number from around 200 to 114. IT systems were installed in 58 out of 107 branches, and 77% of deposit base and 88% of loans were covered by the IT platform.12 56. These reform activities brought positive results to RBB and NBL financials (Figures3–6 and Appendixes 1–2). From 2003 to 2012, total assets at RBB and NBL more than doubled. Gross loan and advances outstanding at RBB and NBL grew by 52% and 64%, respectively. Their portfolio quality improved substantially, from a gross NPL ratio of 60% in 2003 to 7% in 2012 at RBB, and from 60% to 6% at NBL. 57. Profit before tax improved from a loss of NRs4.8 billion in 2003 to a positive income of NRs1.2 billion in 2012 at RBB, while a loss of NRs0.2 billion in 2003 improved to a positive income of NRs0.15 billion in 2012 at NBL. The two banks generated NRs30 billion in operating profits from 2003 to 2012.13 Accordingly, return on assets improved from –11% to 1.3% at RBB, and from –0.63% to 0.3% at NBL for the same period. As a result, RBB and NBL’s total negative net worth declined from NRs32 billion in 2003 to NRs6 billion in 2012.
11 A set of banking regulations put forth by the Basel Committee on Bank Supervision, which regulates finance and banking
internationally. Basel II attempts to integrate Basel capital standards with national regulations, by setting the minimum capital requirements of financial institutions with the goal of ensuring institution liquidity.
12 Para. 3.2.2. World Bank. 2012. Implementation Completion and Results Report for a Financial Sector Technical Assistance Project. Washington, D.C.
13 Para. 3.3. World Bank. 2012. Implementation Completion and Results Report for a Financial Sector Technical Assistance Project. Washington, D.C.

14 ADB South Asia Working Paper Series No. 28
Figure 3: Rastriya Banijya Bank Total Assets, Loans Outstanding, Deposits, and Equity, 2001–2013
(NRs million)
Note: Provisional. Source: Rastriya Banijya Bank.
Figure 4: Rastriya Banijya Bank Capital Adequacy Ratio,
Nonperforming Loan Ratio, and Return on Assets, 2001–2013 (%)
Note: Provisional. Source: Rastriya Banijya Bank.

Finance Sector Reform in Nepal—What Works, What Doesn’t 15
Figure 5: Nepal Bank Limited Total Assets, Loans Outstanding, Deposits, and Equity, 2001–2013
(NRs million)
Note: Provisional. Source: Nepal Bank Limited.
Figure 6: Nepal Bank Limited Capital Adequacy Ratio, Nonperforming Loan Ratio, and Return on Assets, 2001–2013
(%)
Note: Provisional. Source: Nepal Bank Limited.
%

16 ADB South Asia Working Paper Series No. 28
58. But the restructuring did not bring the much-needed change to the ownership, governance, and management of RBB and NBL. The management contract at RBB expired on 15 January 2010. After that, a local management internally from RBB was appointed. After the management contract at NBL expired on 21 July 2007, attempts were made to hire another external management team. After four failed attempts, NRB took over NBL’s management according to Section 86C of the NRB Act of 2002—“Action Against the Problematic Commercial Bank or Financial Institution.”The World Bank’s Implementation Completion and Results Report for FSRP stated, “There has been only a slight improvement in the corporate governance of NBL and RBB brought about the management teams in those two banks. Although staff size was rationalized through implementation of VRS, due to the delay in resolving the status of these banks, all the gains achieved so far risk being lost.”14 59. Branches that were closed were reopened after the end of the conflict for business and political reasons. As a result, the branch numbers increased to 142 at RBB and 117 at NBL by 2012. The restructuring program launched VRS to reduce redundant staff and staff expenses in the operating cost. But the staff expenses to the total operating expenses remained high at the two banks, amounting to around 60%in 2012at both RBB and NBL due to alignment with the incremental salary increases of civil service staff. 60. The planned RBB and NBL privatization did not materialize. The Financial Sector High Level Committee, represented by NRB and the government, never reached a consensus to privatize the two banks. FSTAP and FSRP were closed in 2007 and 2009, respectively. ii. ADBL
61. The government’s initial plan under the FSSS was to strengthen ADBL into a viable financial institution that can supply expanded and sustainable agriculture finance. There was no privatization plan for ADBL. 62. In 2004, the government adopted the ADBL restructuring plan. The ADBL restructuring plan aimed to bring about (i) fundamental reforms in governance, management, and business processes and services; (ii) divestment of government shares in ADBL; and (iii) eventual privatization of ADBL. 63. In October 2006, the government entered into an agreement with ADB for a $64.7 million loan and grant for the RFSDCP subprogram I to implement the ADBL restructuring plan. In March 2007, an international consultant was recruited as chief technical advisor to carry out the ADBL restructuring. 64. The ADBL restructuring activities included (i) recapitalization, (ii) injection of additional government preference shares, (iii) VRS, (iv) organizational and business process improvements, (v) core banking system upgrading, (vi) separation of microfinance operations to
14 Para. 3.4.2, World Bank. 2012. Implementation Completion and Results Report for a Financial Sector Technical Assistance
Project. Washington, D.C.

Finance Sector Reform in Nepal—What Works, What Doesn’t 17
the Small Farmers Development Bank,15 (vii) partial divestment of government share at ADBL through initial public offering (IPO), and (viii) capacity building and training. 65. As part of the restructuring, ADBL was recapitalized by converting NRs4.9 billion government debt into equity. Further, the government injected about NRs5 billion preference share to raise the ADBL CAR above the NRB’s minimum CAR requirement. 66. In December 2005, ADBL’s legal status was converted from a specialized bank to a commercial bank and was licensed as a class A bank (commercial bank) under the Banks and Financial Institutions Ordinance,16 2005 by NRB. This was the first time ADBL was brought under the central bank’s supervision. 67. In November 2007, ADBL completed the preference allotment of 15% of the ordinary shares of the government’s holding to small shareholders whose holdings were created under the erstwhile ADBN Act, 1967.17 In March 2010, the IPO of 30% of the ordinary share to comply with the general public shareholding requirement of the Banks and Financial Institutions Ordinance, 2006. 68. The IPO was over subscribed six fold, resulting in the allotment of shares to 228,174 general public shareholders. Concurrently, ADBL opened the employee shareholding scheme and divested 5% shares to its employees. By June 2010, ADBL became a partially private-owned company, with the government holding 51% of its ordinary share. As a result, the six-member board of directors was reconstituted and three new directors joined from the private sector. 69. ADBL carried out three VRSs during 2006–2012, reducing the number of staff from 3,500 in 2007 to 2,500 in 2012. To preserve the rural service network, ADBL did not reduce the number of its 227 branches, but instead developed a regional profit center concept in which rural branches are grouped under regional centers, generating profit within a region as a whole. ADBL installed a core banking system to 60 branches by the end of 2012 and is expanding the system to the rest of its branches. 70. In addition to the international chief technical advisor, local technical advisors for accounting and audit, treasury, marketing, trade finance, IT, and human resource management were also recruited for the business and operational restructuring. The team of technical advisors prepared manuals and guidelines on various operational aspects, conducted trainings, and developed new service lines such as forex and trade finance. ADBL adopted international standards of accounting, loan classifications, and provisioning (Appendix 3).
15 ADBL started the Small Farmers Development Program (SFDP) in 1975 to extend credit to small and marginal farmers.
Under SFDP, small and marginal farmers were organized into groups of 5–7 individuals to borrow from ADBL based on the group guarantee. In 1987, the Institutional Development Program (IDP) was initiated with the assistance of GIZ. Along with IDP, ADBL separated SFDP from its organization and established a separate and independent Small Farmers Development Bank (SFDB) owned jointly by ADBN, the government, two private banks, and the Small Farmers Cooperative Limited (SFCL). The function of SFDB is to provide wholesale lending to SFCL. In 2010, the government share at SFDB was further divested and SFDB was fully privatized, with SFCL owning over 60% of SFDB equity. SFDB is licensed as a Class D (microfinance) institution by NRB.
16 In Nepal, ordinances are transitory legislations and need to be reapproved every 6 months. The Banks and Financial Institutions Ordinance became an Act in 2007.
17 Class B shareholders are general shareholders, including institutions, who own ADBL shares in accordance with the ADBN Act, 1967. They are new shareholders to whom shares will be offered in accordance with the Memorandum and Article of Association, 2005 of ADBL.

18 ADB South Asia Working Paper Series No. 28
71. The capital and operational restructuring brought positive changes to ADBL’s financial performance. Capital adequacy was substantially improved from negative NRs6 billion in 2004 to NRs16 billion in 2012, which is equivalent to 19% of ADBL’s total risk weighted assets.18 While this improvement in capital adequacy was due to the capital injection by the government in 2006, improved profitability from the restructuring also contributed. Return on equity and return on assets were 31% and 3% in 2012, improved from –6.2% and 1%, respectively in 2006. NPL status was improved from 18% in 2004 to 9% in 2012 (Figures7–8, Appendix 4). RFSDCP subprogram 1 was completed in June 2010. 72. In the fiscal year (FY) 2012, ADBL’s net profit was NRs2.3 billion, which was highest among the commercial banks. But the operational income net of nonoperating income and the write back of loss provisions remained negative at –NRs 102,753,089 ADBL’s total loans grew from NRs32.6 billion at the end of FY2009 to NRs 49.72 billion at the end of FY2012. Commercial lending accounts for more than 60%of the total loan portfolio and agricultural loans represents 33%. The NPL to total loan ratio for the end of FY2013 was 5.9%, declined from 21% in FY2006. The aggregate NPL to total loan ratio for all commercial banks for the same period was 2.3%.
Figure 7: Agricultural Development Bank Limited Total Assets, Loans Outstanding, Deposits, and Equity, 2003–2013
(NRs million)
Source: Agricultural Development Bank Limited.
18 Equivalent to CAR of 18.84% (Appendix 4).

Finance Sector Reform in Nepal—What Works, What Doesn’t 19
Figure 8: Agricultural Development Bank Limited Capital Adequacy Ratio, Nonperforming Loan Ratio, and Return on Assets, 2003–2013
(%)
Source: Agricultural Development Bank Limited.
73. Despite the positive operational and performance changes, the restructuring alone could not bring fundamental changes in the governance and management at ADBL. The appointment of CEO and higher management continued to be influenced by the political parties. Staff union politicization also continued and the unions often interfered with staff appointment, transfer, and promotion decisions. ADBL carried out several VRSs during the restructuring, but there was no considerable improvement in staff quality and motivations. 74. In December 2010, the government adopted the ADBL Capital Restructuring Plan, which committed to privatizing ADBL with the participation of an international strategic investor by reducing government shareholding from 51% to 21% by 2014. An international consultant strategic divestment specialist was recruited in March 2011 to guide the ADBL privatization process. 75. At the same time, the government signed an agreement with ADB for a $60 million loan and $12.1 million grant for RFSDCP subprogram 2 to carry on the ADBL restructuring and implement the ADBL Capital Restructuring Plan. 76. The program hired external local and international consultants as technical advisors. RFSDCP did not hire external management, but instead let the technical advisors work along with the existing ADBL management. The program also had a full-time consultant program coordinator placed at the MOF who acted as an effective anchor, providing technical support to MOF and establishing the coordination among MOF, ADBL, and ADB.
%

20 ADB South Asia Working Paper Series No. 28
IV. FINANCE SECTOR REFORM—WHAT WORKS, WHAT DOESN’T
A. Political Environment during Reform
77. The second finance sector reform was implemented during the political turmoil (Table 5). After failed peace talks with the Maoist in November 2001, the King declared a state of emergency and took direct control of the government. That created a new power structure among the three parties: the King who wanted to continue direct rule; the ruling government, which wanted to regain control and restore the parliament; and the Maoist, which demanded a constituent assembly election and new constitution. The government and the Maoist gradually united on a common ground against the monarchy. 78. In early 2006, anti-monarchy protests escalated. After 3 weeks of intense protests, the King announced the restoration of parliament in April 2006. The Maoist responded to this with a ceasefire. In November 2006, the Maoist signed a peace agreement with the government to hold a constituent assembly election. In April 2008, a national election for the constituent assembly (CA)—an interim parliament—was held. The Maoist won and became a mainstream political party. Subsequently, the newly-elected CA voted to abolish the monarchy on 28 May 2008. 79. It is laudable that the government continued the economic reforms in this turbulent political environment. However, these political situations considerably affected the pace and outcomes of the reforms.
Table 5: Chronology of Political Events and Finance Sector Reform Programs Year Political Events Finance Sector Reform Programs1985 International Monetary Fund (IMF) Economic
Stabilization Program 1986 World Bank Structural Adjustment Program I1989 World Bank Structural Adjustment Program II1990 New constitution formulated 1996 Maoist movement started 1999 World Bank Financial Sector Assessment Study2000 Maoist campaign escalated Government adopts Financial Sector Strategy
Statement 2001 Maoist peace talks failed
King declared state of emergency 2002 Parliament dissolved World Bank Financial Sector Technical Assistance
Project 2003 Maoist and government declared ceasefire IMF Poverty Reduction and Growth Strategy and
Facility 2004 Democracy protest intensified 2005 King lifted state of emergency 2006 Maoist and government signed Comprehensive Peace
Agreement World Bank Financial Sector Restructuring Project
Asian Development Bank (ADB) Rural Finance Sector Development Cluster Program (RFDSCP)_
2007 Parliament abolished monarchy 2008 Constitute assembly (CA) election held
Nepal became republic 2009 Maoist left government 2010 ADB RFDSCP (subprogram 2) 2011 CA failed to meet deadline for new constitution2012 Prime Minister dissolved parliament
Caretaker government formed 2013 Second CA election held World Bank Financial Sector Stability CreditSource: Asian Development Bank.
Finance Sector Reform in Nepal—What Works, What Doesn’t 21
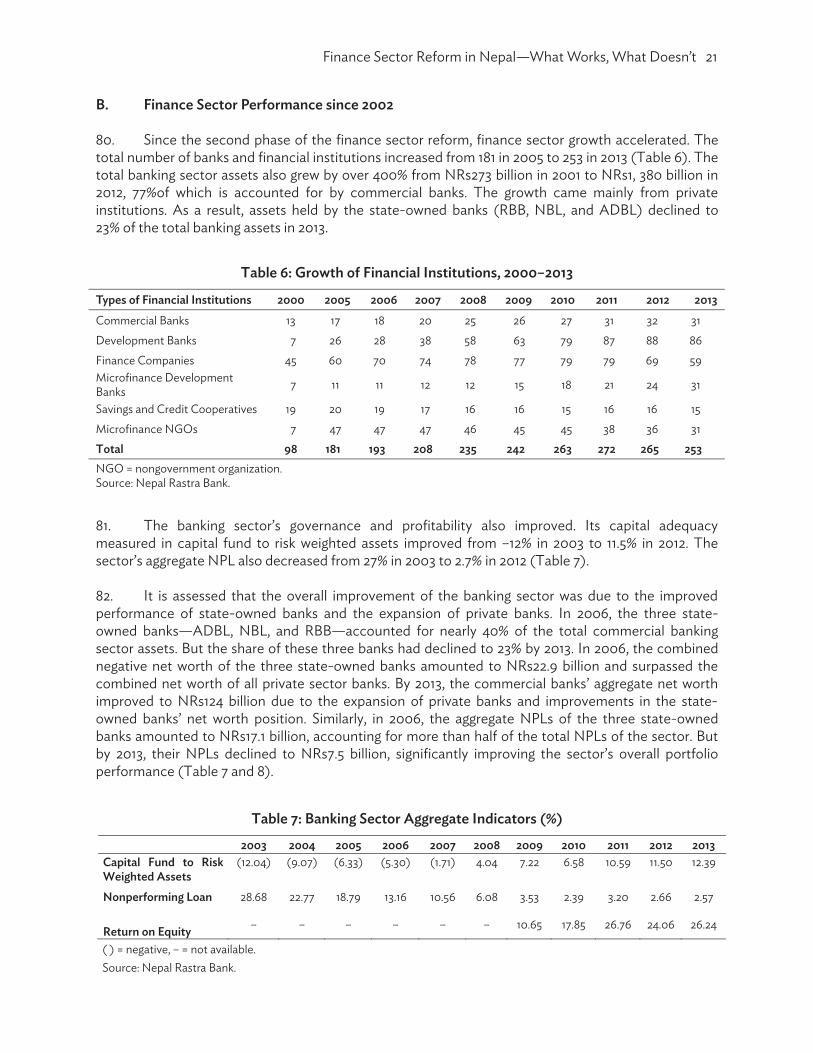
B. Finance Sector Performance since 2002 80. Since the second phase of the finance sector reform, finance sector growth accelerated. The total number of banks and financial institutions increased from 181 in 2005 to 253 in 2013 (Table 6). The total banking sector assets also grew by over 400% from NRs273 billion in 2001 to NRs1, 380 billion in 2012, 77%of which is accounted for by commercial banks. The growth came mainly from private institutions. As a result, assets held by the state-owned banks (RBB, NBL, and ADBL) declined to 23% of the total banking assets in 2013.
Table 6: Growth of Financial Institutions, 2000–2013
Types of Financial Institutions 2000 2005 2006 2007 2008 2009 2010 2011 2012 2013 Commercial Banks 13 17 18 20 25 26 27 31 32 31 Development Banks 7 26 28 38 58 63 79 87 88 86 Finance Companies 45 60 70 74 78 77 79 79 69 59 Microfinance Development Banks 7 11 11 12 12 15 18 21 24 31
Savings and Credit Cooperatives 19 20 19 17 16 16 15 16 16 15 Microfinance NGOs 7 47 47 47 46 45 45 38 36 31 Total 98 181 193 208 235 242 263 272 265 253 NGO = nongovernment organization. Source: Nepal Rastra Bank.
81. The banking sector’s governance and profitability also improved. Its capital adequacy measured in capital fund to risk weighted assets improved from –12% in 2003 to 11.5% in 2012. The sector’s aggregate NPL also decreased from 27% in 2003 to 2.7% in 2012 (Table 7). 82. It is assessed that the overall improvement of the banking sector was due to the improved performance of state-owned banks and the expansion of private banks. In 2006, the three state-owned banks—ADBL, NBL, and RBB—accounted for nearly 40% of the total commercial banking sector assets. But the share of these three banks had declined to 23% by 2013. In 2006, the combined negative net worth of the three state-owned banks amounted to NRs22.9 billion and surpassed the combined net worth of all private sector banks. By 2013, the commercial banks’ aggregate net worth improved to NRs124 billion due to the expansion of private banks and improvements in the state-owned banks’ net worth position. Similarly, in 2006, the aggregate NPLs of the three state-owned banks amounted to NRs17.1 billion, accounting for more than half of the total NPLs of the sector. But by 2013, their NPLs declined to NRs7.5 billion, significantly improving the sector’s overall portfolio performance (Table 7 and 8).
Table 7: Banking Sector Aggregate Indicators (%)
2003 2004 2005 2006 2007 2008 2009 2010 2011 2012 2013 Capital Fund to Risk Weighted Assets
(12.04) (9.07) (6.33) (5.30) (1.71) 4.04 7.22 6.58 10.59 11.50 12.39
Nonperforming Loan 28.68 22.77 18.79 13.16 10.56 6.08 3.53 2.39 3.20 2.66 2.57 Return on Equity – – – – – – 10.65 17.85 26.76 24.06 26.24
( ) = negative, – = not available. Source: Nepal Rastra Bank.

22 ADB South Asia Working Paper Series No. 28
Table 8: Selected Banking Sector Aggregate and Three State-owned Banks’a Indicators (NRs billion)
2006 2007 2008 2009 2010 2011 2012 2013Total Assets Commercial Banks Aggregate 428.7 490.6 566.7 812.2 787.3 878.4 1067.1 1267.3Three State-owned Banksa 168.8 173.2 188.9 215 200.1 217 247.9 285.2 Total Capital Fund Commercial Banks Aggregate (4.5) (4.9) 15.4 37.2 40.1 74.9 97.1 124.1Three State-owned Banksa (22.9) (21.7) (15.9) (8) (4.5) (1.1) 8.6 19.7 Nonperforming Loans Commercial Banks Aggregate 25.6 24.2 18.6 13.6 11.2 16.9 16.3 19.5Three State-owned Banksa 17.1 15 11.6 9 7.9 8.9 7.5 7.5( ) = negative. aAgricultural Development Bank Limited, Nepal Bank Limited, Rastriya Banijya Bank. Source: Nepal Rastra Bank.
83. The private credit to GDP and M2 to GDP indicators used to measure financial deepening also grew in parallel. The private credit to GDP grew from 22% in 2001 to 55% in 2012; M2 to GDP grew from 51% to 71% during the same period. (Figure 9) 84. The reform period (2000–2012) coincides with the rapid growth of remittance to the country. From 2000 to 2012, the official remittance inflow to Nepal grew by more than 30 times, from NRs0.1 billion in 2000 to NRs3.5 billion in 2012. This remittance growth fuelled household consumption and service sector expansion in the real sector. Remittance helped to maintain the positive balance of payments and accelerated credit growth. Remittance also eased banks’ liquidity crunch, especially for 2010–2011.The credit expansion from early 2001 is largely owed to this rapid remittance growth. Improved liquidity position of banks also helped NRB to implement some of the reform measures.
Figure 9: Growth in Financial Deepening Indicators (%)
Source: Asian Development Bank estimates.
%

Finance Sector Reform in Nepal—What Works, What Doesn’t 23
85. The second phase of finance sector reform contributed to the improvement of governance and some finance sector indicators by installing key financial legislations and essential sector infrastructure as shown in the declining NPLs. The government enacted several acts and ordinances, including the amended NRB Act in 2002, Debt Recovery Act in 2002, Secured Transaction Act in 2005, Banks and Financial Institutions Ordinance in 2006 (later became an act in 2007), Insolvency Act in 2006, and Companies Act in 2006. The Banks and Financial Institutions Act is an umbrella act, which repealed the preceding acts related to banks and financial institutions. 86. On other finance sector infrastructure, a Credit Information Bureau was established in 1989 to blacklist defaulters. Under the Debt Recovery Act 2002, a Debt Recovery Tribunal was established in 2003. The National Banking Training Institute, a professional training institute on banking and financial subjects, was established in 2009 to provide short-to medium-term professional training, including training outside Kathmandu. 87. However, the reform was incomplete in state-owned bank restructuring. Although the government made a commitment in FSSS, it never seriously pursued the privatization of NBL and RBB. Due to the frequent changes of the government after the peace agreement in 2006, the government found it difficult to consistently and systematically implement the FSSS commitments. At every change of the government, key officials at MOF were transferred, and the focus on FSSS commitments was gradually defused. ADBL privatization process is ongoing but slow. 88. In its budget speech for FY2014,19 the government expressed that it would continue finance sector reform, including strengthening the role of NRB, supporting merger and capital restructuring of state-owned banks, and improving access to finance. In July 2013, the government entered into a new agreement with the World Bank for a $30 million Financial Sector Stability Credit20 to continue the reform of RBB and NBL. This credit was released upon the compliance of, among others, achieving positive CAR at the two banks. C. Lessons from the Reform
89. The finance sector reform program started in 2002 made tangible achievements in developing legal and regulatory frameworks and establishing or effecting finance sector auxiliary institutions. The reform also enhanced the role of the private sector and reduced the dominance of state-owned banks. But the reform failed to alter the fundamental weakness of the state-owned banks—weak governance and management, inadequate risk management, deficient staff skills and redundancy, and highly politicized employee unions. 90. Given the vulnerability in the banking sector in Nepal, there shall be continuing efforts in strengthening the supervisory capacity of NRB and restructuring the state-owned banks. But will continuing the same reform approach work? To answer this question, it is useful to assess what has worked and what hasn’t in the reform.
19 Government of Nepal. 2013. Budget Speech. FY2014. Ministry of Finance. 20 World Bank. 2013. Program Document on a Development Policy Credit to Nepal for a Financial Sector Stability Credit.
Washington, D.C.

24 ADB South Asia Working Paper Series No. 28
(a) Maintaining state ownership or partial privatization is ineffective and gains from the restructuring may diminish in the long run.
91. Financial distress happens in state-owned banks when the government intervenes for political purposes. Banks, in general, provide greater opportunities for political intervention. The government can direct them to provide concessional loans to certain sectors, industries, or groups. The government can also enforce banks to meet loan targets for special groups, and waive loans and interests or provide interest subsidies for its policy objectives. But these measures are implemented at the expense of the banks’ financial health. There are incentives for the government to continue to intervene instate-owned banks even when the government owns minority shares. 92. After the second reform program, the government’s direct interference with the state-owned banks gradually decreased, but its strong influence over the appointment of the management, employee recruitment, transfer, and promotion remains. The government maintains the deprived sector lending scheme.21 In 2013, the government revived the mandatory targets for agriculture lending,22 which was terminated in 2005. These state influences may gradually undermine the banks’ performances, and gains from restructuring over the last decade may diminish over time. To avoid the banks reverting back to pre-reform distressed conditions, it is necessary to continue efforts to fully privatize the state-owned banks with the participation of strategic investors. (b) International development agencies are the driver of finance sector reform and their
continued engagement is necessary. 93. In international experiences, an economic crisis is what has often triggered reforms and made irreversible and positive changes in the finance sector. It was the 1997–1998 Asian financial crisis that made the Government of Indonesia relinquish state control of banks under the IMF stand-by credit agreements. Due to the crisis, the Indonesian government realized that it could no longer sustain the repressed state-owned banks. It made a complete policy shift from state control to independence and profit maximization of the banks. However, the Government of Nepal has not faced such an acute economic crisis over the last 2decades and lacks a strong incentive to relinquish control of the state-owned financial institutions. 94. Under the prevailing political uncertainties, reform programs—which generally need medium- to long-term implementation periods—tend to be given low priority. In the present political environment where there are multiple parties and conflicting political interests, it is also difficult for the government to make reform commitments, especially when it involves a politically sensitive decision such as privatization. But it is worthwhile for international development agencies to continuously engage in policy dialogues with the government on sound finance sector policies to keep finance sector reform in the policy agenda. It is essential that international development agencies provide insights to the government on the long-term benefits of finance sector reform for the economy at large, and provide guidance to successfully transform state-owned banks. Without such external involvement, gains from the past reforms may quickly be lost. 21 Under the deprived lending scheme, all banks are mandated to allocate 3.5% of their total portfolio to on lend to micro and
small borrowers. To meet this requirement, most of the banks channel the fund to microfinance institutions. To date, there is no solid impact assessment of the scheme on financial inclusion, but the status of financial inclusion in Nepal shows the scheme has a limited impact on access to finance and may have a distortive effect on the finance sector.
22 NRB introduced the priority sector lending scheme in 1974 to enforce on banks targeted lending to the agriculture, small and medium enterprise, and other specified sectors. The scheme was phased out in 2007.

Finance Sector Reform in Nepal—What Works, What Doesn’t 25
(c) NRB strengthening is key for successful finance sector reform and efforts to improve its capacity and autonomy shall be continued.
95. The strengthened regulation and supervisory capacity at NRB contributed to the improved performance of Nepal’s banking sector. But NRB’s structural weaknesses remain, including (i) limited resources and capacity to supervise over 200 financial institutions, and (ii) weak monetary policy implementation and liquidity management. After the real estate bubble collapse in 2008, the sector faced a severe liquidity squeeze. Due to the remittance growth, liquidity tension has somewhat eased since 2011, but NRB’s liquidity management is inadequate and the sector remains to be vulnerable to external shocks such as remittance drops. 96. Also, the government continues to treat the state-owned banks as extra jurisdiction of the central bank, and RBB and NBL’s negative net worth status has been untreated for a long time. Recently, NRB started addressing the undercapitalization of the two banks in coordination with the government, mainly through recapitalization by issuing additional shares and converting government debt into equity. But NRB’s weak autonomy continues to be an issue in maintaining good governance and positive net worth at the two banks. Accordingly, support to enhance NRB’s autonomy and supervisory capacity, especially to exercise its supervisory authority over the state-owned banks, should be strengthened. (d) Restructuring, if left only to external management, is ineffective. Rather, strong
coordination between the government and donors is necessary. 97. There are many merits in bringing in an external management team in bank restructuring. They bring the expertise and experience necessary to transform a state-owned bank into an efficient commercial oriented bank, and institute a new organizational culture that is more merit-based and transparent. Studies23 suggest that bank restructuring led by an external management team yields faster and better performance in bank restructuring. 98. But an external management team works better when the government relinquishes its control of the banks and hands over full managerial responsibility. This was not the case in Nepal. Even after the appointment of external management, the government continued to interfere in the management and operation of state-owned banks, often through the employee unions. The government also continued to impose priority sector lending, loan waivers, and other special programs. Such government interference slowed down the external management’s restructuring activities and undermined their sustainability. 99. From the onset of the restructuring, strong coordination between the government—especially the MOF—and donors is essential to maintain the commitment to reform and refrain from intervening in the state-owned banks’ restructuring. Although there is sufficient merit in introducing external management, the team needs to be supported by a qualified and politically neutral local management. There should be a mechanism in which the banks’ management, MOF, NRB, donor representative, and external management team, if any, periodically meet and discuss the reform progress. In donor-funded programs, it is also essential to place an expert who can advocate and advise within MOF about the reform and privatization.
23 G. Caprio et al. ed. 2004. The Future of State-Owned Financial Institutions. Brookings Institution Press. Washington, D.C.
26 ADB South Asia Working Paper Series No. 28
V. CONCLUSION AND RECOMMENDATIONS 100. On 19 November 2013, the second CA election was held. Over 70% of the registered 12.1 million voters participated. Three major parties—the Nepal Congress (NC), the Communist Party of Nepal (Unified Marxist–Leninist) [CPN (UML)], and the Unified Communist Party of Nepal (Maoist)—secured the largest number of seats in the final proportional representation count. Together, NC and CPN (UML) dominate the 601-member CA, but are short of the two-thirds majority (401 seats) required for approving the constitution. 101. In February 2014, NC and CPN (UML) decided to form a coalition government and elected the NC President as the Prime Minister. But the Maoist refused to participate in the government. It is expected that the Maoist will form a coalition with other minority parties as a major opposition block. While NC and CPN (UML) occupy nearly two-thirds of the parliamentary seats, building a wider consensus to ratify a new constitution is expected to be difficult. Finalizing the new constitution will remain a challenge. 102. Overall, Nepal’s finance sector reform programs helped the finance sector improve governance and capacity. NRB’s supervisory and regulatory capacity was generally enhanced. Essential financial legislations and finance sector infrastructure were developed. Due to the improved regulatory effectiveness and sector infrastructure, Nepal’s banking sector—including the three state-owned banks ADBL, NBL, and RBB—improved its efficiency and profitability. 103. However, reforms could not fundamentally change the state-owned banks. The finance sector develops faster if the state avoids excessive interventions in banks’ credit decisions and the autonomous and accountable central bank supervises the system. Banks can be competitive even under state ownership if the government refrains from interference, grants autonomy, and encourages competition. As an ongoing process, the government shall continue the finance sector reform with a focus on strengthening NRB and restructuring the state-owned financial institutions. For better outcome of the reforms, a few actions are recommended. (a) International development agencies should continuously engage the government and
policy makers in dialogues on the future course of the finance sector. 104. For the successful outcome of the finance sector reform, the government’s political will matters most. In the past two finance sector reform programs, both internal and external factors prompted the government into reforms. Internally, growing political instability and stagnated economic growth were reasons for the government to initiate the reforms. The international development agencies supported the government’s initiatives, but the prolonged political instability gradually defused the government’s focus on the reforms and weakened the commitments to some of the critical reform actions such as the state-owned banks’ privatization. Under Nepal’s current political environment, particularly with its multiple political parties, the government may face further difficulties in formulating and implementing long-term finance sector policies. In such an environment, it is essential that international development agencies provide continued dialogue and constructive advice on finance sector policies for better governance and growth of the sector. There should be a forum for external development partners and the government to continue dialogue and develop policies to promote a more liberalized finance sector for accelerated growth.

Finance Sector Reform in Nepal—What Works, What Doesn’t 27
(b) The government should maintain sound finance sector policies and develop a cadre of finance sector experts within the Ministry of Finance.
105. A finance sector environment conducive to change is a prerequisite for the successful restructuring of a financial institution. On the whole, repressive finance sector policies with state interventions in financial institutions negatively affect sector performance. In particular, interference and control over state-owned financial institutions will negatively affect their financial performance, negate the efforts of restructuring, and increase the vulnerability of the sector as a whole. It is the government’s role to refrain from interfering with state-owned financial institutions and ensure a sound finance sector environment conducive for growth without distortions. International development partners need to monitor repressive policies of the government. Also, finance sector liberalization must be accompanied with appropriate supervision and enforcement of prudential regulation. 106. Along with the frequent changes of the government, key officials at ministries are frequently changed. The recurrent transfer of key officials is not only disruptive to the reform but also detrimental in the development of finance sector expertise within the MOF. The lack of in-house sector expertise is often an obstacle in the smooth implementation of finance sector reform. The government should develop strong finance sector expertise within the ministry by appointing a group of officials and equipping them with finance sector administration and governance experiences. For this, the present government’s transfer system, in which appointments are not based on merit and experience, needs to be revisited. (c) There should be continuous support for strengthening the capacity and independence of
the central bank. 107. To ensure sound finance sector governance, the central bank, NRB, needs to be independent and autonomous to exercise effective supervision and enforcement. NRB should be given sufficient authority to effectively enforce corrective actions, especially those on state-owned financial institutions. Strong oversight and regulatory enforcement are particularly important for state-owned banks. Because of their size, they can pose a systemic risk to the economy if weakened. The continued support of donors for capacity development and particularly the strengthening of NRB for supervision and regulatory enforcement may also be useful. Donors should emphasize NRB autonomy in their dialogues with the government.
REFERENCES Adhikary, K. et al. 2007. Study on Financial Sector Reform in Nepal. Kathmandu: South Asian Network
of Economics Institutes. Andrews, A. 2005. State-Owned Banks, Stability, Privatization, and Growth: Practical Policy Decisions
in a World Without Empirical Proof. IMF Working Paper. International Monetary Fund. Washington, D.C.
Bhusal, B. 2012.Impact of Financial Policy Reforms on Financial Development and Economic Growth in Nepal. Japan: International Journal of Business and Social Science. Vol. 3. No. 14.
Caprio, G. et al. 2004. The Future of State-owned Financial Institutions. Brooking Institution Press. Washington, D.C.
Clarke, G. 2005. Bank Privatization in Developing Countries: A Summary of Lessons and Findings. Journal of Banking & Finance Vol. 29. Elsevier. B.V., Amsterdam.
Government of Nepal. 2007. Three Year Interim Plan (2007–2009). Kathmandu. International Monetary Fund. 2003. Nepal: Poverty Reduction Strategy Paper – IMF Country Report
No. 03/305. Washington, D.C. International Monetary Fund. 2012, Nepal: 2012 Article IV Consultation – IMF Country Report No.
12/326. Washington, D.C. Jeanneney, S. and K. Kpodar. 2008. Financial Development and Poverty Reduction: Can There be a
Benefit Without a Cost? IMF Working Paper. International Monetary Fund. Washington, D.C. Khanal, D. 2005.Understanding Reforms in Nepal – Political Economy and Institutional Perspective.
Institute for Policy Research and Development. Kathmandu. Khanal, D. 2007. Services Trade in Developing Asia: A Case Study of the Banking and Insurance Sector
in Nepal. Asia-Pacific Research and Training Network on Trade Working Paper Series. No. 39. Kathmandu.
Lindgren, C. 1999. Financial Sector Crisis and Restructuring. Lessons from Asia. International Monetary Fund. Washington, D.C.
Parajulee, R. 2000. The Democratic Transition in Nepal. Rowman & Littlefield Publishers, Robinson, R. and A. Rosser. 1998. Contesting Reform: Indonesia’s New Order and the IMF. World
Development. Vol. 26, No. 8. Elsevier. B.V., Amsterdam. Shrestha, M. and K. Chowdhury. 2006. Financial Liberalization Index for Nepal. International Journal of
Applied Econometrics and Quantitative Studies Vol. 3–1. IDEAS, Federal Reserve Bank of St. Louis.
Tiwari, M. 2009. Governance Reform in Political Transition: The Case of Nepal’s Civil Service Reform. Nepalese Journal of Public Policy and Governance. Vol. XXIV, No. 1.Kathmandu.
World Bank. 1994. Project Completion Report, Nepal, Second Structural Adjustment Credit. Washington, D.C.
World Bank. 1996. Structural Adjustment in Nepal. OED Precis. Washington, D.C. World Bank. 1998. Financial Sector Reform – A Review of World Bank Assistance. Operations
Evaluation Department. Washington, D.C. World Bank. 1999. Nepal Country Assistance Evaluation. Operations Evaluation Department.
Washington, D.C. World Bank. 2002. Nepal Financial Sector Study. Washington, D.C. World Bank. 2010. Implementation Completion and Results Reports for a Financial Sector
Restructuring Project. Washington, D.C. World Bank. 2012. Implementation Completion and Results Report for a Financial Sector Technical
Assistance Project. Washington, D.C.

Appendix 4 29
Tabl
e A
1.1: R
astr
iya
Bani
jya
Bank
Fin
anci
al H
ighl
ight
s, 20
01–2
013
Item
20
01
2002
20
03
2004
20
05
2006
20
07
2008
20
09
2010
20
11
2012
20
13
(Pro
visio
nal)
Tota
l ass
ets (
NRs
milli
on)
73,6
44.7
0 44
,969
.43
42,75
4.00
44,6
63.0
056
,526.
67
54,32
5.33
60,4
81.9
5 74
,398.
79
78,4
56.0
1 76
,445
.99
76,55
4.93
93
,905
.09
101,4
53.32
Loan
s and
adv
ance
s
(gro
ss) (
NRs
milli
on)
27,37
5.00
27,0
37.0
0 26
,609
.00
25,10
6.00
27,0
00.9
3 23
,246
.50
24,77
5.73
27,57
0.73
31
,606
.96
35,6
92.51
36
, 851
.29
40,4
48.8
6 49
,044
.91
Dep
osits
(NRs
mill
ion)
40
,773
.65
38,9
93.2
6 39
,402
.00
40,8
67.0
043
,016
.06
46,19
5.41
50,4
64.13
58
,333.
12
68,16
0.93
68
,625
.87
73,9
41.30
87
,782.
20
91,0
97.9
8 Ca
pita
l Fun
d
(N
Rs m
illion
) (1
0,37
8.00
) (1
7,45
0.51
) (2
2,39
2.00
)(2
1,438
.00)
(20,
199.
44)
(18,
718.
57)
(17,
219.
50)
(15,5
09.9
6)(1
1,960
.89)
(9,9
56.6
9)(8
,560.
31)
(3,12
6.64
)1,4
82.33
Prof
it/Lo
ss
Net
inte
rest
inco
me
(NRs
milli
on)
261.7
7 (6
02.0
0)
(58.
00)
741.0
01,3
24.0
5 1,4
32.19
1,4
14.14
1,6
82.11
2,3
76.4
1 2,
817.
42
2,58
9.07
2,
351.6
6 3,2
87.12
Inco
me
befo
re ta
x
(NRs
mill
ion)
(7
,083
.00)
(7
,068
.00)
(4
,839
.00)
1,040
.10
1,322
.89
1,591
.49
1,616
.91
1,718
.94
2,26
8.02
2,
029.
001,7
36.8
2 1,1
89.20
1,5
17.53
In
com
e af
ter t
ax
(N
Rs m
illio
n)
(7,0
83.0
0)
(7,0
68.0
0)
(4,8
39.0
0)1,0
40.10
1,3
22.8
9 1,5
91.4
9 1,5
91.4
9 1,7
18.9
4 1,9
23.6
8 2,
029.
001,7
36.8
2 1,1
84.4
9 1,5
17.53
Fina
ncia
l Rat
ios
Tota
l Cap
ital A
dequ
acy
Ra
tio (%
) (5
.49)
(2
8.03
) (4
4.27
)(4
1.98)
(33.7
6)(5
5.25)
(43.5
3)(4
8.64
)(3
3.98)
(30.
07)
(22.
28)
(9.77
)3.3
3
Non
perfo
rmin
g
Loan
Rat
io (%
) 48
.16
55.0
7 60
.15
57.6
4 50
.70
37.0
928
.63
21.4
3 15
.64
9.81
10
.91
7.27
5.31
Retu
rn o
n as
sets
(%)
(13.9
3)
(15.7
2)
(11.0
3)2.8
5 2.7
5 3.0
92.9
2 2.5
6 2.5
0 2.3
8 9.
081.3
4 1.5
5
Retu
rn o
n eq
uity
(%)
NA
N
A
NA
N
A
NA
N
A
NA
N
A
NA
N
A
NA
N
A
102.3
7
Cost
of f
unds
(%)
6.48
5.8
8 5.3
8 3.7
2 2.4
0 1.9
1 1.9
5 1.8
9 1.6
9 2.0
3 3.4
3 3.7
7 2.7
5
Net
inte
rest
mar
gin
(%)
0.80
(1
.93)
(0
.18)
2.46
4.15
4.
07
3.91
4.20
5.2
9 5.8
8 5.1
3 3.9
3 4.
49
Ope
ratin
g ex
pens
es/o
pera
ting
in
com
e (%
) 31
3.19
(433
.77)
1,455
.00
76.9
5 55
.90
54.2
4 61
.39
49.59
51
.93
61.4
4 51
.64
73.53
78
.87
Loan
-to-
depo
sits
ra
tio (%
) 67
.14
69.34
67
.53
61.4
3 62
.77
50.32
49
.10
47.2
6 46
.37
52.0
1 49
.84
46.0
8 53
.84
( ) =
neg
ativ
e, N
Rs =
Nep
ales
e ru
pees
. N
ote:
Pro
visio
nal.
Sour
ce: R
astri
ya B
anijy
a Ba
nk.
Appendix 4 29
Tabl
e A
1.1: R
astr
iya
Bani
jya
Bank
Fin
anci
al H
ighl
ight
s, 20
01–2
013
Item
20
01
2002
20
03
2004
20
05
2006
20
07
2008
20
09
2010
20
11
2012
20
13
(Pro
visio
nal)
Tota
l ass
ets (
NRs
milli
on)
73,6
44.7
0 44
,969
.43
42,75
4.00
44,6
63.0
056
,526.
67
54,32
5.33
60,4
81.9
5 74
,398.
79
78,4
56.0
1 76
,445
.99
76,55
4.93
93
,905
.09
101,4
53.32
Loan
s and
adv
ance
s
(gro
ss) (
NRs
milli
on)
27,37
5.00
27,0
37.0
0 26
,609
.00
25,10
6.00
27,0
00.9
3 23
,246
.50
24,77
5.73
27,57
0.73
31
,606
.96
35,6
92.51
36
,851
.29
40,4
48.8
6 49
,044
.91
Dep
osits
(NRs
mill
ion)
40
,773
.65
38,9
93.2
6 39
,402
.00
40,8
67.0
043
,016
.06
46,19
5.41
50,4
64.13
58
,333.
12
68,16
0.93
68
,625
.87
73,9
41.30
87
,782.
20
91,0
97.9
8 Ca
pita
l Fun
d
(N
Rs m
illion
) (1
0,37
8.00
) (1
7,45
0.51
) (2
2,39
2.00
)(2
1,438
.00)
(20,
199.
44)
(18,
718.
57)
(17,
219.
50)
(15,5
09.9
6)(1
1,960
.89)
(9,9
56.6
9)(8
,560.
31)
(3,12
6.64
)1,4
82.33
Prof
it/Lo
ss
Net
inte
rest
inco
me
(NRs
milli
on)
261.7
7 (6
02.0
0)
(58.
00)
741.0
01,3
24.0
5 1,4
32.19
1,4
14.14
1,6
82.11
2,3
76.4
1 2,
817.
42
2,58
9.07
2,
351.6
6 3,2
87.12
Inco
me
befo
re ta
x
(NRs
mill
ion)
(7
,083
.00)
(7
,068
.00)
(4
,839
.00)
1,040
.10
1,322
.89
1,591
.49
1,616
.91
1,718
.94
2,26
8.02
2,
029.
001,7
36.8
2 1,1
89.20
1,5
17.53
In
com
e af
ter t
ax
(N
Rs m
illio
n)
(7,0
83.0
0)
(7,0
68.0
0)
(4,8
39.0
0)1,0
40.10
1,3
22.8
9 1,5
91.4
9 1,5
91.4
9 1,7
18.9
4 1,9
23.6
8 2,
029.
001,7
36.8
2 1,1
84.4
9 1,5
17.53
Fina
ncia
l Rat
ios
Tota
l Cap
ital A
dequ
acy
Ra
tio (%
) (5
.49)
(2
8.03
) (4
4.27
)(4
1.98)
(33.7
6)(5
5.25)
(43.5
3)(4
8.64
)(3
3.98)
(30.
07)
(22.
28)
(9.77
)3.3
3
Non
perfo
rmin
g
Loan
Rat
io (%
) 48
.16
55.0
7 60
.15
57.6
4 50
.70
37.0
928
.63
21.4
3 15
.64
9.81
10
.91
7.27
5.31
Retu
rn o
n as
sets
(%)
(13.9
3)
(15.7
2)
(11.0
3)2.8
5 2.7
5 3.0
92.9
2 2.5
6 2.5
0 2.3
8 9.
081.3
4 1.5
5
Retu
rn o
n eq
uity
(%)
NA
N
A
NA
N
A
NA
N
A
NA
N
A
NA
N
A
NA
N
A
102.3
7
Cost
of f
unds
(%)
6.48
5.8
8 5.3
8 3.7
2 2.4
0 1.9
1 1.9
5 1.8
9 1.6
9 2.0
3 3.4
3 3.7
7 2.7
5
Net
inte
rest
mar
gin
(%)
0.80
(1
.93)
(0
.18)
2.46
4.15
4.
07
3.91
4.20
5.2
9 5.8
8 5.1
3 3.9
3 4.
49
Ope
ratin
g ex
pens
es/o
pera
ting
in
com
e (%
) 31
3.19
(433
.77)
1,455
.00
76.9
5 55
.90
54.2
4 61
.39
49.59
51
.93
61.4
4 51
.64
73.53
78
.87
Loan
-to-
depo
sits
ra
tio (%
) 67
.14
69.34
67
.53
61.4
3 62
.77
50.32
49
.10
47.2
6 46
.37
52.0
1 49
.84
46.0
8 53
.84
( ) =
neg
ativ
e, N
Rs =
Nep
ales
e ru
pees
. N
ote:
Pro
visio
nal.
Sour
ce: R
astri
ya B
anijy
a Ba
nk.
Working Paper 28_3rd.indd 35 9/13/2014 8:02:35 PM
Appendix 1
Appe
ndix
1:
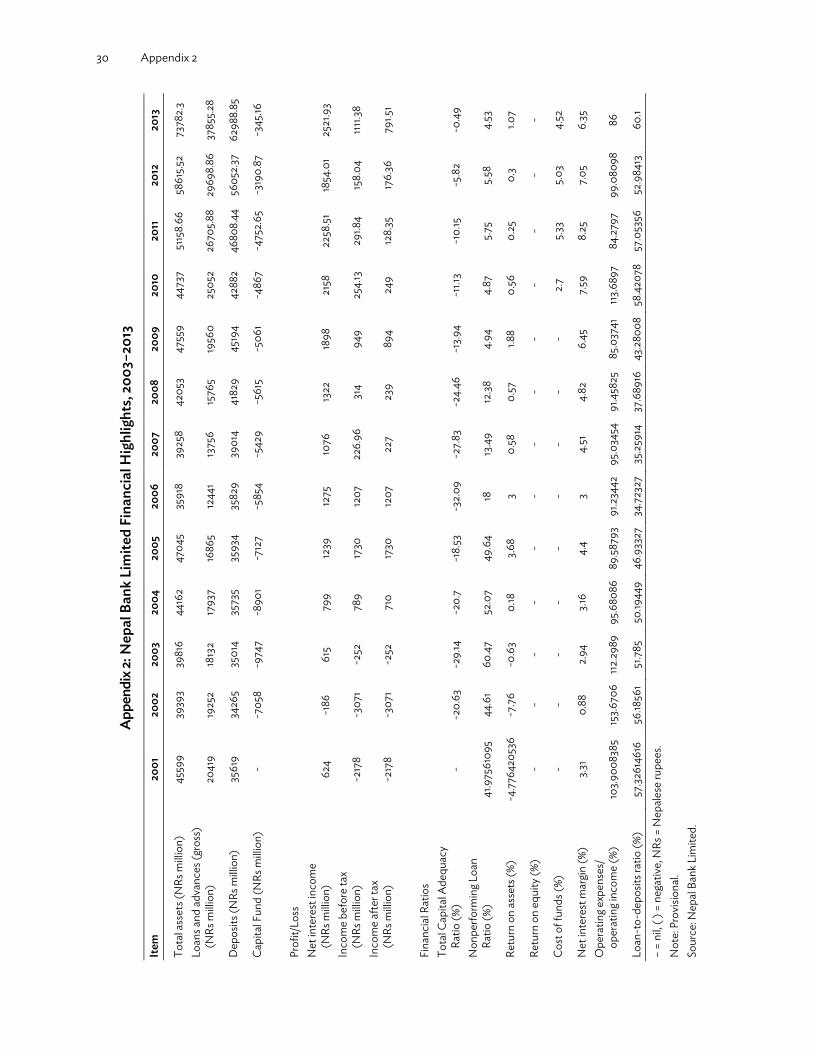
30 Appendix 2
Tabl
e A
2.1:
Nep
al B
ank
Lim
ited
Fina
ncia
l Hig
hlig
hts,
2003
–201
3
Item
20
01
2002
2003
2004
2005
2006
2007
20
0820
0920
1020
1120
1220
13
Tota
l ass
ets (
NRs
milli
on)
4559
9 39
393
3981
6 44
162
4704
5 35
918
3925
8 42
053
4755
9 44
737
5115
8.66
58
615.5
2 73
782.3
Lo
ans a
nd a
dvan
ces (
gros
s)
(N
Rs m
illion
) 20
419
1925
2 18
132
1793
7 16
865
1244
1 13
756
1576
5 19
560
2505
2 26
705.8
8 29
698.
86
3785
5.28
Dep
osits
(NRs
milli
on)
3561
9 34
265
3501
4 35
735
3593
4 35
829
3901
4 41
829
4519
4 42
882
4680
8.44
56
052.
37
6298
8.85
Capi
tal F
und
(NRs
milli
on)
- -7
058
-974
7 -8
901
-712
7 -5
854
-542
9 -5
615
-506
1 -4
867
-475
2.65
-319
0.87
-3
45.16
Prof
it/Lo
ss
Net
inte
rest
inco
me
(NRs
milli
on)
624
-186
61
5 79
9 12
39
1275
10
76
1322
18
98
2158
22
58.51
18
54.0
1 25
21.9
3 In
com
e be
fore
tax
(N
Rs m
illion
) -2
178
-307
1 -2
52
789
1730
12
07
226.
96
314
949
254.
13
291.8
4 15
8.04
111
1.38
Inco
me
afte
r tax
(NRs
milli
on)
-217
8 -3
071
-252
71
0 17
30
1207
22
7 23
9 89
4 24
9 12
8.35
17
6.36
79
1.51
Fina
ncia
l Rat
ios
Tota
l Cap
ital A
dequ
acy
Ra
tio (%
) -
-20.
63
-29.
14
-20.
7 -1
8.53
-3
2.09
-2
7.83
-2
4.46
-1
3.94
-11.1
3 -1
0.15
-5
.82
-0.4
9 N
onpe
rform
ing L
oan
Ratio
(%)
41.9
7561
095
44.6
1 60
.47
52.0
7 49
.64
18
13.4
9 12
.38
4.94
4.
87
5.75
5.58
4.53
Retu
rn o
n as
sets
(%)
-4.7
7642
0536
-7
.76
-0.6
3 0.
18
3.68
3 0.
58
0.57
1.8
8 0.
56
0.25
0.
3 1.0
7
Retu
rn o
n eq
uity
(%)
- -
- -
- -
- -
- -
- -
-
Cost
of f
unds
(%)
- -
- -
- -
- -
- 2.
7 5.3
3 5.0
3 4.
52
Net
inte
rest
mar
gin
(%)
3.31
0.88
2.
94
3.16
4.4
3 4.
51
4.82
6.
45
7.59
8.25
7.0
5 6.
35
Ope
ratin
g exp
ense
s/
op
erat
ing i
ncom
e (%
) 10
3.900
8385
15
3.670
6112
.298
995
.680
86
89.58
793
91.23
442
95.0
3454
91
.458
25
85.0
3741
113
.689
7 84
.279
7 99
.080
98
86
Loan
-to-
depo
sits r
atio
(%)
57.32
6146
16
56.18
561
51.78
5 50
.1944
9 46
.933
27
34.72
327
35.25
914
37.6
8916
43.2
8008
58.4
2078
57
.053
56
52.9
8413
60
.1
– =
nil, (
) =
nega
tive,
NRs
= N
epal
ese
rupe
es.
Not
e: P
rovi
siona
l. So
urce
: Nep
al B
ank L
imite
d.
Working Paper 28_3rd.indd 36 9/13/2014 8:02:35 PM
Appe
ndix
2:
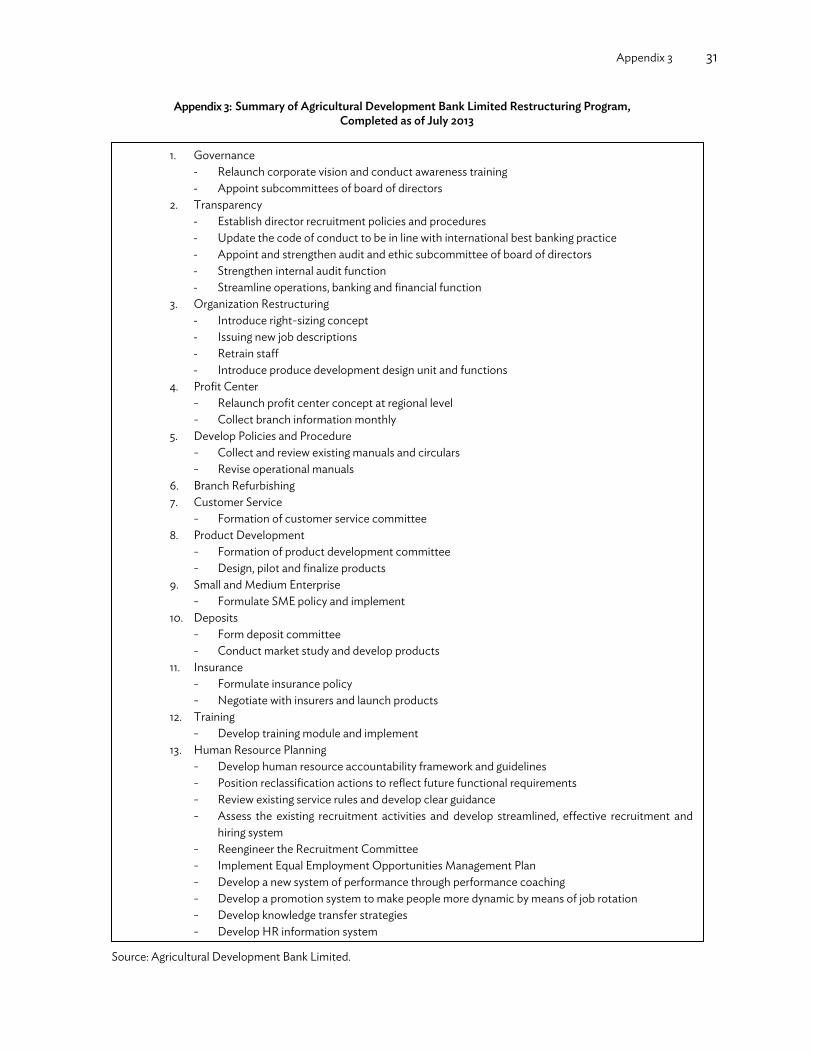
Appendix 3 31
1. Governance - Relaunch corporate vision and conduct awareness training - Appoint subcommittees of board of directors
2. Transparency - Establish director recruitment policies and procedures - Update the code of conduct to be in line with international best banking practice - Appoint and strengthen audit and ethic subcommittee of board of directors - Strengthen internal audit function - Streamline operations, banking and financial function
3. Organization Restructuring - Introduce right-sizing concept - Issuing new job descriptions - Retrain staff - Introduce produce development design unit and functions
4. Profit Center - Relaunch profit center concept at regional level - Collect branch information monthly
5. Develop Policies and Procedure - Collect and review existing manuals and circulars - Revise operational manuals
6. Branch Refurbishing 7. Customer Service
- Formation of customer service committee 8. Product Development
- Formation of product development committee - Design, pilot and finalize products
9. Small and Medium Enterprise - Formulate SME policy and implement
10. Deposits - Form deposit committee - Conduct market study and develop products
11. Insurance - Formulate insurance policy - Negotiate with insurers and launch products
12. Training - Develop training module and implement
13. Human Resource Planning - Develop human resource accountability framework and guidelines - Position reclassification actions to reflect future functional requirements - Review existing service rules and develop clear guidance - Assess the existing recruitment activities and develop streamlined, effective recruitment and
hiring system - Reengineer the Recruitment Committee - Implement Equal Employment Opportunities Management Plan - Develop a new system of performance through performance coaching - Develop a promotion system to make people more dynamic by means of job rotation - Develop knowledge transfer strategies - Develop HR information system
Box A3.1: Summary of Agricultural Development Bank Limited Restructuring Program, Completed as of July 2013
Source: Agricultural Development Bank Limited.
Working Paper 28_3rd.indd 37 9/13/2014 8:02:36 PM
Appendix 3:

32 Appendix 4
Tabl
e A
4.1:
Agr
icul
tura
l Dev
elop
men
t Ban
k Li
mite
d Fi
nanc
ial H
ighl
ight
s, 20
01–2
012
2001
20
02
2003
20
04
2005
20
06
2007
20
08
2009
20
10
2011
20
12
Tota
l ass
ets (
NRs
milli
on)
3214
1 34
948
4031
9 45
671.9
438
694.
5235
297.6
2 38
160.
2143
686.
7551
818.
7454
020.
2359
241.3
668
646.
34Lo
ans a
nd a
dvan
ces (
gros
s)
(N
Rs m
illion
) 20
349
2425
3 26
699
2934
3.32
3130
9.07
3331
0.75
34
440.
3736
604.
7238
301.1
39
582.
8740
372.7
344
988.
37
Dep
osits
(NRs
milli
on)
1778
6 20
812
2395
0 26
244.
1527
223.0
529
631.8
2 32
416.
3632
553.8
335
159.
6132
472.
5734
394.
6343
235.1
Capi
tal F
und
(NRs
milli
on)
1735
18
21
1589
.5 -6
014.
2 -5
989.
27-8
36.0
67
2022
.226
5136
.423
11066
.66
1404
2.96
1563
7.72
1562
5.5
Prof
it/Lo
ss
Net
inte
rest
inco
me
(NRs
milli
on)
1345
16
21
1575
79
9.38
7624
27.72
625
93.70
1 30
17.22
923
19.9
2430
74.0
7239
56.8
639
84.6
9841
20.9
11
Inco
me
befo
re ta
x (N
Rs m
illion
) 13
9 84
23
.02
-800
0.22
-78.
6328
866.
6479
119
4.92
274
9.73
815
92.6
2417
92.7
1819
75.16
924
53.30
9
Inco
me
afte
r tax
(NRs
milli
on)
93
59
15.6
2 -8
000.
22-7
8.63
2835
3.524
9 10
58.4
4966
9.23
9410
57.6
18
92.38
523
65.4
8118
39.9
25
Fina
ncia
l Rat
ios
Tota
l Cap
ital A
dequ
acy R
atio
(%)
5.67
6.33
5.6
9 -1
6.08
-15.5
0-2
.08
4.84
11.41
15.6
918
.3019
.49
18.8
4
Non
perfo
rmin
g Lo
an R
atio
(%)
17.9
419
.81
20.59
17
.96
11.69
9.71
8.36
8.99
8.98
Retu
rn o
n as
sets
(%)
0.29
0.
17
0.04
-1
7.52
-0.20
1.00
2.77
1.53
2.04
3.50
3.99
2.68
Retu
rn o
n eq
uity
(%)
5.36
3.24
0.98
13
3.02
1.31
-6.21
-2
2.86
-19.
8965
.08
42.36
35.0
330
.76
Cost
of f
unds
(%)
7.69
7.
13
7.43
7.2
34.
904.
72
5.10
5.00
3.39
5.93
5.88
6.81
Net
inte
rest
mar
gin
(%)
7.40
7.
46
5.44
2.78
7.81
5.56
4.90
4.52
5.87
6.09
6.35
4.36
Ope
ratin
g exp
ense
s /op
erat
ing
in
com
e (%
) 94
.03
92.0
5 92
.10
122.
1369
.1081
.77
65.33
85.9
783
.47
76.8
670
.3676
.20
Loan
-to-
depo
sits r
atio
(%)
114.4
1 116
.53
111.4
8 111
.81
115.0
1112
.42
106.
24112
.44
108.
9312
1.90
117.38
104.
06
( ) =
nil,
NRs
= N
epal
ese
rupe
e.
Sour
ce: A
gric
ultu
ral D
evel
opm
ent B
ank L
imite
d.
Working Paper 28_3rd.indd 38 9/13/2014 8:02:36 PM
Appe
ndix
4:

ASIAN DEVELOPMENT BANK
AsiAn Development BAnk6 ADB Avenue, Mandaluyong City1550 Metro Manila, Philippineswww.adb.org
Finance Sector Reform in Nepal—What Works, What Doesn’t
This paper analyzes the outcomes and impact of the financial sector reform programs in Nepal. Since its first reform in 1985, Nepal’s financial sector grew rapidly with expanded credit. The reforms’ developing financial regulatory framework, improving the central bank’s autonomy, and establishing key sector infrastructure contributed to this growth. However, restructuring the three state-owned banks was not fully successful due to the country’s complex political situations. Continuing efforts to restructure the state-owned banks, enhance the central bank’s independence, and maintain sound financial sector policies are crucial to the financial sector’s further growth and the economy’s sustainable development.
About the Asian Development Bank
ADB’s vision is an Asia and Pacific region free of poverty. Its mission is to help its developing member countries reduce poverty and improve the quality of life of their people. Despite the region’s many successes, it remains home to approximately two-thirds of the world’s poor: 1.6 billion people who live on less than $2 a day, with 733 million struggling on less than $1.25 a day. ADB is committed to reducing poverty through inclusive economic growth, environmentally sustainable growth, and regional integration.
Based in Manila, ADB is owned by 67 members, including 48 from the region. Its main instruments for helping its developing member countries are policy dialogue, loans, equity investments, guarantees, grants, and technical assistance.
FiNANce SectoR ReFoRm iN NepAl— WhAt WoRkS, WhAt DoeSN’tMayumi Ozaki
adb SOUTH aSia wOrking paper SerieS
No. 28
July 2014