financial services regulatory authority
TRANSCRIPT

FINANCIAL SERVICES REGULATORY AUTHORITY
31 March 2018ANNUAL REPORT

FINANCIAL SERVICES REGULATORY AUTHORITY (FSRA) Annual Report 2018

FINANCIAL SERVICES REGULATORY AUTHORITY (FSRA) Annual Report 2018 01
ABBREVIATION 2
INTRODUCTION 6
THE MINISTRY IN CHARGE OF THE FSRA 7
THE FSRA MANDATE 8
ORGANISATIONAL IDENTITY AND DEFINITION 9
FSRA STATEMENT OF VALUES 10
THE REGULATORY AND LEGISLATIVE FRAMEWORK 11
CHAIRMAN’S REPORT 12
CORPORATE GOVERNANCE 13
GENERAL REVIEW OF THE ECONOMY 19
CEO’s REVIEW 23
FACTS AND FIGURES - DASHBOARD 35
FSRA HISTORIC FINANCIAL SUMMARY 39
REGULATED INDUSTRIES – DETAILED REPORTS
1. Capital Markets Institutions 40
2. Credit and Savings Institutions 57
3. Savings and Credit Cooperative Societies (SACCOs) 59
4. Credit Providers 67
5. Building Societies 72
6. Insurance, Retirement Funds and Medical Schemes 78
7. Long Term Insurance Companies 82
8. Short Term Insurance Companies 95
9. Retirement Funds 106
LEGAL SERVICES, STAKEHOLDER ENGAGEMENTS AND
CONSUMER PROTECTION 124
FSRA AUDITED FINANCIAL STATEMENTS 129
CONTENTS

FINANCIAL SERVICES REGULATORY AUTHORITY (FSRA) Annual Report 2018
AML/CFT - Anti-Money Laundering / Combating the Financing of TerrorismAUM - Assets Under ManagementAMLO - Anti-Money Laundering Officers and Compliance OfficersCIS - Collective Investment SchemesCMA - Common Monetary AreaCMD - Capital Markets Development DivisionCMI - Capital Markets InstitutionsCSI - Credit and Savings Instutions DivisionCSD - Central Securities DepositoriesCISNA - (SADC) Committee of Insurance, Securities and Non Banking Financial AuthoritiesFATCA - Foreign Accounts Tax Compliance ActFATF - Financial Action Task ForceFIP - Finance and Investment Protocol (SADC)FSB - Financial Services Board (South Africa)FSPs - Financial Services ProvidersFSRA - Financial Services Regulatory AuthorityIAIS - International Association of Insurance SupervisorsIMF - International Monetary FundIOPS - International Organisation of Pensions SupervisorsIRF - Insurance and Retirement Funds DivisionMLTPF ACT - Money Laundering and Financing of Terrorism (Prevention) ActMOU - Memorandum of UnderstandingNAMFISA - Namibia Financial Institution Supervisory AuthorityNBFIs - Non-Banking Financial InstitutionsNBFIRA - Non-Bank Financial Institutions Regulatory Authority RIRF - Registrar of Insurance And Retirement FundsSACCO - Savings and Credit Co-OperativesSADC - Southern African Development CommunitySSX - Swaziland Stock ExchangeTWG - Technical Working GroupOTC - Over The Counter
ABBREVIATIONS
02

FINANCIAL SERVICES REGULATORY AUTHORITY (FSRA) Annual Report 2018
ABBREVIATIONS PERFORMANCE OVERVIEW
03
TOTAL ASSETS
E910 Million(2017: E996 Million)
TOTAL CLAIMS
E213 Million(2017: E151 Million)
GROSS PREMIUMS
E631 Million(2017: E584 Million)
NET ASSETS
E413 Million(2017: E329 Million)
NET PROFIT
E127 Million(2017: E124 Million)
5 SHORT TERM LICENCES APPROVED (2017: 5)
SHORT TERM INSURANCE BUSINESS AT A GLANCE
TOTAL ASSETS
E3.9 Billion(2017: E3.7 Billion)
TOTAL CLAIMS
E547 Million(2017: E432 Million)
GROSS PREMIUMS
E662 Million(2017: E625 Million)
NET ASSETS
E515 Million(2017: E470 Million)
NET PROFIT
E72 Million(2017: E59 Million)
7 LONG TERM LICENCES APPROVED (2017: 7)
LONGTERM INSURANCE BUSINESS AT A GLANCE
TOTAL ASSETS
E28 Billion(2017: E27 Billion)
LOCAL INVESTMENTS
E11.9 Billion(2017: E10.2 Billion)
TOTAL CONTRIBUTIONS
E1.5 Billion(2017: E1.8 Billion)
BENEFITS PAID
E1.5 Billion(2017: E1.4 Billion)
FOREIGN INVESTMENTS
E15.9 Billion(2017: E16.8 Billion)
122RETIREMENT FUNDS LICENCES APPROVED (2017: 120)
42% LOCAL INVESTMENTS (2017:38%)
RETIREMENT FUNDS AT A GLANCE
TOTAL ASSETS UNDER REGULATION
E41.7 Billion334FINANCIAL SERVICES LICENCES APPROVED
TOTAL LICENCES AND TOTAL ASSETS UNDER REGULATION

FINANCIAL SERVICES REGULATORY AUTHORITY (FSRA) Annual Report 2018
PERFORMANCE OVERVIEW
04
TOTAL ASSETS OF SACCOS
E1.5 Billion(2017: E1.2 Billion)
TOTAL ASSETS OF BUILDING SOCIETIES
E2.4 Billion(2017: E2.0 Billion)
TOTAL ASSETS OF CREDIT PROVIDERS
E4.6 Billion(2017: E3.5 Billion)
170 LICENCES APPROVED (2017: 180)
TOTAL ASSETS UNDER MANAGEMENT
E25.8 Billion(2017: E23.3 Billion)
GROSS REVENUE
E138.4 Million(2017: E119.9 Million)
30 CAPITAL MARKETS LICENCES APPROVED (2017: 24)
TOTAL EXPENSES
E113.3 Million(2017: E103.0 Million)
CREDIT AND SAVINGS INSTITUTIONS AT A GLANCE
CAPITAL MARKETS INSTITUTIONS AT A GLANCE

FINANCIAL SERVICES REGULATORY AUTHORITY (FSRA) Annual Report 2018
POPULATION
1.14 Million People
Gross Domestic Product
E55.27 Billion
Employment to Population Ratio
41.1%
PERFORMANCE OVERVIEW KEY FIGURES ON MACRO ECONOMIC DATA
GDP Annual Growthas at 31 March 2018
US Dollar Exchange Rate as at 31 March 2018
0.2%
USD1 = E11.8108
05
Source: https://nsd.Eswatini:opendataforafrica.org/chkrctc/population
Source: https://nknoena.com/atlas/Eswatini/GDP

FINANCIAL SERVICES REGULATORY AUTHORITY (FSRA) Annual Report 2018
INTRODUCTION
The Financial Services Regulatory Authority (FSRA) hereby presents its annual report for the year ended 31 March 2018.
The FSRA is built on the energy and drive of its people. This year’s Annual Report is all about capturing the dynamic quality that permeates every department of the Authority. The passionate Board of Directors, Executive Committee, along with
dedicated colleagues, have profoundly affected the Financial Services Sector in a special way.
On every page of this report, we will introduce you to the true inner workings of the FSRA, the engines that keep the Authority running strong. You will see faces, smiles, curious and determined eyes, passionate hearts, and boundary-pushing minds. In short, our people.
06

FINANCIAL SERVICES REGULATORY AUTHORITY (FSRA) Annual Report 2018
INTRODUCTION THE MINISTRY IN CHARGE OF THE FSRA
The Ministry of Finance
The Ministry of Finance is the Ministry responsible for FSRA’s policy guidance. The Mission of the Ministry of Finance is to promote Macroeconomic stability in
Eswatini by formulating and implementing fiscal and financial policies that optimise economic growth and improve the welfare of its citizens. One of the major components of the Ministry’s mission is to:
Provide a sound regulatory framework for the country’s financial sector, hence the FSRA was established to fulfil this mandate.
Create an environment which will promote private sector development
07

FINANCIAL SERVICES REGULATORY AUTHORITY (FSRA) Annual Report 2018
THE FSRA MANDATE
a) The stability of the Eswatini financial system;b) The safety and soundness of financial services providers;c) The highest standards of conduct of business by financial services
providers;d) The promotion of fair competition between different financial service
providers for the benefit of stakeholders;e) The fairness, efficiency and orderliness of the Eswatini
non-bank financial sector, andf) The protection of the stakeholders.
The principal objects of the Authority are spelt out in the FSRA Act, as being to foster, through regulation and prudential supervision of financial services providers:
08

FINANCIAL SERVICES REGULATORY AUTHORITY (FSRA) Annual Report 2018
THE FSRA MANDATE FSRA ORGANISATIONAL IDENTITY AND DEFINITION
The FSRA Vision
The FSRA Mission
To be a world class regulator of financial services.
The following is an outline of what we do (our mission); how we do this (our values); where we want to go (our vision); and how all fits together (our strategic model).
We regulate and supervise financial services to protect stakeholders and foster a stable financial system in Eswatini.
09

FINANCIAL SERVICES REGULATORY AUTHORITY (FSRA) Annual Report 2018
We maintain open, honest and direct relationships with our stakeholders. We treat non-public information at our disposal with utmost confidentiality in accordance with the law.
People are important to us. We work as a team to satisfy our stakeholders.
We execute our mandate and in doing so we fulfil our duties to all stakeholders. We report and take responsibility for our actions.
We are open and transparent in our dealings with stakeholders.
Our laws and regulations guide our decisions. We apply the same principles to similar events.
IntegrityWe, at FSRA, base our decisions on ethical principles and legal fairness.
THE FSRA STATEMENT OF VALUES
Confidentiality
Teamwork
Transparency
Consistency
Accountability
10

FINANCIAL SERVICES REGULATORY AUTHORITY (FSRA) Annual Report 2018
THE FSRA STATEMENT OF VALUES THE REGULATORY AND LEGISLATIVE FRAMEWORK
The FSRA Act, No.2 of 2010, is the legislative frame-work governing the operations of the Authority and the regulation and supervision of Non-Bank Financial Institutions (NBFIs) and matters inciden-tal thereto. The FSRA Act is the umbrella act of the Financial Services Laws for regulating all the NBFIs. The Act prescribes the operations, responsibilities and accountabilities of the FSRA including: Constitution of the Authority; The Board, Chief Executive Officer and Staff of
the Authority; Financial Resources of the Authority; Administration of Financial Services Laws;
Financial Services Licenses; Market Conduct of Financial Services Providers; Auditors and Actuaries; Information, Reports, Inspection and Investiga-
tion; Disciplinary Measures; Curators and Winding up of Authorised Finan-
cial Services Providers (FSPs); The Ombudsman of Financial Services; Appeals; and Miscellaneous provisions.
The regulated Financial Services Providers are listed below:
The Umbrella Act – The Financial Services Regulatory Authority Act (2010)
Name of the Industry Act Supporting Rules and Regulations Types of FSPs
INSURANCE INDUSTRY
The Insurance Act, 2005 1. Insurance Regulations, 20082. Insurance Directives, 2008
1. Reinsurers2. Insurers3. Insurance Brokers4. Corporate Agents5. Individual Agents6. Medical Aid Schemes7. Medical Aid Scheme Providers
RETIREMENT FUNDS INDUSTRY
The Retirement Funds Act, 2005 1. Retirement Funds Regulations, 2008
2. Retirement Funds Directives, 2008
1. Local Retirement Funds 2. Foreign Retirement Funds3. Beneficiary Funds4. Funds Administrators5. Trustees of Retirement Funds6. Other Fund Service Providers
CAPITAL MARKETS INDUSTRY
Securities Act, 2010 1. Industry specific sub-legislations awaiting promulgation.
1. Securities Exchanges2. Investment Advisors3. Investment Advisor Representatives4. Collective Investment Schemes5. Collective Investment Scheme Managers6. Central Securities Depositories7. Trustees and Custodians8. Dealer Representatives9. Exempt Dealers
CREDIT AND SAVINGS INDUSTRY
1. Building Societies Act, 19622. Consumer Credit Act, 20163. SACCOs Bill – under
drafting
1. Consumer Credit Regulations awaiting promulgation
1. Building Societies2. Savings and Credit Cooperative Societies
(SACCOs)3. Credit Providers4. Credit Bureaus5. Debt Counsellors
Note: Other laws applicable to all Financial Services Providers include, inter alia, the Companies Act, the Employment Act and the Income Tax Order.
11
FINANCIAL SERVICES REGULATORY AUTHORITY (FSRA) Annual Report 2018
INTRODUCTION
The Board is grateful to the Minister of Finance, for showing confidence in appointing its members to serve on the board
of the Financial Services Regulatory Authority. The end of this reporting period completes the term for the board. Therefore, the Board is grateful for the opportunity to present an update on the activities at the FSRA, which it now outlines below:
a) Attendance at meetings: Throughout its term in office, the board demonstrated commitment to the business of the Authority, in that they took attendance at board meetings very seriously, as demonstrated in the next section of this report. No meeting was postponed as a result of lack of quorum. This made decision making a lot easier.
b) No Government Subventions requested: The FSRA took a decision on operating on a shoestring budget three years ago by foregoing burdening government with requests for funding its operations. Instead, the FSRA embarked on carrying out its legislative mandate by streamlining operations to fit the resources it is collecting from the levying of regulated entities. It is worth noting that the FSRA, has not increased levy rates since its establishment. By not increasing levy rates, the effectiveness of its supervision has not been compromised.
c) Governance Policies: During its term in office, the board has been able to approve 13 policies to guide management administer the Authority in accordance with good corporate governance principles.
d) Automation of the Stock Exchange: A new stock exchange fully automated with two trading platforms (Main Board and SME platform) is to be launched soon. Management has submitted a business plan currently considered by the board aimed at turning around the stock exchange into a financially viable market. A motivation is to be submitted to the Minister proposing demutualisation of the exchange thus freeing the FSRA from funding the exchange.
e) Staff turnover: The FSRA has been experiencing a turnover of staff at an accelerated pace over the last three years largely due to attraction by better salaries in the financial sector. The board has since commissioned a job evaluation and salary review whose outcome will correctly position the remuneration structure of the Authority. It will be in the best interest of the FSRA to consider the recategorisation of the Authority to category “B” in order to improve its ability to retain competent staff.
f) Outstanding legislation, regulations and notices awaiting gazetting: The board appeals to the Minister to implore officials at the Ministry to process draft legislation, regulations and industry practice notes in order to strengthen the supervisory framework. Technical assistance has been obtained from the IMF and First Initiative to update and harmonise the FSRA Act and its subsidiary legislations such that accelerating the speed of promulgating legislation is crucial going forward.
g) Placing the Motor Vehicle Accident Fund under supervision: the FSRA has received notification from the Ministry, communicating a ministerial directive for the supervision of the MVA Fund by the Authority. The Authority appreciates this move, as the MVA Fund plays a key role in social provision for victims of road accidents. In the same spirit, the Authority also desires that the Occupational Health and Safety Fund, as well as Phalala Fund be brought under FSRA supervision, since now, these funds are bleeding government millions of Emalangeni.
h) New Strategic Plan: The FSRA has formulated a new strategic plan starting 1 April 2018 to 31 March 2021, by which it aims to focus attention on increasing FSRA intensity of supervision. The strategy incorporates the IMF-First Initiative technical assistance aimed at modernising and harmonising the legislative framework of the financial services sector as well as aligning the operations of the FSRA and complementing the efforts of the Central Bank of Eswatini in promoting financial stability.
CHAIRMAN’S REPORT
12

FINANCIAL SERVICES REGULATORY AUTHORITY (FSRA) Annual Report 2018
CHAIRMAN’S REPORT CORPORATE GOVERNANCE REPORT
ROBUST CORPORATE GOVERNANCE
As a Board, we believe that a strong corporate governance framework and culture translates to a strong Authority that delivers
for all its stakeholders. We recognise that the way we do business is critical in order for us to earn and maintain the respect and trust of all stakeholders including our regulated entities, consumers, suppliers, employees, the shareholder and the community. The FSRA directors and management are committed to conducting business in an ethical, fair and transparent manner in accordance with high standards of corporate governance. The Board, together with the management team, leads by example. We have a robust corporate governance framework in place and we are committed to fostering a culture of compliance that values personal and corporate integrity, accountability and continuous improvement. Our corporate governance framework includes:
An engaged Board of directors with a diverse range of skills and experience supported by an effective Board Committee structure.
Clear and transparent communication with our stakeholders.
Strong risk management and assurance processes and culture.
Our Values and Behaviours and supporting policies that underpin the way we behave and meet our strategic objectives.
1. Our Board
In accordance with Section 7 of the FSRA Act, 2010, the Authority is administered and managed by a Board of Directors. The composition of the Board is stipulated in the Act to consist of:a) A Chairman and not more than 4 other members,
who shall be appointed by the Minister of Finance. Members appointed by the Minister shall be persons of recognised standing and experience in the financial services sector.
b) A representative of the Swaziland Law Society;c) A representative of the Institute of Account-
ants;
d) The Principal Secretary of the Ministry of Finance, or a person authorised by the Principal Secretary in writing to act on behalf of the Principal Secretary; and
e) The Chief Executive Officer of the Authority, who shall act as secretary to the Board.
The members of the Board for the year ended 31 March 2018 comprised the following:
1. Mr Stephen L. Simelane - Chairman (Appointed 2015)2. Mr Modern B. Samketi - Member (Appointed 2015)3. Mr Nathie E. Maseko - Member (Appointed 2015)4. Amos C. Mkhatshwa - Member (Appointed 2015)5. Mr Sabelo J. Mabuza - Member (Appointed 2015)6. Mr Ntsika W. Fakudze - Member (Appointed 2015)7. Mr Nkululeko H. Dlamini - Member (Appointed 2017)
11.1 Board term of office
A member of the Board, other than the Principal Secretary and the Chief Executive Officer, shall hold office for a period not exceeding three years on such terms and conditions as the Minister may determine, and shall be eligible for reappointment.
1.2 The role and responsibilities of the Board and management
The Board’s primary role is to ensure the protection and enhancement of long-term shareholder (Government) value taking into account the interests of other stakeholders including employees, regulated entities, consumers of financial services, suppliers and the wider community. The Board is accountable to the shareholder for the performance of the Authority. It directs and monitors the business and affairs of the Authority on behalf of Government and is responsible for the Authority’s overall corporate governance. In particular, the Board’s responsibilities include:
13

FINANCIAL SERVICES REGULATORY AUTHORITY (FSRA) Annual Report 2018
CORPORATE GOVERNANCE REPORT - continued
approving the strategic objectives and direction of the Authority and overseeing management’s implementation of those strategic objectives;
monitoring the Authority’s operational per-formance generally including its financial state and the effectiveness of the Authority’s safety and sustainability strategy;
approving major expenditures, transactions, budgets, funding plans and capital management initiatives;
monitoring the integrity, effectiveness and consistency of the Authority’s risk management framework, controls and systems;
setting the overall remuneration framework for the Authority and overseeing executive succession planning;
appointing, assessing the performance and setting the remuneration of the CEO, as well as approving the appointment and remuneration of senior management and overseeing their performance;
influencing the corporate culture, ethical standards and reputation of the Authority; and
monitoring the effectiveness of the Authority’s governance practices including overseeing shareholder reporting and engagement as well as compliance with the Authority’s continuous disclosure obligations.
1.3 Skills and Diversity of the Board
As observed in the composition of the Board above, the Act stipulates the appropriate characteristics needed by the Board to maximise its effectiveness and the blend of skills, knowledge and experience necessary for the present and future needs of the Authority. Having a range of different skills, backgrounds, experience and diversity ensures a broad range of viewpoints which facilitates effective governance and decision making.
1.4 The Chairman
The Chairman, Mr Stephen Simelane, is an inde-pendent non-executive director. He has been an independent non-executive director and Chairman of the Authority since 2015. The Chairman’s
overarching responsibilities include:1 providing leadership for the Board, 2 facilitating the effective contribution of all
directors, 3 managing the dynamics of Board discussion, 4 setting the Board agenda and ensuring adequate
time is available for discussion on all agenda items on strategic issues.
5 The Chairman is also responsible for encou-raging constructive relations between directors and between Board and management and promoting the interests of the Authority with all key external stakeholders.
Importantly, the roles of Chairman and CEO of the Authority are not fulfilled by the same person.
1.5 The Board Secretary
The role of the Board Secretary rests with the CEO, as stipulated in the Act. The Board Secretary reports directly to the Board through the Chairman, and all directors have access to the Secretary. The Board Secretary’s role in respect of matters relating to the proper functioning of the Board includes: (a) advising the Board and its Committees on
governance matters, (b) monitoring that Board and Committee
policies and procedures are followed, (c) coordinating all Board business including
the timely despatch of Board and Committee papers,
(d) acting as a point of reference for dealings between the Board and management,
(e) sourcing and retaining independent profes-sional advisors as required,
(f ) helping to organise and facilitate the induction and professional development of directors, and
(g) ensuring proper compliance with relevant statu-tory requirements relating to the Authority’s operations.
1.6 Independence of Directors and Confidentiality Oath
Directors are expected to bring independent views and judgement to the Board’s deliberations. The Board recognises the special responsibility of
14

FINANCIAL SERVICES REGULATORY AUTHORITY (FSRA) Annual Report 2018
CORPORATE GOVERNANCE REPORT - continued
non-executive directors for monitoring executive management and providing independent views. Under the Board Charter, the Board must maintain majority non-executive directors and have a non-executive independent Chairman (with different persons filling the roles of Chairman and CEO).
The Board has determined that, in respect of the 2018 financial year, the Chairman and all non-executive directors are independent of executive management and free of any business or other relationship that could materially interfere with the exercise of unfettered and independent judgement or compromise their ability to act in the best interests of the Authority. The independence of each director is considered on a case by case basis from the perspective of both the Authority and the director. All directors have signed Declaration of Interest Form as well as a Confidentiality Oath.
1.7 Board meetings
The FSRA Act stipulates that the Board shall meet as often as the business of the Authority may require, but not less frequent than once in every two months. A quorum at a meeting shall be five members, including the Chief Executive Officer or
a person acting in that capacity. The Chairperson or, in the absence of the Chairperson, the Deputy Chairperson, shall chair a meeting for the Board. Except as otherwise provided in the Act, decisions of the Board shall be determined by a majority of members present and voting, and in the event of a tie, the person chairing that meeting shall have a casting vote in addition to the deliberative vote.
Directors receive comprehensive papers, via IBoards Software, in advance of the Board meetings. The utilisation of technology in dispatching Board Papers comes with great advantages, such as;
Significant reduction in the use of paper, since there’s no longer need to print bulk papers;
Significant savings in utilisation of ink; and Time savings, since no manpower time is
required to compile, bind and drive around delivering Board Papers.
The savings derived from using IBoards Technology far outweighs the cost of hardware, and software annual license. The Directors also receive regular updates in relation to key management reports, via Board Committees, which are then presented to the Main Board by the Committee Chairmen.
Stephen Simelane
Modern Samketi
Nathie Maseko
Amos Mkhat-shwa
Sabelo Mabuza
Ntsika Fakudze
Nkululeko Dlamini
Main Board 13/13 10/13 13/13 10/13 13/13 13/13 8/13
FAR n/a n/a n/a 13 / 13 12 / 13 n/a 9 / 13
REMCO n/a n/a 14 / 14 n/a 13 / 14 13 / 14 n/a
Legal n/a 5/5 n/a 4/5 n/a 4/5 n/a
The table below indicates the number of meetings conducted in the period 2017/2018
*FAR – Finance, Audit and Risk Committee*REMCO – Remunerations and Appointments Committee*Legal – Legal and Compliance Committee
Board remuneration is in accordance with rates published by the Public Enterprise Unit (PEU).
1.8 Conflict of Interest
Directors are required to avoid conflicts of interest and immediately inform their fellow directors
should a conflict of interest arise. Directors are also required to advise the Authority of any relevant interest that may result in a conflict.
The Board has adopted the use of formal declarations of interests that are tabled at Board meetings where directors disclose any new material
15

FINANCIAL SERVICES REGULATORY AUTHORITY (FSRA) Annual Report 2018
CORPORATE GOVERNANCE REPORT - continued
personal interests or if there is any change in the nature or extent of a previously disclosed interest. This includes a director’s appointment or retirement from boards of other companies. Where a matter in which a director has a material personal interest is being considered by the Board, that director must not be present when the matter is being considered or vote on the matter unless all of the directors have passed a resolution to enable that director to do so or the matter comes within a statutory exception.
1.9 Access to management, information and professional advice
All directors have unrestricted access to the senior executives and other employees of the Authority through the Chairman, or the CEO. Directors may seek briefings from senior executives outside the regular presentations made by senior executives at Board meetings.
Subject to prior consultation with the Chairman, each director may seek independent professional advice at the Authority’s expense to assist the director in the proper exercise of powers and discharge of duties as a director or as a member of a Board Committee. Pursuant to a deed executed by the Authority and each director, a director also has the right to have access to all documents which have been presented to meetings or made available to the Board or any Board Committee whilst in office, including materials referred to in those documents.
1.10 Board and executive performance and remuneration
The Board is committed to a performance culture and to ensuring that a range of formal processes are in place to evaluate the performance of the Board, Board Committees, each director and senior executives.
Management review
The non-executive directors are responsible for regularly evaluating the performance of the CEO
based on specific criteria including the Authority’s business performance, short- and long-term strategic objectives and the achievement of personal objectives that are approved annually.
All executives are subject to an annual performance review. These reviews, involve an executive being evaluated by their immediate superior by reference to their specific performance objectives for the year, including the completion of key performance indicators and contribution to specific business and company plans. This review is aligned to the Authority’s remuneration framework and is considered for, among other things, the purposes of determining any increases to fixed remuneration and outcomes under the Authority’s short term incentive plan.
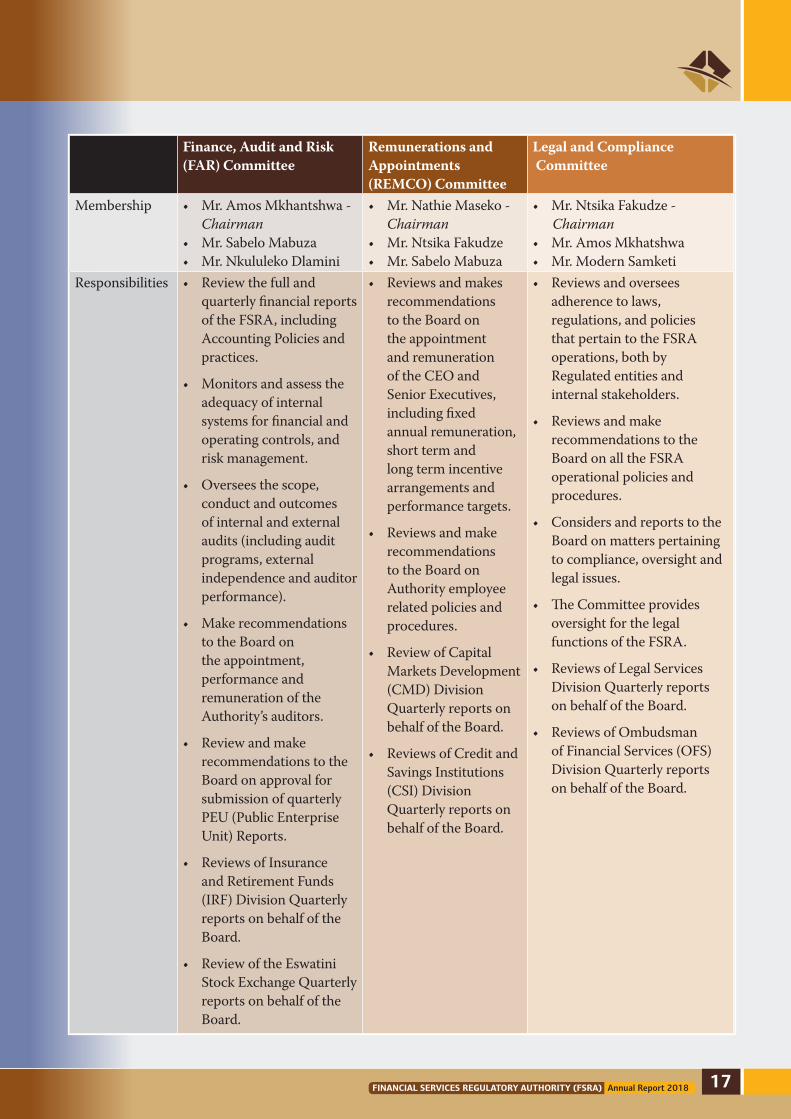
2. Our Board Committees The Board has three standing Committees that play an important role in assisting the Board perform its role and discharge its responsibilities. The following Committees assist the Board by focussing in more detail on specific areas of FSRA’s operations and governance framework: i. Finance, Audit and Risk (FAR) Committee; ii. Remunerations and Appointments Committee
(REMCO); iii. Legal and Compliance (LEGAL) Committee.
Separate charters were approved for each Commi-ttee. The Board Committees, generally, review matters on behalf of the Board and refer matters to the Board for decision with a recommendation from the Committee. The Committee papers, including minutes of meetings, are circulated to the Board members. Additionally, joint Committee meetings are convened where matters overlap and need Committees’ consensus before they are tabled to the main Board.
An overview of the membership, composition and responsibilities of each standing Committee as at the date of this statement is as follows:
16
FINANCIAL SERVICES REGULATORY AUTHORITY (FSRA) Annual Report 2018
Finance, Audit and Risk (FAR) Committee
Remunerations and Appointments (REMCO) Committee
Legal and Compliance Committee
Membership • Mr.AmosMkhantshwa-Chairman
• Mr.SabeloMabuza• Mr.NkululekoDlamini
• Mr.NathieMaseko-Chairman
• Mr.NtsikaFakudze• Mr.SabeloMabuza
• Mr.NtsikaFakudze- Chairman• Mr.AmosMkhatshwa• Mr.ModernSamketi
Responsibilities • Reviewthefullandquarterly financial reports of the FSRA, including Accounting Policies and practices.
• Monitorsandassesstheadequacy of internal systems for financial and operating controls, and risk management.
• Overseesthescope,conduct and outcomes of internal and external audits (including audit programs, external independence and auditor performance).
• Makerecommendationsto the Board on the appointment, performance and remuneration of the Authority’s auditors.
• Reviewandmakerecommendations to the Board on approval for submission of quarterly PEU (Public Enterprise Unit) Reports.
• ReviewsofInsuranceand Retirement Funds (IRF) Division Quarterly reports on behalf of the Board.
• ReviewoftheEswatiniStock Exchange Quarterly reports on behalf of the Board.
• Reviewsandmakesrecommendations to the Board on the appointment and remuneration of the CEO and Senior Executives, including fixed annual remuneration, short term and long term incentive arrangements and performance targets.
• Reviewsandmakerecommendations to the Board on Authority employee related policies and procedures.
• ReviewofCapitalMarkets Development (CMD) Division Quarterly reports on behalf of the Board.
• ReviewsofCreditandSavings Institutions (CSI) Division Quarterly reports on behalf of the Board.
• Reviewsandoverseesadherence to laws, regulations, and policies that pertain to the FSRA operations, both by Regulated entities and internal stakeholders.
• Reviewsandmakerecommendations to the Board on all the FSRA operational policies and procedures.
• ConsidersandreportstotheBoard on matters pertaining to compliance, oversight and legal issues.
• TheCommitteeprovidesoversight for the legal functions of the FSRA.
• ReviewsofLegalServicesDivision Quarterly reports on behalf of the Board.
• ReviewsofOmbudsmanof Financial Services (OFS) Division Quarterly reports on behalf of the Board.
CORPORATE GOVERNANCE REPORT - continued
17

FINANCIAL SERVICES REGULATORY AUTHORITY (FSRA) Annual Report 2018
3. Our Risk Management Practices
Effective assurance and risk management practices help the Authority to achieve its strategic objectives, ensure compliance with its legal obligations and protect the best interests of its stakeholders.
3.1 Integrity of Reporting
The Board and management have established controls that are designed to safeguard the company’s interests and the integrity of its reporting. These include accounting, financial reporting, and other internal control policies and procedures which are directed at monitoring whether the Authority complies with approved policies.
In accordance with standards set by the Board, prior to approval of its financial statements, the Finance, Audit and Risk Committee reviews and provides assurance to the Board that, having made appropriate enquiries, in their opinion;
The financial records of the FSRA have been properly maintained; and
The financial statements comply with the appropriate accounting standards and gives a true and fair view of the financial position and performance of the Authority.
In addition, comprehensive practices have been adopted, in compliance with the Public Procurement Act, to require that:
Capital expenditure, transactions and other commitments above a certain size obtain CEO and Board approval (as required under the Authority’s formal delegation of authority).
Business transactions are properly authorised and executed.
The Authority’s financial statements are subject to an external audit by an independent auditor. The FSRA currently engages PricewaterhouseCoopers (PwC) as its independent external auditors. In accordance with PEU requirements, the Authority is expected to rotate /reappoint Auditors every three years.
The Finance, Audit and Risk Committee is responsible for overseeing the audit process on behalf of the Board.
3.2 Risk Identification and Management
The Board is still in the process of establishing policies for the oversight and management of material business risks and internal controls. The Finance, Audit and Risk Committee has been mandated to oversee the development of policies, internal controls and procedures that the FSRA will use to identify business and regulatory risks. The design and implementation of the risk management and internal controls systems to manage the Authority’s business risks is the responsibility of management.
4. Our Code of Ethics
The FSRA regards integrity and high ethical standards on the part of all its employees as non-negotiable. For that reason, the Authority has adopted a code of ethics and conduct outlining its commitment to society, regulated entities, suppliers and its stakeholders. Employees are required to:a) Desist from involving themselves in any form of
dishonesty.b) Be loyal to the employer, promote its interests
and assist it to achieve its purpose and goals and all business decisions must be made in the best interest of the employer.
c) Perform their duties diligently and in the most effective and efficient manner.
d) Desist from misusing their position to obtain personal benefits on terms which are not available to the general public.
e) Act honestly with integrity at all times towards colleagues, the employer and members of the public.
f) Obtain the employer’s approval before hand if they wish to work for or be associated with another organisation or business where there is conflict with the employer’s business.
g) Not waste the employer’s time, money, or other resources.
h) Not give confidential information about the employer, stakeholders or employees to any other person, or make improper use of it.
i) Use the appropriate channels for making known grievances or complaints they may have.
The FSRA does not tolerate any corrupt or dishonest practice such as bribery and corruption. Employees shall not directly or indirectly request, accept, offer, or grant a personal advantage in connection with a business activity, regardless of whether the other party to the transaction is an individual, company or a government agency.
CORPORATE GOVERNANCE REPORT - continued
18

FINANCIAL SERVICES REGULATORY AUTHORITY (FSRA) Annual Report 2018
CORPORATE GOVERNANCE REPORT - continued
GENERAL OVERVIEW OF THE ECONOMY- ECONOMY OVERVIEW
A small, landlocked kingdom, Eswatini is bordered in the north, west and south by the Republic of South Africa and by
Mozambique in the east. Eswatini depends on South Africa for 60% of its exports and for more than 90% of its imports. Eswatini’s currency is pegged to the South African Rand, effectively relinquishing Eswatini’s monetary policy to South Africa. The government is dependent on customs duties from the Southern African Customs Union (SACU) for 49% of revenue; income tax accounts for 27% and a valued added tax for 19% of revenues. Eswatini is a lower middle income country, but its income distribution is highly skewed, with an estimated 20% of the population controlling 80% of the nation’s wealth.
Subsistence agriculture employs approximately 70% of the population. The manufacturing sector diversified in the 1980s and 1990s, but manufacturing has grown little in the last decade. Sugar and soft drink concentrate are the largest foreign exchange earners. Mining has declined in importance in recent years. Coal, gold, diamond, and quarry stone mines are small scale, and the only iron ore mine closed in 2014. With an estimated 28% unemployment rate, Eswatini’s need to increase the number and size of small and medium enterprises and to attract foreign direct investment is acute. On 1 January 2015, Eswatini lost its eligibility for benefits under the US African Growth and Opportunity Act after failing to meet benchmarks relating to workers’ rights.
19

FINANCIAL SERVICES REGULATORY AUTHORITY (FSRA) Annual Report 2018
The IMF forecasted that Eswatini’s economy will grow at a slower pace in 2017 because of a region-wide drought, which is likely to hurt Eswatini’s revenue from sugar exports and other agricultural products; tourism and transport sectors will also decline. Overgrazing, soil depletion, drought, and floods are persistent problems. Eswatini’s revenue from SACU receipts also are projected to decline in 2017, making it harder for the government to maintain fiscal balance.
Captured from the Minister’s Budget Speech
In March 2018, the Minister of Finance delivered the 2018/2019 Budget Speech. The following write-up is captured from the Minister’s Speech for the benefit of our readers. The Minister highlighted that the widening of the budget deficits without adequate financing is exerting pressures on the domestic economy. Government spending continues to outpace its ability to raise enough revenues resulting in cash flow challenges and accumulation of arrears. The 7 cash flow challenges experienced in 2016/17 continued into 2017/18, and this has negatively affected local businesses. It is therefore, very important that Government restores fiscal sustainability to ensure macroeconomic stability and unlock the country’s potential to place growth on a higher growth path. Increased government recurrent expenditure in the context of severely diminished SACU revenue largely explains the deterioration in the fiscal balance. The widening deficit poses risks to sound public debt management and government’s ability to meet its statutory obligations.
RECENT ECONOMIC PERFORMANCE AND
OUTLOOK
The economic developments, which affected the domestic economy are highlighted as follows.
i) International Developments
The global economy continued to strengthen in 2017. The IMF estimated that global output increased by 3.7 percent in 2017, up from the 3.2 percent estimate for 2016. All major economies across the world contributed to strong growth,
notably, economies in Asia and Europe performed better than initially expected. The 2017 growth for emerging markets and developing countries was 4.7 percent, while advanced economies grew by 2.3 percent.
Global output is expected to maintain the upward momentum experienced in the last two years. Global growth is expected to increase by 3.9 percent annually in 2018 and 2019, respectively. It is expected that this would result in a surge in global investment that will particularly benefit large exporting countries. Furthermore, the U.S. tax reforms are expected to temporarily increase growth in the U.S., an effect that will spill-over to its major trading partners.
ii) Regional Developments
Sub-Saharan Africa grew at a slower pace when compared to other emerging and developing regions in 2017 with GDP growth estimated at 2.7 percent. However, this growth was stronger than the growth rate of 1.4 percent that the region experienced in 2016. The GDP growth rates varied significantly among countries in the region. Oil exporting countries grew at much lower rates relative to non-oil exporting countries mainly due to low oil prices. As these countries continue to recover, growth in the region overall is expected to continue to pick up into 2018 and 2019, at 3.3 percent and 3.5 percent respectively. The South African economy was affected by structural bottlenecks that constrained growth in 2017. The IMF estimates indicate that South Africa’s economy grew by 0.9 percent in 2017 which will be maintained in 2018 and 2019 respectively.
iii) Domestic Developments
Real GDP Growth
The domestic economy is projected to have grown by 1.9 percent in 2017 from 1.4 percent in 2016 mainly benefiting from a faster recovery in crop production on both Swazi Nation Land and individual tenure farms. Maize and sugarcane production in particular, returned to pre-drought production levels. As a result, crop production grew by 17.2 percent in 2017. However, the
ECONOMY REVIEW - continued
20

FINANCIAL SERVICES REGULATORY AUTHORITY (FSRA) Annual Report 2018
livestock population was significantly reduced due to the drought, leading to low output in 2017. Furthermore, there has been a decline in the construction sector as implementation of various construction projects slowed largely due to the current fiscal challenges. On balance, both the primary and secondary sectors grew by 0.7 percent in 2017. The tertiary sector led output growth in 2017, with a projected growth rate of 2.7 percent driven mainly by the wholesale, retail, and the financial services sub sectors.
Economic performance in 2018 is anticipated to be 1.3 percent, followed by an increase to over
2 percent per year in the medium term as the primary and secondary sectors gain from the full recovery of the agriculture sector. The negative risks surrounding the current fiscal challenges will need to be managed effectively to mitigate the impact on growth. In the tertiary sector, growth will be driven by the demand for services to support developments in the primary and secondary sectors.
Inflation
Inflationary pressures eased in 2017 following a tighter monetary policy stance and recovery.
Month 31-Mar-2018 31-Mar-2017 31-Mar-2016 31-Mar-2015 31-Mar-2014April 7,8 8,5 4,9 5,3 5,6May 7,1 8,0 5,4 5,5 5,5June 6,9 7,5 5,7 5,3 5,6July 6,7 7,4 4,9 6,2 6,0August 5,9 8,0 4,8 6,0 5,9September 5,4 8,3 4,5 6,2 5,7October 5,4 8,2 4,6 6,3 4,7November 4,9 8,6 4,5 6,6 4,4December 4,7 8,7 4,9 6,2 4,4January 4,6 8,2 5,6 5,6 4,7February 4,0 6,8 7,3 5,0 4,7March 4,0 6,0 7,8 4,7 5,1Annual Average 5,6 7,9 5,4 5,7 5,2
Eswatini Inflation Trends for the Past Five Years
AprilM
ayJu
neJu
ly
August
Septe
mber
October
November
Decem
ber
Januar
y
Febru
ary
Mar
ch
INFL
ATIO
N R
ATE
S
10,0
9,0
8,0
7,0
6,0
5,0
4,0
3,0
2,0
1,0
0,0
8,5
7,0
5,65,34,9
8,0
7,1
5,45,5
7,5 7,48,0
8,3 8,28,6 8,7
8,2
7,36,8
5,04,74,0 4,0
4,75,1
6,0
7,0
5,6
4,74,6
6,2
4,94,74,4
6,6
4,94,54,4
6,3
5,44,74,6
6,25,75,4
4,5
5,95,96,0
4,8
6,76,26,0
4,9
6,9
5,75,65,3
31-Mar-14 31-Mar-15 31-Mar-16 31-Mar-17 31-Mar-18
Eswatini Inflation Trends for the Past Five Years
ECONOMY REVIEW - continued
21

FINANCIAL SERVICES REGULATORY AUTHORITY (FSRA) Annual Report 2018
Inflation figures over the past 5 years show a drastic decline in inflation rates. When looking at the current financial year alone, inflation rate was 8.5% in April 2017, and closed with 4% on 31 March 2018. The decline in the inflation rate means that the price of Eswatini goods are increasing at a slower rate than before, and because the trend has remained almost flat from month to month, it means prices will change less frequently, and firms can spend less time and energy updating prices. When inflation falls to a very low rate, then real interest rates can be higher than predicted. This increases the real debt burden of citizens and can lead to slower economic growth.
Balance of Payments
Preliminary figures indicate that the current account recorded a surplus of E8.6 billion in 2017, however, declining from the E9.5 billion registered in 2016. Our export earnings in 2017 amounted to E24.1 billion, showing a marginal decline of 1.3 percent compared to the E24.4 billion in 2016. The financial account posted a deficit of E7.2 billion in 2017 from a surplus of
E8.5 billion in 2016. The deficit in the financial account was due to a net decline in Foreign Direct Investment coupled with net increases in foreign portfolio assets and “other investment” assets.
Real Gross domestic product in constant prices growth rate
In 2018, real GDP growth for Eswatini was 0.2%. Though Eswatini real GDP growth fluctuated substantially in recent years, it tended to decrease through 1999 - 2018 period ending at 0.2 % in 2018.
What is real GDP growth?
Real GDP growth represents annual percentage growth rate of GDP at market prices, based on constant local currency. GDP is the sum of gross value added by all resident producers in the economy plus any product taxes and minus any subsidies not included in the value of the products. It is calculated without making deductions for depreciation of fabricated assets or for depletion and degradation of natural resources.
ECONOMY REVIEW - continued
22
PE
RC
EN
TAG
E
20
17.5
15
12.5
10
7.5
5
2.5
0
-2.5
-51980 1982 1984 1986 1988 1990 1992 1994 1996 1998 2000 2002 2004 2006 2008 2010 2012 2014 2016 2018
ESWATINI REAL GDP GROWTH

FINANCIAL SERVICES REGULATORY AUTHORITY (FSRA) Annual Report 2018
ECONOMY REVIEW - continued
CEO’S REVIEW- STRATEGIC REVIEW
D uring the year under review, the FSRA embarked on its Strategy development exercise. The Authority aims to achieve
its strategic goals within the strategic period of 1 April 2018 to 31 March 2021.
Our Mission is to be an effective regulator, which is supported by harmonised legislation, efficient processes, and operating in a low risk environment by 2021.
Strategic Focus Areas
In order to ensure relevance of the FSRA to its stakeholders, we developed three (3) strategic focus areas, namely:
High performance organisation Risk responsive environment Conducive Legislation
STRATEGIC PROJECTS
HighPerformanceOrganisation
Risk ResponsiveEnvironment
ConduciveLegislation
23

FINANCIAL SERVICES REGULATORY AUTHORITY (FSRA) Annual Report 2018
CEO’s REVIEW - continued
1
PROJECT
To integrate our core processes to effectively regulate and supervise the financial services industry.
2
PROJECT
To achieve a working environment that attracts and retains people who reflect the values of the FSRA.
3
PROJECT
To create a low risk financial service provider environment for effective supervision.
4
PROJECT To have a harmonised regulatory framework that will
enable the FSRA to effectively regulate and supervise the financial sector.
STRATEGIC PROJECTS
To achieve the above focus areas, we have identified four strategic projects:
At the FSRA, the Board of Directors owns the strategy, while the Executive team executes it. Our plan is to achieve our strategic goals, within a strategic period, which will begin on 01 April 2018, and will end on 31 March 2021. In so doing, we aim to fully develop our systems and infrastructure, within this time frame. We will achieve this goal, through the strategic programmes, and process targets, as set out in the Strategy document.
Prior to crafting our strategy, we first defined our core business process. This gave us a nodal point from where we could analyse our strengths; weaknesses; opportunities; and threats. In our task to regulate and supervise financial services within Eswatini, a precis of our core process is as follows:
24

FINANCIAL SERVICES REGULATORY AUTHORITY (FSRA) Annual Report 2018
CEO’s REVIEW - continued
From this process, the FSRA’s primary concern is to licence and monitor financial services providers. Moreover, where problems or conflicts arise, the Authority must remedy such to ensure that the financial system of Eswatini is safe and stable. This is our primary task. To support this task, the Authority must also continuously manage good relations with our stakeholders, and we must review and propose legislation that will enable this task.
To express the Authority’s primary task, we have created a mission that will enable our processes, and a vision that will drive our strategy. And to understand this task, we have created a process construct that clearly indicates how our core processes interact with each other. Further to this, we have also developed values that will direct our behaviour.
To drive our strategy, we have created a strategic ladder that we refer to as the V5 system. This system will show how we aim to achieve our ultimate vision; and, it also indicates what our super goal is, for this strategic period.
To put our mission, and vision into action, we pose four strategic programmes, and ten operational targets. We view our strategic programs, as the non-repetitive action that we must take, to stay relevant. We run and measure these programmes
through project management methods. Our operations, on the other hand, are the repetitive action that we must take to perform efficiently. To measure these operations, we have created core targets. Also, we have quantified these targets so that they show the capacity with which we aim to run our processes. Therefore, we have split our strategic initiative from our current operational action. To measure and monitor our strategy we have created a strategic scorecard where we can view our progress without effort.
To stay relevant, we have opted to engage in a rolling strategy, as opposed to a static one. This means that our goal will stay permanent, but that we will engage in different projects to achieve this goal. These projects have different durations, and will be completed at different time intervals. And if our stakeholders demand so, we will close current projects, and engage in new ones. Our three-year goal is to be an effective regulator, which is supported by harmonised legislation; efficient processes; and operating in a low risk environment by 2021. We will do what it takes to achieve this. Whilst we complete our strategic programmes, we will constantly work to achieve our operational process targets. In this way we will stay relevant, whilst we optimally perform.
Stakeholder Relations
Legislative Review
License Monitor Remedy
25
FINANCIAL SERVICES REGULATORY AUTHORITY (FSRA) Annual Report 2018
CHIEF EXECUTIVE OFFICER’S REVIEW - continued
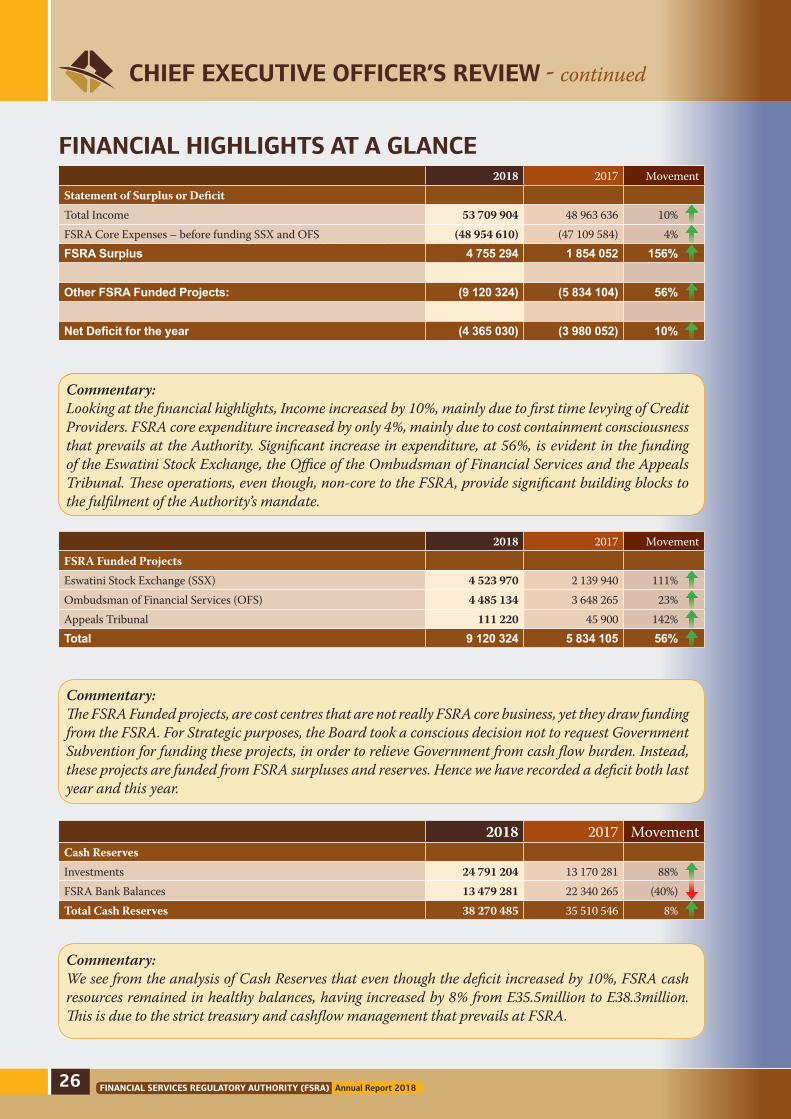
FINANCIAL HIGHLIGHTS AT A GLANCE
2018 2017 MovementFSRA Funded ProjectsEswatini Stock Exchange (SSX) 4 523 970 2 139 940 111%Ombudsman of Financial Services (OFS) 4 485 134 3 648 265 23%Appeals Tribunal 111 220 45 900 142%Total 9 120 324 5 834 105 56%
2018 2017 MovementCash ReservesInvestments 24 791 204 13 170 281 88%FSRA Bank Balances 13 479 281 22 340 265 (40%)Total Cash Reserves 38 270 485 35 510 546 8%
2018 2017 MovementStatement of Surplus or DeficitTotal Income 53 709 904 48 963 636 10%FSRA Core Expenses – before funding SSX and OFS (48 954 610) (47 109 584) 4%FSRA Surplus 4 755 294 1 854 052 156%
Other FSRA Funded Projects: (9 120 324) (5 834 104) 56%
2018 2017 MovementStatement of Surplus or DeficitTotal Income 53 709 904 48 963 636 10%FSRA Core Expenses – before funding SSX and OFS (48 954 610) (47 109 584) 4%FSRA Surplus 4 755 294 1 854 052 156%
Other FSRA Funded Projects: (9 120 324) (5 834 104) 56%
Net Deficit for the year (4 365 030) (3 980 052) 10%
Commentary:Looking at the financial highlights, Income increased by 10%, mainly due to first time levying of Credit Providers. FSRA core expenditure increased by only 4%, mainly due to cost containment consciousness that prevails at the Authority. Significant increase in expenditure, at 56%, is evident in the funding of the Eswatini Stock Exchange, the Office of the Ombudsman of Financial Services and the Appeals Tribunal. These operations, even though, non-core to the FSRA, provide significant building blocks to the fulfilment of the Authority’s mandate.
Commentary:The FSRA Funded projects, are cost centres that are not really FSRA core business, yet they draw funding from the FSRA. For Strategic purposes, the Board took a conscious decision not to request Government Subvention for funding these projects, in order to relieve Government from cash flow burden. Instead, these projects are funded from FSRA surpluses and reserves. Hence we have recorded a deficit both last year and this year.
26
Commentary:We see from the analysis of Cash Reserves that even though the deficit increased by 10%, FSRA cash resources remained in healthy balances, having increased by 8% from E35.5million to E38.3million. This is due to the strict treasury and cashflow management that prevails at FSRA.

FINANCIAL SERVICES REGULATORY AUTHORITY (FSRA) Annual Report 2018
CHIEF EXECUTIVE OFFICER’S REVIEW - continued
27
Operating Highlights
Since the FSRA was founded in 2006 (first as the Office of the Registrar of Insurance and Retirement Funds (RIRF)), we’ve seen first hand the speed and breadth of change in the Financial Services Sector. We have learned the importance of adaptability. As a matter of operating philosophy, we seek to make continuous improvement an integral part of our organisational culture.
That is why, across the Authority, we are accele-rating the development of systems and processes, capabilities and solutions for our stakeholders, especially our regulated entities and consumers of financial services products. In so doing, we believe we can improve the way we approach regulation and deliver regulatory value to all stakeholders.
Human Capital
Our people are at the heart of what we do, and we recognise that our investment in them, along with instilling a positive culture, leads to better business outcomes. That is why the authority and Board has spent quality time during the year, reviewing the Staff terms and conditions of service, as well all other staff related policies as follows:
Recruitment and Selection Policy and Procedure; Education, Training and Development
Policy and Procedure; Health and Safety Policy and Procedure Code of Ethics; Disciplinary Code and Procedure; Incapacity Counselling Policy and
Procedure; Grievance Procedure; Sexual Harassment Policy and
Procedure.
In the year under review, we continued to implement a range of initiatives to support a culture that values performance, innovation, professional development, flexibility and wellbeing.
Manager Development Programmes
At FSRA, we recognise that effective leadership is key to building a positive culture and strong employee engagement, so in the year under review, all our Managers successfully enrolled and graduated for Manager Development Programmes offered by Wits Business School and Stellenbosch Business School.
Encouraging Lateral Movement
As an integrated business, and as a retention strategy, the FSRA offers huge scope for people to make lateral moves within the Authority whenever vacancies become available. A few staff members took advantage of this opportunity during the year.
Employee Engagement
Measuring our employee engagement gives the Authority a valuable insight into the quality of our workplace and culture, and helps us to better understand how we can continue to create a positive work environment for our people.
During the year under review, and as part of our employee engagement objective, an employee survey was conducted. The results of some of the variables that were measured are demonstrated in the charts below:
Personal Growth
Question 1. What attracted them to join the FSRA?
Most participants cited opportunities for growth as the attracting factor to the organisation. 35% of the respondents mentioned they were attracted by the potential of growth opportunities and/or career advancement for themselves. The industry and organisational culture of the Authority follows at 28% and 14%, respectively. A relatively small 3% of the respondent cited passion as an attraction to the FSRA. Overall, the response generated were positive for this question.

FINANCIAL SERVICES REGULATORY AUTHORITY (FSRA) Annual Report 2018
Question 2. How happy are you with working for the FSRA?
Generally, FSRA employees are happy. 50% of the respondents indicated that they are happy whilst only over 6.7% are very happy. 23.3% of the respondents are somewhat happy. When combined these figures display an 80% level of contentment with working for the FSRA
compared to a paltry 20% of unhappy and somewhat unhappy respondents. There is a positive ambience amongst personnel of the Authority and it can be concluded that the staff morale is high. Literature review suggest that the level of happiness of employees is directly linked to their productivity. Figure 2 shows a graphical representation of the happiness level of the Authority’s employees.
CHIEF EXECUTIVE OFFICER’S REVIEW - continued
FIGURE 1: MAIN ATTRACTING FACTORS
FIGURE 2: HAPPINESS LEVEL OF RESPONDANTS
Salary3%
Nature of Work 10%
Industry 28%
Organisational Culture 14%
Position3%
Growth Opportunities/
Career Advancement
35%
Happy50%
Great Team7%
Very Happy7%
Unhappy10%
Somewhat Unhappy
10%
Somewhat Happy
23%
28

FINANCIAL SERVICES REGULATORY AUTHORITY (FSRA) Annual Report 2018
From the chart above you can deduce that there is a small clique of employees who are unhappy, and this represent a small fraction of the Authority employees. With the necessary retention, wellness strategies or policies such can be changed.
Question 3. Do you feel you receive adequate training to help you in your scope of work?
The Education and Training policy clearly spells out the terms of training to be afforded to employees of the Authority. As per the respondent’s views, 46.7% feel they receive adequate training whilst a slightly less 33.3% feel the training provided is inadequate in helping them in their scope of work. 20 % of the respondents elected to remain neutral.
Since the Authority spends over 10% of its entire budget on conferences and training, it is apparent that emphasis have been placed on the importance of continuous development. However, by virtue of the 33.3% who feel they receive inadequate training there needs to be an even balance on how the training provided is structured and evaluated for effectiveness.
Emphasis should be placed on upskilling junior or entry officers in order to fully develop their skills. In essence, training employees will reinforce their sense of value. The nature of training availed by the Authority could achieve employee satisfaction and a higher retention rate for the Authority. Below is a chart representation of the respondent’s responses.
Employee Satisfaction
Question 4. Is there anything in particular that you like most about working here?
From the below chart we can deduce that the nature of job is what employees like most about
working here at the FSRA. The nature of work at 68% is an important component in the retention of employees. The respondents mentioned training, experience and exposure, opportunity of career advancement which are factors that the Authority must ensure are availed going forward.
CHIEF EXECUTIVE OFFICER’S REVIEW - continued
FIGURE 3: ADEQUATE TRAINING BAROMETER
Yes 47%
May be20%
No33%
29

FINANCIAL SERVICES REGULATORY AUTHORITY (FSRA) Annual Report 2018
FIGURE 5: RESPONDANTS ON WHAT THEY LIKE MOST ABOUT WORKING FOR THE AUTHORITY
FIGURE 6: MOTIVATIONAL FACTORS TO GO ABOVE YOUR SCOPE OF WORK
CHIEF EXECUTIVE OFFICER’S REVIEW - continued
Question 5: What can motivate you to go above and beyond your scope of work here at the FSRA?
Simply said, most employees require increased pay for them to go above and beyond their scope of work. 93% of the respondent answered this question. A lesser
percentage just require recognition for work done which can serve as motivation enough for them. It is crucial that supervisors and managers understand the importance of showing appreciation to one’s work. A simple thank you or well done means a lot to an employee.
Nature ofWork68%
Perks8%
Staff and Relations
22%
MonetaryIncentives
49%
Recognition31%
Growth, Trainingand Environment
20%
30

FINANCIAL SERVICES REGULATORY AUTHORITY (FSRA) Annual Report 2018
CHIEF EXECUTIVE OFFICER’S REVIEW - continued
Compensation
Question 6. Hypothetically, if you were to resign / leave FSRA tomorrow what would be the main reason?
This was the crux of the survey. The main reason solicited here is a factor and forms the basis of
which the retention strategy ought to address. 97% of the respondents attempted this question. The two main factors cited as reason for leaving the Authority were dissatisfaction with pay and career advancement. See below a chart of the results.
Evidently, the two main factors contributing to employee turnover is the lack of career advancement / promotion and dissatisfaction with pay. These two are inter-related. Career advancement or promotion comes with an improved pay whilst dissatisfaction with pay is self-explanatory. Combined this adds up to 72.4% of monetary related hence it being the
two absolute factors for employees resigning or leaving FSRA. It seems the Authority needs to timely address or adjust the pay scale. The Authority should also consider creating growth opportunities for its employees. The good news is that the Board has already commissioned a Job Evaluation and Salary review exercise in response to the high turnover problem.
FIGURE 7: MAIN REASON FOR RESIGNING OR LEAVING THE AUTHORITY’S EMPLOY
Dissatisfaction with benefits package
4%
Career advancement/promotion
41%
Dissatisfaction with pay
39%
Dissatisfaction with Management
3%
Nature of job/job satisfaction
4%
Insufficient Challenge4%
Work environment
3%
UnsolicitedOffer 4%
31

FINANCIAL SERVICES REGULATORY AUTHORITY (FSRA) Annual Report 2018
Information and Communication Technology (ICT)
Bank Supervision Application (BSA) System
In order to improve the usage of the Electronic Regulatory System (BSA) by the regulated entities and FSRA staff, the Authority received a two weeks training from a BSA Consultant, Mr. Samuel Mwale from the Reserve Bank of Zimbabwe. The training was also meant to sensitise staff on the features of the new version of BSA, version 4.0 and what to expect from it and to further enable them to use the current version to produce the reports needed on the non-bank financial sector when needed.
Legislative Highlights
SACCO Bill, 2018
The leading consultant who had been engaged to develop the SACCO Policy and the SACCO Bill returned to the country to present both documents to the industry and other stakeholders. Mr. Dave Grace from Dave Grace and Associates conducted a stakeholder workshop on 28 February 2018 at Royal Villas where the SACCO policy and Bill were discussed extensively, and a lot of progress was made. The deadlines for sending comments and reviews on these documents was 14 March 2018. These were incorporated into the final draft of the SACCO Bill which is currently with the Microfinance Unit: Centre for Financial Inclusion (CFI).
Insurance (Amendment) Regulations
The Authority has drafted the Insurance (Amendment) Regulations which aim to increase the local investment criteria for insurers from 30% to 50%. The amendments were sent to the industry for comments and the industry was given the 9th February 2018 as the deadline for submission of comments. Comments received are now being incorporated into the final draft regulations.
The amendments apply to both the short-term and the long-term insurers.
Retirement Funds (Amendment) Regulations
The Authority has drafted the Retirement Funds (Amendment) Regulations. These regulations aim to increase the local investment criteria for retirement funds from 30% to 50%. The regulations were sent to the industry for comments and the industry was given the 9th February 2018 as the deadline for submission of comments. Comments received are being incorporated into the final draft rules regulations
Building Societies (Amendment Bill)
The object of the Bill is to amend the Building Societies Act, 1962 in order to provide for the conversion of a Building Society into a Company incorporated in terms of the Companies Act, 2009, and to provide for incidental matters. The Authority has received the copy of the Bill and is in the process of compiling comments to the Bill for onward transmission to the Ministry of Finance.
Securities Exchange Rules 2018
The Authority is involved in the drafting and finalising the Securities Exchange Rules 2018. The rules are expected to come into operation on the 1 April 2018.
Local, Regional and International Cooperation
Local CooperationMoU with the National Industrial Corporation of Eswatini (NIDCS)
The Authority has received a request from the National Industrial Corporation of Eswatini (NIDCS) to enter into a Memorandum of Understanding (MoU). The objective of NIDCS is to contribute to the sustainable economic development through investing
CHIEF EXECUTIVE OFFICER’S REVIEW - continued
32

FINANCIAL SERVICES REGULATORY AUTHORITY (FSRA) Annual Report 2018
in projects that are economically and financially viable. The parties to the MOU will collaborate and cooperate with each other in supporting fund raising initiatives for economically viable projects.
Participation in Financial Sector Development Implementation Plan
The FSRA is part of the Financial Sector Development Implementation Plan (FSDIP). During the year under review working group meetings were held and FSRA staff members participated in the meetings.
Anti-Money Laundering National Risk Assessment (NRA)
The FSRA also participates in the NRA by reviewing the regulated sectors’ exposure to money laundering and the controls that the sector has in place to mitigate their exposure and vulnerability to money laundering. As at 31 March 2018, the Authority had submitted a draft report on our sector’s exposure to money laundering to the AML Task Force.
International Cooperation
IMF First Initiative Technical Assistance
During the year under review, the FSRA received the approval of Technical Assistance, themed IMF- First Initiative Strengthening the Supervision of the NBFIs.
The purpose of the technical assistance (TA) project is to develop the capacity of the FSRA to effectively regulate and supervise the non-bank financial institutions (NBFIs) sector in Eswatini, with a view to ensuring its stability and that of the entire financial system.
In more specific terms, the aim of the proposed project is to assist the FSRA to achieve its mandate, in accordance with the Financial Services Regulatory Authority Act, 2010 (FSRA Act) of ensuring the soundness and stability of the NBFI sector by enhancing risk-focused supervision in three industry
subsectors: insurance and retirement funds (IRFs); capital market institutions (CMIs); and credit and savings institutions (CSIs).
Through ensuring the stability of the NBFI sector, the project also aims to lay the basis for the further development of the sector and contribute to expanding financial inclusion in Eswatini, and in that context, it is closely aligned with Eswatini’s Financial Sector Development Implementation Plan (FSDIP) 2017 – 2019. It is intended that the project will support the FSRA to implement its component of the FSDIP.
IOSCO (International Organisation of Securities Commissions) Self-Assessment
Following the admission of the FSRA as an Associate member of IOSCO, the IMF is assisting the FSRA to achieve ordinary membership status. The FSRA self-assessment with the 38 IOSCO principles is still in progress and a final report is due to be presented to the Assessment committee in December 2018.
Participation in the IAIS (International Association of Insurance Supervisors) Accounting and Audit Working Group
The Authority has deployed a staff member who actively participates in the mandate of the IAIS Accounting and Audit Working Group (AAWG). The AAWG is responsible for: The IAIS’ external relationships with Account-
ing and Auditing bodies around the world. Monitoring relevant developments in inter-
national accounting, auditing, financial reporting or valuation requirements and in public disclosures made by insurers and more widely.
Preparing comment letters and other papers to external bodies in relation to the above, for approval by the Policy Development Committee.
Developing, updating or providing input into the development or updating of IAIS high-level principles-based supervisory and supporting material relevant to:o accounting of insurance companies;
CHIEF EXECUTIVE OFFICER’S REVIEW - continued
33

FINANCIAL SERVICES REGULATORY AUTHORITY (FSRA) Annual Report 2018
o auditing of insurance companies;o valuation for solvency purposes;o audit assurance required for information provided to insurance supervisors;o reporting to supervisors; ando public disclosures of insurers.
Looking Ahead
The major highlight when looking ahead will impact the Insurance Companies in as far as changes in International Financial Reporting Standards for Insurance Accounting is concerned. On 18 May 2017, the International Accounting Standards Board (IASB or Board) issued IFRS 17 Insurance Contracts (The Standard). The Standard will be first applied for reporting periods starting on or after 1 January 2022. IFRS 17 represents the most significant change to Insurance Accounting requirements in over 20 years – it demands a complete overhaul of insurers’ financial statements.
This major change to implement IFRS 17 will extend beyond the finance and actuarial functions of insurers — with a large impact across Data, Systems and Processes (DSP). Its business impacts need to be understood and communicated to a wide range of internal and external stakeholders. Given the scale of this change, investors and other stakeholders will want to understand the likely impact as early as possible. Different jurisdictions around the globe are busy preparing for the implementation of IFRS 17. The FSRA will be initiating an urgent action plan for Eswatini and SADC Committee of Insurance, Securities, and Non-Bank Financial Authorities towards the preparation for implementation of IFRS 17.
RECOMMENDED ACTION PLAN
1. Organise Internal IFRS 17 training for all Insurance regulatory staff to sensitise them on extensive reporting changes coming with the Standard.
2. Design (at CISNA level) a survey targeting to receive responses from Insurance Companies, Actuaries, and Auditors on level of awareness of the standard and preparatory work being done on the ground.
3. Conduct compulsory extensive regional trainings focusing on getting Insurers, Actuaries, and auditors up to speed with IFRS 17.
4. At FSRA design IFRS compliant reporting returns forms, in conjunction with Capital Adequacy Requirements forms.
5. Recommend an IFRS 17 Working group for CISNA to track progress by member countries.
SANDILE DLAMINI (MR)
Chief Executive Officer
CHIEF EXECUTIVE OFFICER’S REVIEW - continued
34

FINANCIAL SERVICES REGULATORY AUTHORITY (FSRA) Annual Report 2018
FACTS AND FIGURES - DASHBOARDCHIEF EXECUTIVE OFFICER’S REVIEW - continuedN
ON
-BA
NK
ING
FIN
AN
CIA
L IN
STIT
UT
ION
S vs
TO
TAL
FIN
AN
CIA
L SY
STE
M A
SSE
TS
AS
AT
31
MA
RC
H
20
1820
1720
1620
1520
14G
DP
Estim
ate
55 2
70 0
00 0
0061
740
000
000
56 2
18 9
05 4
72 5
4 92
0 40
2 82
0
53 5
80 8
80 8
00
NO
N-B
ANK
ING
FIN
ANC
IAL
INST
ITU
TIO
NS
(NBF
Is)
67 4
78 5
89 3
7663
086
959
423
59 4
21 1
77 8
07 4
9 85
0 49
6 25
6 4
5 43
8 61
0 58
1
EXC
LUD
ING
CIS
– A
SSET
S U
ND
ER M
AN
AG
EMEN
T 41
712
031
265
39 7
40 5
23 5
0336
439
203
478
30 3
59 7
51 2
8228
493
615
553
Retir
emen
t Fun
ds28
145
849
255
27 2
63 8
77 1
0625
550
918
962
22
319
605
062
20
442
962
359
Lo
ng te
rm In
sura
nce
3 90
8 63
3 63
33
724
220
329
3 30
4 42
6 11
4
2 5
67 7
05 1
86
2
359
953
026
Sh
ort t
erm
insu
ranc
e91
0 15
5 08
399
5 86
1 77
461
9 29
3 20
7
28
3 79
8 03
4
29
7 44
8 16
8 Ca
pita
l Mar
kets
Inst
itutio
ns35
1 67
5 29
435
1 67
5 29
431
2 78
7 19
5D
ATA
NO
T Y
ET C
OLL
ECT
EDCo
llect
ive I
nves
tmen
t Sch
emes
(CIS
) – A
UM
/AUA
25 7
66 5
58 1
1123
346
435
920
22 9
81 9
74 3
29 1
9 49
0 74
4 97
4
16 9
44 9
95 0
28
SACC
Os
1 46
8 00
3 00
01
318
164
000
1 17
8 58
1 00
0
75
2 62
4 00
0
1 0
23 8
07 0
00
Cred
it on
ly in
stitu
tions
4 57
1 14
3 00
03
859
288
000
3 49
1 96
0 00
0
2 6
44 4
71 0
00
2
643
597
000
Bu
ildin
g So
ciet
ies
2 35
6 57
2 00
02
227
437
000
1 98
1 23
7 00
0
1 7
91 5
48 0
00
1
725
848
000
CO
MM
ERC
IAL
AN
D D
EVEL
OPM
ENT
BA
NK
S21
500
000
000
18 3
00 0
00 0
0015
800
000
000
12
770
591
000
13
437
973
000
FIN
AN
CIA
L R
EGU
LATO
RS
10 1
85 3
44 2
1810
184
844
769
10 2
52 7
65 8
24
9 41
3 94
5 80
1
9 26
6 11
9 93
9 Ce
ntra
l Ba
nk o
f Es
wat
ini (
CBS
)10
128
352
000
10 1
28 3
52 0
0010
192
107
000
9
366
311
000
9 2
23 4
78 0
00
Fina
ncia
l Ser
vice
s Reg
ulat
ory A
utho
rity (
FSRA
)56
992
218
56 4
92 7
6960
658
824
47
634
801
42
641
939
TOTA
L FI
NA
NC
IAL
SYST
EM99
163
933
594
91 5
71 8
04 1
9285
473
943
631
72
035
033
057
68
142
703
520
EXC
LUD
ING
CIS
– A
UM
(to
avoi
d do
uble
coun
ting)
73 3
97 3
75 4
8368
225
368
272
62 4
91 9
69 3
0252
544
288
083
51 1
97 7
08 4
92N
on-B
ank
Ass
ets a
s a %
of T
otal
Fin
anci
al S
yste
m56
%58
%58
%58
%56
%N
on-B
ank
Ass
ets a
s a %
of G
DP
75%
64%
65%
55%
53%
35

FINANCIAL SERVICES REGULATORY AUTHORITY (FSRA) Annual Report 2018
RE
GU
LAT
ED
IN
DU
STR
IES
RE
QU
IRIN
G 3
0%
LO
CA
L IN
VE
STM
EN
TS
- LO
CA
L V
S FO
RE
IGN
ASS
ET
S
RET
IREM
ENT
FU
ND
S20
1820
1720
1620
1520
14To
tal l
ocal
inve
stm
ents
11 9
10 3
18 2
2110
232
879
796
8 48
0 17
9 30
47
299
822
198
6 38
1 98
5 76
3To
tal f
orei
gn in
vest
men
ts15
930
698
998
16 7
13 0
11 3
8716
828
812
214
15 5
41 8
43 9
44
14 4
18 0
98 1
16
Tota
l Inv
estm
ents
(E)
27 8
41 0
17 2
1926
945
891
183
25 3
08 9
91 5
1822
841
666
142
20 8
00 0
83 8
79
LON
G T
ERM
INSU
RA
NC
E20
1820
1720
1620
1520
14
Tota
l loc
al in
vest
men
ts1
304
686
798
1 55
6 63
8 74
343
8 61
7 92
329
2 42
9 07
8
3
14 2
59 0
40
Tota
l for
eign
inve
stm
ents
2 44
8 68
0 20
21
785
995
146
2 71
8 63
9 24
52
275
276
108
2
045
693
986
To
tal I
nves
tmen
ts (E
)3
753
367
000
3 34
2 63
3 88
93
157
257
168
2 56
7 70
5 18
62
359
953
026
SHO
RT
TER
M IN
SUR
AN
CE
2018
2017
2016
2015
2014
Tota
l loc
al in
vest
men
ts46
5 86
4 13
538
0 83
5 77
420
4 33
7 07
227
7 09
5 24
318
4 26
2 84
9To
tal f
orei
gn in
vest
men
ts94
728
905
337
535
161
161
114
811
74 2
77 8
0418
4 34
4 70
5 To
tal I
nves
tmen
ts (E
)56
0 59
3 04
071
8 37
0 93
536
5 45
1 88
335
1 35
3 04
736
8 60
7 55
4
FACTS AND FIGURES - DASHBOARD - continued
36

FINANCIAL SERVICES REGULATORY AUTHORITY (FSRA) Annual Report 2018
FACTS AND FIGURES - DASHBOARD - continued
TO
TAL
30
% L
OC
AL
INV
EST
ME
NT
S -
LOC
AL
VS
FO
RE
IGN
ASS
ET
SIn
acc
orda
nce
with
Insu
ranc
e A
ct a
nd R
etir
emen
t Act
TO
TAL
2018
2017
2016
2015
2014
Tota
l loc
al in
vest
men
ts13
680
869
154
12 1
70 3
54 3
139
123
134
299
7 68
9 52
6 51
96
880
507
652
Tota
l for
eign
inve
stm
ents
18 4
74 1
08 1
0518
836
541
694
19 5
47 4
51 4
5917
891
397
856
16
648
136
807
To
tal I
nves
tmen
ts (E
)32
154
977
259
31 0
06 8
96 0
0728
670
585
758
25 7
60 9
24 3
7523
528
644
459
% Lo
cal i
nves
tmen
ts to
tota
l inv
estm
ents
43%
39%
32%
31%
29%
% Fo
reig
n in
vest
men
ts to
tota
l inv
estm
ents
57%
61%
68%
69%
71%
Tota
l Inv
estm
ents
(%)
100%
100%
100%
100%
100%
TO
TAL
50
% L
OC
AL
INV
EST
ME
NT
S -
LOC
AL
VS
FO
RE
IGN
ASS
ET
SIn
acc
orda
nce
with
the
Secu
ritie
s Act
ASS
ETS
UN
DER
MA
NA
GEM
ENT
2018
2017
2016
2015
2013
Tota
l loc
al in
vest
men
ts8
629
967
433
11 2
09 2
98 1
812
808
163
837
Tota
l for
eign
inve
stm
ents
17 1
36 5
90 6
7812
143
406
363
19 1
73 8
10 4
92D
ATA
NO
T Y
ET R
EPO
RTED
To
tal I
nves
tmen
ts (E
)25
766
558
111
23
346
435
920
22 9
81 9
74 3
29
% Lo
cal i
nves
tmen
ts to
tota
l inv
estm
ents
33%
48
%12
%
%
Fore
ign
inve
stm
ents
to to
tal i
nves
tmen
ts67
%52
%78
%
To
tal I
nves
tmen
ts (%
)10
0%10
0%10
0%
37

FINANCIAL SERVICES REGULATORY AUTHORITY (FSRA) Annual Report 2018
1. Total Retirement Funds Industry
As at 31 March 2018, the retirement funds industry assets were valued at E27.9 billion, 42 per cent of these were invested locally while 58 percent of the assets were still invested in the foreign markets.
2. Long Term Insurance Companies
As at 31 March 2018, the insurance industry held assets of E3.7 billion and liabilities of E3.3 billion, the ratio of assets to liabilities was 1.12 indicating that the industry was financially sound. Premiums underwritten across the industry were valued at E662 million during the year and claims of E547 million were paid out during the year.
3. Short Term Insurance Companies
As at 31 March 2018, the insurance industry held assets of E910 million and liabilities of E497 million, the ratio of assets to liabilities was 1.83 indicating that the industry was financially sound. Premiums underwritten across the industry were valued at E631 million during the year and claims of E213 million were paid out during the year.
4. Total Credit Providers Assets
Total asset value for credit providers stood at E4.6 billion on 31 March 2018, a 17% increase from E3.9 billion in March 2017.
5. Savings and Credit Cooperative Societies (SACCOs)
Total SACCO assets increased from E1.3 billion on 31 March 2017 to E1.5 billion on 31 March 2018. The SACCOS subsector is highly concentrated with the top 17 SACCOs with assets above E10 million, holding 94% of the sub-sector assets.
6. Total Building Society Assets
The Eswatini Building Society had assets worth E2.4 Billion on 31 March 2018, a 9% increase from 31 March 2017 assets which were worth E 2.2 billion.
7. Capital Markets Institutions
Collective Investment Schemes – Assets Under Management (AUM)/Assets Under Advisory (AUA)
The total assets under management and assets under advisory by collective investment schemes managers as at 31 March 2018 were E25.8 Billion.
On aggregate, the 50% local asset requirement was met by the Collective Investment Scheme Managers during the period under review. The investment managers invested 61% of their assets in local (Eswatini) assets.
REGULATORY HIGHLIGHTS
38

FINANCIAL SERVICES REGULATORY AUTHORITY (FSRA) Annual Report 2018
REGULATORY HIGHLIGHTS FSRA HISTORIC FINANCIAL SUMMARY
FACTS AND FIGURES – FSRA HISTORICAL DATA
2018FSRA
2017RIRF
2016RIRF
2015RIRF
2014RIRF
INCOME STATEMENT Government Subvention - - 10 115 325 8 015 000 12 000 000 Regulatory Levies and fees 50 700 040 47 669 259 37 947 810 27 618 148 22 594 280 Other income 3 009 864 1 294 377 3 398 324 1 170 260 1 490 566 Total Income 53 709 904 48 963 636 51 461 459 36 803 408 36 084 846% MOVEMENT 9% (5%) 40% 2% 20%
Operating Expenses (56 624 112) (51 355 664) (38 578 257) (32 355 286) (29 777 488) Depreciation (1 450 822) (1 588 026) (858 503) (694 460) (662 259 )Total expenses (58 074 934) (52 943 690) (39 436 760) (33 049 746 (30 439 747)
Net surplus (4 365 030) (3 980 054) 12 024 699 3 753 662 5 645 099
BALANCE SHEET Non-Current Assets Property, plant and equipment 2 298 338 2 826 642 3 561 055 3 231 188 3 458 760 Intangible Assets 610 351 1 220 701 1 831 051 - -Financial Assets 24 791 204 13 170 280 12 357 489 18 437 989 21 536 538 27 699 893 17 217 623 17 749 595 21 669 177 24 995 298
Current Assets Trade and other receivables 12 883 108 14 182 657 19 095 084 10 782 026 5 830 216 Cash and Cash equivalents 16 409 217 25 092 489 23 814 145 15 183 598 11 816 425 29 292 325 39 275 146 42 909 229 25 965 624 17 646 641 Total Assets 56 992 218 56 492 769 60 658 824 47 634 801 42 641 939
Equity and LiabilitiesRetained Income 46 760 755 51 125 785 55 105 839 43 081 144 39 327 482
46 760 755 51 125 785 55 105 839 43 081 144 39 327 482
Liabilities Trust Fund / Guarantee Fund 2 929 936 2 752 224 2 360 048 1 287 681 1 113 496 Trade and other payables 5 929 987 1 518 550 2 268 457 2 542 676 1 667 562 Provisions 1 371 540 1 096 210 924 480 723 300 533 399 10 231 463 5 366 984 5 570 985 4 553 657 3 314 457Total Equity and Liabilities 56 992 218 56 492 769 60 658 824 47 634 801 42 641 939
39

FINANCIAL SERVICES REGULATORY AUTHORITY (FSRA) Annual Report 2018
- DETAILED REPORTSCAPITAL MARKETS INSTITUTIONS
40
REGULATED INDUSTRIES

FINANCIAL SERVICES REGULATORY AUTHORITY (FSRA) Annual Report 2018
1. INTRODUCTION
1.1 Industry Overview
The FSRA, through the Capital Markets Development (CMD) Division derives its powers from the Financial Services
Regulatory Authority Act, 2010, and the Securities Act, 2010. The objective of the CMD Division is to develop all aspects of capital markets in the Kingdom of Eswatini, with a particular focus on the removal of impediments to investments and barriers to development. Over and above the two mentioned pieces of legislation, the CMD also oversees industry adherence to the Capital Markets Rules and Regulations as per Section 5 of the Securities Act, 2010; this is the Power of the Registrar to make Rules for the purpose of ensuring the protection of investors.
The CMD supervises and regulates the Eswatini Stock Exchange and the following financial
services providers: Investment Advisors, Dealers, Collective Investment Scheme Managers, Trustees and Custodians, Securities Exchanges, Investment Advisor Representatives, Dealer Representatives, brokers, and Exempt Dealers. However, other financial service providers such as the Central Securities Depository will also come under the regulation of the CMD. Additionally, the CMD sees to the creation, maintenance and regulation of an exchange in which securities can be issued and traded in an orderly, fair, efficient and transparent manner.
1.2 Licenced Entities
As at 31 March 2018, the Authority had licensed a total of thirty three (33) entities within the securi-ties industry. This comprise 7 Collective Investment Schemes, 18 Investment Advisors, 2 Stockbrokers, 1 Primary Dealer, 2 Trustees and Custodians, and 1 Stock Exchange.
- DETAILED REPORTSCAPITAL MARKETS INSTITUTIONS
41
REGULATED INDUSTRIES – DETAILED REPORTS - contd.
REGULATED INDUSTRIES
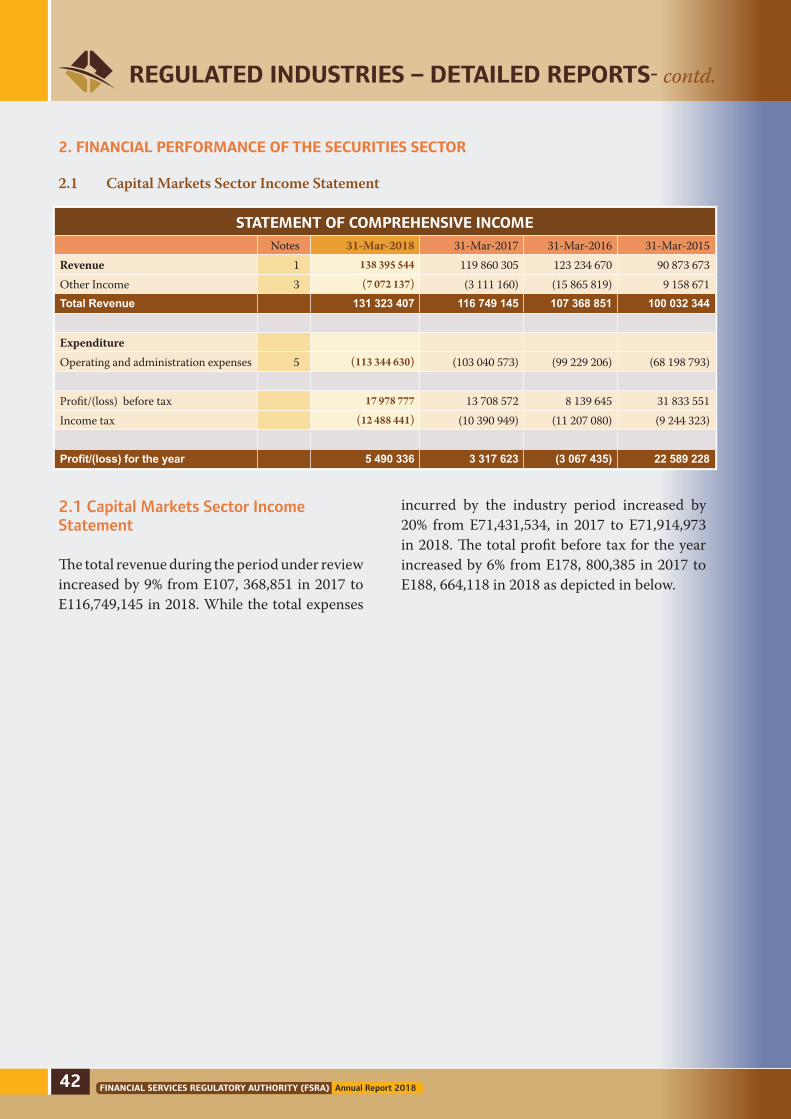
FINANCIAL SERVICES REGULATORY AUTHORITY (FSRA) Annual Report 2018
REGULATED INDUSTRIES – DETAILED REPORTS- contd.
2. FINANCIAL PERFORMANCE OF THE SECURITIES SECTOR
2.1 Capital Markets Sector Income Statement
STATEMENT OF COMPREHENSIVE INCOME
Notes 31-Mar-2018 31-Mar-2017 31-Mar-2016 31-Mar-2015Revenue 1 138 395 544 119 860 305 123 234 670 90 873 673Other Income 3 (7 072 137) (3 111 160) (15 865 819) 9 158 671Total Revenue 131 323 407 116 749 145 107 368 851 100 032 344
Expenditure Operating and administration expenses 5 (113 344 630) (103 040 573) (99 229 206) (68 198 793)
Profit/(loss) before tax 17 978 777 13 708 572 8 139 645 31 833 551Income tax (12 488 441) (10 390 949) (11 207 080) (9 244 323)
Profit/(loss) for the year 5 490 336 3 317 623 (3 067 435) 22 589 228
2.1 Capital Markets Sector Income Statement
The total revenue during the period under review increased by 9% from E107, 368,851 in 2017 to E116,749,145 in 2018. While the total expenses
incurred by the industry period increased by 20% from E71,431,534, in 2017 to E71,914,973 in 2018. The total profit before tax for the year increased by 6% from E178, 800,385 in 2017 to E188, 664,118 in 2018 as depicted in below.
42

FINANCIAL SERVICES REGULATORY AUTHORITY (FSRA) Annual Report 2018
REGULATED INDUSTRIES – DETAILED REPORTS- contd.
Asset Management fees - 58%
Unit trust administration fees - 12%
Commission received - 1%
Consultancy and Advisory income - 15%
Fair value adjustments - 11%
Initial fees - 0.3%
Netting profits - 0%
Sponsoring broker fees - 0.2%
Profit/loss on excchage differences - 0.1%
Segregated fund fees - 2%
12%1%
15%
58%
11%
0.1%0.3% 0.2%2%
NOTE 1 - REVENUE
% share 31-Mar-2018 31-Mar-2017 31-Mar-2016 31-Mar-2015Asset Management fees 58% 80 823 496 76 159 399 73 670 767 60 458 078 Unit trust administration fees 12% 16 955 938 13 360 637 14 045 623 13 811 890 Commission received 1% 806 856 8 907 023 8 597 576 13 291 430 Consultancy and Advisory income 15% 20 900 241 10 225 016 10 767 818 - Fair value adjustments 11% 15 891 069 6 883 437 12 328 180 697 829 Initial fees 0.3% 472 424 712 984 807 494 617 790 Netting profits 0% - 183 003 367 582 626 541 Sponsoring broker fees 0.2% 239 401 1 052 979 89 975 - Profit/loss on exchange differences 0.1% 197 028 16 409 38 203 111 912 Segregated fund fees 2% 2 019 091 2 359 418 2 521 452 1 258 203
Total revenue 100% 138 395 544 119 860 305 123 234 670 90 873 673
2.2 Note 1 - Revenue Breakdown
NOTE 1 - REVENUE TYPES
2.3 Note 3 – Other Income
NOTE 3 - OTHER INCOME
31-Mar-2018 31-Mar-2017 31-Mar-2016 31-Mar-2015Investment/Interest Income 11 227 589 12 221 653 6 779 308 25 316 360 Investment losses/Finance costs (18 299 726) (15 332 813) (22 645 127) (16 157 689) Dividend received - - - -
(7 072 137) (3 111 160) (15 865 819) 9 158 671
43

FINANCIAL SERVICES REGULATORY AUTHORITY (FSRA) Annual Report 2018
This note is illustrated to track the main expense lines incurred by Capital Markets Institutions. Management fees paid to parent companies accounts for 41% of total expenses. When expressed as a percentage of revenue, management fees are at 34% in 2018 (2017: 36%). Management fees paid to parent companies are expected, because local offices rely on parent expertise to manage their businesses.
The purpose of reporting other income is to bring to the attention of the reader that during the year under review yielded negative returns or losses on investment. Looking at the trend from previous year, the negative returns increased a little bit this year, having reduced from E3.1 million in 2017 to E7.1 million in 2018. Negative returns on investment are detrimental to owners of capital, hence it is important for Investment Managers, to advise employees who are close to retirement to invest their monies in less aggressive securities, for capital protection.
2.4 Note 5 – Operating and Administrative Expenses
NOTE 5 - OPERATING AND ADMINISTRATION EXPENSES
Notes 31-Mar-2018 31-Mar-2017 31-Mar-2016 31-Mar-2015Management fees - Parent Company 41% 46 779 113 42 526 466 39 935 594 25 741 767Staff costs 22% 24 613 448 22 375 862 18 841 307 16 759 225Directors fees 1% 4 372 763 3 975 239 506 348 396 139Auditor's remuneration 1% 1 560 684 1 418 804 1 567 369 1 215 089Depreciation 1% 757 636 688 760 586 696 413 911Lease rentals on operating leases 2% 2 815 146 2 559 224 2 017 724 1 715 684Other operating expenses 29% 32 445 840 29 496 218 35 774 168 21 956 978 100% 113 344 680 103 040 573 99 229 206 68 198 793
OPERATING AND ADMINISTRATION EXPENSES
Management fees - parent company - 41%
Staff Costs - 22%
Direct Fees - 4%
Auditor’s remuneration - 1%
Depreciation - 1%
Lease rentals on operating leases - 2%
Other operating expenses - 29%
41%
29%
22%4%
2%
1%1%
REGULATED INDUSTRIES – DETAILED REPORTS- contd.
44

FINANCIAL SERVICES REGULATORY AUTHORITY (FSRA) Annual Report 2018
REGULATED INDUSTRIES – DETAILED REPORTS- contd.
45
REGULATED INDUSTRIES – DETAILED REPORTS - contd.
INDUSTRY STATEMENT OF FINANCIAL POSITION
Notes 31-Mar-2018 31-Mar-2017 31-Mar-2016 31-Mar-2015 Non-current Assets Property, plant and equipment 2 574 697 2 496 255 2 383 558 2 206 301 Loans to group companies 10 985 106 53 955 265 6 712 961 35 518 280 Financial Assets 4 274 288 2 762 656 2 786 246 - Deferred taxation 6 252 170 4 042 462 3 283 113 3 869 799 Total non-current assets 24 086 261 63 256 638 15 165 878 41 594 380
Current AssetsTrade and other receivables 23 981 030 21 800 936 16 177 414 12 726 006 Financial instruments 1 1 78 329 291 737 15 209 591 61 927 057 Amounts due from group companies 215 780 129 196 163 754 195 956,381 209 005 527 Current tax assets 1 391 484 452 905 124 170 975 628 Cash and cash equivalents 92 354 705 69 709 324 70 153 761 51 973 909
334 685 677 288 418 656 297 621 317 336 608 127
TOTAL ASSETS 358 771 938 351 675 294 312 787 195 378 202 507
EQUITY AND LIABILITIES
Capital and Reserves Share Capital 885 648 885 648 885 648 1 385 748 Share Premium 14 423 807 9 362 321 9 362 321 4 212 317 Reserves 13 709 898 8 020 000 8 020 000 1 120 000 Retained earnings 88 957 903 83 467 567 62 303 365 50 755 836 Total capital and reserves 117 977 256 101 735 536 80 571 334 57 473 901
Non-current Liabilities Deferred tax liabilities 3 646 35 223 105 797 111 426 Shareholders loans 12 403 873 9 403 688 9 024 706 11 944 398 Other financial liabilities 150 601 525 170 725 272 157 608 135 264 438 012
163 009 044 180 164 183 166 738 638 276 493 836
Current Liabilities Trade and other payables 26 038 147 23 671 043 37 458 286 30 677 976 Employee benefits 3 332 420 1 688 631 1 915 788 1 099 002 Amounts due to group companies 44 592 691 40 561 857 24 574 635 12 021 814 Current tax liability 3 822 380 3 854 044 1 528 514 435 978
77 785 638 69 939 758 65 477 223 44 234 770 Total Liabilities 240 794 683 249 939 758 232 215 861 320 728 606
Total equity and liabilities 358 771 938 351 675 294 312 787 195 241 241 209
2.7 Capital Markets Industry Balance Sheet

FINANCIAL SERVICES REGULATORY AUTHORITY (FSRA) Annual Report 2018
KEY BALANCE SHEET INDICATORS
31-Mar-2018 31-Mar-2017 31-Mar-2016 31-Mar-2015Total Assets 358 771 938 351 675 294 312 787 195 378 202 507 Total Liabilities 206 556 523 249 939 758 232 215 861 320 728 606 Total capital and reserves 152 215 416 101 735 536 80 571 334 57 473 901
400,000,000
350,000,000
300,000,000
250,000,000
200,000,000
150,000,000
100,000,000
50,000,000
-
Total Assets Total Liabilities Total capital reserves
2015 2016 2017
378,202,507
320,728,606 312,787,195
232,215,861
351,675,294 358,771,938
249,939,758
206,556,523
2015 - 2018 KEY BALANCE SHEET INDICATORS
57,473,902.080,571,334.0
101,735,536
152,215,416
REGULATED INDUSTRIES – DETAILED REPORTS - contd.
46
2.6 Balance Sheet
In general, the capital markets intermediaries recorded an increase of 2% in total assets from E351,675,294 in previous year to E358,771,938 in the current year. The total liabilities also decelerated by 4% to E240,794,638 in 2018 from E249,939,758 recorded in 2017. During the reporting period, capital for the sector
increased by 16% from E101,735,563 in 2017 to E117,977,256 during the period under review.
The total liabilities amounted to 67% of the total assets during the period under review, reporting a decrease of 6% compared to the industry’s total liabilities in 2017. While the capital and equity represented 33% of the total assets in the period under review.

FINANCIAL SERVICES REGULATORY AUTHORITY (FSRA) Annual Report 2018
REGULATED INDUSTRIES – DETAILED REPORTS - contd.
3. INVESTMENT MANAGEMENT
3.1 Total Assets under Management
The total assets held by Collective Investment Scheme Managers (CISM) and Investment Advisors (IA) were E25.8 Billion (2017: E23.3 Billion) during the period under review. Funds sourced from the pension funds dominated the Capital Markets industry accounting for 74% of the total value of funds, illustrating the important role that pension funds play in the long-term development of capital markets industry in Eswatini. Figure 1 below shows the source of funds under management (AUM) within the capital markets industry.
NOTE 2 - ASSETS UNDER MANAGEMENT (AUM)
31-Mar-2018 31-Mar-2017 31-Mar-2016 31-Mar-2015Retail BusinessCollective Investment Schemes 6 993 153 404 2 758 824 343 2 715 756 321 4 108 724 584Money Market 2 934 835 563 3 004 455 120 2 957 552 522 3 423 573 892Total Retail 9 927 988 967 5 763 279 493 5 673 308 843 7 532 298 476
Institutional BusinessSegregated Funds 15 142 902 155 16 998 562 319 16 733 197 486 14 206 598 941Money Market 695 666 989 584 594 108 575 468 000 506 570 000Total Institutional 15 838 569 144 17 583 156 427 17 308 665 486 14 713 168 941
Total assets under management 25 766 558 111 23 346 435 890 22 981 974 329 22 245 467 417
47
REGULATED INDUSTRIES – DETAILED REPORTS - contd.

FINANCIAL SERVICES REGULATORY AUTHORITY (FSRA) Annual Report 2018
4. GEOGRAPHIC ASSET ALLOCATION
As at 31 March 2018 the assets that were managed and advised within the capital markets industry were E25,766,558,110.81 representing a 8% increase from E23,346,435,920.00 in 2017. Figure 3 below illustrates the geographic asset allocation of all assets within the capital markets industry. As seen
in the graph, 30% are invested domestically; 63% are invested within the Common Monetary Area (CMA), excluding Eswatini; and 14% is invested offshore (Outside of CMA). It is worth noting that currently, Investment Advisors do not have a local asset requirement, hence they tend to skew the geographic asset allocation away from domestic assets.
Source: CMD Statistics 2016
Banks
Retail
Professional Investors/High Net Worth
Institutional - Pension
Institutional - Medical Aid Scheme
Institutional - Insurance short term
Institutional - Insurance long term
Unit Trust Schemes
Companies
Institutional - SACCO
Institutional - Other74%
4%
7%0%
1%1% 1% 5% 4%0% 3%
SOURCES OF FUNDS UNDER MANAGEMENT
REGULATED INDUSTRIES – DETAILED REPORTS - contd.
OffshoreGross Assets
14%Domestic
Gross Assets30%
CMAGross Assets
63%
Figure 3: Geographic Asset Allocation Source: FSRA Statistics 2018
48

FINANCIAL SERVICES REGULATORY AUTHORITY (FSRA) Annual Report 2018
REGULATED INDUSTRIES – DETAILED REPORTS - contd.
4.1 Collective Investment Schemes Management
The total assets under management by collective investment schemes managers as at 31 March 2018 were E 6 993 153 403, 96. The source of funds of these assets are depicted in figure 4 with 38% from pension funds and 10 % from companies, while retail investors account for 19%.
49
REGULATED INDUSTRIES – DETAILED REPORTS - contd.
InstitutionalInsurance long-term
4%
Retail19%
InstitutionalPension
37%
Professional Investors - High Net Worth - 4%
Unit Trust Schemes- 8%
Institutional Medical Aid Scheme - 1% Institutional
Insuranc - short-term - 1%
Figure 4: Sources of Funds of Collective Investment Schemes Source: CMD Statistics 2018
On aggregate, the 50% local asset requirement was met by the Collective Investment Scheme Managers during the period under review. The investment managers invested 61% of their assets in local (Eswatini) assets, as illustrated by figure 5.
Domestinc61%
CMA28%
Offshore8%
Figure 5: Collective Investment Schemes Assets Under Management Geographic Allocation
Source: CMD Statistics 2018

FINANCIAL SERVICES REGULATORY AUTHORITY (FSRA) Annual Report 2018
REGULATED INDUSTRIES – DETAILED REPORTS - contd.
4.1.1 Collective Investment Scheme Asset Allocation
Figure 6 gives an overview of the types of assets that are being invested in. As at 31 March 2018, 35% were money markets, 12% were collective investment schemes, 8% were equities and 21% were other portfolio assets. Collective Investment Schemes represents assets that are re-invested in foreign collective investment schemes. Other portfolio assets consist of financial derivatives and money market funds of asset managers in the common monetary area (CMA) and offshore.
The money markets are further broken down with the aggregate holdings shown in figure 6, 22% were in commercial paper, 15% were treasury bills, 15% were cash holdings in banks and 22% were in certificates of deposits.
CorporateBonds
19%
Equities8%
MoneyMarkets
35%
Bonds/Debentures
4%
CollectiveInvestment
Schemes 12%
Other PortfolioAssets
21%
Figure 6: Investments by Asset Class Source: CMD Statistics 2018
Figure 7: Money Market Asset Allocation Source: CMD Statistics 2018
Treasury Bills15%
Banks15%
CommercialPaper22%
Other Portfolio Assets -25%
NegotiableCertificate of
Deposit22%
50

FINANCIAL SERVICES REGULATORY AUTHORITY (FSRA) Annual Report 2018
REGULATED INDUSTRIES – DETAILED REPORTS - contd.
51
REGULATED INDUSTRIES – DETAILED REPORTS - contd.
4.1.2 Geographic Allocation of (CIS) Assets
Figure 7 gives a geographical breakdown of the aggregate investment holdings. In the quarter under review, 35% of fund holdings were in the money markets. This suggests that collective investment scheme managers may have repatriated funds to Eswatini to comply with the local asset requirement, however, they have not initiated or participated meaningfully in developmental projects as intended by the local asset requirement. Funds appear to be parked in cash and near cash instruments in the country; it is hoped that with time, asset managers will look to more productive endeavours to channel these funds to. Figure 8 shows further geographical breakdown of the money market assets.
4.2 INVESTMENT ADVISORY
Assets under advisory are shown in figure 9 and are broken down geographically. These are funds for which investment advisor licence holders offer advisory services to clients through segregated mandates. Figure 9 shows that 75% of the funds are channelled to the CMA and 20% of the funds are channelled to domestic assets.
4,500,000,000.00
4,000,000,000.00
3,500,000,000.00
3,000,000,000.00
2,500,000,000.00
2,000,000,000.00
1,500,000,000.00
1,000,000,000.00
500,000,000.00
-
DOMESTIC CMA OFF SHORE TOTAL
Corporate Bonds - 19%
Equities - 8%
Real Estate - 0%
Money Markets - 35%
Bonds/Debentures - 4%
Collective Investment Schemes - 12%
Other Portfolio Assets - 21%
Source: FSRA 2018Figure 8: Geographical breakdown of CIS Assets

FINANCIAL SERVICES REGULATORY AUTHORITY (FSRA) Annual Report 2018
REGULATED INDUSTRIES – DETAILED REPORTS - contd.
Source: SSX Trading Statistics 2018
Figure 9: Geographic Asset Allocation
Figure 10: SSX Market Capitalisation ’17 vs ’18
5. DOMESTIC SECURITIES EXCHANGES
The SSX All Share Index increased to E380.34 during the period under review. Trading during the year remained rather quiet, as reflected by the significant decrease in the volumes of trades brought on to the market. This saw the growth trend remain rather flat in comparison to the previous year, where the trades overall growth was 6.13%. An increase in the All Share Index was due to increases in the prices of three (3) equities, these consisting of a 2.2% increase in the Nedbank share price, 5.2% increase in the SEL share price, 4.8% in increase the Greystone Partners share price and a 5.0% increase in the SBC LTD share
price. The All Share Index realised a gain of 16.2% from the previous year to the current year.
5.1 Market Capitalisation
SSX Market Capitalisation ended the 1th quarter with a value of SZL3.567 billion, reflecting an increase of 1.77% from the previous quarter’s close of SZL3.504 billion. Growth in the market capitalisation was attributable to gains in the share prices of Greystone Partners share price (21.28%), SWAPROP (10.09%),Nedbank (9.09%), SBC LTD (8.43%), SEL (5%) and RSSC (3.32%). Year-on-year, the Market Capitalisation realised a gain of 7.21% from SZL3.327 billion at end of the 1st quarter of 2018.
3 700 000 000
3 600 000 000
3 500 000 000
3 400 000 000
3 300 000 000
3 200 000 000
3 100 000 000
3 000 000 000
2 900 000 000
- Dec
SSX Market Capitalisation 2018 SSX Market Capitalisation 2017
Jan Feb Mar
SSX MARKET CAPITALISATION ’17 VS ’18
Domestic20%
Offshore20%
CMA75%
52

FINANCIAL SERVICES REGULATORY AUTHORITY (FSRA) Annual Report 2018
REGULATED INDUSTRIES – DETAILED REPORTS - contd.
53
REGULATED INDUSTRIES – DETAILED REPORTS - contd.
5.2 Equities Market
A total turnover of SZL 9,474,078 was recorded from a sale of 2 327 732 shares, which reflects a 680.23% increase from last year’s 1st quarter whereby SZL1,214,268.15 was recorded from a sale of 341,490 shares. In comparison to the 4th quarter of 2017, turnover increased by 411.17%, up from SZL 1,853,411. The stark increase in trade values was due to higher volumes of trades being conducted throughout the 1st quarter, which were as follows: SEL LTD (1 Trade), SBC Ltd (6 Trades) and Greystone Partners LTD (5 Trades).
5.3 Government Bonds
During the period under review, Government through the Central Bank of Eswatini (CBS) maintained 18 bonds (4 Infrastructure and 14 Plain Vanilla) with different maturities, ranging from 3, 5, 7 and 10 years. The total outstanding bonds as at 31 March, 2018 stood at SZL 2.907 billion. This saw the total government bonds outstanding increase by 11.68% from the previous quarter’s close of SZL 2.603 billion. The increase was due to government issuing additional bonds in the market, SG031 worth SZL150 million and SGIFB004 worth SZL150 million. During the course of the 1st quarter of 2018 one government bond matured, SG011 worth SZL146 million. Year-on-year, this reflects a 34.40% as they stood at SZL 2.163 billion as at 31 March, 2017. The total outstanding bonds as at 31 March, 2018 are as outlined in figure 11 below:
5.4 Corporate Bonds
Select Limited returned to the market via its SML604 issuance of SZL10 million. This saw the cumulative corporate bonds outstanding as of 31 March 2018 increase to SZL 1.038 billion, from the previous quarter’s outstanding amount of SZL1.01 billion. This marked an increase of 2.77% increase in the total bonds outstanding. Year-on-year, total corporate bonds outstanding increased by 54.46% as they stood at SZL 672 million as at the end of March 2017. No bonds matured in the 31 March 2018.
3 000 000 000
2 500 000 000
2 000 000 000
1 500 000 000
1 000 000 000
500 000 000
-
Figure 11: Government Bonds as at 31 March 2018Source: SSX Trading Statistics, 2018
TOTAL GOVT. BONDS ‘17 vs ‘18
Govt. Bonds 2018 Govt. Bonds 2017
1 400 000 000
1 200 000 000
1 000 000 000
800 000 000
600 000 000
400 000 000
200 000 000
-
Figure 12: Total Corporate Bonds Year on Year Source: SSX Trading Statistics, 2018
TOTAL CORPORATE BONDS ‘17 vs ‘18
Corporate Bonds 2018 Corporate Bonds 2017

FINANCIAL SERVICES REGULATORY AUTHORITY (FSRA) Annual Report 2018
6. MARKET SURVEILLANCE
6.1 Offsite Supervision
The CMDD receives financial and non-financial information quarterly from the capital markets entities through the BSA system and then prepares periodic reports on the trends in the financial industry and the results of each capital market entity are then consolidated in the form of the Capital Markets Quarterly Bulletin.
6.2 Onsite Supervision
The Capital Markets Development Division of the FSRA is mandated with the responsibility to conduct periodic inspections of the licensed entities in order to gain full understanding of the operations and identify the key risks that the securities industry is faced with and the risk management systems that have been put in place to mitigate the identified risks. During the period under review seven (7) industry players were inspected representing a decreased from 9 to 7 of the inspections that were carried out in the year 2017.
7. REGULATORY DEVELOPMENTS
During the year, the FSRA in exercise of the powers conferred by Section 21 of the Financial Services Regulatory Authority Act, 2010, issued a Legal Notice No.209 on the imposition of supervisory levies of capital markets financial serve providers, which was gazetted in 2017.
8. AML/CFT MATTERS
As part of the efforts to ensure appropriate & effective oversight and further support & enhance the implementation of MLTPF Act, nine (9) onsite inspections on AML/CFT compliance on all capital markets regulated entities were conducted. The division also participated in the AML/CFT National Risk Assessment exercise which is a two year project for the country to be finalised in 2018.
In addition to the risk assessment, follow-ups on the onsite inspections findings are conducted to ensure that capital markets licensees comply with AML/CFT regulatory requirements.
There has not been an imposition of admini-strative sanctions emanating from on-site inspections findings which were carried out during the period under review.
9. INTERNATIONAL AFFILIATION
8.1 International Financial Cooperation
The Authority has applied for membership for Eswatini at the International Financial Cooperation (IFC) and the application still under consideration. The IFC will revert to the Authority once the application has been finalised.
8.2 CISNA
FSRA again released a Capital Markets staff member to attend the bi-annual CISNA meeting. In the quarter under review, the meeting was held in Harare, Zimbabwe. The outcome for that meeting is that the FSRA’s paper on Advertising Guidelines has been forwarded to the Legal Technical Committee at CISNA for their review. Upon approval, the paper will be presented to SPPRC at the 2018 meeting for adoption by all member countries.
8.3 IOSCO
The application for ordinary membership to IOSCO for Eswatini is underway. However technical assistance has been sought from the IMF to assist in compliance with the IOSCO principles in so far as strengthening legislation and regulation.
10. OTHER ACTIVITIES
10.1 High School Essay Competition
FSRA CMDD held the prize giving ceremony for the second annual High School Essay competition on the 25th October 2017 at Happy
REGULATED INDUSTRIES – DETAILED REPORTS - contd.
54

FINANCIAL SERVICES REGULATORY AUTHORITY (FSRA) Annual Report 2018
REGULATED INDUSTRIES – DETAILED REPORTS - contd.
55
REGULATED INDUSTRIES – DETAILED REPORTS - contd.
Valley Hotel. The overall winner was Ms. Mbali Masuku from Evelyn Baring High School. Ms. Mbali was attached at FSRA offices in Mbabane from the 27th November 2017 to 8th December 2017 as part of her prize for coming first in the essay competition.
10.2 Updating of Listing Requirements and Rule Book
The SSX staff working alongside the Consultant and Legal Representative commenced on the final review and cross-checking exercise of the draft Listings Requirements and Schedules and the draft Rule Book and Directives to the Rules. This task started in the beginning of March and is expected to be completed by the end of the second quarter. As soon as this process is completed the SSX will be sending them out for public comment for a month’s period.
10.3 SSX Automation Project
The SSX is still conducting parallel runs, that is, trading at the SSX is done both on the acquired Automated Trading System (ATS) effective February 1, 2017, and manually via a call over system with trading sessions conducted between 12.00pm to 12.30pm on week days. The ATS and complimentary systems for brokers, transfer secretaries, broker-dealers, and regulator’s surveillance will officially go-live once the following outstanding works are complete: 1. SSX Interface with MTN for Mobile Trading.• Creation of Mobile App for Mobile
Trading, USSD Code for Mobile Money transact ability and the MTN SMS gateway.
2. SSX ATS Integration with CBS CSD• Interface between the SSX Automated
Trading System (ATS) with the CBS Central Securities Depository (CSD) for clearing and settlement.
11. CHALLENGES
The Capital Markets industry brings together those with surplus funds and those seeking capital. This has however, not gotten to its optimal level due to the following challenges facing the capital markets.
There is a limited number of companies listed on the Eswatini Stock Exchange (SSX). Compared to the well-established stock markets in developed countries like The United States of America and Europe, the investor in Eswatini has limited options. The companies listed in these developed economies are many and with a large base, hence the options are unlimited.
There is limited access to long term securities. Long term government bonds and corporate bonds are in short supply, with demand being high. This causes a mismatch, especially for long term investors whose needs are tied to long term instruments.
12. LICENCED ENTITIES
Table 2 below lists the entities regulated within the Capital Markets Development Division as at 31 March 2018. The list only shows licences that were active at the close of the period under review.

FINANCIAL SERVICES REGULATORY AUTHORITY (FSRA) Annual Report 2018
REGULATED INDUSTRIES – DETAILED REPORTS - contd.
Licence Type Entity Name Licence Number
Collective Investment Scheme Manager
African Alliance Eswatini Management Company CISM/0009/13Sanlam Eswatini CISM/0015/13STANLIB Eswatini CISM/0010/13JM Busha CISM/0012/13Old Mutual Unit Trust Eswatini CISM/0013/13Pan-African Asset Management CISM/0001/17Inhlonhla CISM/0022/17Esponent Limited CISM/0003/17
Licence Type Entity Name Licence NumberInvestment Advisor Inhlonhla IA/0018/13
Imbewu Yesive IA/0005/13Allan Gray Eswatini IA/0007/13Ecsponent Eswatini IA/0020/14African Alliance Eswatini Management Company IA/0003/13African Alliance Eswatini Limited IA/0002/13Sanlam Eswatini IA/0014/13STANLIB Eswatini IA/0001/13Old Mutual Investment Group Eswatini IA/0008/13Momentum Asset Management Eswatini IA/0013/13BLZI IA/0004/13MB Financial Consultants IA/0021/16Eswatini Employee Benefit Consultants IA/0023/16Umelusi Capital IA/0025/18Aluwami Capital Partners Swaziland IA/0026/18
Licence Type Entity Name Licence NumberStock Broker African Alliance Securities STB/0016/13
Eswatini Stock Brokers Limited STB/0017/13
Licence Type Entity Name Licence NumberTrustee Nedbank Eswatini TR/0002/13
Standard Bank TR/0004/15
Licence Type Entity Name Licence NumberDealer Eswatini Savings and Development Bank DR/001/13
Table 1: Capital Markets Regulated Entities as at 31 March 2018
56

FINANCIAL SERVICES REGULATORY AUTHORITY (FSRA) Annual Report 2018
REGULATED INDUSTRIES – DETAILED REPORTS - contd.
57
CREDIT ANDSAVINGSINSTITUTIONS

FINANCIAL SERVICES REGULATORY AUTHORITY (FSRA) Annual Report 2018
1. INTRODUCTION
The FSRA, through the Credit and Savings Institutions (CSI) Division is responsible for the regulation and supervision of
Savings and Credit Co-operative Societies Limited (SACCOs); Credit Providers; Building Societies; Debt Counsellors, and Credit Bureaus. The Division’s responsibilities are carried out in terms of the following pieces of legislations:
The Financial Services Regulatory Act, 2010 The Consumer Credit Act, 2016, and The Building Societies Act, 1962.
As at 31 March 2018, there were 170 licensed financial services providers (FSPs) under the supervision of the Division, with combined assets of more than E8.3 billion.
31-Mar-2018 31-Mar-2017 31-Mar-2016 31-Mar-2015No of Licensed
EntitiesNo of Licensed
EntitiesAsset Size
E’000Asset Size
E’000Building Societies 1 1 2 356 572 2 227 437SACCOs 51 49 1 468 003 1 318 164Credit Providers 117 89 4 571 143 3 859 288Credit Bureaus 1 1 - -Debt Counsellors - - - -Total 170 140 8 395 718 7 404 889
2018 - FINANCIAL SERVICE PROVIDERS UNDER CSI
2017 - FINANCIAL SERVICE PROVIDERS UNDER CSI
Credit Providers
52%
BuildingSocieties
30%
SACCOs18%
Credit Providers
52%
BuildingSocieties
30%
SACCOs18%
Table 1: Financial Services Providers under the Credit and Savings Institutions Division
58
CREDIT AND SAVINGS INSTITUTIONS DIVISION - continued

FINANCIAL SERVICES REGULATORY AUTHORITY (FSRA) Annual Report 2018
2,3
56
,57
2
2,2
27
,43
7
1,3
18
,16
4
3,8
59
,28
8
1,9
81
,23
7
1,1
78
,58
1
3,4
91
,96
0
4,5
71
,14
2
2018 2017 2016
1,4
68
,00
3
Building Societies SACCOs Credit Providers
FINANCIAL SERVICES PROVIDERS UNDER CSI E’000
2. SAVINGS AND CREDIT COOPERATIVES (SACCOS)
As indicated above, the Authority, through the Credit and Savings Institutions Division is responsible for the regulation and supervision of SACCOs. SACCOs are developed and registered by the Commissioner of Cooperative Development through the Cooperatives Act of 2003 and licensed and supervised by the Authority through the FRSA Act and Consumer Credit Act. The main supervisory objective of the Authority in this subsector is to foster the safety and financial soundness of SACCOs to protect member savings and ensure fair market conduct in all dealings with members. The Authority is still awaiting development of a SACCO specific Act by the Ministry of Finance.
The Licensing Status of SACCOs
As at 31 March 2018, there were 51 licenced SACCOs compared to 49 as at 31 March 2017 comprising of 43 primary SACCOs, 7 multi-purpose cooperatives, and 1 secondary SACCO. Only two new licence applications were approved and total of 9 cooperatives had not renewed their operating licences as at the end of the year under review, whilst a licence renewal application of one SACCO was not approved due to concerns about its financial soundness. Most of the SACCOs that had not renewed their licences are those that fall under the second tier category (have less than E1 million assets). In the coming year, the Authority, will intensify its enforcement and intervention measures to ensure timely renewal of operating licences by regulated entities.
59
CREDIT AND SAVINGS INSTITUTIONS DIVISION - continued
CREDIT AND SAVINGS INSTITUTIONS DIVISION - continued

FINANCIAL SERVICES REGULATORY AUTHORITY (FSRA) Annual Report 2018
CREDIT AND SAVINGS INSTITUTIONS DIVISION - continued
Classification of SACCOs by Assets Size
In terms of structure, the sub-sector is highly concentrated with the top 17 SACCOs, (33% of the total number of licenced SACCOs) holding more than 90% of the subsector total assets. In total, 39 SACCOs with more than E1 million held more than 99% of the subsector’s aggregate assets. The Authority classifies SACCOs with assets more than
E1 million as Tier 1 SACCOs whilst those with less than E1 million assets are classified as Tier 2 SACCOs. This was meant to reduce the supervisory burden on small SACCOs, and to channel the Authority’s limited supervisory resources to risky and systemically important SACCOs thus the former is subjected to strict supervisory oversight compared to the latter.
PERFORMANCE OF THE SACCOS SUBSECTOR The SACCO subsector continued to play its essential financial intermediation role of savings mobilisation and credit extension. Table 4 and 5 below reflect the aggregate balance sheet and
financial performance of the subsector respectively, extracted from the entities’ audited financial statements and these indicate that the sector recorded positive signs of growth in performance.
Type of SACCO 31-Mar-18 31-Mar-17Primary SACCO 43 42 Multipurpose Cooperatives 7 6Apex body/Secondary SACCO 1 1Total Licenced SACCO 51 49Newly Licenced 2 2Non-Renewals 10 10
Type of SACCO Number AssetsE’000
Percentage
Above E10 million 17 1 374 383 93.62%Between E1 million and E10 million 22 90 399 6.16%Below E1million 12 3 221 0.22%Total (E) 51 1 468 003 100%
Table 3: Classification of SACCOs by Assets Size
Table 2: Classification of SACCOs by Assets Size
60

FINANCIAL SERVICES REGULATORY AUTHORITY (FSRA) Annual Report 2018
CREDIT AND SAVINGS INSTITUTIONS DIVISION - continued
Year 31-Mar-2018 31-Mar-2017 31-Mar-2016Assets E’000 E’000 E’000
Property, Plant and Equipment 71 603 65 854 50 795 Loans and Advances 972 814 882 304 788 177 Trade and other Receivables 85 134 63 211 30 033 Investment In Equity Instruments 3 131 2 987 3 288 Balances with other SACCOs 3 475 4 416 5 088 Cash and Cash Equivalents 331 845 299 392 301 200 Total Assets 1 468 003 1 318 164 1 178 581
Liabilities
Member Savings 1 137 207 1 029 850 928 268 Trade and Other Labilities 133 409 125 168 113 363 Borrowings 14 226 14 791 7 428 Total Liabilities 1 284 842 1 169 809 1 049 060
Equity
Member Share Capital 74 658 59 884 50 444 Institutional Capital 83 078 64 487 61 640 Other Reserves and Funds 25 425 23 985 17 436 Total Equity 183 161 148 356 129 521
Total Equity & Liabilities 1 468 003 1 318 164 1 178 581
The subsectors’ total assets grew by 11% in 2018 to E1.5 billion compared to E1.3 billion in 2017. The growth was funded principally by members’ savings which also grew by 10% to reach E1.13 billion in 2018. There was increased demand for loans and advances in the sector. Loans and advances grew by 10% to E 972 million, up from E 882 million. Loans and advances constituted
a huge portion of the sector’ balance sheet, accounting for 66% of the sector total assets compared to 67% in the previous year. Cash and cash equivalent was the second most largest (23%) component of the subsector’s balance sheet and stood at E 332 million compared to E 299 million in 2017, reflecting an annual growth rate of 13%.
31-Mar-2018 31-Mar-2017 31-Mar-2016 31-Mar-2015Assets (E’000) 1 468 003 1 318 164 1 178 581 982 601Loans and advances (E’000) 972 814 882 304 788 177 661 712Savings and Deposits (E’000) 1 137 207 1 029 850 928 268 800 585
Table 5: SACCOS Key Financial Figures as at 31 March 2018
Table 4: SACCOs Consolidated Statement of Financial Position
61
CREDIT AND SAVINGS INSTITUTIONS DIVISION - continued

FINANCIAL SERVICES REGULATORY AUTHORITY (FSRA) Annual Report 2018
31-Mar-2018 31-Mar-2017 31-Mar-2016 E’000 E’000 E’000Interest income 178 925 154 668 140 018Interest Expense (100 333) (90 334) (81 679)Net Interest Income 78 592 64 333 58 339Other Income 23 933 19 755 19 662Net Operating Income 102 524 84 088 78 001Operating Costs (77 325) (68 017) (65 412)Net Surplus/(Loss) 25 199 16 071 12 589
SACCOs Consolidated Industry Income Statement
Table 6 below shows the aggregate financial performance of the subsector over the past three years. The sector generated a combined income of E178 million as of March 2018 mainly from loans and advances compared, to E154 million
in 2017, reflecting an annual growth rate of 16%. This underscores the importance SACCOs ought to attach to the quality of their loans portfolio.
Interest expense constituted significant compo-nent of the sector’s expenses, whilst net surplus retained constituted about 12% of gross income compared to about 9% in 2016.
The upward trend depicted by the graph above, shows that the SACCOs sector is a growing sector, which is a good sign that regulation has brought better control of members’ savings.
CREDIT AND SAVINGS INSTITUTIONS DIVISION - continued
1,600,000,000
1,400,000,000
1,200,000,000
1,000,000,000
800,000,000
600,000,000
400,000,000
200,000,000
-31 March 2015 31 March 2016 31 March 2017 31 March 2018
Total Assets Loans and Advances Savings & Deposits
2017 - SACCOS KEY BALANCE SHEET INDICATORS
Table 6: SACCOs Consolidated Income Statement
62

FINANCIAL SERVICES REGULATORY AUTHORITY (FSRA) Annual Report 2018
CREDIT AND SAVINGS INSTITUTIONS DIVISION - continued
In general, SACCOs are non-profit social entities aiming to promote the financial success of their members. Surplus funds SACCOs make are reinvested in members in the form of higher interest rates on savings and lower interest rates on loans. Similarly, when the Authority assumed the supervision of SACCOs in 2012, it was discovered that several SACCOs were not retaining sufficient surplus income to support their capital position and were paying unsustainable interest on member savings. In this regard, the Authority adopted several approaches to ensure that sufficient surplus income is retained, including setting prudential capital adequacy standards, approving annual audited financial statements and prohibiting fragile SACCOs from paying out interest on member savings or dividends. Going forward, the Authority will continue to engage and encourage SACCOs to retain sufficient income to strengthen their capital positions.
FINANCIAL SOUNDNESS
Section 4 of FSRA Act, requires the Authority to foster, through regulation and prudential
supervision, safety and soundness of financial services providers. In this regard the Division uses the CAEL (Capital, Asset quality, Earnings and Liquidity) to assess and monitor the financial soundness of SACCOs.
Capital Adequacy
Sufficient capital buffers are essential in protecting or cushioning member savings against losses resulting from business risks that SACCOs face in their daily operations. SACCOs, in terms of the SACCOs’ Guidance Notes of 2013, are required to maintain core capital of not less than 10% of total assets and institutional capital of not less than 8% at all times. Core Capital comprises of fully paid up members’ shares, retained earnings, reserves, grants and donations all of which are not meant to be expended unless on liquidation of the SACCO, whilst Institutional capital (reserves) refers to the portion of the core capital that belongs to the SACCO as an institution such that no one member can individually lay claim on it. The Table below shows the aggregate levels of capital adequacy of the sector over the past two years.
Although there were positive improvements in 2018, in general the industry capital adequacy levels are weak, with the institutional capital ratio significantly below the required minimum level of 8%. It is common practice within the SACCO sector that whilst members share capital is non-withdrawable on paper, in practice members are refunded their shareholding on resignation, irrespective of the capital position of the SACCO. Thus, institutional capital is considered the most
reliable, permanent and loss-absorbing element of capital adequacy. Therefore the significantly low levels of the institutional capital ratio signifies the level of vulnerability of the sector and thus requires more targeted supervision to avoid the risk of total failure.
Chart 1 shows the number of SACCOs that were not compliant with the prescribed capital adequacy requirements.
Capital Adequacy Indicators 2018 2017Core Capital/Total Assets (≥10%) 11% 9%Institutional Capital/Total Assets (≥8%) 6% 5%
Table 7: SACCOs Aggregate Capital Adequacy Indicators
63
CREDIT AND SAVINGS INSTITUTIONS DIVISION - continued

FINANCIAL SERVICES REGULATORY AUTHORITY (FSRA) Annual Report 2018
A total of 14 were not compliant with the prescribed minimum core capital ratio of 10 % and 5 of those SACCOs were insolvent or had negative capital implying that liabilities were more that assets. With regard to institutional capital compliance levels, a total 36 SACCOs were not compliant, 11 of which did not have reserves at all. Institutional Capital is principally built from retained earnings and forms a key component of core capital. The poor level of compliance with the institutional capital ratio thus demonstrates that some SACCOs are not retaining sufficient earnings to build capital, proportionately to the growth of their asset base. It also shows that some SACCOs tend to pay out (as dividends on shares or interests on savings), most of their surpluses rather than retain the same to build capital. The Authority is currently developing an intervention plan, for
all entities on stage 4 of the Authority’s ladder of intervention, mainly being those with negative capital.
Asset Quality (Loans and Advances)
The loans portfolio represents the greatest risk and losses to SACCOs as it accounts for the largest portion of total assets and forms the major source of revenue. Therefore deterioration in the quality of the loan portfolio could cause significant income losses and erosion of capital reserves. As part of the Authority’s offsite monitoring system, tier 1 SACCOs (SACCOs with assets above E 1 million) are required to submit their loan delinquency classification reports on a quarterly basis. The table below shows the aggregate position of the sector as regards to the quality of loan portfolio based on submitted quarterly returns for the period ending 31 March 2018.
CREDIT AND SAVINGS INSTITUTIONS DIVISION - continued
NON-COMPLIANT SACCOs
40
30
20
10
0
Less than 0%
59
1411
25
36
Less than 0%0% - 10% 0% - 8%
Compliance Level - Core Capital Compliance Level - Institutional Capital
Total Total
Chart 2: Number of Non-Compliant SACCOs
Table 8: Aggregate Performance of SACCOs Loans Portfolio
Classification 31-Mar-2018Performing 870 055
Watch (1-30 Days) 7 024
Substandard (31-180 days) 9 638
Doubtful (181-360 days) 6 792
Loss (Over 360 days) 6 405
Sub-Total 899 914
Restructured/Renegotiated Loans Performing 195 586
Watch (1-30 Days) 2 985
Substandard (31-180 days) 4 536
Doubtful (181-360 days) 2 530
Loss (Over 360 days) 2 130
Sub- Total 207 768
Grant Total 1 107 682
64

FINANCIAL SERVICES REGULATORY AUTHORITY (FSRA) Annual Report 2018
The reported data indicated that, non-performing loans as percentage of gross loans (NPL30) was around 3% which was within the acceptable recommended ratio of 5% or less. However, the “stressed” NPL30 ratio (which is the ratio of non-performing loans > 30 days + value of renegotiated loans) stood at 21% which indicates serious assets quality and credit recovery problems. The Authority’s supervisory experience of the sector is that several SACCOs lack credible credit underwriting and recovery systems. In addition and of concern is that a majority of SACCOs generally do not maintain loan loss reserves against foreseeable loan losses, notwithstanding that the Authority in 2013 issued a guidance note to the sector on loan loss provisioning. The Authority will continue to work with the sector to instil best credit management practices. The passage of the Consumer Credit Act, 2016 (CCA) will also greatly assist the sector in this regard.
Liquidity Management
Liquidity measures the ability of a SACCO to meet its obligations as they fall due. It is one of the essential indicators of a SACCOs’ financial soundness. Members’ savings in SACCOs are largely withdrawable on resignation upon a three-month notice, and this reduces liquidity risk and simplifies liquid management. SACCOs are required to maintain liquid assets of not less than 15% of members’ savings and short term (30days) liabilities. The aggregate liquidity ratio for the sector as of 31 March 2018 stood at 20.21% which was well above the prescribed minimum liquidity ratio. The ratio of external borrowing to assets was also below the prescribed maximum ratio of 25%, whilst the funding ratio was around 85% indicating that generally the sector was able to fund its loan book with members’ savings.
Whilst the sector was largely compliant and liquid, there are several illiquid SACCOs. Some of this cases are historical and were inherited from the previous regulatory regime. As shown on Chart 2 below a total of 15 SACCOs, failed to maintain the prescribed minimum liquidity ratio of 15%
whilst total of 37 were above the prescribed ratio. Most of the SACCOs having liquidity challenges are also faced with capital adequacy challenges and the Authority is working on an intervention plan for these fragile entities.
Liquidity Indicator 31-Mar-2018 31-Mar-2017Prudential Liquidity Ratio (≥15%) 20.21% 20.35%Borrowing/Assets (≤25%) 0.97% 1.12%Loans/Savings 85.54% 85.67%
CREDIT AND SAVINGS INSTITUTIONS DIVISION - continued
Table 9: SACCOs Aggregate Liquidity Indicators
LIQUIDITY COMPLIANCE LEVEL
0 5 10 15 20 25 30
Above 20%
Between 15% to 20%
Below 15%
Chart 2: Number of Non-Compliant SACCOs
65
26
9
15
CREDIT AND SAVINGS INSTITUTIONS DIVISION - continued

FINANCIAL SERVICES REGULATORY AUTHORITY (FSRA) Annual Report 2018
SUPERVISION
The FSRA’s supervisory approach entails offsite supervision and onsite supervision. Offsite supervision or desktop supervision entails on-going monitoring of the activities and financial soundness of financial services providers through regular analysis of submitted financial and non-financial information. Whilst onsite inspection entails going to the SACCOs place of operations to examine its governance, financial and operating activities for a certain number of days.
Offsite Supervision
In order to effectively examine and monitor the financial soundness and safety of regulated SACCOs, the FSRA requires SACCOs to submit periodic prudential reports and audited annual financial statements. Prudential reports are submitted through a web based system (Banking Supervision Application) that was introduced in December 2015 to enable remote and timely submission of returns. The system enables the FSRA to assess and monitor the financial soundness of SACCOs on an ongoing basis so as to take prompt remedial actions where necessary. Tier 1 SACCOs are required to submit six (6) prudential reports on a monthly and quarterly basis, namely Statement of Financial Position; Statement of Comprehensive Income; Capital Adequacy Report; Liquidity Report; Risk Classification of Assets and Provisioning Report and Investments Report.
Small SACCOs, or Tier 2 are required to submit two reports, the Income Statement and Statement of Financial Position bi-annually. This
was meant to reduce the supervisory burden on small SACCOs, and to channel the Authority’s limited supervisory resources to systemically important SACCOs. Notwithstanding the above, the submission of prudential returns and the quality of financial information submitted thereon are not yet up to required standards. As at the 31 March 2018, the submission rate amongst the 39 Tier 1 SACCOs stood at around 63% and some of the submitted information was less than satisfactory indicating that some SACCOs lack adequate internal systems and capacity to generate and submit reliable financial information timely.
In line with the 2018-2020 FSRA strategic target of achieving 100% timely submission of prudential reports, in the year ahead the FSRA will intensify its offsite monitoring and enforcement measures through issuance of administrative fines for late submissions where necessary whilst working with the sector to overcome capacity challenges.
Onsite Supervision
The FSRA is currently working on developing a robust progressive risk focused offsite monitoring system. The system once complete, will enable the Division to rate SACCOs according to their risk profiles and financial soundness. These ratings will then inform the FSRA’s onsite inspection plan so that onsite inspections are conducted on fragile and systemically important SACCOs. Accordingly, during the year under review, the FSRA conducted one full scope onsite inspection, on one ailing SACCO which was reported to have lost about E8 million due to loans granted to unknown members. The inspection was a two (2) week long full-scope examination.
CREDIT AND SAVINGS INSTITUTIONS DIVISION - continued
Liquidity Indicator 31-Mar-2018 31-Mar-2017Full Scope Inspections 1 4 Targeted Inspections 0 2Total Number of Inspections 1 6
Table 10: Number and Types of Onsite Inspections Conducted
66

FINANCIAL SERVICES REGULATORY AUTHORITY (FSRA) Annual Report 2018
CREDIT AND SAVINGS INSTITUTIONS DIVISION - continued
Debt Counsellors and Credit Bureaus
There was only one licenced Credit Bureau as of 31 March 2018 and no debt counsellors. In terms of the Consumer Credit Act, credit providers are now required (section 25) to take reasonable steps to assess the repayment history of borrowers before
entering into a credit agreements and are further required to submit credit information on their clients periodically to at least one credit bureau. This is expected therefore to increase the activities and the role of credit bureaus in the credit market. The FSRA has not yet begun to collect statistical data from the licenced credit bureau.
Type of Credit Provider 31-Mar-2018 31-Mar-2017 31-Mar-2017 31-Mar-2016Development Finance Institutions 3 2 2 2Micro Lenders 108 81 118 0Hire Purchase 3 3 3 0Credit Retail Stores 3 3 2 0Total 117 89 125 2
Table 11: Number and Type of Licensed Credit Providers
67
CREDIT AND SAVINGS INSTITUTIONS DIVISION - continued
3. CREDIT PROVIDERS, DEBT COUNSELLORS & CREDIT BUREAUS
Under this sector the Authority is responsible for the regulation and supervision of the market conduct of credit providers, debt counsellors and credit bureaus. The main legislation guiding the Authority in supervising the sector is the Consumer Credit Act of 2016, which came into effect on 10th March 2017. Generally, the Act applies to all entities and individuals providing credit agreements in the country save for those entities listed under section 3 of the Act.
The Authority is awaiting publication of the regulations to the Act which will provide further clarity on the scope and implementation of the Act, especially around areas such as the capping of cost of credit, and the thresholds for body corporate consumers as required by section 3 and 11 of the Act.
The analysis of the sector below, only covers credit activities of non-deposit taking credit providers. Deposit-taking credit providers such as SACCOs and Building Societies, whilst subject to the Act, have not been included in the analysis simply because their activities have been reported separately in the annual report.
The Licensing Status of Credit Providers, Debt Counsellors and Credit Bureaus
The number of licensed credit providers increased to 117 as at 31 March 2018, the increase was mainly attributable to a net result of sixteen (16) new licenses and fifteen (15) non-renewal and voluntary exits. Operating licences for credit providers are valid for a period of 12 months up to 31 December and licence renewal applications are processed from October to December every year. The FSRA continues to experience high level of late renewals or non-renewals in this sector. During the year the FSRA received a number of complaints from members of the public and other concerned licenced credit providers of illegal trading by unlicensed credit providers. To this end the Authority, as part of its 2018-2021 strategic plan has taken a strategic decision to reduce number of late licence renewal and unlicensed financial service providers by 100% and 50% respectively over the next 3 years.
To this end the FSRA will embark on aggressive public awareness campaigns and unannounced onsite visits around the major cities and towns to clamp down on illegal operators.

FINANCIAL SERVICES REGULATORY AUTHORITY (FSRA) Annual Report 2018
Performance of the Sector
The analysis focused on the performance of the top 10 credit providers, excluding hire purchase and credit card stores due to data limitations.
The top credit providers account for more than 50% of the total credit market in terms of loan book value. The table below shows the aggregate income statement of the top 10 credit providers.
The sector recorded net interest income of E155.98 million, compared to E139.87 million in 2017, which was an annual increase of 11.52%. Impairments also surged upward by 54% reflecting the sector’s credit recovery challenges. Net Income increased by 43% to E153.718 million, which was 3% of total assets compared to 2% in 2017. The proportion of interest expense to interest income was kept under control as it increased marginally from 62% to 67%. Income from fees and commissions increased significantly by 74% to E188.12 million which indicates that the sector is increasingly relying on income from fees and commissions to
fund its business. The loan portfolio pricing ratio averaged around 27% compared to 29% in 2017, it is much lower than the cost of credit charged by pay day lenders which is estimated to be 30% per month. The cost of funds ratio was around 8%, resulting in an average spread of close to 20%.
The Authority is awaiting publication of the cost of credit caps by the Ministry of Finance which seeks to control the interest and fees on credit charged by the market and this will directly impact the financial performance of credit providers.
CREDIT AND SAVINGS INSTITUTIONS DIVISION - continued
31-Mar-2018 31-Mar-2017 31-Mar-2016 E’000 E’000 E’000Interest Income 476 204 371 452 346 433Interest Expense (320 222) (231 578) (207 106)Net Interest Income 155 982 139 874 139 327 Impairment/recoveries of loans and advances (75 198) (48 712) (40 325)Net Interest Income after Impairments 80 784 91 162 99 002 Fee Income & Commission 188 213 107 683 108 602Other Operating Income 153 090 121 305 76 081Net Operating Income 422 087 320 150 283 685
Operating and Administrative Expenses (244 135) (194 918) (174 314)Net Income before Taxation 177 952 125 232 109 371 Income Tax Expense (24 233) (17 940) (20 667)Net Income after Tax 153 719 107 292 88 704
Table 12: Income Statement for the Top 10 Credit providers
Liquidity Indicator 31-Mar-2018 31-Mar-2017Fee Income/Income from Loans 28% 22%Loan Pricing Ratio 29% 27%Cost of Funds Ratio 6% 7%Return on Assets 2% 3%Return on Equity 11% 8%
Table 13: Financial Performance Indicators
68

FINANCIAL SERVICES REGULATORY AUTHORITY (FSRA) Annual Report 2018
CREDIT AND SAVINGS INSTITUTIONS DIVISION - continued
Table 14: Aggregate Statement of Financial Position of the Top 10 Credit Providers
Table 15: Key Financial Figures as at 31 March 2018
Financial Position of the Sector
The sector’s total assets improved by 18% to E4.5 billion in 2017. The increase in total assets was mostly driven by increased demand for loans and advances. The ratio of loans and advances to total assets stood at 54% compared to 62% in the 2016,
showing a decline of 800 basis points. The sector is highly geared with borrowings accounting for 62% of total assets. A majority of the top 10 credit providers are funded by their parent companies, whilst some are funded through bond listings. Total equity increased by 10% to E 1.4 billion, and was approximately 31% of total assets.
Loan Book and Impairments Reserves
Gross Loans and advances grew by 23% to E 2.502 billion compared to an increase of above 30% in 2017 indicating high demand for loans and advances. The industry’s credit impairment reserve also increased from E 109 million to E 142 million in 2018, which was an annual increase of 30% and accounted for 5% of gross loans, indicating that some consumers were struggling to service their debts on time.
The passage of the Consumer Credit Act will greatly assist the sector in terms of fostering responsible lending and reducing reckless lending as it compels credit providers to conduct proper affordability assessments before granting loans. It will also assist credit providers to reduce information asymmetry and adverse selection as it compels all credit providers to deposit complete consumer credit information to at least one credit bureau each time a credit transaction is completed.
31-Mar-2018 31-Mar-2017 31-Mar-2016 Assets E’000 E’000 E’000Loans and Advances 2 502 658 2 047 871 1 883 743Other Assets 1 727 277 1 578 016 1 468 226Cash and Cash Equivalents 341 208 233 401 139 990Total Assets 4 571 143 3 859 288 3 491 960
EquityShare Capital 355 246 354 020 354 020Reserves 1 055 026 927 915 859 727Total Equity 1 410 272 1 281 935 1 213 747
Liabilities Borrowings 2 837 717 2 251 562 1 872 984Other Liabilities 323 154 325 789 405 229Total Liabilities 3 160 871 2 577 351 2 278 213
Equity and Liabilities 4 571 143 3 859 286 3 491 960
Indicator 31-Mar-2018 31-Mar-2017 31 Mach 2016E’000 E’000 (E’000)
Assets 4 571 143 3 859 288 3 491 960Loans and advances 2 502 658 2 047 871 1 883 743Total Equity 1 410 272 1 281 935 1 213 747Total Liabilities 3 160 872 2 577 351 2 278 213
69
CREDIT AND SAVINGS INSTITUTIONS DIVISION - continued

FINANCIAL SERVICES REGULATORY AUTHORITY (FSRA) Annual Report 2018
2018 - CREDIT PROVIDERS KEY BALANCE SHEET INDICATORS
Assets(E’000)
Total Liabilities(E’000)
Loans & Advances(E’000)
Total Equity(E’000)
31-Mar-16
31-Mar-17
31-Mar-18
31-Mar-16 31-Mar-17 31-Mar-18
2,278,2131,883,743
1,213,747
3,160,872
1,410,272
2,502,658
4,571,143
3,859,288
2,577,351
2,047,871
1,281,935
3,491,960
2018 - CREDIT PROVIDERS KEY BALANCE SHEET INDICATORSG GROWTH CURVE
5,000,000
4,500,000
4,000,000
3,500,000
3,000,000
2,500,000
2,000,000
1,500,000
1,000,000
1,500,000
-
31-Mar-16
Assets (E’000) Total Liabilities (E’000) Loans & Advances (E’000) Total Equity (E’000)
31-Mar-17 31-Mar-18
CREDIT AND SAVINGS INSTITUTIONS DIVISION - continued
70

FINANCIAL SERVICES REGULATORY AUTHORITY (FSRA) Annual Report 2018
2017
2016
2015
IMPAIRMENT RESERVES COMPARED & GROSS LOANS
Chart 3: Impairment Reserves Compared to Gross Loans
CREDIT AND SAVINGS INSTITUTIONS DIVISION - continued
Gross Loans E2.15 billion
500,000 1,000,000 1,500,000 2,000,000 2,500,000 3,000,000
Gross Loans E1.62 billion
Gross Loans E2.64 billion
SUPERVISION
Credit providers are expected to comply with the FSRA Act, Consumer Credit Act and the conditions of their licences when carrying out their credit provision activities. To monitor, assess and determine the level of compliance, the FSRA generally follows the offsite and onsite monitoring mechanism. Offsite monitoring entails submission of 4 quarterly reports by credit providers through the Authority’s online submission system irrespective of their size. During the year under review the submission rate and the quality of submitted information, especially amongst the small credit providers, were not up to the required level and standard
and this resulted in several credit providers being issued with administrative fines for late submissions or failure to submit. In the year ahead, the CSI will intensify its offsite enforcement measures and industry engagements so as to improve the submission rate and the quality of information submitted.
Regarding onsite inspections the FSRA conducted 4 onsite inspections, compared to 7 in 2017 wherein 3 were branch inspections and 1 targeted. When licensed credit providers open new branches, the Division conducts an onsite inspection to assess if the branch has the requisite basic infrastructure in place.
Table 16: Types of Onsite Conducted: Credit Providers
Type of Onsite Inspections 2018 2017Full Scope Compliance Inspections 0 1Targeted Compliance Inspections 1 3Operating Offices Inspections 3 3Total Inspections 4 7
71
CREDIT AND SAVINGS INSTITUTIONS DIVISION - continued
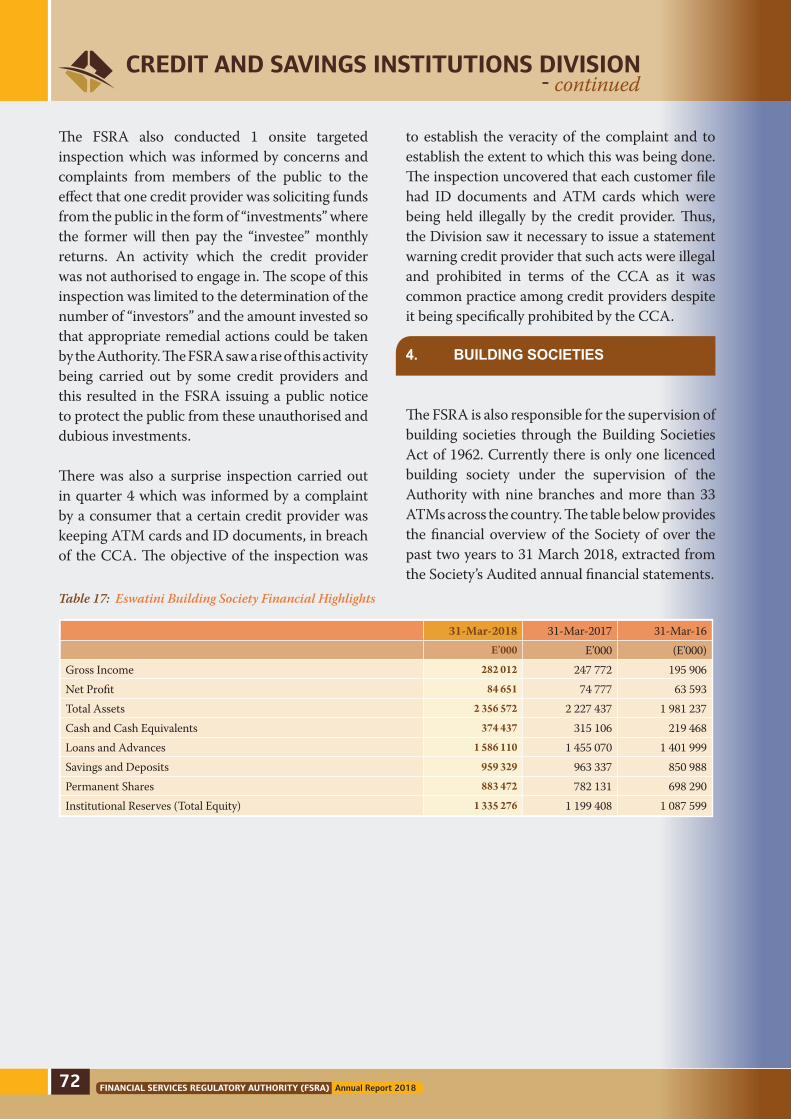
FINANCIAL SERVICES REGULATORY AUTHORITY (FSRA) Annual Report 2018
CREDIT AND SAVINGS INSTITUTIONS DIVISION - continued
31-Mar-2018 31-Mar-2017 31-Mar-16E’000 E’000 (E'000)
Gross Income 282 012 247 772 195 906Net Profit 84 651 74 777 63 593Total Assets 2 356 572 2 227 437 1 981 237Cash and Cash Equivalents 374 437 315 106 219 468Loans and Advances 1 586 110 1 455 070 1 401 999Savings and Deposits 959 329 963 337 850 988Permanent Shares 883 472 782 131 698 290Institutional Reserves (Total Equity) 1 335 276 1 199 408 1 087 599
Table 17: Eswatini Building Society Financial Highlights
72
The FSRA also conducted 1 onsite targeted inspection which was informed by concerns and complaints from members of the public to the effect that one credit provider was soliciting funds from the public in the form of “investments” where the former will then pay the “investee” monthly returns. An activity which the credit provider was not authorised to engage in. The scope of this inspection was limited to the determination of the number of “investors” and the amount invested so that appropriate remedial actions could be taken by the Authority. The FSRA saw a rise of this activity being carried out by some credit providers and this resulted in the FSRA issuing a public notice to protect the public from these unauthorised and dubious investments.
There was also a surprise inspection carried out in quarter 4 which was informed by a complaint by a consumer that a certain credit provider was keeping ATM cards and ID documents, in breach of the CCA. The objective of the inspection was
to establish the veracity of the complaint and to establish the extent to which this was being done. The inspection uncovered that each customer file had ID documents and ATM cards which were being held illegally by the credit provider. Thus, the Division saw it necessary to issue a statement warning credit provider that such acts were illegal and prohibited in terms of the CCA as it was common practice among credit providers despite it being specifically prohibited by the CCA. 4. BUILDING SOCIETIES
The FSRA is also responsible for the supervision of building societies through the Building Societies Act of 1962. Currently there is only one licenced building society under the supervision of the Authority with nine branches and more than 33 ATMs across the country. The table below provides the financial overview of the Society of over the past two years to 31 March 2018, extracted from the Society’s Audited annual financial statements.

FINANCIAL SERVICES REGULATORY AUTHORITY (FSRA) Annual Report 2018
CREDIT AND SAVINGS INSTITUTIONS DIVISION - continued
GrossIncome
Net Profit
TotalAssets
Loans andAdvances
Savings andDeposits
PermanentShares
TotalEquity
Cash andCash
Equivalents
19
5,9
05
24
7,7
72
28
2,0
12
84
,65
1
63
,59
3
74
,77
7 21
9,4
68
31
5,1
06
37
4,4
37
1,9
81
,23
7
2,2
27
,43
7
2,3
55
,67
2
1,4
55
,07
0
1,5
86
,11
0
85
0,9
88
96
3,3
37
95
9,3
29
69
8,2
90
78
2,1
31
88
3,4
72
1,0
87
,59
9
1,1
99
,40
8
1,3
35
,27
6
1,4
01
,99
9
31-Mar-16 (E’000) 31-Mar-17 (E’000) 31-Mar-18 (E’000)
2018 - BUILDING SOCIETY KEY FINANCIAL INDICATORS
73
CREDIT AND SAVINGS INSTITUTIONS DIVISION - continued
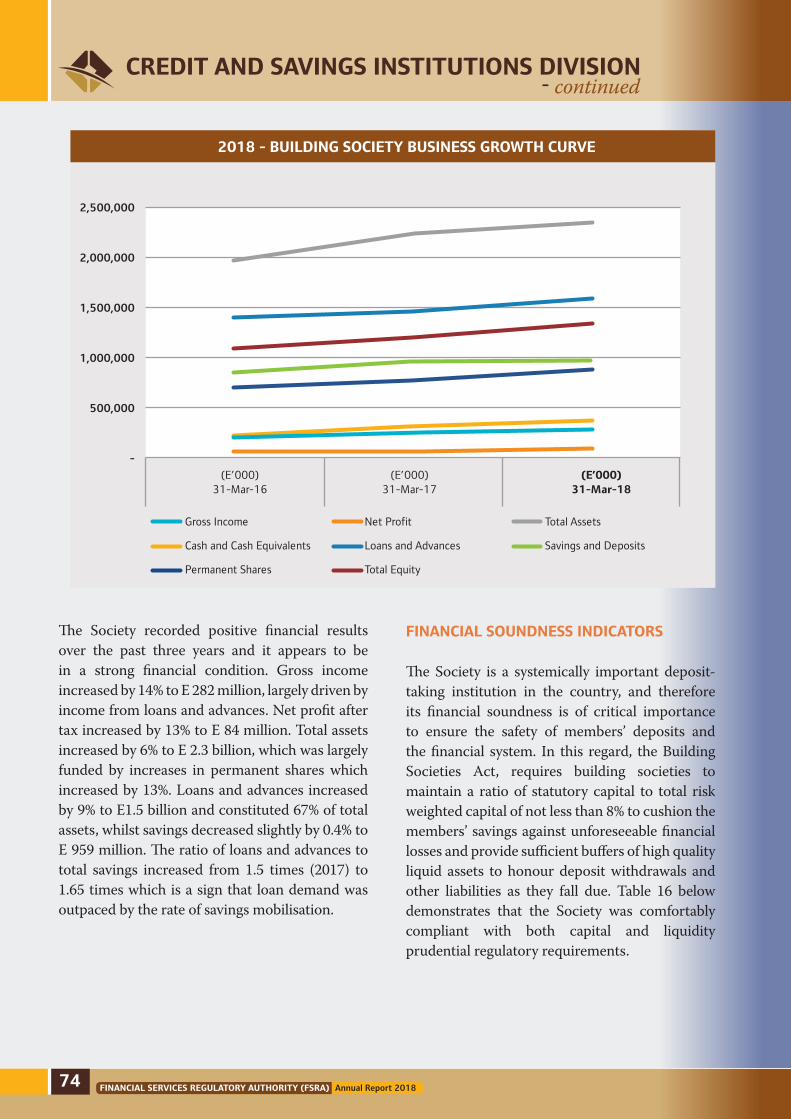
FINANCIAL SERVICES REGULATORY AUTHORITY (FSRA) Annual Report 2018
CREDIT AND SAVINGS INSTITUTIONS DIVISION - continued
2018 - BUILDING SOCIETY BUSINESS GROWTH CURVE
2,500,000
2,000,000
1,500,000
1,000,000
500,000
-
(E’000)31-Mar-16
Gross Income
Cash and Cash Equivalents
Permanent Shares
Net Profit
Loans and Advances
Total Equity
Total Assets
Savings and Deposits
(E’000)31-Mar-17
(E’000)31-Mar-18
The Society recorded positive financial results over the past three years and it appears to be in a strong financial condition. Gross income increased by 14% to E 282 million, largely driven by income from loans and advances. Net profit after tax increased by 13% to E 84 million. Total assets increased by 6% to E 2.3 billion, which was largely funded by increases in permanent shares which increased by 13%. Loans and advances increased by 9% to E1.5 billion and constituted 67% of total assets, whilst savings decreased slightly by 0.4% to E 959 million. The ratio of loans and advances to total savings increased from 1.5 times (2017) to 1.65 times which is a sign that loan demand was outpaced by the rate of savings mobilisation.
FINANCIAL SOUNDNESS INDICATORS
The Society is a systemically important deposit-taking institution in the country, and therefore its financial soundness is of critical importance to ensure the safety of members’ deposits and the financial system. In this regard, the Building Societies Act, requires building societies to maintain a ratio of statutory capital to total risk weighted capital of not less than 8% to cushion the members’ savings against unforeseeable financial losses and provide sufficient buffers of high quality liquid assets to honour deposit withdrawals and other liabilities as they fall due. Table 16 below demonstrates that the Society was comfortably compliant with both capital and liquidity prudential regulatory requirements.
74

FINANCIAL SERVICES REGULATORY AUTHORITY (FSRA) Annual Report 2018
CREDIT AND SAVINGS INSTITUTIONS DIVISION - continued
Table 18: Building Society Financial Soundness Indicator
Table 19: Number and Types of Onsite Inspections Conducted
Financial Soundness Indicator Mar-18 Dec-17 Sep-17 Jun-17Prudential Liquidity Ratio 2.93 3.42 3.15 3.97Capital to Risk Weighted Assets (≥8%) 109% 106% 106% 112%
Type of Inspections 2018 2017Full Scope Prudential Inspections 0 1Branch Office Inspections 3 5Total Inspections 3 6
The ratio of required liquid assets to available liquid assets was three times throughout the four the quarters, whilst the ratio of capital to risk weighted assets was also comfortably above the required level of 8% throughout the year.
SUPERVISION
As part of the Authority’s offsite processes, the Society is required to submit twenty-six (26) prudential reports to the Authority on a monthly and quarterly basis which are used to assess and monitor the Society’s financial soundness on a continuous basis.
In October 2016, the Authority conducted a full scope onsite inspection on the Society operations
which was aimed at assessing the Society’s internal controls, operational systems and governance practices and several recommendations were made to the Society to improve its operational efficiency and financial soundness. Implementation of the recommendations is continuously monitored by the FSRA through periodic progress reports for the Society.
During the year the FSRA conducted 3 onsite inspections of 3 branches which were closed for renovation and structural improvements and this was lower than the number of inspections that were conducted in the previous year as shown on the table below.
75
CREDIT AND SAVINGS INSTITUTIONS DIVISION - continued
REGULATORY DEVELOPMENTS
Several important developments took place during the year, some which were driven by the Authority with a view of the strengthening its regulatory framework for the sub-sectors whilst others were initiated by external policy makers.
CONSUMER CREDIT ACT (CCA)
The major highlight of the year was the coming into effect of the Consumer Credit Act, 2016. The CCA came into effect on 10 March 2017, and it afforded credit providers, debt counsellors and credit bureaus a transitional period of 12 months
which lapsed on 10 March 2018. The Act is now in full force and all affected Credit Providers are expected to be fully compliant to it. The CCA governs all credit agreements in the country with the exception of those entities listed under Section 3 of the Act.
CONSUMER CREDIT REGULATIONS
The Authority completed the development of the Consumer Credit Regulations after extensive stakeholder consultation and engagements. The Authority received industry comments on the regulations between July and August 2017 and also hosted an industry engagement in
FINANCIAL SERVICES REGULATORY AUTHORITY (FSRA) Annual Report 2018
CREDIT AND SAVINGS INSTITUTIONS DIVISION - continued
October 2017. The draft regulations were sent to the Ministry of Finance for publication on 27 November 2017 and the Authority is still awaiting publication of same.
DEVELOPMENT OF SACCO POLICY AND SACCO BILL
The FSRA as a stakeholder participated in the development of a draft SACCO policy and SACCO bill which were piloted by the Ministry of Finance and Centre for Financial Inclusion. The policy and bill seek to ensure that SACCOs have an enabling legal framework that addresses their unique needs in respect of governance, capital, liquidity, supervisory, deposit insurance, the range of permissible services, etc. The Bill is also expected to address and provide clarity on the applicability of the Cooperative Act 2003 in the regulation and supervision of SACCOs in light of section 83 of the FSRA Act which states that Cooperatives Act shall not apply to a SACCO.
AMENDMENT OF THE BUILDING SOCIETIES ACT
The FSRA participated in the amendment of the Building Societies Act which was initiated by the Ministry of Finance. The object of the amendment of the Building Societies Act, 1962 was to provide for the conversion of a building society into a company incorporated in terms of the Companies Act, 2009, and to provide for incidental matters.
TECHNICAL ASSISTANCE FROM THE INTERNATIONAL MONETARY FUND AND THE FINANCIAL SECTOR REFORM AND STRENGTHENING INITIATIVE
The FSRA is currently receiving technical assistance from the International Monetary Fund (IMF). The project will run for two years, and is funded by the Financial Sector Reform and Strengthening Initiative (FIRST). The main
objectives of this Technical Assistance program, under the Credit and Savings Institutions Division is to strengthen the legal, regulatory and supervisory framework for SACCOs, and Building Societies. The specific objectives and expected outcomes under each component are as follows;
To develop and strengthen the regulatory framework for SACCOs, Building Societies that is line with international best practices. Under this component the FSRA will review and develop SACCOs’ guidance notes, SACCOs regulation, and Building Societies Act.
To develop and document a strong off-site surveillance framework for SACCOs, and building societies. Under this component the Division will review and develop the reporting templates for SACCOs and Building Societies to enable sufficient data collection for effective offsite analysis, implementation of progressive offsite risk rating methodology and build staff capacity to identify and monitor behaviours that pose risks to financial stability.
To strengthen the on-site surveillance framework and capacity for SACCOs, and Building societies. Under this component the FSRA will document onsite inspection manuals and build capacity of the staff to undertake onsite inspections.
NATIONAL RISK ASSESSMENT (NRA)
The Division participated in the country’s Anti Money Laundering /Combating Financing of Terrorism (AML/CFT) national risk assessment and was assigned the Other Financial Institutions Module of the World Bank NRA tool. The Division conducted a sector AML/CFT assessment using data collected with risk assessment questionnaires that were sent to
76

FINANCIAL SERVICES REGULATORY AUTHORITY (FSRA) Annual Report 2018
CREDIT AND SAVINGS INSTITUTIONS DIVISION - continued
CREDIT AND SAVINGS INSTITUTIONS DIVISION - continued
the industry. It was however discovered that, a large number of industry players were not aware of the requirements of ML/TF legislation; as a result, they were not forthcoming with reliable and relevant information fearing that doing so would expose their non-compliance with the ML/TF legislation. Preliminary findings of assessment indicate that the non-bank credit and savings sector is vulnerable to money laundering and terrorist financing risks due to poor AML internal control structures and systems.
FINANCIAL SECTOR DEVELOPMENT IMPLEMENTATION PLAN
The Division participated in the implementation of the 2017-2019 Financial Sector Development Implementation Plan (FSDIP). This plan was
formulated by the Government of Eswatini (the Ministry of Finance), Central Bank of Swaziland and Financial Services Regulatory Authority with the support from the private sector and the World Bank. The goal of the FSDIP plan is to reduce poverty and promote economic growth in Eswatini through a stable, diversified, modern, and competitive financial system that provides quality, affordable and accessible financial services to all to support economic growth.
During the year under review the Division was assigned to be the secretariat of the Savings and Credit Working group. This group is responsible for monitoring implementation of 12 policy recommendations related to savings and credit institutions and it consists of representatives from SACCOs, Credit providers and Building Societies.
77

FINANCIAL SERVICES REGULATORY AUTHORITY (FSRA) Annual Report 2018
OPERATIONAL UPDATEREPORT
INSURANCE,RETIREMENT &MEDICAL SCHEMES
78

FINANCIAL SERVICES REGULATORY AUTHORITY (FSRA) Annual Report 2018
OPERATIONAL UPDATEREPORT
Regulated entities in the industry
Medical AidFunds / Schemes
FundAdministrators
RetirementFunds IntermidiariesInsurers
1. INTRODUCTION
Industry Overview
The FSRA is mandated with the regulation and supervision of insurers, medical aid schemes, retirement funds, intermediaries
and fund administrators, among other non-bank financial service providers. In the regulation of the stated entities, the FSRA is guided by the Financial
Services Regulatory Authority Act of 2010, the Retirement Funds Act, 2005 together with the Insurance Act of 2005.
Structure of the Insurance, Retirement Funds & Medical Schemes Industry as at 31 March 2018
The composition of the industry is depicted in the figure below:
Registered Entities
Insurance Industry as at 31 March 2018
During the year under review, the insurance market participants decreased by 10% to 214 participants.
The highest decrease was in respect of individual agents, followed by corporate agents. In the contrary the number of insurers operating in the sector increased as a result of the registration of two new insurers: United Life Assurance Limited and Medscheme Health Insurance Eswatini Limited.
The Retirement Funds Industry as at 31 March 2018
Table 2 below indicates movements in the period under review wherein there were 122 market participants in the retirement funds industry,
inclusive of retirement funds and entities that provide administration services to the sector. The increase in the number of registered entities when compared to the previous period was due to the registration of new beneficiary fund administrator.
Type of Entity Registered as at 31st March 2018
Registered as at 31st March 2017
Changes
Reinsurers 1 1 -Insurers 13 11 2Brokers 29 31 -2Corporate Agents 31 40 -9Individual Agents 137 155 -Total 214 238 -
Table 1: Movements of registered entities in the Insurance Industry
INSURANCE, RETIREMENT FUNDS & MEDICAL SCHEMES OPERATIONAL UPDATE REPORT - continued
79

FINANCIAL SERVICES REGULATORY AUTHORITY (FSRA) Annual Report 2018
Category of Entity Registered as at 31st March 2018
Registered as at 31st March 2017
Changes
Retirement Funds (total) Stand-alone funds and Umbrella Funds
72
61
11
72
61
11
---
Foreign Retirement Funds 41 41 -Retirement Fund Administrators 5 5 -Beneficiary Fund Administrators 3 2 1Total 122 120 2
Table 2: Movements of registered entities in the Retirement Funds Industry
80
INSURANCE, RETIREMENT FUNDS & MEDICAL SCHEMES OPERATIONAL UPDATE REPORT - continued
Medical Aid Schemes as at 31 March 2018
The number of medical aid schemes and administrators remained constant from the previous year.
On-site Inspections
During the period under review, five (5) onsite inspections were conducted, in terms of section 62 of the Financial Services Regulatory Authority Act, 2010. Table 4 below shows the types of entities that were inspected during the period:
Type of Entity Registered as at 31st March 2018
Registered as at 31st March 2017
Medical Aid Schemes 2 2
Medical Aid Administrators 1 1
Total 3 3
Type of Entity Number of Entities InspectedRetirement Funds 2
Brokers 3
Total 5
Table 3: Movements in number of registered medical aid schemes and administrators
Table 4: Onsite Inspections conducted during the period
The following compliance concerns were identified through the on-site inspections:
Brokers 1. The lack of service level agreements between
some of the insurers and brokers. The lack of agreements is of concern as the agreement guides the working relationship between the two parties and clearly specifies issues of collection and remittance premiums, disclosures to policy holders as well as specifies
dispute resolution procedures among others issues.
2. There is a delay in seeking approval from the Authority of changes that are made to the Shareholding, Board and Management of the company in line with the Fitness and Propriety Requirements of key persons.
3. Absence of adequate risk management controls and review of the sufficiency of controls that are in place to ensure that risk exposures are identified and well mitigated.

FINANCIAL SERVICES REGULATORY AUTHORITY (FSRA) Annual Report 2018 81
INSURANCE, RETIREMENT FUNDS & MEDICAL SCHEMES OPERATIONAL UPDATE REPORT - continued
INSURANCE, RETIREMENT FUNDS & MEDICAL SCHEMES OPERATIONAL UPDATE REPORT - continued
4. Lack of sufficient controls on collection and remittance of premiums due to insurers was also identified as a concern as well as the lack of separation of duties in the operation of brokers which exposes the business to risk.
5. There were no strategic plans in place outlining the future objectives of the brokers and how to resolve identified weakness in the business.
Retirement Funds1. Abdication of duties by Trustees to Retirement
Fund Administrators continues to be a problem. 2. Late remittance of contributions by the
employers especially entities that are funded by Government
3. Late payment of member benefits.4. The absence of signed service level agreements
with service providers was found to be a common occurrence within the retirement funds sector. Having service level agreements provides a level of control over outsourced functions as the agreement guides the working relationship and stipulates clear expectations for all parties involved.
5. Delay in seeking approval from the Authority for rule amendments and changes made to the Board of Trustees. This is of concern as the fund rules guide the operations of the fund and the Trustees are responsible for managing the operations of the fund in line with the requirements of the Retirement Funds Act, 2005.
Off-Site Interventions
The following compliance concerns were identified through offsite monitoring:
Misuse of brokerage licenceA broker was found to be misusing a brokerage licence wherein the broker was providing financial advisory services and not marketing insurance products which is the core business of a broker. The said company was therefore required to apply for a licence which is in line their business model and their brokerage licence was withdrawn.
Liquidation In the period under review one broker received a Court Order to undergo liquidation. Prior to receiving the Court Order the FSRA had withdrawn the broker’s licence due to financial insolvency and misconduct in the use of premiums.
Key Regulatory Highlights during the period
IMF First Initiative Technical Assistance
The FSRA is currently receiving technical assistance from the IMF whose aim is to improve the supervision of the Non-bank Financial Sector, harmonise supervisory processes within the FSRA Divisions and to develop a risk based supervisory framework for the supervised sectors.
AML/CFT National Risk Assessment As the regulator of the Non-Bank Financial Sector, the FSRA was tasked with conducting a risk assessment of all the sectors under its supervision. Following the data collection exercise that was conducted in the previous year, FSRA completed the sector analysis as at 31 March 2018 and submitted a draft report on the insurance sector’s exposure to money laundering to the Ministry of Finance.
Financial Sector Development Implementation Plan
The Insurance and Retirement Funds and Medical Schemes Division is part of the Financial Sector Development Implementation Plan (FSDIP) and has been given the responsibility of performing Secretariat services for the Insurance and Retire-ment Funds working group.
Regulatory Challenges
FSRA continues to experience problems with respect to:a) The Authority has received complaints
from individual members and members of foreign retirement funds. Of concern is the insufficient knowledge shown by the members on their rights and benefits. Due to matters of jurisdiction, the members have limited legal recourse when participating in foreign retirement funds as opposed to member participating in local retirement funds, for Eswatini members participating in foreign retirement funds.
b) Inadequate time dedicated to fund related issues in the administration of retirement funds by trustees which leads to administrative weaknesses and failure to attend to governance and member issues timeously.

FINANCIAL SERVICES REGULATORY AUTHORITY (FSRA) Annual Report 2018
LONG TERMINSURANCE
CONSOLIDATED FINANCIAL PERFORMANCE
As at 31 March 2018, there were seven (7) long term insurers operating in Eswatini, namely:
Eswatini Royal Insurance Corporation (ESRIC) Liberty Life Eswatini Metropolitan Life Eswatini Old Mutual Eswatini Safrican Dups Direct and Orchard
This section outlines how the Long-Term Insurance industry performed in the year under review. Comparative data for the year ended 31 March 2017 is also analysed in comparison to 2018. Included also, is performance for the past 5 years in order to determine how the industry has been performing thus far.
Worth mentioning, for the benefit of the reader is that the data used in this report was captured from Audited Financial Statements of the different entities which have different financial year end months. However, these figures resemble the best estimates of the Long-Term Insurance industry as at 31 March 2018.
FINANCIAL PERFORMANCE
82

FINANCIAL SERVICES REGULATORY AUTHORITY (FSRA) Annual Report 2018
FINANCIAL PERFORMANCE
LONG-TERM INSURANCE BUSINESS FINANCIAL PERFORMANCE - continued
LONG TERM INSURANCE BUSINESS – INDUSTRY INCOME STATEMENTYear end
Notes 31-Mar-2018 31-Mar-2017 31-Mar-2016 31-Mar-2015 31-Mar-2014
Premiums receivedInsurance premiums revenue 1 661 744 891 625 394 631 779 849 304 481 740 637 714 622 855 Less: (Insurance Premiums ceded to reinsurers)
1 (67 379 221) (62 721 784) (57 911 949) (38 045 200) (28 657 249 )
Net Insurance premiums revenue 594 365 670 562 672 847 721 937 355 443 695 437 685 965 606
Fee Income 2 24 857 908 20 813 630 14 071 065 10 989 414 10 543 148 Investment Income 3 240 283 933 79 661 018 188 962 365 188 194 433 237 892 735 Net Income (A) 859 507 511 663 147 495 924 970 785 642 879 284 934 401 489
Net Insurance Benefits and Claims 4 (546 791 626) (431 634 529) (685 613 604) (478 223 312) (741 013 633) Expenses for the acquisition of insurance and investments contracts (Commission)
5 (38 739 722) (30 856 285) (26 907 794) (22 959 883) (21 846 587)
Expenses for marketing and administration
5 (4 391 242) (8 014 722) (6 987 879) (4 549 000) (3 604 000)
Other operating expenses 6 (174 314 918) (125 359 493) (99 598 995) (95 198 154) (79 604 941) Total expenses (B) (764 237 508) (595 865 029) (819 108 272) (600 930 349) (846 069 161)
Profit/(Loss) before tax (A - B) 95 270 003 67 282 466 105 862 513 41 948 935 88 332 328 Taxation (23 068 627) (8 647 783) (16 326 451) (12 368 935) (32 344 908) Net Profit for the year 72 201 376 58 634 683 89 536 062 29 580 000 55 987 420
1 data used in this report was captured from audited financial statements of the different entities which have different financial year ends. However, these
figures resemble the best estimates of the long-term insurance industry as at 31 March 2018.
Income Statement - Key highlights
The Long Term insurance recorded a total net premium insurance revenue of E594 million (2017: E563 million). This is only 6% more than the 2017 results of E563 million. Net income in the year under review increased by 30% from the
previous year. This increment in income is also accompanied by a 28% increase in expenses in the long term insurance industry. Net profit for the year ended 31 March 2018 for the long term industry was E72 million, 23% more than the previous year.
83

FINANCIAL SERVICES REGULATORY AUTHORITY (FSRA) Annual Report 2018
LONG-TERM INSURANCE BUSINESS FINANCIAL PERFORMANCE - continued
LONG TERM INSURANCE - 5 YEARS - KEY INCOME STATEMET FINANCIAL INDICATORSYear End
31-Mar-2018 31-Mar-2017 31-Mar-2016 31-Mar-2015 31-Mar-2014Net Insurance premiums revenue 594 365 670 562 672 847 721 937 355 443 695 437 685 965 606 Net Income (A) 859 507 511 663 147 495 924 970 785 642 879 284 934 401 489 Total expenses (B) 764 237 508 595 865 029 819 108 272 600 930 349 846 069 161 Net Profit for the year 72 201 376 58 634 683 89 536 062 29 580 564 55 987 420
1,000,000,000
900,000,000
800,000,000
700,000,000
600,000,000
500,000,000
400,000,000
300,000,000
200,000,000
100,000,000
0
900,000,000
800,000,000
700,000,000
600,000,000
500,000,000
400,000,000
300,000,000
200,000,000
100,000,000
0
31-Mar-16 31-Mar-1731-Mar-1531-Mar-1431-Mar-13
2018 - LONG TERM INSURANCE KEY INCOME STATEMENT FINANCIAL INDICATORS
Net Insurance Premiums Revenue Net Income (A)
Total Expenses (B) Net Profit for the Year
84

FINANCIAL SERVICES REGULATORY AUTHORITY (FSRA) Annual Report 2018
LONG-TERM INSURANCE BUSINESS FINANCIAL PERFORMANCE - continued
LONG-TERM INSURANCE BUSINESS FINANCIAL PERFORMANCE - continued
LONG TERM INSURANCE – INDUSTRY BALANCE SHEETYear End
31-Mar-2018 31-Mar-2017 31-Mar-2016 31-Mar-2015 31-Mar-2014ASSETS
Property, Plant and Equipment 3 891 422 3 414 493 4 026 297 2 820 840 2 220 959Intangible assets 2 322 940 2 886 658 2 947 285 3 727 412 2 679 940Investments 3 753 367 000 3 332 478 667 3 157 257 168 2 567 704 185 2 359 952 025Reinsurance assets 31 660 626 26 107 384 22 763 615 18 512 739 11 636 180Loans and receivables 112 735 587 353 934 580 100 933 683 90 187 884 66 377 243Technical assets 2 339 125 2 099 880 9 613 561 9 604 329 5 547 114Deferred tax 2 316 933 3 298 667 6 884 535 2 375 375 1 595 418Total assets 3 908 633 633 3 724 220 329 3 304 426 144 2 694 932 764 2 450 008 879
EQUITY Capital and reserves Ordinary shares 46 872 000 46 872 000 46,872,000 46 362 000 46 872 000Share premium and Shareholders' funding
103 874 587 103 874 587 103 874 587 103 874 587 103 874 587
Other reserves 35 418 836 22 906 702 24 906 702 - 5 346 737Retained earnings 328 593 038 296 263 074 291 217 024 251 775 053 230 517 324 514 758 461 469 916 363 466 870 313 402 011 640 386 610 648
LIABILITIES Insurance contracts/policy holders' liabilities
1 469 978 128 1 886 607 838 1 229 036 449 1 135 569 808 1 008 303 084
Investment contract liabilities 1 790 732 997 1 238 773 370 1 465 355 556 1 060 758 142 929 995 883Derivative financial instruments - - 5 029 789 - -Trade and other payables 121 563 476 125 051 156 116 172 883 86 832 019 122 537 841Deferred income tax - - 2 448 636 - 278 423Taxation 11 600 571 3 871 602 19 512 518 9 761 155 2 283 000Total liabilities 3 393 875 172 3 254 303 966 2 837 555 831 2 292 921 124 2 063 398 231
Total equity and liabilities 3 908 633 633 3 724 220 329 3 304 426 144 2 694 932 764 2 450 008 879
85

FINANCIAL SERVICES REGULATORY AUTHORITY (FSRA) Annual Report 2018
LONG-TERM INSURANCE BUSINESS FINANCIAL PERFORMANCE - continued
LONG TERM INSURANCE – INDUSTRY BALANCE SHEETYear End
31-Mar-2018 31-Mar-2017 31-Mar-2016 31-Mar-2015 31-Mar-2014TOTAL ASSETS 3 908 633 633 3 724 220 329 3 304 426 144 2 694 932 764 2 450 008 879 TOTAL CAPITAL AND RESERVES 514 758 461 469 916 363 466 870 313 402 011 640 386 610 648 TOTAL LIABILITIES 3 393 875 172 3 254 303 966 2 837 555 831 2 292 921 124 2 063 398 231
LONG TERM INSURANCE - 5 YEARS - KEY BALANCE SHEET TRENDS
4,500,000,000
4,000,000,000
3,500,000,000
3,000,000,000
2,500,000,000
2,000,000,000
1,500,000,000
1,000,000,000
500,000,000
0
4,000,000,000
3,500,000,000
3,000,000,000
2,500,000,000
2,000,000,000
1,500,000,000
1,000,000,000
500,000,000
0
31-Mar-17 31-Mar-1831-Mar-1631-Mar-1531-Mar-14
Total Assets Total Capital and Reserves Total Liabilities
Balance Sheet - Key highlights
Total assets held by long term insurers amounted to E3.9 billion. This shows an increase of 5% when compared to 2017 figures of E3.7 billion. About 96% of the assets relates to investment assets valued at
E3.8 billion. Capital and reserves are valued at E515 million. This is 10% increase from the previous year where E470 million was for capital and reserves. Liabilities increased by 4% from the previous year to the current year.
The market trend depicted by the graph above shows a growing balance sheet in the last year. The pattern of total assets, total liabilities and total net
assets shows that the long term insurance has been growing from year to year in the last five years.
86

FINANCIAL SERVICES REGULATORY AUTHORITY (FSRA) Annual Report 2018
LONG-TERM INSURANCE BUSINESS FINANCIAL PERFORMANCE - continued
LONG-TERM INSURANCE MARKET SHARE
LONG TERM INSURANCE BUSINESS – PREMIUM MARKET SHARESENTITY % MARKET SHARE GROSS PREMIUMS 31-Mar-2018 31-Mar-2017 31-Mar-2018 31-Mar-2017
ESRIC 36% 28% 241 141 238 161 287 771 OLD MUTUAL 23% 28% 152 130 802 161 825 762METROPOLITAN 15% 18% 100 156 000 100 156 000 LIBERTY LIFE 13% 12% 88 391 000 71 417 000 DUBS DIRECT 6% 7% - 37 697 355 41 474 961 ORCHARD 4% 4% - 25 004 622 20 777 698SAFRICAN 3% 3% - 17 223 874 14 489 989 TOTAL INDUSTRY PREMIUMS 100% 100% 661 744 891 571 429 181
Gross Premium Income - Gross premium income for the long-term insurance industry increased by 16% to E662 million in 2018 from E571 million in 2017.
Gross Premium Market share - The table above shows the different long-term insurers and their different market share percentages. The following changes have been noted from the 2016 to 2017 financial year: SRIC continued to lead the industry, with an
increase in market share from 28% in 2017 to 36% in 2018.
Old mutual saw a decrease from 28% in 2017 to 23% in 2018.
Metropolitan decreased from 18% in 2017 to 15% in 2018.
Liberty Life saw a slight increase from 12% in 2017 to 13% in 2018.
Safrican remained stagnant at 3% both in 2017 and 2018.
Orchard also remained stagnant 4%, having converted its business from Short Term to Long term business during the year 2017.
31 March 2018- LONG TERM INSURANCEGROSS PREMIUM MARKET SHARE
31 March 2017 - LONG TERM INSURANCEGROSS PREMIUM MARKET SHARE
SAfrican3%
SAfrican3%
LibertyLife 13%
LibertyLife 12%
DUPSDirect
6%
DUPSDirect
7%
Orchard4%
Orchard4%
SRIC36%
SRIC28%
Metropolitan15%
Metropolitan18%Old Mutual
23%Old Mutual
28%
87
LONG-TERM INSURANCE BUSINESS FINANCIAL PERFORMANCE - continued
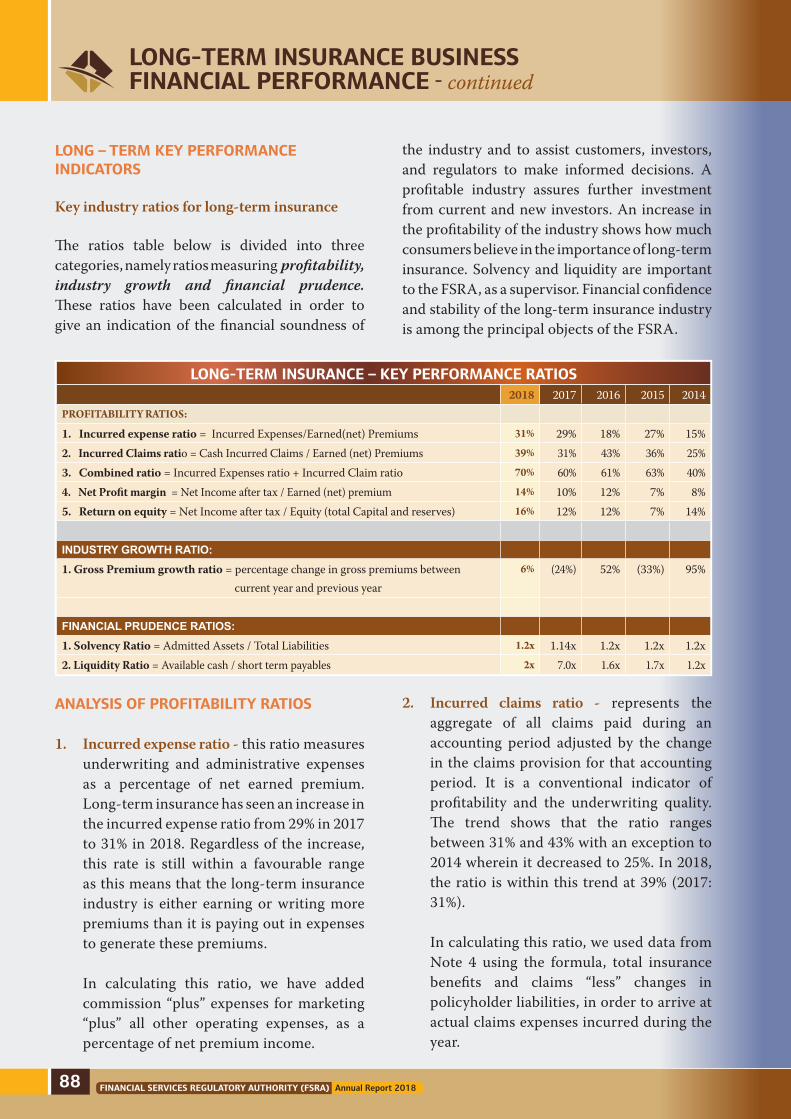
FINANCIAL SERVICES REGULATORY AUTHORITY (FSRA) Annual Report 2018
LONG-TERM INSURANCE BUSINESS FINANCIAL PERFORMANCE - continued
LONG – TERM KEY PERFORMANCE INDICATORS
Key industry ratios for long-term insurance
The ratios table below is divided into three categories, namely ratios measuring profitability, industry growth and financial prudence. These ratios have been calculated in order to give an indication of the financial soundness of
the industry and to assist customers, investors, and regulators to make informed decisions. A profitable industry assures further investment from current and new investors. An increase in the profitability of the industry shows how much consumers believe in the importance of long-term insurance. Solvency and liquidity are important to the FSRA, as a supervisor. Financial confidence and stability of the long-term insurance industry is among the principal objects of the FSRA.
LONG-TERM INSURANCE – KEY PERFORMANCE RATIOS 2018 2017 2016 2015 2014PROFITABILITY RATIOS:
1. Incurred expense ratio = Incurred Expenses/Earned(net) Premiums 31% 29% 18% 27% 15%2. Incurred Claims ratio = Cash Incurred Claims / Earned (net) Premiums 39% 31% 43% 36% 25%3. Combined ratio = Incurred Expenses ratio + Incurred Claim ratio 70% 60% 61% 63% 40%4. Net Profit margin = Net Income after tax / Earned (net) premium 14% 10% 12% 7% 8%5. Return on equity = Net Income after tax / Equity (total Capital and reserves) 16% 12% 12% 7% 14%
INDUSTRY GROWTH RATIO:1. Gross Premium growth ratio = percentage change in gross premiums between current year and previous year
6% (24%) 52% (33%) 95%
FINANCIAL PRUDENCE RATIOS:1. Solvency Ratio = Admitted Assets / Total Liabilities 1.2x 1.14x 1.2x 1.2x 1.2x2. Liquidity Ratio = Available cash / short term payables 2x 7.0x 1.6x 1.7x 1.2x
ANALYSIS OF PROFITABILITY RATIOS
1. Incurred expense ratio - this ratio measures underwriting and administrative expenses as a percentage of net earned premium. Long-term insurance has seen an increase in the incurred expense ratio from 29% in 2017 to 31% in 2018. Regardless of the increase, this rate is still within a favourable range as this means that the long-term insurance industry is either earning or writing more premiums than it is paying out in expenses to generate these premiums.
In calculating this ratio, we have added commission “plus” expenses for marketing “plus” all other operating expenses, as a percentage of net premium income.
2. Incurred claims ratio - represents the aggregate of all claims paid during an accounting period adjusted by the change in the claims provision for that accounting period. It is a conventional indicator of profitability and the underwriting quality. The trend shows that the ratio ranges between 31% and 43% with an exception to 2014 wherein it decreased to 25%. In 2018, the ratio is within this trend at 39% (2017: 31%).
In calculating this ratio, we used data from Note 4 using the formula, total insurance benefits and claims “less” changes in policyholder liabilities, in order to arrive at actual claims expenses incurred during the year.
88

FINANCIAL SERVICES REGULATORY AUTHORITY (FSRA) Annual Report 2018
3. Combined ratio - it is a combination of incurred claims ratio and the incurred expense ratio. It is a reflection of the underwriting expense as well as operating expense structure of the insurers. As a benchmark, ideally it should be below 100%. A combined ratio of more than 100% is an indication that the industry is making underwriting losses. The trend shows that the last 5 years the ratio has been between 40% and 60. In 2018, the ratio is within this range at 70%. The ratio shows that the industry is able to cater for its expenses without relying on investment income.
4. Net profit ratio - this ratio measures net insurance profit as a percentage of net earned premium. This trend indicates the ratio has increased from 10% in 2017 to 14% in 2018. This is a good return for owners of capital, seeing that in 2015 the industry earned a low 7%.
5. Return on equity (ROE) ratio - the ratio measures insurers’ efficiency in utilising capital. It reflects the level of capital that shareholders have subscribed, and the return directed at them. The trend shows that the ratio has been between to 7% and 16% in the past 5 years. However, in 2016 and 2017, the ratio has remained constant at 12%. In 2018, the industry ratio improved significantly to 16%.
ANALYSIS OF INDUSTRY GROWTH RATIO
6. Premium growth ratio - this ratio measures the level of industry growth from year to year. The long-term insurance industry had an improvement in premium growth ratio as it moved from -24% to 6%.
FINANCIAL SOLVENCY
7. Solvency ratio - the solvency ratio of an insurance company is the size of its capital relative to all the assumed risk. It is a measurement of how much the insurer has in assets versus how much it owes. The solvency ratio remained stable at 1.2 times for the last 5 years. In 2017, it dropped slightly to 1.14 times. In 2018, it is back to the 1.2x trend, implying that the industry is still able to meet its future obligations.
8. Liquidity ratio - this ratio measures the ability of the industry to meet its short-term obligations. During the period under review, the ratio shot up 7 times, growing from 1.6 times in 2016. According to the ratio, the industry is able meet its short- term payables as they are due.
LONG-TERM INSURANCE BUSINESS FINANCIAL PERFORMANCE - continued
89
LONG-TERM INSURANCE BUSINESS FINANCIAL PERFORMANCE - continued

FINANCIAL SERVICES REGULATORY AUTHORITY (FSRA) Annual Report 2018
LONG-TERM INSURANCE BUSINESS FINANCIAL PERFORMANCE - continued
LONG TERM INVESTMENTS - LOCAL Vs FOREIGN ASSETS 31-Mar-2018 31-Mar-2017 31-Mar-2016 31-Mar-2015 31-Mar-2014Total local investments 1 304 686 798 1 556 638 743 438 617 923 292 429 078 314 259 040Total foreign investments 2 448 680 202 1 785 995 146 2 718 639 245 2 275 276 108 2 045 693 986Total Investments (E) 3 753 367 000 3 342 633 889 3 157 257 168 2 567 705 186 2 359 953 026
% Local investments to total investments 35% 47% 14% 11% 13%% Foreign investments to total investments 65% 53% 86% 89% 87%Total Investments (%) 100% 100% 100% 100% 100%
2018 - LONG TERM LOCAL INVESTMENTS
Eswatini Stock Exchange
11%
Bonds26%
Property3%
Cash and Moneymarket instruments
60%
2017 - LONG TERM LOCAL INVESTMENTS
Swaziland Stock Exchange
9%
Bonds29%
Property4%
Cash and Moneymarket instruments
58%
LONG TERM INSURANCE - LOCAL INVESTMENTS 31-Mar-2018 31-Mar-2017 31-Mar-2016 31-Mar-2015 31-Mar-2014Eswatini Stock Exchange 142 618 400 142 235 900 16 813 120 5 076 120 5 076 120Bonds 339 341 007 455 705 780 106 409 501 45 168 501 35 372 010 Property 43 300 000 57 000 000 80 078 899 80 078 899 108 004 815Cash and money market instruments 779 427 391 901 697 063 235 316 403 146 134 558 150 089 095TOTAL LOCAL INVESTMENTS 1 304 686 798 1 556 638 743 438 617 923 276 458 078 298 542 040
90

FINANCIAL SERVICES REGULATORY AUTHORITY (FSRA) Annual Report 2018
LONG-TERM INSURANCE BUSINESS FINANCIAL PERFORMANCE - continued
LONG TERM INSURANCE - FOREIGN INVESTMENTS 31-Mar-2018 31-Mar-2017 31-Mar-2016 31-Mar-2015 31-Mar-2014Johannesburg Stock Exchange 1 101 220 378 1 294 644 138 1 962 423 617 1 573 307 181 1 557 656 233Cash and Money Market instruments 360 105 016 106 592 000 345 009 939 - 49 494 273Bond exchange of South Africa 378 383 156 189 493 544 411 205 689 388 284 689 233 021 519Offshore equities 32 273 883 106 343 890 - - -Offshore bonds 19 215 000 33 769 575 - 313 684 238 205 521 961Property 557 482 769 55 152 000 - - -TOTAL FOREIGN INVESTMENTS 2 448 680 202 1 785 995 147 2 718 639 245 2 275 276 108 2 045 693 986
2017 - LONG TERM LOCAL INVESTMENTS
Property3%
JohannesburgStock Exchange
72%
Cash and Money Market instruments
72%
Offshore Bonds -2%
Bond exchange of South
Africa - 11%
Offshoreequities
6%
2018 - LONG TERM LOCAL INVESTMENTS
Property1%
JohannesburgStock Exchange
45%
Cash and Money Market instruments
23%Offshore
bonds -2%
Bond exchange of South
Africa - 15%
LONG TERM INSURANCE INVESTMENTS - GROWTH CURVE
4,000,000,000
3,500,000,000
3,000,000,000
2,500,000,000
2,000,000,000
1,500,000,000
1,000,000,000
500,000,000
0
Total Investments (E)Total Foreign InvestmentsTotal local investments
2010 2011 2012 2013 2014 2015 2016 2017 2018
91
LONG-TERM INSURANCE BUSINESS FINANCIAL PERFORMANCE - continued

FINANCIAL SERVICES REGULATORY AUTHORITY (FSRA) Annual Report 2018
LONG-TERM INSURANCE BUSINESS FINANCIAL PERFORMANCE - continued
NOTE 1: PREMIUM REVENUEYear End
31-Mar-2018 31-Mar-2017 31-Mar-2016 31-Mar-2015 31-Mar-2014Long term insurance contracts 600 816 581 571 429 181 748 277 130 448 641 042 699 383 928
Contributions from Pension and Retirement annuity schemes
60 928 310 53 965 450 31 572 174 31 087 640 15 238 927
Total Gross Premiums 661 744 891 625 394 631 779 849 304 479 728 682 714 622 855Reinsurance Premiums Ceded To Reinsurers (67 379 221) (62 721 784) (57 911 949) (37 779 300) (28 049 794)
NOTE 2: FEE INCOMEYear End
31-Mar-2018 31-Mar-2017 31-Mar-2016 31-Mar-2015 31-Mar-2014
Policy administration services: Insurance contracts - - - -Investment contracts 8 961 000 17 715 383 13 824 646 10 946 990 10 471 491
Commission Income 15 824 784 12 000 62 894 13 200 71 657Administration fees 72 124 3 086 247 183 525 Total fee income 24 857 908 20 813 630 14 071 065 10 960 190 10 543 148
NOTE 3: INVESTMENT INCOMEYear End
31-Mar-2018 31-Mar-2017 31-Mar-2016 31-Mar-2015 31-Mar-2014
Dividend income 129 060 419 123 723 281 124 832 099 142 212 454 104 380 429Interest income 110 263 106 28 663 156 22 871 023 19 069 668 17 459 534Net realised gains on Financial Assets 8 545 158 - - - -Net fair value gains through PL (13 768 384) (72 725 419) 41 217 058 39 148 311 116 052 772Rental Income 6 184 634 - 42 185 - -Total investment income 240 284 933 79 661 018 188 962 365 200 430 433 237 892 735
LONG TERM INSURANCE BUSINESS NOTES TO THE FINANCIAL STATEMENTS
92

FINANCIAL SERVICES REGULATORY AUTHORITY (FSRA) Annual Report 2018
LONG-TERM INSURANCE BUSINESS FINANCIAL PERFORMANCE - continued
NOTE 4: INSURANCE BENEFITS AND CLAIMSYear End
31-Mar-2018 31-Mar-2017 31-Mar-2016 31-Mar-2015 31-Mar-2014Insurance Benefits and Claims Death, maturity and surrender benefits (213 311 679) (192 775 165) (154 543 182) (149 995 399) (136 836 453)Investment contracts (34 206 315) (30 033 488) (29 881 313) 2 913 465 (13 496 465)Increase in policyholder liability (345 270 917) (256 050 758) (495 937 287) (316 424 360) (564 331 241)Pension and Retirement claims (28 120 693) (15 992 261) (12 507 332) (8 798 784) (6 728 407)Increase in Capital portion of Investment products
- 38 972 764 (15 670 243)
Less: Reinsurance recoveries 42 829 978 - 22 925 753 (5 261 443) (19 621 067)
(578 079 626) (431 634 529) (685 613 604) (477 566 521) (741 013 633)
NOTE 5: COMMISSION AND MARKETING EXPENSESYear End
31-Mar-2018 31-Mar-2017 31-Mar-2016 31-Mar-2015 31-Mar-2014a) Expenses for the acquisition of insurance contract (Commission paid):
Costs incurred and expensed in the year (50 268 742) (36 598 047) (33 089 189) (28 434 829) (27 647 604)Less: (Commission earned from reinsurance contracts)
11 529 020 5 741 762 6 181 395 5 474 946 5 801 017
Total expenses for the acquisition of insurance contracts
(38 739 722) (30 856 285) (26 907 794) (22 959 883) (21 846 587)
b) Marketing expenses Marketing expenses (620 000) (583 000) (583 000) (1 399 000) (1 470 000)Bancassurance (3 771 242) (7 431 722) (6 404 879) (3 150 000) (2 134 000) (4 391 242) (8 014 722) (6 987 879) (4 549 000) (3 604 000)
Total Commission and Marketing expenses (42 130 964) (38 871 007) (33 895 673) (27 508 883) (25 450 587)
93
LONG-TERM INSURANCE BUSINESS FINANCIAL PERFORMANCE - continued

FINANCIAL SERVICES REGULATORY AUTHORITY (FSRA) Annual Report 2018
NOTE 6: OTHER EXPENSESYear End
31-Mar-2018 31-Mar-2017 31-Mar-2016 31-Mar-2015 31-Mar-2014
Auditors remuneration (1 621 944) (1 008 824) (1 104 721) (1 420 922) (1 257 097)Depreciation (3 293 019) (949 635) (640 195) (6 575 391) (4 561 485)Employee Costs (26 448 822) (25 615 112) (23 771 988) (18 305 595) (16 595 490)Interest expense (594 403) (3 540 245) - (2 068 922) (1 295 486)Purchases of goods and services (13 753 483) (15 543 568) (16 274 627) (13 971 901) (8 354 580)IT costs (6 659 940) (8 394 518) (5 844 365) (1 235 000) (1 595 640)Management Fees (56 745 878) (53 417 120) (43 395 854) (47 260 135) (42 206 149)FSRA levy fees (13 108 596) (11 019 204) (10 890 000) (224 000) (450 000)Directors fees and travel (5 580 917) (3 687 754) (4 360 187) (2 622 440) (1 954 680)Operating lease rentals (2 513 008) (2 183 513) (2 037 432) (1 513 848) (1 434 334)Other (12 620 708) (912 209) (796 516)Total other expenses (142 940 718) (125 359 493) (99 598 995) (95 198 154) (79 704 941)
LONG-TERM INSURANCE BUSINESS FINANCIAL PERFORMANCE - continued
94

FINANCIAL SERVICES REGULATORY AUTHORITY (FSRA) Annual Report 2018
LONG-TERM INSURANCE BUSINESS FINANCIAL PERFORMANCE - continued
As at 31 March 2018 there were five short-term insurers in Eswatini namely:
Eswatini Royal Insurance Corporation Lidwala Insurance Company Momentum Insurance Company Phoenix Eswatini Assurance Company
United General Insurance Limited
The following sections outline short-term industry performance during the year ended 31 March 2018. Industry trends for the last 5 years will be analysed1.
95
SHORT-TERMINSURANCE BUSINESSFINANCIAL PERFORMANCE

FINANCIAL SERVICES REGULATORY AUTHORITY (FSRA) Annual Report 2018
SHORT TERM INSURANCE - INDUSTRY SUMMARYSTATEMENT OF COMPREHENSIVE INCOME
Year end
Notes 31-Mar-2018 31-Mar-2017 31-Mar-2016 31-Mar-2015 31-Mar-2014Premiums receivedInsurance premiums revenue 1 631 468 248 583 920 198 535 672 719 509 052 030 456 951 262Less: (Insurance Premiums ceded to reinsurers) 1 (232 846 442 (216 695 230) (198 456 913) (198 519 738) (180 014 817)Net Insurance premiums revenue 398 621 806 367 224 968 337 215 806 310 532 292 276 936 445
Fee Income 2 15 455 018 11 793 059 10 390 875 14 377 223 11 495 602Investment Income 3 37 319 623 25 270 621 18 349 111 22 964 829 30 239 306Other operating income 4 588 000 582 000 - - -Net Income (A) 451 984 447 404 870 648 365 955 792 347 874 344 318 671 353
Insurance claims and loss adjustment expenses 5 213 491 297 150 806 892 129 404 333 126 931 484 186 462 696
Less: (Insurance claims and loss adjustment expenses recovered from reinsurers)
5 (83 146 779) (33 835 242) (22 270 797) (21 934 361) (95 867 505)
Net insurance claims 130 344 518 116 971 650 107 133 536 104 997 123 90 595 191
Expenses for the acquisition of insurance contracts (Commission)
6 24 713 758 18 038 635 13 066 928 17 899 725 23 813 518
Expenses for marketing 6 2 621 724 1 172 236 955 343 955 343 1 118 235Other operating expenses 7 117 026 626 96 833 744 74 004 579 75 476 232 77 189 180Total expenses (B) 274 706 626 233 016 265 195 160 386 199 328 423 192 716 124
Results from Operating activities (A - B) 177 277 821 171 854 383 170 795 406 148 545 921 125 955 229Less: Finance Costs - - - - (1 411)Profit/(Loss) before tax 177 277 821 171 854 383 170 795 406 148 545 921 125 953 818
Less: (Income tax expense) (50 564 178) (48 194 978) (37 066 346) - (30 456 151)Net Profit for the year 126 713 643 123 659 405 133 729 060 148 545 921 95 497 667
1 data used in this report was captured from audited financial statements of the different entities which have different financial year ends. However these figures resemble the best estimates of the short-term insurance industry as at 31 March 2018.
SHORT-TERM INSURANCE BUSINESS FINANCIAL PERFORMANCE - continued
96
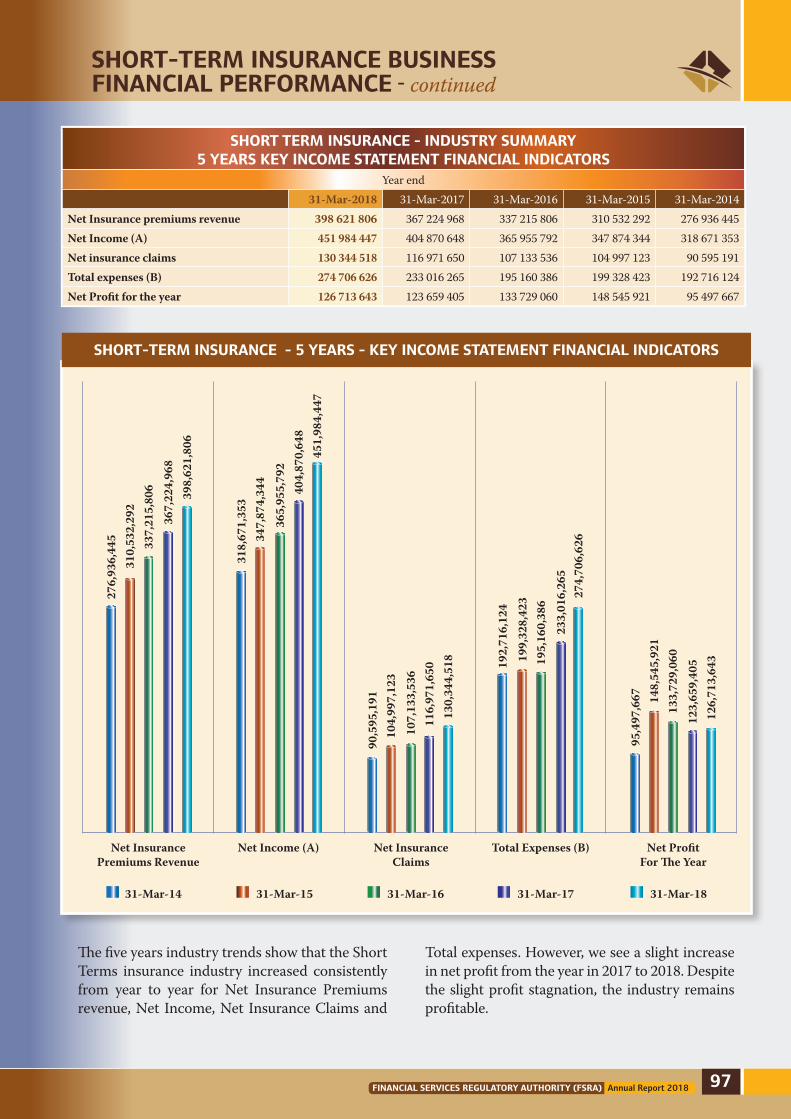
FINANCIAL SERVICES REGULATORY AUTHORITY (FSRA) Annual Report 2018
The five years industry trends show that the Short Terms insurance industry increased consistently from year to year for Net Insurance Premiums revenue, Net Income, Net Insurance Claims and
Total expenses. However, we see a slight increase in net profit from the year in 2017 to 2018. Despite the slight profit stagnation, the industry remains profitable.
SHORT TERM INSURANCE - INDUSTRY SUMMARY5 YEARS KEY INCOME STATEMENT FINANCIAL INDICATORS
Year end 31-Mar-2018 31-Mar-2017 31-Mar-2016 31-Mar-2015 31-Mar-2014Net Insurance premiums revenue 398 621 806 367 224 968 337 215 806 310 532 292 276 936 445 Net Income (A) 451 984 447 404 870 648 365 955 792 347 874 344 318 671 353 Net insurance claims 130 344 518 116 971 650 107 133 536 104 997 123 90 595 191 Total expenses (B) 274 706 626 233 016 265 195 160 386 199 328 423 192 716 124 Net Profit for the year 126 713 643 123 659 405 133 729 060 148 545 921 95 497 667
276,
936,
445
310,
532,
292
337,
215,
806
367,
224,
968
398,
621,
806
318,
671,
353
347,
874,
344
365,
955,
792
404,
870,
648
451,
984,
447
90,5
95,1
9110
4,99
7,12
3
107,
133,
536
116,
971,
650
130,
344,
518 19
2,71
6,12
4
199,
328,
423
195,
160,
386
233,
016,
265
274,
706,
626
95,4
97,6
67 148,
545,
921
133,
729,
060
123,
659,
405
126,
713,
643
Net InsurancePremiums Revenue
Net Income (A) Net InsuranceClaims
Total Expenses (B) Net Profit For The Year
31-Mar-14 31-Mar-1631-Mar-15 31-Mar-17 31-Mar-18
SHORT-TERM INSURANCE - 5 YEARS - KEY INCOME STATEMENT FINANCIAL INDICATORS
SHORT-TERM INSURANCE BUSINESS FINANCIAL PERFORMANCE - continued
97
SHORT-TERM INSURANCE BUSINESS FINANCIAL PERFORMANCE - continued

FINANCIAL SERVICES REGULATORY AUTHORITY (FSRA) Annual Report 2018
SHORT TERM INSURANCE - INDUSTRY SUMMARYSTATEMENT OF FINANCIAL POSITION
Year end 31-Mar-2018 31-Mar-2017 31-Mar-2016 31-Mar-2015 31-Mar-2014AssetsProperty, Plant and Equipment 44 056 644 39 736 468 42 315 450 42 435 336 28 448 557Intangible assets 3 212 093 4 212 843 561 068 574 209 958 947Deferred acquisition costs - 12 546 - - -Deferred income tax assets 2 410 620 1 937 058 1 282 080 1 447 959 3 629 277Prepaid taxes - - - 12 509 675 -Financial Assets 560 593 040 718 370 935 365 451 883 356 536 205 367 748 776Reinsurance Contracts 56 551 664 56 280 867 41 090 599 45 097 054 48 782 896Loans and receivables 117 619 161 104 506 134 104 912 329 87 566 122 87 058 017Technical Assets 125 711 861 70 804 923 63 679 798 76 543 699 112 199 200Total assets 910 155 083 995 861 774 619 293 207 622 710 259 648 825 670
EQUITYCAPITAL AND RESERVES Ordinary shares 14 652 947 12 652 947 5 242 805 7 242 805 6 867 805Share premium 13 715 983 10 959 223 10 959 223 11 160 217 8 535 217Other reserves 4 834 647 4 397 276 4 200 088 4 200 088 18 780 320Retained earnings 379 867 680 301 391 409 262 657 159 234 357 372 237 128 491Total Capital and Reserves 413 071 257 329 400 855 283 059 275 256 960 482 271 311 833
LIABILITIESInsurance contracts/policy holders’ liabilities 409 643 968 335 479 716 292 350 583 305 984 477 325 481 533
Amounts owing to related parties 1 127 949 899 986 - - -Reinsurance liabilities 35 676 416 25 902 044 17 236 309 10 478 422 18 830 076Trade and other payables 42 288 045 299 821 138 21 740 775 45 521 465 31 023 819Provision for other liabilities and charges 2 919 890 - 3 132 747 3 132 747 2 114 711Current tax payable 5 427 558 4 358 035 1 773 518 632 666 63 698Total Liabilities 497 083 826 666 460 919 336 233 932 365 749 777 377 513 837
Total equity and liabilities 910 155 083 995 861 774 619 293 207 622 710 259 648 825 670
SHORT-TERM INSURANCE BUSINESS FINANCIAL PERFORMANCE - continued
98

FINANCIAL SERVICES REGULATORY AUTHORITY (FSRA) Annual Report 2018
SHORT-TERM INSURANCE BUSINESS FINANCIAL PERFORMANCE - continued
SHORT TERM INSURANCE - INDUSTRY SUMMARYSHORT TERM INSURANCE - 5 YEARS KEY BALANCE SHEET INDICATORS
Year end 31-Mar-2018 31-Mar-2017 31-Mar-2016 31-Mar-2015 31-Mar-2014Total assets 910 155 083 995 861 774 619 293 207 622 710 259 648 825 670Total Capital and Reserves 413 071 257 329 400 855 283 059 275 256 960 482 271 311 833Total Liabilities 497 083 826 666 460 919 336 233 932 365 749 777 377 513 837
31-Mar-14 31-Mar-1631-Mar-15 31-Mar-17 31-Mar-18
648,
825,
670
622,
710,
259
619,
293,
207
995,
861,
774
910,
155,
083
271,
311,
833
256,
960,
482
283,
059,
275
329,
400,
855
413,
071,
257
377,
513,
837
365,
749,
777
336,
233,
932
666,
460,
919
497,
083,
826
Total Assets Total Capital and Reserves Total Liabilities
Looking at the Balance Sheet trends, we saw a sharp increase in Total Assets and Total Liabilities in 2017. However, in 2018 the assets have dropped again. The net assets or Capital and reserves maintained a moderate growth from year to year, which is an indication of a growing industry and good news for investors.
SHORT-TERM INSURANCE - 5 YEARS - KEY BALANCE SHEET INDICATORS
99
SHORT-TERM INSURANCE BUSINESS FINANCIAL PERFORMANCE - continued
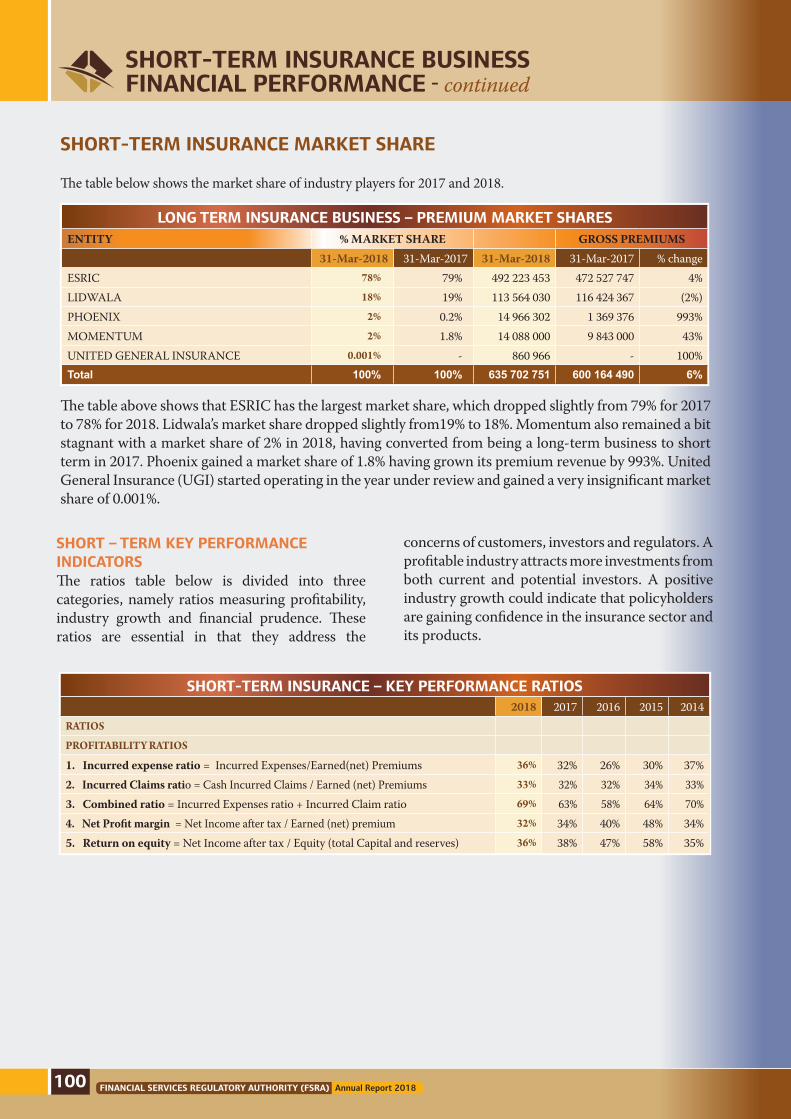
FINANCIAL SERVICES REGULATORY AUTHORITY (FSRA) Annual Report 2018
SHORT-TERM INSURANCE BUSINESS FINANCIAL PERFORMANCE - continued
SHORT-TERM INSURANCE MARKET SHARE
The table below shows the market share of industry players for 2017 and 2018.
LONG TERM INSURANCE BUSINESS – PREMIUM MARKET SHARESENTITY % MARKET SHARE GROSS PREMIUMS 31-Mar-2018 31-Mar-2017 31-Mar-2018 31-Mar-2017 % changeESRIC 78% 79% 492 223 453 472 527 747 4%LIDWALA 18% 19% 113 564 030 116 424 367 (2%)PHOENIX 2% 0.2% 14 966 302 1 369 376 993%MOMENTUM 2% 1.8% 14 088 000 9 843 000 43%UNITED GENERAL INSURANCE 0.001% - 860 966 - 100%Total 100% 100% 635 702 751 600 164 490 6%
The table above shows that ESRIC has the largest market share, which dropped slightly from 79% for 2017 to 78% for 2018. Lidwala’s market share dropped slightly from19% to 18%. Momentum also remained a bit stagnant with a market share of 2% in 2018, having converted from being a long-term business to short term in 2017. Phoenix gained a market share of 1.8% having grown its premium revenue by 993%. United General Insurance (UGI) started operating in the year under review and gained a very insignificant market share of 0.001%.
SHORT – TERM KEY PERFORMANCE INDICATORSThe ratios table below is divided into three categories, namely ratios measuring profitability, industry growth and financial prudence. These ratios are essential in that they address the
concerns of customers, investors and regulators. A profitable industry attracts more investments from both current and potential investors. A positive industry growth could indicate that policyholders are gaining confidence in the insurance sector and its products.
SHORT-TERM INSURANCE – KEY PERFORMANCE RATIOS 2018 2017 2016 2015 2014RATIOS
PROFITABILITY RATIOS
1. Incurred expense ratio = Incurred Expenses/Earned(net) Premiums 36% 32% 26% 30% 37%2. Incurred Claims ratio = Cash Incurred Claims / Earned (net) Premiums 33% 32% 32% 34% 33%3. Combined ratio = Incurred Expenses ratio + Incurred Claim ratio 69% 63% 58% 64% 70%4. Net Profit margin = Net Income after tax / Earned (net) premium 32% 34% 40% 48% 34%5. Return on equity = Net Income after tax / Equity (total Capital and reserves) 36% 38% 47% 58% 35%
100

FINANCIAL SERVICES REGULATORY AUTHORITY (FSRA) Annual Report 2018
SHORT-TERM INSURANCE BUSINESS FINANCIAL PERFORMANCE - continued
SHORT-TERM INSURANCE – KEY PERFORMANCE RATIOS - continued 2018 2017 2016 2015 2014INDUSTRY GROWTH RATIO:
1. Gross Premium growth ratio = percentage change in gross premiums between current year and previous year
6% 11% 8% 11% 12%
2. Concentration (market share of top 2) 96% 98% 98% 100% 100%
FINANCIAL PRUDENCE RATIOS:
1. Solvency Ratio = Admitted Assets / Total Liabilities 1.71x 1.49x 1.84x 0.97x 0.97x2. Liquidity Ratio = Available cash / short term payables 7.42x 1.09x 1.41x 3.60x 1.23x
RATIO ANALYSIS
ANALYSIS OF PROFITABILITY RATIOS
1. Incurred expense ratio – the ratio increased from 32% in 201 to 36% in 2018. The insurers seem to be able to manage their costs which is shown by the relatively stable incurred expense ratio for the past five years.
In calculating this ratio, we have added commission “plus” expenses for marketing “plus” all other operating expenses, as a percentage of net premiums. An increase in the incurred expense ratio reflects that the insurers are incurring more selling and operating expenses. This is expected for the insurers who are still new in the market in order to make their presence visible.
2. Incurred claims ratio – over the past four years, the incurred claims ratio has been stable between 32% and 34%. A lower ratio is preferred by insurers as it means reduced costs. However, a low incurred claims ratio may be of concern to the Regulator. The incurred claims ratio is close to the bottom limit of 30% (acceptable range is 30 – 60%) and therefore this could indicate that the premiums are too high thus not providing any value to the policyholders or that claims are being adjudicated unfairly.
3. Combined ratio – The trend over the past five years reflects that the combined ratio is also stable between 58% and 70%. On average, the insurers combined ratio has been less than 100% for the past five years implying that the insurers are making underwriting profit. The combined
ratio has decreased from 70% in 2014 to 58% in 2016, increasing to 69% in 2018.
4. Net income ratio – The ratio measures net insurance profit as a percentage of net earned premium. The trend for this ratio reflects that for the past 5 years, the ratio has been declining with 2018 recording the lowest ratio of 32%.
5. Return on equity – Return on equity is a profitability indicator that is intended to measure an insurer’s efficiency in using its capital. It is also a measure of investor value. The return on equity reflects the level of capital that the shareholders have subscribed, and the return directed at them. The return on equity has been increasing with the highest level of 58% seen in 2015. However, the ratio then decreased to 36% in 2018. Even through it decreased, it is still a good return implying that shareholders are getting value from the investments made. This is a very attractive return for investors considering that that the return on alternative investments such as bonds are far lower.
ANALYSIS OF INDUSTRY GROWTH RATIOS
1. Premium growth ratio – is an indicator for the industry growth, in 2018 the growth rate for the short- term sector was reported at 6% decreasing from 11% in 2017. The growth in the sector can be attributed to an increase in new customers or the new products being rolled out to the market showing insurers’ improved innovations. Therefore, it can be said that the industry is slowly and steadily growing.
101
SHORT-TERM INSURANCE BUSINESS FINANCIAL PERFORMANCE - continued

FINANCIAL SERVICES REGULATORY AUTHORITY (FSRA) Annual Report 2018
2. Concentration - there were five registered insurers in 2018. The concentration ratio was calculated by adding the market share for the top 2 insurers. The concentration ratio, at 96%, is very high nearly 100% depicting that the short term industry is still dominated by 2 insurers.
FINANCIAL PRUDENCY RATIOS
1. Solvency ratio – A great deal of the viability of an industry depends on the degree to which debts and payables can be settled, as insolvency and
illiquidity might lead to an insurer failing to settle customer claims. The ratio shows that the short term insurance industry is solvent as the solvency ratio has been above 1 with the exception of 2014 and 2015. The solvency ratio increased to 1.49x for the year 2017 implying that the insurers will be able to meet their liabilities as they fall due.
2. Liquidity ratio – the liquidity ratio shows that the industry will be able to meet its short-term liabilities as the liquidity ratio is above 1 for the five years under review.
SHORT-TERM INSURANCE BUSINESS FINANCIAL PERFORMANCE - continued
SHORT TERM INSURANCE - LOCAL Vs FOREIGN ASSETSYear end
31-Mar-2018 31-Mar-2017 31-Mar-2016 31-Mar-2015 31-Mar-2014Total local investments 465 864 135 380 835 774 204 337 072 277 075 243 184 262 849Total foreign investments 94 728 905 337 535 161 161 114 811 74 277 804 184 344 705Total Investments (E) 560 593 040 718 370 935 365 451 883 351 353 047 368 607 554
% Local investments to total investments 83% 53% 56% 79% 50%% Foreign investments to total investments 17% 47% 44% 21% 50%Total Investments (%) 100% 100% 100% 100% 100%
LOCAL INVESTMENTSYear end
31-Mar-2018 31-Mar-2017 31-Mar-2016 31-Mar-2015 31-Mar-2014Eswatini Stock Exchange 2 210 000 2 045 000 5 113 620 5 113 620 5 076 120Unlisted Shares 52 707 444 48 717 715 - - -Property 57 000 000 57 000 000 40 000 000 40 000 000 26 640 602Cash and money market instruments 353 946 691 273 073 059 159 223 452 237 144 781 151 687 349Total Local Investments 465 864 135 380 835 774 204 337 072 282 258 401 183 404 071
SHORT-TERM INDUSTRY INVESTMENTS
FOREIGN INVESTMENTSYear end
31-Mar-2018 31-Mar-2017 31-Mar-2016 31-Mar-2015 31-Mar-2014Johannesburg Stock Exchange 24 028 078 274 467 502 161 114 811 16 253 999 40 231 210Offshore equities - - - -Bond exchange of South Africa 46 609 422 42 451 994 12 109 560 29 863 969Cash and Money Market instruments 24 091 405 20 615 665 45 914 245 114 249 526Total Foreign Investments 94 728 905 337 535 161 161 114 811 74 277 804 184 344 705Total Investments 560 593 040 718 370 935 365 451 883 356 536 205 367 748 776
102

FINANCIAL SERVICES REGULATORY AUTHORITY (FSRA) Annual Report 2018
SHORT-TERM INSURANCE BUSINESS FINANCIAL PERFORMANCE - continued
NOTE 1: PREMIUM REVENUEYear end
31-Mar-2018 31-Mar-2017 31-Mar-2016 31-Mar-2015 31-Mar-2014Short-term insurance contracts: Premium receivable 635 702 751 600 164 490 539 011 606 514 609 527 477 278 073Change in unearned premium provision (4 234 503) (16 244 292) (3 338 887) (5 557 497) (20 326 811)Premium revenue arising from insurance contracts
631 468 248 583 920 198 535 672 719 509 052 030 456 951 262
Less: Premiums ceded to short term reinsurers (232 846 442) (216 695 230) (198 456 913) (198 519 738) (180 014 817)
Net insurance premium revenue 398 621 806 367 224 968 337 215 806 310 532 292 276 936 445
NOTE 2: FEE INCOMEYear end
31-Mar-2018 31-Mar-2017 31-Mar-2016 31-Mar-2015 31-Mar-2014Policy administration services: Insurance policy administration fees 12 302 697 11 624 631 10 390 875 9 445 777 7 868 761Commission income 3 152 321 168 428 - 4 931 446 3 626 841 Total fee income 15 455 018 11 793 059 10 390 875 14 377 223 11 495 602
SHORT-TERM INSURANCE BUSINESS – NOTES TO THE FINANCIAL STATEMENTS
103
SHORT-TERM INSURANCE BUSINESS FINANCIAL PERFORMANCE - continued
NOTE 3: INVESTMENT INCOMEYear end
31-Mar-2018 31-Mar-2017 31-Mar-2016 31-Mar-2015 31-Mar-2014Dividend and Interest income 33 907 547 25 474 689 25 199 052 26 347 460 32 617 631Net fair value gains on financial assets at fair value through Income Statement
(154 838) (204 068) (6 849 941) (4 302 093) (9 607 767)
Other operating income 4 154 914 - - 919 462 7 229 442Total investment income 37 907 623 25 270 621 18 349 111 22 964 829 30 239 306

FINANCIAL SERVICES REGULATORY AUTHORITY (FSRA) Annual Report 2018
SHORT-TERM INSURANCE BUSINESS FINANCIAL PERFORMANCE - continued
NOTE 4: INSURANCE CLAIMSYear end
31-Mar-2018 31-Mar-2017 31-Mar-2016 31-Mar-2015 31-Mar-2014Claims and loss adjustment expenses Gross insurance claims 167 894 217 129 633 536 151 324 012 160 171 523 141 655 986Change in the provision for claims 45 597 080 21 173 356 (21 919 679) (33 240 039) 44 806 710 213 491 297 150 806 892 129 404 333 126 931 484 186 462 696
Reinsurance RecoveriesGross reinsurance recoveries (40 656 616) (24 573 068) (6 925 250) 10 432 171 (106 912 870)Less: change in provision for reinsurance recoveries (42 490 163) (9 262 174) (15 345 547) (32 366 532) 11 045 365 (83 146 779) (33 835 242) (22 270 797) (21 934 361) (95 867 505)
Net insurance claims 130 344 518 116 971 650 107 133 536 104 997 123 90 595 191
NOTE 5: COMMISSION AND MARKETING EXPENSESYear end
31-Mar-2018 31-Mar-2017 31-Mar-2016 31-Mar-2015 31-Mar-2014a) Expenses for the acquisition of insurance contract (Commission paid):
Costs incurred for the acquisition of insurance contracts expensed in the year
77 429 869 72 764 992 65 809 288 64 269 245 57 844 546
Less: (Commission earned from reinsurance contracts) (52 716 111) (54 726 357) (52 742 360) (46 369 520) (34 031 028)Total expenses for the acquisition of insurance contracts
24 713 758 18 038 635 13 066 928 17 899 725 23 813 518
b) Marketing expenses Marketing expenses 2 621 724 1 172 236 955 343 955 343 1 118 235
Total marketing and administrative expenses 27 335 482 19 210 871 14 022 271 18 855 068 24 931 753
104

FINANCIAL SERVICES REGULATORY AUTHORITY (FSRA) Annual Report 2018
SHORT-TERM INSURANCE BUSINESS FINANCIAL PERFORMANCE - continued
SHORT-TERM INSURANCE BUSINESS FINANCIAL PERFORMANCE - continued
NOTE 6: OTHER EXPENSESYear end
31-Mar-2018 31-Mar-2017 31-Mar-2016 31-Mar-2015 31-Mar-2014Audit fees 3 633 017 3 105 526 3 216 150 3 172 511 3 057 789Actuarial fees 1 869 078 2 056 233 1 337 995 1 270 662 2 240 429Amortisation of intangible assets 2 354 425 1 215 383 3 206 177 3 044 831 1 039 542Asset management fees 6 047 583 7 116 214 5 678 707 5 392 935 7 415 923Directors fees 1 072 100 1 270 157 1 046 295 1 011 807 1 298 586Depreciation 3 785 258 2 931 371 1 954 127 1 920 820 2 012 550Employee costs and benefits 61 845 977 49 181 991 29 981 229 31 194 161 34 498 802Impairment allowance on insurance receivables 848 589 - 802 624 802 624 1 225 830Regulatory levy fees 5 443 449 4 429 492 3 632 739 3 449 927 4 026 609Legal fees 486 109 679 227 809 148 768 429 49 435Management fees 1 912 856 1 540 759 - 147 960 70 056Operating expenses 9 934 146 8 228 885 4 927 469 6 186 939 5 463 118Professional fees 2 304 353 850 493 574 014 1 122 064 967 414Repairs and maintenance 4 031 134 4 298 220 4 806 227 4 564 361 3 420 602Software licences and maintenance fees 11 458 552 9 929 793 12 031 677 11 426 201 10 402 495
Total other expenses 117 026 626 96 833 744 74 004 579 75 476 232 77 189 180
105

FINANCIAL SERVICES REGULATORY AUTHORITY (FSRA) Annual Report 2018
The following sections outline how the retirement funds industry performed during the year to 31 March 2018.
However, the collection of financial data through quarterly returns continued to lag due to slow submissions as well as the need to revamp our returns forms to ensure collection of comprehensive data. To obtain meaningful and
current financial data on retirement funds, the latest sets of audited financial statements were used to aggregate industry financial data.
Comparative data for the year 2017 is analysed in comparison to 2018. Trends for the past 5 years are tracked to see how the industry has been performing.
106
RETIREMENTFUNDSFINANCIAL PERFORMANCE
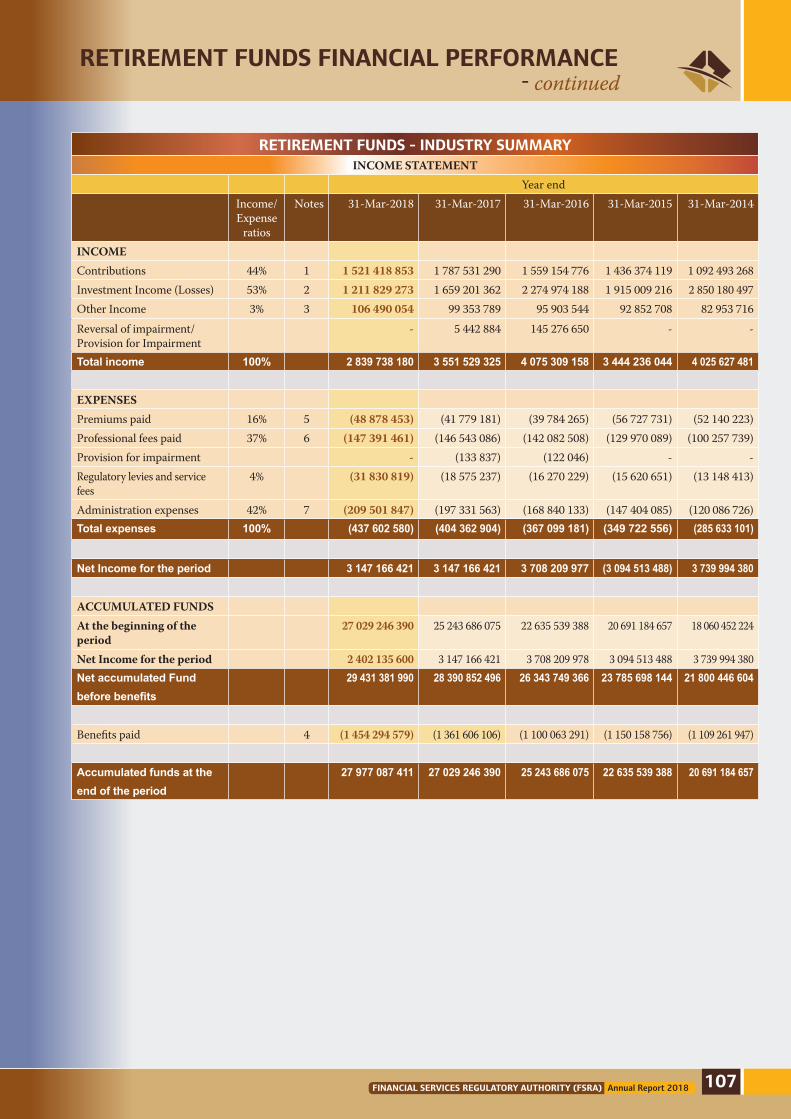
FINANCIAL SERVICES REGULATORY AUTHORITY (FSRA) Annual Report 2018
RETIREMENT FUNDS - INDUSTRY SUMMARYINCOME STATEMENT
Year end Income/
Expense ratios
Notes 31-Mar-2018 31-Mar-2017 31-Mar-2016 31-Mar-2015 31-Mar-2014
INCOMEContributions 44% 1 1 521 418 853 1 787 531 290 1 559 154 776 1 436 374 119 1 092 493 268Investment Income (Losses) 53% 2 1 211 829 273 1 659 201 362 2 274 974 188 1 915 009 216 2 850 180 497Other Income 3% 3 106 490 054 99 353 789 95 903 544 92 852 708 82 953 716
Reversal of impairment/ Provision for Impairment
- 5 442 884 145 276 650 - -
Total income 100% 2 839 738 180 3 551 529 325 4 075 309 158 3 444 236 044 4 025 627 481
EXPENSES Premiums paid 16% 5 (48 878 453) (41 779 181) (39 784 265) (56 727 731) (52 140 223)Professional fees paid 37% 6 (147 391 461) (146 543 086) (142 082 508) (129 970 089) (100 257 739)Provision for impairment - (133 837) (122 046) - -Regulatory levies and service fees
4% (31 830 819) (18 575 237) (16 270 229) (15 620 651) (13 148 413)
Administration expenses 42% 7 (209 501 847) (197 331 563) (168 840 133) (147 404 085) (120 086 726)Total expenses 100% (437 602 580) (404 362 904) (367 099 181) (349 722 556) (285 633 101)
Net Income for the period 3 147 166 421 3 147 166 421 3 708 209 977 (3 094 513 488) 3 739 994 380
ACCUMULATED FUNDS At the beginning of the period
27 029 246 390 25 243 686 075 22 635 539 388 20 691 184 657 18 060 452 224
Net Income for the period 2 402 135 600 3 147 166 421 3 708 209 978 3 094 513 488 3 739 994 380Net accumulated Fund before benefits
29 431 381 990 28 390 852 496 26 343 749 366 23 785 698 144 21 800 446 604
Benefits paid 4 (1 454 294 579) (1 361 606 106) (1 100 063 291) (1 150 158 756) (1 109 261 947) Accumulated funds at the end of the period
27 977 087 411 27 029 246 390 25 243 686 075 22 635 539 388 20 691 184 657
107
RETIREMENT FUNDS FINANCIAL PERFORMANCE - continued
FINANCIAL PERFORMANCE

FINANCIAL SERVICES REGULATORY AUTHORITY (FSRA) Annual Report 2018
RETIREMENT FUNDS FINANCIAL PERFORMANCE - continued
STATEMENT OF FUNDS AND NET ASSETSYear end
Notes 31-Mar-2018 31-Mar-2017 31-Mar-2016 31-Mar-2015 31-Mar-2014ASSETS Fixed Assets 141 169 853 160 661 042 141 905 604 140 809 888 131 212 673Investments 8 27 841 017 219 26 945 891 183 25 308 991 518 22 841 666 142 20 800 083 879
Current assets Account receivable 9 40 655 102 62 095 685 41 297 094 40 049 249 46 466 865Arrear contributions 10 123 007 081 95 229 196 58 724 746 102 009 584 89 769 983
Total assets 28 145 849 255 27 263 877 106 25 550 918 962 23 124 534 863 21 067 533 400
FUNDS Accumulated funds/Liability for future benefits & surpluses
27 977 087 411 27 029 246 390 25 243 686 075 22 635 539 388 20 691 184 657
Current liabilities Benefits payable 11 86 088 203 120 617 741 115 422 638 408 448 143 301 497 579Accounts payable 12 82 673 641 114 012 975 191 810 249 80 547 332 74 851 164
Total funds and liabilities 28 145 849 255 27 263 877 106 25 550 918 962 23 124 534 863 21 067 533 400
RETIREMENT FUNDS - LOCAL VS FOREIGN ASSETSYear end
31-Mar-2018 31-Mar-2017 31-Mar-2016 31-Mar-2015 31-Mar-2014TOTAL LOCAL INVESTMENTS 11 910 318 221 10 232 879 796 8 480 179 304 7 299 822 198 6 381 985 763TOTAL FOREIGN INVESTMENTS 15 930 698 998 16 713 011 387 16 828 812 214 15 541 843 944 14 418 098 116TOTAL INVESTMENTS 27 841 017 219 26 945 891 183 25 308 991 518 22 841 666 142 20 800 083 879
% LOCAL INVESTMENTS TO TOTAL INVESTMENTS
42% 38% 33% 32% 31%
% FOREIGN INVESTMENTS TO TOTAL INVESTMENTS
58% 62% 67% 68% 69%
TOTAL INVESTMENTS 100% 100% 100% 100% 100%
108

FINANCIAL SERVICES REGULATORY AUTHORITY (FSRA) Annual Report 2018
INVESTMENTS - BY ASSET CLASSYear end
31-Mar-2018 31-Mar-2017 31-Mar-2016 31-Mar-2015 31-Mar-2014
LOCAL INVESTMENTS: 11 910 318 221 10 232 879 796 8 480 179 304 7 299 822 198 6 381 985 763Eswatini Stock Exchange: equities 747 769 457 737 410 759 567 654 682 483 987 786 535 584 715Unlisted Shares 1 884 633 314 1 661 103 894 1 168 929 903 1 230 755 505 639 940 059Bonds – Funds own portfolio 1 503 632 559 903 773 362 311 110 856 246 339 997 244 104 995STANLIB Bonds 71 401 023 160 030 387 160 189 148 173 145 962 173 194 059Old Mutual Bonds 48 641 780 48 641 780 48 652 727 48 652 727 48 652 727Loans and Advances – Funds own portfolio 1 884 207 190 1 447 858 423 761 227 458 464 351 052 691 667 119Inhlonhla Eswatini – Loans Portfolio 932 190 276 663 400 808 729 879 445 585 674 209 446 308 166STANLIB – Loans Portfolio 115 178 057 112 892 484 110 614 517 108 626 538 78 573 425OLD Mutual Eswatini – Loans Portfolio 186 770 927 87 515 008 35 510 976 39 064 360 30 883 512African Alliance – Loans Portfolio 225 122 316 113 926 907 134 214 783 133 806 250 20 495 616Property 1 458 206 632 1 128 589 082 944 310 595 878 229 102 835 895 493INSURED FUNDS 350 689 080 295 780 789 274 406 209 166 251 611 165 395 847Cash and money market instruments: 2 501 875 610 2 871 956 113 3 233 478 005 2 740 937 099 2 471 290 030
FOREIGN INVESTMENTS BY INVESTMENT CLASS:
15 930 698 998 16 713 011 387 16 828 812 214 15 541 843 944 14 418 098 116
Johannesburg Stock Exchange Equities 15 150 842 610 8 951 842 545 9 095 983 666 8 327 735 187 7 798 406 377Offshore equities 175 440 596 4 029 445 763 3 884 806 043 3 461 023 601 3 167 813 168Bond exchange of South Africa 183 047 495 1 544 981 765 1,602,736,379 1 679 017 757 1 387 029 483Offshore bonds 43 417 690 138 949 337 164 148 962 2 950 965 2 682 695Cash and Money Market instruments 253 789 758 1 028 864 193 1 010 056 461 1 121 149 787 1 343 399 952Offshore Cash - - - - -Commodities 23 769 353 95 077 413 106 450 660 35 061 086 33 537 076Equity Linked Derivatives 83 192 736 23 769 353 32 745 979 130 783 949 124 776 194Property 17 198 687 900 081 018 931 884 064 784 121 612 560 453 171
TOTAL INVESTMENTS 27 841 017 219 26 945 891 183 25 308 991 518 22 841 666 142 20 800 083 879
109
RETIREMENT FUNDS FINANCIAL PERFORMANCE - continued

FINANCIAL SERVICES REGULATORY AUTHORITY (FSRA) Annual Report 2018
COMMENTARY ON FINANCIAL RESULTS
Income StatementThe industry income statement above highlights that overall, the net income for the period decreased by 23% from E3.1 million in 2017 to E2.4 million in 2018.The main reason for the decrease is evident in the investment Income line, which has decreased by 26% from E1.7 million in 2017 to E1.2 million in 2018. This has resulted in a decrease in the overall income from E3.6 million in 2017 to E2.8 million in 2018.
Balance SheetThe Statement of Funds and Net Assets above shows that as at 31 March 2018, the retirement funds’ assets totalled E28.1 billion (2017: E27.2 billion). This represents 3% growth from prior year.
This growth is also consistent with the increase in accumulated funds.
Analysis of Investments
a. Local vs Foreign Assets
The Retirement Funds legislations requires that 30% of assets must be invested in Eswatini. The purpose of tracking this local and foreign investment ratio is to check how compliant the industry is with this legislation. The trend analysis below reflects that the industry is currently meeting this requirement, having achieved 42% in 2018 (2017: 38%). The upward trend in local investments, is a manifestation of the retirement funds working towards the 50% local investment legislative requirement already imposed by the Securities to Asset Managers.
2018 - RETIREMENT FUNDS - LOCAL VS FOREIGN ASSETS
Total Local Investments Total Foreign Investments
Total Investments
18,000,000,000
16,000,000,000
14,000,000,000
12,000,000,000
10,000,000,000
8,000,000,000
6,000,000,000
4,000,000,000
2,000,000,000
-
30,000,000,000
25,000,000,000
20,000,000,000
15,000,000,000
10,000,000,000
5,000,000,000
-
RETIREMENT FUNDS FINANCIAL PERFORMANCE - continued
110

FINANCIAL SERVICES REGULATORY AUTHORITY (FSRA) Annual Report 2018
Investments by Asset Class Local Investments – by asset class
INVESTMENTS - BY ASSET CLASSYear end
31-Mar-2018 31-Mar-2017 31-Mar-2016 31-Mar-2015 31-Mar-2014
LOCAL INVESTMENTS: Eswatini Stock Exchange (ESE): equities 747 769 457 737 410 759 567 654 682 483 987 786 535 584 715Unlisted Shares 1 884 633 314 1 661 103 894 1 168 929 903 1 230 755 505 639 940 059Bonds – Own Portfolio 1 503 632 559 903 773 362 311 110 856 246 339 997 244 104 995STANLIB Bonds 71 401 023 160 030 387 160 189 148 173 145 962 173 194 059Old Mutual Bonds 48 641 780 48 641 780 48 652 727 48 652 727 48 652 727Loans and Advances – Funds own portfolio
1 884 207 190 1 447 858 423 710 419 934 464 351 052 691 667 119
Inhlonhla Swaziland – Loans Portfolio 932 190 228 648 651 250 754 333 679 609 885 334 446 308 166STANLIB Swaziland – Loans Portfolio 115 178 057 112 892 484 110 614 517 108 626 538 78 573 425Old Mutual Swaziland – Loans Portfolio 186 770 927 87 515 008 35 510 976 39 064 360 30 883 512African Alliance – Loans Portfolio 225 122 316 113 926 907 134 214 783 133 806 250 20 495 616Property 1 458 206 632 1 128 589 082 944 310 595 878 229 102 835 895 494INSURED FUNDS 350 689 080 295 780 789 274 406 209 166 251 611 165 395 847Cash and money market instruments: 2 501 875 658 2 886 705 671 3 258 198 502 2 716 725 974 2 471 290 029
TOTAL 11 910 318 221 10 232 879 796 8 478 546 511 7 299 822 198 6 381 985 763% INCREASE 16% 21% 16% 14% 15%
111
RETIREMENT FUNDS FINANCIAL PERFORMANCE - continued

FINANCIAL SERVICES REGULATORY AUTHORITY (FSRA) Annual Report 2018
2017 - LOCAL ASSETS CLASSES
2018 - LOCAL ASSETS CLASSES
Cash and Money Market
instruments21%
Cash and Money Market
instruments39%
Insured Funds3%
Insured Funds3%
Property12%
Property13%
African Alliance- Loans Portfolio
2%
African Alliance
0.5%
Old Mutual Eswatini
Portfolio - 1.6%
Old Mutual Swaziland
Portfolio - 0.3%
STANLIB Swaziland
Loans Portfolio - 1%
STANLIB Portfolio - 1%
Inhlonhla Eswatini - Loans Portfolio - 8%
Inhlonhla - 7%
Loans and Advances -Funds own Portfolio
16%
Loans and Advances -Funds Portfolio - 11%
STANLIB Bonds1%
STANLIB Bonds - 3%
Old Mutual Bonds0.4%
Old Mutual Bonds - 1%
Bonds - Own Portfolio
13%
Bonds - Own Portfolio - 4%
Unlisted Shares
16%
Unlisted Shares - 10%
Eswatini Stock Exchange
6%
Swaziland Stock Exchange
8%
RETIREMENT FUNDS FINANCIAL PERFORMANCE - continued
112

FINANCIAL SERVICES REGULATORY AUTHORITY (FSRA) Annual Report 2018
ESE - Worth noting when looking at the trends of the local asset classes, we can see that there is no improvement in the proportion invested in the Eswatini Stock Exchange, still stagnant at 6%, a drop from 8% in 2017. The FSRA has embarked on a strategic action plan for making the ESE more visible to the regulated industries so that a shift can manifest in this trend.
Unlisted Shares – this asset class saw a 13% increase (2017:30%) from E1.7 billion in 2017 to E1.9 billion in 2018. This is very encouraging as retirement funds participate more in local entities, in their attempt to comply with initially the 30% (and now the 50%) local investment requirements imposed by the Securities Act.
Bonds – As you can see from the pie chart, this asset class has now been expanded, to identify the Asset Managers who have participated in local bonds, as well as bonds held directly by retirement funds. When looking at the overall balance in bonds this year, this asset class increased from E1.1 billion in 2017 to E1.6 billion in 2018.
Property – investments in this asset class have increased significantly by 29% in the year under review, from E1.1 billion in 2017 to E1.4 billion in 2018.
Loans and advances – As you can see from the pie chart, this asset class has now been expanded, to identify the Asset Managers who have participated in loans and advances, as well as direct lending done by retirement funds. When looking at the overall balance in loans this year, this asset class increased significantly from E2.4 billion in 2017 to E3.3 billion in 2018. We expect more growth in this asset class as a result of a drive by retirement funds to participate more in local business projects, either via Investment managers or directly. FSRA applauds this development, and we will keep monitoring the performance of these loans, to ensure pensioners do not lose out from failed projects.
Insured funds – this class forms an insignificant 2% (2017: 3%) of the total local assets. This asset class has increased slightly from E296 million in 2017 to E351 million in 2017. Cash and Money market instruments – cash holdings by the end of 2018 had decreased by 13% from E2.9 billion in 2017 to E2.5 billion in 2018. The Authority is still monitoring this asset closely, as we are worried that money held in cash quickly returns to South Africa through the Commercial Banks. However, the downward trend in cash holdings is encouraging as retirements funds invest in real local assets.
FOREIGN INVESTMENTS – BY ASSET CLASSYear end
31-Mar-2018 31-Mar-2017 31-Mar-2016 31-Mar-2015 31-Mar-2014
Johannesburg Stock Exchange Equities 15 150 842 683 8 951 842 545 9 095 983 666 8 327 735 187 7 798 406 377Offshore Equities 175 440 596 4 029 445 763 3 884 806 043 3 461 023 601 3 167 813 168South African Bonds 183 047 495 1 544 981 765 1 602 736 379 1 679 017 757 1 387 029 483Offshore bonds 43 417 690 138 949 337 164 148 962 2 950 965 2 682 695Cash and Money Market instruments 253 789 758 1 028 864 193 1 010 056 461 1 121 149 787 1 343 399 952Commodities 23 769 353 95 077 413 106 450 660 35 061 086 33 537 076Equity Linked Derivatives 83 192 736 23 769 353 32 745 979 130 783 949 124 776 194Property 17 198 687 900 081 018 931 884 064 784 121 612 560 453 171TOTAL 15 930 698 998 16 713 011 387 16 828 812 214 15 541 843 944 14 418 098 116% Movement (4%) (1%) 8% 8% 13%
113
RETIREMENT FUNDS FINANCIAL PERFORMANCE - continued

FINANCIAL SERVICES REGULATORY AUTHORITY (FSRA) Annual Report 2018
RETIREMENT FUNDS FINANCIAL PERFORMANCE - continued
The pie charts above shows that the pattern of asset allocation almost remained the same when looking at 2018 and 2017. As usual the JSE Equities took the bigger pie of 95% (2017: 54%). All other Asset
classes reduced drastically from previous year. Overall, assets invested outside Eswatini increased by 16% (2017: 21%).
INVESTMENTS BY ASSET MANAGERYear end
31-Mar-2018 31-Mar-2017 31-Mar-2016 31-Mar-2015 31-Mar-2014Allan Gray 5 892 876 499 6 673 656 317 6 394 343 376 5 082 531 683 4 939 986 785Coronation 4 340 985 526 4 492 002 268 4 389 418 190 4 119 524 663 3 613 077 937RMB and Momentum Asset - - - 609 356 894 738 996 429Foord 1 451 521 715 2 063 799 918 2 143 101 994 2 012 787 198 1 801 411 301African Alliance 1 485 167 992 919 442 630 1 025 737 325 811 802 366 750 306 937Investec 416 123 397 324 292 316 327 876 583 335 391 117 342 063 230STANLIB 3 744 799 852 3 095 696 174 3 452 680 587 2 025 436 301 1 808 480 797Old Mutual Investment 660 070 128 775 924 212 1 107 582 357 179 815 049 157 770 659Inhlonhla 1 734 188 699 1 286 929 658 116 916 074 111 519 505 110 963 498Insured Funds 350 689 080 295 780 789 274 406 209 166 251 611 165 395 847Mergence Africa 35 810 131 - - 25 070 814 18 815 792Balondozi 54 390 623 183 376 293 158 101 304 100 470 187 28 586 770SSgA 16 959 819 - - 13 349 553 10 400 768ORANGE 26 073 084 - - 19 248 997 17 681 278Metropolitan - - - 95 539 618 79 555 935
SANLAM 932 176 983 959 516 778 887 025 164 - -
Other Locally Administered Assets 6 699 183 691 5 875 473 830 5 031 802 355 7 133 570 586 6 216 589 916Total 27 841 017 219 26 945 891 183 25 308 991 518 22 841 666 142 20 800 083 879
2017 - FOREIGN INVESTMENTS BY ASSET CLASS
Cash and Money Market
Instruments - 6%
Johannesburg Stock Exchange Equities - 54%
Bondexchange
ofSouth
African - 9%
OffshoreEquities
- 24%
Equity LinkedDerivatives- 0.1%
Offshorebonds - 1%
Commodities- 1%
Property - 5%
2018 - FOREIGN INVESTMENTS BY ASSET CLASS
Cash and Money Market
Instruments - 1%
JohannesburgStock ExchangeEquities - 95%
South AfricanBonds
1%
Equity LinkedDerivatives - 1%
Offshore bonds - 0.3%
Offshore Equities -1%
Commodities0.1%
Property - 0.1%
114

FINANCIAL SERVICES REGULATORY AUTHORITY (FSRA) Annual Report 2018
2018 - ASSET MANAGER MARKET SHARE
Other LocallyAdministered Assets -
22%
Insurers Funds -1%
Balondolozi - 1%
SANLAMSecurities
- 4%
African Alliance- 1%
Foord - 8%
Coronation - 17%
Allan Gray - 25%
Inhlonhla - 5%
Old Mutual - 3%
Stanlib - 11%
Investec - 1%
2018 - ASSET MANAGER MARKET SHARE
Other SelfAdministered Assets -
24%
Insurers Funds -1%
Balondolozi - 0.2%
Orange - 0.1%
SSgA - 0.1%
Mergence Africa - 0.1%
STANLIB13%
African Alliance
6%
Foord - 5%
Coronation 16%
Allan Gray - 21%SANLAM - 3%
Inhlonhla - 6%
Insured Funds - 1%
Old MutualInvestment
Management Co.2% Investec
1%
115
RETIREMENT FUNDS FINANCIAL PERFORMANCE - continued

FINANCIAL SERVICES REGULATORY AUTHORITY (FSRA) Annual Report 2018
31-Mar-1531-Mar-14 31-Mar-16 31-Mar-17 31-Mar-18
TOP 10 ASSET MANAGER - 5 YEAR ASSETS GROWTH TRENDS
30,000,000,000
25,000,000,000
20,000,000,000
15,000,000,000
10,000,000,000
5,000,000,000
-
ALLAN G
RAY
CORONAT
ION
STANLI
B
FOORD
AFRIC
AN ALL
IANCE
INVES
TEC
OLD M
UTUAL
BALONDOLO
ZI
INHLO
NHLA
SELF
-ADM
INIS
TERED
ASS
ETS
SANLA
M
TOTA
L ASS
ETS
RETIREMENT FUNDS FINANCIAL PERFORMANCE - continued
The above bar chart is clear demonstration that Allan Gray continues to enjoy the largest market share of the retirement funds assets which have been growing steadily from year to year. Coronation, Foord and STANLIB are manifesting similar upward trends from year to year. Other Asset Managers that are emerging with growing market shares are Inhlonhla, Sanlam and African Alliance.
Overall, total retirement funds assets are increasing from year to year, as manifesting in the graph above.
With the increase to 50% of legislative requirement for local investments, large Retirement Funds, PSPF and SNPF are putting more effort in investing their funds themselves, as manifesting in the self-administered assets graph
116

FINANCIAL SERVICES REGULATORY AUTHORITY (FSRA) Annual Report 2018
NOTE 1 - CONTRIBUTIONSYear end
31-Mar-2018 31-Mar-2017 31-Mar-2016 31-Mar-2015 31-Mar-2014
ContributionsMember contributions - regular 469 144 634 526 089 707 468 313 304 402 826 015 385 148 754Employer contributions 1 039 768 595 1 179 878 253 1 027 062 359 1 007 116 636 858 569 747Employer Ex Gratia Contributions 5 747 848 5 747 848 7 272 427 12 064 776 6 209 387Member additional voluntary contributions 6 757 776 57 104 544 6 756 313 4 312 894 (163 165 236)Transfers-In - 18 710 938 49 750 373 10 053 798 5 730 616
Total 1 521 418 853 1 787 531 290 1 559 154 776 1 436 374 119 1 092 493 268
RETIREMENT FUNDS INDUSTRY INVESTMENTS – NOTES TO THE FINANCIAL STATEMENTS
NOTE 2 - INVESTMENT INCOMEYear end
31-Mar-2018 31-Mar-2017 31-Mar-2016 31-Mar-2015 31-Mar-2014
Investment IncomeDividends 133 513 052 133 513 052 103 010 344 86 306 341 80 010 979Interest 544 230 705 544 230 705 470 019 496 379 631 696 290 786 241Net realised gains/losses on financial assets 45 413 056 45 413 056 96 885 549 230 321 102 61 679 337
Fair value adjustments through Profit & Loss 488 672 460 936 044 549 1 605 058 426 1 218 750 077 2 417 703 940
Total 1 211 829 273 1 659 201 362 2 274 974 188 1 915 009 216 2 850 180 497
NOTE 3 - OTHER INCOMEYear end
31-Mar-2018 31-Mar-2017 31-Mar-2016 31-Mar-2015 31-Mar-2014
Other incomeRent 85 111 408 80 988 643 74 575 192 71 662 980 56 436 340Sundry Income 5 710 831 5 234 735 4 594 458 4 202 754 4 963 775GLA recoveries proceeds 15 667 815 13 130 411 16 733 894 16 986 974 21 553 601
Total 106 490 054 99 353 789 95 903 544 92 852 708 82 953 716
117
RETIREMENT FUNDS FINANCIAL PERFORMANCE - continued

FINANCIAL SERVICES REGULATORY AUTHORITY (FSRA) Annual Report 2018
NOTE 4 - BENEFITS PAIDYear end
31-Mar-2018 31-Mar-2017 31-Mar-2016 31-Mar-2015 31-Mar-2014
Retirement benefit paid (Pension/annuity) (736 302 206) (635 966 041) (533 178 234) (521 120 097) (460 165 447)Periodic Payments to beneficiaries (31 649 189) (36 037 982) (29 576 309) (30 441 177) (21 348 570)Lump sum benefit paid:
On death and disability (83 634 569) (88 887 443) (69 200 019) (72 051 026) (103 836 642)On retirement (421 627 506) (438 987 143) (341 783 361) (360 932 612) (382 925 857)On withdrawal (104 269 341) (109 787 882) (112 298 068) (109 912 693) (109 390 463)Transfers to other funds (65 965 268) (42 533 032) (1 127 881) (27 149 246) (4 179 734)Retrenchments/Voluntary Early Retirement
(10 846 500) (9 852 349) (12 899 419) (28 551 905) (27 415 234)
Other - USDF Past service contributions refund
- - - -
Total (1 454 294 579) (1 362 051 872) (1 100 063 291) (1 150 158 756) (1 109 261 947)
RETIREMENT FUNDS FINANCIAL PERFORMANCE - continued
NOTE 5 - PREMIUMS PAIDYear end
31-Mar-2018 31-Mar-2017 31-Mar-2016 31-Mar-2015 31-Mar-2014
Group life and funeral premiums (44 352 538) (37 721 809) (35 800 613) (55 434 606) (50 215 902)Permanent Health Insurance (PHI) premium (4 254 279) (3 460 885) (3 484 189) (1 293 125) (1 924 321)Purchase of annuities (271 636) (596 487) (499 463) - -
Total (48 878 453) (41 779 181) (39 784 265) (56 727 731) (52 140 223)
NOTE 6 - PROFESSIONAL FEES PAIDYear end
31-Mar-2018 31-Mar-2017 31-Mar-2016 31-Mar-2015 31-Mar-2014
Professional Fees:Actuarial fees (2 170 263) (2 561 122) (2 007 512) (1 677 009) (1 050 366)Audit fees (2 084 563) (2 653 488) (2 087 189) (3 038 634) (2 814 337)Fund administration fees (18 019 058) (20 900 199) (17 756 678) (21 112 376) (19 200 879)Investment management fees (119 882 729) (113 704 307) (107 998 296) (99 342 162) (73 179 705)Legal fees (1 468 139) (1 467 131) (3 425,800) (2 121 460) (1 440 527)Consultants fees (3 766 709) (5 256 839) (8 684 987) (2 678 448) (2 571 924)
Total (147 391 461) (146 543 086) (141 960 462) (129 970 089) (100 257 738)
118

FINANCIAL SERVICES REGULATORY AUTHORITY (FSRA) Annual Report 2018
NOTE 7 - ADMINISTRATION EXPENSESYear end
31-Mar-2018 31-Mar-2017 31-Mar-2016 31-Mar-2015 31-Mar-2014
Advertising and Communication to members (6 374 613) (5 811 038) (5 404 571) (4 999 264) (3 774 459)Bank charges (1 694 993) (2 235 364) (2 079 807) (2 771 372) (2 128 021)Board expenses (4 763 888) (4 311 674) (2 904 520) (2 860 899) (3 004 507)Computer expenses (2 183 935) (2 261 642) (2 118 931) (1 393 625) (1 707 357)Depreciation (5 610 173) (4 805 386) (3 928 106) (3 947 986) (3 851 663)General expenses (8 894 937) (10 697 757) (8 279 144) (1 984 993) (1 750 682)Licences (3 640 028) (3 771 374) (3 004 441) (3 101 292) (2 592 668)Insurance (368 464) (317 563) (269 851) (296 629) (409 665)Motor vehicle expenses (994 805) (990 297) (968 338) (893 599) (627 194)Postage and telephone (2 542 686) (2 566 308) (2 485 719) (2 217 681) (1 973 749)Printing and stationery (1 279 650) (1 215 228) (1 406 922) (1 244 707) (1 200 788)Rent, property and office expenses (41 680 600) (38 147 456) (37 560 889) (35 251 478) (25 906 666)Repairs and maintenance (452 724) (595 427) (658 617) (685 279) (1 425 431)Salaries, wages and allowances (80 280 725) (76 454 978) (60 565 943) (60 996 141) (57 883 648)Social Investments (13 558 960) (5 437 257) (538 689) (1 248 768) (223 911)Travel and entertainment (937 217) (946 490) (965 171) (714 996) (1 128 899)Public Functions - - (6 089 748) (59 702) (37 541)Training expenses (3 643 485) (3 318 862) (2 798 163) (3 610 416) (1 908 520)Withdrawing tax (30 599 964) (33 447 462) (26 812 563) (19 125 258) (8 551 357) Total (209 501 847) (197 331 563) (168 840 133) (147 404 085) (120 086 726)
NOTE 8 - LOCAL INVESTMENTS, CASH AND CASH EQUIVALENTSYear end
TYPE OF INVESTMENT AND COUNTERPARTY
31-Mar-2018 31-Mar-2017 31-Mar-2016 31-Mar-2015 31-Mar-2014
Eswatini Stock Exchange: 747 769 457 737 410 759 567 654 682 483 987 786 535 584 715SWAPROP 84 598 865 73 890 859 65 823 596 53 656 330 53 617 400
Eswatini Empowerment Limited (SEL) 471 314 235 448 870 700 361 992 500 354 752 650 333 033 100
RSSC 1 736 268 1 940 000 1 940 000 1 690 000 1 690 000
SBC Shares 4 923 562 24 001 800 6 250 003 - -
Nedbank Share 4 701 080 10 959 750 10 959 750 10 759 750 10 444 750
Newera Partners - - - 24 833 312 55 992 547
Greyston Partners 180 495 447 177 747 650 120 688 833 38 295 744 80 806 918
119
RETIREMENT FUNDS FINANCIAL PERFORMANCE - continued

FINANCIAL SERVICES REGULATORY AUTHORITY (FSRA) Annual Report 2018
NOTE 8 - LOCAL INVESTMENTS, CASH AND CASH EQUIVALENTS - continued
Year end TYPE OF INVESTMENT AND COUNTERPARTY
31-Mar-2018 31-Mar-2017 31-Mar-2016 31-Mar-2015 31-Mar-2014
Unlisted Shares 1 884 633 314 1 661 103 894 1 168 929 903 1 230 755 505 639 940 059
Old Mutual Eswatini Shares 8 009 255 7 988 235 7 988 235 7 988 235 7 988 235SBS - permanent shares 11 700 448 14 874 800 13 652 907 146 309 853 147 611 991SIDC Shares 408 639 000 395 954 293 274 420 293 124 000 000 124 000 000Happy Valley Enterprises 143 883 000 143 883 000 136 303 000 123 484 392 104 506 561Motel Enterprises 134 057 545 142 429 065 5 618 668 - - The New Mall – equity 52 823 272 52 823 272 15 823 272 15 823 272 15 823 272Emprop Limited – equity 20 000 000 20 000 000 20 000 000 53 000 000 73 000 000ESRIC 32 500 000 32 500 000 32 500 000 32 500 000 32 500 000RMS Manzini investments 38 275 000 38 275 000 33 002 000 2 000 28 890 000Libuyile Equity 73 146 163 73 146 163 - 64 383 052 60 000 000Old Mutual Agri-Fund - - - 45 620 000 45 620 000Eswatini National Housing Board - - - 14 967 691 -Montigny Group of Companies 623 804 555 618 147 010 602 677 010 602 677 010 -Maguduza Hydro Power Station 31 683 701 31 683 701 25 644 518The Gables Ezulwini 186 581 415 3 734 590 1 300 000T1 and T2 Property (Pty) Ltd 79 136 608 79 136 608 -Inyatsi House 47 333 6 528 157 - Ezulwini Reinsurance Company Limited 40 346 019
Bonds – Own Portfolio 1 503 632 559 903 773 362 311 110 856 246 339 997 244 104 995
Newera Bond - - 3 833 312 3 680 767Bond SG016 – 31/08/2018 50 259 712 50 259 712 50 276 633 50 259 712 50 259 712Bond SG017 – 31/10/2020 93 269 345 93 269 345 93 290 328 93 300 820 92 712 516Bond SG018 – 31/01/2024 98 909 107 98 909 107 98 933 804 98 946 153 97 452 000Bond SG023 68 594 112 68 594 112 68 610 091 - -Bond SG024 80 937 658 80 937 658 - - -Bond SG025 102 794 525 102 794 525 - - -Bond SG026 100 764 383 100 764 383 - - -Bond SG027 104 447 260 104 447 260 - - -Bond SG028 102 905 479 102 905 479 - - -Bond SG029 604 098 682 100 891 781 - - -Inyatsi Bond - - - - -Eswatini 0 - 3 years 96 752 296 - - - -Eswatini 3 - 5 years - - - - -Eswatini 5 - 7 years - - - - -Eswatini Government Bond - - - - -
Bonds – Old Mutual 48 641 780 48 641 780 48 652 727 48 652 727 48 652 727
Eswatini Govt Bond SG017 – 31/10/2020 48 641 780 48 641 780 48 652 727 48 652 727 48 652 727
120
RETIREMENT FUNDS FINANCIAL PERFORMANCE - continued

FINANCIAL SERVICES REGULATORY AUTHORITY (FSRA) Annual Report 2018
NOTE 8 - LOCAL INVESTMENTS, CASH AND CASH EQUIVALENTS - continuedYear end
TYPE OF INVESTMENT AND COUNTERPARTY
31-Mar-2018 31-Mar-2017 31-Mar-2016 31-Mar-2015 31-Mar-2014
Bonds – STANLIB 71 401 023 160 030 387 160 189 148 173 145 962 173 194 059
Bond STD202 (8.1010%) – 14/10/2015 - - - 13 176 882 13 176 882
Bond SG08 (7.30%) – 30/11/2015 - - - 46 055 587 46 055 587Bond SG011 (8.25%) – 31/01/2018 - 91 214 216 91 227 756 91 214 216 91 214 216
Bond SG0016 – 31/08/2018 17 123 780 17 121 956 17 263 407 17 315 360 17 363 457
Bond SG0017 – 31/10/2020 5 416 011 5 383 917 5 384 114 5 383 917 5 383 917Bond SG0023 48 861 232 46 310 298 46 313 871
Loans and Advances – Own Portfolio 1 884 207 190 1 456 008 982 761 227 458 464 351 052 691 667 119
Eswatini Sugar Association 355 950 449 253 762 702 253 383 768 252 816 429 252 714 846Eswatini Electricity Company 45 890 957 61 321 644 76 633 973 91 913 425 107 094 244Eswatini Bank 170 833 336 200 049 864 87 288 099 81 629 246 122 104 932Central Bank of Eswatini - 3-year note - - - - 202 810 822The New Mall loan 6 942 275 6 942 275 36 448 869 6 942 275 6 942 275Select Management Services 90 008 198 90 008 198 - 20 176 147 -Eswatini Revenue Authority 432 826 097 272 840 996 - - -Select Limited Loan 3 50 745 022 51 182 523 50 807 524 - -Eswatini National Housing Board 667 553 448 456 443 372 240 303 884 10 873 530 -C&M Sales 3 364 531 3 364 531 - - -FINCORP 34 864 747 34 864 747 - - -Manzini City Council 17 871 492 17 871 492 7 417 557 - -Members Loans 7 356 638 7 356 638 8 943 784 - -
Loans portfolio – Inhlonhla Swaziland 932 190 276 663 400 808 729 879 445 585 674 209 446 308 166
Swazi Observer Loan 1 313 086 1 984 503 2 346 311 2 885 643 3 396 144
Saphumula SACCO loan 7 919 134 9 079 373 274 780 1 886 337 4 132 189
Moshav Properties loan - 741 038 2 593 695 2 580 007 2 876 833Swazi Plaza Properties 42 379 104 49 651 522 56 311 892 63 012 921 69 475 188
Emprop Limited 100 753 383 102 494 426 100 912 029 105 769 734 105 737 715
Standard Bank – Custodian Accountant 1 130 905 11 259 458 40 462 104 17 658 178 14 084 829
First Finance Loan 193 153 523 193 208 840 193 239 481 141 646 535 145 953 934
Amandla Financial Services 61 260 822 71 536 853 71 419 505 71 131 299 30 533 654
Libuyile (Pty) Ltd Loan 69 736 129 70 318 425 70 273 212 70 252 752 70 117 680
Libuyile Shareholders loan - - - - -
Montigny Group of Eswatini Companies 156 648 083 138 376 812 69 179 567 108 850 803 -
Serjeans Investments (Pty) Ltd 27 056 252 14 749 558 122 766 869 - -Swazi Mobile 270 839 855 - - - -
121
RETIREMENT FUNDS FINANCIAL PERFORMANCE - continued
RETIREMENT FUNDS FINANCIAL PERFORMANCE - continued

FINANCIAL SERVICES REGULATORY AUTHORITY (FSRA) Annual Report 2018
NOTE 8 - LOCAL INVESTMENTS, CASH AND CASH EQUIVALENTS - continuedYear end
TYPE OF INVESTMENT AND COUNTERPARTY
31-Mar-2018 31-Mar-2017 31-Mar-2016 31-Mar-2015 31-Mar-2014
Loans Portfolio - STANLIB Eswatini 115 178 057 112 892 484 110 614 517 108 626 538 78 573 425
Eswatini Sugar Association 75 413 527 75 425 342 75 378 082 75 069 350 75 053 425RMS Manzini Investment (Pty) Ltd 39 764 530 37 467 142 35 236 435 33 557 188 3 520 000 Loans Portfolio – Old Mutual Eswatini 186 770 927 87 515 008 35 510 976 39 064 360 30 883 512
Agri-Fund 180 824 478 78 837 281 24 197 794 24 926 849 22 810 000Ezulwini Town Board 1 929 590 3 956 086 5 924 557 6 904 949 8 073 512New Mall 4 016 859 4 721 641 5 388 625 7 232 562 -
Loans Portfolio – African Alliance 225 122 316 113 926 907 134 214 783 133 806 250 20 495 616
Inyatsi Construction 152 704 658 - 20 641 301 20 495 615 20 495 616Select Limited Loan 1 40 570 192 31 311 781 31 324 727 31 316 096 -Select Limited Loan 2 31 847 466 31 432 603 31 441 231 31 436 919 -Select Limited Loan 3 - 51 182 523 50 807 524 50 557 620 -
Property 1 458 206 632 1 128 589 082 944 310 595 878 229 102 835 895 493
Investment Property 1 391 095 202 1 109 167 652 944 310 595 878 229 102 835 895 493Equity to property developers 25 490 000 - - - -Loans to property developers 41 621 430 19 421 430 - - -
Cash and money market instruments: 2 501 875 610 2 871 956 113 3 233 478 005 2 740 937 699 2 471 290 030
STANLIB Money Market 1 217 005 466 1 424 780 929 1 448 874 413 1 381 647 121 1 279 244 770African Alliance Money Market 390 601 739 517 049 795 519 452 232 456 434 999 304 888 447Eswatini Building Society 156 055 593 223 006 566 214 029 803 57 365 791 54 700 318First National Bank 74 560 811 79 695 717 109 707 942 50 892 513 271 982 925Nedbank Eswatini 164 566 632 162 703 145 95 017 360 62 164 507 38 310 223Standard Bank Eswatini 145 667 623 145 198 671 34 565 622 69 784 016 151 819 083Swazi Bank 121 635 899 20 172 720 117 869 221 102 067 461 2 558 471Central Bank of Eswatini deposits - - - 14 308 486 10 664 272Old Mutual money market 231 781 847 299 348 570 690 126 625 497 849 955 357 121 520
Insured assets 399 178 441 295 780 789 280 656 212 166 250 611 165 395 847
Total Local Investments 11 910 318 221 10 232 879 796 8 367 050 008 7 299 821 198 6 381 985 763
RETIREMENT FUNDS FINANCIAL PERFORMANCE - continued
122

FINANCIAL SERVICES REGULATORY AUTHORITY (FSRA) Annual Report 2018
NOTE 9 - ACCOUNTS RECEIVABLEYear end
31-Mar-2018 31-Mar-2017 31-Mar-2016 31-Mar-2015 31-Mar-2014
Prepayments 3 944 543 6 866 122 7 356 758 6 236 547 6 436 288Staff receivables 20 928 146 16 577 824 3 081 919 2 672 249 2 717 388Sundry Receivables 4 866 934 5 329 128 5 277 603 7 839 257 4 521 790Interest receivable 3 000 2 874 6 546 1 152 291 2 172 785Transfers from other funds - - 4 915 935 - -Proceeds from GLA policies 889 095 10 813 748 10 044 376 18 154 784 6 105 139Rent receivables 1 020 342 7 780 275 1 459 962 3 994 121 2 546 822Net Vat receivables 9 003 042 14 725 714 9 153 995 - 21 966 653 40 655 102 62 095 685 41 297 094 40 049 249 46 466 865
NOTE 10 - ARREAR CONTRIBUTIONSYear end
31-Mar-2018 31-Mar-2017 31-Mar-2016 31-Mar-2015 31-Mar-2014 Receivables from employers 98 421 782 3 135 497 (88 884 178) 337 848 444 566 371 032Less: Provision for impairment 23 801 134 2 587 777 1 775 208 (237 815 330) (478 252 236)Receivables from employees 784 165 89 505 922 145 833 716 1 976 470 1 651 187Total 123 007 081 95 229 196 58 724 746 102 009 584 89 769 983
NOTE 11 - BENEFITS PAYABLEYear end
31-Mar-2018 31-Mar-2017 31-Mar-2016 31-Mar-2015 31-Mar-2014 Accrued benefits due 76 432 624 22 032 042 24 953 763 374 666 160 251 940 054Pensioners on hold - 83 027 109 74 008 468Pensioners suspended 4 966 421 10 839 146 11 792 386 29 113 962 44 889 504Exgratia benefit accrual 4 689 158 4 719 444 4 668 021 4 668 021 4 668 021Total 86 088 203 120 617 741 115 422 638 408 448 143 301 497 579
NOTE 12 - ACCOUNTS PAYABLEYear end
31-Mar-2018 31-Mar-2017 31-Mar-2016 31-Mar-2015 31-Mar-2014 Accrued Expenses 40 249 813 32 996 534 139 478 666 45 891 087 64 080 495Uncollected benefit claims - 30 103 942 18 946 145 958 849 1 117 642Other Payables 40 893 164 10 480 157 5 028 029 31 976 781 7 231 717Retention - - - 609 164 908 879Provision for Foreign Tax 27 859 31 928 1 260 218 1 111 451 1 111 451GLA premium payable 611 013 1 084 668 308 651 - 400 980VAT Output 891 792 39 315 746 26 788 540Total 82 673 641 114 012 975 191 810 249 80 547 332 74 851 164
RETIREMENT FUNDS FINANCIAL PERFORMANCE - continued
123

FINANCIAL SERVICES REGULATORY AUTHORITY (FSRA) Annual Report 2018
LEGAL SERVICESSTAKEHOLDERENGAGEMENTS &CONSUMERPROTECTION
124

FINANCIAL SERVICES REGULATORY AUTHORITY (FSRA) Annual Report 2018 125
STAKEHOLDER ENGAGEMENTS AND CONSUMER PROTECTION- continued
UPDATE ON LEGISLATIVE ISSUES Consumer Credit Regulations 2017
The Authority received and reviewed comments from stakeholders on the draft Consumer Credit Regulations 2017. Five
topical issues were raised which relate to the dual regulation of financial institutions by the FSRA and the Central Bank on credit agreements, the capping of the cost of credit, asset thresholds for corporate consumers, the introduction of capital adequacy requirements and transitional arrangements to allow entities to introduce technological changes that comply with the regulations.
Insurance Amendment Regulations and Retirement Funds (Amendment) Regulations
The Authority drafted the Insurance (Amend-ment) Regulations 2018 and Retirement Funds (Amendment) Regulations 2018. These regu- lations aim to increase the local investment criteria for insurance companies and retirement funds from 30% to 50%, to reduce the amount of insurance and retirement funds assets that can be held in cash, improve liquidity in the domestic market and to encourage insurance companies and retirement funds to invest in the domestic economy The regulations were also sent to the industry for comment and comments received were incorporated into the final draft regulations which are currently awaiting promulgation.
HARMONISATION OF LEGAL AND REGU-LATORY FRAME-WORK PROJECT BY THE INTERNATIONAL MONETARY FUND (IMF).
The Authority received technical assistance from the IMF to assist in the strengthening, development and harmonization of the current regulatory and supervisory framework to align it with international best practice and to build supervisory staff capacity to effectively execute the FSRA’s mandate. The Authority and the IMF set targets for the technical assistance and capacity
building program to be implemented over a two-year period with effect from January 2018 and agreed to review the FSRA Act, Insurance Act, Retirement Funds Act, Securities Act, Building Societies Act.
Reinsurance Bill
During the reporting period, the Reinsurance Bill was developed with the objective to establish, recognise and promote reinsurance business in the insurance industry; provide for the participation of the Government in the reinsurance business and to introduce a legal framework for the regulation and supervision of reinsurance business in Eswatini.
Registration requirements for forex intermediaries
The capital markets and securities industry has seen a rise in entities that are trading illegally in the industry taking advantage of the non-existence of an appropriate legislative framework to regulate them. In order to bring the entities under regulation, the Authority developed registration and reporting requirements for forex intermediaries which include trading platform providers, financial markets education institutions, forex investment brokers etc.
INTERVENTION ISSUES
The FSRA is mandated under the FSRA Act to ensure sound conduct of business in the financial services sector. Enforcement is one of the tools which enables the FSRA to achieve this objective. The FSRA is committed to use its enforcement mandate in a fair and proportionate manner and where appropriate, the Authority ensures that contraventions are dealt with expeditiously through the normal supervisory process.
During the year under review enforcement action was taken for various transgressions as follows: The Authority undertook special investi-
gations on the business activities of two financial services providers following

FINANCIAL SERVICES REGULATORY AUTHORITY (FSRA) Annual Report 2018
irregularities which were uncovered during onsite inspections undertaken in 2017.
An insurance broker was directed to cease carrying on insurance business due to the failure to comply with the Insurance Act, No 7 of 2005;
An insurance broker was directed to cease misleading the public by purporting to be a licensed dealer in contravention of the Securities Act 2005;
An insurance company for paying upfront commission to insurance brokers in contravention of the Insurance Regulations 2008; and,
An insurance company for transacting with an unlicensed intermediary.
Medical Aid Scheme for the failure to adhere to a regulatory directive issued in terms of the FSRA Act; and
An insurance broker for trading without a licence;
NATURE OF INTERVENTION ACTION TYPE OF ENTITY NUMBER OF ENTITY
Withdrawal of licence Insurance Broker 1Administrative penalty Insurance Broker 3Administrative penalty Insurer 3Special Investigation SACCO, Pension Fund 2Liquidation SACCO 1Administrative penalty Retirement Fund 1Liquidation Insurance Broker 1
Table 10: Number of Enforcement Actions
STAKEHOLDER ENGAGEMENTS AND CONSUMER PROTECTION- continued
CIRCULARS AND INDUSTRY NOTES
Industry Note no 1/2017 on Regulatory Exams for Retirement Funds trustees
The Authority has accredited training programs which have been spearheaded by Business Capital Development Agency in collaboration with AMADI University College Swaziland. The programs are aimed at equipping trustees, administrators, consultants and other key functionaries in the retirement funds industry with basic knowledge in legal, governance, financial and investment principles needed in the execution of their duties. Upon successful completion of the modules, candidates will be awarded either a Certificate of Proficiency in Retirement Fund Basics or an Advanced Certificate in Retirement Fund Trusteeship.The programs are offered through AMADI and are available with effect from January 2018.
RELATIONSHIPS WITH OTHER REGULATORS
The FSRA is committed to building relations with key stakeholders and other supervisors and regulators both locally and internationally. A memorandum of understating was signed with the Council for Medical Schemes (CMS)in South Africa. The purpose of the MoU is to establish a framework for cooperation on information sharing for the benefit of transferring knowledge and skills in the private health care insurance industry and to share experiences and challenges in the respective regulatory environments. Another MOU was also signed with the National Industrial Corporation of Eswatini (ENIDCS) and its main purpose is to formalise avenues for collaboration for each signatory to benefit from the expertise of the other on matters relating to sustainable economic development and invest-ments among others.
126

FINANCIAL SERVICES REGULATORY AUTHORITY (FSRA) Annual Report 2018
STAKEHOLDER ENGAGEMENTS AND CONSUMER PROTECTION- continued
ANTI MONEY LAUNDERING/COUNTER FINANCING OF TERRORISM
AML/CFT National Risk Assessment
Recommendation 1 of the Financial Action Task Force (FATF) requires countries to conduct a risk assessment which is aimed at identifying, assessing and understanding money laundering and terrorist financing risks faced by countries. Eswatini is currently undergoing its national risk assessment. This is a government-led initiative which is being conducted with the technical assistance of the World Bank. This exercise will enable the assessment of risks, application of resources and adoption of measures for the mitigation of the risks identified. Further, it will enable the Eswatini Authorities to assess the effectiveness of the current legal framework and the application of a risk based approach.
As part of the exercise, the Authority continued collecting statistical data and other pertinent information that would enable it to understand money laundering and terrorist financing threats, vulnerabilities and risks to which the non-bank sector is exposed. Preliminary findings for the insurance, securities and other financial institutions were communicated to the sector.
AML/CFT National Strategy
As a member of the national AML/CFT task force, the Authority participated in the development of the Anti- Money Laundering / Countering the Financing of Terrorism (AML/CFT) national strategy. The main objective of the strategy is to enforce compliance with international standards, improve the quality of data that informs AML/CFT intervention, enhancing collaboration and cooperation between members of the national AML/CFT task force, building capacity among key stakeholders.
CONSUMER PROTECTION AND STAKEHOLDER RELATIONS
The FSRA is mandated by Section 5 of the FSRA Act, 2010 to take measures for the better protection of consumers of financial services and to promote public understanding of the financial system including awareness raising. Through financial literacy, consumers of financial services are able to practice financial planning and save for their economic wellbeing by choosing financial products that suit their needs. During the reporting period, the FSRA has undertaken a number of financial literacy initiatives as follows:
1.1 Awareness Raising and Outreach Initiatives
The consumer education outreach program is aimed at reaching all demographics across the Eswatini population and seeks to raise awareness about consumer rights with regards to financial services products in order to enhance financial literacy in the Kingdom. Under this program, the FSRA conducts outreach sessions across the four regions of the country in both urban and remote rural areas.During the period under review the FSRA conducted outreach sessions on financial literacy and consumer education as set out below. All Umbutfo Swaziland Defence Force (USDF)
Army Barracks in the Hhohho region, Tinkhundla including, Lobamba, Ludzeludze,
Hhukwini, Mantabeni, Nkwene, and Sigwe, . Nhlangano Correctional Services
Mawelawela Correctional Services Junior Achievers Institute of Development Management (IDM) Swaziland Nazarene Health Institutions Factory workers at the RHODES FACTORY
in Malkerns Workers at the Crooks Plantations in Big Bend
127

FINANCIAL SERVICES REGULATORY AUTHORITY (FSRA) Annual Report 2018
Students and Lecturers at the Southern Africa Nazarene University (SANU)
Visually Impaired people under the Mayiwane Inkhundla
Swazi Bank Staff Sidwashini youth Students of the Limkokwing University of
Technology
1.2 Radio AdvertsPursuant to the prohibited practices listed under Section 10 of the Consumer Credit Act, 2016, the FSRA aired Radio advertisements warning members of the public not to leave their IDs and Bank Cards with money lenders on the Eswatini Broadcasting and Information Station. The advertisements were aired every quarter during the cause of the financial year.
1.3 Formation of a financial services industry associationsTo encourage organisation amongst market players, the Authority hosted Ms. Christabel Banda, who is the Chief Executive Officer of the Insurance Association of Zambia to share the Zambian experience and the benefits of forming industry associations. The discussion session was held at the Happy Valley Hotel on the 7th June 2017. Ms Banda emphasized the importance of collaboration and acting collectively as competitors. The meeting also discussed the importance of lobbying for the review of legislation, education, resource mobilisation and sustainability and keeping an association relevant through vigilance on policy developments that might affect the industry.
1.4 BillboardsTwo billboards were erected. One along the freeway between Mbabane and Manzini and the other in the bus terminus in Manzini. The billboards were aimed at promoting the “saving” culture amongst Emaswati and encourage investing in Eswatini. The billboards had the inscription “Put your money where your heart is; SAVE AND INVEST IN SWAZILAND”. Another billboard was erected along Mhlamba-nyatsi road next to the Prime Minister’s offices with a warning “PROTECT YOURSELF – don’t deal with unlicensed entities”. This was meant to warn members of the public from dealing with unlicensed entities which put them at risk of losing their money.
1.5 RoadshowsRoadshows were held in Nhlangano and Pigg’s-Peak on the 11th November 2017 and 17th
February 2018 respectively. The purpose of the roadshows was to create awareness and educate the public about the role of the Authority, and the Ombudsman for Financial Services. The Eswatini Stock Exchange also participated in the roadshow; educating members of the public on how to invest through the stock exchange.
1.6 Financial Services MarathonOn the 9th September 2017, FSRA hosted the third edition of the Financial Services Marathon. The event plays an important role in creating awareness about the Authority, its role and the financial services industry as a whole.
STAKEHOLDER ENGAGEMENTS AND CONSUMER PROTECTION- continued
128

FINANCIAL SERVICES REGULATORY AUTHORITY (FSRA) Annual Report 2017
GENERAL OVERVIEW
FINANCIAL STATEMENTS
BUSINESSOVERVIEW
REGULATED INDUSTRIES- FINANCIAL STATISTICS
ANNUALFINANCIALSTATEMENTS
For The Year Ended
31 March 2018
Country of incorporation
and domicile Eswatini
Nature of business and
principal activities Regulator of non-bank financial services providers
Business address 2nd Floor Public Service Pension Fund (Ingcamu) Building Mhlambanyatsi Road Mbabane, H100
Postal address
P.O. Box 3365Mbabane, H100Eswatini
Bankers
Standard Bank (Swaziland) LimitedFirst National Bank (Swaziland) LimitedNedbank (Swaziland) Limited
Auditors
PricewaterhouseCoopers Swaziland RHUS Office Park Karl Grant Street Mbabane Eswatini
Postal address
P. O. Box 569MbabaneH100Eswatini
GENERALINFORMATION
Page
Statement of Responsibility by the Board of Directors 130
Independent Auditor’s Report 131 - 132
Directors Report 133
Statement of Comprehensive Income 134
Statement of Financial Position 135
Statement of Changes in Equity 136
Statement of Cash Flows 137
Notes to the Annual Financial Statements 138 - 151
Detailed Income Statement 152 - 153
Detailed Income Statement (Eswatini Stock Exchange) 154
Detailed Income Statement (Ombudsman of Financial Services) 155
CONTENTS
129
FINANCIAL SERVICES REGULATORY AUTHORITY (FSRA) Annual Report 2018
The Directors are responsible for the preparation, integrity and fair presentation of the financial statements of Financial Services Regulatory Authority. The financial statements presented on pages 134 to 151 have been prepared in accordance with the basis of accounting described innote 1 to the financial statements and include amounts based on judgements and estimates made by management.
The Directors are also responsible for the Authority’s system of internal financial control. These are designed to provide reasonable, but not absolute assurance as to the reliability of the financial statements, and to adequately safeguard, verify and maintain accountability of the assets, and to prevent and detect misstatement and loss. Nothing has come to the attention of the Directors to indicate that any material breakdown in the functioning of these controls, procedures and system has occurred during the year under review.
The going concern basis has been adopted in preparing the financial statements. The Directors have no reason to believe that the Authority will not be a going concern in the foreseeable future based on forecasts and available cash resources. These financial statements support the viability of the Authority.
The financial statements have been audited by the independent auditors, PricewaterhouseCoopers, which was given unrestricted access to all financial records and related data, including minutes of all meetings of the Board of Directors and committees of the board. The Directors believe that all representations made to the independent auditors during their audit are valid and appropriate.
___________________________________________ _________________________________________Board Chairman CEO and Board Secretary
___________________________________________ _________________________________________Date Date
STATEMENT OF RESPONSIBILITY BY THE BOARD OF DIRECTORS - for the year ended 31 March 2018
130

FINANCIAL SERVICES REGULATORY AUTHORITY (FSRA) Annual Report 2018
Our opinionIn our opinion, the financial statements of The Financial Services Regulatory Authority for the year ended 31 March 2018 are prepared, in all material respects, in accordance with the basis of accounting described in note 1 to the financial statements.
What we have auditedThe Financial Services Regulatory Authority’s financial statements set out on pages 134 to 151 comprise:
• thestatementoffinancialpositionasat31March2018;• thestatementofcomprehensiveincomefortheyearthenended;• thestatementofchangesinequityfortheyearthenended;• thestatementofcashflowsfortheyearthenended;and• thenotestothefinancialstatements,whichincludeasummaryofsignificantaccountingpolicies.
Basis for opinionWe conducted our audit in accordance with International Standards on Auditing (ISAs). Our responsibilities under those standards are further described in the Auditor’s responsibilities for the audit of the financial statements section of our report.
We believe that the audit evidence we have obtained is sufficient and appropriate to provide a basis for our opinion.
Independence
We are independent of the Authority in accordance with the requirements of the Swaziland Institute of Accountants (SIA) Code of Ethics for Professional Accountants and other independence requirements applicable to performing audits of financial statements in Swaziland. We have fulfilled our ethical responsibilities in accordance with the SIA Code and in accordance with other ethical requirements applicable to performing audits in Swaziland..
Emphasis of Matter – Basis of Accounting and restriction on distribution and useWe draw attention to note 1 to the financial statements, which describes the basis of accounting. The financial statements are prepared in accordance with the Authority’s own accounting policies to satisfy the financial information needs of the Authority’s members. As a result, the financial statements may not be suitable for another purpose. Our opinion is not modified in respect of this matter. Other informationThe Directors are responsible for the other information. Other information comprises the Statement of responsibility by the Directors, the Directors’ report and the detailed statement of comprehensive income. Other information does not include the financial statements and our auditor’s report thereon.Our opinion on the financial statements does not cover the other information and we do not and will not express an audit opinion or any form of assurance conclusion thereon.
In connection with our audit of the financial statements, our responsibility is to read the other information identified above and, in doing so, consider whether the other information is materially inconsistent with the financial statements or our knowledge obtained in the audit, or otherwise appears to be materially misstated. If, based on the work we have performed, we conclude that there is a material misstatement of this other information, we are required to report that fact. We have nothing to report in this regard.
Responsibilities of the Directors for the financial statementsThe directors are responsible for the preparation and fair presentation of these financial statements in accordance with the basis of accounting described in note 1 to the financial statements. This responsibility includes: designing, implementing and maintaining internal control relevant to the preparation and fair presentation of financial statementsthatarefreefrommaterialmisstatement,whetherduetofraudorerror;selectingandapplyingappropriateaccountingpolicies;andmakingaccountingestimatesthatarereasonableinthecircumstances.
INDEPENDENT AUDITOR’S REPORT To the Board of Directors of the Financial Services Regulatory Authority
131

FINANCIAL SERVICES REGULATORY AUTHORITY (FSRA) Annual Report 2018
In preparing the financial statements, the directors are responsible for assessing the Authority’s ability to continue as a going concern, disclosing, as applicable, matters related to going concern and using the going concern basis of accounting unless the directors either intend to liquidate the Authority or cease operations, or have no realistic alternative but to do so.
Auditor’s responsibilities for the audit of the financial statementsOur objectives are to obtain reasonable assurance about whether the financial statements as a whole are free from material misstatement, whether due to fraud or error, and to issue an auditor’s report that includes our opinion. Reasonable assurance is a high level of assurance, but is not a guarantee that an audit conducted in accordance with ISAs will always detect a material misstatement when it exists. Misstatements can arise from fraud or error and are considered material if, individually or in the aggregate, they could reasonably be expected toinfluencetheeconomicdecisionsofuserstakenonthebasisofthesefinancialstatements.
As part of an audit in accordance with ISAs, we exercise professional judgement and maintain professional scepticism throughout the audit. We also:
• Identifyandassess the risksofmaterialmisstatementof thefinancial statements,whetherdue tofraud or error, design and perform audit procedures responsive to those risks, and obtain audit evidence that is sufficient and appropriate to provide a basis for our opinion. The risk of not detecting a material misstatement resulting from fraud is higher than for one resulting from error, as fraud may involve collusion, forgery, intentional omissions, misrepresentations, or the override of internal control.
• Obtainanunderstandingofinternalcontrolrelevanttotheauditinordertodesignauditproceduresthat are appropriate in the circumstances, but not for the purpose of expressing an opinion on the effectiveness of the Authority’s internal control.
• Evaluate the appropriateness of accounting policies used and the reasonableness of accountingestimates and related disclosures made by the directors.
• Concludeontheappropriatenessofthedirector’suseofthegoingconcernbasisofaccountingand,based on the audit evidence obtained, whether a material uncertainty exists related to events or conditions that may cast significant doubt on the Authority’s ability to continue as a going concern. If we conclude that a material uncertainty exists, we are required to draw attention in our auditor’s report to the related disclosures in the financial statements or, if such disclosures are inadequate, to modify our opinion. Our conclusions are based on the audit evidence obtained up to the date of our auditor’s report. However, future events or conditions may cause the Authority to cease to continue as a going concern.
We communicate with the directors regarding, among other matters, the planned scope and timing of the audit and significant audit findings, including any significant deficiencies in internal control that we identify during our audit.
PricewaterhouseCoopers Partner: Theo MasonRegistered Auditor P.O. Box 569 MbabaneDate
INDEPENDENT AUDITOR’S REPORT To the Board of Directors of the Financial Services Regulatory Authority
132

FINANCIAL SERVICES REGULATORY AUTHORITY (FSRA) Annual Report 2018
The directors of the Authority have pleasure in presenting their report on the activities of the Financial Services Regulatory Authority (FSRA) for the year ended 31 March 2018.
1. General review
The FSRA was established by the Government of Swaziland in terms of the FSRA Act 2010. The FSRA was established to foster, through the regulation and prudential supervision of financial services providers:
• ThestabilityoftheSwazilandfinancialservices;• Thesafetyandsoundnessoffinancialservicesproviders;• Thehigheststandardsofconductofbusinessbyfinancialservicesproviders;• Thepromotionoffaircompetitionbetweendifferentfinancialservicesprovidersforthebenefitof
stakeholders;• Thefairness,efficiencyandorderlinessoftheSwazilandnon-bankfinancialsector;and• Theprotectionofstakeholders.
2. Financial year end
The financial year end of the FSRA is defined in the Act as 31 March of every year, to coincide with the financial year of Government.
3. The Board
The directors of the Authority during the year were:
Mr.SLSimelane - (Chairman)Mr.SSDlamini - (Chief Executive Officer/Secretary)Mr.NWFakudze - MemberMr.NEMaseko - MemberMr.ACMkhatshwa - MemberMr.NDlamini - MemberMr.MBSamketi - MemberMr.SJMabuza - Member
4. Auditors
• TheauditoroftheAuthorityisPricewaterhouseCoopersSwaziland.
• Theaddressesoftheauditorare:
Business address Postal address
PricewaterhouseCoopers Swaziland P O Box 569 RHUS Office Park MbabaneKarl Grant Street SwazilandMbabane H100 Swaziland
DIRECTORS’ REPORTfor the year ended 31 March 2018
133

FINANCIAL SERVICES REGULATORY AUTHORITY (FSRA) Annual Report 2018
Notes 2018 2017
Revenue 2 50 700 040 47 669 259Other income 2 3 009 864 1 294 377
53 709 904 48 963 636
Employee benefit expense (26 970 587) (25 081 460)Depreciation expense (1 450 822) (1 588 026)
Other Expenses (20 533 201) (20 440 100)
Surplus before related organisation expenses 4 755 294 1 854 050 Swaziland Stock Exchange expenses (4 523 970) (2 139 940)Ombudsman of Financial Services expenses (4 485 134) (3 648 264)Appeals Tribunal expenses (111 220) (45 900)
Deficit for the year 3 (4 365 030) (3 980 054)
STATEMENT OF COMPREHENSIVE INCOMEfor the year ended 31 March 2018
134

FINANCIAL SERVICES REGULATORY AUTHORITY (FSRA) Annual Report 2018
Notes 2018 2017
ASSETS
Non-Current Assets Property, plant and equipment 4 2 298 338 2 826 642Intangible assets 5 610 351 1 220 701Investments 6 24 791 204 13 170 280
27 699 893 17 217 623 Current Assets Trade and other receivables 7 12 883 108 14 182 657Cash and cash equivalents 8 16 409 217 25 092 489Total current assets 29 292 325 39 275 146
Total Assets 56 992 218 56 492 769 EQUITY AND FUND BALANCES
Capital and reserves Retained earnings 46 760 755 51 125 785
LIABILITIES
Current Liabilities Trade and other payables 9 5 929 987 1 518 550Provision 10 1 371 540 1 096 210Trust/Guarantee fund 11 2 929 936 2 752 224
Total liabilities 10 231 463 5 366 984
Total equity and liabilities 56 992 218 56 492 769
STATEMENT OF FINANCIAL POSITIONas at 31 March 2018
135
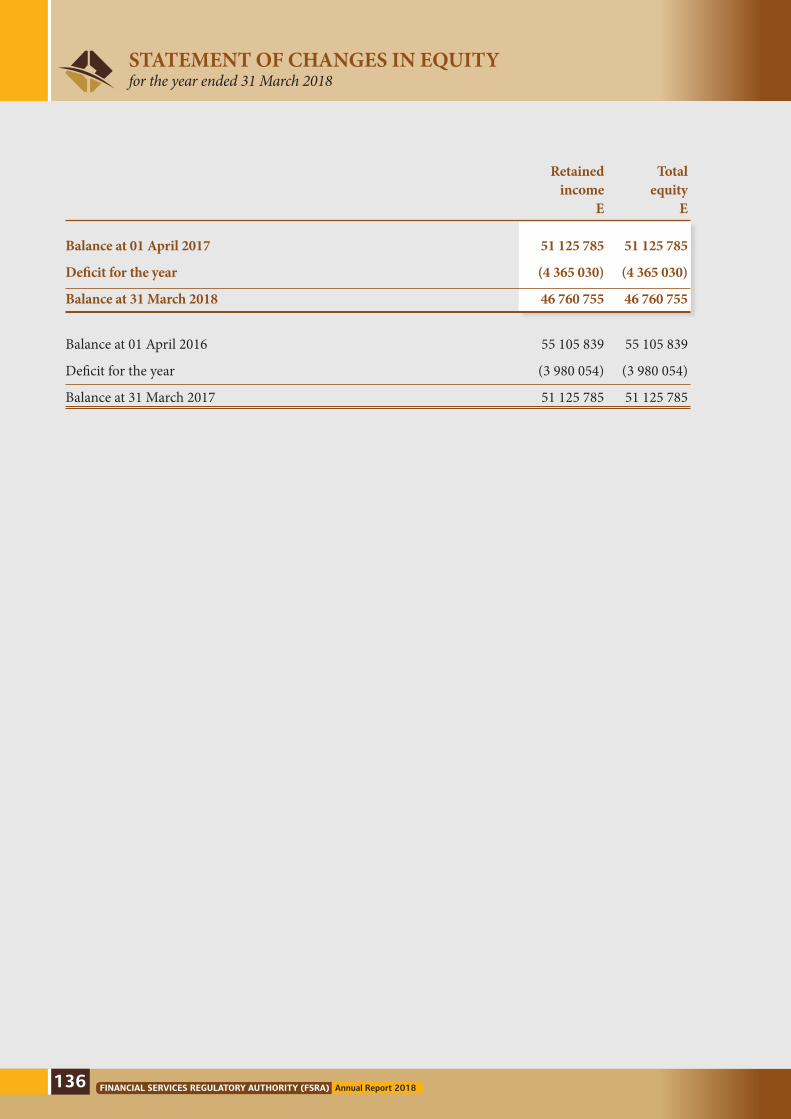
FINANCIAL SERVICES REGULATORY AUTHORITY (FSRA) Annual Report 2018
Retained Total income equity E E
Balance at 01 April 2017 51 125 785 51 125 785
Deficit for the year (4 365 030) (4 365 030)
Balance at 31 March 2018 46 760 755 46 760 755 Balance at 01 April 2016 55 105 839 55 105 839
Deficit for the year (3 980 054) (3 980 054)
Balance at 31 March 2017 51 125 785 51 125 785
STATEMENT OF CHANGES IN EQUITYfor the year ended 31 March 2018
136

FINANCIAL SERVICES REGULATORY AUTHORITY (FSRA) Annual Report 2018
Note 2018 2017
Cash flows from operating activities Cash generated from operations 13 245 654 799 137Interest received 2 2 826 455 1 143 085
3 072 109 1 942 222 Cash flows from investing activities Purchase of property, plant and equipment 4 (312 168) (243 262)Movement in Investments (11 620 924) (812 792)
Net cash from investing activities (11 933 092) (1 056 054) Cash flows from financing activities Net movement on guarantee fund 177 711 392 176
Net cash from financing activities 177 711 392 176 (Decrease)/increase in cash and cash equivalents (8 683 272) 1 278 344 Cash at the beginning of the year 25 092 489 23 814 145
Total cash at end of the year 8 16 409 217 25 092 489
STATEMENT OF CASH FLOWfor the year ended 31 March 2018
137

FINANCIAL SERVICES REGULATORY AUTHORITY (FSRA) Annual Report 2018
1. Presentation of Annual financial Statements
Background Information
The Financial Services Regulatory Authority (FSRA) is a body corporate established by the Financial Services Regulatory Authority Act, 2010.
FSRAisaregulatoryandsupervisorybodyestablishedtoregulateandsupervisetheprovidersofnon-bankfinancialservices in the Kingdom of Swaziland with the aim of bringing stability, safety and soundness of the Swaziland financial system and its providers as well as protecting the average Swazi from exploitation by the industry players.
The FSRA office is a parent of the former office of the Registrar of Insurance and Retirement Funds (RIRF) and currently holds the following divisions: Insurance and Retirement Funds (IRF) Division: Capital Markets Development (CMD)Division; andCredit Savings Institutions (CSI)Division;Legal,Policy and InterventionDivision;andFinanceandCorporateServicesDivision.
The financial statements incorporate the following:TheleviesAccountoftheAuthorityasperSections21and22oftheFSRAAct2010;The Registrar’s Guarantee Account as per Sections 41 and 42 of the Insurance Act 7/2005. The Insurance and Retirement Trust Fund as per Sections 43 and 44 of the Insurance Act 7/2005.
The following are the principal accounting policies adopted in the preparation of these financial statements as set out below. These policies have been consistently applied in all material respects with those of the previous year, unless otherwise stated.
1.1 Basis of preparation
The financial statements of the Financial Services Regulatory Authority (FSRA) have been prepared in accordance with accounting policies of the Financial Services Regulatory Authority and the requirements of the Financial Services Regulatory Authority Act, 2010.
The preparation of financial statements in requires the use of certain critical accounting estimates. It also requires management to exercise its judgement in the process of applying the Authority’s accounting policies.
1.2 Functional and presentation currency
Items included in the financial statements of the Financial Regulatory Authority (FSRA) are measured using the currency of the primary economic environment in which the Authority operates (‘the functional currency’). The financial statements are presented in the lilangeni currency (SZL), which is FSRA’s functional and presentation currency.
1.3 Transactions and balances
Foreign currency transactions are translated into the functional currency using the exchange rates prevailing at the dates of transactions or valuation where items are remeasured. Foreign exchange gains and losses resulting fromthesettlementofsuchtransactionsandfromthetranslationatyear-endexchangeratesofmonetaryassetsand liabilities denominated in foreign currencies are recognised in the income statement. Foreign exchange gains and losses that relate to borrowings and cash and cash equivalents are presented in the income statement within “finance income or cost”. All other foreign exchange gains and losses are presented in the income statement within “other(losses)/gains-net.
NOTES TO THE FINANCIAL STATEMENTS for the year ended 31 March 2018
138

FINANCIAL SERVICES REGULATORY AUTHORITY (FSRA) Annual Report 2018
1.4 Significant judgements and sources of estimation uncertainty
In preparing the financial statements, management is required to make estimates and assumptions that affect the amounts represented in the financial statements and related disclosures. Use of available information and the application of judgement in inherent in the formation of estimates. Actual results in the future could differ from these estimates which may be material to the financial statements. There were no significant judgements and estimates made in preparing this annual financial statements.
1.5 Property, plant and equipment
Property, plant and equipment is shown at cost less accumulated depreciation and any accumulated impairment losses. Historical cost include expenditure that is directly attributable to bringing the asset to the location and condition necessary for it to be capable of operating in the manner intended by management.
The Authority adds to the carrying amount of an item of property, plant and equipment the cost of replacing parts of such an item when that cost is incurred if the replacement part is expected to provide incremental future benefits to the Authority. The carrying amount of the replaced parts is derecognized. All other repairs and maintenance are charged to profit or loss during the period in which they are incurred.
The estimated useful lives range as follows:
Furniture and fixtures 10%Motor vehicles 20%Office equipment 10%IT equipment and software 33.3%
The assets residual values, useful lives and depreciation methods are reviewed, and adjusted prospectively if appropriate, if there is an indication of a significant change since the last reporting date.
An assets carrying amount is written down immediately to its recoverable amount if the assets carrying amount is greater than its estimated recoverable amount.
Gains and losses on disposals are determined by comparing the proceeds with the carrying amount and are recognised within ‘other gains/ (losses) – net’ in the statement of comprehensive income.
1.6 Intangible assets
Intangible assets are recognized if and only if it is probable that future economic benefits associated with the item willflowtotheorganizationandthecostoftheitemcanbemeasuredreliably.
Intangible assets are subsequently carried at cost, less any accumulated amortization and impairment losses. Amortisation is calculated using the straight line basis at rates calculated to reduce the book value of these assets to estimated residual values over their expected useful lives.
TheAuthorityamortisesintangibleassetswithalimitedusefullifeusingthestraight-linemethodover the following rates:
IT development and software 33.3%
NOTES TO THE FINANCIAL STATEMENTS - continuedfor the year ended 31 March 2018
139

FINANCIAL SERVICES REGULATORY AUTHORITY (FSRA) Annual Report 2018
1.7 Leased assets
Leases of property, plant and equipment where the Authority, as lessee, has substantially all the risks and rewards of ownership are classified as finance leases. Finance leases are capitalised at the lease’s inception at the fair value of the leased property or, if lower, the present value of the minimum lease payments. The corresponding rental obligations,netoffinancecharges,areincludedinothershort-termandlong-termpayables.Eachleasepaymentis allocated between the liability and finance cost. The finance cost is charged to the profit or loss over the lease period so as to produce a constant periodic rate of interest on the remaining balance of the liability for each period. The property, plant and equipment acquired under finance leases is depreciated over the asset’s useful life or over the shorter of the asset’s useful life and the lease term if there is no reasonable certainty that the group will obtain ownership at the end of the lease term.
Leases in which a significant portion of the risks and rewards of ownership are not transferred to the Authority as lessee are classified as operating leases. Payments made under operating leases (net of any incentives received from thelessor)arechargedtoprofitorlossonastraight-linebasisovertheperiodofthelease.
LeaseincomefromoperatingleaseswheretheAuthorityisalessorisrecognisedinincomeonastraight-linebasisover the lease term. The respective leased assets are included in the balance sheet based on their nature.
1.8 Provision
Provisions are recognised when the Authority has a present legal or constructive obligation as a result of past events,itisprobablethatanoutflowofresourceswillberequiredtosettletheobligationandtheamountcanbereliably estimated. Provisions are not recognised for future operating losses.Wherethereareanumberofsimilarobligations,thelikelihoodthatanoutflowwillberequiredinsettlementisdetermined by considering the class of obligations as a whole. A provision is recognised even if the likelihood of an outflowwithrespecttoanyoneitemincludedinthesameclassofobligationsmaybesmall.
Provisions are measured at the present value of management’s best estimate of the expenditure required to settle the present obligation at the end of the reporting period. The discount rate used to determine the present value isapre-taxratethatreflectscurrentmarketassessmentsofthetimevalueofmoneyandtherisksspecifictotheliability. The increase in the provision due to the passage of time is recognised as interest expense.
1.9 Employee benefits
The Authority contributes to a statutory fund, the Swaziland National Provident Fund and to a defined contribution plan on behalf of its employees.
Fordefinedcontributionplans,FSRApayscontributionstotheself-administeredretirementfundonamandatory,contractual, or voluntary basis. Once the contributions have been paid, FSRA has no further payment obligations. The regular contributions constitute net periodic costs for the year in which they are due, and as such are included in staff costs.
Payments to defined contribution retirement benefit plans are charged as an expense as they fall due.
NOTES TO THE FINANCIAL STATEMENTS - continuedfor the year ended 31 March 2018
140
FINANCIAL SERVICES REGULATORY AUTHORITY (FSRA) Annual Report 2018
1.10 Financial assets
Initial recognition and measurementThe Authority initially recognises financial assets when it becomes a party to the contractual provisions of the instrument.
Financial assets are initially measured at fair value plus in the case of assets not measured at fair value through profit or loss, directly attributable transaction costs. Subsequently financial assets are classified as measured at amortised cost or fair value, depending on the Authority’s business model for managing the financial asset and the contractualcashflowcharacteristicsofthefinancialasset.
A financial asset qualifies for amortised cost, using the effective interest method net of any impairment loss if it meets both of the following conditions:– the asset is held within a business model whose objective is to hold assets in order to collect contractual cash
flows;and– thecontractualtermsofthefinancialassetgiverise,onspecifieddates,tocashflowsthataresolelypayments
of principal and interest on the principal amount outstanding.
If a financial asset does not meet both of these conditions, it is measured at fair value.
Theassessmentofbusinessmodelismadeatportfoliolevelasthisreflectsbestthewaythebusinessismanagedand information is provided to management.
Purchases or sales of financial assets that require delivery of assets within a time frame established by regulation or convention in the marketplace are recognised on the trade date, i.e. the date that the Authority commits to purchase or sell the asset.
The Authority’s financial assets are classified as trade and other receivables, cash and bank balances and investments.
Trade and other receivables
Trade receivables are measured at initial recognition at fair value, and are subsequently measured at amortised cost using the effective interest method. Appropriate allowances for estimated irrecoverable amounts are recognised in profit or loss when there is objective evidence that the asset is impaired. Significant financial difficulties of the debtor, probability that the debtor will enter bankruptcy of financial reorganization, and default or delinquency in payments are considered indicators that the trade receivable is impaired. The allowance recognised is measured as thedifferencebetweentheasset’scarryingamountandthepresentvalueofestimatedfuturecashflowsdiscountedat the effective interest rate computed at initial recognition.
The carrying amount of the asset is reduced through the use of allowance account, and the amount of the loss is recognised in profit or loss within operating expenses. When a trade receivable is uncollectable, it is written off against the allowance account for trade receivables. Subsequent recoveries of amounts previously written off are credited against operating expenses in profit or loss.
NOTES TO THE FINANCIAL STATEMENTS - continuedfor the year ended 31 March 2018
141

FINANCIAL SERVICES REGULATORY AUTHORITY (FSRA) Annual Report 2018
1.10 Financial assets (continued)
Cash and bank balancesFor the purpose of presentation in the statement of cash flows, cash and cash equivalents includes cash onhand,depositsheldatcallwithfinancialinstitutions,othershort-term,highlyliquidinvestmentswithoriginalmaturities of three months or less that are readily convertible to known amounts of cash and which are subject to an insignificant risk of changes in value, and bank overdrafts. Bank overdrafts are shown within borrowings in current liabilities in the balance sheet.
Impairment of financial assets
The Authority assesses, at each reporting date, whether there is objective evidence that a financial asset or a group of financial assets is impaired. An impairment exists if one or more events that has occurred since the initial recognitionoftheasset(anincurred“lossevent”),hasanimpactontheestimatedfuturecashflowsofthefinancialasset or the group of financial assets that can be reliably estimated.
Financial assets not carried at fair value through profit or loss are assessed at each reporting date to determine whether there is objective evidence of impairment.
Objective evidence that financial assets are impaired includes:
– defaultordelinquencybyadebtorininterestorprincipalpayments;– restructuringofanamountduetotheAuthorityontermsthattheAuthoritywouldnotconsiderotherwise;– indicationsthatadebtororissuerwillenterbankruptcyorotherfinancialreorganisation;– adversechangesinthepaymentstatusofborrowersorissuers;– thedisappearanceofanactivemarketforasecurity;or– observabledataindicatingthatthereismeasurabledecreaseinexpectedcashflowsfromagroupoffinancial
assets such as changes in arrears or economic conditions that correlate with defaults.
DerecognitionA financial asset is derecognised when:– therightstoreceivecashflowsfromtheassethaveexpired;or– theAuthorityhastransferreditsrightstoreceivecashflowsfromtheassetorhasassumedanobligationtopay
thereceivedcashflowsinfullwithoutmaterialdelaytoathirdpartyundera“pass-through”arrangement;and either (a) the Authority has transferred substantially all the risks and rewards of the asset, or (b) the Authority has neither transferred nor retained substantially all the risks and rewards of the asset, but has transferred control of the asset.
WhentheAuthorityhas transferred its rights toreceivecashflows fromanasset,andhasneither transferrednor retained substantially all the risks and rewards of the asset nor transferred control of the asset, the asset is recognised to the extent of the Authority’s continuing involvement in the asset. In that case, the Authority also recognises an associated liability.
Thetransferredassetandtheassociatedliabilityaremeasuredonabasisthatreflectstherightsandobligationsthatthe Authority has retained. Continuing involvement that takes the form of a guarantee over the transferred asset is measured at the lower of the original carrying amount of the asset and the maximum amount of consideration that the Authority could be required to repay.
NOTES TO THE FINANCIAL STATEMENTS - continuedfor the year ended 31 March 2018
142

FINANCIAL SERVICES REGULATORY AUTHORITY (FSRA) Annual Report 2018
1.11 Financial liabilities
Initial recognition and measurement
The Authority initially recognises financial liabilities when the Authority becomes a party to the contractual provisions of the instrument.
Financial liabilities are classified as measured at amortised cost or fair value, as appropriate. The Authority determines the classification of its financial liabilities at initial recognition. All financial liabilities are recognised initially at fair value and in the case of loans and borrowings and other liabilities, less directly attributable transaction costs. The Authority’s financial liabilities include trade and other payables and amounts due to related companies.
The Authority has not designated any financial liabilities upon initial recognition as at fair value through profit or loss,exceptthosefinancialliabilitiesthatcontainembeddedderivativesthatsignificantlymodifycashflowsthatwould otherwise be required under the contract.
Trade and other payables
These amounts represent liabilities for goods and services provided to the Authority prior to the end of financial year which are unpaid. The amounts are unsecured and are usually paid within 30 days of recognition. Trade and other payables are presented as current liabilities unless payment is not due within 12 months after the reporting period. They are recognised initially at their fair value and subsequently measured at amortised cost using the effective interest method.
Offsetting of financial instruments
Financial assets and financial liabilities are offset and the net amount reported in the statement of financial position if, and only if, there is a currently enforceable legal right to offset the recognised amounts and there is an intention to settle on a net basis, or to realise the assets and settle the liabilities simultaneously.
Derecognition
A financial liability is derecognised when the obligation under the liability is discharged or cancelled or expires. When an existing financial liability is replaced by another from the same lender on substantially different terms, or the terms of an existing liability are substantially modified, such an exchange or modification is treated as a derecognition of the original liability and the recognition of a new liability, and the difference in the respective carrying amounts is recognised in earnings. 1.12 Impairment of assets
The Authority assesses at each end of the reporting whether there is any indication that an asset may be impaired. If any such indication exists, the Authority estimates the recoverable amount of the asset.
If there is any indication that an asset may be impaired, the recoverable amount is estimated for the individual asset. If it is not possible to estimate the recoverable amount of the individual asset, the recoverable amount of the cash-generatingunittowhichtheassetbelongsisdetermined.
The recoverable amount of an asset or a cash generating unit is the higher of its fair value less costs to sell and its value in use.
If the recoverable amount of an asset is less than its carrying amount, the carrying amount of the asset is reduced to its recoverable amount. That reduction is an impairment loss.
NOTES TO THE FINANCIAL STATEMENTS - continuedfor the year ended 31 March 2018
143

FINANCIAL SERVICES REGULATORY AUTHORITY (FSRA) Annual Report 2018
1.12 Impairment of assets (continued)
An impairment loss of assets carried a cost less any accumulated depreciation or amortisation is recognised immediately in profit or loss. Any impairment loss of a revalued asset is treated as a revaluation decrease.
An entity assesses at each reporting date whether there is any indication that an impairment loss recognised in prior periods for assets other than goodwill may no longer or may have decreased. If any such indication exists, the recoverable amounts of those assets are estimated.
The increased carrying amount of an asset other than goodwill attributable to a reversal of an impairment loss does not exceed the carrying amount that would have been determined had impairment loss been recognised for the asset in prior periods.
1.13 Revenue recognition
RevenueisrecognisedwhenitisprobablethattheeconomicbenefitsassociatedwiththetransactionwillflowtoFSRA and the amounts of revenue can be reliably measured.
Levies
All registered entities are required to pay annual levies to maintain their licences in terms of the FSRA Act, 2010. Levies are raised in terms of the regulations published in the Government Gazette and are recognised on an accrual basis.
The regulated entities are invoiced based on the following:
- Shortterminsurer–1.25%ofgrosswrittenpremiumlesscommission- LongtermInsurer–0.07%oftheinsurer’stotalassets- RetirementFunds–0.07%oftotalassets- Brokers–1.25%oftotalcommissionreceivedduringthefinancialyear- Agents–1.25%oftotalcommissionreceivedduringthefinancialyear- FundAdministration–1.25%offeeincomereceivedduringthefinancialyear- InvestmentManager–1.25%oftheincome- SACCOS–0.1%ofmemberssavings- Credit Providers – 0.6% of loans and advances for money lenders and outstanding credit for retails
institutions- DevelopmentFinanceInstitution–0.3%ofloansandadvances
Registration and renewal fees
Revenue arising from registration and renewal fees are raised in terms of the regulations published in the Government Gazette and are recognised on a cash basis.
Fines and penalties
Fines and penalties raised for late submission of returns and any other regulatory sanctions are recognised on a cash basis. The income from lines and penalties is credited to the statement of financial performance and is considered to form part of the normal operating activities of the FSRA, and are classified under sundry income.
1.14 Tax
FSRA is exempt from income taxes as it falls within the ambit of the definition of an ‘Exempt organisation’ as stipulated in Section 2 of the Income Tax Order 1975 as amended.
NOTES TO THE FINANCIAL STATEMENTS - continuedfor the year ended 31 March 2018
144
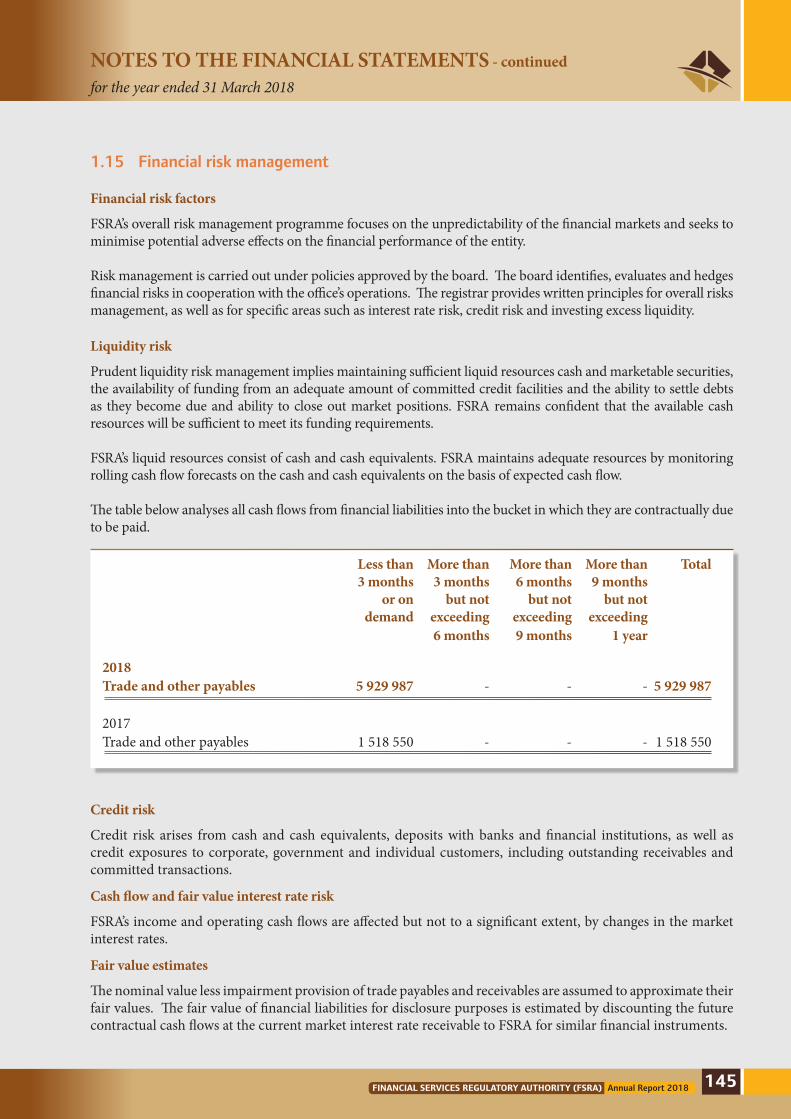
FINANCIAL SERVICES REGULATORY AUTHORITY (FSRA) Annual Report 2018
1.15 Financial risk management
Financial risk factors
FSRA’s overall risk management programme focuses on the unpredictability of the financial markets and seeks to minimise potential adverse effects on the financial performance of the entity.
Risk management is carried out under policies approved by the board. The board identifies, evaluates and hedges financial risks in cooperation with the office’s operations. The registrar provides written principles for overall risks management, as well as for specific areas such as interest rate risk, credit risk and investing excess liquidity.
Liquidity risk
Prudent liquidity risk management implies maintaining sufficient liquid resources cash and marketable securities, the availability of funding from an adequate amount of committed credit facilities and the ability to settle debts as they become due and ability to close out market positions. FSRA remains confident that the available cash resources will be sufficient to meet its funding requirements.
FSRA’s liquid resources consist of cash and cash equivalents. FSRA maintains adequate resources by monitoring rollingcashflowforecastsonthecashandcashequivalentsonthebasisofexpectedcashflow.
Thetablebelowanalysesallcashflowsfromfinancialliabilitiesintothebucketinwhichtheyarecontractuallydueto be paid.
Less than More than More than More than Total 3 months 3 months 6 months 9 months or on but not but not but not demand exceeding exceeding exceeding 6 months 9 months 1 year
2018 Trade and other payables 5 929 987 - - - 5 929 987
2017 Tradeandotherpayables 1518550 - - - 1518550
Credit risk
Credit risk arises from cash and cash equivalents, deposits with banks and financial institutions, as well as credit exposures to corporate, government and individual customers, including outstanding receivables and committed transactions.
Cash flow and fair value interest rate risk
FSRA’sincomeandoperatingcashflowsareaffectedbutnottoasignificantextent,bychangesinthemarketinterest rates.
Fair value estimates
The nominal value less impairment provision of trade payables and receivables are assumed to approximate their fair values. The fair value of financial liabilities for disclosure purposes is estimated by discounting the future contractualcashflowsatthecurrentmarketinterestratereceivabletoFSRAforsimilarfinancialinstruments.
NOTES TO THE FINANCIAL STATEMENTS - continuedfor the year ended 31 March 2018
145

FINANCIAL SERVICES REGULATORY AUTHORITY (FSRA) Annual Report 2018
1.16 Financial instrument by category
The accounting policies for financial instruments have been applied to the line items below:
Description per the statement of financial Amortised Carrying value position cost
2018 2017 E E
Financialassets Tradeandotherreceivables - 12 883 108 14 182 657 Cashandcashequivalent - 6 409 217 25 092 489 Financial assets at at fair value throughprofitandloss - 24 791 204 13 170 280 - 4 083 529 52 445 426
Tradeandotherpayables - 5 929 987 1 518 550
Credit quality of financial assets
The table below analyses all undiscounted cashflows fromfinancial assets into timebucketwhen they arecontractually due to be received:
Less than More than More than More than Total 3 months or 3 months but 6 months but 9 months but on demand not exceeding not exceeding not exceeding 6 months 9 months 1 year
2018 Trade and other receivables 7 353 525 5 267 647 261 936 - 12 883 108
2017 Tradeandotherreceivables 8832197 5035641 314819 - 14182657
NOTES TO THE FINANCIAL STATEMENTS - continuedfor the year ended 31 March 2018
146

FINANCIAL SERVICES REGULATORY AUTHORITY (FSRA) Annual Report 2018
2018 2017
2. Revenue
The Authority derives the following types of revenue: Levies 48 860 195 46 071 918 Registration and renewal fees 1 839 845 1 597 341
50 700 040 47 669 259 Other income comprise of the following: Government subvention - - Other - 300 Penalties and fees 183 409 150 992 Interest income 2 826 455 1 143 085
3 009 864 1 294 377 3 Operating (deficit)/surplus
The following items have been charged in arriving at the operating (deficit)/surplus:
Auditors’ remuneration -Auditfees 155 430 138 568 Operating lease charges Premises -Contractualamounts 2 927 732 2 879 696 Depreciation on property, plant and equipment (Note 4) 840 472 977 675 Amortisation of intangible asset (Note 5) 610 350 610 350 Employee costs (Note 12) 26 970 587 25 081 460
NOTES TO THE FINANCIAL STATEMENTS - continuedfor the year ended 31 March 2018
147

FINANCIAL SERVICES REGULATORY AUTHORITY (FSRA) Annual Report 2018
4 Property, plant and equipment
2018 2017 Cost / Accumulated Carrying Cost / Accumulated Carrying Valuation depreciation value Valuation depreciation value
Furniture and fixtures 4 657 473 (3 176 217) 1 481 256 4 527 656 (2 813 779) 1 713 877
Motor vehicles 173 417 (173 417) - 173 417 (147 404) 26 013
Office equipment 1 077 257 672 265) 404 992 1 034 140 (594 159) 439 981
IT equipment 2 354 430 (1 942 340) 412 090 2 215 193 (1 568 423) 646 770
8 262 577 (5 964 239) 2 298 338 7 950 406 (5 123 765) 2 826 642
Reconciliation of property, plant and equipment
2018
Opening
Balance Additions Depreciation Total
Furniture and fixtures 1 713 878 129 816 (362 438) 1 481 256
Motor Vehicles 26 013 - (26 013) -
Office equipment 439 981 43 115 (78 104) 404 992
IT equipment 646 770 139 237 (373 917) 412 090
2 826 642 312 168 (840 472) 2 298 338
2017
Opening
Balance Additions Depreciation Total
Furniture and fixtures 2 067 527 97 745 (451 394) 1 713 878
MotorVehicles 60696 - (34683) 26013
Office equipment 507 684 34 566 (102 269) 439 981
IT equipment 925 148 110 951 (389 329) 646 770
3 561 055 243 262 (977 675) 2 826 642
At 31 March 2018, included in property, plant and equipment are fully depreciated assets with an initial cost of
E876 906 (2017: E391 192).
NOTES TO THE FINANCIAL STATEMENTS - continuedfor the year ended 31 March 2018
148

FINANCIAL SERVICES REGULATORY AUTHORITY (FSRA) Annual Report 2018
Software Total E E
5 Intangible Assets Year ended 31 March 2018 Opening net book amount 1 220 701 1 220 701 Additions - - Amortisation charge (610 350) (610 350)
Closing net book amount 610 351 610 351 At 31 March 2018 Cost 1 831 051 1 831 051 Accumulated amortisation (1 220 700) (1 220 700)
Net book amount 610 351 610 351
Year ended 31 March 2017
Opening net book amount 1 831 051 1 831 051
Additions - -
Amortisation charge (610 350) (610 350)
Closing net book amount 1 220 701 1 220 701
At 31 March 2017
Cost 1 831 051 1 831 051
Accumulated amortisation (610 350) (610 350)
Net book amount 1 220 701 1 220 701
TheintangibleassetrelatestotheFinancialServicesRegulatoryAuthority’sSupervisionApplicationsoft-ware which was purchased during the prior year by the Authority from the Central Bank of Mozambique.
2018 2017 E E 6 Financial assets This represents the following investments: Swaziland Building Society – Permanent shares 2 268 782 2 000 000 Stanlib Swaziland (Pty) Ltd – Money Market instruments 22 522 422 11 170 280
24 791 204 13 170 280
NOTES TO THE FINANCIAL STATEMENTS - continuedfor the year ended 31 March 2018
149

FINANCIAL SERVICES REGULATORY AUTHORITY (FSRA) Annual Report 2018
7 Trade and other receivables
Trade debtors 11 151 468 12 605 138 Staff loans 505 038 1 138 274 Prepayments and other receivables 1 226 602 439 245
12 883 108 14 182 657
The carrying amount of trade and other receivables is equal to their fair values.
8 Cash and cash equivalents
Cash and cash equivalents consist of:
Cash on hand 2 000 2 000 Bank balances 12 816 690 21 844 892 Swaziland Building Society – Special Savings 660 591 493 373 SwazilandBuildingsociety-GoldAccount 2 929 936 2 752 224
16 409 217 25 092 489
Bank balances consists of the following:
Standard Bank Swaziland Limited 1 308 558 11 780 520 First National Bank of Swaziland Limited 11 508 132 10 064 372
12 816 690 21 844 892
9 Trade and other payables
Trade payables 4 964 062 631 720 Accrued audit fees 157 597 43 230 Unallocated deposits 808 328 743 600
5 929 987 1 518 550
10 Provision
Opening balance Additions Total
Reconciliation of provision - 2018
Provision for gratuity 1 096 210 275 330 1 371 540
Reconciliationofprovision-2017
Provision for gratuity 924 480 171 730 1 096 210
2018 2017
NOTES TO THE FINANCIAL STATEMENTS - continuedfor the year ended 31 March 2018
150

FINANCIAL SERVICES REGULATORY AUTHORITY (FSRA) Annual Report 2018
11 Trust/ Guarantee Fund
Trust/ Guarantee Fund 929 936 2 752 224
In terms of section 33(5) of the Retirement Funds Act, 2005, if the fund does not become aware of or cannot trace any dependant of the member within twelve months from the death of the member, and if the member has either not designated in writing to the fund a nominee, or if the member has designated a nominee to receive a portion of the benefit, the benefit or the remaining only portion of the benefit after payment to the designated nominee, shall be paid into the estate of the member, or, if no inventory in respect of the member has been received by the court, the fund shall pay the monies into the Insurance and retirement benefit trust account. The funds are kept in a Swaziland Building Society Gold Account and the balance at the end of the financial year was E2 929 936.
2018 2017 E E
12 Employee costs
Salaries 26 970 587 25 081 460
The average number of employees during the year was 54 (2017: 52).
13 Cash generated from operations
Deficit for the year (4 365 030) (3 980 054) Adjustments for:
Depreciation and amortisation 1 450 823 1 588 025 Interest received (2 826 455) (1 143 085)
Changes in working capital:
Trade and other receivables 1 299 549 4 912 427 Trade and other payables 4 411 437 (749 907) Provisions 275 330 171 730
245 654 1 942 219
14 Related parties
Related party transactions: SSX expenses 4 523 970 2 139 940
Ombudsman expenses 4 485 134 3 694 165
Related party balances: Amounts due from SSX 13 971 8 582
Amounts payable to SSX (2 044 091) - Amounts due from/(to) Ombudsman 90 775 (6 308)
NOTES TO THE FINANCIAL STATEMENTS - continuedfor the year ended 31 March 2018
151

FINANCIAL SERVICES REGULATORY AUTHORITY (FSRA) Annual Report 2018
Note(s) 2018 2017
Revenue Registration and renewal 1 839 845 1 597 341Interest received 2 826 455 1 143 085Levies fee 48 860 195 46 071 918Sundry income 183 409 151 292
53 709 904 48 963 636
Operating expenses
Advertising - (18 601)Auditors remuneration (155 430) (138 568)Bank charges (129 464) (181 163)Bad debt (1 326 475) (2 972 485)Cleaning (72 230) (94 539)Conference hosting expenses (305 092) (384 829)Computer expenses (1 107 741) (723 500)Consulting and professional fees (1 160 821) (232 928)Consumer education expenses (633 079) (825 659)Depreciation, amortisation and impairments (1 450 822) (1 588 025)Employee costs (26 970 587) (25 081 460)Staff uniform (127 771) (213 879)Legal expenses (721 544) (238 826)Board fees and expenses (665 899) (548 659)Insurance (507 150) (640 353)Internet expenses (560 257) (121 817)Financial Services Marathon (424 053) -Lease rentals on operating lease (2 927 732) (2 879 696)Printing and stationery (157 348) (873 200)Donations (130 735) (52 926)General office expenses (13 415) (13 196)Postage (21 264) (16 477)Repairs and maintenance (68 286) (111 910)Staff welfare (270 290) (180 183)Subscriptions (829 927) (517 838)Special Investigation (4 668) -Telephone and fax (741 961) (1 361 257)Conferences – Local and International (4 357 997) (3 504 652)Staff training – Local and International (2 670 892) (3 367 214)Local Travel (201 222) -Technical Assistance (27 070) -Utilities (213 388) (225 744)
Total expenses before related organisations expenses 48 954 610 47 109 584 Surplus before related organisations expenses 4 755 294 1 854 052
DETAILED INCOME STATEMENTfor the year ended 31 March 2018
152

FINANCIAL SERVICES REGULATORY AUTHORITY (FSRA) Annual Report 2018
2018 2017
Related organisations expenses
Swaziland Stock Exchange expenses (4 523 970) (2 139 940)Ombudsman of Financial services expenses (4 485 134) (3 648 265)Appeals Tribunal expenses (111 220) (45 900)
Total related organisations expenses (9 120 324) (5 834 105) Total expenses (58 074 934) (52 943 689) Deficit for the year (4 365 030) (3 980 053)
DETAILED INCOME STATEMENT - continuedfor the year ended 31 March 2018
153

FINANCIAL SERVICES REGULATORY AUTHORITY (FSRA) Annual Report 2018
2018 2017
Income FSRA Subvention 4 523 970 2 139 940Licensing/Registration/Sustaining fees 1 923 197 697 132Other Income - 325 153
6 447 167 3 162 225
Expenses Advertising and promotions (10 105) (2 995)Bank charges and interest paid (11 166) (12 382)Levies (30 000) -Computer expenses (11 121) (31 646)Consulting/professional fees/secretariat (138 566) (201 153)Consumer education expenses (57 206) (177 085)Hosted Conferences (4 900) (100 062)General office sundries, cleaning and teas (9 876) (2 310)Legal expenses (27 089) (4 534)Depreciation and amortisation (556 370) (133 425)Printing and stationery (21 295) (22 324)Rent and utilities (359 101) (136 196)Repairs and maintenance (13 212) (13 945)Employee costs (1 311 072) (1 119 151)Staff training/conference and travel (460 676) (337 590)Staff uniform and welfare (14 051) (7 982)Subscriptions (26 852) (302 587)Telephone, fax and internet (306 145) (26 664)Deferred Income (3 078 364) -
Total expenditure (6 447 167) (2 632 031) Surplus before related entity expenses - 530 194
DETAILED INCOME STATEMENT – ESWATINI STOCK EXCHANGE - for the year ended 31 March 2018
154
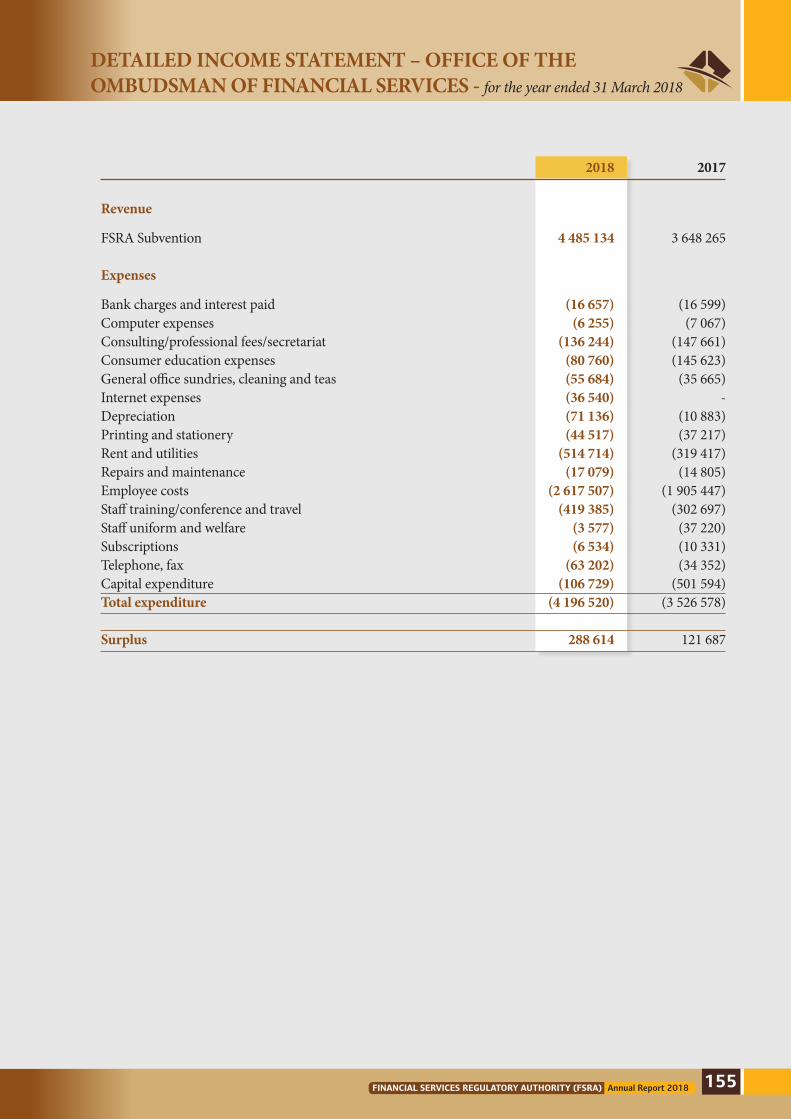
FINANCIAL SERVICES REGULATORY AUTHORITY (FSRA) Annual Report 2018
2018 2017
Revenue
FSRA Subvention 4 485 134 3 648 265 Expenses
Bank charges and interest paid (16 657) (16 599)Computer expenses (6 255) (7 067)Consulting/professional fees/secretariat (136 244) (147 661)Consumer education expenses (80 760) (145 623)General office sundries, cleaning and teas (55 684) (35 665)Internet expenses (36 540) -Depreciation (71 136) (10 883)Printing and stationery (44 517) (37 217)Rent and utilities (514 714) (319 417)Repairs and maintenance (17 079) (14 805)Employee costs (2 617 507) (1 905 447)Staff training/conference and travel (419 385) (302 697)Staff uniform and welfare (3 577) (37 220)Subscriptions (6 534) (10 331)Telephone, fax (63 202) (34 352)Capital expenditure (106 729) (501 594)Total expenditure (4 196 520) (3 526 578) Surplus 288 614 121 687
DETAILED INCOME STATEMENT – OFFICE OF THE OMBUDSMAN OF FINANCIAL SERVICES - for the year ended 31 March 2018
155

FINANCIAL SERVICES REGULATORY AUTHORITY (FSRA)