financial statements bulletin - metsaboard.com · financial statements bulletin for 1 january ......
TRANSCRIPT
Financial statements bulletin for 1 January – 31 December 2017 8 February 2018 at 12:00 noon
Page 1/27
METSÄ BOARD FINANCIAL STATEMENTS BULLETIN
2017
Financial statements bulletin for 1 January – 31 December 2017 8 February 2018 at 12:00 noon
Page 2/27
METSÄ BOARD’S COMPARABLE OPERATING RESULT IN 2017 WAS EUR 194 MILLION
JANUARY–DECEMBER 2017 (1–12/2016)
• Sales were EUR 1,848.6 million (1,720.3).
• Comparable operating result was EUR 193.5 million (137.5), or 10.5 per cent (8.0) of sales. The operat-ing result was EUR 207.1 million (132.3).
• Comparable earnings per share were EUR 0.39 (0.26), and earnings per share were EUR 0.42 (0.25).
• Comparable return on capital employed was 11.2 per cent (8.1).
OCTOBER–DECEMBER 2017 (7–9/2017)
• Sales were EUR 451.3 million (478.6).
• Comparable operating result was EUR 54.4 million (50.4), or 12.0 per cent (10.5) of sales. The operat-ing result was EUR 54.4 million (60.6).
• Comparable earnings per share were EUR 0.12 (0.08), and earnings per share were EUR 0.12 (0.11).
• Comparable return on capital employed was 12.4 per cent (11.5).
EVENTS IN OCTOBER–DECEMBER 2017
• In December, Metsä Board raised its result guid-ance for the fourth quarter due to the stronger-than-expected pulp market.
• Sales prices of paperboard rose, but deliveries were at a lower level than in the previous quarter, mainly due to the seasonal decline in December.
• The annual maintenance shutdown at the Husum in-tegrated mill had a significant negative effect on the fourth quarter result.
• Thanks to the strong cash flow and the improved re-sult, the ratio of interest-bearing net debt to compa-rable EBITDA fell to 1.2. Interest-bearing net debt decreased by nearly EUR 80 million.
• CDP recognised Metsä Board’s responsibility. The company was included on the A List in the Climate and Water programmes, and received Leadership status in the Forests programme.
EVENTS AFTER THE REVIEW PERIOD
• Due to suspected information security breach, Metsä Board announced preliminary information on the sales, comparable operating result and earnings per share for the fourth quarter of 2017 on 9 Janu-ary 2018. The suspected information security breach has not had financial impacts on Metsä Board.
• Metsä Board announced an increase of EUR 50 per tonne in the white kraftliner prices in Europe as of 1 February 2018.
• Metsä Board introduced a biobased, biodegradable paperboard with a special eco-barrier treatment, de-veloped particularly for food service packaging. In addition to being environmentally friendly, the new product offers efficiencies in printing and converting.
RESULT GUIDANCE FOR JANUARY–MARCH 2018
Metsä Board’s comparable operating result in the first quarter of 2018 is expected to improve slightly com-pared to the fourth quarter of 2017.
DIVIDEND PROPOSAL
The Board of Directors proposes to the Annual General Meeting to be held on 27 March 2018 that a dividend of EUR 0.21 per share will be paid for the 2017 financial period. The proposed dividend is equal to 50 per cent of the earnings per share for 2017.
Metsä Board’s CEO Mika Joukio:
“The average prices of our paperboards rose during the fourth quarter of 2017. Due to the seasonal decline in December, the delivery volumes of paperboards re-mained at a lower level than in the previous quarter. We also continued measures to improve the geographical sales mix of folding boxboard. Due to the strong pulp market, we raised the previously announced result guidance for the fourth quarter.
Year 2017 was Metsä Board’s first full year as a pure-play paperboard company. It was also a year of strong growth – our paperboard deliveries grew by 15 per cent from the previous year and amounted to approximately 1.8 million tonnes. Five of our eight production units set new annual production records.
Our comparable operating result improved by 41 per cent from the previous year and was EUR 194 million. In addition to an increase in paperboard deliveries, our profitability improved due to the strong pulp market. The new bioproduct mill of our associated company Metsä
Financial statements bulletin for 1 January – 31 December 2017 8 February 2018 at 12:00 noon
Page 3/27
Fibre at Äänekoski started up in August in an excellent market situation, in addition to which the mill’s produc-tion volumes have been higher than forecast. The global market situation for white kraftliners remained good throughout the year.
Our cash flow from operations grew clearly in 2017, and our balance sheet is strong. We issued a ten-year bond, and the strong demand for it is also an indication of the credit market’s trust in Metsä Board’s future.
We begin 2018 in a good market situation. The prices of paperboard are on the rise and demand is at a good level in the market areas that are important for us. On the other hand, the weakening of the US dollar has a negative impact on our result. We have not yet reached the targeted profitability in Husum’s folding boxboard, and we are continuing our measures on this front.
As part of our business development, we renewed our key marketing messages, and harmonised our product and service portfolio in 2017. This strengthens Metsä Board’s market position as a company focused on pre-mium, lightweight paperboards. The Better with Less concept reflects our desire to promote packaging solu-tions that create better consumer experiences with less environmental impact.
Metsä Board will continue to invest in growth, but at the same time, we want to reward our shareholders. The Board of Directors proposes that a dividend of EUR 0.21 per share will be paid for 2017. I would also like to extend my thanks for the past year to our customers, employees and other stakeholders.”
Financial statements bulletin for 1 January – 31 December 2017 8 February 2018 at 12:00 noon
Page 4/27
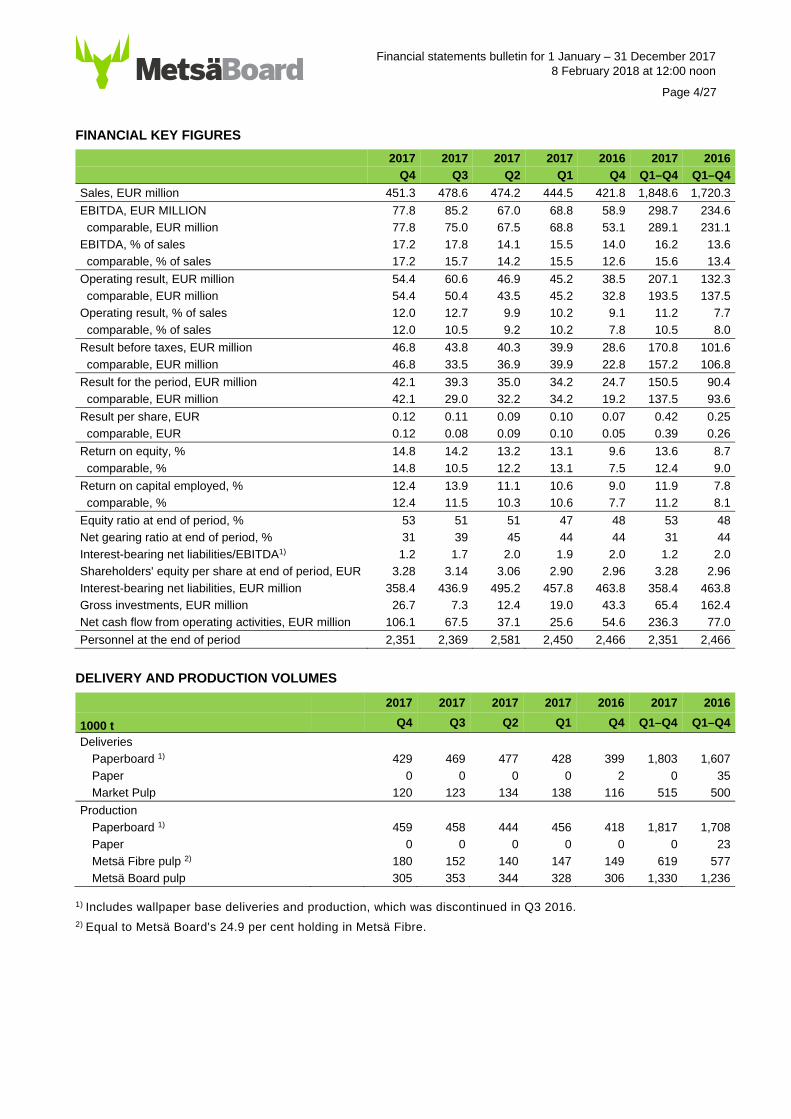
FINANCIAL KEY FIGURES
2017 2017 2017 2017 2016 2017 2016
Q4 Q3 Q2 Q1 Q4 Q1–Q4 Q1–Q4
Sales, EUR million 451.3 478.6 474.2 444.5 421.8 1,848.6 1,720.3
EBITDA, EUR MILLION 77.8 85.2 67.0 68.8 58.9 298.7 234.6
comparable, EUR million 77.8 75.0 67.5 68.8 53.1 289.1 231.1
EBITDA, % of sales 17.2 17.8 14.1 15.5 14.0 16.2 13.6
comparable, % of sales 17.2 15.7 14.2 15.5 12.6 15.6 13.4
Operating result, EUR million 54.4 60.6 46.9 45.2 38.5 207.1 132.3
comparable, EUR million 54.4 50.4 43.5 45.2 32.8 193.5 137.5
Operating result, % of sales 12.0 12.7 9.9 10.2 9.1 11.2 7.7
comparable, % of sales 12.0 10.5 9.2 10.2 7.8 10.5 8.0
Result before taxes, EUR million 46.8 43.8 40.3 39.9 28.6 170.8 101.6
comparable, EUR million 46.8 33.5 36.9 39.9 22.8 157.2 106.8
Result for the period, EUR million 42.1 39.3 35.0 34.2 24.7 150.5 90.4
comparable, EUR million 42.1 29.0 32.2 34.2 19.2 137.5 93.6
Result per share, EUR 0.12 0.11 0.09 0.10 0.07 0.42 0.25
comparable, EUR 0.12 0.08 0.09 0.10 0.05 0.39 0.26
Return on equity, % 14.8 14.2 13.2 13.1 9.6 13.6 8.7
comparable, % 14.8 10.5 12.2 13.1 7.5 12.4 9.0
Return on capital employed, % 12.4 13.9 11.1 10.6 9.0 11.9 7.8
comparable, % 12.4 11.5 10.3 10.6 7.7 11.2 8.1
Equity ratio at end of period, % 53 51 51 47 48 53 48
Net gearing ratio at end of period, % 31 39 45 44 44 31 44
Interest-bearing net liabilities/EBITDA1) 1.2 1.7 2.0 1.9 2.0 1.2 2.0
Shareholders' equity per share at end of period, EUR 3.28 3.14 3.06 2.90 2.96 3.28 2.96
Interest-bearing net liabilities, EUR million 358.4 436.9 495.2 457.8 463.8 358.4 463.8
Gross investments, EUR million 26.7 7.3 12.4 19.0 43.3 65.4 162.4
Net cash flow from operating activities, EUR million 106.1 67.5 37.1 25.6 54.6 236.3 77.0
Personnel at the end of period 2,351 2,369 2,581 2,450 2,466 2,351 2,466
DELIVERY AND PRODUCTION VOLUMES
2017 2017 2017 2017 2016 2017 2016
1000 t Q4 Q3 Q2 Q1 Q4 Q1–Q4 Q1–Q4
Deliveries
Paperboard 1) 429 469 477 428 399 1,803 1,607
Paper 0 0 0 0 2 0 35
Market Pulp 120 123 134 138 116 515 500
Production
Paperboard 1) 459 458 444 456 418 1,817 1,708
Paper 0 0 0 0 0 0 23
Metsä Fibre pulp 2) 180 152 140 147 149 619 577
Metsä Board pulp 305 353 344 328 306 1,330 1,236
1) Includes wallpaper base deliveries and production, which was discontinued in Q3 2016. 2) Equal to Metsä Board's 24.9 per cent holding in Metsä Fibre.
Financial statements bulletin for 1 January – 31 December 2017 8 February 2018 at 12:00 noon
Page 5/27
FINANCIAL STATEMENTS BULLETIN FOR 1 JANUARY – 31 DECEMBER 2017
OCTOBER–DECEMBER 2017 (7–9/2017)
SALES AND RESULT
Metsä Board’s sales amounted to EUR 451.3 million (478.6). Sales decreased due to the delivery volumes of paperboard and market pulp, which were lower than in the previous quarter. The operating result was EUR 54.4 million (60.6), and the comparable operating result was EUR 54.4 million (50.4). There were no items af-fecting comparability during the review period. Items af-fecting comparability during the comparison period con-sisted of the recognition of translation differences accu-mulated by the subsidiaries dissolved in the United Kingdom.
The comparable operating result for October–Decem-ber improved due to stronger-than-expected pulp mar-ket. Because of this, Metsä Board raised its previously announced result guidance for the fourth quarter on 13 December 2017. The average prices of paperboards in-creased, but the delivery volumes remained lower, mainly due to the seasonal decline in December. Ex-change rate fluctuations including hedges had a nega-tive effect of EUR 4 million on the operating result.
The annual maintenance shutdown of the Husum inte-grated mill had a significant negative impact on the re-sult. In addition to maintenance costs, the result of Husum mill decreased due to the lower production and delivery volumes of paperboards, and particularly pulp. The start-up phase of Metsä Fibre’s bioproduct mill has proceeded well, and the mill’s production volumes have been higher than expexted.
There were no significant changes in the total produc-tion costs of paperboards.
In October–December, deliveries of Metsä Board’s fold-ing boxboard and white kraftliners declined by 8 per cent and 10 per cent, respectively, from the previous quarter. Correspondingly, deliveries by European fold-ing boxboard producers declined by 1 per cent. Deliver-ies by European producers of white kraftliners declined by 2 per cent.
In Europe, the euro-denominated market price of long-fibre pulp increased by 6 per cent, while its dollar-de-nominated market price increased by 7 per cent com-pared to the previous quarter. The euro- and dollar-de-nominated market prices of short-fibre pulp increased by 8 per cent. In China, the dollar-denominated market price of long-fibre pulp increased by 27 per cent and that of short-fibre pulp by 13 per cent.
Financial income and expenses totalled EUR -7.5 mil-lion (-16.8), including foreign exchange rate differences from trade receivables, trade payables, financial items and the valuation of currency hedging instruments, to-talling EUR -0.5 million (-0.0). The financial expenses of the comparison period include EUR -10.9 million in
costs related to the early repurchase of the bond matur-ing in 2019.
The result before taxes in October–December was EUR 46.8 million (43.8). The comparable result before taxes was EUR 46.8 million (33.5). Income taxes amounted to EUR -4.7 million (-4.5).
Earnings per share were EUR 0.12 (0.11). The return on equity was 14.8 per cent (14.2), and the comparable return on equity was 14.8 per cent (10.5). The return on capital employed was 12.4 per cent (13.9), and the comparable return on capital employed was 12.4 per cent (11.5).
JANUARY–DECEMBER 2017 (1–12/2016)
SALES AND RESULT
Metsä Board’s sales amounted to EUR 1,848.6 million (1,720.3). Sales increased due to the increased delivery volumes of paperboards and market pulp as well as higher pulp prices. The operating result was EUR 207.1 million (132.3), and the comparable operating result was EUR 193.5 million (137.5). Items affecting compa-rability during the financial period consisted mainly of the reversal of a previously recognised impairment loss on the closed and sold paper machine at Kyro mill, and the recognition of translation differences accumulated by the subsidiaries dissolved in the United Kingdom.
The comparable operating result improved due to the increased delivery volumes of paperboards and market pulp, and the discontinued paper operations. The result also improved due to the strong pulp market and the successful start-up of the new bioproduct mill of our as-sociated company Metsä Fibre in the second half of the year. The positive momentum in the linerboard market globally increased the price of white kraftliners in local currencies. Exchange rate fluctuations including hedges had a positive effect of approximately EUR 13 million on the operating result for the financial period.
The average price of Metsä Board’s folding boxboard fell due to the sales mix of Husum, particularly during the first half of the year. The company aims to continue to improve the average price and increase sales, partic-ularly in North America.
The prices of latex were high in the first half of the year, but returned to a normal level during the third quarter. In other respects, there were no significant changes in the total production costs of paperboards. The produc-tion costs per tonne of folding boxboard produced at Husum continued to be higher than the production costs at other mills. This was due to the lower capacity utilisation rate.
Deliveries of Metsä Board’s folding boxboard and white kraftliners in the financial period increased by 16 per cent and 14 per cent, respectively, compared to the previous year. Correspondingly, deliveries by European folding boxboard producers increased by 4 per cent, and deliveries by producers of white kraftliner by 7 per
Financial statements bulletin for 1 January – 31 December 2017 8 February 2018 at 12:00 noon
Page 6/27
cent. Metsä Board’s share of the total deliveries by Eu-ropean folding boxboard producers was 39 per cent, and 67 per cent of exports from Europe.
The euro-denominated market price of long-fibre pulp increased by 8 per cent, while its dollar-denominated market price increased by 10 per cent compared to the previous year. The euro-denominated market price of short-fibre pulp increased by 16 per cent, while its dol-lar-denominated market price increased by 18 per cent.
Financial income and expenses totalled EUR -36.3 mil-lion (-30.7), including foreign exchange rate differences from trade receivables, trade payables, financial items and the valuation of currency hedging instruments, to-talling EUR -1.1 million (-4.9). Financial expenses in-clude EUR -11.2 million of costs related to the early re-purchase of the bond maturing in 2019.
The result before taxes for the financial period was EUR 170.8 million (101.6). The comparable result be-fore taxes was EUR 157.2 million (106.8). Income taxes amounted to EUR -20.3 million (-11.3).
Earnings per share were EUR 0.42 (0.25). Comparable earnings per share were EUR 0.39 (0.26). The return on equity was 13.6 per cent (8.7), and the comparable return on equity was 12.4 per cent (9.0). The return on capital employed was 11.9 per cent (7.8), and the com-parable return on capital employed was 11.2 per cent (8.1).
CASH FLOW
Net cash flow from operations in October–December was EUR 106.1 million (7–9/2017: 67.5). Cash flow in-creased mainly due to changes in trade receivables and trade payables. Working capital decreased by EUR 58.8 million (7–9/2017: decreased by EUR 24.2 million). The net cash flow of the comparison period was bur-dened by the costs related to the early repurchase of the bond maturing in 2019.
Net cash flow from operations in 2017 was EUR 236.3 million (1–12/2016: 77.0). Cash flow increased due to the improved operating result and changes in working capital. Working capital decreased by EUR 34.1 million in the financial period (2016: increased by 74.5). In 2016, working capital increased due to the investment programme at Husum.
INVESTMENTS
Gross investments in 2017 totalled EUR 65.4 million (2016: 162.4) consisting mainly of maintenance invest-ments and the extrusion coating line at the Husum mill. In 2016, investments totalled EUR 162.4 million, the most significant investments being the investment pro-gramme at Husum and the extrusion coating line, as well as the equity investment in Metsä Fibre’s new bioproduct mill.
BALANCE SHEET AND FINANCING
Metsä Board’s equity ratio at the end of the year was 53 per cent (31 December 2016: 48) and its net gearing ra-tio was 31 per cent (44). The ratio of interest-bearing net debt to comparable EBITDA in the last 12 months was 1.2 at the end of the financial period (31 December 2016: 2.0).
At the end of the year, interest-bearing liabilities totalled EUR 577.0 million (31 December 2016: 688.0). Foreign currency-denominated loans accounted for 1.1 per cent of loans and floating-rate loans for 18.5 per cent, with the rest being fixed-rate loans. At the end of the year, the average interest rate on loans was 3.3 per cent (31 December 2016: 3.3), and the average maturity of long-term loans was 5.4 years (31 December 2016: 2.2). The interest rate maturity of loans at the end of the year was 67.9 months (31 December 2016: 14.9).
At the end of the year, net interest-bearing liabilities to-talled EUR 358.4 million (31 December 2016: 463.8).
In September, Metsä Board issued an unsecured bond of EUR 250 million. The bond matures in 2027 and car-ries a fixed coupon rate of 2.75 per cent. The bond has a Standard & Poor’s credit rating of BB+. In addition, Metsä Board has a bond maturing in 2019, with an orig-inal amount of EUR 225 million, of which there remains outstanding a nominal amount of EUR 60.4 million, fol-lowing the repurchases made in 2017.
Metsä Board’s liquidity has remained strong. At the end of the review period, the available liquidity was EUR 449.2 million (31 December 2016: 422.6), consisting of the following items: liquid assets and investments of EUR 215.1 million, a syndicated credit facility of EUR 100.0 million, and undrawn pension premium (TyEL) funds of EUR 134.1 million. Of the liquid assets, EUR 207.0 million consisted of short-term deposits with Metsä Group Treasury, and EUR 8.1 million were cash funds and investments. Other interest-bearing receiva-bles amounted to EUR 3.5 million. In addition, Metsä Board’s liquidity reserve is complemented by Metsä Group’s internal undrawn short-term credit facility of EUR 150.0 million.
The fair value of investments available for sale was EUR 240.3 million at the end of the review period (31 December 2016: 195.9). The change in fair value from the beginning of the review period, EUR 44.4 million, related to the increase in the fair value of the shares in Pohjolan Voima Oyj.
At the end of the review period, an average of 8.0 months of the net foreign currency exposure was hedged, including the hedging of the balance sheet po-sition of trade receivables and trade payables (31 De-cember 2016: 6.4). The degree of hedging during the period varied between six and eight months, on aver-age. In addition to the balance sheet position, half of the projected annual net foreign currency exposure is hedged. The amount of hedging may deviate from the norm by 40 per cent in either direction. When hedging
Financial statements bulletin for 1 January – 31 December 2017 8 February 2018 at 12:00 noon
Page 7/27
is at the norm level, the aim is to allocate the hedges primarily to the following two quarters.
In August, Moody’s Investors Service upgraded Metsä Board Corporation’s credit rating from Ba2 to Ba1. The outlook of the rating is stable.
PERSONNEL
At the end of 2017, the number of personnel was 2,351 (2,466), of whom 1,344 (1,442) people worked in Fin-land. In January–December, Metsä Board employed 2,456 people on average (1–12/2016: 2,588). Person-nel expenses in 2017 totalled EUR 198.0 million (211.0).
CHANGES IN THE CORPORATE MANAGE-MENT TEAM
Ms Sari Pajari, M.Sc. (Eng.), was appointed Metsä Board’s SVP, Sales and Marketing, on 6 June 2017. Her previous area of responsibility in the Corporate Management Team was business development. Mr Seppo Puotinen, the Corporate Management Team member previously in charge of marketing and sales, left the company. Mr Harri Pihlajaniemi, M.Sc. (Eng.), took up his position as Metsä Board’s SVP, Production, and a member of the Corporate Management Team on 6 September 2017. As of 6 September 2017, the area of responsibility of Mr Ari Kiviranta, D.Sc. (Tech.), previously in charge of pro-duction and technology, has included research, product development and technology, as well as business de-velopment. Pajari, Pihlajaniemi and Kiviranta report to Mr Mika Joukio, CEO of Metsä Board. BUSINESS DEVELOPMENT
Demand for Metsä Board’s lightweight, ecological and recyclable fresh fibre paperboards remained at a good level in 2017. By exploiting Husum’s folding boxboard capacity, Metsä Board is increasingly well positioned to meet the growing global demand for premium fresh fi-bre paperboards.
The good global demand for fresh fibre paperboards was visible in the average order books of Metsä Board’s paperboard mills, which were at a higher level than normal during the second half of the year. Five Metsä Board production units – Tako, Simpele, Husum, Kaskinen and Joutseno – set new annual production records in 2017.
In 2017, Metsä Board’s total paperboard deliveries grew by 15 per cent from the previous year and were approximately 1.80 million tonnes (2016: 1.57). Folding boxboard deliveries in 2017 totalled 1.14 million tonnes, of which approximately 70 per cent was delivered to the EMEA region, 20 per cent to the Americas and 10 per cent to the APAC region. Linerboard deliveries in 2017
totalled 658,000 tonnes, of which approximately 70 per cent was delivered to the EMEA region and 30 per cent to the Americas. Total paperboard deliveries to the Americas grew by 23 per cent in 2017.
Metsä Board announced an increase of EUR 90 per tonne in the price of folding boxboard in Europe as of November. The company also announced to increase the price of white kraftliners in April and September. Price increase announcements relating to kraftliners were EUR 50 per tonne each.
The capacity utilisation rate for folding boxboard at the Husum mill was 71 per cent in 2017. In the first half of the year, the average price of folding boxboard was weakened by the geographical sales mix, as part of Husum’s paperboard deliveries were targeted to the Middle East. Towards the end of the year, the share of sales to North America grew, and the average price of folding boxboard in local currencies improved. The an-nual maintenance shutdown at the Husum integrated mill, which took place in the fourth quarter, lasted longer than expected and resulted in lost production and sales, particularly in terms of pulp.
Deliveries of Metsä Board’s own PE-coated paper-boards from the Husum mill began during the second quarter of the year. The company is continuing to de-velop other barrier solutions, and is investigating the ex-ploitation of dispersion coating and biobased coating solutions as well as their commercial potential. After the review period, Metsä Board launched an innovative bio-based, biodegradable paperboard with a special barrier treatment, mainly for use in food service packaging.
Metsä Board has estimated the results improvement potential of the Husum integrated mill to be approxi-mately EUR 100 million between 2016 and 2019. The most significant part of this improvement will be achieved if the capacity utilisation rate of folding box-board is at least 95 per cent and if the sales price is at a normal level. The rest of the improved result is due to an increase in the delivery volumes of pulp and cost savings.
In May, Metsä Board launched its renewed product and service portfolio. The product names of all paperboards were brought under the MetsäBoard product family. The Better with Less concept promotes packaging solu-tions that create better consumer experiences with less environmental impact.
Metsä Board was again successful in a number of inter-national competitions organised by the packaging in-dustry during the year. Metsä Board’s packaging solu-tions and the high-quality materials used in them re-ceived recognition for their environmental friendliness, innovativeness and functionality. The company was also recognised for its responsibility by CDP and EcoVadis, among others.
The new bioproduct mill of Metsä Board’s associated company Metsä Fibre started up in August 2017, and the pulp deliveries to customers began in September. The mill’s start-up phase has progressed better than
Financial statements bulletin for 1 January – 31 December 2017 8 February 2018 at 12:00 noon
Page 8/27
expected. The new bioproduct mill will increase Metsä Board’s annual pulp capacity by approximately 200,000 tonnes as of 2018.
STRATEGY AND FINANCIAL TARGETS
Metsä Board is a leading European producer of fresh fi-bre paperboards. The company focuses on lightweight, premium fresh fibre paperboards used in consumer goods, retail-ready and food service packaging. Metsä Board’s strategic objective is to grow profitably and faster than average market growth. Global demand for high-quality paperboard made from fresh fibre is ex-pected to grow by approximately 3–4 per cent a year. Metsä Board’s profitability is based on superior cost-ef-fectiveness and healthy sales prices, combined with high-quality fibre raw materials and unique technical know-how.
Metsä Board’s Board of Directors updated the com-pany’s long-term financial goals and decided on a new dividend policy, effective as of 1 June 2017.
A comparable return on capital employed (ROCE) of, at minimum, 12 per cent (Actual in 2017: 11.2)
A ratio of interest-bearing net liabilities to compara-ble EBITDA of, at maximum, 2.5 (Actual in 2017: 1.2)
Growth in paperboard deliveries exceeding aver-age market growth (In 2017, paperboard deliveries grew by 15 per cent)
In addition, Metsä Board aims to distribute at least 50 per cent of the result for the financial period in divi-dends every year. The Board of Directors’ proposal to the Annual General Meeting concerning the dividend to be paid for the 2017 financial year corresponds to 50 per cent of the result for the financial period.
DECISIONS MADE AT THE 2017 ANNUAL
GENERAL MEETING
Metsä Board’s Annual General Meeting held on 23 March 2017 adopted the company’s financial state-ments for the financial year 2016 and decided to distrib-ute a dividend of EUR 0.19 per share.
The Annual General Meeting decided to raise the Board of Directors’ annual remuneration by 8 per cent in such a way that the Chair of the Board of Directors is paid annual remuneration of EUR 95,000, the Deputy Chair is paid EUR 80,000 and each member of the Board is paid EUR 62,500, and that a meeting fee of EUR 700 will be paid for each meeting of the Board and commit-tees of the Board that a member attends. The Annual General Meeting decided to pay roughly half of the re-muneration in the form of the company’s B shares ac-quired through public trading. Furthermore, the Annual General Meeting decided to pay the Chair of the Audit Committee monthly remuneration of EUR 800.
The Annual General Meeting confirmed the number of members of the Board of Directors as nine (9) and elected the following individuals as members of the Board of Directors: Martti Asunta, metsäneuvos (Finn-ish honorary title); Kari Jordan, vuorineuvos (Finnish honorary title); Kirsi Komi, LL.M.; Kai Korhonen, M.Sc. (Eng.); Liisa Leino, teollisuusneuvos (Finnish honorary title); Jussi Linnaranta, M.Sc. (Agriculture and Forestry); Juha Niemelä, vuorineuvos (Finnish honorary title); Veli Sundbäck, ambassador; and Erkki Varis, M.Sc. (Eng). The Board members’ term of office expires at the end of the next Annual General Meeting.
Metsä Board published a stock exchange release on the decisions made by the Annual General Meeting and the constitution of the Board of Directors on 23 March 2017. More detailed information on the decisions of the Annual General Meeting and introductions of the Board members are available on Metsä Board’s website at: www.metsaboard.com/Investors/General-Meeting/.
LEGAL PROCEEDINGS
In May 2014, Metsä Board petitioned the District Court of Helsinki to revoke the judgment issued by the Arbitral Tribunal on 11 February 2014 that orders Metsä Board to pay EUR 19.7 million in damages to UPM Kymmene Corporation. In a judgment issued in June 2015, the District Court rejected Metsä Board’s petition. Metsä Board appealed the decision of the District Court to the Court of Appeal. The Court of Appeal dismissed Metsä Board’s appeal on 21 October 2016. Metsä Board has applied for leave to appeal the matter to the Supreme Court.
In the autumn of 2015, the Finnish Tax Administration gave an opinion against the deductibility of certain losses in Metsä Board’s 2014 taxation. Metsä Board has appealed against the decision issued by the Tax Administration, as the company believes the losses are deductible.
SHARES
At the end of the financial period, the price for Metsä Board’s B share on the Nasdaq Helsinki was EUR 7.15. The share’s highest and lowest prices in 2017 were EUR 7.36 and EUR 5.34, respectively. At the end of the financial period, the price for Metsä Board’s A share on the Nasdaq Helsinki was EUR 7.13. The share’s high-est and lowest prices in 2017 were EUR 7.28 and EUR 5.43, respectively.
In 2017, the average daily trading volumes of the B and A shares on the Nasdaq Helsinki were 688,995 shares and 5,944 shares, respectively. The total trading vol-umes of the B and A shares were EUR 1,101.6 million and EUR 9.5 million, respectively.
In addition to the Nasdaq Helsinki, Metsä Board’s shares are traded on other marketplaces, such as Chi-X and BATS. The Nasdaq Helsinki’s share of total trad-ing during the financial period was 73 per cent.
Financial statements bulletin for 1 January – 31 December 2017 8 February 2018 at 12:00 noon
Page 9/27
At the end of the financial period, there were 35,886,682 A shares and 319,626,064 B shares.
At the end of the financial period, the market value of all Metsä Board’s shares was EUR 2,539.6 million, of which the market value of the B shares was EUR 2,283.7 million, and that of the A shares was EUR 255.9 million.
At the end of the year, Metsäliitto Cooperative owned 42 per cent of the shares, and the voting rights con-ferred by these shares amounted to 61 per cent. At the end of the year, international and nominee-registered investors held 20 per cent of all the shares (31 Decem-ber 2016: 15).
In 2017, a total of 8,969 of Metsä Board Corporation’s A shares were converted to B shares. At the end of the year, the total number of Metsä Board shares was 355,512,746, of which 35,886,682 were A shares and 319,626,064 were B shares.
The company does not hold any treasury shares.
NEAR-TERM RISKS AND UNCERTAINTIES
Considerable uncertainties still exist in the global econ-omy. If realised, they may result in weakened demand and reduced prices for paperboard and pulp products. An imbalance in supply and demand may impact the prices of end products and Metsä Board’s profitability.
Metsä Board is focusing on the active development and growth of its paperboard business. Growing the paper-board business and introducing new production to the market are dependent on the successful growth of sales in Europe, and particularly in the Americas. In-creasing sales at the global level also involves cost and exchange rate risks.
There are several geopolitical risk concentrations around the world, and forecasting developments in them is difficult. Changes in these areas may be very sudden and unpredictable. There have been, and will continue to be, international sanctions related to these crises, and they may also have a direct or indirect im-pact on the demand for paperboards and, therefore, on Metsä Board’s result. Negative developments in inter-national free trade would, if realised, weaken Metsä Board’s result.
The US dollar strengthening by 10 per cent against the euro would have a positive impact of approximately EUR 65 million on Metsä Board’s annual operating re-sult. Correspondingly, the Swedish krona strengthening by 10 per cent would have a negative impact of approx-imately EUR 39 million. The British pound strengthen-ing by 10 per cent would have a positive impact of ap-proximately EUR 7 million. The impact of weakened ex-change rates would be the opposite. The sensitivities do not include the impact of hedging.
Wood accounts for more than a quarter of Metsä Board’s total costs. The availability of the wood raw ma-terial becoming more difficult or a sudden increase in
prices would have a weakening effect on Metsä Board’s result.
The forward-looking estimates and statements in this fi-nancial statements bulletin are based on current plans and estimates. For this reason, they contain risks and other uncertainties that may cause the results to differ from the statements concerning them. In the short term, Metsä Board’s result will be particularly affected by the price of and demand for finished products, raw material costs, the price of energy, and the exchange rate devel-opment of the euro compared to the company’s other main currencies.
Additional information on long-term risks is also availa-ble on pages 24–25 of Metsä Board’s 2016 Annual Re-port, and on pages 26–36 of the prospectus concerning the bond issued in 2017. NEAR-TERM OUTLOOK
Growth in the demand for high-quality consumer pack-aging paperboard made from fresh fibre is expected to continue in market areas important for Metsä Board. The market prices of folding boxboard and white kraft-liners in local currencies are expected to rise as a result of the price increases announced in 2017. Metsä Board aims to further improve the average price of Husum’s folding boxboard and increase sales in North America.
Metsä Board’s paperboard deliveries in January–March are expected to grow from the previous quarter. No sig-nificant maintenance shutdowns will take place during the first quarter.
The weakening of the US dollar against the euro, in-cluding the impact of hedges, will have a negative effect on the operating result in at least the first half of the year.
The rainy and mild weather in last autumn and early winter has made the situation in the wood supply tougher. For now, the weaker availability of wood has not led to production curtailments at Metsä Board.
Production costs in 2018 are expected to rise from the previous year. Wood prices are expected to increase, particularly in Sweden and the Baltic countries. In addi-tion, the general cost inflation has accelerated slightly.

Financial statements bulletin for 1 January – 31 December 2017 8 February 2018 at 12:00 noon
Page 10/27
EVENTS AFTER THE REVIEW PERIOD
Due to suspected information security breach, Metsä Board announced preliminary information on the sales, comparable operating result and earnings per share for the fourth quarter of 2017 on 9 January 2018. The sus-pected information security breach has not had financial impacts on Metsä Board.
Metsä Board announced an increase of EUR 50 per tonne in the white kraftliner prices in Europe as of 1 February 2018.
Metsä Board is launching a biobased, biodegradable paperboard with a special eco-barrier treatment, devel-oped particularly for food service packaging. In addition to being environmentally friendly, the new product of-fers efficiencies in printing and converting.
RESULT GUIDANCE FOR JANUARY–MARCH
2018
Metsä Board’s comparable operating result in the first quarter of 2018 is expected to improve slightly com-pared to the fourth quarter of 2017.
BOARD OF DIRECTORS’ PROPOSAL FOR
DISTRIBUTION OF PROFIT
The distributable funds of the parent company on 31 December 2017 were EUR 529.0 million, of which the retained earnings are EUR 144.1 million.
The Board of Directors proposes to the Annual General Meeting to be held on 27 March 2018 that a dividend of EUR 0.21 per share, or a total of EUR 74.7 million, will be paid for the 2017 financial period.
The dividend will be paid to shareholders who are regis-tered in the company’s shareholders register held by Euroclear Finland Oy on the dividend payment record date of 29 March 2018.
The Board of Directors proposes 10 April 2018 as the dividend payment date.
METSÄ BOARD CORPORATION
Espoo, Finland, 8 February 2018 BOARD OF DIRECTORS
Further information:
Jussi Noponen, CFO tel. +358 10 465 4913
Katri Sundström, VP, Investor Relations, tel. +358 400 976 333
Further information will be available as of 1 p.m. on 8 February 2018. A conference call held for investors and analysts in English will begin at 3 p.m. Conference call participants are requested to dial in and register a few minutes earlier on the following numbers:
Finland: +358 (0)9 7479 0361 Sweden: +46 (0)8 5033 6574 UK: 44 (0)330 336 9105 US: +1 323-794-2149
The conference ID is 6742592.
Metsä Board’s financial reporting in 2018: Annual Report 2017, week 9 Interim Report for January–March 2018, 3 May Half-year Financial Report for January–June 2018, 2 August Interim Report for January–September 2018, 8 Novem-ber Other events in 2018: Annual General Meeting of 2018, 27 March Capital Markets Day 2018, 14 November
Financial statements bulletin for 1 January – 31 December 2017 8 February 2018 at 12:00 noon
Page 11/27
CALCULATION OF KEY RATIOS
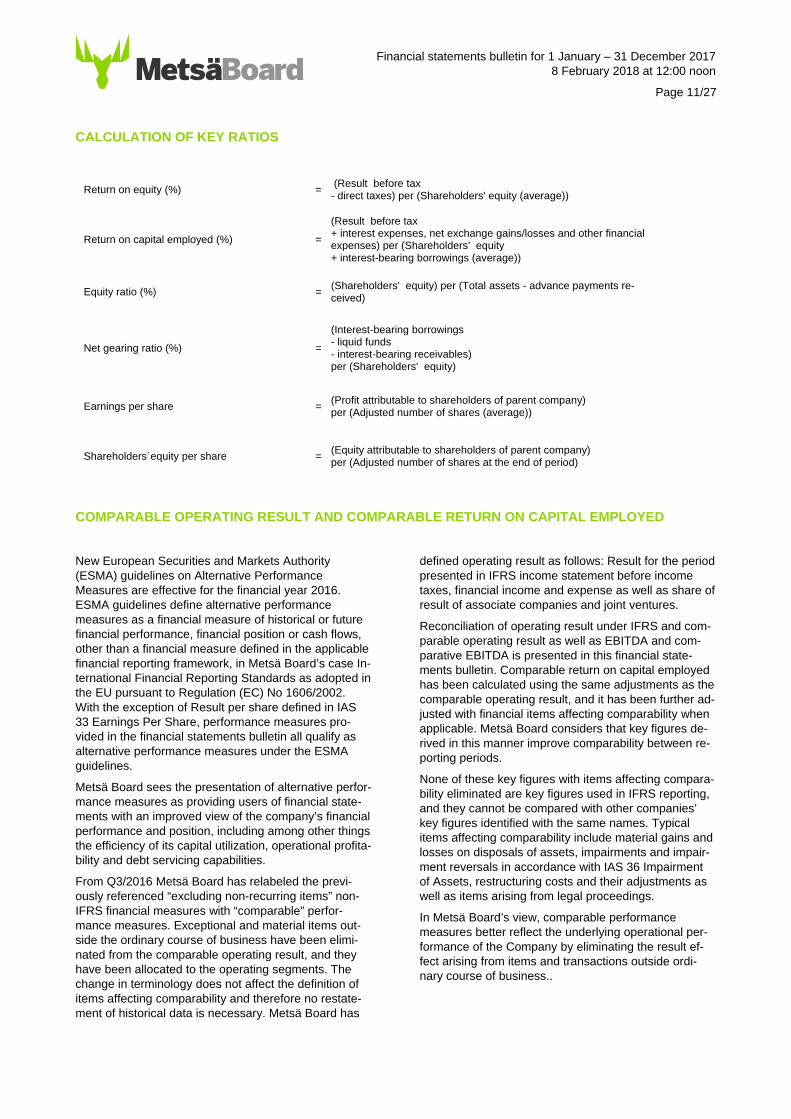
Return on equity (%) = (Result before tax - direct taxes) per (Shareholders' equity (average))
Return on capital employed (%) =
(Result before tax + interest expenses, net exchange gains/losses and other financial expenses) per (Shareholders' equity + interest-bearing borrowings (average))
Equity ratio (%) = (Shareholders' equity) per (Total assets - advance payments re-ceived)
Net gearing ratio (%) =
(Interest-bearing borrowings - liquid funds - interest-bearing receivables) per (Shareholders' equity)
Earnings per share = (Profit attributable to shareholders of parent company) per (Adjusted number of shares (average))
Shareholders´equity per share = (Equity attributable to shareholders of parent company) per (Adjusted number of shares at the end of period)
COMPARABLE OPERATING RESULT AND COMPARABLE RETURN ON CAPITAL EMPLOYED
New European Securities and Markets Authority (ESMA) guidelines on Alternative Performance Measures are effective for the financial year 2016. ESMA guidelines define alternative performance measures as a financial measure of historical or future financial performance, financial position or cash flows, other than a financial measure defined in the applicable financial reporting framework, in Metsä Board’s case In-ternational Financial Reporting Standards as adopted in the EU pursuant to Regulation (EC) No 1606/2002. With the exception of Result per share defined in IAS 33 Earnings Per Share, performance measures pro-vided in the financial statements bulletin all qualify as alternative performance measures under the ESMA guidelines.
Metsä Board sees the presentation of alternative perfor-mance measures as providing users of financial state-ments with an improved view of the company’s financial performance and position, including among other things the efficiency of its capital utilization, operational profita-bility and debt servicing capabilities.
From Q3/2016 Metsä Board has relabeled the previ-ously referenced “excluding non-recurring items” non-IFRS financial measures with “comparable” perfor-mance measures. Exceptional and material items out-side the ordinary course of business have been elimi-nated from the comparable operating result, and they have been allocated to the operating segments. The change in terminology does not affect the definition of items affecting comparability and therefore no restate-ment of historical data is necessary. Metsä Board has
defined operating result as follows: Result for the period presented in IFRS income statement before income taxes, financial income and expense as well as share of result of associate companies and joint ventures.
Reconciliation of operating result under IFRS and com-parable operating result as well as EBITDA and com-parative EBITDA is presented in this financial state-ments bulletin. Comparable return on capital employed has been calculated using the same adjustments as the comparable operating result, and it has been further ad-justed with financial items affecting comparability when applicable. Metsä Board considers that key figures de-rived in this manner improve comparability between re-porting periods.
None of these key figures with items affecting compara-bility eliminated are key figures used in IFRS reporting, and they cannot be compared with other companies’ key figures identified with the same names. Typical items affecting comparability include material gains and losses on disposals of assets, impairments and impair-ment reversals in accordance with IAS 36 Impairment of Assets, restructuring costs and their adjustments as well as items arising from legal proceedings.
In Metsä Board’s view, comparable performance measures better reflect the underlying operational per-formance of the Company by eliminating the result ef-fect arising from items and transactions outside ordi-nary course of business..
Financial statements bulletin for 1 January – 31 December 2017 8 February 2018 at 12:00 noon
Page 12/27
FINANCIAL STATEMENTS
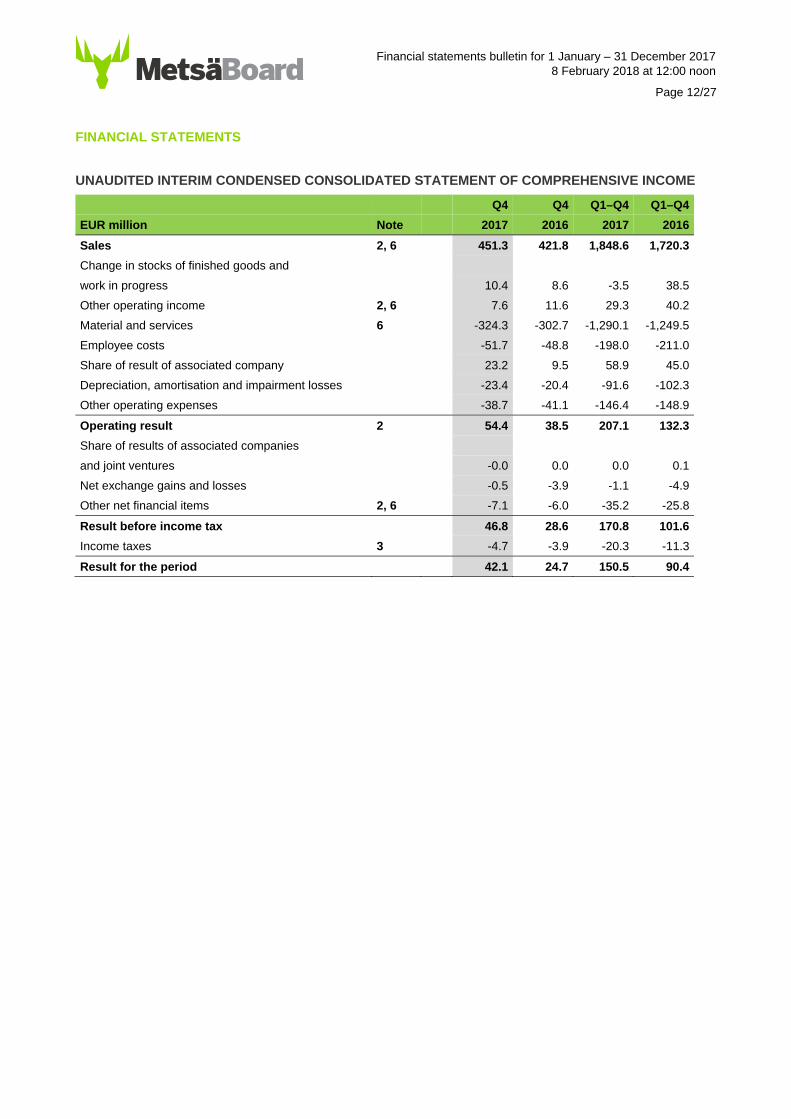
UNAUDITED INTERIM CONDENSED CONSOLIDATED STATEMENT OF COMPREHENSIVE INCOME
Q4 Q4 Q1–Q4 Q1–Q4
EUR million Note 2017 2016 2017 2016
Sales 2, 6 451.3 421.8 1,848.6 1,720.3
Change in stocks of finished goods and
work in progress 10.4 8.6 -3.5 38.5
Other operating income 2, 6 7.6 11.6 29.3 40.2
Material and services 6 -324.3 -302.7 -1,290.1 -1,249.5
Employee costs -51.7 -48.8 -198.0 -211.0
Share of result of associated company 23.2 9.5 58.9 45.0
Depreciation, amortisation and impairment losses -23.4 -20.4 -91.6 -102.3
Other operating expenses -38.7 -41.1 -146.4 -148.9
Operating result 2 54.4 38.5 207.1 132.3
Share of results of associated companies
and joint ventures -0.0 0.0 0.0 0.1
Net exchange gains and losses -0.5 -3.9 -1.1 -4.9
Other net financial items 2, 6 -7.1 -6.0 -35.2 -25.8
Result before income tax 46.8 28.6 170.8 101.6
Income taxes 3 -4.7 -3.9 -20.3 -11.3
Result for the period 42.1 24.7 150.5 90.4
Financial statements bulletin for 1 January – 31 December 2017 8 February 2018 at 12:00 noon
Page 13/27
Q4 Q4 Q1–Q4 Q1–Q4
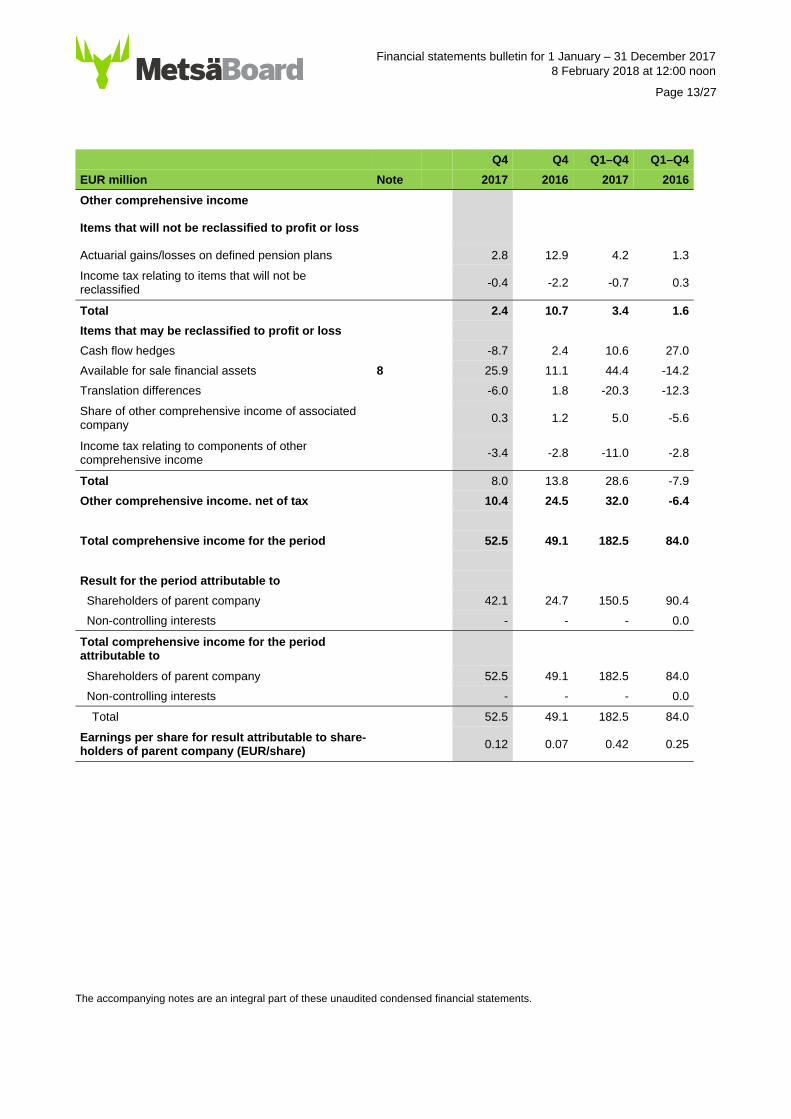
EUR million Note 2017 2016 2017 2016
Other comprehensive income
Items that will not be reclassified to profit or loss
Actuarial gains/losses on defined pension plans 2.8 12.9 4.2 1.3
Income tax relating to items that will not be reclassified
-0.4 -2.2 -0.7 0.3
Total 2.4 10.7 3.4 1.6
Items that may be reclassified to profit or loss
Cash flow hedges -8.7 2.4 10.6 27.0
Available for sale financial assets 8 25.9 11.1 44.4 -14.2
Translation differences -6.0 1.8 -20.3 -12.3
Share of other comprehensive income of associated company
0.3 1.2 5.0 -5.6
Income tax relating to components of other comprehensive income
-3.4 -2.8 -11.0 -2.8
Total 8.0 13.8 28.6 -7.9
Other comprehensive income. net of tax 10.4 24.5 32.0 -6.4
Total comprehensive income for the period 52.5 49.1 182.5 84.0
Result for the period attributable to
Shareholders of parent company 42.1 24.7 150.5 90.4
Non-controlling interests - - - 0.0
Total comprehensive income for the period attributable to
Shareholders of parent company 52.5 49.1 182.5 84.0
Non-controlling interests - - - 0.0
Total 52.5 49.1 182.5 84.0
Earnings per share for result attributable to share-holders of parent company (EUR/share)
0.12 0.07 0.42 0.25
The accompanying notes are an integral part of these unaudited condensed financial statements.
Financial statements bulletin for 1 January – 31 December 2017 8 February 2018 at 12:00 noon
Page 14/27
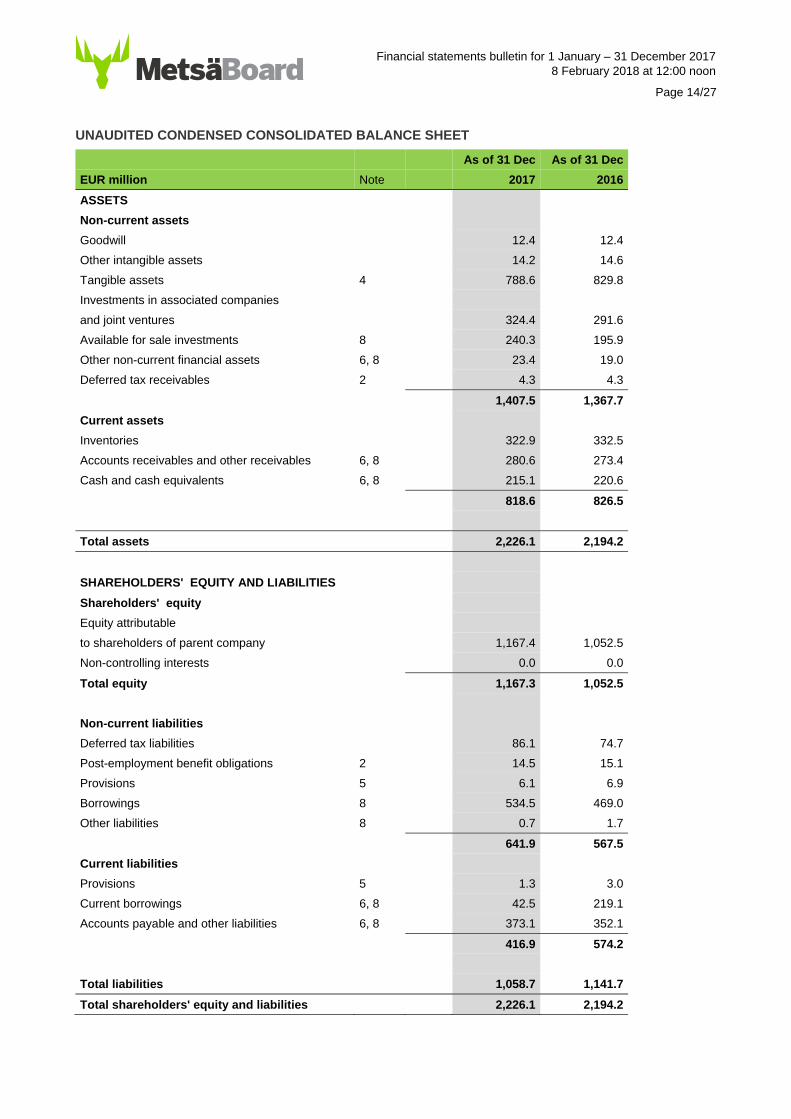
UNAUDITED CONDENSED CONSOLIDATED BALANCE SHEET
As of 31 Dec As of 31 Dec
EUR million Note 2017 2016
ASSETS
Non-current assets
Goodwill 12.4 12.4
Other intangible assets 14.2 14.6
Tangible assets 4 788.6 829.8
Investments in associated companies
and joint ventures 324.4 291.6
Available for sale investments 8 240.3 195.9
Other non-current financial assets 6, 8 23.4 19.0
Deferred tax receivables 2 4.3 4.3 1,407.5 1,367.7
Current assets
Inventories 322.9 332.5
Accounts receivables and other receivables 6, 8 280.6 273.4
Cash and cash equivalents 6, 8 215.1 220.6 818.6 826.5
Total assets 2,226.1 2,194.2
SHAREHOLDERS' EQUITY AND LIABILITIES
Shareholders' equity
Equity attributable
to shareholders of parent company 1,167.4 1,052.5
Non-controlling interests 0.0 0.0
Total equity 1,167.3 1,052.5
Non-current liabilities
Deferred tax liabilities 86.1 74.7
Post-employment benefit obligations 2 14.5 15.1
Provisions 5 6.1 6.9
Borrowings 8 534.5 469.0
Other liabilities 8 0.7 1.7 641.9 567.5
Current liabilities
Provisions 5 1.3 3.0
Current borrowings 6, 8 42.5 219.1
Accounts payable and other liabilities 6, 8 373.1 352.1 416.9 574.2
Total liabilities 1,058.7 1,141.7
Total shareholders' equity and liabilities 2,226.1 2,194.2
Financial statements bulletin for 1 January – 31 December 2017 8 February 2018 at 12:00 noon
Page 15/27
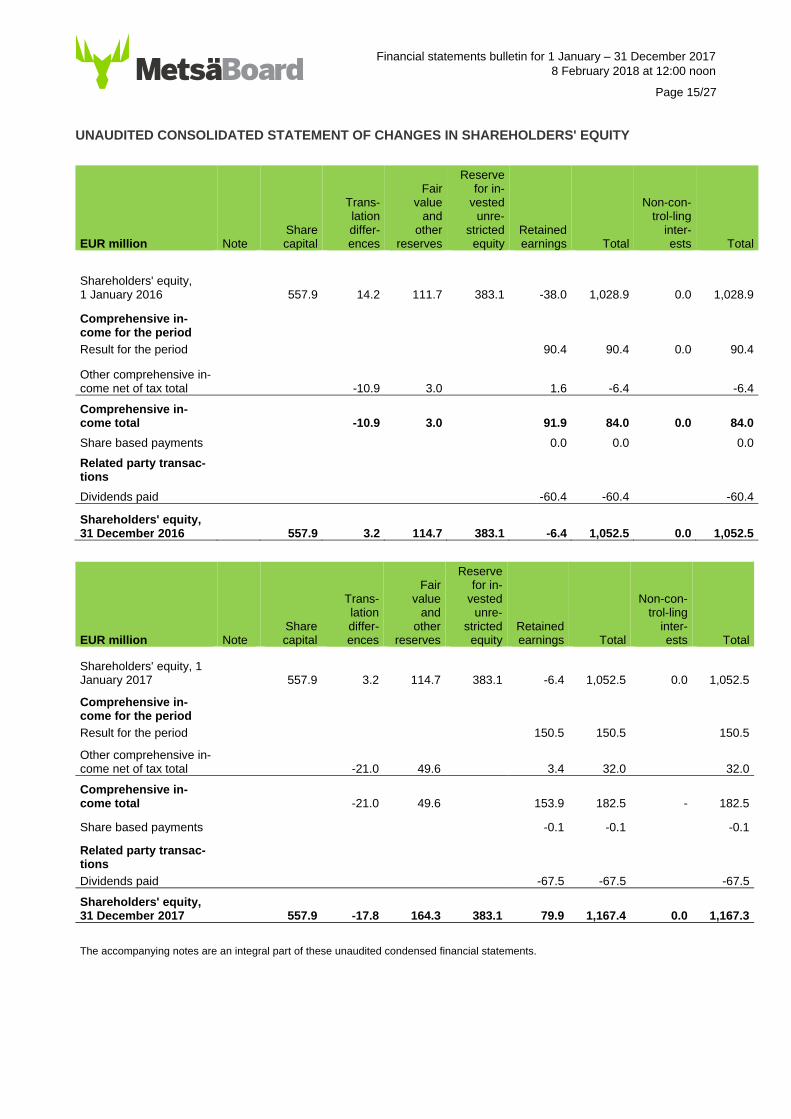
UNAUDITED CONSOLIDATED STATEMENT OF CHANGES IN SHAREHOLDERS' EQUITY
EUR million Note Share capital
Trans- lation differ- ences
Fair value
and other
reserves
Reserve for in-
vested unre-
stricted equity
Retained earnings Total
Non-con-trol-ling
inter- ests Total
Shareholders' equity, 1 January 2016 557.9 14.2 111.7 383.1 -38.0 1,028.9 0.0 1,028.9
Comprehensive in-come for the period Result for the period 90.4 90.4 0.0 90.4
Other comprehensive in-come net of tax total -10.9 3.0 1.6 -6.4 -6.4
Comprehensive in-come total -10.9 3.0 91.9 84.0 0.0 84.0
Share based payments 0.0 0.0 0.0
Related party transac-tions
Dividends paid -60.4 -60.4 -60.4
Shareholders' equity, 31 December 2016 557.9 3.2 114.7 383.1 -6.4 1,052.5 0.0 1,052.5
EUR million Note Share capital
Trans- lation differ- ences
Fair value
and other
reserves
Reserve for in-
vested unre-
stricted equity
Retained earnings Total
Non-con-trol-ling
inter- ests Total
Shareholders' equity, 1 January 2017 557.9 3.2 114.7 383.1 -6.4 1,052.5 0.0 1,052.5
Comprehensive in-come for the period Result for the period 150.5 150.5 150.5
Other comprehensive in-come net of tax total -21.0 49.6 3.4 32.0 32.0
Comprehensive in-come total -21.0 49.6 153.9 182.5 - 182.5
Share based payments -0.1 -0.1 -0.1
Related party transac-tions Dividends paid -67.5 -67.5 -67.5
Shareholders' equity, 31 December 2017 557.9 -17.8 164.3 383.1 79.9 1,167.4 0.0 1,167.3
The accompanying notes are an integral part of these unaudited condensed financial statements.
Financial statements bulletin for 1 January – 31 December 2017 8 February 2018 at 12:00 noon
Page 16/27
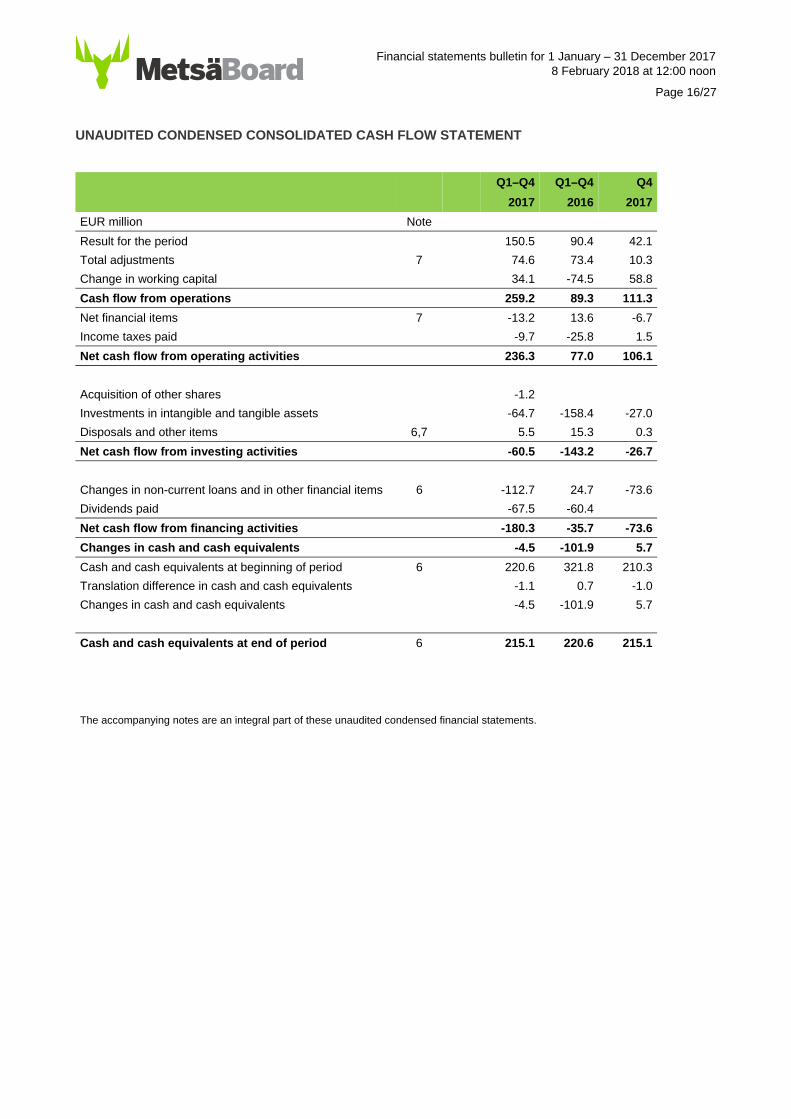
UNAUDITED CONDENSED CONSOLIDATED CASH FLOW STATEMENT
Q1–Q4 Q1–Q4 Q4
2017 2016 2017
EUR million Note
Result for the period 150.5 90.4 42.1
Total adjustments 7 74.6 73.4 10.3
Change in working capital 34.1 -74.5 58.8
Cash flow from operations 259.2 89.3 111.3
Net financial items 7 -13.2 13.6 -6.7
Income taxes paid -9.7 -25.8 1.5
Net cash flow from operating activities 236.3 77.0 106.1
Acquisition of other shares -1.2
Investments in intangible and tangible assets -64.7 -158.4 -27.0
Disposals and other items 6,7 5.5 15.3 0.3
Net cash flow from investing activities -60.5 -143.2 -26.7
Changes in non-current loans and in other financial items 6 -112.7 24.7 -73.6
Dividends paid -67.5 -60.4
Net cash flow from financing activities -180.3 -35.7 -73.6
Changes in cash and cash equivalents -4.5 -101.9 5.7
Cash and cash equivalents at beginning of period 6 220.6 321.8 210.3
Translation difference in cash and cash equivalents -1.1 0.7 -1.0
Changes in cash and cash equivalents -4.5 -101.9 5.7
Cash and cash equivalents at end of period 6 215.1 220.6 215.1
The accompanying notes are an integral part of these unaudited condensed financial statements.
Financial statements bulletin for 1 January – 31 December 2017 8 February 2018 at 12:00 noon
Page 17/27
NOTES TO THE UNAUDITED INTERIM FINANCIAL REPORT
NOTE 1 – BACKGROUND AND BASIS OF PREPARATION
Metsä Board Corporation and its subsidiaries comprise a forest industry group whose main product areas are fresh fibre cartonboards and linerboards. Metsä Board Corporation, the parent company, is domiciled in Hel-sinki and the registered address of the company is Revontulenpuisto 2, 02100 Espoo, Finland. Metsä Board’s ultimate parent company is Metsäliitto Cooper-ative.
This unaudited financial statements bulletin has been prepared in accordance with IAS 34, Interim Financial Reporting, and it should be read in conjunction with the 2016 IFRS financial statements. The same accounting policies have been applied as in the 2016 IFRS finan-cial statements with the following exception:
Depreciation of machinery and equipment during the fi-nancial year has been adjusted between the quarters when applicable in order to correspond with the use of the economic benefit of the asset.
The Group has adopted the following new standards and amendments to existing standards on 1 January 2017:
Amendments to IAS 7 Statement of Cash Flows – Dis-closure Initiative. The changes were made to enable users of financial statements to evaluate changes in lia-bilities arising from financing activities, including both changes arising from cash flow and non-cash changes. The amendments have an impact on the disclosures in consolidated financial statements.
Amendments to IAS 12 Income Taxes - Recognition of Deferred Tax Assets for Unrealised Losses. The amendments clarify that the existence of a deductible temporary difference depends solely on a comparison of the carrying amount of an asset and its tax base at
the end of the reporting period, and is not affected by possible future changes in the carrying amount or ex-pected manner of recovery of the asset. The amend-ments have no significant impact on Group’s consoli-dated financial statements.
Annual Improvements to IFRSs (2014–2016 cycle): The annual improvements process provides a mechanism for minor and non-urgent amendments to IFRSs to be grouped together and issued in one package annually. In 2017, the amendmends apply to one standard, and they do not have a significant impact on Group’s con-solidated financial statements.
All amounts are presented in millions of euros, unless otherwise stated.
This financial statements bulletin was authorised for is-sue by the Board of Directors of Metsä Board on 8 Feb-ruary 2018.
NOTE 2 – SEGMENT INFORMATION
The Corporate Management Team is the chief opera-tional decision-maker monitoring business operations performance based on the operating segments.
After Metsä Board’s uncoated paper production ended in July 2016, the remaining business operations of the Group consist solely of folding boxboard, fresh fibre lin-erboard and market pulp businesses previously re-ported under Paperboard segment and complemented by the discontinued wallpaper base production at Kyro mill. As the paper business previously reported under Non-core operations segment has been fully discontin-ued, Metsä Board will report on its financial perfor-mance using only one reporting segment starting from third quarter of 2016.
Financial statements bulletin for 1 January – 31 December 2017 8 February 2018 at 12:00 noon
Page 18/27
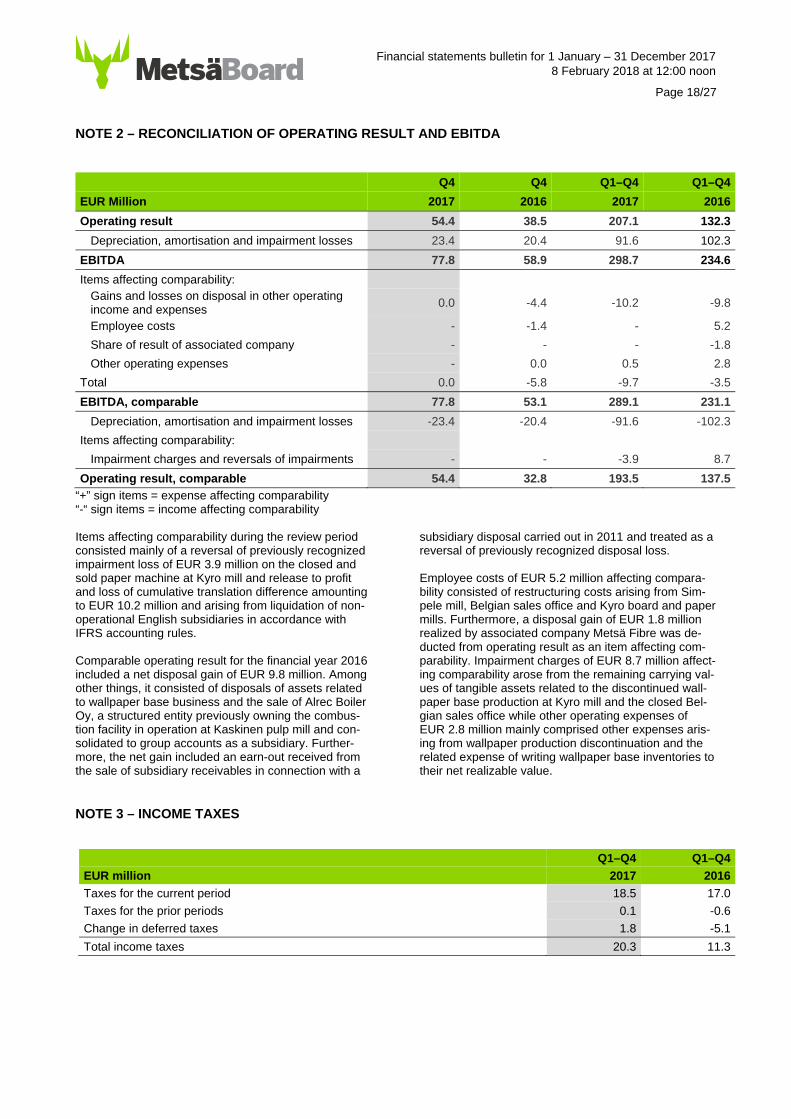
NOTE 2 – RECONCILIATION OF OPERATING RESULT AND EBITDA
“+” sign items = expense affecting comparability “-“ sign items = income affecting comparability Items affecting comparability during the review period consisted mainly of a reversal of previously recognized impairment loss of EUR 3.9 million on the closed and sold paper machine at Kyro mill and release to profit and loss of cumulative translation difference amounting to EUR 10.2 million and arising from liquidation of non-operational English subsidiaries in accordance with IFRS accounting rules. Comparable operating result for the financial year 2016 included a net disposal gain of EUR 9.8 million. Among other things, it consisted of disposals of assets related to wallpaper base business and the sale of Alrec Boiler Oy, a structured entity previously owning the combus-tion facility in operation at Kaskinen pulp mill and con-solidated to group accounts as a subsidiary. Further-more, the net gain included an earn-out received from the sale of subsidiary receivables in connection with a
subsidiary disposal carried out in 2011 and treated as a reversal of previously recognized disposal loss. Employee costs of EUR 5.2 million affecting compara-bility consisted of restructuring costs arising from Sim-pele mill, Belgian sales office and Kyro board and paper mills. Furthermore, a disposal gain of EUR 1.8 million realized by associated company Metsä Fibre was de-ducted from operating result as an item affecting com-parability. Impairment charges of EUR 8.7 million affect-ing comparability arose from the remaining carrying val-ues of tangible assets related to the discontinued wall-paper base production at Kyro mill and the closed Bel-gian sales office while other operating expenses of EUR 2.8 million mainly comprised other expenses aris-ing from wallpaper production discontinuation and the related expense of writing wallpaper base inventories to their net realizable value.
NOTE 3 – INCOME TAXES
Q1–Q4 Q1–Q4
EUR million 2017 2016
Taxes for the current period 18.5 17.0
Taxes for the prior periods 0.1 -0.6
Change in deferred taxes 1.8 -5.1
Total income taxes 20.3 11.3
Q4 Q4 Q1–Q4 Q1–Q4
EUR Million 2017 2016 2017 2016
Operating result 54.4 38.5 207.1 132.3
Depreciation, amortisation and impairment losses 23.4 20.4 91.6 102.3
EBITDA 77.8 58.9 298.7 234.6
Items affecting comparability: Gains and losses on disposal in other operating income and expenses
0.0 -4.4 -10.2 -9.8
Employee costs - -1.4 - 5.2
Share of result of associated company - - - -1.8
Other operating expenses - 0.0 0.5 2.8
Total 0.0 -5.8 -9.7 -3.5
EBITDA, comparable 77.8 53.1 289.1 231.1
Depreciation, amortisation and impairment losses -23.4 -20.4 -91.6 -102.3
Items affecting comparability:
Impairment charges and reversals of impairments - - -3.9 8.7
Operating result, comparable 54.4 32.8 193.5 137.5
Financial statements bulletin for 1 January – 31 December 2017 8 February 2018 at 12:00 noon
Page 19/27
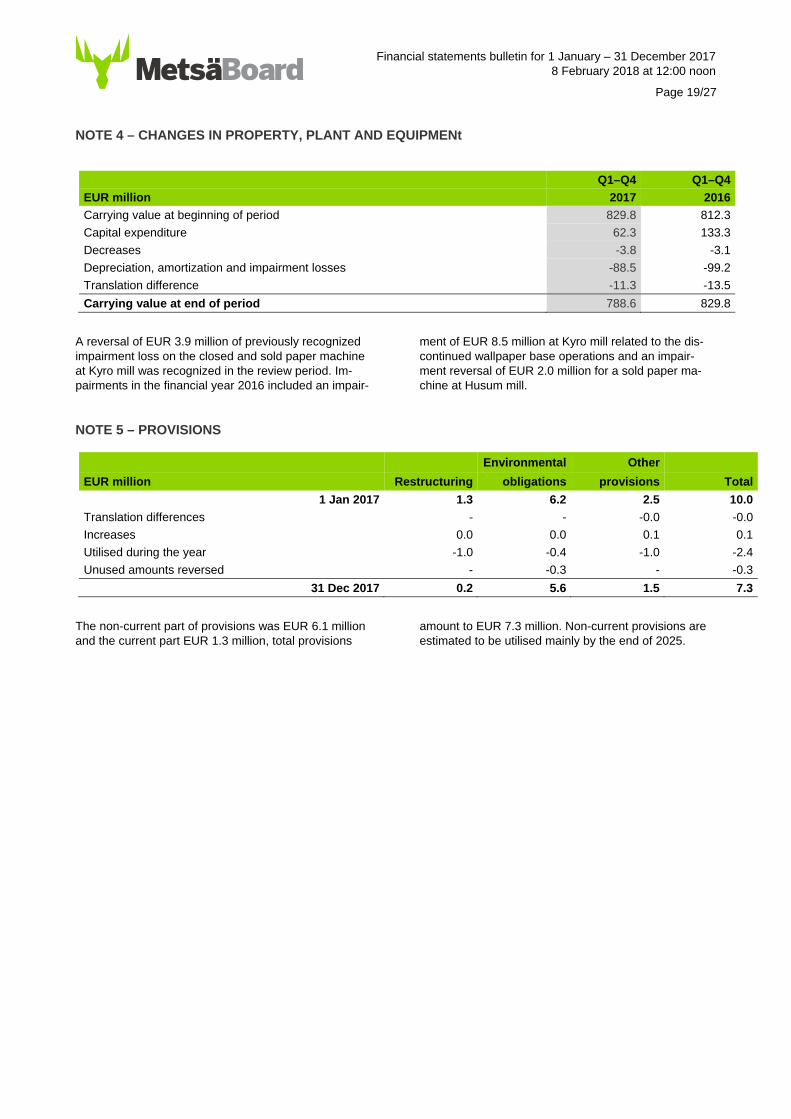
NOTE 4 – CHANGES IN PROPERTY, PLANT AND EQUIPMENt
Q1–Q4 Q1–Q4
EUR million 2017 2016
Carrying value at beginning of period 829.8 812.3
Capital expenditure 62.3 133.3
Decreases -3.8 -3.1
Depreciation, amortization and impairment losses -88.5 -99.2
Translation difference -11.3 -13.5
Carrying value at end of period 788.6 829.8
A reversal of EUR 3.9 million of previously recognized impairment loss on the closed and sold paper machine at Kyro mill was recognized in the review period. Im-pairments in the financial year 2016 included an impair-
ment of EUR 8.5 million at Kyro mill related to the dis-continued wallpaper base operations and an impair-ment reversal of EUR 2.0 million for a sold paper ma-chine at Husum mill.
NOTE 5 – PROVISIONS
Environmental Other
EUR million Restructuring obligations provisions Total
1 Jan 2017 1.3 6.2 2.5 10.0
Translation differences - - -0.0 -0.0
Increases 0.0 0.0 0.1 0.1
Utilised during the year -1.0 -0.4 -1.0 -2.4
Unused amounts reversed - -0.3 - -0.3
31 Dec 2017 0.2 5.6 1.5 7.3
The non-current part of provisions was EUR 6.1 million and the current part EUR 1.3 million, total provisions
amount to EUR 7.3 million. Non-current provisions are estimated to be utilised mainly by the end of 2025.
Financial statements bulletin for 1 January – 31 December 2017 8 February 2018 at 12:00 noon
Page 20/27
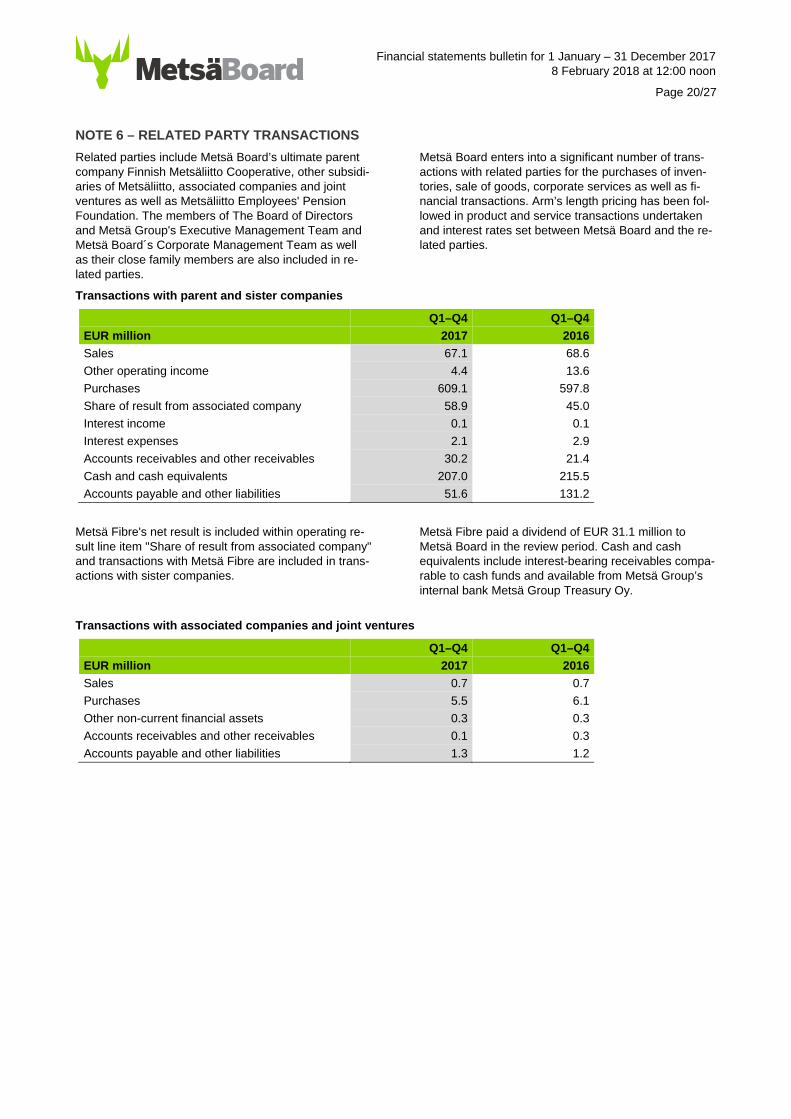
NOTE 6 – RELATED PARTY TRANSACTIONS
Related parties include Metsä Board’s ultimate parent company Finnish Metsäliitto Cooperative, other subsidi-aries of Metsäliitto, associated companies and joint ventures as well as Metsäliitto Employees' Pension Foundation. The members of The Board of Directors and Metsä Group's Executive Management Team and Metsä Board´s Corporate Management Team as well as their close family members are also included in re-lated parties.
Metsä Board enters into a significant number of trans-actions with related parties for the purchases of inven-tories, sale of goods, corporate services as well as fi-nancial transactions. Arm’s length pricing has been fol-lowed in product and service transactions undertaken and interest rates set between Metsä Board and the re-lated parties.
Transactions with parent and sister companies
Q1–Q4 Q1–Q4
EUR million 2017 2016
Sales 67.1 68.6
Other operating income 4.4 13.6
Purchases 609.1 597.8
Share of result from associated company 58.9 45.0
Interest income 0.1 0.1
Interest expenses 2.1 2.9
Accounts receivables and other receivables 30.2 21.4
Cash and cash equivalents 207.0 215.5
Accounts payable and other liabilities 51.6 131.2
Metsä Fibre's net result is included within operating re-sult line item "Share of result from associated company" and transactions with Metsä Fibre are included in trans-actions with sister companies.
Metsä Fibre paid a dividend of EUR 31.1 million to Metsä Board in the review period. Cash and cash equivalents include interest-bearing receivables compa-rable to cash funds and available from Metsä Group’s internal bank Metsä Group Treasury Oy.
Transactions with associated companies and joint ventures
Q1–Q4 Q1–Q4
EUR million 2017 2016
Sales 0.7 0.7
Purchases 5.5 6.1
Other non-current financial assets 0.3 0.3
Accounts receivables and other receivables 0.1 0.3
Accounts payable and other liabilities 1.3 1.2
Financial statements bulletin for 1 January – 31 December 2017 8 February 2018 at 12:00 noon
Page 21/27
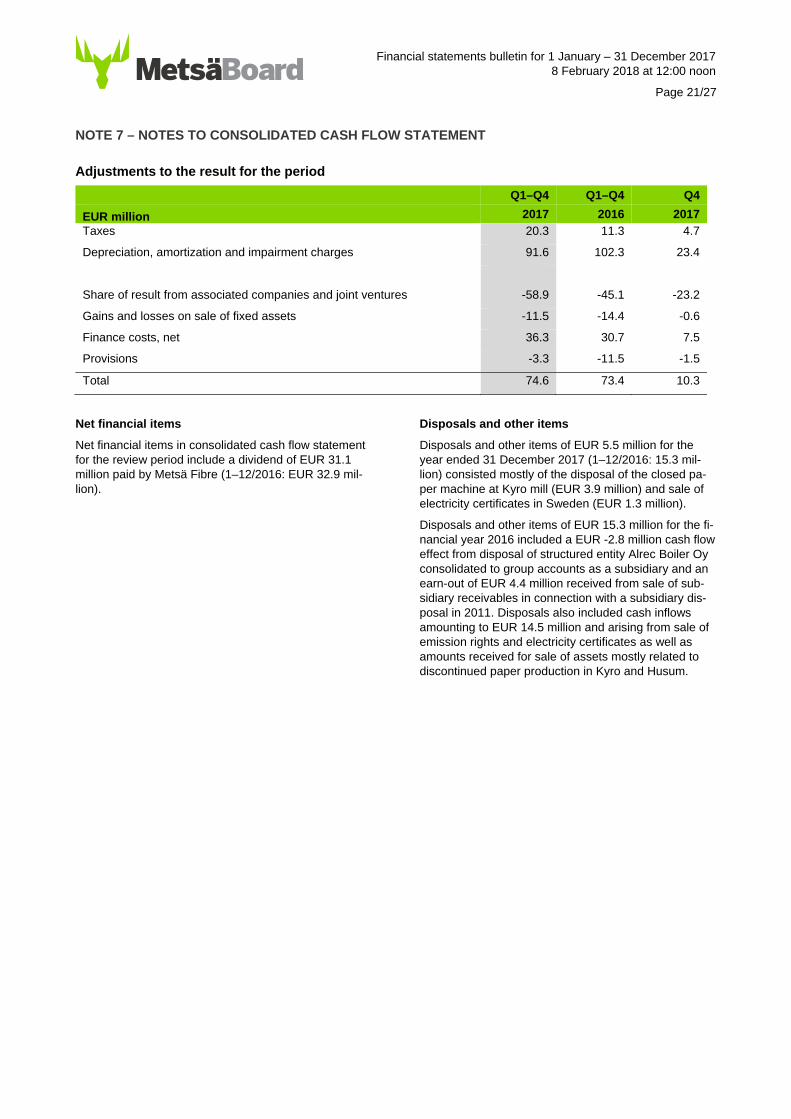
NOTE 7 – NOTES TO CONSOLIDATED CASH FLOW STATEMENT
Adjustments to the result for the period
Net financial items
Net financial items in consolidated cash flow statement for the review period include a dividend of EUR 31.1 million paid by Metsä Fibre (1–12/2016: EUR 32.9 mil-lion).
Disposals and other items
Disposals and other items of EUR 5.5 million for the year ended 31 December 2017 (1–12/2016: 15.3 mil-lion) consisted mostly of the disposal of the closed pa-per machine at Kyro mill (EUR 3.9 million) and sale of electricity certificates in Sweden (EUR 1.3 million).
Disposals and other items of EUR 15.3 million for the fi-nancial year 2016 included a EUR -2.8 million cash flow effect from disposal of structured entity Alrec Boiler Oy consolidated to group accounts as a subsidiary and an earn-out of EUR 4.4 million received from sale of sub-sidiary receivables in connection with a subsidiary dis-posal in 2011. Disposals also included cash inflows amounting to EUR 14.5 million and arising from sale of emission rights and electricity certificates as well as amounts received for sale of assets mostly related to discontinued paper production in Kyro and Husum.
Q1–Q4 Q1–Q4 Q4
EUR million 2017 2016 2017
Taxes 20.3 11.3 4.7
Depreciation, amortization and impairment charges 91.6 102.3 23.4
Share of result from associated companies and joint ventures -58.9 -45.1 -23.2
Gains and losses on sale of fixed assets -11.5 -14.4 -0.6
Finance costs, net 36.3 30.7 7.5
Provisions -3.3 -11.5 -1.5
Total 74.6 73.4 10.3
Financial statements bulletin for 1 January – 31 December 2017 8 February 2018 at 12:00 noon
Page 22/27
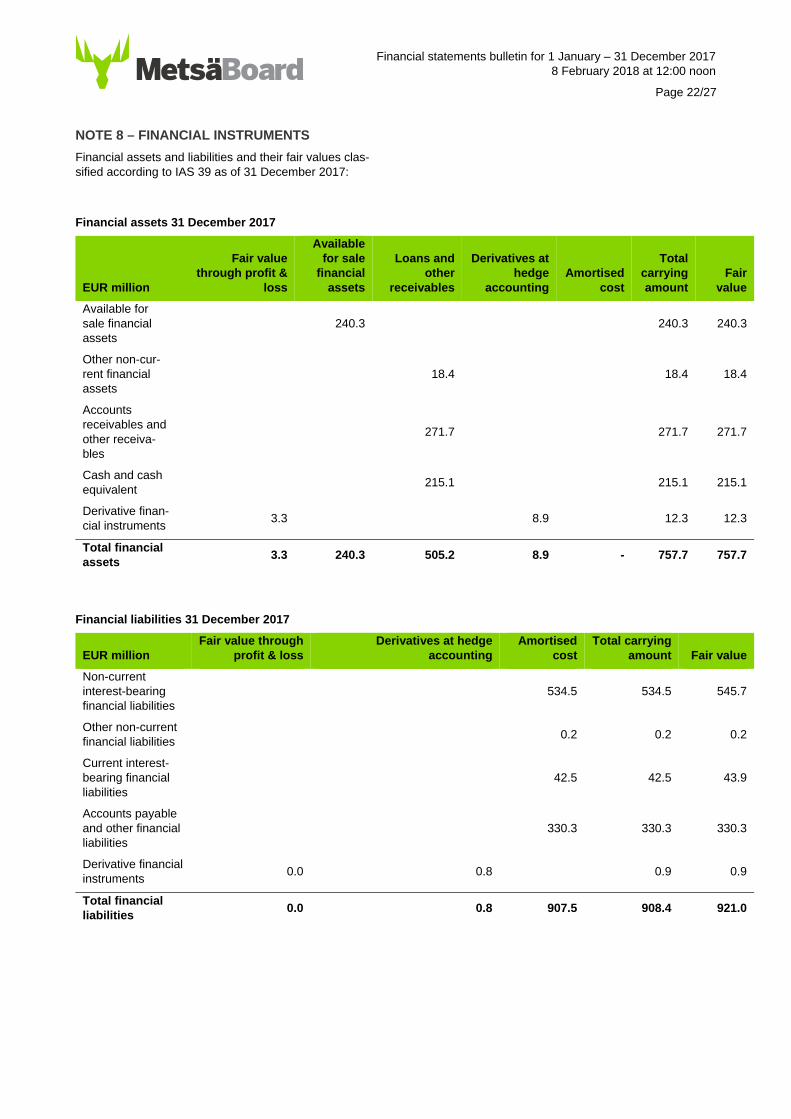
NOTE 8 – FINANCIAL INSTRUMENTS
Financial assets and liabilities and their fair values clas-sified according to IAS 39 as of 31 December 2017:
Financial assets 31 December 2017
EUR million
Fair value through profit &
loss
Available for sale
financial assets
Loans and other
receivables
Derivatives at hedge
accounting Amortised
cost
Total carrying amount
Fair value
Available for sale financial assets
240.3 240.3 240.3
Other non-cur-rent financial assets
18.4 18.4 18.4
Accounts receivables and other receiva-bles
271.7 271.7 271.7
Cash and cash equivalent
215.1 215.1 215.1
Derivative finan-cial instruments
3.3 8.9 12.3 12.3
Total financial assets
3.3 240.3 505.2 8.9 - 757.7 757.7
Financial liabilities 31 December 2017
EUR million Fair value through
profit & loss Derivatives at hedge
accounting Amortised
cost Total carrying
amount Fair value
Non-current interest-bearing financial liabilities
534.5 534.5 545.7
Other non-current financial liabilities
0.2 0.2 0.2
Current interest-bearing financial liabilities
42.5 42.5 43.9
Accounts payable and other financial liabilities
330.3 330.3 330.3
Derivative financial instruments
0.0 0.8 0.9 0.9
Total financial liabilities
0.0 0.8 907.5 908.4 921.0
Financial statements bulletin for 1 January – 31 December 2017 8 February 2018 at 12:00 noon
Page 23/27
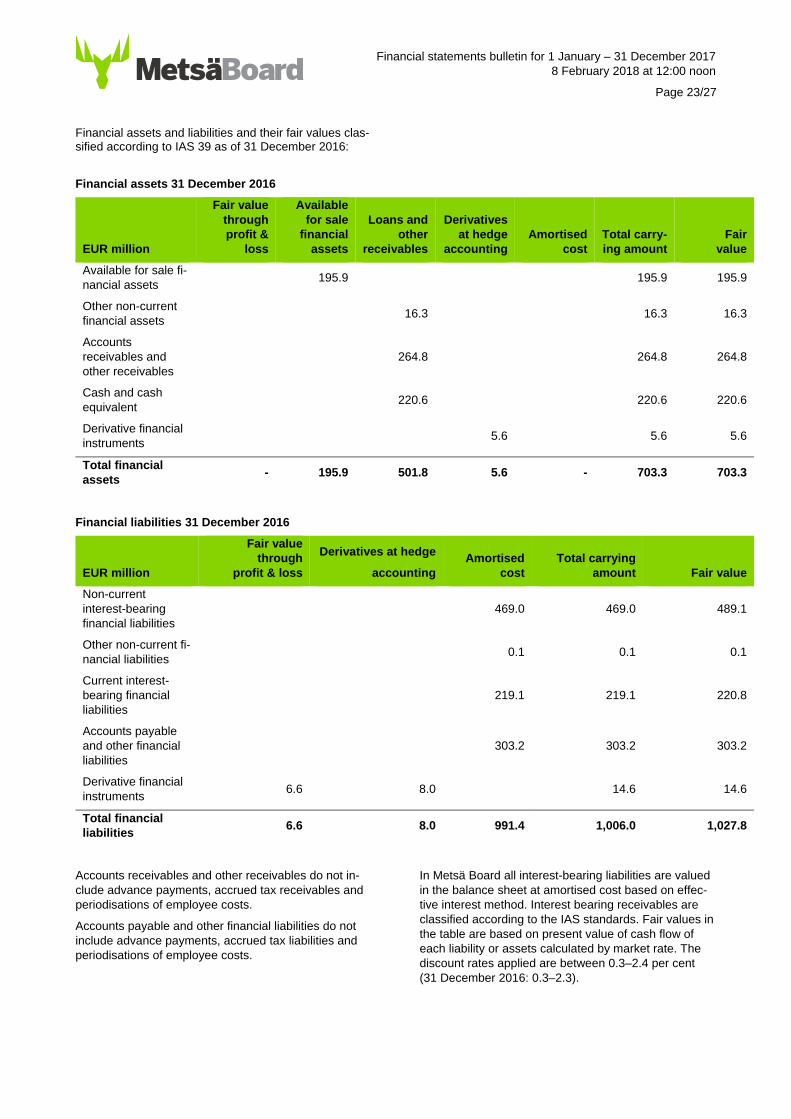
Financial assets and liabilities and their fair values clas-sified according to IAS 39 as of 31 December 2016:
Financial assets 31 December 2016
EUR million
Fair value through profit &
loss
Available for sale
financial assets
Loans and other
receivables
Derivatives at hedge
accounting Amortised
cost Total carry-ing amount
Fair value
Available for sale fi-nancial assets
195.9 195.9 195.9
Other non-current financial assets
16.3 16.3 16.3
Accounts receivables and other receivables
264.8 264.8 264.8
Cash and cash equivalent
220.6 220.6 220.6
Derivative financial instruments
5.6 5.6 5.6
Total financial assets
- 195.9 501.8 5.6 - 703.3 703.3
Financial liabilities 31 December 2016
EUR million
Fair value through
profit & loss
Derivatives at hedge
accounting Amortised
cost Total carrying
amount Fair value
Non-current interest-bearing financial liabilities
469.0 469.0 489.1
Other non-current fi-nancial liabilities
0.1 0.1 0.1
Current interest-bearing financial liabilities
219.1 219.1 220.8
Accounts payable and other financial liabilities
303.2 303.2 303.2
Derivative financial instruments
6.6 8.0 14.6 14.6
Total financial liabilities
6.6 8.0 991.4 1,006.0 1,027.8
Accounts receivables and other receivables do not in-clude advance payments, accrued tax receivables and periodisations of employee costs.
Accounts payable and other financial liabilities do not include advance payments, accrued tax liabilities and periodisations of employee costs.
In Metsä Board all interest-bearing liabilities are valued in the balance sheet at amortised cost based on effec-tive interest method. Interest bearing receivables are classified according to the IAS standards. Fair values in the table are based on present value of cash flow of each liability or assets calculated by market rate. The discount rates applied are between 0.3–2.4 per cent (31 December 2016: 0.3–2.3).
Financial statements bulletin for 1 January – 31 December 2017 8 February 2018 at 12:00 noon
Page 24/27
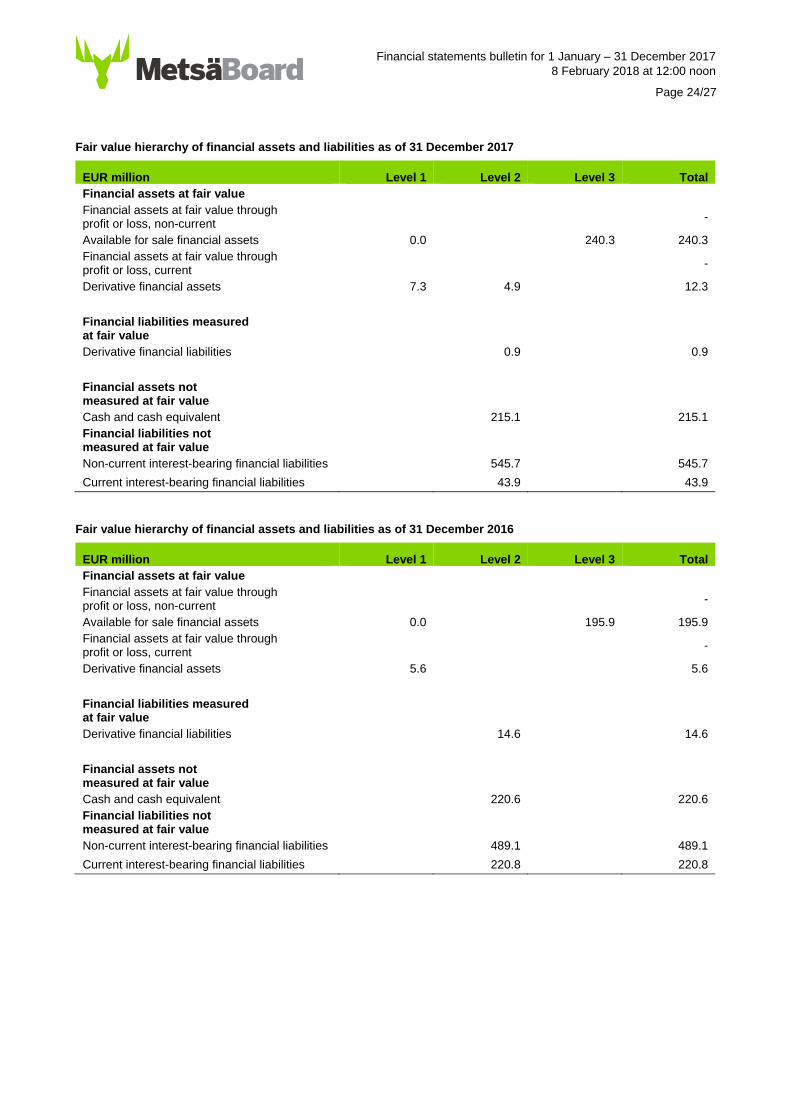
Fair value hierarchy of financial assets and liabilities as of 31 December 2017
EUR million Level 1 Level 2 Level 3 Total Financial assets at fair value Financial assets at fair value through profit or loss, non-current
-
Available for sale financial assets 0.0 240.3 240.3 Financial assets at fair value through profit or loss, current
-
Derivative financial assets 7.3 4.9 12.3
Financial liabilities measured at fair value
Derivative financial liabilities 0.9 0.9
Financial assets not measured at fair value
Cash and cash equivalent 215.1 215.1 Financial liabilities not measured at fair value
Non-current interest-bearing financial liabilities 545.7 545.7
Current interest-bearing financial liabilities 43.9 43.9
Fair value hierarchy of financial assets and liabilities as of 31 December 2016
EUR million Level 1 Level 2 Level 3 Total Financial assets at fair value Financial assets at fair value through profit or loss, non-current
-
Available for sale financial assets 0.0 195.9 195.9 Financial assets at fair value through profit or loss, current
-
Derivative financial assets 5.6 5.6
Financial liabilities measured at fair value
Derivative financial liabilities 14.6 14.6
Financial assets not measured at fair value
Cash and cash equivalent 220.6 220.6 Financial liabilities not measured at fair value
Non-current interest-bearing financial liabilities 489.1 489.1
Current interest-bearing financial liabilities 220.8 220.8
Financial statements bulletin for 1 January – 31 December 2017 8 February 2018 at 12:00 noon
Page 25/27
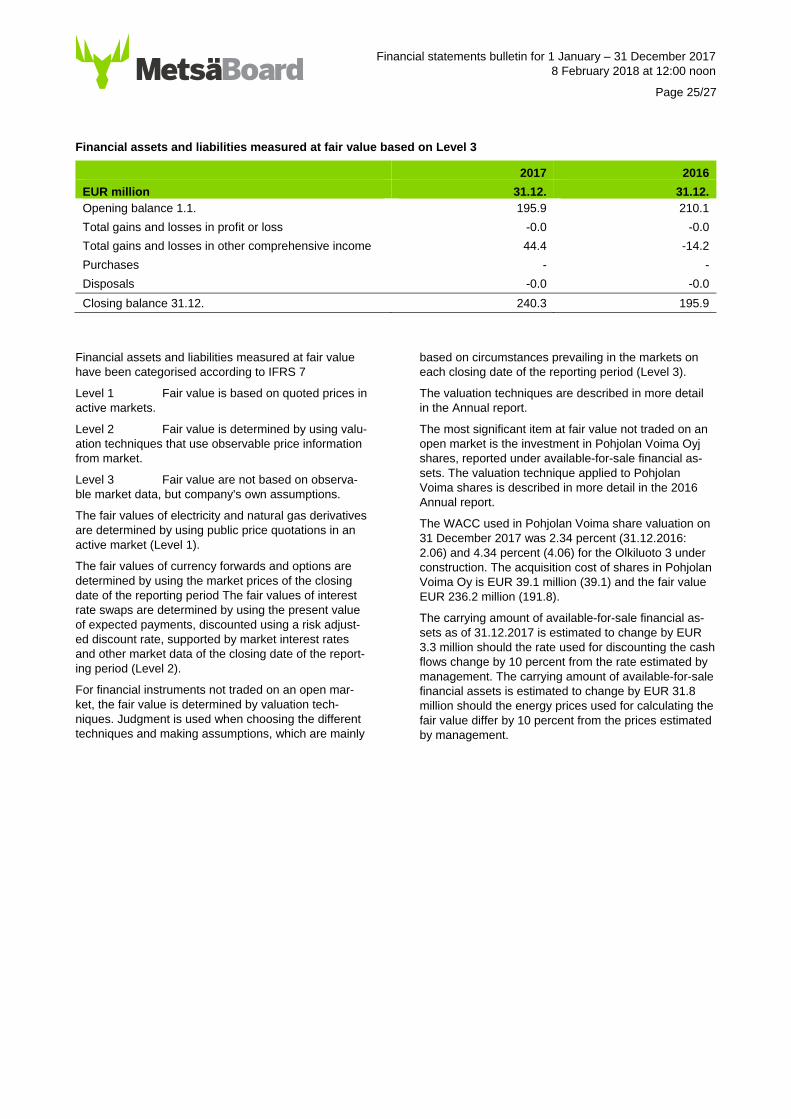
Financial assets and liabilities measured at fair value based on Level 3
2017 2016
EUR million 31.12. 31.12. Opening balance 1.1. 195.9 210.1
Total gains and losses in profit or loss -0.0 -0.0
Total gains and losses in other comprehensive income 44.4 -14.2
Purchases - -
Disposals -0.0 -0.0
Closing balance 31.12. 240.3 195.9
Financial assets and liabilities measured at fair value have been categorised according to IFRS 7
Level 1 Fair value is based on quoted prices in active markets.
Level 2 Fair value is determined by using valu-ation techniques that use observable price information from market.
Level 3 Fair value are not based on observa-ble market data, but company's own assumptions.
The fair values of electricity and natural gas derivatives are determined by using public price quotations in an active market (Level 1).
The fair values of currency forwards and options are determined by using the market prices of the closing date of the reporting period The fair values of interest rate swaps are determined by using the present value of expected payments, discounted using a risk adjust-ed discount rate, supported by market interest rates and other market data of the closing date of the report-ing period (Level 2).
For financial instruments not traded on an open mar-ket, the fair value is determined by valuation tech-niques. Judgment is used when choosing the different techniques and making assumptions, which are mainly
based on circumstances prevailing in the markets on each closing date of the reporting period (Level 3).
The valuation techniques are described in more detail in the Annual report.
The most significant item at fair value not traded on an open market is the investment in Pohjolan Voima Oyj shares, reported under available-for-sale financial as-sets. The valuation technique applied to Pohjolan Voima shares is described in more detail in the 2016 Annual report.
The WACC used in Pohjolan Voima share valuation on 31 December 2017 was 2.34 percent (31.12.2016: 2.06) and 4.34 percent (4.06) for the Olkiluoto 3 under construction. The acquisition cost of shares in Pohjolan Voima Oy is EUR 39.1 million (39.1) and the fair value EUR 236.2 million (191.8).
The carrying amount of available-for-sale financial as-sets as of 31.12.2017 is estimated to change by EUR 3.3 million should the rate used for discounting the cash flows change by 10 percent from the rate estimated by management. The carrying amount of available-for-sale financial assets is estimated to change by EUR 31.8 million should the energy prices used for calculating the fair value differ by 10 percent from the prices estimated by management.
Financial statements bulletin for 1 January – 31 December 2017 8 February 2018 at 12:00 noon
Page 26/27
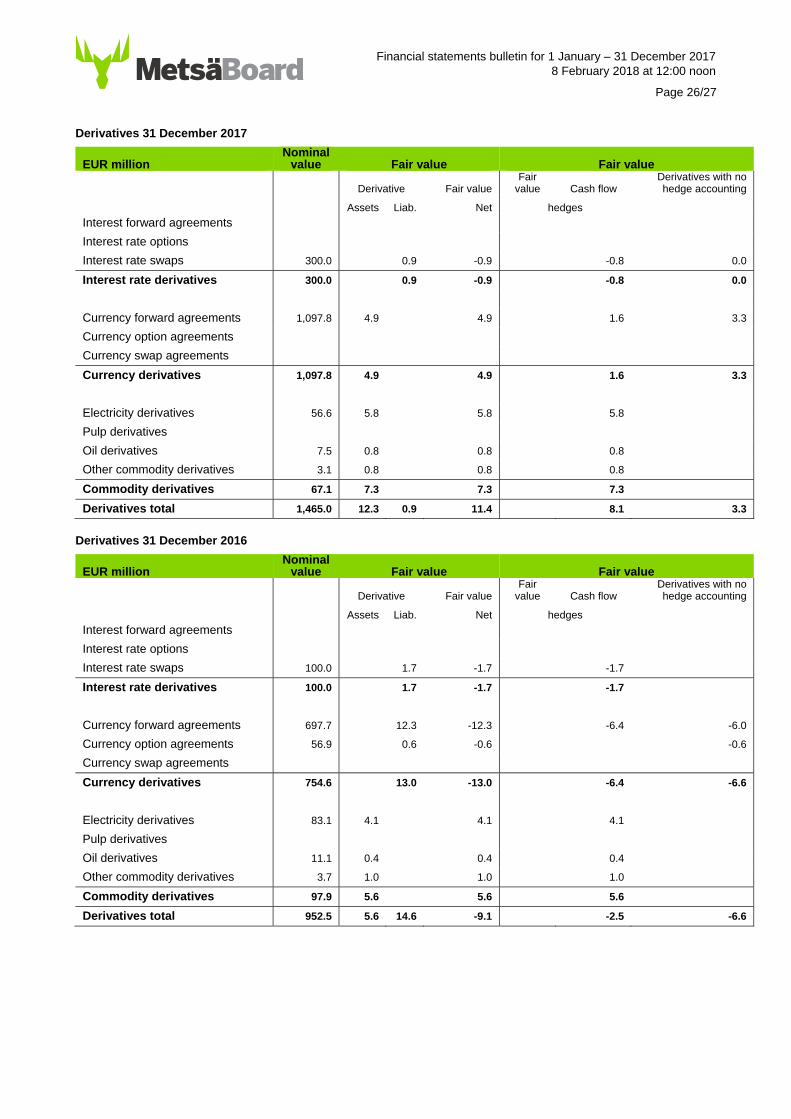
Derivatives 31 December 2017
EUR million Nominal
value Fair value Fair value
Derivative Fair value Fair
value Cash flow Derivatives with no hedge accounting
Assets Liab. Net hedges
Interest forward agreements
Interest rate options
Interest rate swaps 300.0 0.9 -0.9 -0.8 0.0
Interest rate derivatives 300.0 0.9 -0.9 -0.8 0.0
Currency forward agreements 1,097.8 4.9 4.9 1.6 3.3
Currency option agreements
Currency swap agreements
Currency derivatives 1,097.8 4.9 4.9 1.6 3.3
Electricity derivatives 56.6 5.8 5.8 5.8
Pulp derivatives
Oil derivatives 7.5 0.8 0.8 0.8
Other commodity derivatives 3.1 0.8 0.8 0.8
Commodity derivatives 67.1 7.3 7.3 7.3
Derivatives total 1,465.0 12.3 0.9 11.4 8.1 3.3
Derivatives 31 December 2016
EUR million Nominal
value Fair value Fair value
Derivative Fair value Fair
value Cash flow Derivatives with no hedge accounting
Assets Liab. Net hedges
Interest forward agreements
Interest rate options
Interest rate swaps 100.0 1.7 -1.7 -1.7
Interest rate derivatives 100.0 1.7 -1.7 -1.7
Currency forward agreements 697.7 12.3 -12.3 -6.4 -6.0
Currency option agreements 56.9 0.6 -0.6 -0.6
Currency swap agreements
Currency derivatives 754.6 13.0 -13.0 -6.4 -6.6
Electricity derivatives 83.1 4.1 4.1 4.1
Pulp derivatives
Oil derivatives 11.1 0.4 0.4 0.4
Other commodity derivatives 3.7 1.0 1.0 1.0
Commodity derivatives 97.9 5.6 5.6 5.6
Derivatives total 952.5 5.6 14.6 -9.1 -2.5 -6.6
Financial statements bulletin for 1 January – 31 December 2017 8 February 2018 at 12:00 noon
Page 27/27
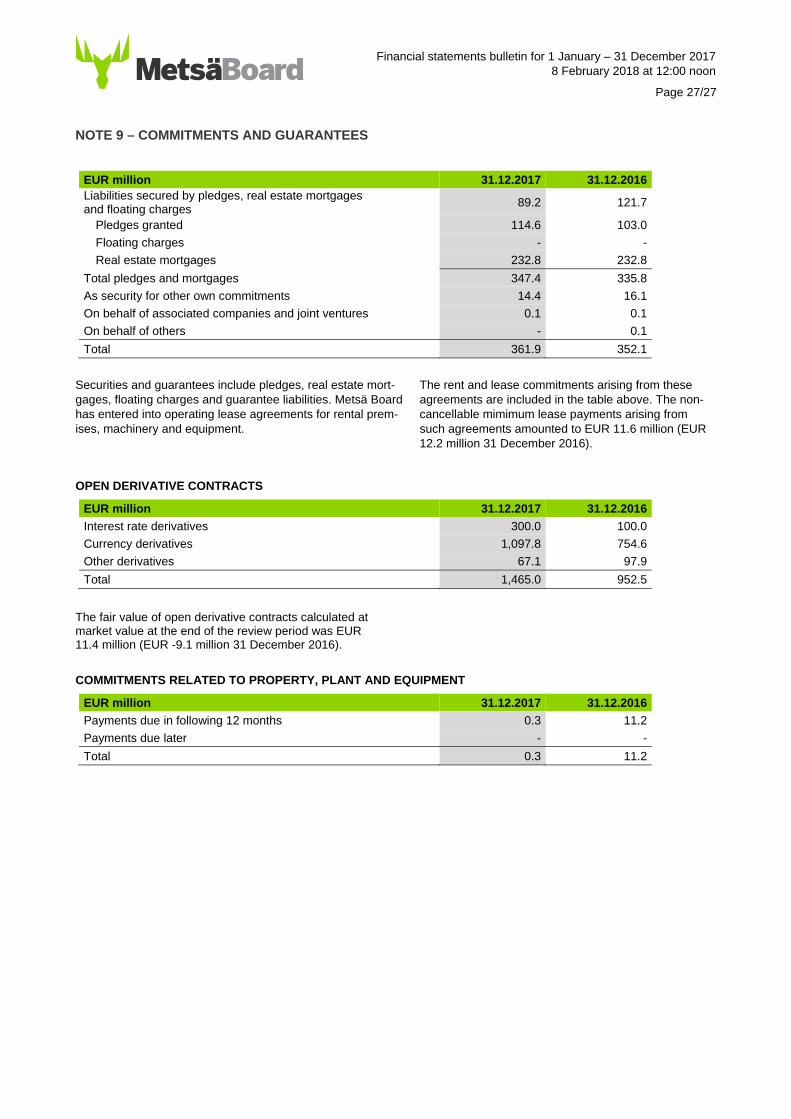
NOTE 9 – COMMITMENTS AND GUARANTEES
EUR million 31.12.2017 31.12.2016 Liabilities secured by pledges, real estate mortgages and floating charges
89.2 121.7
Pledges granted 114.6 103.0
Floating charges - -
Real estate mortgages 232.8 232.8
Total pledges and mortgages 347.4 335.8
As security for other own commitments 14.4 16.1
On behalf of associated companies and joint ventures 0.1 0.1
On behalf of others - 0.1
Total 361.9 352.1
Securities and guarantees include pledges, real estate mort-gages, floating charges and guarantee liabilities. Metsä Board has entered into operating lease agreements for rental prem-ises, machinery and equipment.
The rent and lease commitments arising from these agreements are included in the table above. The non-cancellable mimimum lease payments arising from such agreements amounted to EUR 11.6 million (EUR 12.2 million 31 December 2016).
OPEN DERIVATIVE CONTRACTS
EUR million 31.12.2017 31.12.2016
Interest rate derivatives 300.0 100.0
Currency derivatives 1,097.8 754.6
Other derivatives 67.1 97.9
Total 1,465.0 952.5
The fair value of open derivative contracts calculated at market value at the end of the review period was EUR 11.4 million (EUR -9.1 million 31 December 2016).
COMMITMENTS RELATED TO PROPERTY, PLANT AND EQUIPMENT
EUR million 31.12.2017 31.12.2016
Payments due in following 12 months 0.3 11.2
Payments due later - -
Total 0.3 11.2