financial statements bulletin
TRANSCRIPT
Qt Group Plc, Stock Exchange Release February 14, 2020 at 8:00 a.m.
Fourth quarter: Net sales increased by 51.8 percent – full-year growth was 28.0 percent op
Fiscal year 2019
• Net sales increased by 28.0 percent to EUR 58,373 thousand (45,590)*. At comparable exchange rates, net sales increased by 23.8 percent.
• Net sales of distribution licenses grew by 21.4 percent to EUR 14,556 thousand (11,990). • The operating result was EUR 219 thousand (-2,322). • The operating margin (EBIT-%) was 0.4 percent (-5.1 %). • Earnings per share were EUR -0.01 (-0.10).
October–December 2019
• Net sales increased by 51.8 percent to EUR 16,907 thousand (11,138)*. At comparable exchange rates, net sales increased by 49.3 percent.
• The operating result was EUR -48 thousand (-1,651). • The operating margin (EBIT-%) was -0.3 percent (-14.8 %). • Earnings per share were EUR -0.01 (-0.06).
Financial statements bulletin January 1–December 31, 2019
Financial statements bulletin January 1–December 31, 2019
2
* the figures in brackets refer to the comparison period, i.e. the corresponding period in the previous year. This financial statement bulletin was prepared in compliance with IAS 34 Interim Financial Reporting. The amounts from the financial statements presented in this bulletin are based on the company’s audited financial statements. The Auditor’s Report was issued on 13 February 2020.
BOARD OF DIRECTORS’ DIVIDEND PROPOSAL The Board of Directors of Qt Group Plc proposes to the Annual General Meeting that no dividend be paid for the fiscal year that ended on December 31, 2019.
Business Report
Financial performance: Qt’s net sales for the fourth quarter amounted to EUR 16,907 thousand (EUR 11,138 thousand), up 51.8 percent. License sales and consulting grew by 72.5 percent, while maintenance revenue increased by 16.2 percent. The effect of exchange rates on the comparison period’s net sales was EUR 187 thousand and at comparable exchange rates, net sales increased by 49.3 percent. Full-year net sales for 2019 increased by 28.0 percent year-on-year and amounted to EUR 58,373 thousand (EUR 45,590 thousand). License sales and consulting grew by 32.2 percent, while maintenance revenue increased by 19.5 percent. As part of license sales and consulting, the net sales of distribution licenses grew by 21.4 percent to EUR 14,556 thousand (EUR 11,990 thousand). The effect of exchange rates on the comparison period’s net sales was EUR 1,551 thousand and at comparable exchange rates, net sales increased by 23.8 percent. Qt’s operating result for the period under review October–December 2019 was EUR -48 thousand (EUR -1,651 thousand). The operating result for the financial year was EUR 219 thousand (EUR -2,322 thousand). Expenses for the period under review were particularly increased by subcontracting costs, which were allocated on product development and a performance-based bonus scheme for revenue growth. The Group had 340 employees at the end of 2019, compared to 306 a year earlier. The increase in the number of employees has been strongest in the Asian sales and consulting organization.
Juha Varelius, President and CEO: The fiscal year 2019 was a very successful one as a whole for Qt Group. The net sales saw strong growth and the operating result was positive. The increase in net sales was boosted by the strengthening of the US dollar against the euro, the effect on net sales being about EUR 1.6 million. About two-thirds of the sales of Qt are USD-based.
Financial statements bulletin January 1–December 31, 2019
3
Net sales growth accelerated further in the fourth quarter of 2019. Of particular note is that during the quarter, no exceptionally large license sales were recorded, but record net sales were generated from a number of transactions in all our geographical areas and in a variety of industries. In December, we launched a new Qt for MCUs solution that allows businesses to create flexible and intuitive interfaces for lower price category processors. The new solution utilises Qt Company's existing software tools and libraries. It enables companies to design better user experiences for displays that are supported by microcontrollers while reducing hardware costs. The Qt for MCUs solution further expands Qt's target market and provides a new growth area in the future. For the first time this November, we organized the Qt World Summit in Tokyo, in addition to the traditional Qt World Summit Berlin. The Tokyo event featured top-level customer and partner speeches by, for example, Amazon Web Service, Nikon, Suzuki, and Toyota, among others. Real-life customer examples illustrate how Qt helps companies in streamlining their software development processes, creating first-class user experiences and accelerating product launches. The success of the Tokyo Qt World Summit reinforced our understanding of the strategic importance of Qt to our Asian customers, providing a good starting point for our future business growth. Earlier in the financial year, we reported that cooperation with LG was expanding. Together with LG, we offer webOS operating system as the most comprehensive platform for the automotive industry, robotics, and smart homes. Qt provides LG with a development environment to create innovative user experiences (UX) for next-generation embedded devices. In the future, webOS will be the operating system supported by Qt. Our most important customer segments are the automation industry, medical industry, automotive industry, and consumer electronics. We will continue to enhance the performance and resource efficiency of Qt applications in addition to offering targeted applications to our most important customer segments. Products programmed on Qt can be used during free time, at work, at home and in vehicles. Qt is used, for example, in airplane entertainment systems, as a platform for digital televisions, in automotive digital cockpits, in the user interfaces of medical devices and small household electronics. Our performance during the financial year means we are well positioned to continue the implementation of our growth strategy.
Future Outlook
Operating environment and market outlook The company estimates the growth prospects for its business in the next few years as very promising. The Group’s business development efforts will focus on desktop applications as well as embedded systems in the automotive industry, medical devices, industrial automation, and consumer electronics sectors. Product development efforts will also focus on the value-added features and tools needed in the creation of embedded systems.
Financial statements bulletin January 1–December 31, 2019
4
Sales growth associated with embedded systems will also reflect on the earnings logic. Volume-based distribution license revenue from these sales accumulates over the long term. The company estimates that the growth of volume-based distribution license revenue from the sales of embedded systems will accelerate to a more significant degree starting from 2020.
Outlook 2020 We estimate that our net sales in 2020 will increase by more than 20 percent year-on-year at comparable exchange rates and that the operating result shows a profit in 2020.
Financial reporting
Net sales and profit performance Full-year net sales for 2019 increased by 28.0 percent year-on-year and amounted to EUR 58,373 thousand (EUR 45,590 thousand). License sales and consulting grew by 32.2 percent, while maintenance revenue increased by 19.5 percent. As part of license sales and consulting, the net sales of distribution licenses grew by 21.4 percent to EUR 14,556 thousand (EUR 11,990 thousand). The effect of exchange rates on the comparison period’s net sales was EUR 1,551 thousand and at comparable exchange rates, net sales increased by 23.8 percent. Qt’s net sales for the fourth quarter amounted to EUR 16,907 thousand (EUR 11,138 thousand), up 51.8 percent. License sales and consulting grew by 72.5 percent, while maintenance revenue increased by 16.2 percent. The effect of exchange rates on the comparison period’s net sales was EUR 187 thousand and at comparable exchange rates increased by 49.3 percent. Qt’s operating result for the period under review October–December 2019 was EUR -48 thousand (EUR -1,651 thousand). The operating result for the financial year was EUR 219 thousand (EUR -2,322 thousand). Expenses for the period under review were particularly increased by subcontracting costs, which were allocated on product development and a performance-based bonus scheme for revenue growth. The other operating income includes income from events held and tax-free research and development investment grants received by the company in Norway, totalling approximately EUR 351 thousand (EUR 436 thousand). The grants concern the applicable personnel expenses related to the research and development activities of Qt’s Norwegian company, and they were paid to the company in the second half of 2019. The company’s operating expenses, including materials and services, personnel expenses, depreciation and other operating expenses, amounted to EUR 17,636 thousand (EUR 13,380 thousand) in the fourth quarter, up 31.8 percent year-on-year due to the growth of the business. Personnel expenses accounted for 62.6 percent (61.7%) of operating expenses, or EUR 11,040 thousand (EUR 8,262 thousand).
Financial statements bulletin January 1–December 31, 2019
5
The company’s net financial expenses in the fourth quarter amounted to EUR 66 thousand positive (EUR 54 thousand positive), due to translation differences in currency-denominated internal receivables and debts related to the financing of international subsidiaries. Qt’s earnings before tax for the fourth quarter totaled EUR 18 thousand (EUR -1,597 thousand) and the result was EUR -205 thousand (EUR -1,451 thousand). Taxes for the period under review amounted to EUR -222 thousand (EUR 146 thousand positive, which was due to deferred tax assets recognised for losses). Earnings per share totaled EUR -0.01 during the fourth quarter (EUR -0.06).
Financing and investments Cash flow from operating activities during the financial year was EUR 6,110 thousand (EUR -1,230 thousand) due to positive result, advances received and partly also due to reporting according to the IFRS 16 Leases standard. Qt’s cash and cash equivalents totaled EUR 11,944 thousand (EUR 9,702 thousand) at the end of the financial year. Qt Group’s consolidated balance sheet total at the end of the financial year stood at EUR 49,996 thousand (EUR 38,760 thousand). Net cash flow from investments in the financial year was EUR -465 thousand (EUR -797 thousand). The equity ratio was 54.3 percent (71.2%) and gearing was -46.4 percent (-49.5%). Interest-bearing liabilities amounted to EUR 4,081 thousand (EUR 630 thousand) of which short-term loans accounted for EUR 1,625 thousand (EUR 391 thousand). Significant changes in the loan amounts are the result of IFRS 16 Leases standard, effective from January 1, 2019, when new assets and liabilities have been recognized in the balance sheet, mainly from business premises and vehicle leases. The return on investment for the financial year was 1.1 percent (-11.6%) and return on equity was -2.0 percent (-12.4%).
Research and development Product development expenses are included in the result for the fiscal year in their entirety and the company has no capitalised product development expenses on its balance sheet. Product development expenses during the fiscal year totaled EUR 12,865 thousand (EUR 10,863 thousand), accounting for 22 percent (23.8%) of net sales. Product development expenses increased by 18.4 percent year-on-year.
There were, on average, 119 people working in product development during the financial year (118).
Financial statements bulletin January 1–December 31, 2019
6
Personnel The number of Group personnel was 342 (303) on average during the fourth quarter and 340 (306) at the end of the financial year. The Group’s personnel expenses during the quarter amounted to EUR 11,040 thousand (EUR 8,262 thousand), up 33.6 percent year-on-year. Personnel expenses totaled EUR 39,359 thousand (EUR 32,896 thousand), during the financial year, up 19.6 percent. At the end of the financial year, international personnel represented 71 percent (72 %) of the total.
Other events in the review period
Governance Qt Group Plc's general meeting held on March 14, 2019, adopted the company’s annual accounts, including the consolidated annual accounts for the accounting period January 1‒December 31, 2018, and discharged the Members of the Board and the Chief Executive Officer from liability. The general meeting resolved, in accordance with the Board’s proposal, that no dividend will be paid based on the balance sheet adopted for the accounting period that ended on December 31, 2018. The general meeting resolved on the remuneration of the company’s Board of Directors and auditors, decided that the number of members on the Board of Directors would be five (5) and elected the company’s Board of Directors. Robert Ingman, Jaakko Koppinen, Mikko Marsio, Leena Saarinen and Tommi Uhari were re-elected as members of Qt Group Plc’s Board of Directors. At its organizing meeting held after the general meeting, the Board of Directors elected Robert Ingman as its Chairman and Tommi Uhari as the Vice Chairman. The general meeting granted the following authorizations to the Board of Directors of Qt Group Plc: Authorizing the Board of Directors to decide on repurchasing the company’s own shares and/or accepting them as collateral The general meeting authorized the Board of Directors to decide on the repurchase and/or acceptance as collateral of a maximum of 2,000,000 of the company’s own shares by using funds in the unrestricted equity. According to the authorization, the Board will decide on how these shares are to be purchased. The shares may be repurchased in a proportion other than that of the shares held by the current shareholders. The authorization also includes the acquisition of shares through public trading organized by Nasdaq Helsinki Ltd in accordance with its and Euroclear Finland Ltd’s rules and instructions, or through offers made to shareholders.
Financial statements bulletin January 1–December 31, 2019
7
Shares may be acquired in order to improve the company’s capital structure, to finance or carry out acquisitions or other arrangements, to implement share-based incentive schemes, to be transferred for other purposes, or to be cancelled. The shares shall be repurchased for a price based on the fair value quoted in public trading. The authorization is valid for 18 months from the issue date of the authorization, i.e. until September 14, 2020, and it replaces any earlier authorizations on the repurchase and/or acceptance as collateral of the company's own shares. Authorizing the Board of Directors to decide on a share issue and the granting of special rights entitling to shares The AGM authorized the Board to decide on a share issue and the granting of special rights pursuant to Chapter 10, Section 1, of the Companies Act, subject to or free of charge, in one or several tranches on the following terms. The maximum total number of shares to be issued by virtue of the authorization is 2,000,000. The authorization concerns both the issuance of new shares and the transfer of shares held by the company. By virtue of the authorization, the Board of Directors is entitled to decide on share issues and the granting of special rights waiving the pre-emptive subscription rights of the shareholders (directed issue). The authorization may be used in order to finance or carry out acquisitions or other arrangements, to carry out the company’s share-based incentive schemes and to improve the capital structure of the company, or for other purposes decided by the Board of Directors. The authorization includes the Board of Directors' right to decide on all terms relating to the share issue and granting of special rights including the subscription price, its payment and its entry into the company's balance sheet. The authorization is valid for 18 months from the issue date of the authorization, i.e. until September 14, 2020, and it replaces any earlier authorizations on share issues and the granting of special rights. By virtue of the authorization granted to it by the general meeting, the Board of Directors of Qt Group Plc resolved at its meeting on February 14, 2019, on the program for keypersons’ share rewards. Within this program, a reward corresponding to the value of 530,000 shares of the company at the most can be granted to keypersons in the company or its group companies. The governance, security and execution of the incentive scheme has been outsourced to Evli Awards Management Oy. According to the outsourcing arrangement, the company shall fund the acquisition of shares required for paying out rewards in the manner permitted by Chapter 13, Section 10, Clause 2 of the Limited Liability Companies Act, and Evli Awards Management shall independently perform the acquisition of such shares in the stock market.
Events after the review period The company had no other significant events deviating from normal business operations after the end of the review period.
Financial statements bulletin January 1–December 31, 2019
8
Risks and uncertainties The company’s short-term risks and uncertainties are related to potential significant changes in the company’s business operations as well as the retention and recruitment of the personnel required for business development. Exchange rate fluctuations, particularly between the US dollar and euro, may have a large impact on the development of the company’s net sales. Another factor contributing to considerable fluctuation in quarterly net sales and profitability in particular is contract turnaround times which, in the major customer segment, are very long at up to 18 months. The company’s business risks and preparations for them are also described on the company website at www.qt.io. Helsinki, February 14, 2020 Qt Group Plc Board of Directors
Communications Qt Group will hold a briefing on this financial statement bulletin for analysts on Friday, February 14, 2020, at 10:00 a.m. in the Eino Leino cabinet of Hotel Kämp, Pohjoisesplanadi 29, 00100 Helsinki, Finland. The financial statement bulletin and presentation will be available in the Investors section at www.qt.io from 10:00 a.m. on February 14, 2020.
Further information Juha Varelius, CEO, tel. +358 9 8861 8040 DISTRIBUTION NASDAQ Helsinki Key media
Financial statements bulletin January 1–December 31, 2019
9
Summary of financial statements and notes to the financial statements 1 January–31 December 2019 Accounting principles This financial statement bulletin was prepared in compliance with IAS 34 Interim Financial Reporting. The amounts from the financial statements presented in this bulletin are based on the company’s audited financial statements. The Auditor’s Report was issued on 13 February 2020. The preparation of IFRS financial statements requires the application of judgement by the management to make estimates and assumptions that affect the reported amounts of assets and liabilities on the balance sheet date and the reported amounts of income and expenses for the financial year. The management also has to make judgements when applying the accounting policies of the Group. As the estimates and related assumptions are based on the management’s view at the end of the review period, they include risks and uncertainties. Actual results may differ from the estimates and assumptions used. The figures shown in the income statement and balance sheet are consolidated figures. As the figures in this report are independently rounded, the sums of individual figures may deviate from the sum figures shown. Qt Group has applied the IFRS 16 Leases standard effective from January 1, 2019. As a result of the new standard, the Group recognized principally non-cancellable leases relating to the office premises on the balance sheet. The Group made use of an easement allowed in the standard, according to which short-term leases of assets with minor value do not need to be recognized on the balance sheet. At the beginning of the period under review, the right-of-use assets recognized on the balance sheet according to the IFRS 16 standard amounted to EUR 5,014 thousand and were included in the “Tangible assets” section under the consolidated statement of financial position. Correspondingly, the long-term and short-term interest-bearing liabilities in the consolidated statement of financial position include EUR 5,014 thousand of lease liabilities at the beginning of the period. Depreciations for right-of-use assets were EUR 1,407 thousand and financing expenses EUR 124 thousand for the period under review. The adjusted premises rents were EUR 1,481 thousand for the same period. A simplified method has been used for the transition, and the comparison figures from the year preceding the transition have not been adjusted. Share based payments The Board of Directors of Qt Group Plc has in February decided to establish a new equity incentive program for the company’s President and CEO and other key persons. The incentive program has one reward collection period covering years 2019–2021. Rewards in the program are determined by Qt Group Plc’s net sales in 2021. Rewards will start accumulating once the net sales for 2021 exceed EUR 80 million, and they then continue to increase in a linear manner up to a maximum value equivalent to 530,000 shares once net sales reach EUR 120 million. The fair value of the commissions at the date of issue was EUR 1.8 million.
Financial statements bulletin January 1–December 31, 2019
10
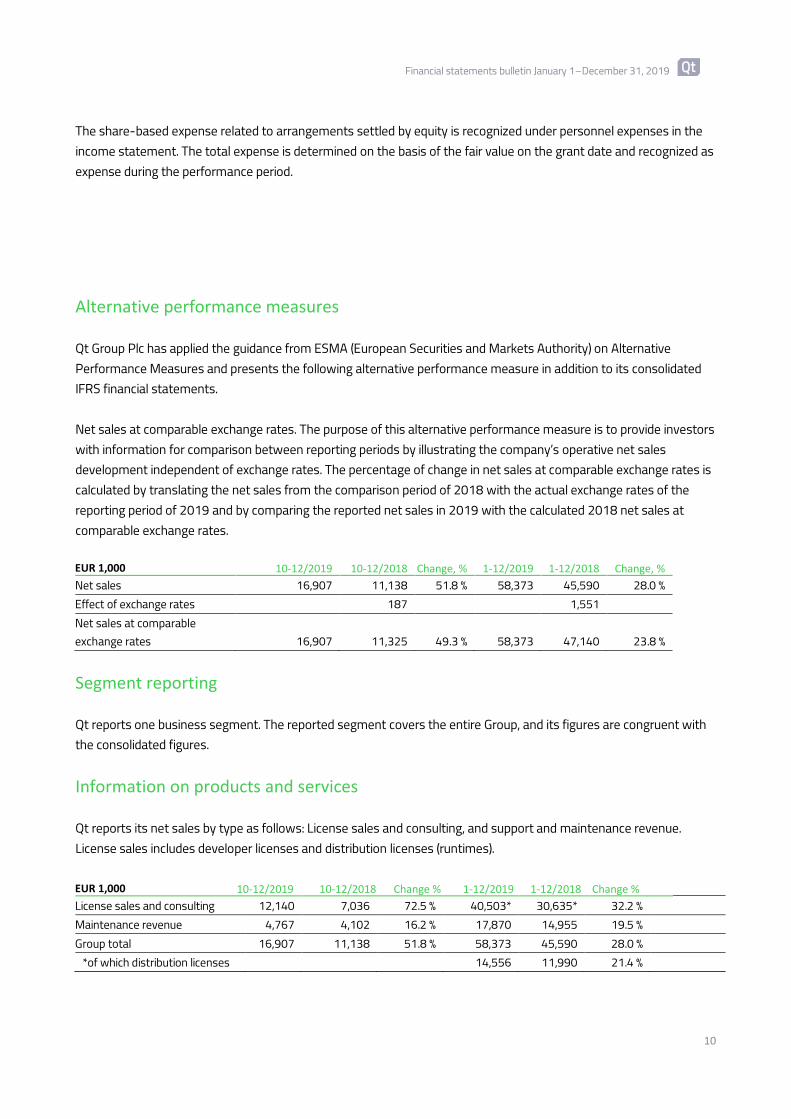
The share-based expense related to arrangements settled by equity is recognized under personnel expenses in the income statement. The total expense is determined on the basis of the fair value on the grant date and recognized as expense during the performance period. Alternative performance measures Qt Group Plc has applied the guidance from ESMA (European Securities and Markets Authority) on Alternative Performance Measures and presents the following alternative performance measure in addition to its consolidated IFRS financial statements. Net sales at comparable exchange rates. The purpose of this alternative performance measure is to provide investors with information for comparison between reporting periods by illustrating the company’s operative net sales development independent of exchange rates. The percentage of change in net sales at comparable exchange rates is calculated by translating the net sales from the comparison period of 2018 with the actual exchange rates of the reporting period of 2019 and by comparing the reported net sales in 2019 with the calculated 2018 net sales at comparable exchange rates. EUR 1,000 10-12/2019 10-12/2018 Change, % 1-12/2019 1-12/2018 Change, %
Net sales 16,907 11,138 51.8 % 58,373 45,590 28.0 % Effect of exchange rates 187 1,551 Net sales at comparable exchange rates 16,907 11,325 49.3 % 58,373 47,140 23.8 % Segment reporting Qt reports one business segment. The reported segment covers the entire Group, and its figures are congruent with the consolidated figures. Information on products and services Qt reports its net sales by type as follows: License sales and consulting, and support and maintenance revenue. License sales includes developer licenses and distribution licenses (runtimes). EUR 1,000 10-12/2019 10-12/2018 Change % 1-12/2019 1-12/2018 Change %
License sales and consulting 12,140 7,036 72.5 % 40,503* 30,635* 32.2 % Maintenance revenue 4,767 4,102 16.2 % 17,870 14,955 19.5 % Group total 16,907 11,138 51.8 % 58,373 45,590 28.0 %
*of which distribution licenses 14,556 11,990 21.4 %
Financial statements bulletin January 1–December 31, 2019
11
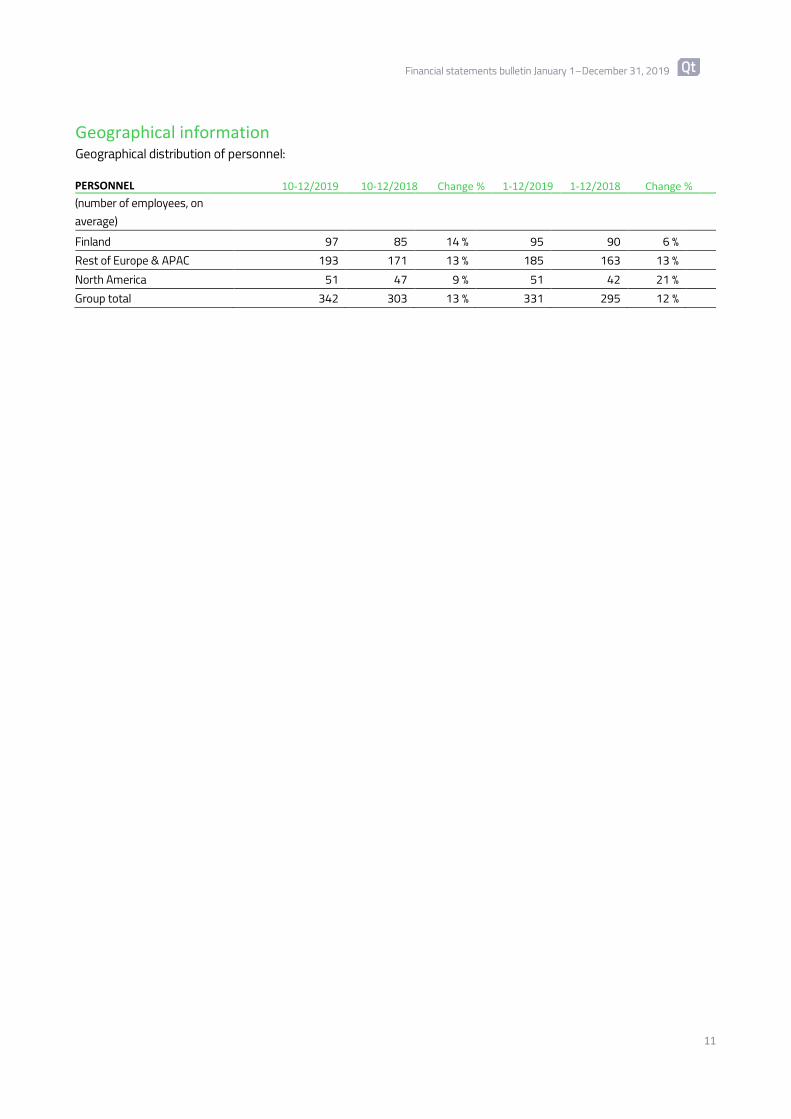
Geographical information Geographical distribution of personnel: PERSONNEL 10-12/2019 10-12/2018 Change % 1-12/2019
1-12/2018 Change %
(number of employees, on average) Finland 97 85 14 % 95 90 6 % Rest of Europe & APAC 193 171 13 % 185 163 13 % North America 51 47 9 % 51 42 21 % Group total 342 303 13 % 331 295 12 %
Financial statements bulletin January 1–December 31, 2019
12
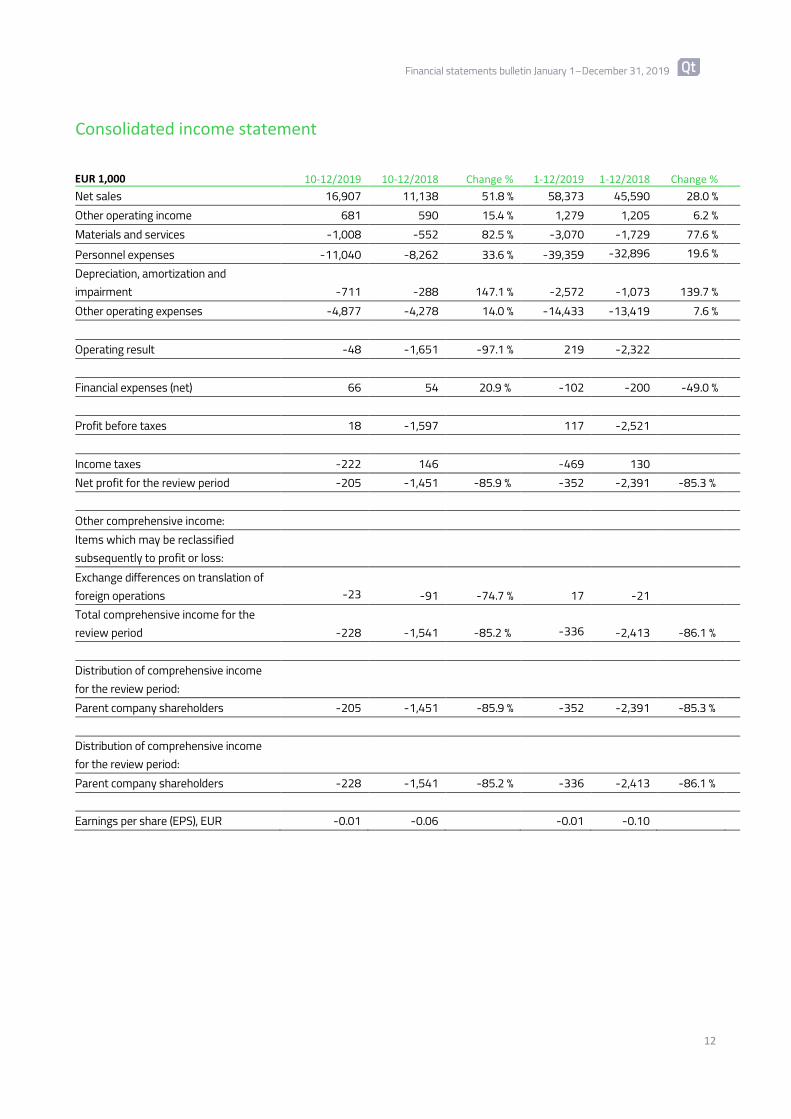
Consolidated income statement
EUR 1,000 10-12/2019
10-12/2018 Change % 1-12/2019
1-12/2018 Change %
Net sales 16,907 11,138 51.8 % 58,373 45,590 28.0 % Other operating income 681 590 15.4 % 1,279 1,205 6.2 % Materials and services -1,008 -552 82.5 % -3,070 -1,729 77.6 % Personnel expenses -11,040 -8,262 33.6 % -39,359 -32,896 19.6 % Depreciation, amortization and impairment -711 -288 147.1 % -2,572 -1,073 139.7 % Other operating expenses -4,877 -4,278 14.0 % -14,433 -13,419 7.6 % Operating result -48 -1,651 -97.1 % 219 -2,322 Financial expenses (net) 66 54 20.9 % -102 -200 -49.0 % Profit before taxes 18 -1,597 117 -2,521 Income taxes -222 146 -469 130 Net profit for the review period -205 -1,451 -85.9 % -352 -2,391 -85.3 % Other comprehensive income: Items which may be reclassified subsequently to profit or loss: Exchange differences on translation of foreign operations -23 -91 -74.7 % 17 -21 Total comprehensive income for the review period -228 -1,541 -85.2 % -336 -2,413 -86.1 % Distribution of comprehensive income for the review period: Parent company shareholders -205 -1,451 -85.9 % -352 -2,391 -85.3 % Distribution of comprehensive income for the review period: Parent company shareholders -228 -1,541 -85.2 % -336 -2,413 -86.1 % Earnings per share (EPS), EUR -0.01 -0.06 -0.01 -0.10
Financial statements bulletin January 1–December 31, 2019
13
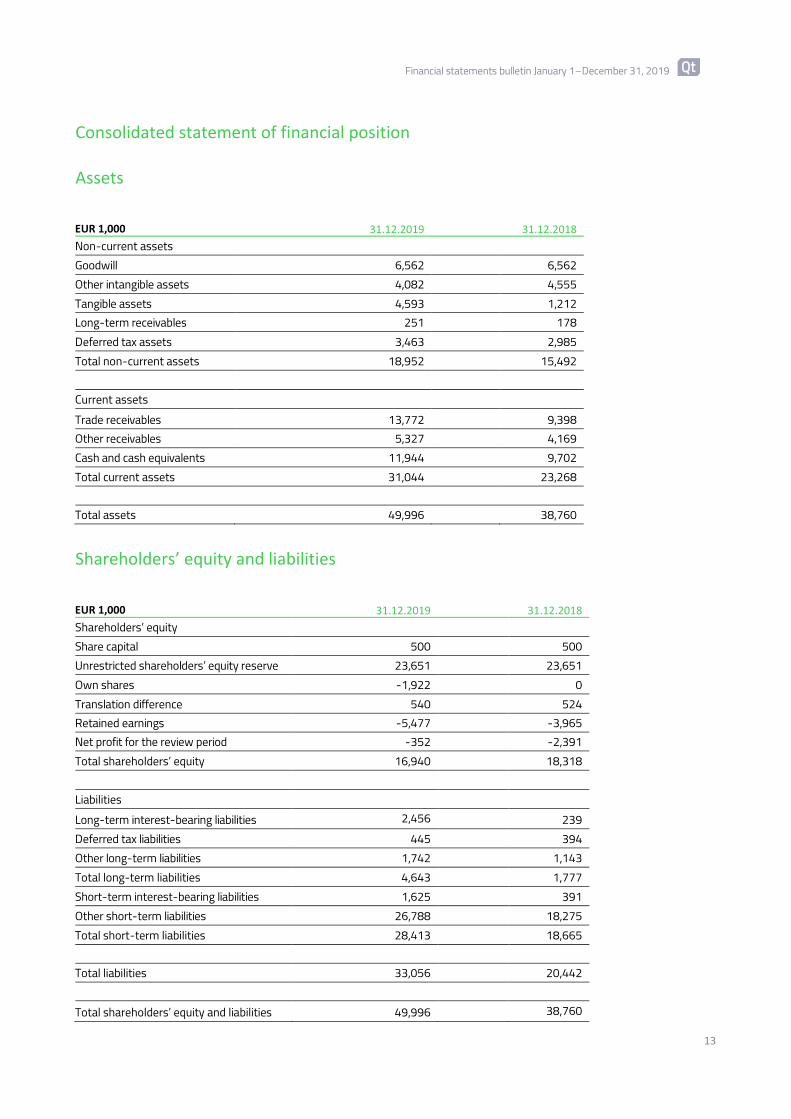
Consolidated statement of financial position Assets
EUR 1,000 31.12.2019
31.12.2018
Non-current assets Goodwill 6,562 6,562 Other intangible assets 4,082 4,555 Tangible assets 4,593 1,212 Long-term receivables 251 178 Deferred tax assets 3,463 2,985 Total non-current assets 18,952 15,492 Current assets Trade receivables 13,772 9,398 Other receivables 5,327 4,169 Cash and cash equivalents 11,944 9,702 Total current assets 31,044 23,268 Total assets 49,996 38,760
Shareholders’ equity and liabilities
EUR 1,000 31.12.2019
31.12.2018
Shareholders’ equity Share capital 500 500 Unrestricted shareholders’ equity reserve 23,651 23,651 Own shares -1,922 0 Translation difference 540 524 Retained earnings -5,477 -3,965 Net profit for the review period -352 -2,391 Total shareholders’ equity 16,940 18,318 Liabilities Long-term interest-bearing liabilities 2,456 239 Deferred tax liabilities 445 394 Other long-term liabilities 1,742 1,143 Total long-term liabilities 4,643 1,777 Short-term interest-bearing liabilities 1,625 391 Other short-term liabilities 26,788 18,275 Total short-term liabilities 28,413 18,665 Total liabilities 33,056 20,442 Total shareholders’ equity and liabilities 49,996 38,760
Financial statements bulletin January 1–December 31, 2019
14
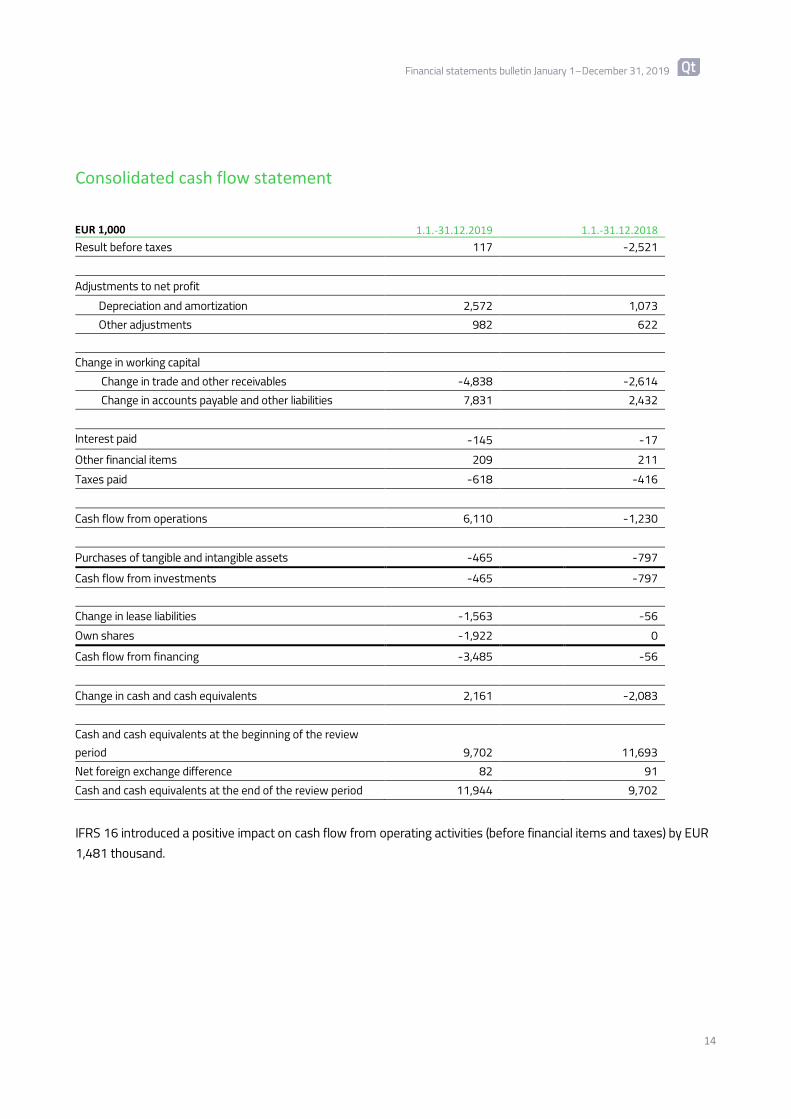
Consolidated cash flow statement
EUR 1,000 1.1.-31.12.2019
1.1.-31.12.2018
Result before taxes 117 -2,521 Adjustments to net profit Depreciation and amortization 2,572 1,073 Other adjustments 982 622 Change in working capital Change in trade and other receivables -4,838 -2,614 Change in accounts payable and other liabilities 7,831 2,432 Interest paid -145 -17 Other financial items 209 211 Taxes paid -618 -416 Cash flow from operations 6,110 -1,230 Purchases of tangible and intangible assets -465 -797 Cash flow from investments -465 -797 Change in lease liabilities -1,563 -56 Own shares -1,922 0 Cash flow from financing -3,485 -56 Change in cash and cash equivalents 2,161 -2,083 Cash and cash equivalents at the beginning of the review period 9,702 11,693 Net foreign exchange difference 82 91 Cash and cash equivalents at the end of the review period 11,944 9,702
IFRS 16 introduced a positive impact on cash flow from operating activities (before financial items and taxes) by EUR 1,481 thousand.
Financial statements bulletin January 1–December 31, 2019
15
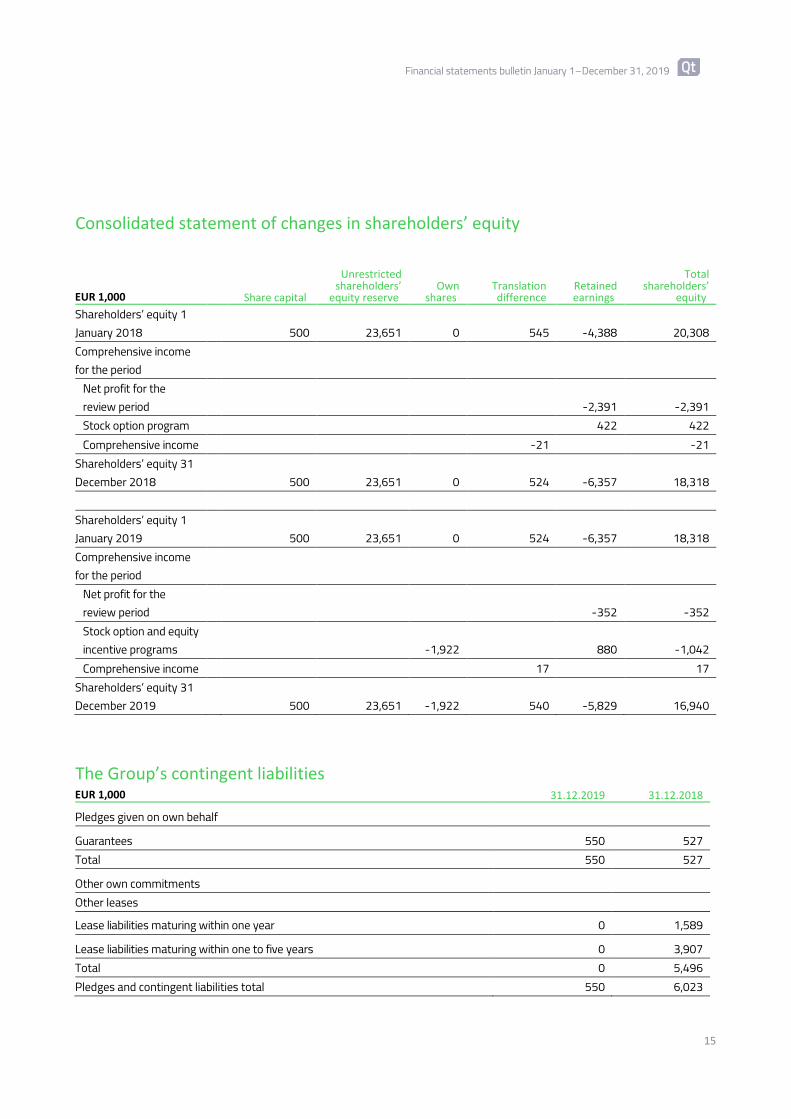
Consolidated statement of changes in shareholders’ equity
EUR 1,000 Share capital
Unrestricted shareholders’
equity reserve Own
shares Translation difference
Retained earnings
Total shareholders’
equity
Shareholders’ equity 1 January 2018 500 23,651 0 545 -4,388 20,308 Comprehensive income for the period Net profit for the review period -2,391 -2,391 Stock option program 422 422 Comprehensive income -21 -21 Shareholders’ equity 31 December 2018 500 23,651 0 524 -6,357 18,318 Shareholders’ equity 1 January 2019 500 23,651 0 524 -6,357 18,318 Comprehensive income for the period Net profit for the review period -352 -352 Stock option and equity incentive programs -1,922 880 -1,042 Comprehensive income 17 17 Shareholders’ equity 31 December 2019 500 23,651 -1,922 540 -5,829 16,940
The Group’s contingent liabilities EUR 1,000 31.12.2019 31.12.2018
Pledges given on own behalf
Guarantees 550 527 Total 550 527
Other own commitments Other leases Lease liabilities maturing within one year 0 1,589
Lease liabilities maturing within one to five years 0 3,907 Total 0 5,496 Pledges and contingent liabilities total 550 6,023
Financial statements bulletin January 1–December 31, 2019
16
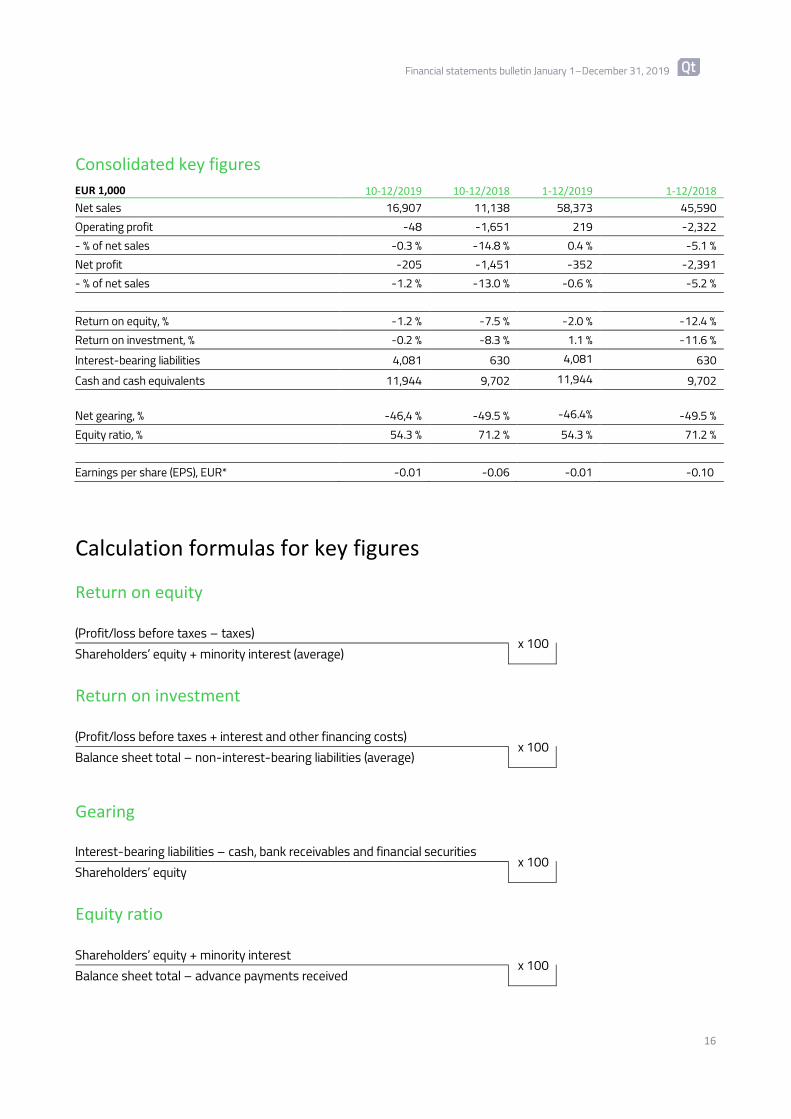
Consolidated key figures
EUR 1,000 10-12/2019 10-12/2018
1-12/2019
1-12/2018
Net sales 16,907 11,138 58,373 45,590 Operating profit -48 -1,651 219 -2,322 - % of net sales -0.3 % -14.8 % 0.4 % -5.1 % Net profit -205 -1,451 -352 -2,391 - % of net sales -1.2 % -13.0 % -0.6 % -5.2 % Return on equity, % -1.2 % -7.5 % -2.0 % -12.4 % Return on investment, % -0.2 % -8.3 % 1.1 % -11.6 % Interest-bearing liabilities 4,081 630 4,081 630 Cash and cash equivalents 11,944 9,702 11,944 9,702
Net gearing, % -46,4 % -49.5 % -46.4% -49.5 % Equity ratio, % 54.3 % 71.2 % 54.3 % 71.2 % Earnings per share (EPS), EUR* -0.01 -0.06 -0.01 -0.10
Calculation formulas for key figures
Return on equity (Profit/loss before taxes – taxes)
x 100 Shareholders’ equity + minority interest (average)
Return on investment (Profit/loss before taxes + interest and other financing costs)
x 100 Balance sheet total – non-interest-bearing liabilities (average)
Gearing Interest-bearing liabilities – cash, bank receivables and financial securities
x 100 Shareholders’ equity
Equity ratio Shareholders’ equity + minority interest
x 100 Balance sheet total – advance payments received
Financial statements bulletin January 1–December 31, 2019
17
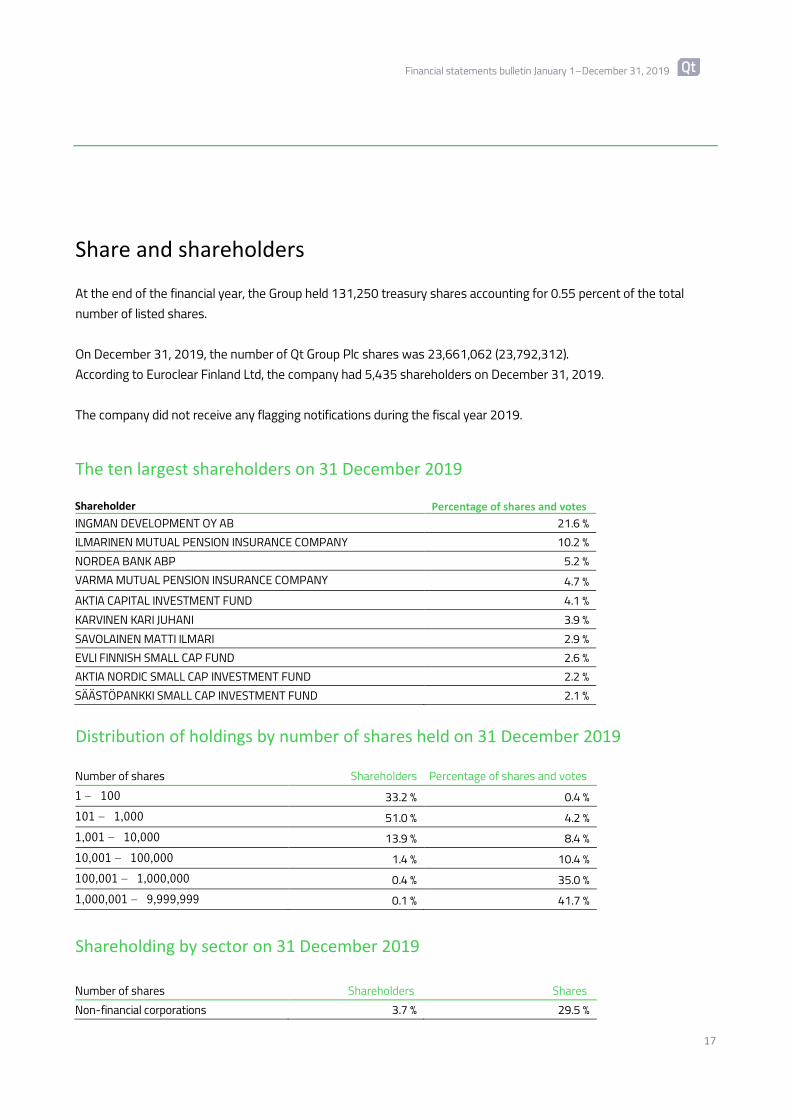
Share and shareholders At the end of the financial year, the Group held 131,250 treasury shares accounting for 0.55 percent of the total number of listed shares. On December 31, 2019, the number of Qt Group Plc shares was 23,661,062 (23,792,312). According to Euroclear Finland Ltd, the company had 5,435 shareholders on December 31, 2019. The company did not receive any flagging notifications during the fiscal year 2019.
The ten largest shareholders on 31 December 2019 Shareholder Percentage of shares and votes INGMAN DEVELOPMENT OY AB 21.6 % ILMARINEN MUTUAL PENSION INSURANCE COMPANY 10.2 % NORDEA BANK ABP 5.2 % VARMA MUTUAL PENSION INSURANCE COMPANY 4.7 % AKTIA CAPITAL INVESTMENT FUND 4.1 % KARVINEN KARI JUHANI 3.9 % SAVOLAINEN MATTI ILMARI 2.9 % EVLI FINNISH SMALL CAP FUND 2.6 % AKTIA NORDIC SMALL CAP INVESTMENT FUND 2.2 % SÄÄSTÖPANKKI SMALL CAP INVESTMENT FUND 2.1 %
Distribution of holdings by number of shares held on 31 December 2019 Number of shares Shareholders Percentage of shares and votes 1 – 100 33.2 % 0.4 % 101 – 1,000 51.0 % 4.2 % 1,001 – 10,000 13.9 % 8.4 % 10,001 – 100,000 1.4 % 10.4 % 100,001 – 1,000,000 0.4 % 35.0 % 1,000,001 – 9,999,999 0.1 % 41.7 %
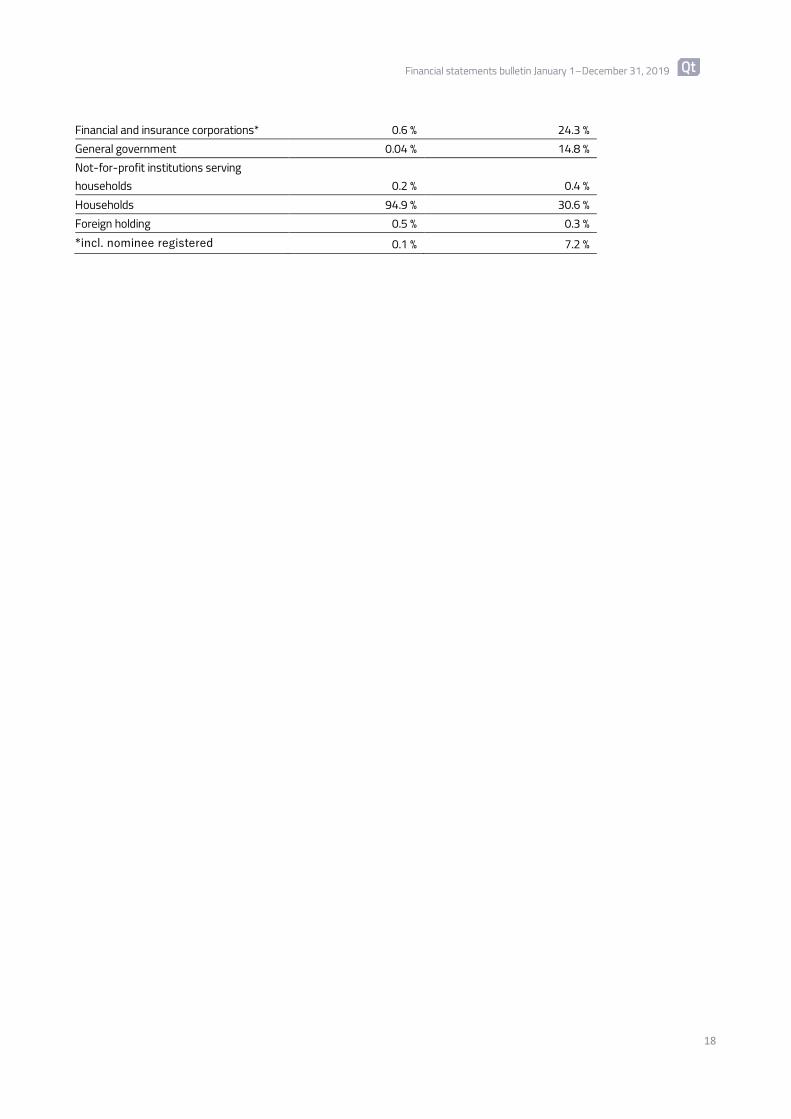
Shareholding by sector on 31 December 2019 Number of shares Shareholders Shares Non-financial corporations 3.7 % 29.5 %
Financial statements bulletin January 1–December 31, 2019
18
Financial and insurance corporations* 0.6 % 24.3 % General government 0.04 % 14.8 % Not-for-profit institutions serving households 0.2 % 0.4 % Households 94.9 % 30.6 % Foreign holding 0.5 % 0.3 % *incl. nominee registered 0.1 % 7.2 %