financial statements - nzx-prod-s7fsd7f98s.s3...
TRANSCRIPT

FINANCIAL STATEMENTS – As at 29 April 2018

Directors’ Statement
The Board of Directors are pleased to present the consolidated financial statements for Tegel Group Holdings Limited, and the auditors’ report, for the year ended 29 April 2018.
The Directors present financial statements for each financial year which fairly present the financial position of the Group and its financial performance and cash flows for that period.
The Directors consider the financial statements of the Group have been prepared using appropriate accounting policies, consistently applied and supported by reasonable judgements and estimates, and that all relevant financial reporting and accounting standards have been followed.
The Directors believe that proper accounting records have been kept which enable, with reasonable accuracy, the determination of the financial position of the Group and facilitate compliance of the financial statements with the Financial Markets Conduct Act 2013.
The Board of Directors of Tegel Group Holdings Limited authorised these financial statements presented on pages 4 to 28 for issue on 11 June 2018.
For and on behalf of the Board.
David Jackson Phil HandDirector Director
Directors’ Statement i
Independent Auditors’ Report 1
Consolidated Financial Statements 4
Notes to the Consolidated Financial Statements 8
1. Basis of Preparation 8
2. Performance 10
3. Working Capital 11
4. Long Term Assets 14
5. Borrowings and Equity 18
6. Other 20
7. Financial Risk Management 25
CONTENTS
1
Independent Auditors’ ReportTo the shareholders of Tegel Group Holdings Limited
The consolidated financial statements comprise:
• the balance sheet as at 29 April 2018;
• the statement of comprehensive income for the year then ended;
• the statement of changes in equity for the year then ended;
• the statement of cash flows for the year then ended; and
• the notes to the financial statements, which include a summary of significant accounting policies.
Our opinion In our opinion, except for the effects of the matter described in the Basis for qualified opinion section of our report, the consolidated financial statements of Tegel Group Holdings Limited (the Company), including its subsidiaries (the Group), present fairly, in all material respects, the financial position of the Group as at 29 April 2018, its financial performance and its cash flows for the year then ended in accordance with New Zealand Equivalents to International Financial Reporting Standards (NZ IFRS) and International Financial Reporting Standards (IFRS).
Basis for qualified opinion The Group has a goodwill balance of $264 million at balance date. As set out in Note 4.2 (b) to the consolidated financial statements the Directors completed their year end impairment test and concluded that the goodwill balance is not impaired. The goodwill assessment is based on the Group’s internal value in use calculation using specific assumptions over five year cash flows and the cash flows beyond five years extrapolated using a terminal growth rate of 3% consistent with prior years.
A takeover offer has been made by Bounty Holdings New Zealand Limited (Bounty) for all the shares in the Company at $1.23 per share. Claris Investments Pte who hold 45% of the Company’s shares has entered into an agreement with Bounty to accept the offer in respect of its entire shareholding subject to certain conditions. Bounty had also acquired 13.49% of the Company’s shares on the market in the period between announcing the offer and 29 May 2018. The offer at a price of $1.23 also permits the payment of a dividend of up to 4.1 cents per share prior to the closing of the offer. The valuation of the Company at the net price of $1.27 per share implies a goodwill impairment of approximately $31 million.
An independent adviser report in relation to the full takeover offer has also been prepared by an independent firm and assessed the standalone valuation of the Company at between $1.15 to $1.39 per share. The mid point of this valuation is also $1.27 per share. The valuation of the Company using a price of $1.15 per share implies a goodwill impairment of approximately $74 million and the valuation of the Company using a price of $1.39 per share implies that there is no impairment of goodwill.
Based on our review of all the documentation we have concluded that the goodwill balance should be impaired by approximately $31 million.
We conducted our audit in accordance with International Standards on Auditing (New Zealand) (ISAs NZ) and International Standards on Auditing (ISAs). Our responsibilities under those standards are further described in the Auditor’s responsibilities for the audit of the consolidated financial statements section of our report.
We believe that the audit evidence we have obtained is sufficient and appropriate to provide a basis for our qualified opinion.
We are independent of the Group in accordance with Professional and Ethical Standard 1 (Revised) Code of Ethics for Assurance Practitioners (PES 1) issued by the New Zealand Auditing and Assurance Standards Board and the International Ethics Standards Board for Accountants’ Code of Ethics for Professional Accountants (IESBA Code), and we have fulfilled our other ethical responsibilities in accordance with these requirements.
Our firm carries out other services for the Group in the areas of Tax compliance, Tax consulting, Treasury advisory services, Remuneration benchmarking services and Agreed upon procedures at the Annual General Meeting. The provision of these other services has not impaired our independence as auditor of the Group.
Our audit approachOverview
Materiality
Audit scope
Key audit matters
An audit is designed to obtain reasonable assurance whether the financial statements are free from material misstatement.
Overall Group materiality: $1.8 million, which represents approximately 5% of profit before tax.
We chose profit before tax as the benchmark because, in our view, it is the benchmark against which the performance of the Group is most commonly measured by users, and is a generally accepted benchmark.
We have determined that in addition to the matter described in the Basis for qualified opinion section there is one key audit matter:
• Biological Assets (fair value measurement)

2 Tegel Financial Statements 2018
MaterialityThe scope of our audit was influenced by our application of materiality.
Based on our professional judgement, we determined certain quantitative thresholds for materiality, including the overall Group materiality for the consolidated financial statements as a whole as set out above. These, together with qualitative considerations, helped us to determine the scope of our audit, the nature, timing and extent of our audit procedures and to evaluate the effect of misstatements, both individually and in aggregate on the consolidated financial statements as a whole.
Audit scopeWe designed our audit by assessing the risks of material misstatement in the consolidated financial statements and our application of materiality. As in all of our audits, we also addressed the risk of management override of internal controls including among other matters, consideration of whether there was evidence of bias that represented a risk of material misstatement due to fraud.
We tailored the scope of our audit in order to perform sufficient work to enable us to provide an opinion on the consolidated financial statements as a whole, taking into account the structure of the Group, the accounting processes and controls, and the industry in which the Group operates.
Key audit matters Key audit matters are those matters that, in our professional judgment, were of most significance in our audit of the consolidated financial statements of the current year. These matters were addressed in the context of our audit of the consolidated financial statements as a whole, and in forming our qualified opinion thereon, and we do not provide a separate opinion on these matters. In addition to the matter described in the Basis for qualified opinion section, we have determined the matter described below to be the key audit matter to be communicated in our report.
Key audit matter How our audit addressed the key audit matter
Biological assets (fair value measurement)Biological assets are measured at fair value in accordance with the relevant accounting standards.
Biological assets are transferred to inventory at fair value less estimated costs to sell at date of harvest. As described in note 3.3 to the consolidated financial statements, management estimations and judgements are required in determining the fair value of biological assets as unobservable inputs are used.
Key inputs to the model used in determining fair value include:
• Price achieved in market for feed, eggs and day old chicks;
• Age of birds, feed conversion rates and mortality;
• Eggs produced; and
• Quantity of birds and eggs on hand.
Given the magnitude of biological assets of $35.1 million, as disclosed in note 3.3 in the financial statements, complexity of the calculations and significant management estimation and judgement involved, we have focused our audit on calculation of the fair value.
We have obtained an understanding of the processes and controls adopted by management to determine the fair value of biological assets and inventory valuation at the point of harvest.
We have re-performed the calculation of the fair value less cost to sell of the biological assets agreeing key inputs to the calculations and critically assessing the significant assumptions made. This included:
• Agreeing price achieved for feed, eggs and day old chicks against historical invoices;
• Agreeing age of birds, feed conversion rates and mortality rates against historical data;
• Agreeing eggs produced, harvested birds and feed consumed to the agriculture system reports;
• Testing agriculture system reports on a sample basis by agreeing the reported information to the individual farm records; and
• Confirming a sample of quantity of birds and eggs on hand used in the calculation with the breeder farm.
No matters arose from undertaking the above procedures.
Information other than the financial statements and auditor’s reportThe Directors are responsible for the annual report. Our opinion on the consolidated financial statements does not cover the other information included in the annual report and we do not, and will not express any form of assurance conclusion on the other information. At the time of our audit, there was no other information available to us.
In connection with our audit of the consolidated financial statements, our responsibility is to read the other information and, in doing so, consider whether the other information is materially inconsistent with the consolidated financial statements or our knowledge obtained in the audit, or otherwise appears to be materially misstated. If, based on the work we have performed on the other information that we obtained prior to the date of this auditor’s report, we conclude that there is a material misstatement of this other information, we are required to report that fact.
Independent auditor’s report (continued)

3
Responsibilities of the Directors for the consolidated financial statementsThe Directors are responsible, on behalf of the Company, for the preparation and fair presentation of the consolidated financial statements in accordance with NZ IFRS and IFRS, and for such internal control as the Directors determine is necessary to enable the preparation of consolidated financial statements that are free from material misstatement, whether due to fraud or error.
In preparing the consolidated financial statements, the Directors are responsible for assessing the Group’s ability to continue as a going concern, disclosing, as applicable, matters related to going concern and using the going concern basis of accounting unless the Directors either intend to liquidate the Group or to cease operations, or have no realistic alternative but to do so.
Auditor’s responsibilities for the audit of the consolidated financial statementsOur objectives are to obtain reasonable assurance about whether the consolidated financial statements, as a whole, are free from material misstatement, whether due to fraud or error, and to issue an auditor’s report that includes our opinion. Reasonable assurance is a high level of assurance, but is not a guarantee that an audit conducted in accordance with ISAs NZ and ISAs will always detect a material misstatement when it exists. Misstatements can arise from fraud or error and are considered material if, individually or in the aggregate, they could reasonably be expected to influence the economic decisions of users taken on the basis of these consolidated financial statements.
A further description of our responsibilities for the audit of the financial statements is located at the External Reporting Board’s website at:
https://www.xrb.govt.nz/standards-for-assurance-practitioners/auditors-responsibilities/audit-report-1/
This description forms part of our auditor’s report.
Who we report toThis report is made solely to the Company’s shareholders, as a body. Our audit work has been undertaken so that we might state those matters which we are required to state to them in an auditor’s report and for no other purpose. To the fullest extent permitted by law, we do not accept or assume responsibility to anyone other than the Company and the Company’s shareholders, as a body, for our audit work, for this report or for the opinions we have formed.
The engagement partner on the audit resulting in this independent auditor’s report is Leopino (Leo) Foliaki.
For and on behalf of:
Chartered Accountants Auckland11 June 2018
4 Tegel Financial Statements 2018
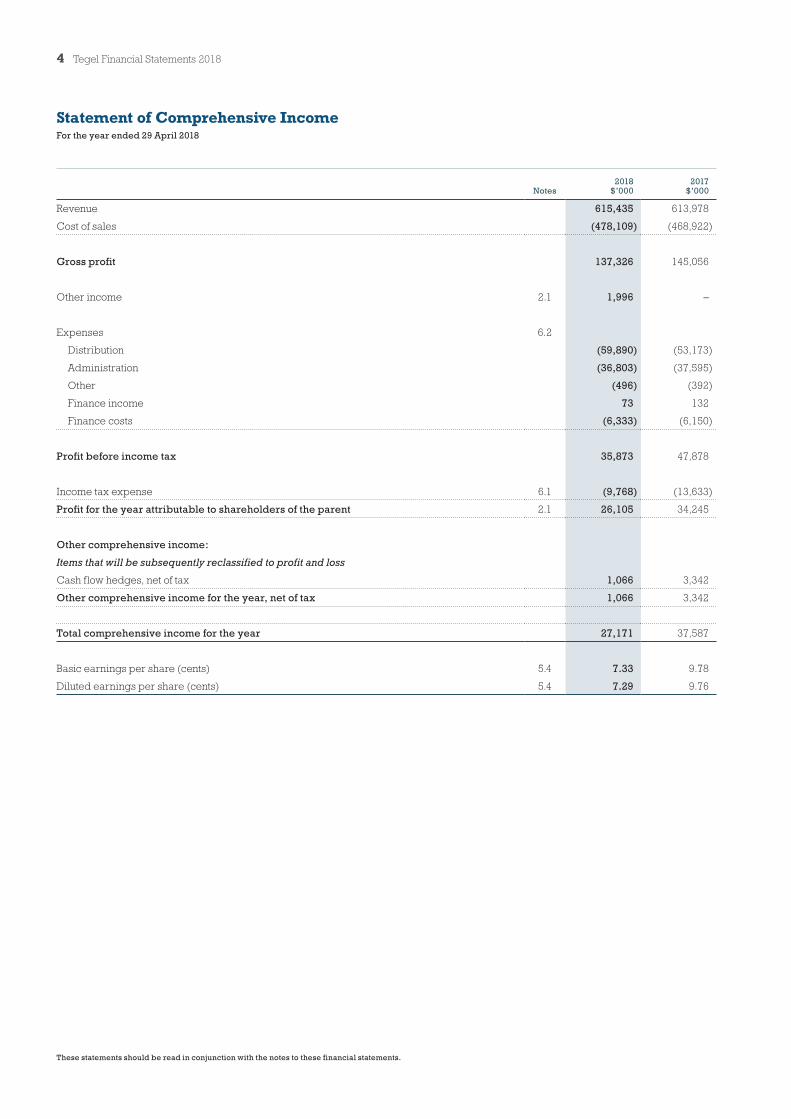
Statement of Comprehensive IncomeFor the year ended 29 April 2018
These statements should be read in conjunction with the notes to these financial statements.
Notes2018
$’0002017
$’000
Revenue 615,435 613,978
Cost of sales (478,109) (468,922)
Gross profit 137,326 145,056
Other income 2.1 1,996 –
Expenses 6.2
Distribution (59,890) (53,173)
Administration (36,803) (37,595)
Other (496) (392)
Finance income 73 132
Finance costs (6,333) (6,150)
Profit before income tax 35,873 47,878
Income tax expense 6.1 (9,768) (13,633)
Profit for the year attributable to shareholders of the parent 2.1 26,105 34,245
Other comprehensive income:
Items that will be subsequently reclassified to profit and loss
Cash flow hedges, net of tax 1,066 3,342
Other comprehensive income for the year, net of tax 1,066 3,342
Total comprehensive income for the year 27,171 37,587
Basic earnings per share (cents) 5.4 7.33 9.78
Diluted earnings per share (cents) 5.4 7.29 9.76
5
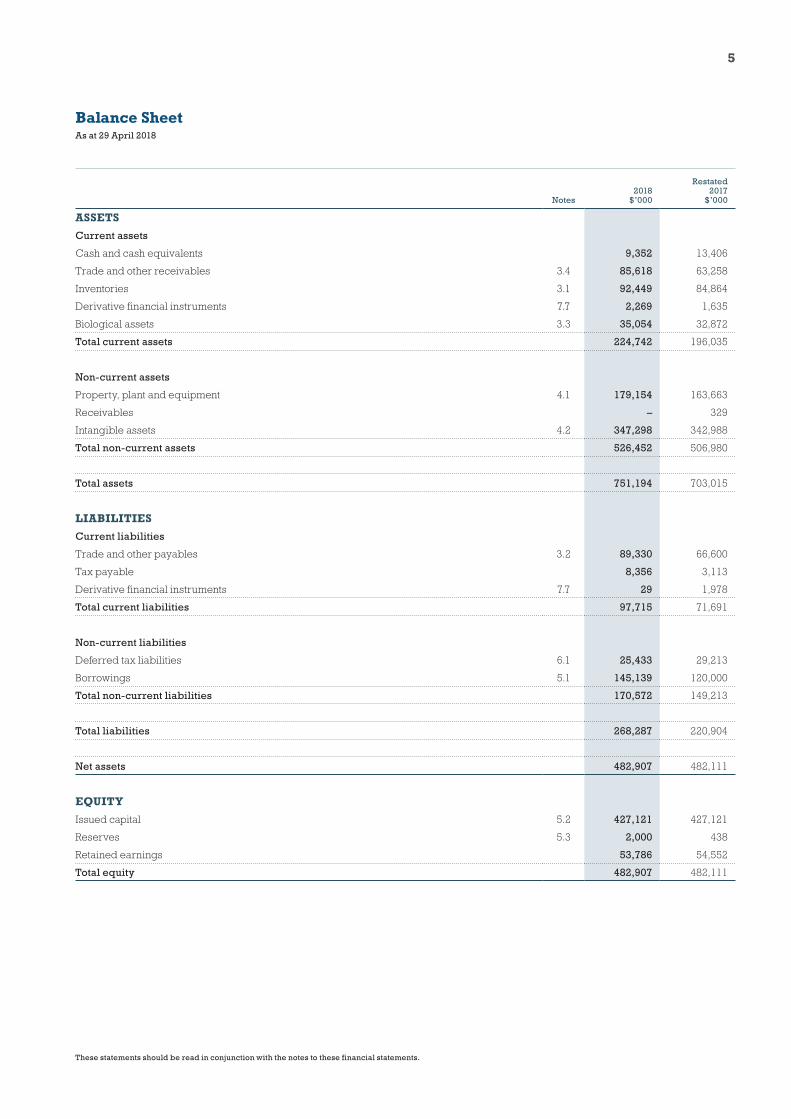
Balance SheetAs at 29 April 2018
These statements should be read in conjunction with the notes to these financial statements.
Notes2018
$’000
Restated2017
$’000
ASSETS
Current assets
Cash and cash equivalents 9,352 13,406
Trade and other receivables 3.4 85,618 63,258
Inventories 3.1 92,449 84,864
Derivative financial instruments 7.7 2,269 1,635
Biological assets 3.3 35,054 32,872
Total current assets 224,742 196,035
Non-current assets
Property, plant and equipment 4.1 179,154 163,663
Receivables – 329
Intangible assets 4.2 347,298 342,988
Total non-current assets 526,452 506,980
Total assets 751,194 703,015
LIABILITIES
Current liabilities
Trade and other payables 3.2 89,330 66,600
Tax payable 8,356 3,113
Derivative financial instruments 7.7 29 1,978
Total current liabilities 97,715 71,691
Non-current liabilities
Deferred tax liabilities 6.1 25,433 29,213
Borrowings 5.1 145,139 120,000
Total non-current liabilities 170,572 149,213
Total liabilities 268,287 220,904
Net assets 482,907 482,111
EQUITY
Issued capital 5.2 427,121 427,121
Reserves 5.3 2,000 438
Retained earnings 53,786 54,552
Total equity 482,907 482,111

6 Tegel Financial Statements 2018
Statement of Changes in EquityFor the year ended 29 April 2018
These statements should be read in conjunction with the notes to these financial statements.
Issued capital$’000
(Note 5.2)
Reserves$’000
(Note 5.3)
Retained earnings
$’000
Total equity$’000
Balance at 24 April 2016 284,423 (3,149) 32,586 313,860
Profit for the year – – 34,245 34,245
Other comprehensive income for the year, net of tax – 3,342 – 3,342
Total comprehensive income – 3,342 34,245 37,587
Movement in fair value of share based payments reserve – 245 – 245
Shares redeemed during the year (264,158) – – (264,158)
Issue of shares during the year net of issue costs 406,856 – – 406,856
Dividends paid – – (12,279) (12,279)
Supplementary dividends paid – – (431) (431)
Foreign investor tax credit – – 431 431
142,698 245 (12,279) 130,664
Balance at 30 April 2017 427,121 438 54,552 482,111
Profit for the year – – 26,105 26,105
Other comprehensive income for the year, net of tax – 1,066 – 1,066
Total comprehensive income – 1,066 26,105 27,171
Movement in fair value of share based payments reserve – 496 – 496
Dividends paid – – (26,871) (26,871)
Supplementary dividends paid – – (865) (865)
Foreign investor tax credit – – 865 865
– 496 (26,871) (26,375)
Balance at 29 April 2018 427,121 2,000 53,786 482,907
7
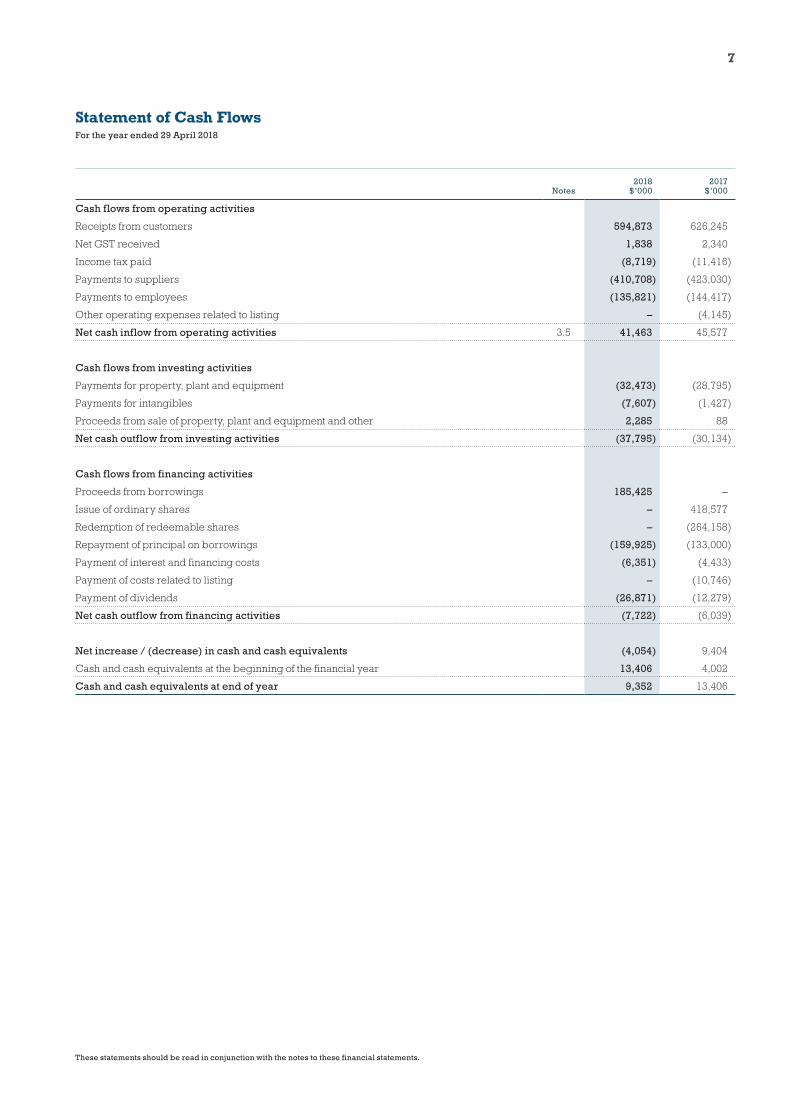
Statement of Cash FlowsFor the year ended 29 April 2018
These statements should be read in conjunction with the notes to these financial statements.
Notes2018
$’0002017
$’000
Cash flows from operating activities
Receipts from customers 594,873 626,245
Net GST received 1,838 2,340
Income tax paid (8,719) (11,416)
Payments to suppliers (410,708) (423,030)
Payments to employees (135,821) (144,417)
Other operating expenses related to listing – (4,145)
Net cash inflow from operating activities 3.5 41,463 45,577
Cash flows from investing activities
Payments for property, plant and equipment (32,473) (28,795)
Payments for intangibles (7,607) (1,427)
Proceeds from sale of property, plant and equipment and other 2,285 88
Net cash outflow from investing activities (37,795) (30,134)
Cash flows from financing activities
Proceeds from borrowings 185,425 –
Issue of ordinary shares – 418,577
Redemption of redeemable shares – (264,158)
Repayment of principal on borrowings (159,925) (133,000)
Payment of interest and financing costs (6,351) (4,433)
Payment of costs related to listing – (10,746)
Payment of dividends (26,871) (12,279)
Net cash outflow from financing activities (7,722) (6,039)
Net increase / (decrease) in cash and cash equivalents (4,054) 9,404
Cash and cash equivalents at the beginning of the financial year 13,406 4,002
Cash and cash equivalents at end of year 9,352 13,406
8 Tegel Financial Statements 2018
Notes to the financial statements29 April 2018
1 BASIS OF PREPARATION
1.1 General informationTegel Group Holdings Limited (the Company) and its subsidiaries (together the Group) is a fully integrated poultry producer, involved in the breeding, hatching, processing, marketing and distribution of poultry products.
These financial statements are the consolidated financial statements and incorporate the assets, liabilities and results of Tegel Group Holdings Limited and its subsidiaries Ross Group Enterprises Limited, Ross Group Developments Limited, SH12 Limited, Tegel Foods Limited, and Tegel International Services Limited. These subsidiary companies are all 100% owned by the Company and incorporated in New Zealand.
1.2 Statement of compliance and basis of preparationThe consolidated financial statements have been prepared in accordance with New Zealand generally accepted accounting practice (NZ GAAP). They comply with New Zealand equivalents to International Financial Reporting Standards (NZ IFRS) and other applicable New Zealand Financial Reporting Standards, as appropriate for profit-oriented entities. The consolidated financial statements also comply with International Financial Reporting Standards (IFRS) and International Financial Reporting Interpretations Committee (IFRIC) interpretations.
Statutory baseTegel Group Holdings Limited is a limited liability company which is domiciled and incorporated in New Zealand. It is registered under the Companies Act 1993 and listed on the Stock Exchange in New Zealand and Australia, and is a FMC Reporting Entity under the Financial Markets Conduct Act 2013.
The financial statements have been prepared in accordance with the requirements of the Financial Reporting Act 2013, the Companies Act 1993 and the Financial Markets Conduct Act 2013.
The financial statements have been rounded to the nearest one thousand New Zealand dollars. The Group divides its financial year into weekly periods. The 2018 full year results are for 52 weeks (2017: 53 weeks).
Historical cost conventionThese financial statements have been prepared under the historical cost convention, as modified by the revaluation of certain assets and liabilities as identified in specific accounting policies below.
Changes in accounting policies and adoption of new and amended standardsIn 2011, on acquisition of the Tegel business, the Group recognised an indefinite life brand with a fair value of $33.5 million. No deferred tax was recognised in relation to this asset at the time of the acquisition. This was based on the assumption that because an indefinite life brand is not amortised, its carrying amount is not expected to be consumed, rather, its carrying amount is expected to be recovered entirely through sale.
In November 2016, the IFRS Interpretations Committee (IFRS IC) issued an agenda decision regarding the determination of the expected manner of recover of intangible assets with indefinite useful life for the purposes of measuring deferred tax, in accordance with IAS 12 Income Taxes. This provided additional guidance on how an entity recovers the carrying value of such assets and the consequences for the measurement and recognition of deferred tax.
As a result of this additional guidance, the Group has recognised a deferred tax liability of $9.4 million on brands, with a corresponding increase in the carrying amount of the generated goodwill. There has been no impairment of the goodwill or brands since the acquisition. Comparatives for goodwill and deferred tax liability have been restated and both increased by $9.4 million.
There have been no other changes in accounting policies or new standards adopted that have had a material impact on the financial statements during the year.
9
1.3 Critical accounting judgements, estimates and assumptions
Accounting Policy
Critical accounting estimatesThe preparation of financial statements in conformity with NZ IFRS requires the use of certain critical accounting estimates. It also requires management to exercise its judgement in the process of applying the Group’s accounting policies. The areas involving a higher degree of judgement or complexity, or areas where assumptions and estimates are significant to the financial statements, are disclosed below.
Estimates and judgements are continually evaluated and are based on historical experience and other factors, including expectations of future events that are believed to be reasonable under the circumstances.
The following critical accounting estimates and judgements have been made:
(a) Reviewing the carrying value of goodwill, trademarks and customer relationships. Note 4.2 provides information about the impairment testing of goodwill and trademarks.
(b) Biological assetsJudgements have been made in relation to the Group’s biological assets as disclosed in Note 3.3.
1.4 Significant events during the yearRefinanceOn 10 October 2017, a new banking facility was negotiated, resulting in all bank borrowing being repaid and a new three year facility being advanced to the Group. For more details see note 5.1 Borrowings.
Takeover noticeOn 25 April 2018, a takeover notice, under Rule 41 of the Takeovers Code, was received by the directors of the Group from Bounty Holdings New Zealand Limited (Bounty) to acquire all of the issued shares in the Group at a price per ordinary share of NZ$1.23.
The takeover offer document was distributed by Bounty to all Tegel shareholders on 28 May 2018 and accepted by Claris Investments Pte. Limited (Claris) on 30 May 2018 in respect of their 45% shareholding of the issued ordinary shares. Claris is now subject to the terms of the Lock-up agreement with Bounty.

10 Tegel Financial Statements 2018
Notes to the financial statements (continued)29 April 2018
2 PERFORMANCE
2.1 Segment reportingOperating segments are reported in a manner consistent with the internal reporting provided to the chief operating decision-maker. The chief operating decision-maker, who is responsible for allocating resources and assessing performance of the operating segments, has been identified as the Group’s senior management team.
The Group operates in one industry, being the manufacture and sale of poultry products. Management makes resource allocation decisions based on expected cash flows and results of the Group’s operations as a whole and the Group therefore has one segment.
A key performance measure reviewed by management is underlying earnings before interest, tax, depreciation, amortisation, fair value adjustments to biological assets and share based payments, and unrealised gains and losses on foreign exchange (underlying EBITDA). This is adjusted for significant one off items.
Revenues of approximately 44% (2017: 42%) are derived from two customers with greater than 10% of revenue.
2018$’000
2017$’000
Underlying EBITDA 70,166 75,558
Unrealised gains / (losses) on foreign exchange revaluations 152 (418)
Fair value adjustment to biological assets 249 (32)
Share based payments (496) (245)
Settlement of historical legal and other claims (12) (654)
Listing costs – (147)
Gains /(loss) on the disposal of property, plant and equipment 1,996 (146)
Kaikoura earthquake costs and other distribution costs (1,381) (535)
Industry compliance costs1 (4,141) –
Costs related to Cyclone Gita and other one off events (3,277) –
Restructuring costs (1,133) –
EBITDA 62,123 73,381
Depreciation (16,693) (16,273)
Amortisation (3,297) (3,212)
Net finance costs (6,260) (6,018)
Profit before tax 35,873 47,878
Income tax expense (9,768) (13,633)
Profit after tax 26,105 34,245
1 Costs have been incurred by the Group while working with all industry companies to establish a catching practice that reduced risk to catching staff. Management have assessed these industry compliance costs to be $4.1 million.
Accounting policy
Revenue recognitionRevenue comprises the fair value of the consideration received or receivable for the sale of goods, net of Goods and Services Tax, rebates and discounts.
Revenue from the sale of goods including feed and biological assets is recognised in profit and loss when the significant risks and rewards have been transferred to the buyers. No revenue is recognised if there are significant uncertainties regarding recoverability.
The Group sells to many different countries with all sales originating from New Zealand.
2018$’000
2017$’000
REVENUE
Domestic 525,859 511,023
Export 89,576 102,955
Total revenue 615,435 613,978
2018$’000
2017$’000
OTHER INCOME
Gain on disposal of property, plant and equipment 1,996 –
1,996 –
11
3 WORKING CAPITAL
3.1 Inventories
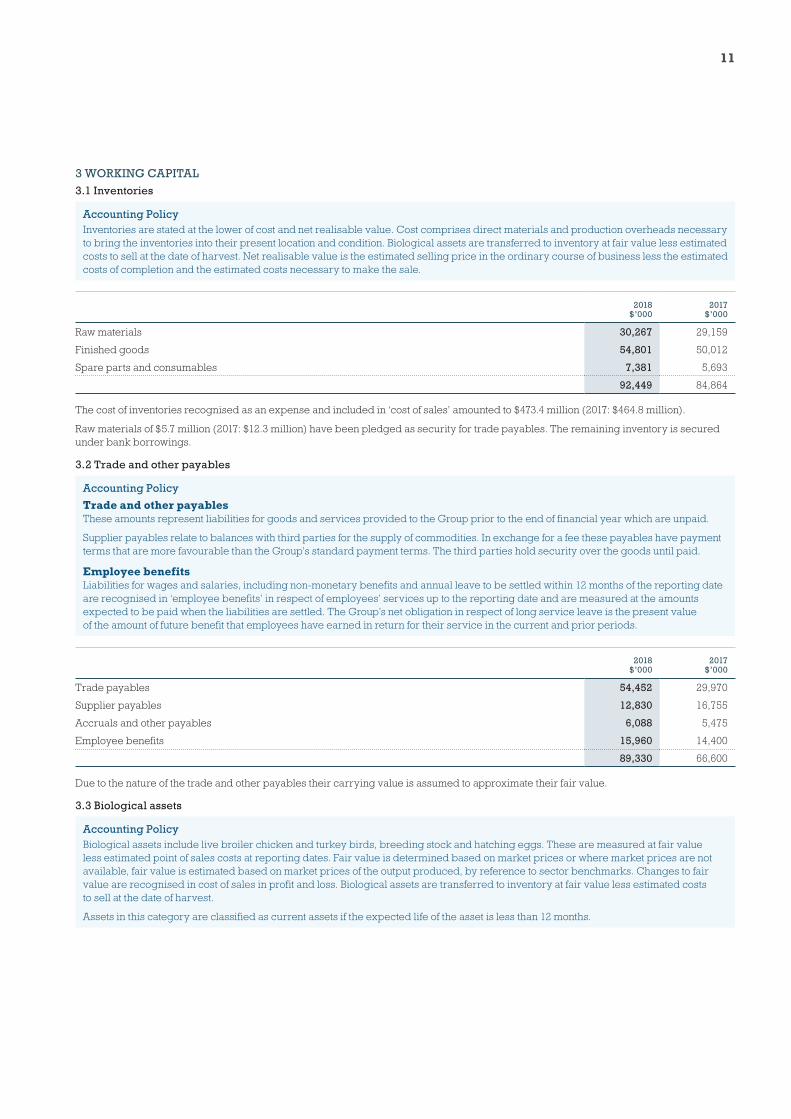
Accounting PolicyInventories are stated at the lower of cost and net realisable value. Cost comprises direct materials and production overheads necessary to bring the inventories into their present location and condition. Biological assets are transferred to inventory at fair value less estimated costs to sell at the date of harvest. Net realisable value is the estimated selling price in the ordinary course of business less the estimated costs of completion and the estimated costs necessary to make the sale.
2018$’000
2017$’000
Raw materials 30,267 29,159
Finished goods 54,801 50,012
Spare parts and consumables 7,381 5,693
92,449 84,864
The cost of inventories recognised as an expense and included in ‘cost of sales’ amounted to $473.4 million (2017: $464.8 million).
Raw materials of $5.7 million (2017: $12.3 million) have been pledged as security for trade payables. The remaining inventory is secured under bank borrowings.
3.2 Trade and other payables
Accounting Policy
Trade and other payablesThese amounts represent liabilities for goods and services provided to the Group prior to the end of financial year which are unpaid.
Supplier payables relate to balances with third parties for the supply of commodities. In exchange for a fee these payables have payment terms that are more favourable than the Group’s standard payment terms. The third parties hold security over the goods until paid.
Employee benefitsLiabilities for wages and salaries, including non-monetary benefits and annual leave to be settled within 12 months of the reporting date are recognised in ‘employee benefits’ in respect of employees’ services up to the reporting date and are measured at the amounts expected to be paid when the liabilities are settled. The Group’s net obligation in respect of long service leave is the present value of the amount of future benefit that employees have earned in return for their service in the current and prior periods.
2018$’000
2017$’000
Trade payables 54,452 29,970
Supplier payables 12,830 16,755
Accruals and other payables 6,088 5,475
Employee benefits 15,960 14,400
89,330 66,600
Due to the nature of the trade and other payables their carrying value is assumed to approximate their fair value.
3.3 Biological assets
Accounting PolicyBiological assets include live broiler chicken and turkey birds, breeding stock and hatching eggs. These are measured at fair value less estimated point of sales costs at reporting dates. Fair value is determined based on market prices or where market prices are not available, fair value is estimated based on market prices of the output produced, by reference to sector benchmarks. Changes to fair value are recognised in cost of sales in profit and loss. Biological assets are transferred to inventory at fair value less estimated costs to sell at the date of harvest.
Assets in this category are classified as current assets if the expected life of the asset is less than 12 months.
12 Tegel Financial Statements 2018
Notes to the financial statements (continued)29 April 2018
3 WORKING CAPITAL (CONTINUED)
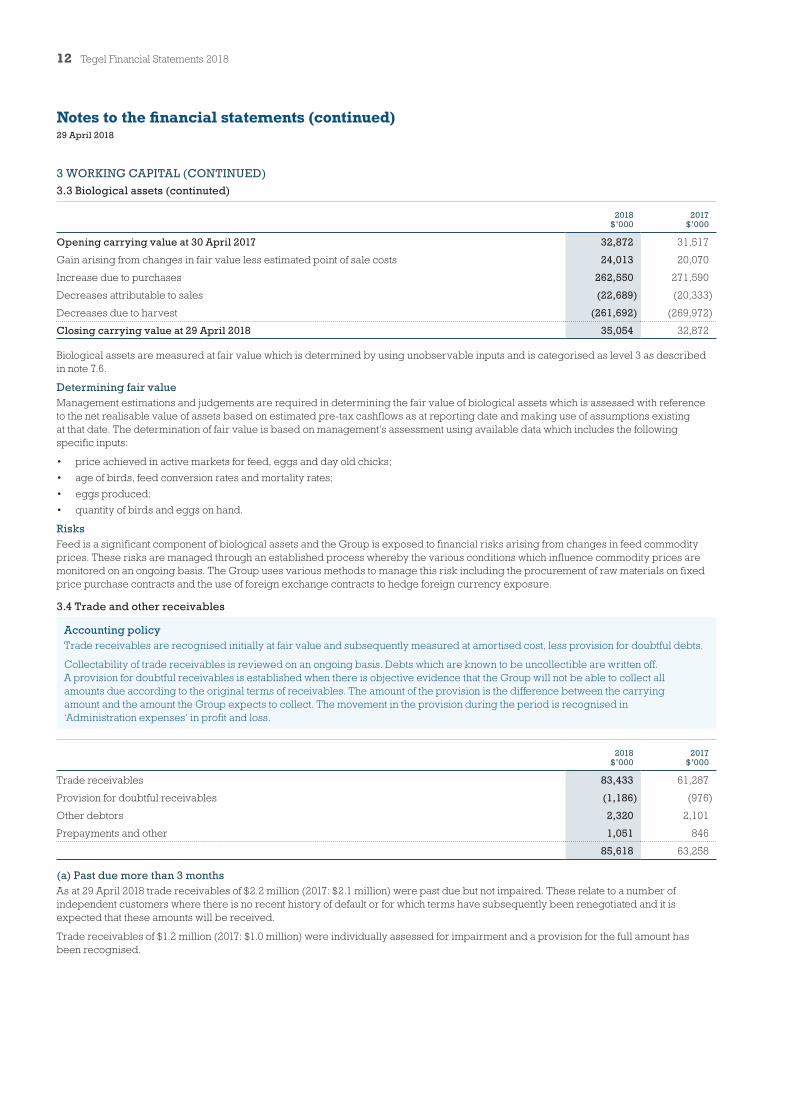
3.3 Biological assets (continuted)
2018$’000
2017$’000
Opening carrying value at 30 April 2017 32,872 31,517
Gain arising from changes in fair value less estimated point of sale costs 24,013 20,070
Increase due to purchases 262,550 271,590
Decreases attributable to sales (22,689) (20,333)
Decreases due to harvest (261,692) (269,972)
Closing carrying value at 29 April 2018 35,054 32,872
Biological assets are measured at fair value which is determined by using unobservable inputs and is categorised as level 3 as described in note 7.6.
Determining fair valueManagement estimations and judgements are required in determining the fair value of biological assets which is assessed with reference to the net realisable value of assets based on estimated pre-tax cashflows as at reporting date and making use of assumptions existing at that date. The determination of fair value is based on management’s assessment using available data which includes the following specific inputs:
• price achieved in active markets for feed, eggs and day old chicks;
• age of birds, feed conversion rates and mortality rates;
• eggs produced;
• quantity of birds and eggs on hand.
RisksFeed is a significant component of biological assets and the Group is exposed to financial risks arising from changes in feed commodity prices. These risks are managed through an established process whereby the various conditions which influence commodity prices are monitored on an ongoing basis. The Group uses various methods to manage this risk including the procurement of raw materials on fixed price purchase contracts and the use of foreign exchange contracts to hedge foreign currency exposure.
3.4 Trade and other receivables
Accounting policyTrade receivables are recognised initially at fair value and subsequently measured at amortised cost, less provision for doubtful debts.
Collectability of trade receivables is reviewed on an ongoing basis. Debts which are known to be uncollectible are written off. A provision for doubtful receivables is established when there is objective evidence that the Group will not be able to collect all amounts due according to the original terms of receivables. The amount of the provision is the difference between the carrying amount and the amount the Group expects to collect. The movement in the provision during the period is recognised in ‘Administration expenses’ in profit and loss.
2018$’000
2017$’000
Trade receivables 83,433 61,287
Provision for doubtful receivables (1,186) (976)
Other debtors 2,320 2,101
Prepayments and other 1,051 846
85,618 63,258
(a) Past due more than 3 monthsAs at 29 April 2018 trade receivables of $2.2 million (2017: $2.1 million) were past due but not impaired. These relate to a number of independent customers where there is no recent history of default or for which terms have subsequently been renegotiated and it is expected that these amounts will be received.
Trade receivables of $1.2 million (2017: $1.0 million) were individually assessed for impairment and a provision for the full amount has been recognised.
13
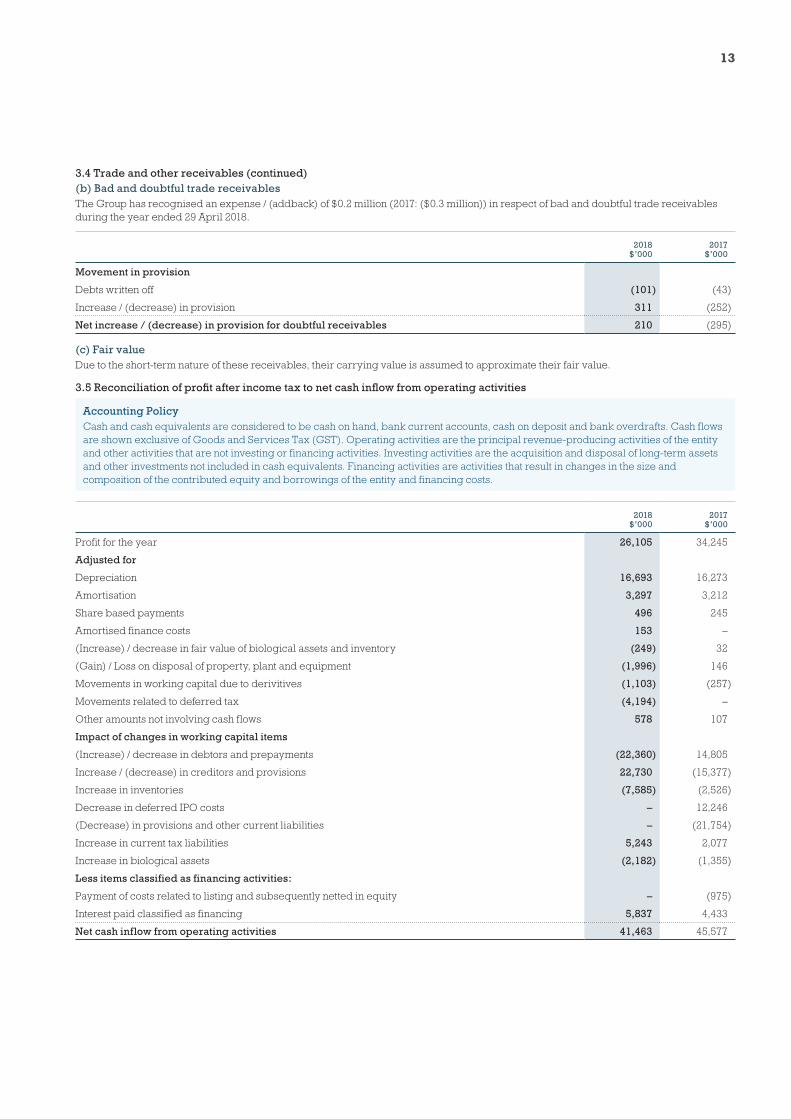
3.4 Trade and other receivables (continued)(b) Bad and doubtful trade receivablesThe Group has recognised an expense / (addback) of $0.2 million (2017: ($0.3 million)) in respect of bad and doubtful trade receivables during the year ended 29 April 2018.
2018$’000
2017$’000
Movement in provision
Debts written off (101) (43)
Increase / (decrease) in provision 311 (252)
Net increase / (decrease) in provision for doubtful receivables 210 (295)
(c) Fair valueDue to the short-term nature of these receivables, their carrying value is assumed to approximate their fair value.
3.5 Reconciliation of profit after income tax to net cash inflow from operating activities
Accounting PolicyCash and cash equivalents are considered to be cash on hand, bank current accounts, cash on deposit and bank overdrafts. Cash flows are shown exclusive of Goods and Services Tax (GST). Operating activities are the principal revenue-producing activities of the entity and other activities that are not investing or financing activities. Investing activities are the acquisition and disposal of long-term assets and other investments not included in cash equivalents. Financing activities are activities that result in changes in the size and composition of the contributed equity and borrowings of the entity and financing costs.
2018$’000
2017$’000
Profit for the year 26,105 34,245
Adjusted for
Depreciation 16,693 16,273
Amortisation 3,297 3,212
Share based payments 496 245
Amortised finance costs 153 –
(Increase) / decrease in fair value of biological assets and inventory (249) 32
(Gain) / Loss on disposal of property, plant and equipment (1,996) 146
Movements in working capital due to derivitives (1,103) (257)
Movements related to deferred tax (4,194) –
Other amounts not involving cash flows 578 107
Impact of changes in working capital items
(Increase) / decrease in debtors and prepayments (22,360) 14,805
Increase / (decrease) in creditors and provisions 22,730 (15,377)
Increase in inventories (7,585) (2,526)
Decrease in deferred IPO costs – 12,246
(Decrease) in provisions and other current liabilities – (21,754)
Increase in current tax liabilities 5,243 2,077
Increase in biological assets (2,182) (1,355)
Less items classified as financing activities:
Payment of costs related to listing and subsequently netted in equity – (975)
Interest paid classified as financing 5,837 4,433
Net cash inflow from operating activities 41,463 45,577
14 Tegel Financial Statements 2018
Notes to the financial statements (continued)29 April 2018
4 LONG TERM ASSETS
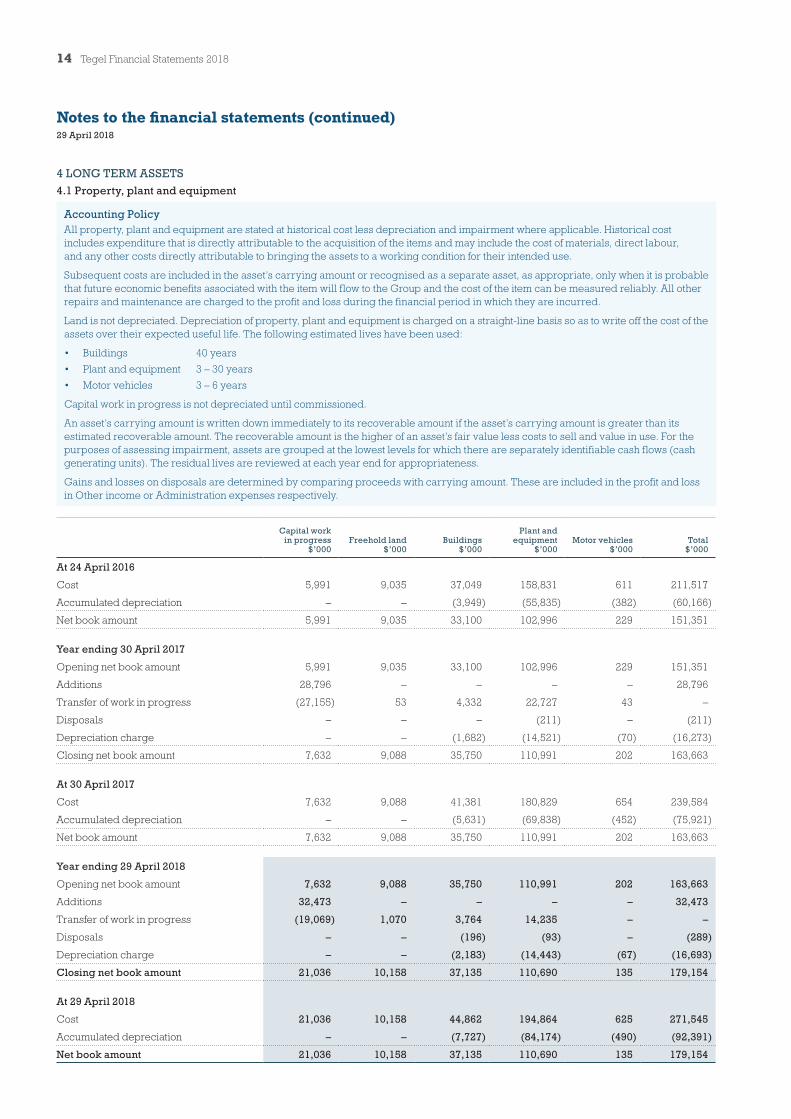
4.1 Property, plant and equipment
Accounting PolicyAll property, plant and equipment are stated at historical cost less depreciation and impairment where applicable. Historical cost includes expenditure that is directly attributable to the acquisition of the items and may include the cost of materials, direct labour, and any other costs directly attributable to bringing the assets to a working condition for their intended use.
Subsequent costs are included in the asset’s carrying amount or recognised as a separate asset, as appropriate, only when it is probable that future economic benefits associated with the item will f low to the Group and the cost of the item can be measured reliably. All other repairs and maintenance are charged to the profit and loss during the financial period in which they are incurred.
Land is not depreciated. Depreciation of property, plant and equipment is charged on a straight-line basis so as to write off the cost of the assets over their expected useful life. The following estimated lives have been used:
• Buildings 40 years
• Plant and equipment 3 – 30 years
• Motor vehicles 3 – 6 years
Capital work in progress is not depreciated until commissioned.
An asset’s carrying amount is written down immediately to its recoverable amount if the asset’s carrying amount is greater than its estimated recoverable amount. The recoverable amount is the higher of an asset’s fair value less costs to sell and value in use. For the purposes of assessing impairment, assets are grouped at the lowest levels for which there are separately identifiable cash flows (cash generating units). The residual lives are reviewed at each year end for appropriateness.
Gains and losses on disposals are determined by comparing proceeds with carrying amount. These are included in the profit and loss in Other income or Administration expenses respectively.
Capital work in progress
$’000Freehold land
$’000Buildings
$’000
Plant and equipment
$’000Motor vehicles
$’000Total
$’000
At 24 April 2016
Cost 5,991 9,035 37,049 158,831 611 211,517
Accumulated depreciation – – (3,949) (55,835) (382) (60,166)
Net book amount 5,991 9,035 33,100 102,996 229 151,351
Year ending 30 April 2017
Opening net book amount 5,991 9,035 33,100 102,996 229 151,351
Additions 28,796 – – – – 28,796
Transfer of work in progress (27,155) 53 4,332 22,727 43 –
Disposals – – – (211) – (211)
Depreciation charge – – (1,682) (14,521) (70) (16,273)
Closing net book amount 7,632 9,088 35,750 110,991 202 163,663
At 30 April 2017
Cost 7,632 9,088 41,381 180,829 654 239,584
Accumulated depreciation – – (5,631) (69,838) (452) (75,921)
Net book amount 7,632 9,088 35,750 110,991 202 163,663
Year ending 29 April 2018
Opening net book amount 7,632 9,088 35,750 110,991 202 163,663
Additions 32,473 – – – – 32,473
Transfer of work in progress (19,069) 1,070 3,764 14,235 – –
Disposals – – (196) (93) – (289)
Depreciation charge – – (2,183) (14,443) (67) (16,693)
Closing net book amount 21,036 10,158 37,135 110,690 135 179,154
At 29 April 2018
Cost 21,036 10,158 44,862 194,864 625 271,545
Accumulated depreciation – – (7,727) (84,174) (490) (92,391)
Net book amount 21,036 10,158 37,135 110,690 135 179,154
15
4.2 Intangible assets
Accounting Policy
(i) GoodwillGoodwill represents the excess of the consideration transferred and the acquisition date fair value of any previous equity interest in the acquiree over the fair value of the Group’s share of the identifiable net assets acquired. If this is less than the fair value of the net assets of the subsidiary acquired in the case of a bargain purchase, the difference is recognised directly in profit and loss.
Goodwill is not amortised but is tested for impairment annually or immediately if events or changes in circumstances indicate that there might be an impairment and is carried at cost less accumulated impairment losses.
(ii) Customer relationshipsCustomer relationships acquired in a business combination are recognised at fair value at the acquisition date. The Customer relationships have a finite useful life, assessed as 25 years, and are carried at cost less accumulated amortisation. Amortisation is calculated using the straight line method over the expected life of the customer relationship and classified within Administration expenses.
(iii) Brands Separately acquired trademarks and licences are shown at historical cost and represent the value of brands acquired. Trademarks and licences acquired in a business combination are recognised at fair value at the acquisition date. Trademarks are not amortised. Instead trademarks are tested for impairment annually, or immediately if events or changes in circumstances indicate that there might be impairment, and are carried at cost less accumulated impairment losses. Trademarks are considered to have an indefinite useful life due to the unique nature of the brand in the New Zealand market.
(iv) Computer softwareAcquired computer software licences are capitalised on the basis of the costs incurred to acquire and bring the specific software to use. These costs are amortised over their estimated useful lives (three to five years).
Costs associated with developing or maintaining computer software programmes are recognised as an expense as incurred. Costs that are directly associated with the production of identifiable and unique software products controlled by the Group, and that will probably generate economic benefits exceeding costs beyond one year, are recognised as intangible assets. Direct costs include the software development employee costs and an appropriate portion of relevant overheads.
(v) Other intangibles Other intangibles are payments made in the course of business that are capitalised over the term of the agreement to which they relate. This ranges from three to seven years. These costs are amortised over this same term.
16 Tegel Financial Statements 2018
Notes to the financial statements (continued)29 April 2018
4 LONG TERM ASSETS (CONTINUED)
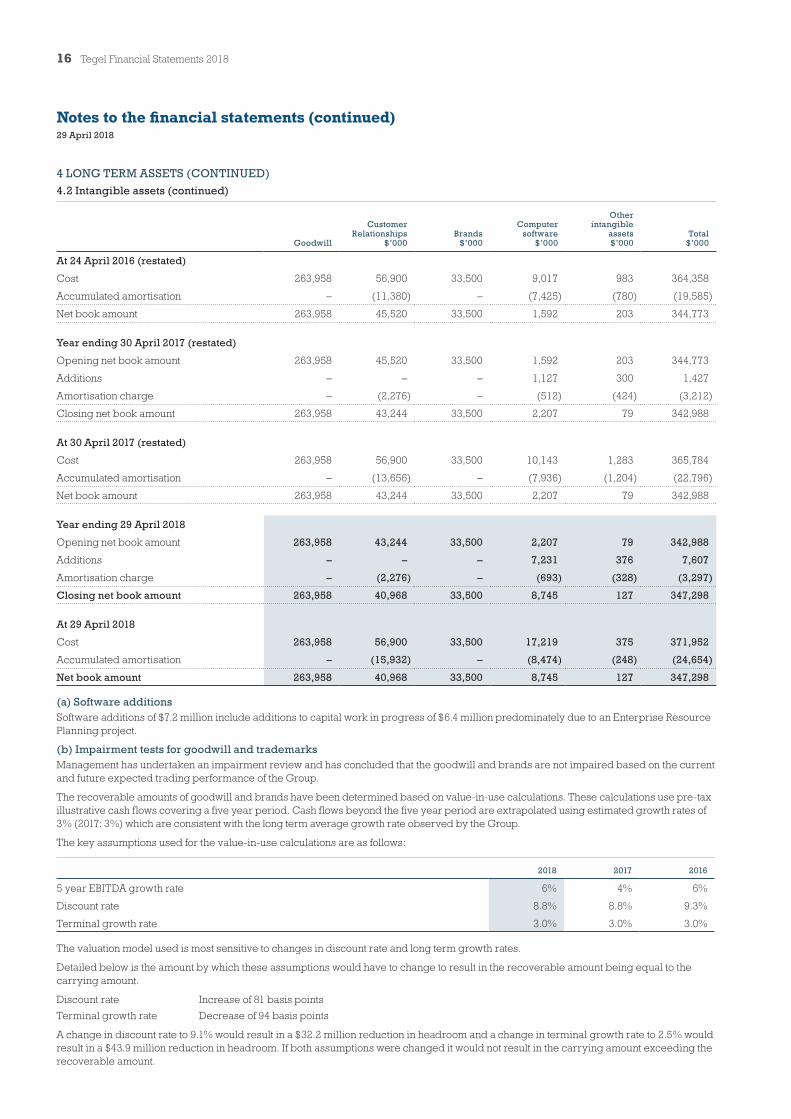
4.2 Intangible assets (continued)
Goodwill
Customer Relationships
$’000Brands
$’000
Computer software
$’000
Other intangible
assets$’000
Total$’000
At 24 April 2016 (restated)
Cost 263,958 56,900 33,500 9,017 983 364,358
Accumulated amortisation – (11,380) – (7,425) (780) (19,585)
Net book amount 263,958 45,520 33,500 1,592 203 344,773
Year ending 30 April 2017 (restated)
Opening net book amount 263,958 45,520 33,500 1,592 203 344,773
Additions – – – 1,127 300 1,427
Amortisation charge – (2,276) – (512) (424) (3,212)
Closing net book amount 263,958 43,244 33,500 2,207 79 342,988
At 30 April 2017 (restated)
Cost 263,958 56,900 33,500 10,143 1,283 365,784
Accumulated amortisation – (13,656) – (7,936) (1,204) (22,796)
Net book amount 263,958 43,244 33,500 2,207 79 342,988
Year ending 29 April 2018
Opening net book amount 263,958 43,244 33,500 2,207 79 342,988
Additions – – – 7,231 376 7,607
Amortisation charge – (2,276) – (693) (328) (3,297)
Closing net book amount 263,958 40,968 33,500 8,745 127 347,298
At 29 April 2018
Cost 263,958 56,900 33,500 17,219 375 371,952
Accumulated amortisation – (15,932) – (8,474) (248) (24,654)
Net book amount 263,958 40,968 33,500 8,745 127 347,298
(a) Software additionsSoftware additions of $7.2 million include additions to capital work in progress of $6.4 million predominately due to an Enterprise Resource Planning project.
(b) Impairment tests for goodwill and trademarksManagement has undertaken an impairment review and has concluded that the goodwill and brands are not impaired based on the current and future expected trading performance of the Group.
The recoverable amounts of goodwill and brands have been determined based on value-in-use calculations. These calculations use pre-tax illustrative cash flows covering a five year period. Cash flows beyond the five year period are extrapolated using estimated growth rates of 3% (2017: 3%) which are consistent with the long term average growth rate observed by the Group.
The key assumptions used for the value-in-use calculations are as follows:
2018 2017 2016
5 year EBITDA growth rate 6% 4% 6%
Discount rate 8.8% 8.8% 9.3%
Terminal growth rate 3.0% 3.0% 3.0%
The valuation model used is most sensitive to changes in discount rate and long term growth rates.
Detailed below is the amount by which these assumptions would have to change to result in the recoverable amount being equal to the carrying amount.
Discount rate Increase of 81 basis points
Terminal growth rate Decrease of 94 basis points
A change in discount rate to 9.1% would result in a $32.2 million reduction in headroom and a change in terminal growth rate to 2.5% would result in a $43.9 million reduction in headroom. If both assumptions were changed it would not result in the carrying amount exceeding the recoverable amount.

17
However, a significant change in assumptions such as a discount rate of 9.1% and a terminal growth rate of 2% would result in an impairment of $13.7 million.
Value in respect of current Takeover offer by Bounty Holdings New Zealand Limited (Bounty)In assessing the recoverable value of goodwill, the Directors have considered the terms of the current takeover offer by Bounty. The effective offer price of $1.271 is below the Group’s Net Assets on a per share basis of $1.357. Adjusting goodwill to an effective net asset value per share of $1.271 (consistent with the effective offer price), would result in an impairment of $30.6 million.
No adjustment has been made in these accounts for any potential impairment after giving consideration to:
1. The value-in-use model outlined above showing no impairment being required;
2. The independent adviser report providing a valuation range of $1.15 - $1.39 per share, the range including the Net Asset per share value of $1.357;
3. The Directors have formed an assessment of the current offer and provided a recommendation to accept the offer in the Target Company Statement dated 11 June 2018, noting in particular that Bounty has already achieved a majority shareholder position and any remaining shareholders would hold a minority. However as noted in that recommendation, shareholders with a longer term risk profile should consider holding onto their shares. This gives consideration to the long term value shown by the company’s value-in-use model and implied by the top end of the independent valuers report.
4.3 Commitments
Accounting policy
Operating leasesLeases in which a significant portion of the risks and rewards of ownership are retained by the lessor are classified as operating leases. Payments made under operating leases (net of any incentives received from the lessor) are charged to the profit and loss on a straight-line basis over the period of the lease.
The Group leases certain property, plant and equipment which are classified as operating leases as the lessor has retained substantially all the risks and rewards of ownership.
(a) Operating lease commitmentsOperating leases held over properties give the Group the right to renew the lease subject to a redetermination of the lease rental by the lessor.
2018$’000
2017$’000
Commitments for minimum lease payments in relation to non-cancellable operating leases are payable as follows:
Within one year 28,594 23,876
Later than one year but not later than five years 89,223 75,268
Later than five years 185,845 104,884
303,662 204,028
(b) Other commitments for expenditure
2018$’000
2017$’000
Raw material purchasing commitments are as follows:
Within one year 55,205 76,716
55,205 76,716
The Group has contracts with growers which require certain minimum standards to be met. The next renewal date for approximately 44% of these contracts is 30 April 2019 with the renewal date for the remaining contracts between 4 and 25 years. The amount committed to be paid within the next year is $25.0 million (2017: $18.6 million).
(c) Capital commitmentsCapital expenditure contracted for at the reporting date but not recognised as liabilities is as follows:
2018$’000
2017$’000
Property, plant and equipment and intangibles 7,228 8,985
7,228 8,985
(d) Letter of credit
2018$’000
2017$’000
Letters of credit issued as at reporting date for purchase of capital items due for delivery after balance date – 2,090
18 Tegel Financial Statements 2018
Notes to the financial statements (continued)29 April 2018
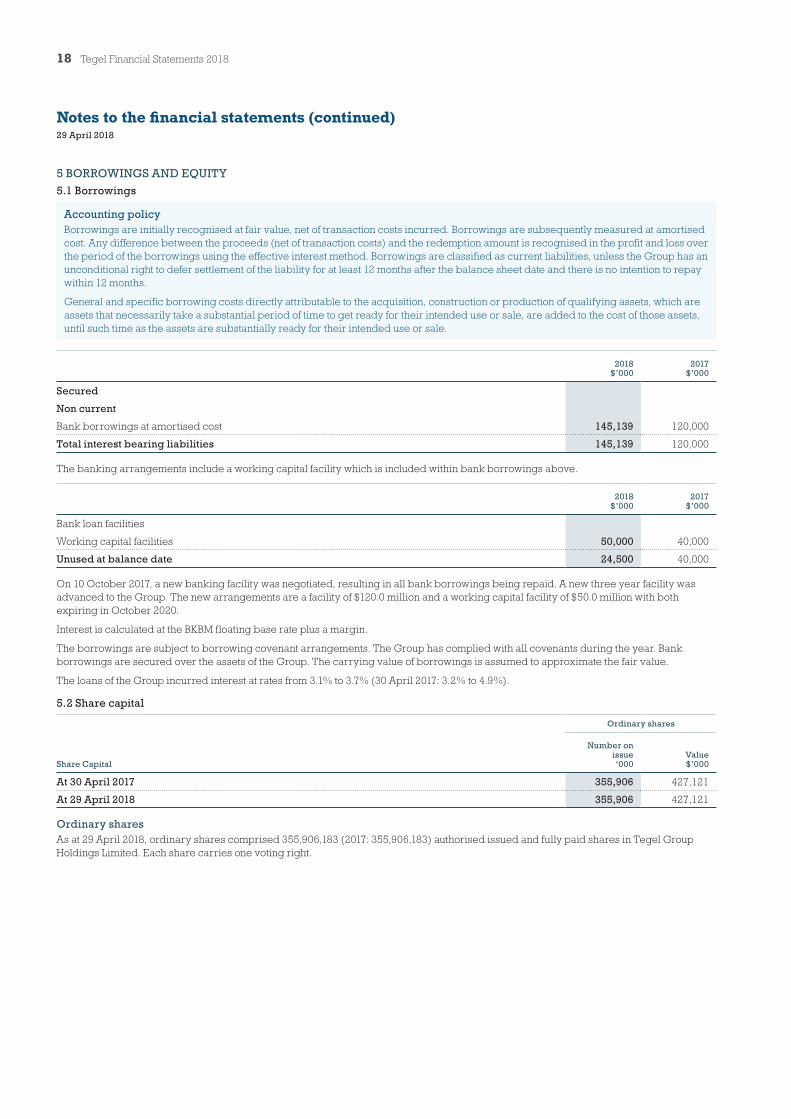
5 BORROWINGS AND EQUITY
5.1 Borrowings
Accounting policyBorrowings are initially recognised at fair value, net of transaction costs incurred. Borrowings are subsequently measured at amortised cost. Any difference between the proceeds (net of transaction costs) and the redemption amount is recognised in the profit and loss over the period of the borrowings using the effective interest method. Borrowings are classified as current liabilities, unless the Group has an unconditional right to defer settlement of the liability for at least 12 months after the balance sheet date and there is no intention to repay within 12 months.
General and specific borrowing costs directly attributable to the acquisition, construction or production of qualifying assets, which are assets that necessarily take a substantial period of time to get ready for their intended use or sale, are added to the cost of those assets, until such time as the assets are substantially ready for their intended use or sale.
2018$’000
2017$’000
Secured
Non current
Bank borrowings at amortised cost 145,139 120,000
Total interest bearing liabilities 145,139 120,000
The banking arrangements include a working capital facility which is included within bank borrowings above.
2018$’000
2017$’000
Bank loan facilities
Working capital facilities 50,000 40,000
Unused at balance date 24,500 40,000
On 10 October 2017, a new banking facility was negotiated, resulting in all bank borrowings being repaid. A new three year facility was advanced to the Group. The new arrangements are a facility of $120.0 million and a working capital facility of $50.0 million with both expiring in October 2020.
Interest is calculated at the BKBM floating base rate plus a margin.
The borrowings are subject to borrowing covenant arrangements. The Group has complied with all covenants during the year. Bank borrowings are secured over the assets of the Group. The carrying value of borrowings is assumed to approximate the fair value.
The loans of the Group incurred interest at rates from 3.1% to 3.7% (30 April 2017: 3.2% to 4.9%).
5.2 Share capital
Ordinary shares
Share Capital
Number on issue‘000
Value$’000
At 30 April 2017 355,906 427,121
At 29 April 2018 355,906 427,121
Ordinary sharesAs at 29 April 2018, ordinary shares comprised 355,906,183 (2017: 355,906,183) authorised issued and fully paid shares in Tegel Group Holdings Limited. Each share carries one voting right.
19
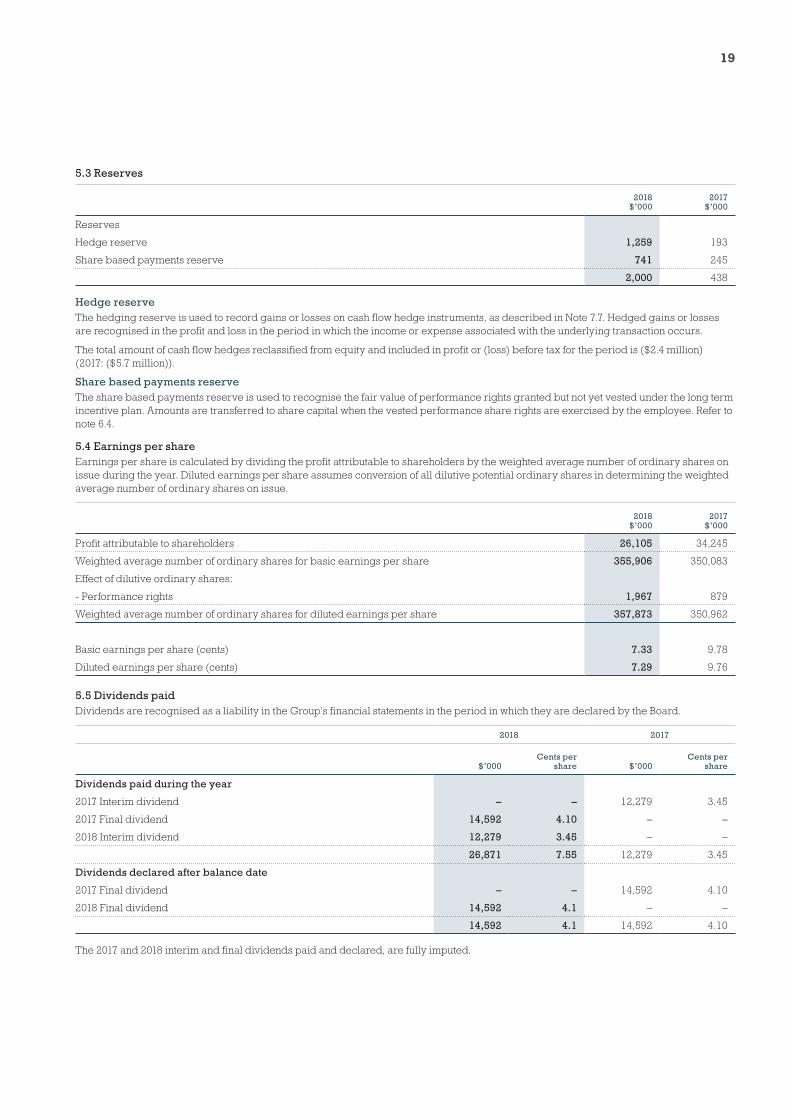
5.3 Reserves
2018$’000
2017$’000
Reserves
Hedge reserve 1,259 193
Share based payments reserve 741 245
2,000 438
Hedge reserveThe hedging reserve is used to record gains or losses on cash flow hedge instruments, as described in Note 7.7. Hedged gains or losses are recognised in the profit and loss in the period in which the income or expense associated with the underlying transaction occurs.
The total amount of cash flow hedges reclassified from equity and included in profit or (loss) before tax for the period is ($2.4 million) (2017: ($5.7 million)).
Share based payments reserveThe share based payments reserve is used to recognise the fair value of performance rights granted but not yet vested under the long term incentive plan. Amounts are transferred to share capital when the vested performance share rights are exercised by the employee. Refer to note 6.4.
5.4 Earnings per shareEarnings per share is calculated by dividing the profit attributable to shareholders by the weighted average number of ordinary shares on issue during the year. Diluted earnings per share assumes conversion of all dilutive potential ordinary shares in determining the weighted average number of ordinary shares on issue.
2018$’000
2017$’000
Profit attributable to shareholders 26,105 34,245
Weighted average number of ordinary shares for basic earnings per share 355,906 350,083
Effect of dilutive ordinary shares:
- Performance rights 1,967 879
Weighted average number of ordinary shares for diluted earnings per share 357,873 350,962
Basic earnings per share (cents) 7.33 9.78
Diluted earnings per share (cents) 7.29 9.76
5.5 Dividends paidDividends are recognised as a liability in the Group’s financial statements in the period in which they are declared by the Board.
2018 2017
$’000Cents per
share $’000Cents per
share
Dividends paid during the year
2017 Interim dividend – – 12,279 3.45
2017 Final dividend 14,592 4.10 – –
2018 Interim dividend 12,279 3.45 – –
26,871 7.55 12,279 3.45
Dividends declared after balance date
2017 Final dividend – – 14,592 4.10
2018 Final dividend 14,592 4.1 – –
14,592 4.1 14,592 4.10
The 2017 and 2018 interim and final dividends paid and declared, are fully imputed.

20 Tegel Financial Statements 2018
Notes to the financial statements (continued)29 April 2018
6 OTHER
6.1 Taxation
Accounting PolicyThe tax expense for the period comprises current and deferred tax. Tax is recognised in the income statement, except to the extent that it relates to items recognised in other comprehensive income or directly in equity. In this case, the tax is also recognised in other comprehensive income or directly in equity, respectively.
Deferred income tax is recognised, using the liability method, on temporary differences arising between the tax bases of assets and liabilities and their carrying amounts in the consolidated financial statements. However, deferred tax liabilities are not recognised if they arise from the initial recognition of goodwill; deferred income tax is not accounted for if it arises from initial recognition of an asset or liability in a transaction other than a business combination that at the time of the transaction affects neither accounting nor taxable profit or loss. Deferred income tax is determined using tax rates (and laws) that have been enacted or substantially enacted by the balance sheet date and are expected to apply when the related deferred income tax asset is realised or the deferred income tax liability is settled.
Deferred income tax assets are recognised only to the extent that it is probable that future taxable profit will be available against which the temporary differences can be utilised.
2018$’000
2017$’000
(a) Income tax expense
Current tax
Current tax on profits for the year 14,138 14,058
Over provided in prior years (176) (567)
Total current tax 13,962 13,491
Deferred tax
Origination and reversal of temporary differences (4,481) (538)
Under provided in prior years 287 680
Total deferred tax (benefit) / expense through profit and loss (4,194) 142
Income tax expense 9,768 13,633
(b) Numerical reconciliation of income tax expense to prima facie tax payable
Profit from continuing operations before income tax expense 35,873 47,878
Tax calculated at domestic tax rate applicable to profits at 28% 10,044 13,406
Tax effect of amounts which are not deductible (taxable) in calculating taxable income:
Non-taxable (gain) / loss on the sale of property, plant and equipment (394) 40
Non deductible expenses 75 105
Revaluation of fair value of biological assets (70) 9
Sundry items including under provided in prior years 113 73
Income tax expense 9,768 13,633

21
(c) Deferred tax liabilities
2018$’000
Restated2017
$’000
The balance comprises temporary differences attributable to:
Provisions for doubtful debts, inventory and employee benefits (4,217) (678)
Property, plant and equipment 8,309 8,327
Cash flow hedge reserve 490 76
Customer relationships 11,471 12,108
Brands 9,380 9,380
Net deferred tax liabilities 25,433 29,213
Movements in deferred tax:
Opening balance 29,213 27,773
(Credited) / charged to the income statement
Provisions for doubtful debts, inventory and employee benefits (3,539) 497
Property, plant and equipment (18) 281
Customer relationships (637) (638)
(4,194) 140
Charged directly to equity
Cash flow hedge reserve 414 1,300
Closing balance 25,433 29,213
(d) Imputation credit accountThe amount of imputation credits at balance date available for future distribution is set out below:
2018$’000
2017$’000
Closing balance 14,348 10,616
Certain Group subsidiary companies and the parent form a consolidated group for income tax purposes. The Group imputation credit account reported above is for this tax group and is available to shareholders either directly or indirectly through their shareholding in the parent company.
Imputation credits remaining after distribution of the final 2018 dividend are estimated to be c$9.2 million. To the extent not otherwise utilised, these will no longer be available to shareholders, if all conditions of the Bounty takeover offer are met resulting in a change of shareholding exceeding 66%. (Refer note 1.4).
6.2 Expenses
2018$’000
2017$’000
Profit before income tax includes the following specific expenses:
Operating lease payments 29,461 28,331
Employee benefits
Wages, salaries and other employment costs 140,177 135,914
Directors’ fees 343 382
Contributions to defined contribution superannuation plans 4,140 3,864
Share based payments expense 496 245
145,156 140,405
22 Tegel Financial Statements 2018
Notes to the financial statements (continued)29 April 2018
6 OTHER (CONTINUED)
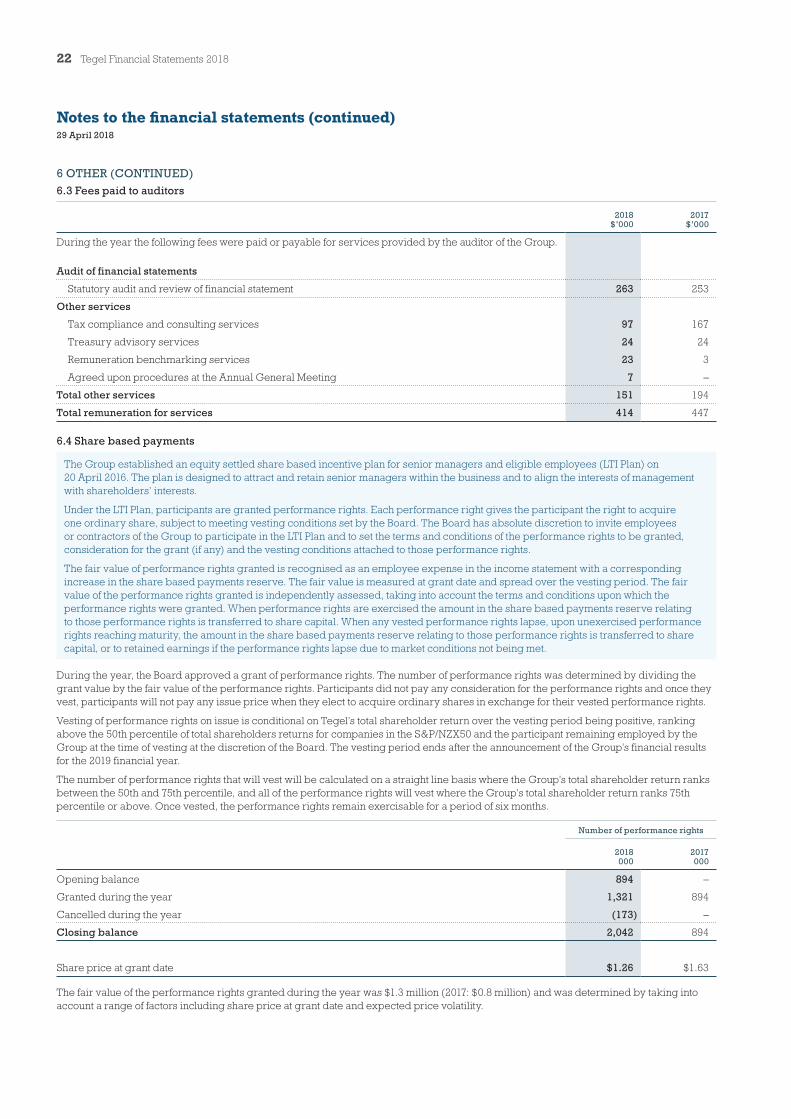
6.3 Fees paid to auditors
2018$’000
2017$’000
During the year the following fees were paid or payable for services provided by the auditor of the Group.
Audit of financial statements
Statutory audit and review of financial statement 263 253
Other services
Tax compliance and consulting services 97 167
Treasury advisory services 24 24
Remuneration benchmarking services 23 3
Agreed upon procedures at the Annual General Meeting 7 –
Total other services 151 194
Total remuneration for services 414 447
6.4 Share based payments
The Group established an equity settled share based incentive plan for senior managers and eligible employees (LTI Plan) on 20 April 2016. The plan is designed to attract and retain senior managers within the business and to align the interests of management with shareholders’ interests.
Under the LTI Plan, participants are granted performance rights. Each performance right gives the participant the right to acquire one ordinary share, subject to meeting vesting conditions set by the Board. The Board has absolute discretion to invite employees or contractors of the Group to participate in the LTI Plan and to set the terms and conditions of the performance rights to be granted, consideration for the grant (if any) and the vesting conditions attached to those performance rights.
The fair value of performance rights granted is recognised as an employee expense in the income statement with a corresponding increase in the share based payments reserve. The fair value is measured at grant date and spread over the vesting period. The fair value of the performance rights granted is independently assessed, taking into account the terms and conditions upon which the performance rights were granted. When performance rights are exercised the amount in the share based payments reserve relating to those performance rights is transferred to share capital. When any vested performance rights lapse, upon unexercised performance rights reaching maturity, the amount in the share based payments reserve relating to those performance rights is transferred to share capital, or to retained earnings if the performance rights lapse due to market conditions not being met.
During the year, the Board approved a grant of performance rights. The number of performance rights was determined by dividing the grant value by the fair value of the performance rights. Participants did not pay any consideration for the performance rights and once they vest, participants will not pay any issue price when they elect to acquire ordinary shares in exchange for their vested performance rights.
Vesting of performance rights on issue is conditional on Tegel’s total shareholder return over the vesting period being positive, ranking above the 50th percentile of total shareholders returns for companies in the S&P/NZX50 and the participant remaining employed by the Group at the time of vesting at the discretion of the Board. The vesting period ends after the announcement of the Group’s financial results for the 2019 financial year.
The number of performance rights that will vest will be calculated on a straight line basis where the Group’s total shareholder return ranks between the 50th and 75th percentile, and all of the performance rights will vest where the Group’s total shareholder return ranks 75th percentile or above. Once vested, the performance rights remain exercisable for a period of six months.
Number of performance rights
2018000
2017000
Opening balance 894 –
Granted during the year 1,321 894
Cancelled during the year (173) –
Closing balance 2,042 894
Share price at grant date $1.26 $1.63
The fair value of the performance rights granted during the year was $1.3 million (2017: $0.8 million) and was determined by taking into account a range of factors including share price at grant date and expected price volatility.
23
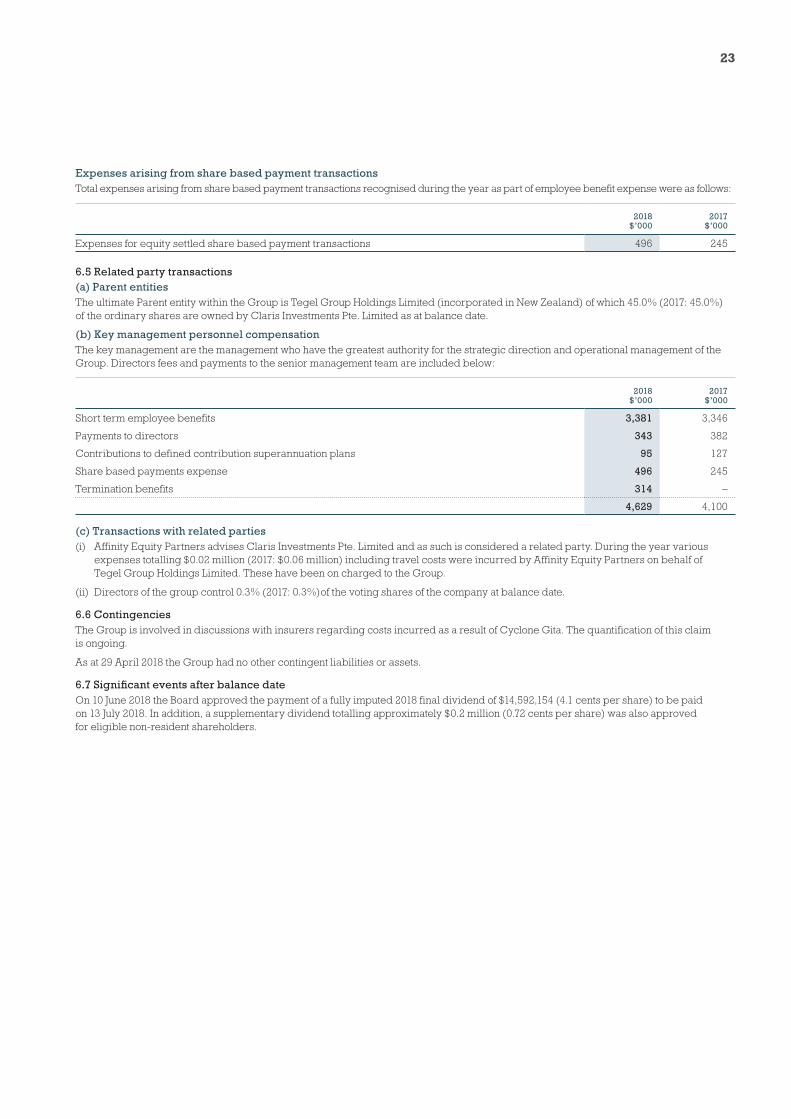
Expenses arising from share based payment transactionsTotal expenses arising from share based payment transactions recognised during the year as part of employee benefit expense were as follows:
2018$’000
2017$’000
Expenses for equity settled share based payment transactions 496 245
6.5 Related party transactions(a) Parent entitiesThe ultimate Parent entity within the Group is Tegel Group Holdings Limited (incorporated in New Zealand) of which 45.0% (2017: 45.0%) of the ordinary shares are owned by Claris Investments Pte. Limited as at balance date.
(b) Key management personnel compensationThe key management are the management who have the greatest authority for the strategic direction and operational management of the Group. Directors fees and payments to the senior management team are included below:
2018$’000
2017$’000
Short term employee benefits 3,381 3,346
Payments to directors 343 382
Contributions to defined contribution superannuation plans 95 127
Share based payments expense 496 245
Termination benefits 314 –
4,629 4,100
(c) Transactions with related parties(i) Affinity Equity Partners advises Claris Investments Pte. Limited and as such is considered a related party. During the year various
expenses totalling $0.02 million (2017: $0.06 million) including travel costs were incurred by Affinity Equity Partners on behalf of Tegel Group Holdings Limited. These have been on charged to the Group.
(ii) Directors of the group control 0.3% (2017: 0.3%)of the voting shares of the company at balance date.
6.6 ContingenciesThe Group is involved in discussions with insurers regarding costs incurred as a result of Cyclone Gita. The quantification of this claim is ongoing.
As at 29 April 2018 the Group had no other contingent liabilities or assets.
6.7 Significant events after balance dateOn 10 June 2018 the Board approved the payment of a fully imputed 2018 final dividend of $14,592,154 (4.1 cents per share) to be paid on 13 July 2018. In addition, a supplementary dividend totalling approximately $0.2 million (0.72 cents per share) was also approved for eligible non-resident shareholders.
24 Tegel Financial Statements 2018
Notes to the financial statements (continued)29 April 2018
6 OTHER (CONTINUED)
6.8 Other accounting policies
(a) Principles of consolidationSubsidiaries are all entities over which the Group has control. The Group controls an entity when the Group is exposed to, or has rights to, variable returns from its involvement with the entity and has the ability to affect those returns through its power over the entity. Subsidiaries are fully consolidated from the date on which control is transferred to the Group. They are deconsolidated from the date that control ceases.
Intercompany transactions, balances and unrealised gains on transactions between Group companies are eliminated. Accounting policies of subsidiaries have been changed where necessary to ensure consistency with the policies adopted by the Group.
(b) Foreign currency translation(i) Functional and presentation currencyItems included in the financial statements of each of the Group’s entities are measured using the currency of the primary economic environment in which the entity operates (the ‘functional currency’). The consolidated financial statements are presented in New Zealand dollars, which is the Group’s functional and presentation currency.
(ii) Transactions and balancesForeign currency transactions are translated into the functional currency using the exchange rates prevailing at the dates of the transactions. Foreign exchange gains and losses resulting from the settlement of such transactions and from the translation at year-end exchange rates of monetary assets and liabilities denominated in foreign currencies are recognised in profit and loss.
(c) Goods and Services Tax (GST)The income statement and the statement of cash flows have been prepared so that all components are stated exclusive of GST. All items in the balance sheet are stated net of GST, with the exception of receivables and payables, which include GST invoiced.
(d) ProvisionsProvisions are recognised when the Group has a present legal or constructive obligation as a result of past events; it is probable that an outflow of resources will be required to settle the obligation; and the amount has been reliably estimated. Provisions are not recognised for future operating losses.
Where there are a number of similar obligations, the likelihood that an outflow will be required in settlement is determined by considering the class of obligations as a whole. A provision is recognised even if the likelihood of an outflow with respect to any one item included in the same class of obligations may be small.
(e) Sale and leasebackWhen a sale and leaseback results in a finance lease, any gain on the sale is deferred and recognised as income over the lease term. Any loss on the sale is immediately recognised as an impairment loss when the sale occurs. If the leaseback is classified as an operating lease, then any gain is recognised immediately if the sale and leaseback terms are demonstrably at fair value.
(f) New standards and interpretations not yet adoptedA number of new standards and amendments to standards and interpretations are effective for annual periods beginning on or after 29 April 2018 and have not been applied in preparing these consolidated financial statements. None of these are expected to have a significant effect on the consolidated financial statements of the Group, except the following set out below:
NZ IFRS 16: LeasesNZ IFRS 16, ‘Leases’, replaces the current guidance in NZ IAS 17. Under NZ IFRS 16, a contract is, or contains, a lease if the contract conveys the right to control the use of an identified asset for a period of time in exchange for consideration. Under NZ IAS 17, a lessee was required to make a distinction between a finance lease (on balance sheet) and an operating lease (off balance sheet). NZ IFRS 16 now requires a lessee to recognise a lease liability reflecting future lease payments and a ‘right-of-use asset’ for virtually all lease contracts. Included is an optional exemption for certain short-term leases and leases of low-value assets; however, this exemption can only be applied by lessees.
The standard is effective for accounting periods beginning on or after 1 January 2019. Early adoption is permitted but only in conjunction with NZ IFRS 15, ‘Revenue from Contracts with Customers’.
The Group intends to adopt NZ IFRS 16 on its effective date and is currently assessing its full impact.
NZ IFRS 15: Revenue from contracts with customers NZ IFRS 15, ‘Revenue from contracts with customers’ establishes the framework for revenue recognition. The standard replaces NZ IAS 18 ‘Revenue’ and NZ IAS 11 ‘Construction contracts’ and related interpretations. The standard is effective for annual periods beginning on or after 1 January 2018 and earlier application is permitted.
The new standard is based on the principle that revenue is recognised when control of a good or services transfers to a customer. The notion of control replaces the existing notion of risks and rewards.
The group intends to adopt NZ IFRS 15 on its effective date and is currently assessing its full impact. This standard is not expected to significantly impact the Group.
NZ IFRS 9: Financial instrumentsNZ IFRS 9. ‘Financial instruments’ replaces NZ IAS 39 ‘Financial Instruments: Recognition and measurement. The standard is effective for annual periods beginning on or after 1 January 2018 and earlier application is permitted.
The new standard addresses the classification, measurement and derecognition of financial assets and financial liabilities, introduces new rules for hedge accounting and introduced a new impairment model.
The group intends to adopt NZ IFRS 9 on its effective date and is currently assessing its full impact. The standard is not expected to significantly impact the Group.
25
7 FINANCIAL RISK MANAGEMENT
7.1 Financial instruments by category
Accounting Policy
Offsetting financial instrumentsFinancial instruments and liabilities are offset and the net amount reported in the balance sheet when there is a legally enforceable right to offset the recognised amounts and there is an intention to settle on a net basis or realise the assets and settle the liability simultaneously.
The Group’s activities expose it to a variety of material financial risks including currency, interest rate, credit, and liquidity risks. The Group’s overall risk management program focuses on the unpredictability of financial markets and seeks to minimise potential adverse effects on the financial performance of the Group. The Group uses different methods to measure and mitigate different types of risk to which it is exposed. Risk management is carried out under policies approved by the Board of Directors and executive management. The financial instruments are classified in the following way:
Financial instruments Classification Explanation
Derivatives Fair value through profit and loss These instruments are used to hedge currency movements and changes to interest rates.
Cash and cash equivalents
Loans and receivables and liabilities held at amortised cost. The carrying amount is considered a reasonable approximation of fair value due to their nature and the impact of discounting not being significant.
These relate to the normal operating needs of the business and the day-to-day operations.
Trade and other receivables
Trade and other payables
Borrowings
7.2 Credit riskCredit risk is managed on a Group basis. Credit risk arises from cash and cash equivalents, derivative financial instruments, as well as credit exposures to receivables from customers. For banks and financial institutions, only independently rated parties with a minimum rating of ‘A’ are acceptable.
If wholesale customers are independently rated, there ratings are used. Otherwise, if there is no independent rating, credit risk of customers is managed by credit checking procedures and the application of and adherence to credit limits. The Group uses several tools to mitigate upfront risk including the use of independent credit ratings, credit references, past experience, financial reviews and obtaining security assets.
The maximum credit risk on cash and cash equivalents, trade and other receivables and derivative financial instruments is best represented by their carrying amounts.
7.3 Market risk(i) Cash flow and fair value interest rate riskThe Group’s interest rate risk arises from long term borrowings. Borrowings issued at variable rates expose the Group to cash flow interest rate risk. Borrowings issued at fixed rates expose the Group to fair value interest rate risk. The Group manages its cash flow interest rate risk within the parameters of its banking facility agreements, including the use of Board approved instruments such as interest rate swaps.
(ii) Foreign exchange riskForeign exchange risk arises when future operational transactions and recognised assets and liabilities are denominated in a currency that is not the entity’s functional currency.
Forward contracts are the key instrument used to manage foreign exchange risk although other derivatives approved by the Board may be used from time to time.
The Group’s material exposure during the reporting period was to USD and AUD denominated grain and other animal feed imports, and AUD denominated export sales.
(iii) Summarised sensitivity analysisAs cash balances are not subject to foreign exchange risk, these have been excluded from this analysis. Interest rate risk and foreign exchange risk assumptions have been made on estimated changes in the market.
Interest rate riskAt 29 April 2018 if market interest rates had been 1% higher/lower with all other variables held constant, post tax profit for the year would have been $0.9 million (2017: $0.9 million) lower/higher mainly as a result of higher/lower interest expense on floating borrowings.
Foreign exchange riskAt 29 April 2018 if foreign exchange rates had been 10% higher with all other variables held constant, equity would have been $1.3 million (2017: $2.0 million) lower as a result of a change in fair value of derivatives designated as cash flow hedges.
At 29 April 2018 if foreign exchange rates had been 10% lower with all other variables held constant, equity would have been $1.6. million (2017: $2.5 million) higher as a result of an increase in fair value of derivatives designated as cash flow hedges.

26 Tegel Financial Statements 2018
Notes to the financial statements (continued)29 April 2018
7. FINANCIAL RISK MANAGEMENT (CONTINUED)
7.4 Liquidity riskPrudent liquidity risk management implies maintaining sufficient cash, the availability of funding through an adequate amount of committed credit facilities and the ability to pay debts when they fall due.
The Group was in compliance with all of its banking facility agreements as at 29 April 2018.
Maturities of financial liabilitiesThe tables below analyse the Group’s financial liabilities into relevant maturity groupings based on the remaining period from the reporting date to the contractual maturity date. The amounts disclosed in the table are calculated using estimated cash outflows. Interest rate swaps cash outflows have been calculated using the forward interest rates applicable at the reporting date.
Less than 1 year
$’000
Between 1 and 2 years
$’000
Between 2and 5 years
$’000
Over 5 years
$’000
Total contractual cash flows
$’000
Carrying amount
liabilities$’000
29 April 2018
Trade payables 89,330 – – – 89,330 89,330
Interest Bearing Liabilities 5,283 5,283 147,859 – 158,425 145,139
Forward foreign exchange contracts inflow (7,445) – – – (7,445) –
Forward foreign exchange contracts outflow 7,460 – – – 7,460 –
Net Forward foreign exchange contracts 15 – – – 15 29
Total 94,628 5,283 147,859 – 247,770 234,498
30 April 2017
Trade payables 66,600 – – – 66,600 66,600
Interest Bearing Liabilities 4,128 2,126 120,000 – 126,254 120,000
Forward foreign exchange contracts inflow (91,894) – – – (91,894) –
Forward foreign exchange contracts outflow 93,882 – – – 93,882 –
Net Forward foreign exchange contracts 1,988 – – – 1,988 1,978
Total 72,716 2,126 120,000 – 194,842 188,578
7.5 Capital risk managementThe Group’s objectives when managing capital are to safeguard their ability to continue as a going concern and to maintain an optimal capital structure, so that they can continue to provide returns for shareholders and benefits for other stakeholders.
In order to maintain or adjust the capital structure, the Group may adjust the amount of dividends paid to shareholders, return capital to shareholders, issue new shares, sell assets or apply cash reserves to reduce debt.
The Group monitors capital, being the total equity of the group in conjunction with the financial undertakings pursuant to its debt financing agreements. These financial undertakings include an Interest Cover Ratio, Senior Leverage Ratio and Debt Service Cover Ratio. The Group ensures that it operates within the parameters of these financial undertakings at all times.
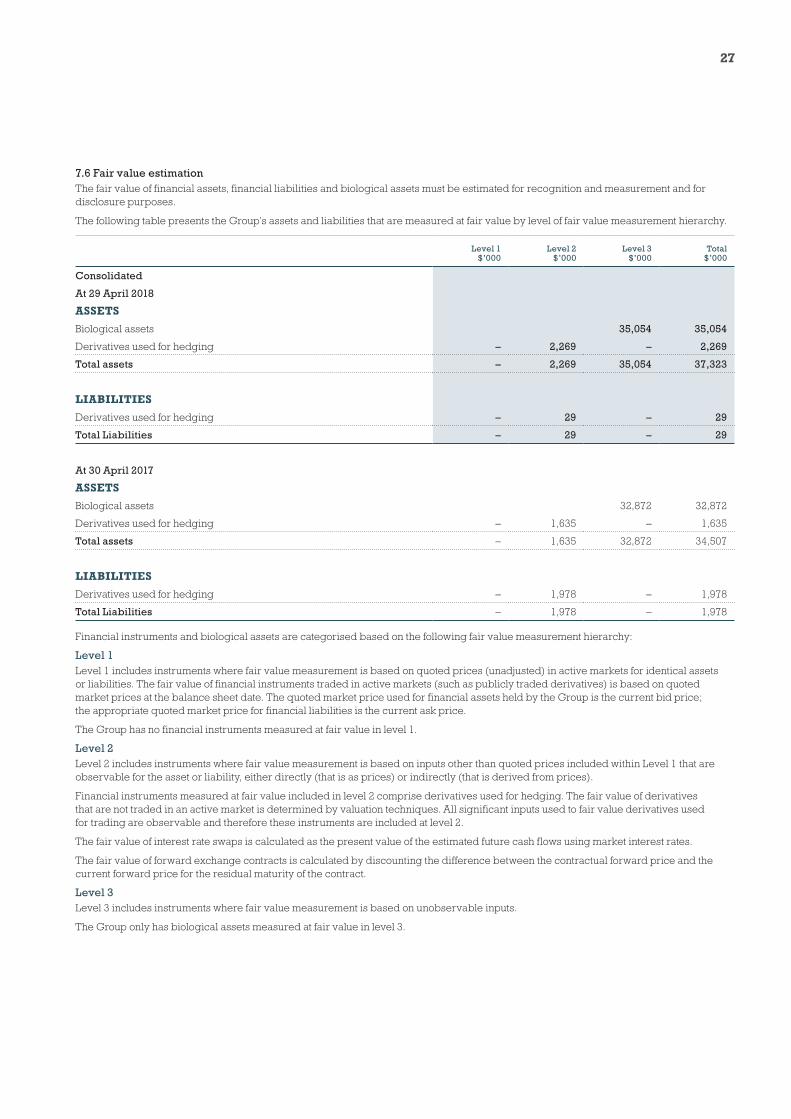
27
7.6 Fair value estimationThe fair value of financial assets, financial liabilities and biological assets must be estimated for recognition and measurement and for disclosure purposes.
The following table presents the Group’s assets and liabilities that are measured at fair value by level of fair value measurement hierarchy.
Level 1$’000
Level 2$’000
Level 3$’000
Total$’000
Consolidated
At 29 April 2018
ASSETS
Biological assets 35,054 35,054
Derivatives used for hedging – 2,269 – 2,269
Total assets – 2,269 35,054 37,323
LIABILITIES
Derivatives used for hedging – 29 – 29
Total Liabilities – 29 – 29
At 30 April 2017
ASSETS
Biological assets 32,872 32,872
Derivatives used for hedging – 1,635 – 1,635
Total assets – 1,635 32,872 34,507
LIABILITIES
Derivatives used for hedging – 1,978 – 1,978
Total Liabilities – 1,978 – 1,978
Financial instruments and biological assets are categorised based on the following fair value measurement hierarchy:
Level 1Level 1 includes instruments where fair value measurement is based on quoted prices (unadjusted) in active markets for identical assets or liabilities. The fair value of financial instruments traded in active markets (such as publicly traded derivatives) is based on quoted market prices at the balance sheet date. The quoted market price used for financial assets held by the Group is the current bid price; the appropriate quoted market price for financial liabilities is the current ask price.
The Group has no financial instruments measured at fair value in level 1.
Level 2Level 2 includes instruments where fair value measurement is based on inputs other than quoted prices included within Level 1 that are observable for the asset or liability, either directly (that is as prices) or indirectly (that is derived from prices).
Financial instruments measured at fair value included in level 2 comprise derivatives used for hedging. The fair value of derivatives that are not traded in an active market is determined by valuation techniques. All significant inputs used to fair value derivatives used for trading are observable and therefore these instruments are included at level 2.
The fair value of interest rate swaps is calculated as the present value of the estimated future cash flows using market interest rates.
The fair value of forward exchange contracts is calculated by discounting the difference between the contractual forward price and the current forward price for the residual maturity of the contract.
Level 3Level 3 includes instruments where fair value measurement is based on unobservable inputs.
The Group only has biological assets measured at fair value in level 3.
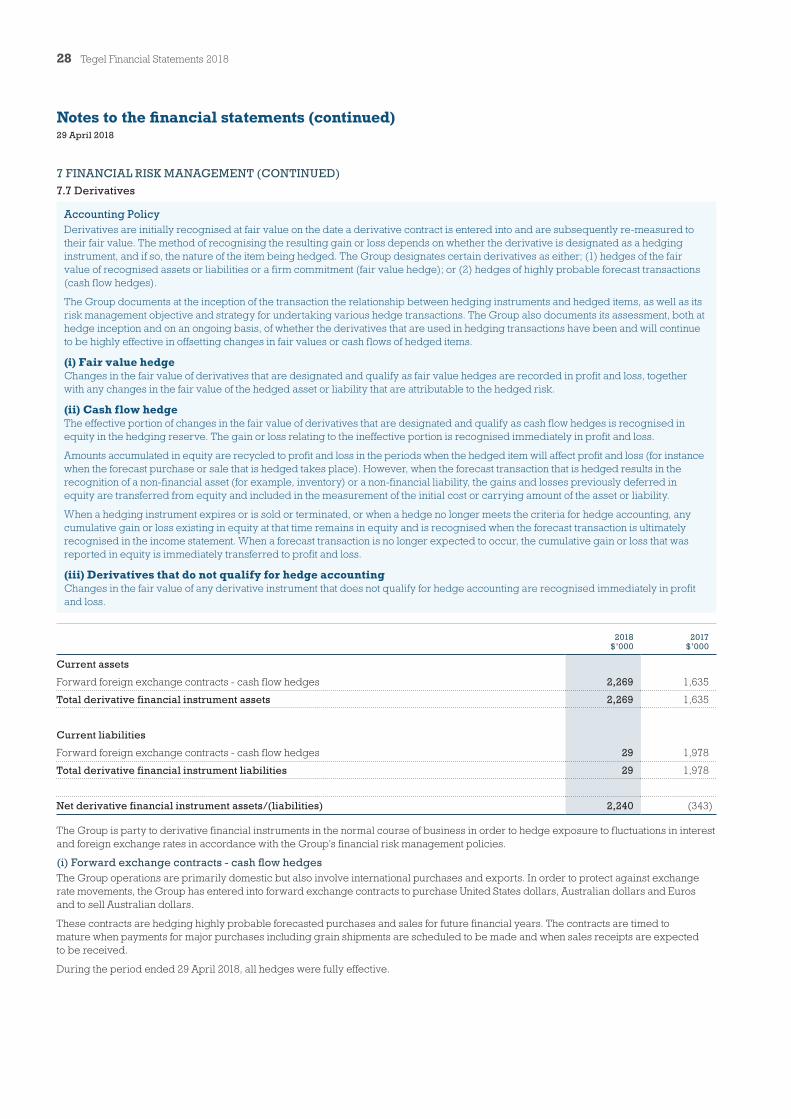
28 Tegel Financial Statements 2018
Notes to the financial statements (continued)29 April 2018
7 FINANCIAL RISK MANAGEMENT (CONTINUED)
7.7 Derivatives
Accounting PolicyDerivatives are initially recognised at fair value on the date a derivative contract is entered into and are subsequently re-measured to their fair value. The method of recognising the resulting gain or loss depends on whether the derivative is designated as a hedging instrument, and if so, the nature of the item being hedged. The Group designates certain derivatives as either; (1) hedges of the fair value of recognised assets or liabilities or a firm commitment (fair value hedge); or (2) hedges of highly probable forecast transactions (cash flow hedges).
The Group documents at the inception of the transaction the relationship between hedging instruments and hedged items, as well as its risk management objective and strategy for undertaking various hedge transactions. The Group also documents its assessment, both at hedge inception and on an ongoing basis, of whether the derivatives that are used in hedging transactions have been and will continue to be highly effective in offsetting changes in fair values or cash flows of hedged items.
(i) Fair value hedgeChanges in the fair value of derivatives that are designated and qualify as fair value hedges are recorded in profit and loss, together with any changes in the fair value of the hedged asset or liability that are attributable to the hedged risk.
(ii) Cash flow hedgeThe effective portion of changes in the fair value of derivatives that are designated and qualify as cash flow hedges is recognised in equity in the hedging reserve. The gain or loss relating to the ineffective portion is recognised immediately in profit and loss.
Amounts accumulated in equity are recycled to profit and loss in the periods when the hedged item will affect profit and loss (for instance when the forecast purchase or sale that is hedged takes place). However, when the forecast transaction that is hedged results in the recognition of a non-financial asset (for example, inventory) or a non-financial liability, the gains and losses previously deferred in equity are transferred from equity and included in the measurement of the initial cost or carrying amount of the asset or liability.
When a hedging instrument expires or is sold or terminated, or when a hedge no longer meets the criteria for hedge accounting, any cumulative gain or loss existing in equity at that time remains in equity and is recognised when the forecast transaction is ultimately recognised in the income statement. When a forecast transaction is no longer expected to occur, the cumulative gain or loss that was reported in equity is immediately transferred to profit and loss.
(iii) Derivatives that do not qualify for hedge accountingChanges in the fair value of any derivative instrument that does not qualify for hedge accounting are recognised immediately in profit and loss.
2018$’000
2017$’000
Current assets
Forward foreign exchange contracts - cash flow hedges 2,269 1,635
Total derivative financial instrument assets 2,269 1,635
Current liabilities
Forward foreign exchange contracts - cash flow hedges 29 1,978
Total derivative financial instrument liabilities 29 1,978
Net derivative financial instrument assets/(liabilities) 2,240 (343)
The Group is party to derivative financial instruments in the normal course of business in order to hedge exposure to fluctuations in interest and foreign exchange rates in accordance with the Group’s financial risk management policies.
(i) Forward exchange contracts - cash flow hedgesThe Group operations are primarily domestic but also involve international purchases and exports. In order to protect against exchange rate movements, the Group has entered into forward exchange contracts to purchase United States dollars, Australian dollars and Euros and to sell Australian dollars.
These contracts are hedging highly probable forecasted purchases and sales for future financial years. The contracts are timed to mature when payments for major purchases including grain shipments are scheduled to be made and when sales receipts are expected to be received.
During the period ended 29 April 2018, all hedges were fully effective.


www.tegel.co.nz