smiths city group - nzx-prod-s7fsd7f98s.s3-website...
TRANSCRIPT

INTERIM REPORT31 October 2017
SMITHS CITY GROU
P

2
CONTENTSHighlights .................................................................................................. 3
Chairman and Chief Executive’s report ........................................ 4
Smiths City’s Auckland stores ..........................................................8
Financial Statements ...................................................................10-15
Notes to Financial Statements ...............................................16-22
Company directory ............................................................................23
ABOUT SMITHS CITY GROUP LIMITEDSmiths City Group (NZX.SCY) was founded in Christchurch in 1918
and has a proud tradition as one of New Zealand’s oldest and largest retail chains. The company floated on the stock exchange in 1972 and
operates 35 stores (including 3 clearance centres) nationwide. The Group comprises Smiths City Retail, Smiths City Finance and
Smiths City Commercial.
2
HIGHLIGHTS
REVENUE
Down 4.6% on same period last year
$108.7m
Down 5% on same period last year
SAME STORE SALES
$102.9m
3
SMITHS CITY BRAND ACHIEVES NATIONAL FOOTPRINT
BOARD STRENGTHENED
FULLY-IMPUTED DIVIDEND
Unchanged on last year 1.0c
FOR THE SIX MONTHS TO 31 OCTOBER 2017
Alastair Kerr and Ben Powles appointed in December
Former Furniture City stores transitioned to ‘live better’ livery
44
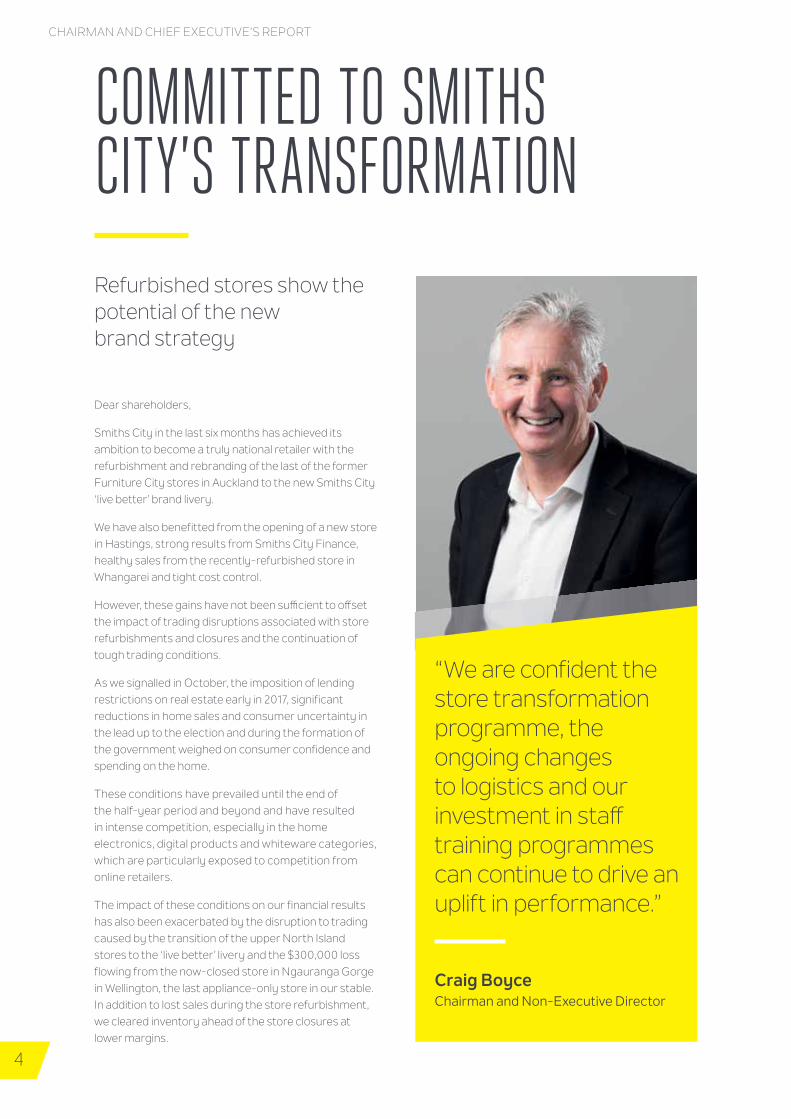
Craig BoyceChairman and Non-Executive Director
“We are confident the store transformation programme, the ongoing changes to logistics and our investment in staff training programmes can continue to drive an uplift in performance.”
Dear shareholders,
Smiths City in the last six months has achieved its ambition to become a truly national retailer with the refurbishment and rebranding of the last of the former Furniture City stores in Auckland to the new Smiths City ‘live better’ brand livery.
We have also benefitted from the opening of a new store in Hastings, strong results from Smiths City Finance, healthy sales from the recently-refurbished store in Whangarei and tight cost control.
However, these gains have not been suffi cient to off set the impact of trading disruptions associated with store refurbishments and closures and the continuation of tough trading conditions.
As we signalled in October, the imposition of lending restrictions on real estate early in 2017, significant reductions in home sales and consumer uncertainty in the lead up to the election and during the formation of the government weighed on consumer confidence and spending on the home.
These conditions have prevailed until the end of the half-year period and beyond and have resulted in intense competition, especially in the home electronics, digital products and whiteware categories, which are particularly exposed to competition from online retailers.
The impact of these conditions on our financial results has also been exacerbated by the disruption to trading caused by the transition of the upper North Island stores to the ‘live better’ livery and the $300,000 loss flowing from the now-closed store in Ngauranga Gorge in Wellington, the last appliance-only store in our stable. In addition to lost sales during the store refurbishment, we cleared inventory ahead of the store closures at lower margins.
COMMITTED TO SMITHS CITY’S TRANSFORMATIONRefurbished stores show the potential of the new brand strategy
CHAIRMAN AND CHIEF EXECUTIVE’S REPORT
FINANCIAL HIGHLIGHTS
5
Smiths City Finance Segment Profit Rises 7.5% on last year
$2.4m
Cash and Cash Equivalents
$9.9m
Rise in Smiths City Whangarei Sales since refurbishment
17%
As a result, group revenue for the six months to 31 October 2017 fell 4.6% to $108.7 million from $113.9 million in the same period a year ago, with same store sales falling 5% to $102.9 million from $108.4 million in the same period a year ago. Profit before tax was $2,000, down from $1.5 million in the same period a year ago.
Many of the factors that weighed on trading are short term in nature and therefore we expect all of our upper North Island stores will make a good contribution to the second half of the financial year. Meanwhile, we continue to drive effi ciencies in the business, maintaining inventories appropriate to the trading conditions and driving cost out of the business.
We are confident our store transformation programme, the ongoing changes to logistics and our investment in staff training programmes can continue to drive an uplift in performance.
Although it is early days for the Auckland stores, the Whangarei store, since opening, has delivered sales 17% ahead of the same period a year ago. Meanwhile, our Hastings store, the first to deploy the new format, continues to trade well.
Same store sales for the six-month period, excluding the Furniture City stores, were down by only 2.9% and margins remained strong. This performance underscores the value of Smiths City’s unique proposition of great service, a pleasant in-store and online experience and the assurance of a trusted national brand.
The new format will be rolled out progressively to the broader network. Meanwhile, our new Auckland distribution centre, from where we service the majority of our North-Island stores, has introduced supply-chain effi ciencies and helped us to ensure all stores are delivering the optimum range.
We are therefore committed to continuing the transformation programme we began three years ago.
SMITHS CITY FINANCE Half-year Smiths City Finance revenue fell to $3.8 million from $4.6 million in the prior year as the company met the market with long-dated interest-free finance off ers.
But half-year segment profits increased 9.0% to $2.4 million from $2.2 million in the same period a year ago as the company benefited from more favourable finance costs following the transition of the loan book to ASB. The loan book grew modestly to $64.7 million from $64.2 million in the same period a year ago, largely reflecting the interest-free loan promotions during July and August.
Following the appointment of a new General Manager of Finance we are now looking at how we can make our finance off er more relevant and better able to compete with the expansion of credit providers. We are confident that our point-of-sale off er represents a strategic service capability that others will struggle to match.
“The Whangarei store, since opening, has delivered sales 17% ahead of the same period a year ago. Meanwhile, our Hastings store, the first to deploy the new format, continues to trade well.”
6
Roy Campbell Chief Executive Offi cer
Craig Boyce Chairman
6
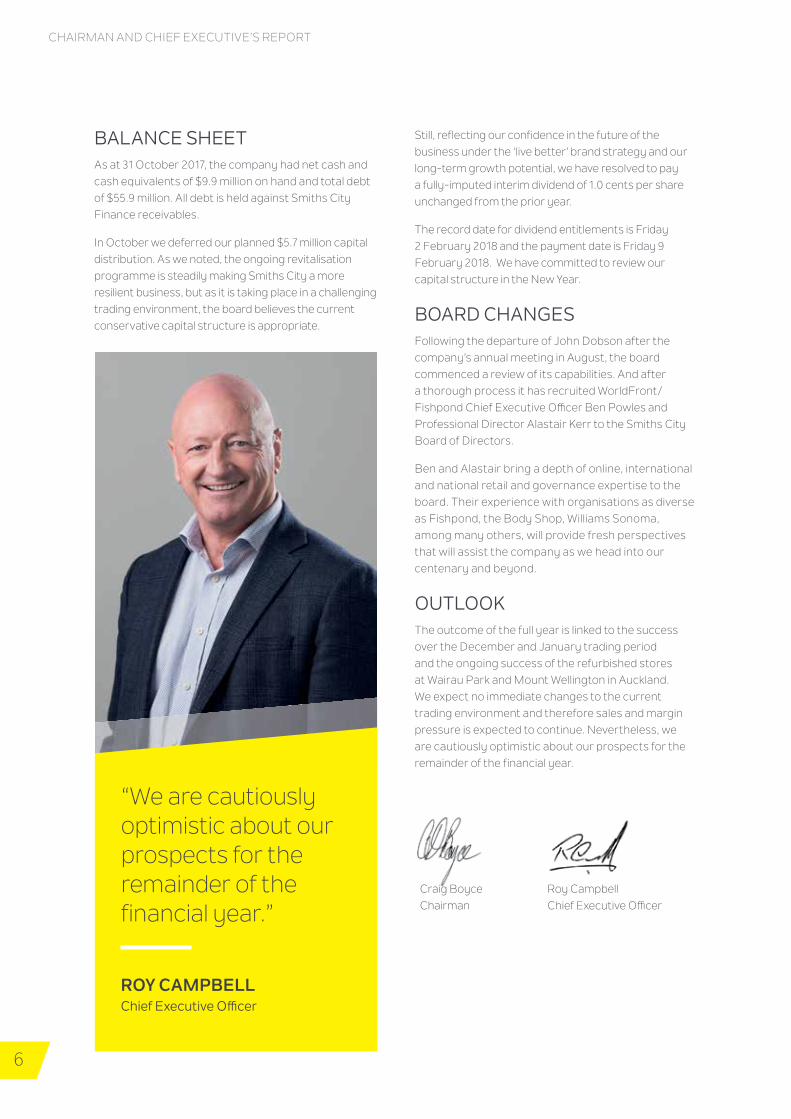
ROY CAMPBELLChief Executive Offi cer
“We are cautiously optimistic about our prospects for the remainder of the financial year.”
BALANCE SHEET As at 31 October 2017, the company had net cash and cash equivalents of $9.9 million on hand and total debt of $55.9 million. All debt is held against Smiths City Finance receivables.
In October we deferred our planned $5.7 million capital distribution. As we noted, the ongoing revitalisation programme is steadily making Smiths City a more resilient business, but as it is taking place in a challenging trading environment, the board believes the current conservative capital structure is appropriate.
Still, reflecting our confidence in the future of the business under the ‘live better’ brand strategy and our long-term growth potential, we have resolved to pay a fully-imputed interim dividend of 1.0 cents per share unchanged from the prior year.
The record date for dividend entitlements is Friday 2 February 2018 and the payment date is Friday 9 February 2018. We have committed to review our capital structure in the New Year.
BOARD CHANGES Following the departure of John Dobson after the company’s annual meeting in August, the board commenced a review of its capabilities. And after a thorough process it has recruited WorldFront/Fishpond Chief Executive Offi cer Ben Powles and Professional Director Alastair Kerr to the Smiths City Board of Directors.
Ben and Alastair bring a depth of online, international and national retail and governance expertise to the board. Their experience with organisations as diverse as Fishpond, the Body Shop, Williams Sonoma, among many others, will provide fresh perspectives that will assist the company as we head into our centenary and beyond.
OUTLOOK The outcome of the full year is linked to the success over the December and January trading period and the ongoing success of the refurbished stores at Wairau Park and Mount Wellington in Auckland. We expect no immediate changes to the current trading environment and therefore sales and margin pressure is expected to continue. Nevertheless, we are cautiously optimistic about our prospects for the remainder of the financial year.
CHAIRMAN AND CHIEF EXECUTIVE’S REPORT
7
Whangarei
North Shore
TaurangaOpotiki
Blenheim
Timaru
Kaikoura
Oamaru
Dunedin
Greymouth
Wellington
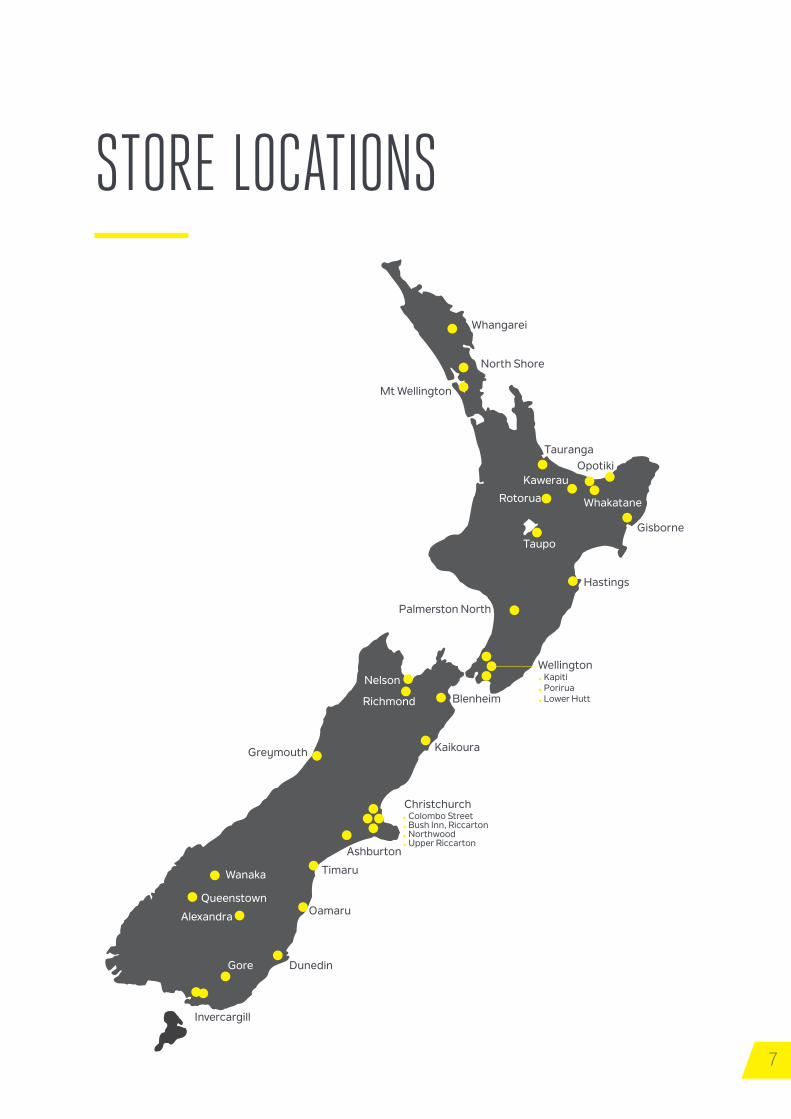
Christchurch• Colombo Street• Bush Inn, Riccarton• Northwood• Upper Riccarton
• Kapiti• Porirua• Lower Hutt
Gisborne
Mt Wellington
Alexandra
Queenstown
Taupo
Whakatane
Hastings
Kawerau
Rotorua
Nelson
Richmond
Wanaka
Palmerston North
Ashburton
Invercargill
Gore
STORE LOCATIONS
8
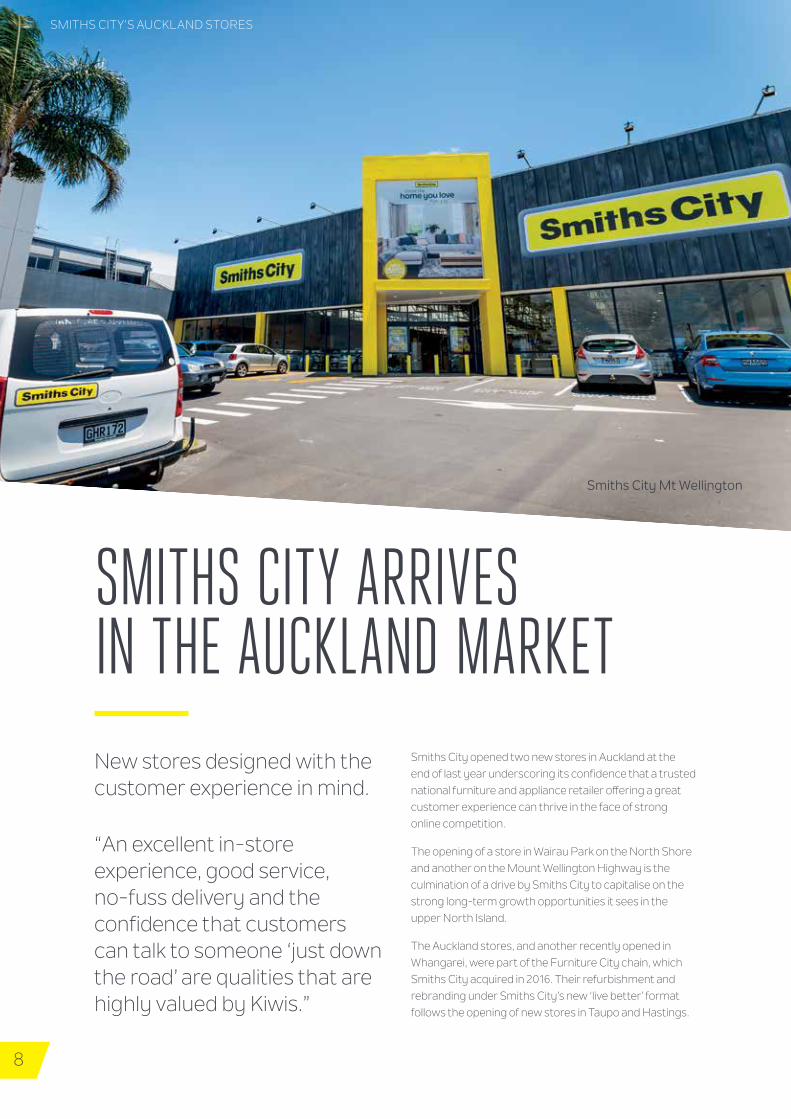
SMITHS CITY’S AUCKLAND STORES
SMITHS CITY ARRIVES IN THE AUCKLAND MARKETNew stores designed with the customer experience in mind.
Smiths City opened two new stores in Auckland at the end of last year underscoring its confidence that a trusted national furniture and appliance retailer offering a great customer experience can thrive in the face of strong online competition.
The opening of a store in Wairau Park on the North Shore and another on the Mount Wellington Highway is the culmination of a drive by Smiths City to capitalise on the strong long-term growth opportunities it sees in the upper North Island.
The Auckland stores, and another recently opened in Whangarei, were part of the Furniture City chain, which Smiths City acquired in 2016. Their refurbishment and rebranding under Smiths City’s new ‘live better’ format follows the opening of new stores in Taupo and Hastings.
“An excellent in-store experience, good service, no-fuss delivery and the confidence that customers can talk to someone ‘just down the road’ are qualities that are highly valued by Kiwis.”
Smiths City Mt Wellington

9
“The upper North Island, and the Auckland market in particular, offer strong long-term growth prospects. Demand for housing, a key driver of Smiths City’s sales, continues to outstrip supply, while the region’s long-term economic prospects look good,” says Smith City Chief Executive Roy Campbell.
Mr Campbell said the ‘live better’ livery, which is being rolled out across the retailer’s 32 Smiths-City branded stores, had been developed in response to changes in the retail market including the rise of the online channel.
“The rise of online shopping has resulted in much greater price transparency and significantly intensified competition. Traditional ‘bricks-and-mortar’ retailers must not only embrace the online channel, but also make the most of the in-store experience, which cannot be matched by online-only competitors,” Mr Campbell said.
“In our core categories of furniture and appliances, the instore experience is more important than ever. Customers in these core categories want to touch and feel products
before they buy. They want to sit on the sofa, test the comfort of a bed and see whether their chosen fridge has all the storage compartments they need.
The new stores have been designed with the customer experience at the top of mind. They offer wide aisles that give customers quick and easy access to the departments they want to visit. Each department is colour coded so they can be easily identified. Furnishings are also displayed in ‘lifestyle sets’ to show customers how a new sofa, bedroom suite or dining room table may look in the home.
“An excellent in-store experience, good service, no-fuss delivery and the confidence that customers can talk to someone ‘just down the road’ are qualities that are highly valued by Kiwis. Combined with Smiths City’s point-of-sale finance offer, they will beat a good deal from an online-only retailer, hands down. We are excited by the opportunities in Auckland.”
Smiths City Wairau Park
FINANCIAL INFORMATIONIncome Statement .............................................................. 11Statement of Comprehensive Income....................... 12Statement of Movements in Equity .............................13Balance Sheet .......................................................................14Satement of Cashflows .....................................................15Notes to the Financial Statements ....................... 16-22
10
11
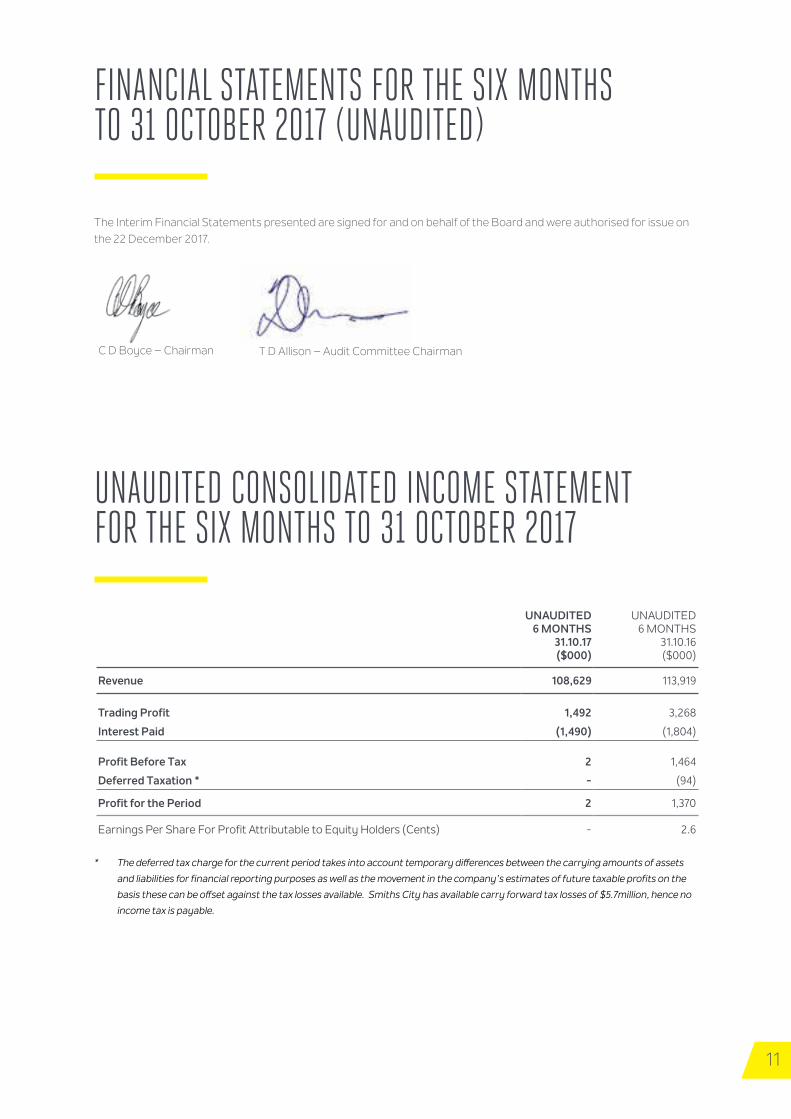
FINANCIAL STATEMENTS FOR THE SIX MONTHS TO 31 OCTOBER 2017 (UNAUDITED)
UNAUDITED CONSOLIDATED INCOME STATEMENT FOR THE SIX MONTHS TO 31 OCTOBER 2017
UNAUDITED6 MONTHS
31.10.17($000)
UNAUDITED6 MONTHS
31.10.16($000)
Revenue 108,629 113,919
Trading Profit 1,492 3,268
Interest Paid (1,490) (1,804)
Profit Before Tax 2 1,464
Deferred Taxation * - (94)
Profit for the Period 2 1,370
Earnings Per Share For Profit Attributable to Equity Holders (Cents) - 2.6
The Interim Financial Statements presented are signed for and on behalf of the Board and were authorised for issue on the 22 December 2017.
C D Boyce – Chairman T D Allison – Audit Committee Chairman
* The deferred tax charge for the current period takes into account temporary diff erences between the carrying amounts of assets
and liabilities for financial reporting purposes as well as the movement in the company’s estimates of future taxable profits on the
basis these can be off set against the tax losses available. Smiths City has available carry forward tax losses of $5.7million, hence no
income tax is payable.
12
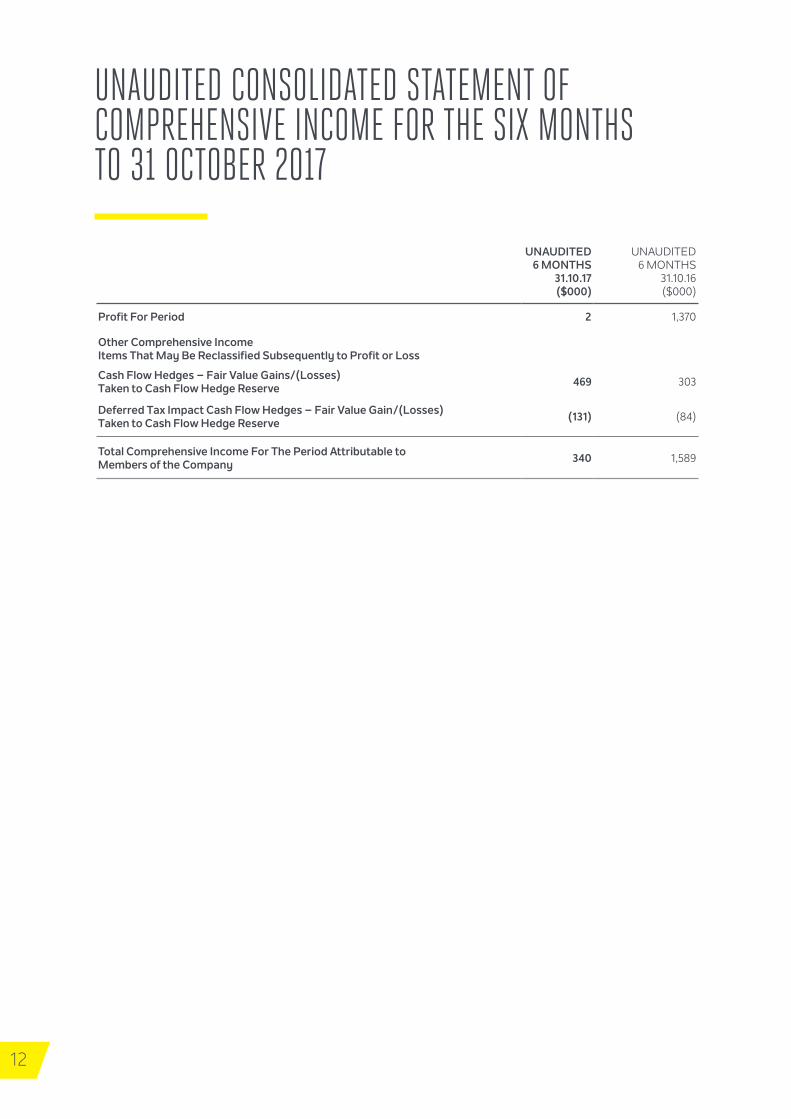
UNAUDITED CONSOLIDATED STATEMENT OF COMPREHENSIVE INCOME FOR THE SIX MONTHS TO 31 OCTOBER 2017
UNAUDITED6 MONTHS
31.10.17($000)
UNAUDITED6 MONTHS
31.10.16($000)
Profit For Period 2 1,370
Other Comprehensive Income Items That May Be Reclassified Subsequently to Profit or Loss
Cash Flow Hedges – Fair Value Gains/(Losses) Taken to Cash Flow Hedge Reserve 469 303
Deferred Tax Impact Cash Flow Hedges – Fair Value Gain/(Losses) Taken to Cash Flow Hedge Reserve (131) (84)
Total Comprehensive Income For The Period Attributable to Members of the Company 340 1,589
13
SHARE CAPITAL
($000)
HEDGING RESERVES
($000)
OTHER RESERVES
($000)
RETAINED EARNINGS
($000)
TOTAL EQUITY
($000)
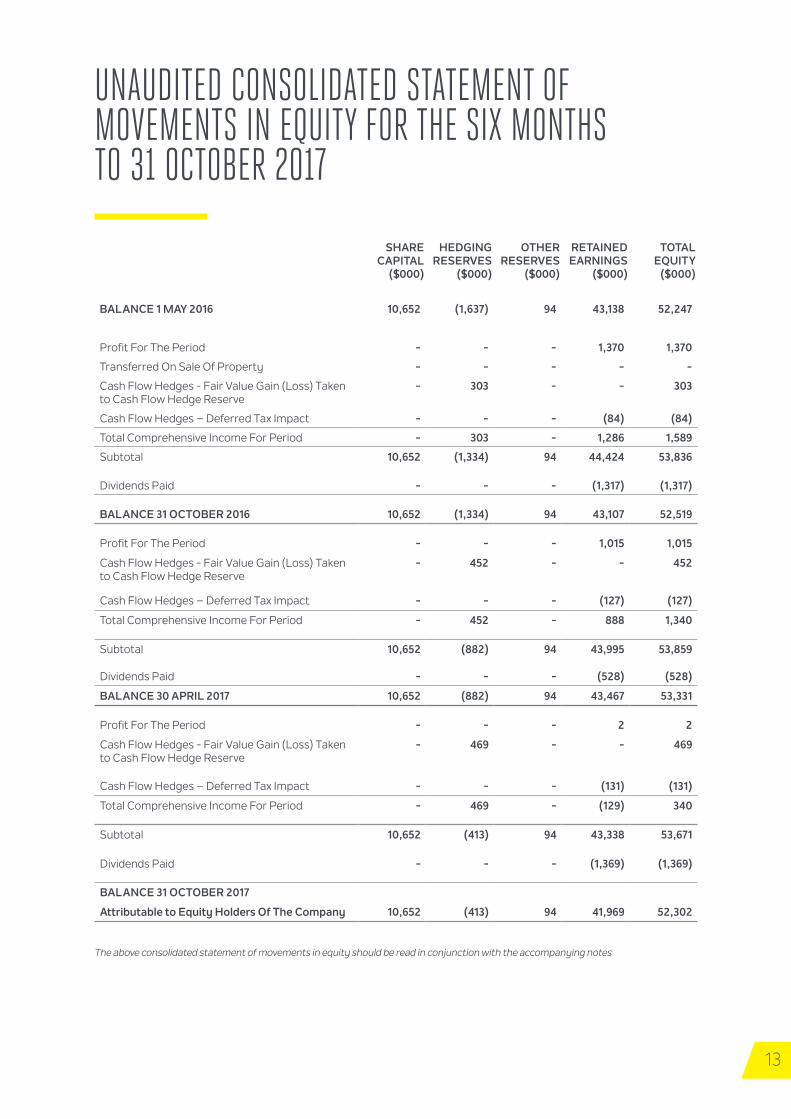
BALANCE 1 MAY 2016 10,652 (1,637) 94 43,138 52,247
Profit For The Period - - - 1,370 1,370
Transferred On Sale Of Property - - - - -
Cash Flow Hedges - Fair Value Gain (Loss) Taken to Cash Flow Hedge Reserve
- 303 - - 303
Cash Flow Hedges – Deferred Tax Impact - - - (84) (84)
Total Comprehensive Income For Period - 303 - 1,286 1,589
Subtotal 10,652 (1,334) 94 44,424 53,836
Dividends Paid - - - (1,317) (1,317)
BALANCE 31 OCTOBER 2016 10,652 (1,334) 94 43,107 52,519
Profit For The Period - - - 1,015 1,015
Cash Flow Hedges - Fair Value Gain (Loss) Taken to Cash Flow Hedge Reserve
- 452 - - 452
Cash Flow Hedges – Deferred Tax Impact - - - (127) (127)
Total Comprehensive Income For Period - 452 - 888 1,340
Subtotal 10,652 (882) 94 43,995 53,859
Dividends Paid - - - (528) (528)
BALANCE 30 APRIL 2017 10,652 (882) 94 43,467 53,331
Profit For The Period - - - 2 2
Cash Flow Hedges - Fair Value Gain (Loss) Taken to Cash Flow Hedge Reserve
- 469 - - 469
Cash Flow Hedges – Deferred Tax Impact - - - (131) (131)
Total Comprehensive Income For Period - 469 - (129) 340
Subtotal 10,652 (413) 94 43,338 53,671
Dividends Paid - - - (1,369) (1,369)
BALANCE 31 OCTOBER 2017
Attributable to Equity Holders Of The Company 10,652 (413) 94 41,969 52,302
UNAUDITED CONSOLIDATED STATEMENT OF MOVEMENTS IN EQUITY FOR THE SIX MONTHS TO 31 OCTOBER 2017
The above consolidated statement of movements in equity should be read in conjunction with the accompanying notes
14
UNAUDITED6 MONTHS
31.10.17($000)
UNAUDITED6 MONTHS
31.10.16($000)
AUDITEDFULL YEAR
30.4.17($000)
CURRENT ASSETS
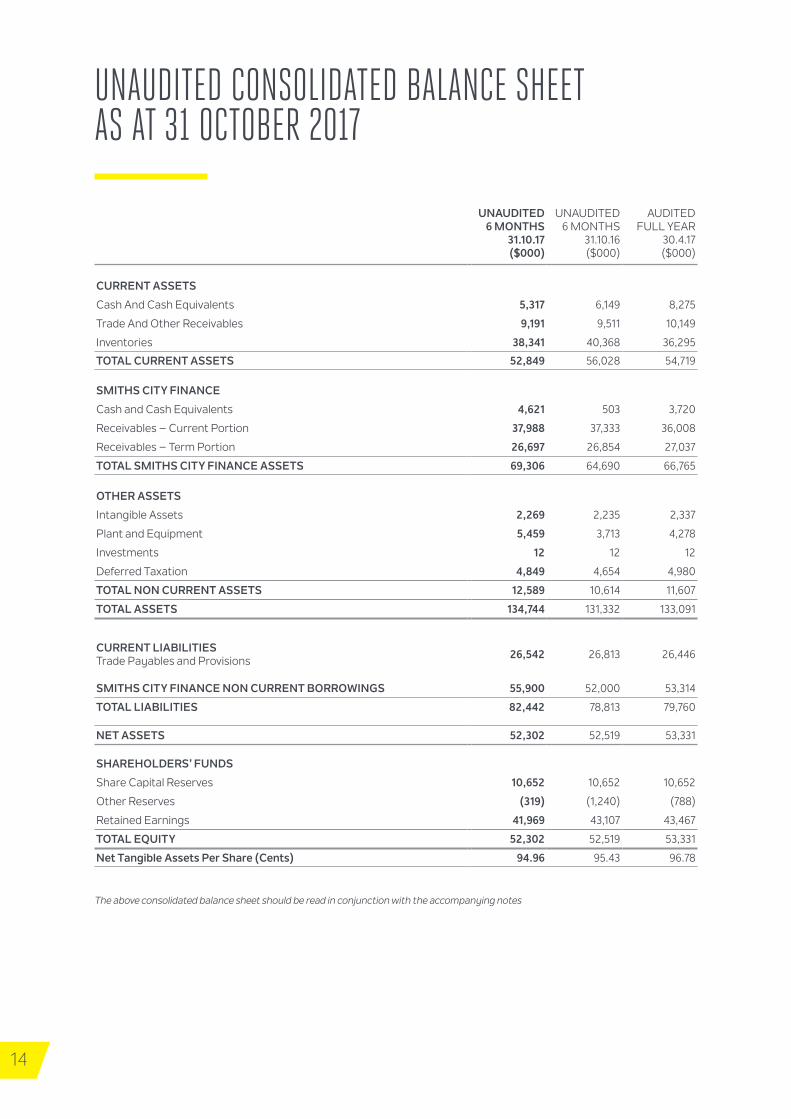
Cash And Cash Equivalents 5,317 6,149 8,275
Trade And Other Receivables 9,191 9,511 10,149
Inventories 38,341 40,368 36,295
TOTAL CURRENT ASSETS 52,849 56,028 54,719
SMITHS CITY FINANCE
Cash and Cash Equivalents 4,621 503 3,720
Receivables – Current Portion 37,988 37,333 36,008
Receivables – Term Portion 26,697 26,854 27,037
TOTAL SMITHS CITY FINANCE ASSETS 69,306 64,690 66,765
OTHER ASSETS
Intangible Assets 2,269 2,235 2,337
Plant and Equipment 5,459 3,713 4,278
Investments 12 12 12
Deferred Taxation 4,849 4,654 4,980
TOTAL NON CURRENT ASSETS 12,589 10,614 11,607
TOTAL ASSETS 134,744 131,332 133,091
CURRENT LIABILITIES Trade Payables and Provisions 26,542 26,813 26,446
SMITHS CITY FINANCE NON CURRENT BORROWINGS 55,900 52,000 53,314
TOTAL LIABILITIES 82,442 78,813 79,760
NET ASSETS 52,302 52,519 53,331
SHAREHOLDERS’ FUNDS
Share Capital Reserves 10,652 10,652 10,652
Other Reserves (319) (1,240) (788)
Retained Earnings 41,969 43,107 43,467
TOTAL EQUITY 52,302 52,519 53,331
Net Tangible Assets Per Share (Cents) 94.96 95.43 96.78
UNAUDITED CONSOLIDATED BALANCE SHEET AS AT 31 OCTOBER 2017
The above consolidated balance sheet should be read in conjunction with the accompanying notes
15
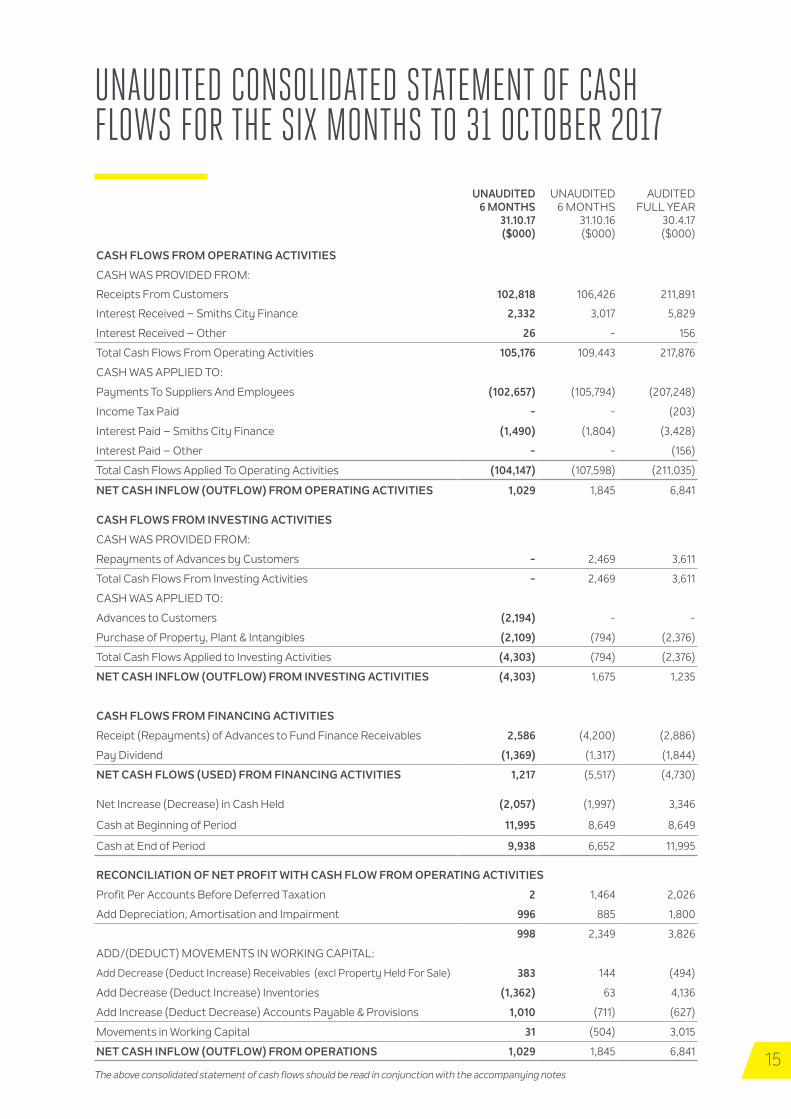
UNAUDITED CONSOLIDATED STATEMENT OF CASH FLOWS FOR THE SIX MONTHS TO 31 OCTOBER 2017
UNAUDITED6 MONTHS
31.10.17 ($000)
UNAUDITED6 MONTHS
31.10.16 ($000)
AUDITEDFULL YEAR
30.4.17 ($000)
CASH FLOWS FROM OPERATING ACTIVITIES
CASH WAS PROVIDED FROM:
Receipts From Customers 102,818 106,426 211,891
Interest Received – Smiths City Finance 2,332 3,017 5,829
Interest Received – Other 26 - 156
Total Cash Flows From Operating Activities 105,176 109,443 217,876
CASH WAS APPLIED TO:
Payments To Suppliers And Employees (102,657) (105,794) (207,248)
Income Tax Paid - - (203)
Interest Paid – Smiths City Finance (1,490) (1,804) (3,428)
Interest Paid – Other - - (156)
Total Cash Flows Applied To Operating Activities (104,147) (107,598) (211,035)
NET CASH INFLOW (OUTFLOW) FROM OPERATING ACTIVITIES 1,029 1,845 6,841
CASH FLOWS FROM INVESTING ACTIVITIES
CASH WAS PROVIDED FROM:
Repayments of Advances by Customers - 2,469 3,611
Total Cash Flows From Investing Activities - 2,469 3,611
CASH WAS APPLIED TO:
Advances to Customers (2,194) - -
Purchase of Property, Plant & Intangibles (2,109) (794) (2,376)
Total Cash Flows Applied to Investing Activities (4,303) (794) (2,376)
NET CASH INFLOW (OUTFLOW) FROM INVESTING ACTIVITIES (4,303) 1,675 1,235
CASH FLOWS FROM FINANCING ACTIVITIES
Receipt (Repayments) of Advances to Fund Finance Receivables 2,586 (4,200) (2,886)
Pay Dividend (1,369) (1,317) (1,844)
NET CASH FLOWS (USED) FROM FINANCING ACTIVITIES 1,217 (5,517) (4,730)
Net Increase (Decrease) in Cash Held (2,057) (1,997) 3,346
Cash at Beginning of Period 11,995 8,649 8,649
Cash at End of Period 9,938 6,652 11,995
RECONCILIATION OF NET PROFIT WITH CASH FLOW FROM OPERATING ACTIVITIES
Profit Per Accounts Before Deferred Taxation 2 1,464 2,026
Add Depreciation, Amortisation and Impairment 996 885 1,800
998 2,349 3,826
ADD/(DEDUCT) MOVEMENTS IN WORKING CAPITAL:
Add Decrease (Deduct Increase) Receivables (excl Property Held For Sale) 383 144 (494)
Add Decrease (Deduct Increase) Inventories (1,362) 63 4,136
Add Increase (Deduct Decrease) Accounts Payable & Provisions 1,010 (711) (627)
Movements in Working Capital 31 (504) 3,015
NET CASH INFLOW (OUTFLOW) FROM OPERATIONS 1,029 1,845 6,841
The above consolidated statement of cash flows should be read in conjunction with the accompanying notes
16
NOTES TO THE FINANCIAL STATEMENTS
1. GENERAL INFORMATIONSmiths City Group Limited (“the Company”) is a company domiciled in New Zealand, registered under the Companies Act 1993 and listed on the New Zealand Stock Exchange (“NZX”). The company is an issuer in terms of the Financial Reporting Act 2013. The consolidated financial statements of Smiths City Group Limited for the six months ended 31 October 2017 comprise the Company and its subsidiaries (together referred to as the “Group”).
Smiths City Group Limited is primarily involved in the retailing of consumer electronics products, kitchen appliances, home heating solutions, home furnishings and sporting goods together with the provision of finance.
2. BASIS OF PREPARATIONa) Statement of Compliance
These financial statements have been prepared in accordance with New Zealand Generally Accepted Accounting Practice (NZGAAP). They comply with the New Zealand equivalent to International Financial Reporting Standards (NZIFRS) and other applicable Financial Reporting Standards, as appropriate of profit oriented entities. The financial statements also comply with International Financial Reporting Standards (IFRS).
b) Summary of Significant Accounting PoliciesThese general purpose financial statements for the interim six month reporting period ended 31 October 2017 have been prepared in accordance with accounting standard NZIAS 34 and IAS34 Interim Financial Reporting. They do not include all the Notes included in the full annual financial statements and are to be read in conjunction with the Annual Report for the year ended 30 April 2017.
c) Functional and Presentation CurrencyThe financial statements are presented in New Zealand dollars ($) which is the Company’s functional currency. All financial information presented in New Zealand dollars has been rounded to the nearest thousand unless otherwise stated.
d) Changes in Accounting PoliciesThe accounting policies applied are consistent with those of the annual financial statements for the year ended 30 April 2017 as described in those annual financial statements and will be used in the financial statements for the year ended 30 April 2017.
e) Use of Estimates and JudgementsThe preparation of financial statements requires management to make judgements, estimates and assumptions that affect the application of accounting policies and the reported amounts of assets, liabilities, income and expenses. Actual results may differ from these estimates.
Estimates and underlying assumptions are reviewed on an ongoing basis. Revisions to accounting estimates are recognised in the period in which the estimate is revised and in any future periods affected. There have been no changes to the areas of estimation uncertainty and critical judgement in applying accounting policies that have the most significant effect on the amount recognised in the financial statements from those appearing in the Annual Report for the year ended 30 April 2017.
f) New Standards and Interpretations Not Yet AdoptedA number of new standards, amendments to standards and interpretations are effective for annual periods beginning after 1 May 2017 and have not been applied in preparing these consolidated financial statements. Those which may be relevant to the Group are set out below. The Group does not plan to adopt these standards early.
17
NZIFRS16 Leases
The new Leases Standard IFRS16 was released by IASB in January 2016 and adopted by External Reporting Board in New Zealand in February 2016. The standard requires lease agreements to be recognised on balance sheet as a right to use asset, with a corresponding liability.
The company intends to adopt NZIFRS16 for the annual period beginning on 1 May 2019. This will have an impact on the balance sheet due to the number, value and length of lease commitments. However, the extent of the impact of adoption of the standard has yet to be determined.
NZIFRS9 Financial Instruments (2014)
NZIFRS9 (2014) introduces new requirements for the classification and measurement of financial assets. Under NZIFRS9 (2014) financial assets are classified and measured based on the business model in which they are held and the characteristics of their contractual cash flows. The standard introduces additional changes relating to financial liabilities. It also amends the impairment model by introducing a new “expected credit loss” model for calculating impairment.
NZIFRS9 (2014) also includes a new general hedge accounting standard which aligns hedge accounting more closely with risk management. This new standard does not fundamentally change the types of hedging relationship or the requirement to measure and recognise the ineffectiveness, however, it will provide more hedging strategies that are used for risk management to qualify for hedge accounting and introduce more judgement to assess the effectiveness of hedging relationship.
The company intends to adopt NZIFRS9 (2014) in its financial statements for the annual period beginning on 1 May 2018. The extent of the impact of adoption of the standard has not yet been determined.
NZIFRS15 Revenue From Contracts With Customers
The standard contains a single model that applies to contracts with customers and two approaches to recognising revenue at a point in time or over time. The model features a contract-based five step analysis of transactions to determine whether, how much and when revenue is recognised. New estimates and judgemental thresholds have been introduced, which may affect the amount and/or timing of revenue recognised.
The new standard applies to contracts with customers. It does not apply to insurance contracts, financial instruments or lease contracts, which fall in the scope of other NZIFRS.
The company intends to adopt NZIFRS15 in its financial statements for the annual period beginning on 1 May 2018. The company does not expect the standard to have a material impact on the financial statements.
Certain comparatives have been restated to ensure consistent presentation of financial information for this period.
3. SEASONALITYThe Group’s revenue and profitability follow a seasonal pattern with higher sales and net profits typically achieved in the second half of the financial year as a result of additional sales generated during the Christmas trading period.
4. SEGMENT INFORMATIONThe Group has three reportable operating segments that are defined by the sectors within the Group which operates namely retail, the financing of retail sales, and property. This reflects the provision of flexible branded finance options to the Group’s retail customers as being considered a key and integral part of the full service offering of all the trading operations of the Group.
The following is an analysis of the Group’s revenue and results by operating segment. Revenue reported below represents revenue generated from external customers. Inter segment revenue is recognised on the basis of arms length transactions.
The accounting policies of the reportable segments are the same as the Group’s accounting policies.
g)
18
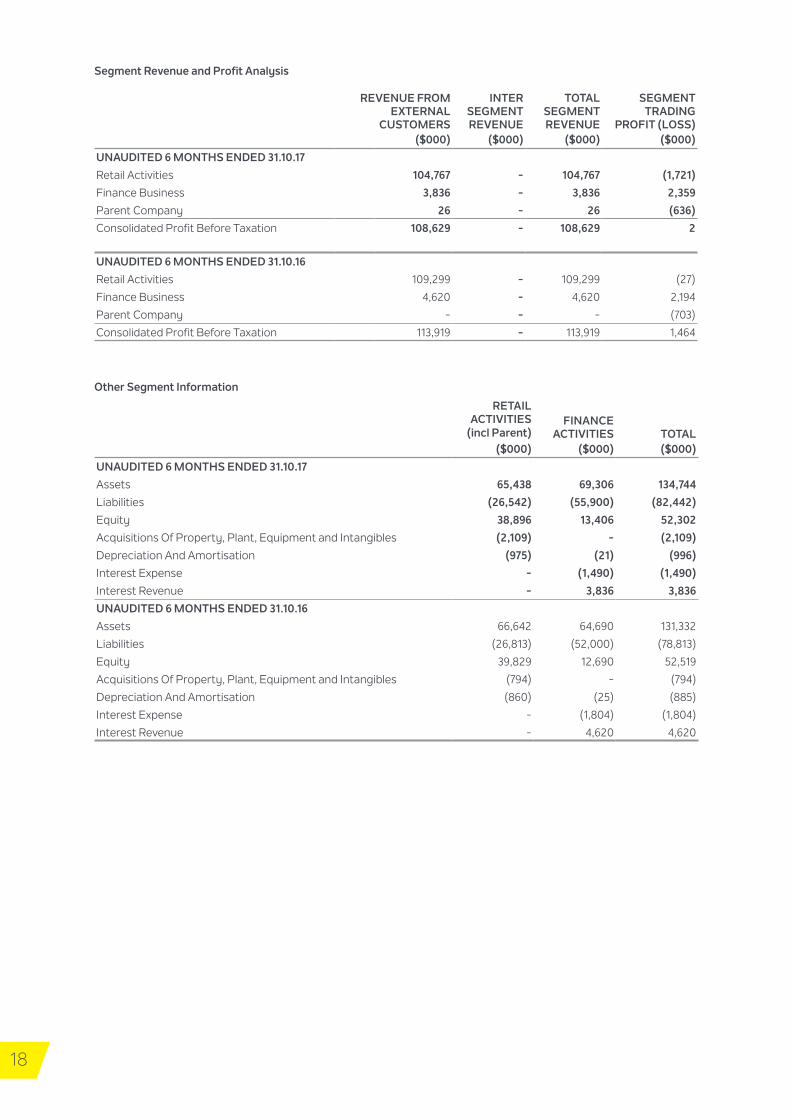
Segment Revenue and Profit Analysis
REVENUE FROM EXTERNAL
CUSTOMERS
INTER SEGMENT REVENUE
TOTAL SEGMENT REVENUE
SEGMENT TRADING
PROFIT (LOSS)($000) ($000) ($000) ($000)
UNAUDITED 6 MONTHS ENDED 31.10.17
Retail Activities 104,767 - 104,767 (1,721)
Finance Business 3,836 - 3,836 2,359
Parent Company 26 - 26 (636)
Consolidated Profit Before Taxation 108,629 - 108,629 2
UNAUDITED 6 MONTHS ENDED 31.10.16
Retail Activities 109,299 - 109,299 (27)
Finance Business 4,620 - 4,620 2,194
Parent Company - - - (703)
Consolidated Profit Before Taxation 113,919 - 113,919 1,464
Other Segment Information
RETAIL ACTIVITIES FINANCE
ACTIVITIES TOTAL(incl Parent)($000) ($000) ($000)
UNAUDITED 6 MONTHS ENDED 31.10.17
Assets 65,438 69,306 134,744
Liabilities (26,542) (55,900) (82,442)
Equity 38,896 13,406 52,302
Acquisitions Of Property, Plant, Equipment and Intangibles (2,109) - (2,109)
Depreciation And Amortisation (975) (21) (996)
Interest Expense - (1,490) (1,490)
Interest Revenue - 3,836 3,836
UNAUDITED 6 MONTHS ENDED 31.10.16
Assets 66,642 64,690 131,332
Liabilities (26,813) (52,000) (78,813)
Equity 39,829 12,690 52,519
Acquisitions Of Property, Plant, Equipment and Intangibles (794) - (794)
Depreciation And Amortisation (860) (25) (885)
Interest Expense - (1,804) (1,804)
Interest Revenue - 4,620 4,620
19
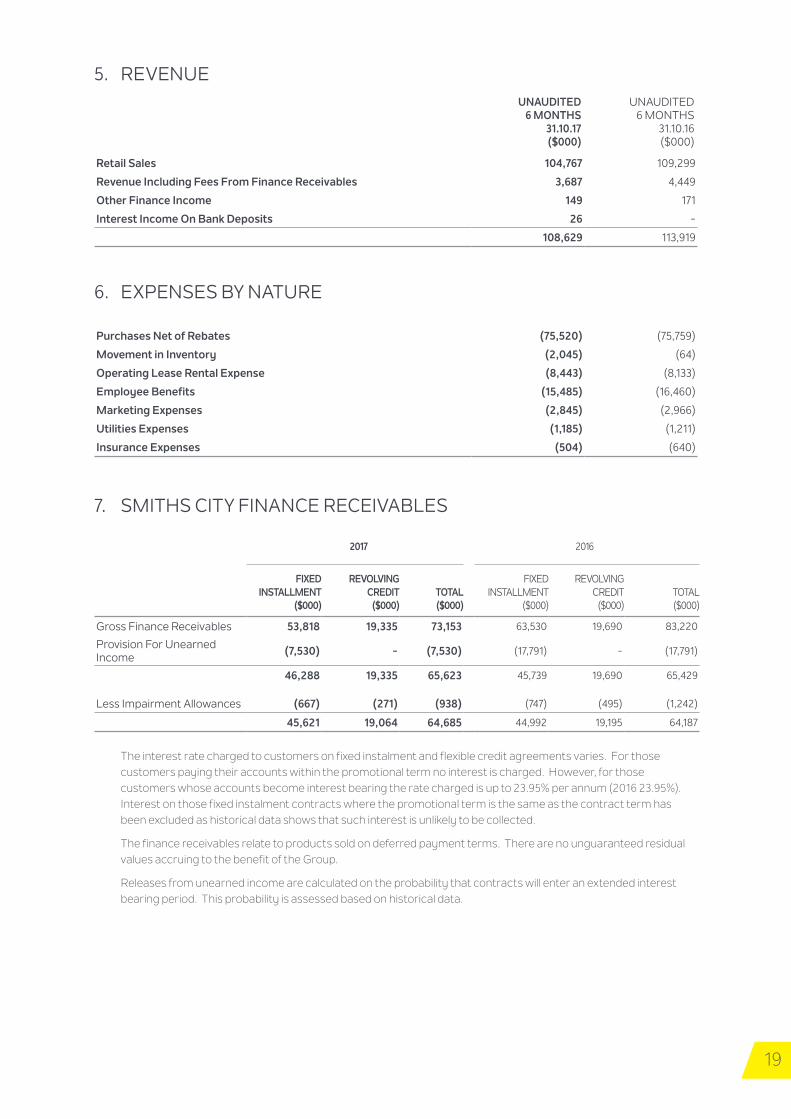
5. REVENUEUNAUDITED
6 MONTHS 31.10.17 ($000)
UNAUDITED6 MONTHS
31.10.16 ($000)
Retail Sales 104,767 109,299
Revenue Including Fees From Finance Receivables 3,687 4,449
Other Finance Income 149 171
Interest Income On Bank Deposits 26 -
108,629 113,919
6. EXPENSES BY NATURE
Purchases Net of Rebates (75,520) (75,759)
Movement in Inventory (2,045) (64)
Operating Lease Rental Expense (8,443) (8,133)
Employee Benefits (15,485) (16,460)
Marketing Expenses (2,845) (2,966)
Utilities Expenses (1,185) (1,211)
Insurance Expenses (504) (640)
7. SMITHS CITY FINANCE RECEIVABLES
2017 2016
FIXED INSTALLMENT
($000)
REVOLVING CREDIT
($000) TOTAL ($000)
FIXED INSTALLMENT
($000)
REVOLVING CREDIT
($000)TOTAL ($000)
Gross Finance Receivables 53,818 19,335 73,153 63,530 19,690 83,220
Provision For Unearned Income (7,530) - (7,530) (17,791) - (17,791)
46,288 19,335 65,623 45,739 19,690 65,429
Less Impairment Allowances (667) (271) (938) (747) (495) (1,242)
45,621 19,064 64,685 44,992 19,195 64,187
The interest rate charged to customers on fixed instalment and flexible credit agreements varies. For those customers paying their accounts within the promotional term no interest is charged. However, for those customers whose accounts become interest bearing the rate charged is up to 23.95% per annum (2016 23.95%). Interest on those fixed instalment contracts where the promotional term is the same as the contract term has been excluded as historical data shows that such interest is unlikely to be collected.
The finance receivables relate to products sold on deferred payment terms. There are no unguaranteed residual values accruing to the benefit of the Group.
Releases from unearned income are calculated on the probability that contracts will enter an extended interest bearing period. This probability is assessed based on historical data.
20
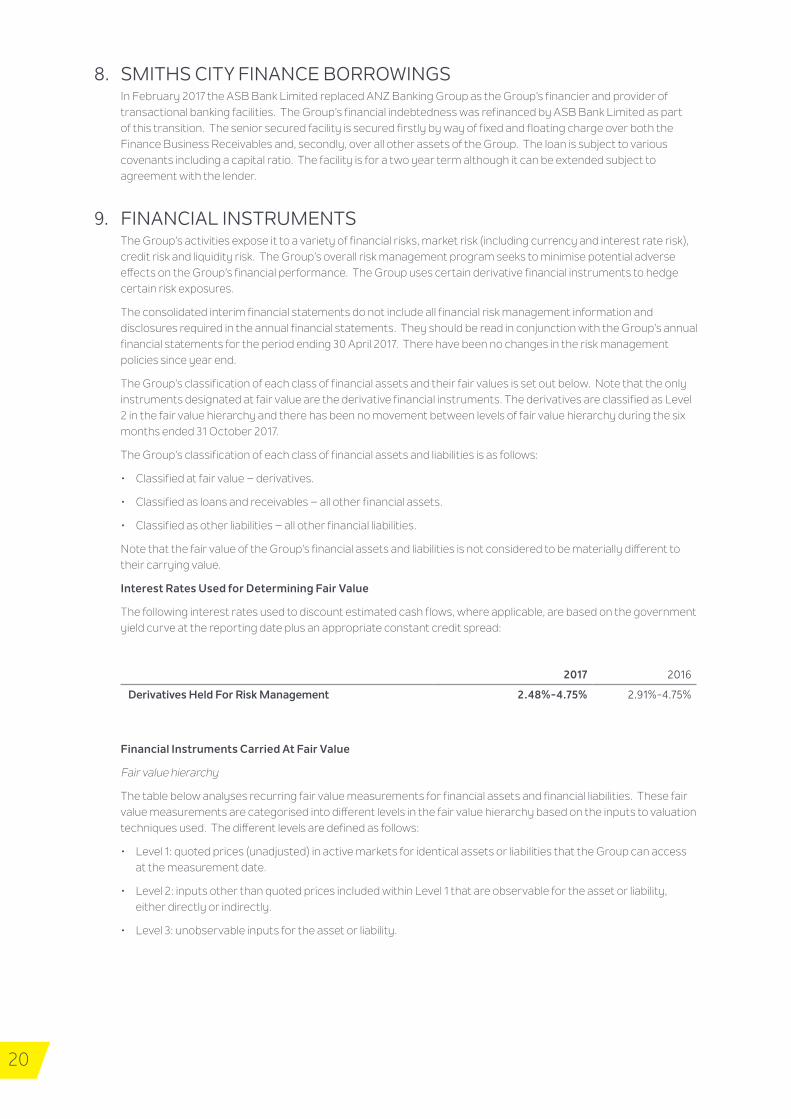
8. SMITHS CITY FINANCE BORROWINGSIn February 2017 the ASB Bank Limited replaced ANZ Banking Group as the Group’s financier and provider of transactional banking facilities. The Group’s financial indebtedness was refinanced by ASB Bank Limited as part of this transition. The senior secured facility is secured firstly by way of fixed and floating charge over both the Finance Business Receivables and, secondly, over all other assets of the Group. The loan is subject to various covenants including a capital ratio. The facility is for a two year term although it can be extended subject to agreement with the lender.
9. FINANCIAL INSTRUMENTSThe Group’s activities expose it to a variety of financial risks, market risk (including currency and interest rate risk), credit risk and liquidity risk. The Group’s overall risk management program seeks to minimise potential adverse effects on the Group’s financial performance. The Group uses certain derivative financial instruments to hedge certain risk exposures.
The consolidated interim financial statements do not include all financial risk management information and disclosures required in the annual financial statements. They should be read in conjunction with the Group’s annual financial statements for the period ending 30 April 2017. There have been no changes in the risk management policies since year end.
The Group’s classification of each class of financial assets and their fair values is set out below. Note that the only instruments designated at fair value are the derivative financial instruments. The derivatives are classified as Level 2 in the fair value hierarchy and there has been no movement between levels of fair value hierarchy during the six months ended 31 October 2017.
The Group’s classification of each class of financial assets and liabilities is as follows:
• Classified at fair value – derivatives.
• Classified as loans and receivables – all other financial assets.
• Classified as other liabilities – all other financial liabilities.
Note that the fair value of the Group’s financial assets and liabilities is not considered to be materially different to their carrying value.
Interest Rates Used for Determining Fair Value
The following interest rates used to discount estimated cash flows, where applicable, are based on the government yield curve at the reporting date plus an appropriate constant credit spread:
2017 2016
Derivatives Held For Risk Management 2.48%-4.75% 2.91%-4.75%
Financial Instruments Carried At Fair Value
Fair value hierarchy
The table below analyses recurring fair value measurements for financial assets and financial liabilities. These fair value measurements are categorised into different levels in the fair value hierarchy based on the inputs to valuation techniques used. The different levels are defined as follows:
• Level 1: quoted prices (unadjusted) in active markets for identical assets or liabilities that the Group can access at the measurement date.
• Level 2: inputs other than quoted prices included within Level 1 that are observable for the asset or liability, either directly or indirectly.
• Level 3: unobservable inputs for the asset or liability.
21
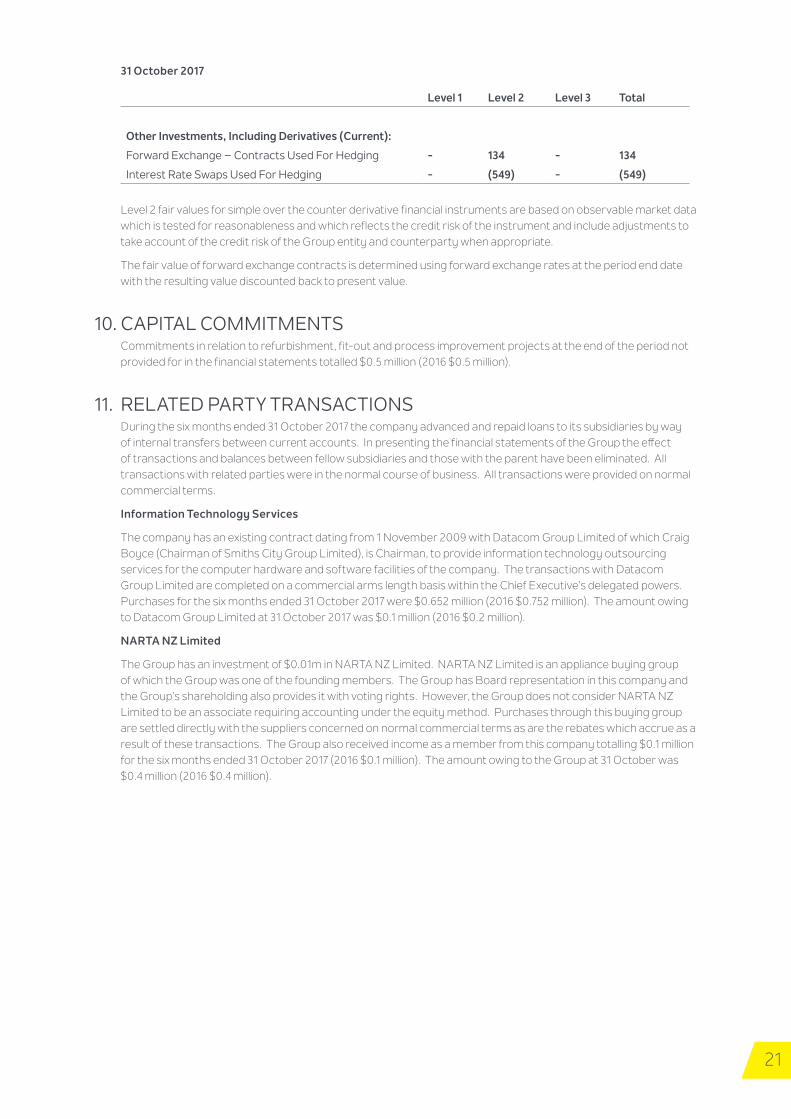
31 October 2017
Level 1 Level 2 Level 3 Total
Other Investments, Including Derivatives (Current):
Forward Exchange – Contracts Used For Hedging - 134 - 134
Interest Rate Swaps Used For Hedging - (549) - (549)
Level 2 fair values for simple over the counter derivative financial instruments are based on observable market data which is tested for reasonableness and which reflects the credit risk of the instrument and include adjustments to take account of the credit risk of the Group entity and counterparty when appropriate.
The fair value of forward exchange contracts is determined using forward exchange rates at the period end date with the resulting value discounted back to present value.
10. CAPITAL COMMITMENTSCommitments in relation to refurbishment, fit-out and process improvement projects at the end of the period not provided for in the financial statements totalled $0.5 million (2016 $0.5 million).
11. RELATED PARTY TRANSACTIONSDuring the six months ended 31 October 2017 the company advanced and repaid loans to its subsidiaries by way of internal transfers between current accounts. In presenting the financial statements of the Group the effect of transactions and balances between fellow subsidiaries and those with the parent have been eliminated. All transactions with related parties were in the normal course of business. All transactions were provided on normal commercial terms.
Information Technology Services
The company has an existing contract dating from 1 November 2009 with Datacom Group Limited of which Craig Boyce (Chairman of Smiths City Group Limited), is Chairman, to provide information technology outsourcing services for the computer hardware and software facilities of the company. The transactions with Datacom Group Limited are completed on a commercial arms length basis within the Chief Executive’s delegated powers. Purchases for the six months ended 31 October 2017 were $0.652 million (2016 $0.752 million). The amount owing to Datacom Group Limited at 31 October 2017 was $0.1 million (2016 $0.2 million).
NARTA NZ Limited
The Group has an investment of $0.01m in NARTA NZ Limited. NARTA NZ Limited is an appliance buying group of which the Group was one of the founding members. The Group has Board representation in this company and the Group’s shareholding also provides it with voting rights. However, the Group does not consider NARTA NZ Limited to be an associate requiring accounting under the equity method. Purchases through this buying group are settled directly with the suppliers concerned on normal commercial terms as are the rebates which accrue as a result of these transactions. The Group also received income as a member from this company totalling $0.1 million for the six months ended 31 October 2017 (2016 $0.1 million). The amount owing to the Group at 31 October was $0.4 million (2016 $0.4 million).
22
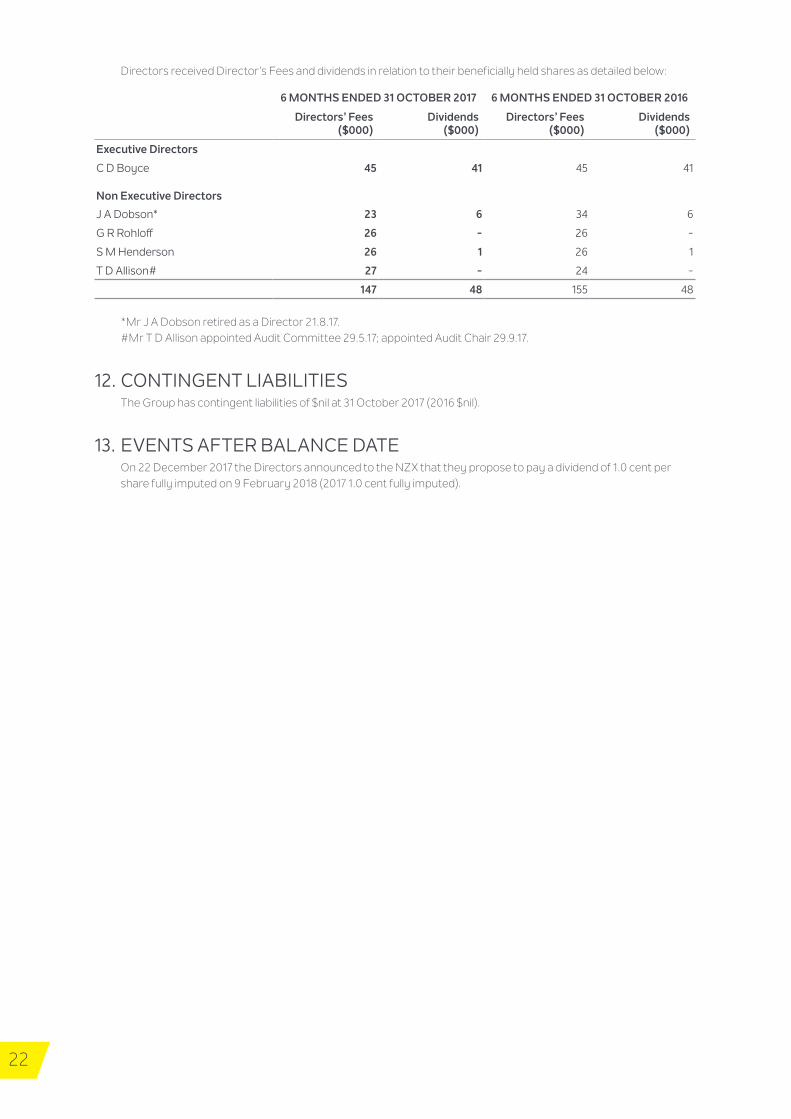
Directors received Director’s Fees and dividends in relation to their beneficially held shares as detailed below:
6 MONTHS ENDED 31 OCTOBER 2017 6 MONTHS ENDED 31 OCTOBER 2016
Directors’ Fees ($000)
Dividends ($000)
Directors’ Fees ($000)
Dividends ($000)
Executive Directors
C D Boyce 45 41 45 41
Non Executive Directors
J A Dobson* 23 6 34 6
G R Rohloff 26 - 26 -
S M Henderson 26 1 26 1
T D Allison# 27 - 24 -
147 48 155 48 *Mr J A Dobson retired as a Director 21.8.17. #Mr T D Allison appointed Audit Committee 29.5.17; appointed Audit Chair 29.9.17.
12. CONTINGENT LIABILITIESThe Group has contingent liabilities of $nil at 31 October 2017 (2016 $nil).
13. EVENTS AFTER BALANCE DATEOn 22 December 2017 the Directors announced to the NZX that they propose to pay a dividend of 1.0 cent per share fully imputed on 9 February 2018 (2017 1.0 cent fully imputed).
23
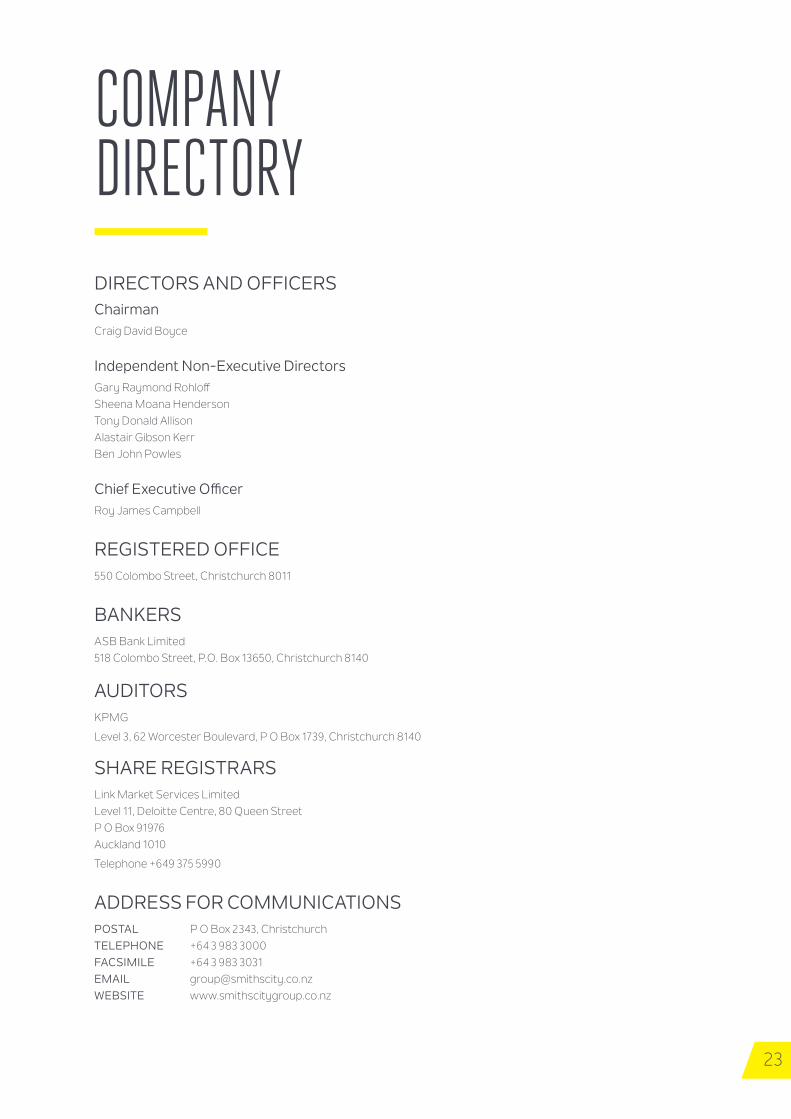
DIRECTORS AND OFFICERSChairmanCraig David Boyce
Independent Non-Executive DirectorsGary Raymond RohloffSheena Moana HendersonTony Donald Allison Alastair Gibson Kerr Ben John Powles
Chief Executive OfficerRoy James Campbell
REGISTERED OFFICE550 Colombo Street, Christchurch 8011
BANKERSASB Bank Limited 518 Colombo Street, P.O. Box 13650, Christchurch 8140
AUDITORSKPMG
Level 3, 62 Worcester Boulevard, P O Box 1739, Christchurch 8140
SHARE REGISTRARS Link Market Services LimitedLevel 11, Deloitte Centre, 80 Queen StreetP O Box 91976Auckland 1010
Telephone +649 375 5990
ADDRESS FOR COMMUNICATIONSPOSTAL P O Box 2343, ChristchurchTELEPHONE +64 3 983 3000FACSIMILE +64 3 983 3031EMAIL [email protected] www.smithscitygroup.co.nz
COMPANY DIRECTORY
