financial technology: algorithmic trading and social media analytics prof. philip treleaven director...
TRANSCRIPT

Financial Technology: Algorithmic Trading and Social Media Analytics
Prof. Philip TreleavenDirector
UK Centre for Financial Computing
University College London

What would you like me to cover?
Big Data Analytics Algorithmic Trading Flash Crashes & Rouge Algorithms Social Media Analytics …
Big Data Analytics

4
Doctoral Training Programme
600-700 enquiries/applications pa
Intake 15-20 PhD students Year 1 Masters of Research
(MRes) Years 2-4 Applied PhD
Student can be registered in any department at UCL or LSE (Computer Science, Statistics, Maths, Economics …)
Each student has an Academic Supervisor and an Industry Adviser.
Student has an industrial partner and works at partner from 6 months to 3 years.

UK Centre for Financial Computing 80 PhD Students Computational Finance
Work with DB, BAML, BNP Paribas, Man, BarCap, Citi, HSBC … Algorithmic Trading Risk Management etc.
Computational Retail Customer Analytics Loyalty cards
Computational Advertising Recommender Systems
Computational Healthcare Boots eHealthcare 3D Healthcare
Computational Sport Performance Enhancement Talent Identification
55

Algorithmic TradingThe industrialisation of trading

Algorithmic Trading Definition Algorithmic trading is an ‘arms race’ - 70%-75% US equity trades by
volume now done by algorithms.
Algorithmic trading is the use of computer programs to automate one or more stages of the trading process: pre-trade analysis (data analysis), trading signal generation (what to trade), and trade execution (when and how to trade).
High-Frequency trading is the execution of computerized trading strategies characterized by extremely short position-holding periods.
Each stage of this trading process can be conducted by: by humans by algorithms + humans (e.g. low frequency trading) fully by algorithms (e.g. high-frequency trading)
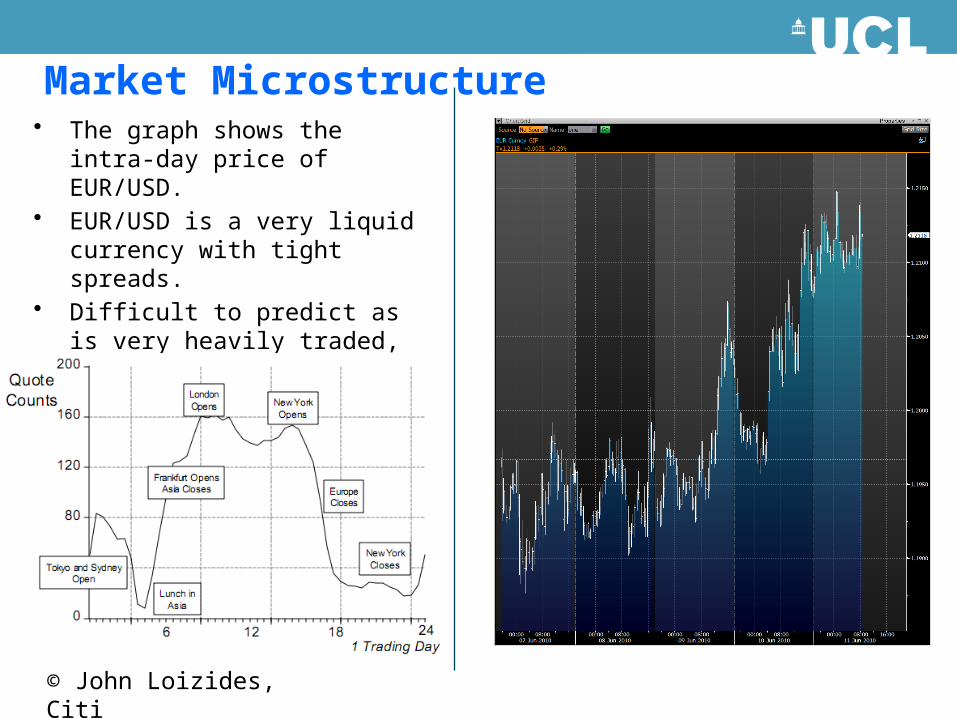
Market Microstructure• The graph shows the intra-day
price of EUR/USD.• EUR/USD is a very liquid currency
with tight spreads.• Difficult to predict as is very
heavily traded, often the driver for other currency pair movements.
© John Loizides, Citi

Centralised Order book - Orders, stacks & matching Order types:
market order (immediately) limit order (specific price) iceberg order (large single order that has
been divided into smaller lots)
Time in force: day order (valid only for less than a day) good-till-cancelled (valid until executed or
cancelled) fill-or-kill (immediately execute or cancel)
Conditional orders: stop order (to sell (buy) when the price of a
security falls (rises) to a designated level) stop limit order (executed at the exact price
or better)
Discretionary order (broker decides when and price)
113.13 1255
113.12 480
113.11 825
Offers(Prices & Quantity)
113.10 600
113.09 725
113.08 150Bids
(Prices & Quantity)
Market Touch
113.10
Detailed view of 113.10 stack:
5 370 13 212
User A User B User … User …
Any new buy limit-order at 113.10 will join the stack at
the back of the queue
Any sell market-order will first trade with User A, then User B, etc…
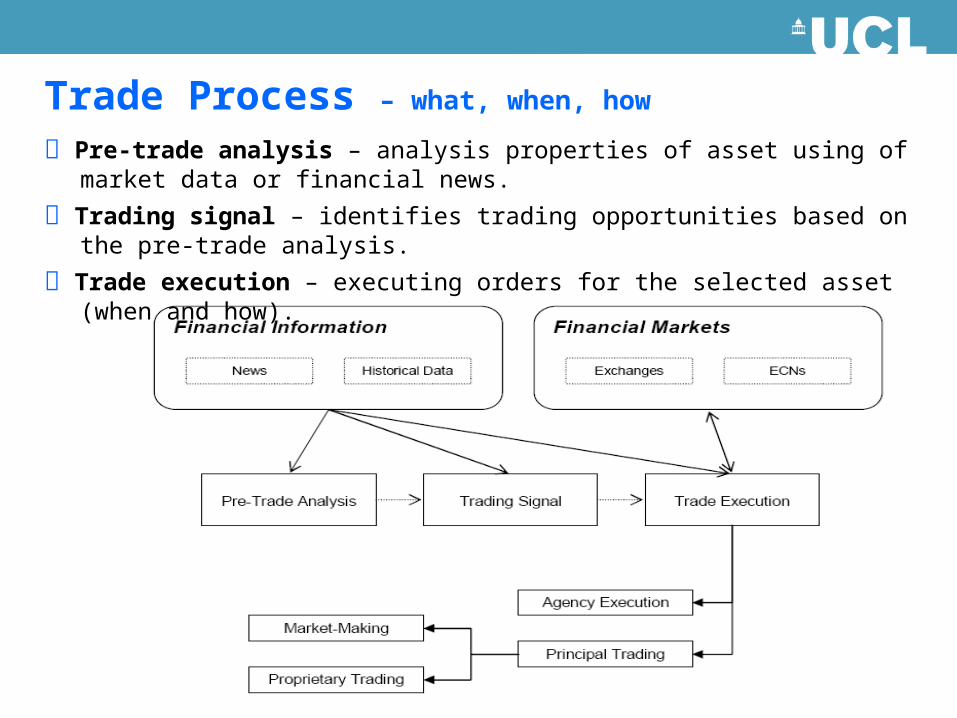
Trade Process – what, when, how
Pre-trade analysis – analysis properties of asset using of market data or financial news.
Trading signal – identifies trading opportunities based on the pre-trade analysis.
Trade execution – executing orders for the selected asset (when and how).
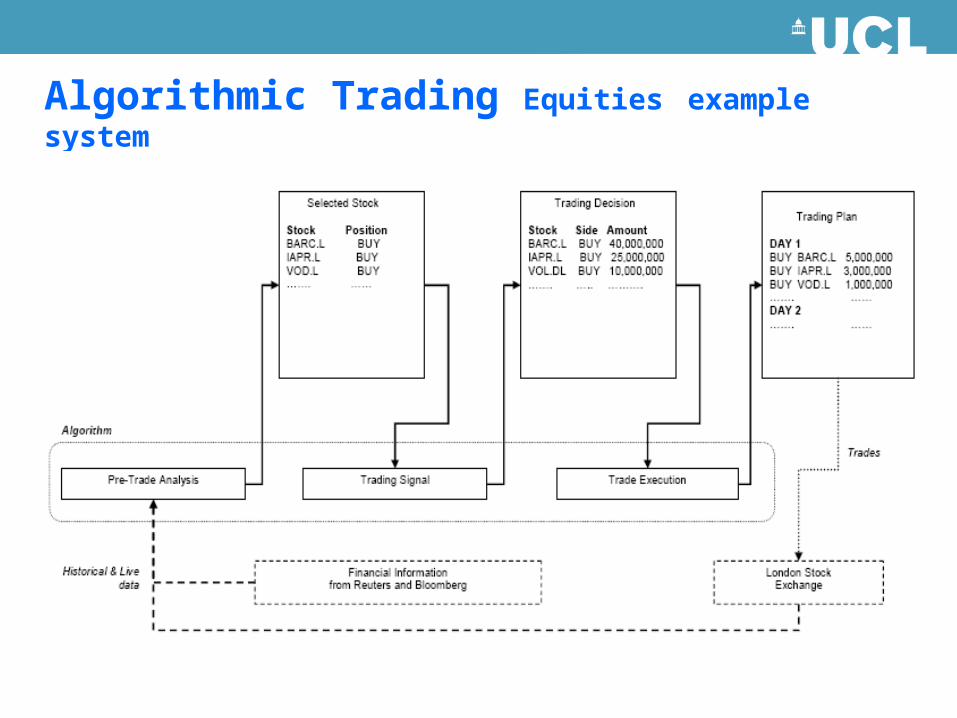
Algorithmic Trading Equities example system

Algorithmic/Systematic trading
Pre-trade Analysis
Trading Signal
Trade Execution
Data (Real-time/Historical; market/non-market)
Research
Alpha Model
Risk Model
Transaction Cost Model
Portfolio Construction Model
Execution Model
Post-trade analysis

Algorithmic/Systematic trading
Pre-trade Analysis
Trading Signal
Trade Execution
Data (Real-time/Historical; market/non-market)
Research
Alpha Model
Risk Model
Transaction Cost Model
Portfolio Construction Model
Execution Model
Implementation IssuesForecast
target
Time Horizon
‘Bet’ Structure
Investment Universe
Model Specification
Run Frequency
Data Availability
Regulation Compliance
Post-trade analysis

Theory-driven (hypothesizing the way markets behave)
Empirical Data-driven (data mining to identify behaviour)
FundamentalPrice-data Behaviour/ Sentiment
Mean Reversion
Trend Following
Yield QualityGrowth
Stat Arb
Input
Quant Style
Approach
Strategy
Real-time Historical
Market Data
Non-market Data
Alpha Trading Models - (predicting the future of instruments)

Risk Model
Limiting Amount of Risk (Exposure)
Limiting Type of Risk ()
Size Limits (constraints,
penalty)
Measuring Risk (standard deviation)
Volatility Dispersion
VaR
Empirical (using historical data)
Theory-driven (systematic risk)
Regime Change Risk
Exogenous Shock Risk
Endogenous Risk
Risk Model - selection/sizing of exposures to maximise returns
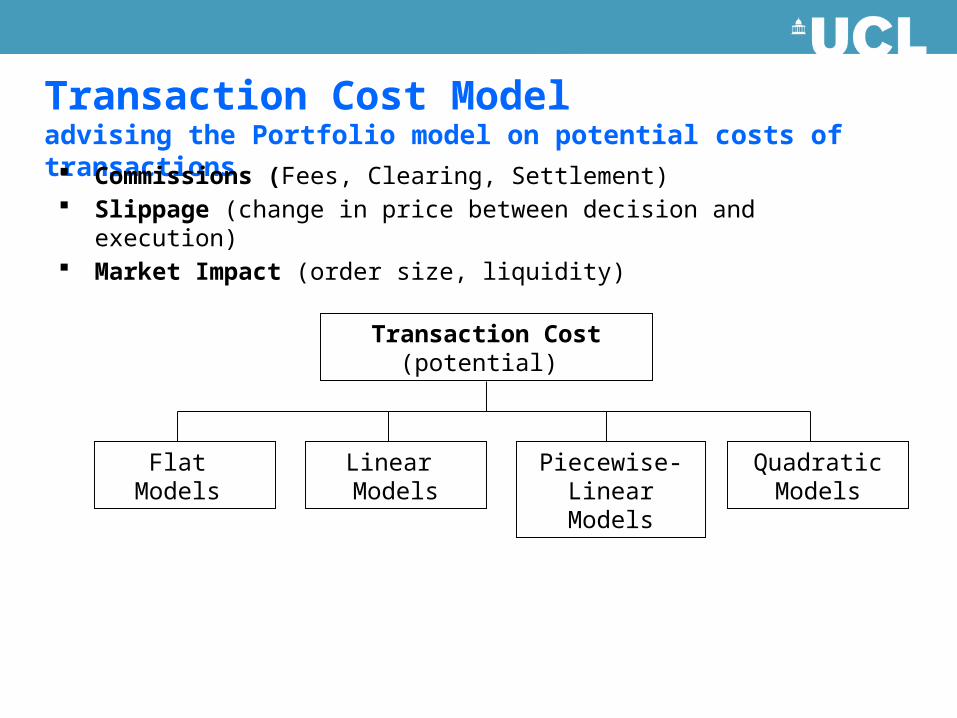
Transaction Cost Modeladvising the Portfolio model on potential costs of transactions Commissions (Fees, Clearing, Settlement) Slippage (change in price between decision and execution) Market Impact (order size, liquidity)
Transaction Cost(potential)
Quadratic Models
Piecewise-Linear Models
Linear Models
Flat Models

Portfolio Construction ModelQuantitative Portfolio
Construction
Optimizer ModelsRule-based Models
Alpha-driven
Weighting
Decision-tree
Weighting
Equal Position
Weighting
Equal Risk
Weighting
Mean variance optimisation
Expected Returns
Expected Volatility
Correlation Matrix
GARCH
Unconstrained Optimisation
Constrained Optimisation
Black-Litterman
Optimisation
…

Execution Model
Order Type
Execution StrategiesSchedulingAggressive/
PassiveRouting
Discretionary Orders
Time in force (day, GTC)
Conditional Orders
Market Limit
Trading Venue
NYSE LSE
Large/Small Order
NASDAQ CME LME
Execution Model

Flash Crashes & Rouge Algorithms

Flash Crash – May 6, 2010
ba
SPX
1060
1080
1100
1120
1140
1160
1180
9:3
0 A
M
9:4
9 A
M
10
:08
AM
10
:28
AM
10
:47
AM
11
:07
AM
11
:26
AM
11
:45
AM
12
:05
PM
12
:24
PM
12
:44
PM
1:0
3 P
M
1:2
2 P
M
1:4
2 P
M
2:0
1 P
M
2:2
0 P
M
2:4
0 P
M
2:5
9 P
M
3:1
8 P
M
3:3
8 P
M
3:5
7 P
M
$600 billion in market value of US corporate stocks disappeared

“Knightmare” – Knight Capital loose $440m In the mother of all computer glitches, market-making firm
Knight Capital Group lost $440 million in 30 minutes One of Knight’s trading algorithms reportedly started
pushing erratic trades through on nearly 150 different stocks

Potential for Catastrophe
Major Nuclear Explosion Major Flash Crash

Trading volatility - 2007
This astonishing GIF comes from Nanex, and shows the amount of high-frequency trading in the stock market from January 2007 to January 2012. (Which means that the Knightmare craziness of last week is not included.)

Trading volatility - 2009

Trading volatility 2011

Trading volatility - 2012

high-frequency trading in the stock market from January 2007 to January 2012

Flash Crash – May 6th.
$600 billion in market value of US corporate stocks disappeared
Causes Fat Finger Stop-loss Triggering Inconsistent Trade Halting Rules Stub Quotes - ultra-low bids NYSE Delay Quote Stuffing - attempt to overwhelm a market
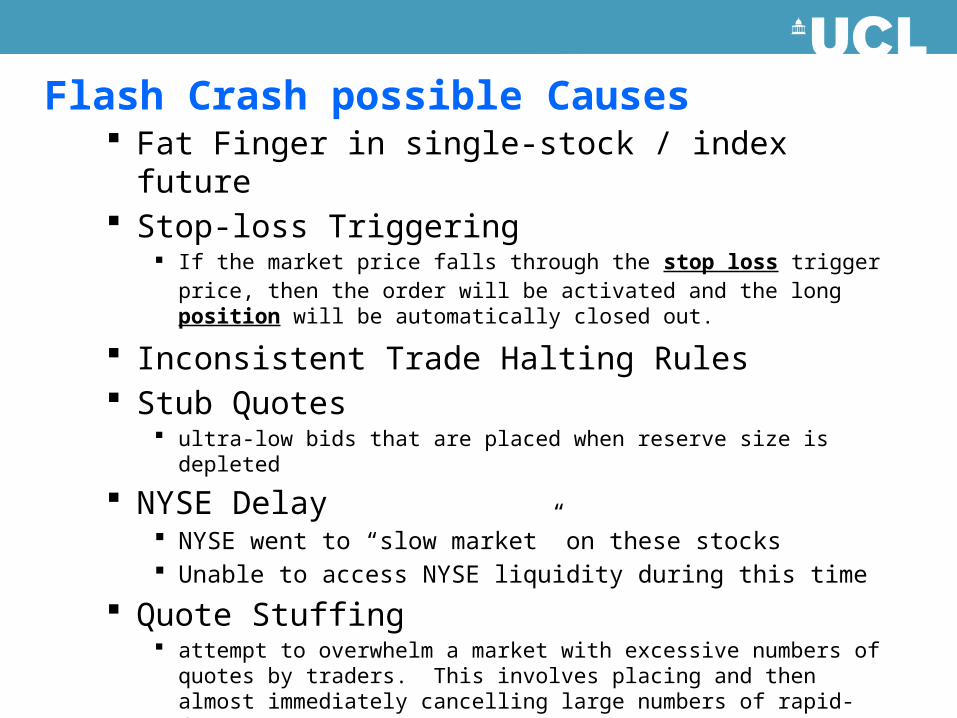
Flash Crash possible Causes Fat Finger in single-stock / index future Stop-loss Triggering
If the market price falls through the stop loss trigger price, then the order will be activated and the long position will be automatically closed out.
Inconsistent Trade Halting Rules Stub Quotes
ultra-low bids that are placed when reserve size is depleted
NYSE Delay NYSE went to “slow market” on these stocks Unable to access NYSE liquidity during this time
Quote Stuffing attempt to overwhelm a market with excessive numbers of quotes by
traders. This involves placing and then almost immediately cancelling large numbers of rapid-fire orders to buy or sell stocks
SEC Report http://www.sec.gov/news/studies/2010/marketevents-report.pdf
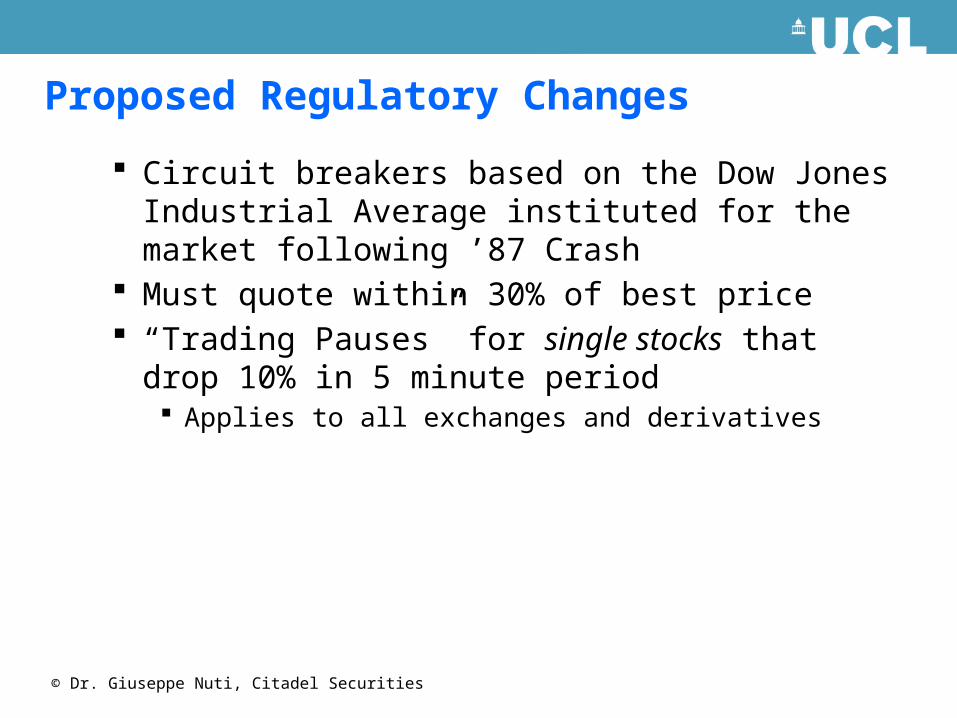
Proposed Regulatory Changes
Circuit breakers based on the Dow Jones Industrial Average instituted for the market following ’87 Crash
Must quote within 30% of best price “Trading Pauses” for single stocks that drop 10% in
5 minute period Applies to all exchanges and derivatives
© Dr. Giuseppe Nuti, Citadel Securities

Social Media Scraping & Analytics

Social Networking sites
Blogs & Microblogs
Content Communities
Collaborative Projects
Virtual Social Worlds
News
Financial News
Social Media and News Data:
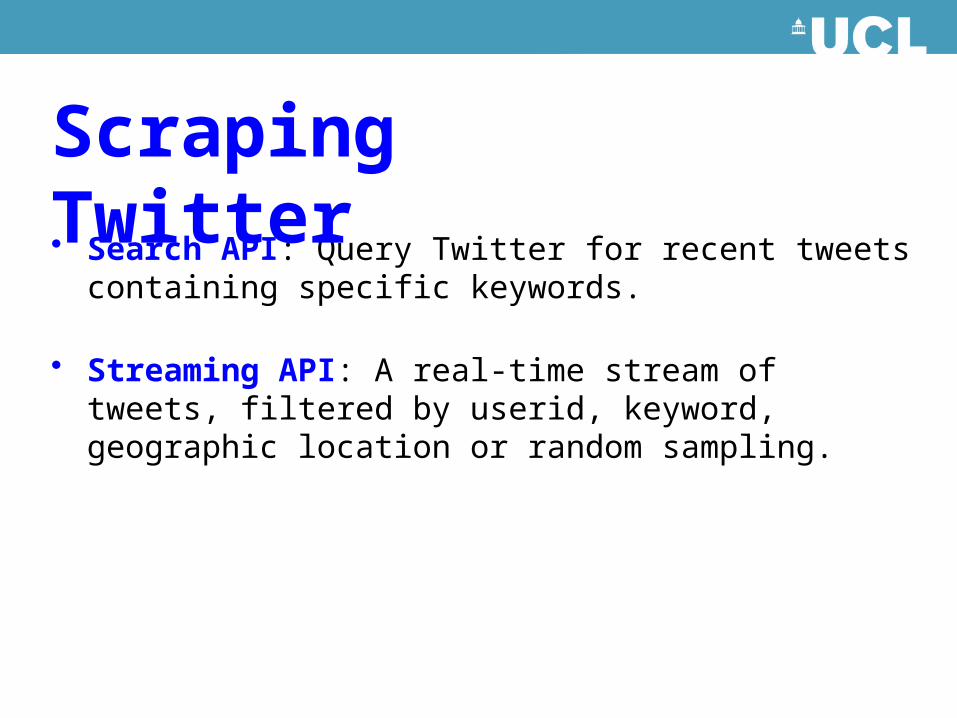
• Search API: Query Twitter for recent tweets containing specific keywords.
• Streaming API: A real-time stream of tweets, filtered by userid, keyword, geographic location or random sampling.
Scraping Twitter

• One may retrieve recent tweets from the last 6-9 days containing particular keywords through Twitter’s Search API; with the following API call:
http://search.twitter.com/search.json?q=APPLE
Full documentation @ https://dev.twitter.com/docs/using-search
Search API

UCL Social Media Platform (SocialSTORM)
3636
Big Data Analytics Computational Finance
Work with DB, BAML, BNP Paribas, Man, BarCap, Citi, HSBC … Algorithmic Trading Risk Management etc. Agent-based models of UK banking system & systemic risk
Computational Retail Customer Analytics, Loyalty cards Pricing models Fashion Analytics
Computational Advertising Recommender Systems
Computational Healthcare Boots eHealthcare 3D Healthcare
Computational Sport Performance Enhancement Talent Identification
3737