financing social enterprise in the very long run
TRANSCRIPT
Financing Social Enterprise in the very long run
Jeremy Thornton1 Samford University
David King2 Indiana University-Purdue University Indianapolis
Abstract
Social enterprises share a common struggle to finance output that have public good characteristics. Public goods are notoriously difficult for private firms to produce, because of the incentive for their constituents to defect, or free-ride, on the contributions of others. Due of their historical success, this paper examines long-lived religions institutions for strategies to mitigate this collective action problem. We empirically examine the Southern Baptist Convention, which records its efforts to finance international mission activities since 1935. We test a variation of the club good model, which emphasizes imposing costs on members to separate out high intensity adherents. Consistent with the model, we find that contributions to international missions increase when the cost of affiliation increases. We do not find that the specific mechanism for collection within the Southern Baptist matters. We conclude that the club model of organization, where
high membership costs are deliberately applied, offers valuable – and counterintuitive –lessons for social enterprises more broadly.
JEL: H41, Z12, D2, L3
Keywords: Social Entrepreneurship, Finance, Religion, Club Model
1 Professor of Economics and Dwight Moody Beeson Chair of Business Brock School of Business, Birmingham, AL USA 35229 [email protected] (Contact Author) 2 Assistant Professor, Karen Lake Buttery Director, Lake Institute for Faith and Giving Lilly Family School of Philanthropy, Indianapolis, IN USA 46202 [email protected]
___________________________________________________________________
This is the author's manuscript of the article published in final edited form as:Thornton, J. P., & King, D. (2017). Financing Social Enterprise in the Very Long Run. ACRN Oxford Journal of Finance and Risk Perspectives 6.3 – Special Issue FRAP/SSFII Conference (2017): 29-70. http://dx.doi.org/10.2139/ssrn.2922579
brought to you by COREView metadata, citation and similar papers at core.ac.uk
provided by IUPUIScholarWorks

1
Introduction
This paper examines techniques available to finance social
enterprise over very long time horizons. We adopt a model of social
enterprise described in Santos (Santos, 2012), where the distinctive
characteristic of social entrepreneurship is the private production of
public goods (or, the more modern term - collective goods).1 In contrast
to the existing literature, Santos (2012) explores a non-normative
definition of a social entrepreneur, where “social” implies deliberate
strategy to produce a positive externality, or public good. Public goods
are classically identified by their absence, to varying degrees, of rivalry
and excludablity. These characteristics describe the circumstance
where consumption by one individual does not preclude the
consumption by others, nor can non-contributors be excluded from
consumption (Mas-Colell, Whinston, & Green, 1995, p. 359).
Examples of public goods in the social entrepreneurship literature
may include: cultural goods production; environmental protection,
public health, or anti-poverty programs (Elkington & Hartigan, 2008).2
Importantly, even if a wide range of consumers value the public good,
each individual has a private incentive to free-ride on the contributions
of others, rather than contribute themselves (Varian, 2014, p. 717).
Collectively, the production of the public good will be sub-optimal
because no individual accounts for the public good’s value to others in
their contribution (Cornes & Sandler, 1996, Chapter 6). Overcoming
1 Santos (2012) uses the language of value creation and value capture to make the distinction between social entrepreneurs and traditional profit maximizing firms. He rejects the distinction between social and economic value creation, thereby allowing for a concrete definition of social value (p.337). The profit maximizing firm sets a strategy to capture as much value from a transaction as possible. In contrast, Santos argues that the social entrepreneur seeks to maximise value creation (p.337). While Santos emphasizes consumer surplus, there is no good reason to discount the value accrued to producers, particularly the suppliers of productive inputs. Value creation in excess of that which is captured by parties in the transaction is described by economists as an externality. Public (or collective) goods refer to the circumstance where externalities are shared among more than two or more economic agents. In this case, public goods must be provided in the same amount to all consumers, regardless of their valuation of the good.
2 Cornes and Sandler (1996) use the term “easy rider” for the more common circumstance where crowd-out is incomplete (p.455).

2
free riding behavior when financing the production of public goods is a
key constraint to designing a successful social enterprise business
model.
The challenges associated with financing public goods have been
thoroughly examined in the social sciences. Theory, supported by
extensive experimental research, demonstrates the difficulty in
sustaining voluntary cooperative networks to produce public goods
(Andreoni, 1988; Andreoni & Payne, 2013; Bergstrom, Blume, &
Varian, 1986; Dawes & Thaler, 1988; James Andreoni & A. Abigail
Payne, 2008).
This paper contributes to the social enterprise literature by
examining the methods used by long-lived institutions to sustain
collective contributions to a public good. We test a specific variant of
the club model for public goods production (Iannaccone, 1992). We
confirm the models basic intuition, where imposing a high cost to deter
low value members can – under certain conditions - reduce free riding.
Exclusion of low-value members can induce sustainable contributions
to the public good by creating a separating equilibrium, where only
those who sufficiently value the good will choose to participate in the
club. We discuss the circumstances where this strategy may be
appropriate for social entrepreneurs.
The paper begins with an overview of existing financing schemes
for public goods. The paper then narrows its scope to examine the
particular strategies applied by religiously motivated institutions who
also choose to produce locally public goods. The paper is careful to
explain how the study of religiously motivated institutions may inform
financing strategies for social enterprise more broadly. The paper then
tests several hypotheses drawn from the club model in the context of
religious production. Finally, we connect our findings to common
challenges faced by social enterprises.

3
Typology of financing collective goods
Public goods are notoriously difficult to finance. Economic
theory predicts that, when a good (or service) are both nonrival and
nonexculable, the dominant strategy for any individual contributor is
to “free ride” on the contributions of others (Andreoni, 1988; Dawes &
Thaler, 1988; Fischbacher & Gächter, 2010). For exposition purposes,
we sketch a brief canonical model.3
An individual i receives utility from both a private good yi and
the total value of a public good 𝑋 = ∑ 𝑥𝑖𝑛𝑖=1 , where 𝑈𝑖(𝑦𝑖 , 𝑋) is
continuous, strictly increasing, and twice differentiable. Importantly,
X has standard public good characteristics, such that it is both nonrival
and non-excludable. Thus, agent i takes the value of X as exogenous.
Maximizing utility by the representative consumer results in the
socially optimal condition:
∑ 𝑀𝑅𝑆𝑦𝑖𝑋 = 𝑀𝐶𝑋
𝑛
𝑖=1
Which notes that the optimal quantity of the public good
equates the sum of the marginal rates of substitution for X to its cost
(i.e. the Samuelson condition). However, each individual will choose to
maximize:
max 𝑈(𝑦𝑖 , 𝑥𝑖 + 𝑋−𝑖)
Where individual I will choose:
𝑀𝑅𝑆𝑦𝑖𝑥𝑖= 𝑀𝐶𝑋
3 Adapted from Cornes & Sandler (1996)

4
Because each individual may consume X-i and takes its value as given,
only individual i with the highest value of X will contribute anything
to the public good. Others will simply free-ride on that individual’s
contribution, and increase their consumption of the private good.
Consequently, the public good will be provided in a socially insufficient
quantity.
A common example is street lamps for a neighbourhood.
Because everyone in the neighbourhood benefits from the street lamps,
the best strategy for any one household is to allow other households to
contribute, while they themselves defect. Unfortunately, this is the
dominant strategy for each household, resulting in sub-optimal
lighting, even if streetlights are highly valued. Thus, private markets,
which attempt to charge positive prices for use of the streetlights, often
fail, because individuals will consume the good regardless.
In a social entrepreneurship context, reductions of global
poverty, public safety, improved environmental conditions, or better
educational opportunities each have public good traits. Individuals
may easily “consume” these goods without diminishing the
consumption of others, even if they have not contributed. As everyone
faces a similar incentive, it becomes difficult to finance the good’s
production. How then can a social enterprise form a sustainable
business model to finance the production of public goods? There are
generally three broad strategies.
Government (Public) Provision
The most straightforward method of providing collective goods is
for government to finance them. Governments can mitigate the free-
rider problem by compelling payment through a system of taxation.
Government agencies can either provide the collective good directly (as
with a standing military or Global Positioning System satellites), or
they can contract with private agencies to produce the service (as with
foster care or private prisons). Government agencies are not the only
institutions with the power to compel payments. Private community
organizations such as homeowners associations, unions, and social clubs
5
may operate (often with the explicit or implicit backing of the
government) in a similar way.
Academic inquiry into the public financing of collective goods has
produced an extensive literature dating back to mid twentieth century
(Samuelson, 1954). European countries have typically followed a model
of more direct public support for social enterprise, relative to the US
(Defourny & Nyssens, 2010). Even so, approximately one-third of
revenues for the US non-profit sector are derived from government
funding (McKeever, 2015).
However, financing collective goods through government taxation
poses its own problems. The most well-known is the incidence of
deadweight loss generated by the taxation necessary for public funding
(Hausman, 1981). Depending on the form of the tax, government
intervention may lead to losses in consumer and producer surplus by
preventing mutually beneficial transactions that would have been
consummated absent the tax. Second, the government agency must
decide how much, or little, of the public good to provide (Manning et
al., 1985). Should a state have more or less vocational training, public
healthcare, or child literacy programs? Voting mechanisms are
notoriously imprecise aggregating citizen preferences, resulting in
allocative inefficiency (Gruber, 2005, pp. 228–230).
Financing Public Goods from Residual Profits
A second alternative is for private firms to divert residual
revenues from other business lines to finance public goods. One
technique is to embed an implicit contribution in the price of a private
good. TOMS shoes and fair trade coffee fall under this model.
Consumers understand that they are paying a significant premium over
the firm’s cost in order to provide an implicit donation to a particular
cause. Consumers buy a pair of shoes, eyeglasses, or coffee and a
portion of these revenues is used to finance charitable (public good)
output. The approach has proven successful at raising revenue, and
has thus been mimicked by a variety of organisations such as
Mealshare, Two Degrees, and Nouri (Marquis & Park, 2014).

6
Alternatively, firms may finance the public good output indirectly
via a diversion of residual profits from unrelated business lines. This
type of indirect financing is more common for large corporations, and
often conducted under the label of corporate social responsibility
(CSR). These charitable expenditures may be related to the firm’s core
business, as in Coca Cola’s water stewardship program. Others, such
as Walmart and Target, emphasize health and education, which are
only tangentially related to their core business lines. See Aguinis and
Glavas (2012) for a comprehensive review of this CSR research.
Unfortunately, the diversion of residual profits to the production of
collective goods requires that there first be residual profits to allocate.
Competitive market theory predicts that residual profits will be driven
to zero in efficient markets, which are common for start-up stage
businesses (Hamilton, 2000). Notably, this circumstance does not
require competition solely from profit driven competitors. Even
competition among like-minded social entrepreneurs can drive residual
profits to zero (Bagnoli & Watts, 2003). Sustaining a residual that can
be applied to social mission requires a substantial degree of market
power. Absent new technologies, government regulation, barriers to
entry, or large economies of scale, market power is often transitory and
difficult for a social entrepreneur to maintain.
Voluntary Contributions
Third, social enterprises may receive charitable contributions or
subsidies directly from the public. Decentralized charitable
contributions remain a dominant form of financing for the non-profit
sector (Andreoni, 2006; Mckeever, 2015). It is also common for for-
profit social entrepreneurs to operate with some type of donative
income (ether as cash, in-kind donations, or volunteer labour) in its
revenue mix (Austin, Stevenson, & Wei-Skillern, 2006; Oster, 1995).
Implicit donations may also come in the form of resources priced below
their market rates (i.e. subsidized credit or tax incentives).
However, reliance on donation revenue also has significant
limitations. Donors are not immune from the free rider problem.
7
Donations from one individual may offset the gifts of another
(Andreoni, 1990; Cornes & Sandler, 1996). Just as significant, the
fraction of national income allocated to explicit charitable giving has
remained consistent over the past several decades (Mckeever, 2015).
This implies that new entry into donor markets likely displaces
incumbent charitable production.
Another way? The club model
Financing public goods out of residual revenues or through
donations may be relatively common, however, neither are immune to
the free rider problem discussed previously (Powell & Steinberg, 2006).4
This paper, instead, will re-introduce a (perhaps) older technique to
mitigate free riding. The club model of local public goods is an
adaptation of the public goods model that may offer particular insights
for financing certain types of social enterprise. Cornes & Sandler (1996)
list a few key traits that distinguish club goods from traditional public
goods:
1. The (local) public goods are jointly provided by a club with a
defined membership. Club goods are both nonrival and
(typically) non-excludable within the club, but (partially)
excludable to non-members.
2. Membership in the club is voluntary, thus the benefits of
membership (consumption of the local public good) must exceed
the cost of membership.
3. Both the benefits and costs of club membership vary with club
size. Clubs may use some type of exclusion mechanism to
manage club size.
The club model dates back to Buchanan (1965). The original
application of the model was to help economist explain and analyze
the behaviour of traditional health clubs, country clubs, homeowner
4CSR and donation flows are also likely sensitive to tax regimes. See Kitzmueller
& Shimshack (2012) for a thorough review.

8
associations, and the like. A key element of the club model is that the
public good created and maintained by the club is congestible, meaning
its usefulness declines with the total number of members. Thus, club
members will develop an exclusion mechanism (such as a membership
fee) to restrict usage of the local public good. However, there is a trade-
off. Fewer members imply higher per-person costs for each individual.
The model identifies the trade-off between lowering the average cost
per member and overuse of the public good.
Iannaccone (1992) later innovated on the club model to help
explain how certain religious sects succeeded despite (or perhaps
because of) the high levels of personal sacrifice required from their
members. The innovation of the club model was to invert the concept
of congestion. Now club members’ utility increased with the active
participation of others. Consistent with religious practice, adherents
benefit when members actively participate, but are harmed by religious
free riders. In this way, religious prohibitions (i.e. admonitions against
alcohol consumption or certain sexual behaviours) serve as a tax on
secular activity, thereby encouraging religious participation.
Berman (2003; 2000; 2008) extends the Iannaconne model by
demonstrating that personal sacrifice (i.e. significant contributions of
time or money, strict dress codes, or even violence) can enhance the
value of clubs by creating a separating equilibrium. By making club
participation costly, only those who are sufficiently fervent will find it
beneficial to participate in a religious club. Iannaccone (1992) spawned
a significant literature in the application of clubs to a wide variety of
religious and secular groups.5 We test the idea that social enterprise -
which may produce club style goods - can be analysed from this
framework. To make the model clear to unfamiliar readers, we offer a
brief sketch.6
5 See Aimone et. al. (2013) for a comprehensive review. 6 A full derivation of this model can be found in (D. M. Hungerman, 2014), we
only offer a brief summary to motivate our empirical analysis.

9
Club Model of Social Enterprise
In this simple version of the model, members maximize their
utility over a private good y, a club good x, and the quality of that
club good Q.
𝑈𝑖 = 𝑈𝑖(𝑦𝑖 , 𝑥𝑖, 𝑄)
Subject to a resource constraint:
𝜋𝑦𝑦𝑖 + 𝜋𝑥𝑥𝑖 ≤ 𝐼𝑖,
Where I is a resource endowment, and 𝜋𝑖 is the relative price. x is the
local public good (which we will now refer to a “club good”), y is a
private good. The club nature of x is expressed through Q, which is a
measure of “quality” for the club good. Quality is used as a general
term, which captures the idea that the intensity and nature of other
members participation is important to individual utility.
Specifically:
𝑄 = 𝑓(𝑋, 𝑁)
where 𝑋 = ∑𝑋𝑘
𝑁
𝐾𝑘≠𝑖
So the average level of club good provision matters to individual
utility, along with the total number of participants N. Utility
increases with new members (N), but only if they are of above
average “quality”.
Hungerman (2014) sketches a Nash equilibrium for the model,
where higher prices for the private good increase utility, if the elasticity
between the club good and private consumption is sufficiently high.
The intuition of the here is that club members benefit both from their
own consumption of the club good, but also benefit from the intensity
and participation of other members. A corollary to the model is that
relatively passive members (below average intensity) will reduce the
utility of all other members.
10
The higher price (𝜋𝑦) for private consumption creates an
incentive for club participation by altering the relative prices. This
increases aggregate welfare because of the positive externality to club
good production. Similarly, high participation costs can create a
separating equilibrium, where only those who value will contribute
sufficiently to the club good X will join. Those who would be more
likely to free ride will find it optimal not to join the club, because they
do not value the club good sufficiently to bear the additional costs.
The model is tailored to religious clubs, where (𝜋𝑦) may be prohibitions
on secular activities such as alcohol consumption, gambling, or certain
sexual activities.
The main idea of the model is that religious consumption will
be more valuable once less fervent adherents are “screened out”.
Consequently, it becomes much more viable to produce the club
(religious) good. The theoretical model has been supported by
experimental evidence. Voluntary contributions to club goods were
much higher and sustainable once groups were able to select out free
riders (Aimone, Iannaccone, Makowsky, & Rubin, 2013).
Social entrepreneurs have struggled to develop business models
that overcome free riding. One useful example is the news industry, a
social enterprise by our definition. Since the popularization of online
content publishing, news organizations have experimented widely with
their pricing models. At one extreme is the Wall Street Journal which
erected a hard paywall to limit users who haven’t contributed, thus
privatizing their output, though significantly limiting their reach and
influence. At the other extreme is National Public Radio, which has
used the model of soliciting donations, while distributing their content
widely. Other news agencies have found middle ground, with an
intermediate mix of paywall and donation revenues.
This range represents the strategy space for social enterprises.
How then should ventures choose the appropriate mix of revenue
streams, set their prices, and weigh the trade-off between revenue and
reach? The club model helps to clarify this question. To the extent

11
that the quality of the local public good produced by the social
enterprise relies on the intensity of participation by its constituents,
then the club model indicates that managers should consider raising
the cost of participation. Managers of clubs may accept the lower levels
of output in return for higher quality participation.
Alternatively, other social enterprises will want to see the reach
of their output maximized. The average level of participation or
engagement will not be primary objective. Anti-poverty or policy
advocacy programs may better fit this mould. The experience value of
participation by one constituent, is not (per se) contingent on the
intensity of participation by others. In this cas,e the pure public goods
model of private provision is appropriate. Output is maximized and
some alternative revenues, most likely donative, will be deployed.
More commonly, social enterprises will produce a mix of goods,
some with club good and others with pure public good characteristics.
For example political advocacy organizations will require a core group
of constituents for community organization and outreach. These
individuals will make their own choice of effort contingent on the
choices of their peers. Counter to intuition, identifying a sufficiently
robust level of exclusion can improve the overall production of the club
good. Thus a club model of selection is important. We next test specific
hypotheses of the club model on a sample religious institution, then
discuss potential implications for social enterprise more generally.
Religious organizations as social enterprise
This paper will examine the financing scheme used by an American
religious institution to produce a public good. The object of our study
begs the question; do institutions pursuing religiously motivated social
objectives offer insights for social enterprises more generally? Some
social entrepreneurs have been sceptical, arguing that religious
institutions cannot be viewed as social enterprises. They have argued
that religious firms pose a “threat” to the social enterprise “movement”

12
(Esposito & Pelsinger, 2014). Alternatively, other authors have noted
parallels in language and strategy between environmental social
enterprises and religious sects (Bose & Komarek, 2015). Consistent
with Santos’(2012) positive definition of social enterprise, we argue
that there should be no restriction on the particular type of public good
a social enterprise may produce, allowing us to analyze religion through
a market framework.7
Furthermore, economic theory has made steady advances in
applying standard industrial organization models to interpret, explain,
and predict the behaviour of religious institutions. See Iyer (2016) and
Hungerman (2010) for comprehensive reviews. Economists have also
successfully applied market structure theories to explain the behaviour
of religious institutions in historical contexts dating back centuries
(Ekelund, Hébert, & Tollison, 2006). In a relevant decision, the US
Supreme Court has recently upheld the right of privately held
companies to pursue religiously motivated objectives (US Supreme
Court, 2013). Thus, for legal scholars, examining the behaviour of
religiously motivated for-profit firms is now keenly relevant. Finally,
religious belief has been offered as a significant motivator for social
entrepreneurs (Roundy & Taylor, 2016).
Most importantly, churches, their respective denominations, and
hierarchies appear to match the definitions of social enterprise put
forward in the existing literature. In a comprehensive review, Dacin &
Dacin (2011) attempt to distil a common theme from various
definitions of social entrepreneurship across thirty-seven recent papers.
Dacin & Dacin (2011) conclude:
We believe the definition that holds the most potential for building
a unique understanding of social entrepreneurship and developing
actionable implications is one that focuses on the social value
7 In an extensive treatment of religious competition during the first two centuries
of United States history, Fine and Stark (2005) describe how Baptist and Methodist applied recognizable economic strategies to overtake incumbent Presbyterian and Congregational churches

13
creation mission, both positive and negative, of undertakings aimed
at creating social value. (p.42)
Social value in this definition is consistent with our public good
definition of social entrepreneurship (Santos, 2012, p.337). We claim
that existing definitions of social entrepreneurship offer no guidance
regarding which social values entrepreneurs may pursue, or how one
might define positive. Social value is inherently subjective, variable
over time and across individuals. Thus, religious institutions which
promote a distinct type of social good can offer valuable insights for
the field of social entrepreneurship in several important ways.
Advantages of using religious institutions to study social
enterprise
Religious institutions offer social entrepreneurship researchers
unique opportunities for research. First, religious institutions provide
a rich set of empirical data. Many religious institutions are meticulous
recorders of revenues, expenses, and output. These records are typically
available to the public, and provide a detailed look at religious
production. In contrast, current social enterprise firm-level data is
often unrecorded or proprietary. To illustrate, Hand (2016)
meticulously identifies the current twenty-five most influential
academic articles in social entrepreneurship. More than half of the
sample deals with definitions of social entrepreneurship. The others
explore theory and research frontiers of the field. None offer a
substantive empirical analysis of any social enterprise. The lack of
empirical studies in the literature is a likely contributor to the slow
progress in establishing academic credibility in social enterprise.
Second, religious firms offer records over extraordinarily long
periods of time. Obvious examples include the Roman Catholic or
Orthodox churches, which maintain stable institutions and record
keeping that date back millennia. More recent protestant
denominations have formal institutional structures and record keeping

14
that can date back dozens, or hundreds of years. Their longevity stands
in sharp contrast to typical social enterprise research.
Long data frames are particularly important for social
entrepreneurship research. For classical for-profit firms, researchers can
apply theories of profit maximization, which are safely assumed to
remain stable over time. This is not necessarily true for social
enterprises. How any particular social cause is “valued” may vary
dramatically over time. Consider any array of contemporary
organizations that deal with political, environmental, or social causes.
How would their activities be valued now, versus fifty or one hundred
years in the past? A modern environmental cause might seem as absurd
in 1920 as a temperance league would appear today. Very long-lived
institutions are one avenue to extend analysis out from our own social
context, and to examine how social enterprise adapts to changes
culture, demographics, and political regimes.
Finally, and most significantly, religious institutions face the same
core problem as social enterprises; they must finance collective output
while mitigating free-riding among its constituents. Religious
instructions have been extremely adaptive in the tools they employ to
overcome this challenge. Iannaccone and Bose (2012) describe the
various models of financing discussed previously. Stark (1996,
2015)describe the intense competitive forces that, particularly U.S.,
religious sects endure to finance and promote their objectives.
For these reasons, we propose that religious institutions can be
viewed as a specific type of social enterprise, and subject to economic
analysis. They offer particular advantages to advance our knowledge
of social entrepreneurship by offering reliable, open, long-term data.
Using this information, we can examine how religious institutions have
evolved to overcome the difficulties in financing collective goods. To
make our analysis tractable, we focus our attention on one particular
religious institution in the United States, the Southern Baptist
Convention.

15
Overview of the Southern Baptist Convention
This paper will use historical financial data from the Southern
Baptist Convention (SBC) for its analysis. The SBC is the largest
protestant denomination in the United States, claiming more than
sixteen million adherents in 2010 (Lindner, 2012).
Southern Baptist Convention History & Governance
The SBC traces its roots to the Reformation era in England.
Reformers maintained an emphasis on adult baptism, and fled
persecution in England for the United States in the early seventeenth
century. Expansion of Baptist churches continued rapidly through the
mid nineteenth century, by emphasizing the use of lay pastors and
outdoor preaching (Finke & Stark, 2005). In 1845, the Southern
Baptist split from Northern Baptist over the issue of allowing slave
owners as missionaries (Baker, 1974).
SBC governance is highly decentralized. Each of its approximately
40,000 churches operate as independent, self-governing entities. The
local church is an autonomous unit of the SBC, with the authority
select its own pastor and leadership. However, it is common for SBC
churches to affiliate with a state convention, of which there are
currently 42 in the United States. The state conventions then
coordinate with the national convention, which meets annually to
conduct business.
The convention is overseen by an executive committee. This
committee oversees the budgets for four standing “boards” or
institutions that receive funds from the national convention. These
boards include: Guidestone Financial Resources – which oversees SBC
pensions, LifeWay Christian Resources – which handles publication
and research, the International Mission Board (IMB) – which supports
international missions, and the North American Mission Board
(NAMB) – which supports missionary personal domestically. The
executive committee also oversees budget allocation to eight SBC
seminaries.

16
Our interest lies in the activities of this national convention. The
SBC, like most religious institutions, produces a variety of religious
services, social welfare, education, recreation etc. Different goods and
services produced by the SBC have varying degrees of public good
characteristics. Our analysis will focus its attention on missionary
financing and production by the SBC. Foremost, missionary
production fits well with our definition of a local club good. For SBC
members, the value of missionaries is non-rival and non-excludable.
Yet these missionaries would have zero (or possibly negative) value for
individuals outside of the SBC. There is also the practical reason
where, unlike other types of production, the SBC has kept consistent
records of foreign missionary production for nearly a century. It is
reasonable to consider missionary production as a proxy for overall
religious production by the SBC.
Both the IMB and NAMB directly sponsor and support full-time
vocational missionaries. Producing and sponsoring new missionaries is
valuable to most SBC members. The SBC ascribes the need for
missionaries to New Testament Scripture, which commands: “But you
will receive power when the Holy Spirit has come on you, and you will
be My witnesses in Jerusalem, in all Judea and Samaria, and to the
ends of the earth” (Act 1:8, The Holman Christian Standard Bible).
SBC statements of basic beliefs support this scriptural claim, “It is the
duty and privilege of every follow of Christ and every church of the
Lord Jesus Christ to endeavour to make disciples of all nations…”.8
The IMB and the NAMB are the primary institutional vehicles for
missionary production and support in the SBC.
The consumption of missionary activity is central to SBC members.
There may be “eschatological consumption”, where an adherent
believes that the spreading of the Gospel through missionaries brings
about fulfilment of a scriptural historical narrative. Alternatively, the
adherent may simply consume the extra status and ancillary benefits
from being part of a larger group, via expansion of new believers.
8 http://www.sbc.net/aboutus/basicbeliefs.asp

17
Neither of these types of consumption are excludable to SBC members.
The SBC cannot prevent, in a literal sense, the consumption value
provided by additional missionary activity, even if the adherent did
not contribute financially to their support their costs.
Missionaries are also non-rival. Once a missionary has been put in
place, one adherent’s consumption of their work does not prevent
another’s. These two conditions would likely lead to an equilibrium of
under provision described previously. Again, this is a core problem
faced by every social entrepreneur. However, the SBC has evolved an
informative set of tools designed to mitigate the free rider problem.
SBC Collective Financing Schemes
The SBC has two primary mechanisms for financing missionary
production. The larger of the two programs is the Lottie Moon (LM)
Christmas offering. The annual offering began in 1888, and was named
for the influential female missionary in 1918.9 LM is interesting because
it is most similar to typical fundraising programs of many charitable
organizations. Individual families choose how much to give in private,
where donations are largely anonymous to other church members.
Furthermore, their private donation is competing against the large
number of other ways they could have allocated those gifts. For every
dollar a family chooses to give to LM, their personal consumption is
reduced by one dollar. The LM is our base case for voluntary
contributions to the club good.
The second vehicle for missionary financing is the Cooperative
Program (CP). The CP was started in 1925 as a collective mechanism
for supporting international missions. In the case of the CP, the church
is the giving agent. Both of the decisions (whether to give and how
much to give) are made at the church level, out of undesignated
revenues. Contributions decisions to the CP are made by an elected
church board, who face different incentives than an individual family.
Foremost, contributions decisions are public to the entire group.
9 Lottie Moon was a female missionary to China from 1873 to 1912. See
https://www.imb.org/lottie-moon-christmas-offering for more information.

18
Budget decisions are typically discussed openly in church meetings.
Further, when a board member votes to increase the contributions of
their church by one dollar, the value of the collective good increases
by one dollar, but the impact on any one family’s current consumption
is negligible. In this sense, the CP operates similarly to corporate
charitable giving, where agency issues are more acute. Later in our
analysis, we will be interested if there are systematic differences in
these two giving vehicles.
Figure 1 depicts real (2009 dollar) contributions to the CP and LM
programs since 1935. The SBC has created a remarkable financing
system, spanning decades. From the start of our time frame (1935)
until 1985, real (inflation adjusted) contributions to LM increased, on
average, by 11% year. Contributions to the CP increased, on average
by 8% annually. However, there is a noticeable change in donation
patterns after 1985, this is particularly true for the CP. Post 1985,
donations grew, on average, by 1% annually for LM and there was no
net change in real contributions to the Cooperative Program for the
past thirty years.
Our ongoing questions for this paper. What factors attributed to
the successful fundraising by the SBC for much of the twentieth
century? What factors lead to the relative collapse of fundraising by
the SBC after 1985? Finally, why has the LM fundraising strategy
proven more robust in recent decades relative to the CP?
Data
The SBC meets annually to conduct its national business. Each
national convention produces a written record of its activities, called
the SBC Annual. Our interest in the SBC coincides with the emergence
of the Cooperative Program for funding international missionaries,
which was initiated in 1925.

19
The data begins in 1935, once record keeping and the CP program
stabilized. The SBC annuals are archived as scanned PDFs.10 We
extracted the relevant tables from the annuals in five year increments
(i.e. 1935, 1940, 1945 … 2015), giving us seventeen periods. Though
the SBC annuals are available for each year, the data required
extensive by-hand data entry, so we chose to only record every fifth
year. Records are organized by state convention, thus state-year
contributions will be our unit of observation.
Because of the growth of the SBC, only a few southern states (i.e.
Alabama, Georgia, etc.) appear in the earliest panels, while northern
and western states (i.e. Iowa, Nevada, etc.) begin appear in later panels
as Southern Baptist churches spread outward in the twentieth century.
Southern Baptist churches are typically organized into individual state
conventions; however, a few states were grouped into multi-state
regions (i.e. New England, Oregon/Washington, etc.) where church
populations are more diffuse. Of the thirty-eight state/groups
available, 19 were observed over every period. The remaining were
added to SBC annuals in later periods. In all, there are 513 state/year
observations available for our analysis.
Contributions to the club good
Our primary variables of interest are state level contributions to
international missions via the Cooperative Program (CP) and Lottie
Moon (LM) offerings. Table 1 gives the inflation-adjusted values for
both the CP a LM in constant 2009 dollars. The strongest growth for
both CP and LM came in the early half of the twentieth century,
boasting double-digit real gains for several decades. However, since late
mid-century, contributions to both CP and LM have stagnated. The
CP peaked (in real terms) around 1990. LM managed modest
additional gains, until turn of the millennium, peaking in 2005. After,
10 http://www.sbhla.org/sbc_annuals/index.asp

20
2005, funding has collapsed. In particular, CP contributions have fallen
in real terms to levels observed in the 1980’s.
The data structure provides us two forms of variation: across US
state conventions, and within those conventions over time. Table 2
presents the total nominal dollar amounts given to the CP by each
state and year. Because of wide variation in state population, it is not
surprising that large states, like Texas, Georgia, and Florida, maintain
the largest levels of contributions. Alabama is a notable outlier.
Alabama has roughly one-fifth the population of Florida, yet exceeds
it in contributions. The largest and longest-lived contributors are
located in the south-eastern part of the US, consistent with the history
of the Southern Baptists. Sates outside of the southeast region were
added gradually throughout the twentieth century, creeping north and
westward.11 Nominal LM state contributions (Table 3) follow a similar
pattern, though they follow state populations more closely.
State Data
Because we are interested in explaining the contributions by states
to either the CP or LM over time, we also collect basic state
demographic data over our relevant time horizon (1935 – 2015). Table
4 presents our demographic data by state. The variables include the
number of Southern Baptist Churches (as reported in SBC Annuals),
government transfer payments (i.e. social security, public assistance,
and unemployment), per-capita income, state population, and race
(percent black). Table 5 presents these averages by year, instead of
state.
Religious Exclusion Cost
We are interested in testing the impact of exclusion mechanisms in
order to promote contributions to the club good. The SBC has
11 A notable outlier in the data is Oregon/Washington, which expresses positive
values beginning in 1950, then stops in 1985. This is a result of SBC state level conventions where, after 1985 Oregon/Washing was subsumed into a larger Northwest convention. Because the geographic boundaries are imprecise, regional conventions (i.e. Northwest or New England) were dropped from the sample.

21
remained remarkably consistent in its religions doctrinal provisions.12
Thus, we do not have a significant variation in the exclusion costs
imposed on its adherents. Alternatively, we will look for variation by
examining changes in the opportunity cost of adherence, by
documenting the availability of competing sects. We do this by
measuring the availability of alternative religious denominations, while
holding constant the strictness of SBC.
Unfortunately, comprehensive religious affiliation data is not
available by state, particularly over our long time frame. Instead, we
divide state population into the number of SBC churches to generate
a SBC church density metric. We use this as a proxy for religious
exclusion, whereby a higher concentration of SBC churches per state
lowers the cost of adherents. Conversely, lower concentration of SBC
churches implies lower cultural dominance. It is more likely that
existing or potential adherents have lower cost alternatives to SBC
membership.
Secular Exclusion Cost
Hungerman (2010) argues that, when examining markets for
religious services, researchers should analyse both intra religious
competition and competition against secular alternatives. He outlines
an effective method for doing so in a series of papers that examine the
repeal of “Blue Laws” by states over the previous century (Gerber,
Gruber, & Hungerman, 2016; Gruber & Hungerman, 2008; D. M.
Hungerman, 2014). Blue laws are religiously motivated laws (such as
prohibition against alcohol or Sunday retail sales) which were named
for their printing on blue paper. Blue laws have gradually been repealed
by US states over the last century. Hungerman demonstrates that the
blue law repeals both signal a change in culture and alter the relative
opportunity cost of participation in religious activities.
Our Table 6 is adapted from Gruber & Hungerman (2008), which
gives the year that each state voted to repeal it’s blue laws. Gruber
12 A complete catalog of SBC resolutions can be found at
http://www.sbc.net/resolutions/.

22
and Hungerman note that many states are not included in the table
because; either they never had blue laws, or the blue laws were repealed
at the county level. We will seek to expand the detail of this blue laws
list as this paper develops further. By including a set of indicator
variables for when secular competition increases, we hope to identify
points of cultural change that indicate an increase secular competition
for religious services.
Empirical Model and Hypotheses
Our aim of this paper is to test the club model of public goods
financing on mitigating free riding. We examine the test case of the
Southern Baptist Convention. As discussed previously, we are looking
at two distinct financing schemes over time and across US states. The
baseline models are as follows:
[
𝑃𝑒𝑟𝐶ℎ_𝐶𝑃𝑖𝑡
𝑃𝑒𝑟𝐶ℎ_𝐿𝑀𝑖𝑡
𝑇𝑜𝑡𝑎𝑙_𝐶𝑃𝑖𝑡
𝑇𝑜𝑡𝑎𝑙_𝐿𝑀𝑖𝑡
] = 𝛼 + 𝛽𝑖𝑡 𝑅𝑒𝑙𝑖𝑔𝑖𝑜𝑢𝑠 𝐶𝑜𝑠𝑡 ##𝜃𝑖𝑆 + 𝜆𝑖𝑡𝑋 + 𝜇𝑡𝑌𝐸𝐴𝑅 + 𝜖𝑖𝑡 (1)
[
𝑃𝑒𝑟𝐶ℎ_𝐶𝑃𝑖𝑡
𝑃𝑒𝑟𝐶ℎ_𝐿𝑀𝑖𝑡
𝑇𝑜𝑡𝑎𝑙_𝐶𝑃𝑖𝑡
𝑇𝑜𝑡𝑎𝑙_𝐿𝑀𝑖𝑡
] = 𝛼 + 𝛽𝑖𝑡 𝑆𝑒𝑐𝑢𝑙𝑎𝑟 𝐶𝑜𝑠𝑡##𝜃𝑖𝑆 + 𝜆𝑖𝑡𝑋 + 𝜇𝑡𝑌𝐸𝐴𝑅 + 𝜖𝑖𝑡 (2)
The models will test four dependent variables: per-church giving
to the Cooperative Program (PerCH CP), total giving to the CP (Total
CP), per-church giving the Lottie Moon (PerCH LM), and total giving
to LM (Total LM) for state i and year t.
We examine exclusion costs in two ways. First, a significant
cost of adherence is the forgone opportunity to participate in a
competing religious sect. Religious Cost is lowest in an environment
that is dominated by a single religious provider. The opportunity cost
will rise as the religious environment becomes more pluralistic and
competitive. We constructed this proxy as the number of Southern
Baptist churches in the state, divided by the state population where

23
those churches are located.13 This implies that greater religious
concentration (moving toward monopoly) will result in a lower cost.
Conversely, greater religious plurality implies a high opportunity costs
for participation in any one sect.
We calculate a measure of density for SBC churches by state,
specifically the number of churches per 10,000 persons of state
population 𝐶ℎ𝑢𝑟𝑐ℎ 𝐷𝑒𝑛𝑠𝑖𝑡𝑦 = (𝑆𝐵𝐶 𝐶ℎ𝑢𝑟𝑐ℎ𝑒𝑠
𝑆𝑇𝐴𝑇𝐸 𝑃𝑜𝑝𝑢𝑙𝑎𝑡𝑖𝑜𝑛). Table 7 lists the mean
number of churches per 10,000 in population, by state. Not
surprisingly, “deep south” states such as Alabama, Mississippi, and
Georgia have the highest concentration of SBC churches. North-
eastern and northwester states, where the SBC spread much later, have
lower concentrations of churches. To be consistent with the notion of
lower church density implying higher costs, we construct Religious
Cost = (1
𝐶ℎ𝑢𝑟𝑐ℎ 𝐷𝑒𝑛𝑠𝑖𝑡𝑦). Thus, higher values of Church Density implies
lower membership costs.
Second, contributions of time and money to religious activities
represent forgone secular consumption. To capture this, we adopt a set
of dummy variables that tracks the repeal of Blue Laws in a particular
state. Blue laws repeal imply a higher cost of religious participation,
because greater secular opportunities then become available. Thus,
Secular Cost =1 indicates that a Blue Law was repealed in year t and
state i.
Finally, X is a vector of state level covariates including: (Per-
Capita Income; Government Transfers; and race (measured as percent
black)). We include a full set of state and year dummy variables. Table
8 presents summary statistics for all covariates.
Hypotheses
There are opposing views as to whether contributions to the club
good will increase or decrease with higher exclusion mechanisms. On
one hand, high levels of church density imply amplified cultural
13 Unfortunately, we were unable to attain reliable church membership (Southern
Baptist or otherwise) estimates at the state level over this time span.

24
dominance, social conformity, and returns to religious signalling. These
forces will encourage additional contributions, because the marginal
benefit to conformity is high. Furthermore, increasing church density
will simply make it more likely that potential adherents are solicited
more often for contributions (Bekkers & Wiepking, 2011).
Experimental research has demonstrated that voluntary contributions
are positively influenced by social conformity and positive self-image
(Gneezy, Gneezy, Riener, & Nelson, 2012). This story would indicate
that contributions (CP and LM) will be inversely correlated with
Religious Cost.
On the other hand, religious market power implies that it is easier
for an individual to free ride by escaping detection. Non-contributors
find it easier to pose as an adherent, because of its dominance of the
ambient culture. Further, cultural dominance could reduce product
innovation on the supply side, thereby discouraging adherence. This
story would imply a positive relationship between Religious Cost and
per-church contributions. Empirically, Zalezki and Zech find that
congregations in low density (high competition) markets actually give
more. They argue competitive churches are more sensitive to consumer
needs, and find niches in the religious marketplace (1992).
Hypothesis 1 & 2: Per-church contributions will increase
with Religious Cost.
Iannacone and Bose (Iannaccone & Bose, 2012) offer a way to
separate these competing narratives. Their paper distinguishes between
collective and private religions. Collective religions operate like clubs,
where adherents are viewed as members, rather than patrons.
Collective religions are usually theologically exclusive, and often
impose costly lifestyle and moral codes to identify true members
(Iannaccone, 1992). Collective (or club) religions include Christian
Evangelical traditions (including the Southern Baptists), along with
Mormonism, and stricter forms of Islam. Group participation, identity,
and distinctions between in-group and out-group matter a great deal

25
in these faith traditions. Somewhat counterintuitively, hegemony of
these types of religions will likely reduce individual contributions to
the collective good. As these religions become larger, the ability to
enforce conformity and monitor free riding declines. Second, any
individual’s marginal contribution to the club good will be small,
particularly as the total size of religious club goods increases. Thus, for
collective religions, we expect that per church contributions will move
positively with Religious Cost (Zaleski & Zech, 1995).14
Southern Baptist convention falls well within what Iannaccone and
Bose (2012) characterize as a collective religion. Though enforcement
has varied, historical Southern Baptist teaching has historically
included significant lifestyle prohibitions including: abstinence from
alcohol, gambling (including most card play), and sexual activity
outside of traditional marriage.15 In the affirmative, Southern Baptist
tradition calls for a public profession of faith by immersion baptism.
These characteristics impose a high cost on those with relatively low
religious adherence, making the SBC a club style religion. Consistent
with theory of club religions, we expect that giving to the collective
good by adherents within the SBC will move positively to Religious
Cost (inversely to church density). Formally:
𝐻1: 𝛿(𝑃𝑒𝑟𝐶ℎ 𝐶𝑃 )
𝛿𝑅𝑒𝑙𝑖𝑔𝑖𝑜𝑢𝑠 𝐶𝑜𝑠𝑡> 0 𝐻2:
𝛿(𝑃𝑒𝑟𝐶ℎ 𝐿𝑀)
𝛿𝑅𝑒𝑙𝑖𝑔𝑖𝑜𝑢𝑠 𝐶𝑜𝑠𝑡> 0
We report our empirical results for H1 and H2 in Tables 9 and 10.
14 For contrast, Iannaccone & Bose (2012) describe private religions as those that
act more like secular commercial firms. Examples of private religions include
Chinese “folk” traditions, Greco-Roman paganism, and American “New
Age/Spiritualism”. For private religions, brand loyalty is rare, and theology is less exclusive. Religious services are typically provided as fee for service. Patrons often construct a religious portfolio of goods and services, encompassing many different
traditions that meet an adherent’s particular tastes. In particular, private religious are those for which participation, allegiance to that particular group matters less. Religious patrons are free to shop around for religious services from different vendors without stigma. Thus, private religions are more likely to be adversely influenced by religiously competitive environments.
15 See http://www.sbc.net/resolutions, and search by keyword for various
resolutions.

26
Hypothesis 3 & 4: Per Church contributions to CP or LM
will increase with Secular Cost.
As discussed previously, Hungerman presents evidence that secular
competition is just as important in religious markets (Gerber et al.,
2016; D. Hungerman, 2010; D. M. Hungerman, 2014). Intuitively,
religions traditions compete for time and resource both among existing
religious traditions and against secular competitors. We adopt
Hungerman’s use of Blue Laws by state as an instrument for Secular
Cost.
Under the club religions model, competition between secular and
religious activities plays out similarly to intra-religious completion. In
club religious, the free rider problems dominates, thus imposing higher
cost has the effect of increasing per-church contributions. Thus, we
expect that:
𝐻3: 𝛿(𝑃𝑒𝑟𝐶ℎ 𝐶𝑃)
𝛿 𝑆𝑒𝑐𝑢𝑙𝑎𝑟 𝐶𝑜𝑠𝑡> 0 𝐻4:
𝛿(𝑃𝑒𝑟𝐶ℎ 𝐿𝑀)
𝛿 𝑆𝑒𝑐𝑢𝑙𝑎𝑟 𝐶𝑜𝑠𝑡> 0
We report results for H3 and H4 in tables 11 & 12.
Hypothesis 5 & 6: Total contributions to CP or LM will
decrease with Religious Cost.
Under the club model, increasing the exclusion mechanism
should increase per-church contributions, but the effect on total
contributions is ambiguous. If price elasticity is sufficiently high,
increasing the exclusion mechanism will reduce total contributions to
the club good because a large number of potential members are
excluded. While not making a strong prediction, we test this outcome
by looking at whether increases in Religious Cost subsequently reduce
total state contributions to LM and CP.16 Specifically:
16 To normalize the distribution, we take the natural logarithm of total
contributions.

27
𝐻5: 𝛿(𝑙𝑛𝑇𝑜𝑡𝑎𝑙_𝐶𝑃)
𝛿 𝑅𝑒𝑙𝑖𝑔𝑖𝑜𝑢𝑠 𝐶𝑜𝑠𝑡< 0 𝐻6:
𝛿(𝑙𝑛𝑇𝑜𝑡𝑎𝑙_𝐶𝑃)
𝛿 𝑅𝑒𝑙𝑖𝑔𝑖𝑜𝑢𝑠 𝐶𝑜𝑠𝑡< 0
Hypothesis 7 & 8: contributions to CP or LM will increase
with Secular Cost.
We perform a similar test for Secular Cost. Specifically, we test:
𝐻7: 𝛿(𝑙𝑛𝑇𝑜𝑡𝑎𝑙_𝐶𝑃)
𝛿 𝑆𝑒𝑐𝑢𝑙𝑎𝑟 𝐶𝑜𝑠𝑡< 0 𝐻8:
𝛿(𝑙𝑛𝑇𝑜𝑡𝑎𝑙_𝐿𝑀)
𝛿 𝑆𝑒𝑐𝑢𝑙𝑎𝑟 𝐶𝑜𝑠𝑡< 0
Hypothesis 9 & 10: CP will express lower sensitivity to
variation in religious and secular competition, relative to
the LM program.
Recall there are two distinct channels provided by the SBC for
missions funding. The LM Christmas offering is representative of
traditional forms of philanthropy. Gift amounts are largely anonymous,
and the donor bears the full cost of the donation. The decision to
contribute to the CP program are made differently. Contributions
decisions are public, and made by a committee (often of church
deacons). Since contributions from to the CP program are from
unrestricted church budgets, the cost of the initial donation is already
sunk. Experimental evidence demonstrates that exclusion mechanisms
should be most effective when contributions are anonymous (Aimone
et al., 2013). Thus, we expect that the impact of religious and secular
cost will be larger for LM than CP. Formally,
H5: |𝛿𝐿𝑀
𝛿𝑅𝑒𝑙𝑖𝑔𝑖𝑜𝑢𝑠 𝐶𝑜𝑠𝑡| > |
𝛿𝐶𝑃
𝛿𝑅𝑒𝑙𝑖𝑔𝑖𝑜𝑢𝑠 𝐶𝑜𝑠𝑡|
and
H6: |𝛿𝐿𝑀
𝛿 𝑆𝑒𝑐𝑢𝑙𝑎𝑟 𝐶𝑜𝑠𝑡| > |
𝛿𝐶𝑃
𝛿 𝑆𝑒𝑐𝑢𝑙𝑎𝑟 𝐶𝑜𝑠𝑡|
The practical implication of this hypothesis is that CP should be a
more stable source of financing, relative to LM contributions.

28
Results
Results related to Hypothesis 1 & 2:
Table 9 presents results from the regression on Per-Church LM
contributions. Our primary interest is in the impact of Religious Cost
on per-church LM contributions. The model includes interaction
effects, which are suppressed for presentation purposes in the regression
tables. To ease interpretation, we include the marginal effect for
Religious Cost below the full regression table. The point estimate
should be interpreted as the effect of an increase in 10,000 state
residents, for a given number of churches in the state. When the
density of churches in a state is reduced (thereby increasing the
opportunity cost to the adherent) average per-church donations to the
Lottie Moon missions offering increase by $101.74. This effect is large,
statistically significant, and consistent with H1.
Table 10 presents the results for the regression model on the
Cooperative Program (CP). Recall that the CP is the fraction of
church revenues that are allocated to foreign missions. Again, the point
estimate is interpreted as the effect of increasing the state population
by 10,000 on the average contribution of a church in that state. The
marginal effect of Religious Cost indicates that increasing the
population by 10,000, holding churches constant, will increase per-
church contributions by $59.24. Again, the effect is large, statistically
significant, and consistent with H2.
Results related to Hypothesis 3 & 4:
We next looked at the effect of secular competition on contributions
to the club good. Our primary variable of interest is now Secular Cost,
a dummy variable indicating the year a particular state repealed their
Blue Laws. Thus, secular costs increase when Secular Cost =1. Recall
that not every state experienced a state-level change in blue laws
during the sample frame. Only states in Table 6 are included in the
regression sample. This regression also removes state and year dummy
variables to prevent collinearity.

29
We interact Secular Cost with State so that we can isolate the
individual of the blue laws for each state affected. Table 11 reports
both the marginal effects for Secular Cost and Secular Cost by State
for the regression on per-church CP. The table shows that the average
treatment effect, for all states and years, was to increase per-church
contributions to the CP by $1,271.55. The effect is large, and
statistically significant. Repealing Blue Laws in the states where the
sample is available increases, on average, real contributions to the CP
by sixty percent. The bottom section of Table 11 shows the marginal
effects for each state that contained enough data to form an estimate.
We observe a statistically significant impact of repeal in half of those
states that were tested (Kansas/Nebraska, Ohio, Tennessee, and
Texas). The remainder were indistinguishable from zero.17
Findings were similar for contributions to the LM Christmas
offering, shown in Table 12. Again, for clarity, we only display the
marginal effect for Secular Cost and then for Secular Cost interacted
with each State. Similar to the results for CP, per church contributions
to LM increase with Secular Cost. The magnitude of the effect is very
similar, increasing average contributions by $746.74, though the effect
was only significant at larger confidence intervals (𝛼 = .10). Again, the
same states demonstrated statistically significant increases in
contributions subsequently to the Blue Laws repeal. These results
broadly support H3 and H4.
It is worth noting again that many states in the sample could not
be tested. Alabama, for instance, repealed blue laws at the county level,
thus a state observation is not possible. Efforts to integrate these, and
other, states back into the sample are ongoing.
Results related to Hypothesis 5 & 6
From the club model, we expect that per-church contributions
will increase with stronger exclusion mechanisms. However, the impact
on total contributions is ambiguous. The total impact on contributions
17 It is important to remember that CP has been deflated to real values, so this
effect is not impacted by general inflation.

30
depends on the sensitivity of adherents to the exclusion mechanism on
the extensive margin. It is plausible that increases in the exclusion
mechanisms may increase per church contributions, while decreasing
overall contributions. We test this by regressing exclusion (religious
and secular) costs against total contributions to LM and CP.
Because the coefficient is difficult to interpret, Table 13 reports
the elasticity of the marginal effect below the main regression. The
impact of an increase in Religious Cost (lowering church density) on
total contributions by ten percent, reduces total contributions to LM
by one-half of one percent. The effect size is modest, but statistically
significant. Increasing the religions exclusion lowers aggregate
contributions, but not by much. We find a similar result for the impact
of Religious Cost on the contributions to CP, reported in Table 14. In
this case an increase in Religious Cost of ten percent reduces total
contributions to the CP by eight tenths of one percent. Again, modest,
but statistically significant. These results support H5 & H6.
We then examine the impact of increasing Secular Cost. For
brevity, we only post the marginal effects of the exclusion costs
(Religious Cost and Secular Cost) in Table 15. The regression model
does not show a statistically significant effect. The most plausible
interpretation of these results is that increases in per-church giving
(intensive margin) are offset by declining total giving. While not
specifically supporting H7 & H8, these results are consistent with the
club model.
Results related to H9 & H10
In our final set of results, we examine the differences in impact
between contributions to CP and LM. Recall that we are interested if
the two types of financing schemes produce different levels of
contribution to the club good when religious and Secular Cost vary.
LM offerings are individual, anonymous, and repeatable. Thus they
mimic individual giving patterns for many types of public goods games.

31
In contrast, CP contributions are public, and set by committee at the
church level. We have shown that contributions to both LM and CP
increase with when the cost of participation rises. This is the
theoretical prediction for collective religions. However, we also have
the opportunity to observe differences in fundraising effectiveness
across two distinct fundraising schemes for the same public good.
Table 16 offers a simple t-test between the marginal effects of
Religious Cost on CP and LM contributions. The test confirms a
statistically significant difference between the two financing
mechanisms. However, we do not get the expected sign. Contributions
to the CP were more responsive to changes in Religious Cost compared
to contributions to LM. . This finding is not supportive of H5.
Contributions to CP appear to be more sensitive to changes in the
religious competitive environment than do contributions to the LM.
This finding is not consistent with our club theory model, and worthy
of further inquiry.
Table 17 reports a t-test between the marginal impacts of Secular
Cost on CP and LM contributions. In this case, we cannot detect a
statistically significant difference between the two effect sizes. The
point estimates are consistent with our previous test. The impact of
Secular Cost is more pronounced for contributions to CP, compared to
LM. Again this is unexpected, considering the decision making process
of a church committee should be, ex-ante, less reactive than individual
donors.
Conclusions & Lessons for Social Enterprise
This paper began with the premise that social enterprises can
be identified by their production of public goods. Given this definition,
all social entrepreneurs face a common struggle; to finance production
when free-riding is optimal by their constituents. A common tactic is
for governments to employ their unique ability to tax, which mitigates
free riding. However, for those social enterprises which are not

32
supported by government budgets, or wish to supplement those funds
through voluntary financing, other strategies must be developed.
Social entrepreneurs may attempt to charge a premium mark-up
linked to their public good. Strategies for this include tying their public
good to a private product, or by erecting a paywall to charge a price
in excess of marginal cost (as with the WSJ). Of course, by doing this,
the social enterprise limits the scope and influence of their public good.
Alternatively, the social enterprise may choose to lower their price
- perhaps to zero- to maximize the reach of their product. Examples
include political advocacy organizations and most aid NGOs. However,
this choice requires generating alternative revenues, typically through
voluntary donations (as with NPR). Though social enterprises have
engaged a range of these approaches, there is little theoretical (or
empirical) guidance as to when, or under what circumstances, to
pursue either strategy.
This paper takes an evolutionary approach, by examining
institutions that have proven durable at providing public goods over
very long time horizons. Religious institutions have deployed a
remarkable variety of schemes to facilitate production of religious
public goods. Analyzing these institutions may offer valuable lessons
for social enterprise today. We have focused on one large religious
institution, the Southern Baptist Convention which produces a costly
public good, international missionaries. Over the past century, the SBC
has produced and deployed one of the largest professional missionary
forces in the world, employing millions of dollars and thousands of
workers over the past eight decades. SBC missions programs reached
their funding zenith around the turn of the millennium. However,
recent financial stress has caused the International Mission Board to
reduce their staff by nearly one thousand full time missionaries, and
liquidate many of foreign assets (Smietana, 2015).
Iannaconne and Bose (Iannaccone & Bose, 2012) describe Southern
Baptist as a collective religion. Collective religions rely heavily on
strong group identity and high-cost religious activities to effectively
exclude insufficiently fervent adherents. Relative to private religions,

33
collective religious have strong club goods characteristics that are
amenable to the sustainable production public goods.
Counterintuitively, the club theory of religions predicts that
adherents of collective religions can increase their output of the club
good when the cost of membership is higher (Aimone et al., 2013; Eli
Berman & Laitin, 2008; Iannaccone, 1992). We tested this conjecture
by examining SBC giving data to international missions from 1935 to
present day. Our analysis examined both intra-religious competition
and secular competition. Consistent with the club theory of religion,
we find that per-church contributions to missions are higher when
religious competition increases. Furthermore, secular competition was
also correlated with higher contributions to the public good. These
findings do not, however, help explain the relatively recent collapse in
missions funding in the SBC, which is an area of ongoing inquiry.
Our analysis further sought to exploit a peculiar aspect of SBC
governance where contributions to missions is collected by two distinct
means. The annual Lottie Moon Christmas offering is most similar to
typical voluntary charitable donations. LM contributions are
anonymous and the household bears the full cost of the donation. This
mechanisms is different than contributions through the Cooperative
Program. Giving through the CP is aggregated at the congregation
level. Giving is authorised through a committee of elders from
unrestricted church funds. The dollar value of the contributions is
published publicly, while the cost of the gift is dispersed through the
congregation. Counter to our expectations, we did not find any
meaningful difference between these two contribution schemes.
Though this paper has focused on religious institutions, we believe
that there are lessons to be applied to social enterprise in general. The
club model of religion offers an illuminating method for mitigating
these problems.
Under specific circumstances, making membership in your club
costly (exclusive) may increase the average willingness to voluntarily
contribute. There are various strategies, from demanding sacrifices (in
terms of time and money), to outrageous signals of allegiance

34
(countercultural dress codes or behaviours). These signals may create
a separating equilibrium, which both mitigates defection by true
followers, and screens less enthusiastic adherents (Iannaccone, 1992).
These practices run counter to the logic of competitive markets, where
lowering the costs and barriers to consumers is the dominant
competitive strategy.
This paper demonstrates that the strategies employed by a
collective religion operating within club model of membership has been
successful producing a club good over a long time period. Other
examples in the literature include ultra-orthodox Jews (Eli Berman,
2000) and Hamas (Eli Berman & Laitin, 2008) and environmental
organizations (Bose & Komarek, 2015). Each demand high levels of
commitment and public sacrifice. In return, clubs mitigate free riding
and create an environment conducive to the production of public
goods. Importantly, Beman & Laitin (2008) argue that it is the
structure and practices of the organization, not the religious claims or
mission of the organization that are key to member allegiance.
Individual incentives to free ride, combined with competitive
pressures, whittle away a firm’s ability to divert resources to finance
the club good. Can a social enterprise follow a strategy similar to
private religious clubs? Could the club model of religion offer some
helpful alternative strategy for social enterprise? Some segments of the
modern environmental movement and various social justice/equality
organization appear to be adopting these techniques. Examining a
sample of successful social enterprises in light of this club model is
beyond the scope of this paper, but a worthy avenue of future research.
Limitations and Extensions
We have tested the application of the club model of public goods
production as a strategy for mitigating free riding. We have argued
that the model provides useful insights for social enterprise in general.
Primarily, if an organization’s membership is collective, where the

35
value to members is contingent on the quality of other members’
participation, then raising the cost of membership could lead to more
sustainable production. This claim appears to be consistent with the
history of the SBC. However, we are careful to note that this is just
one organization.
Subsequent research effort is being put forth to collect additional
data from a more wide variety of religious institutions. This included
organizations that have experience more variation in their demand for
sacrifice (i.e. main-line denominations such as United Methodist,
Presbyterian Church (USA), or the American Baptist). These religious
organization have relaxed religious restrictions earlier in their history
and to a much greater degree than the SBC. Also, we would like to
collect data on non-collective religious organizations, as described
previously.
For reasons described above, we do think that the careful
examination of religious organization can provide valuable information
for social enterprise strategy. However, we do not want to overstate
this comparison. Social enterprise represents a vast array of missions,
markets, and operation models. Consequently, no single paper can
pretend to unlock a universal principle for this type of institution. We
do emphasize the need to empirical examination of social enterprise.
With existing data limitations, religious institutions do provide a
valuable, if imperfect starting point.

36
Works Cited
Aguinis, H., & Glavas, A. (2012). What We Know and Don’ t Know About
Corporate Social Responsibility. Journal of Management, 38(4), 932–
968. https://doi.org/10.1177/0149206311436079
Aimone, J. A., Iannaccone, L. R., Makowsky, M. D., & Rubin, J. (2013).
Endogenous Group Formation via Unproductive Costs. The Review of
Economic Studies, 80(4), 1215– 1236.
https://doi.org/10.1093/restud/rdt017
Andreoni, J. (1988). Why free ride?: Strategies and learning in public goods
experiments. Journal of Public Economics, 37(3), 291– 304.
https://doi.org/10.1016/0047-2727(88)90043-6
Andreoni, J. (1990). Impure Altruism and Donations to Public Goods: A
Theory of Warm-Glow Giving? Economic Journal, 100(401), 464– 77.
Andreoni, J. (2006). Philanthropy. In Serge-Christophe Kolm & Jean
Mercier Ythier (Eds.), Handbook of the Economics of Giving, Altruism
and Reciprocity (Vol. 2, pp. 1201– 1269). Elsevier.
https://doi.org/10.1016/S1574-0714(06)02018-5
Andreoni, J., & Payne, A. A. (2013). Charitable Giving. Handbook of
Public Economics (Vol. 5). Elsevier B.V.
https://doi.org/10.1016/B978-0-444-53759-1.00001-7
Austin, J., Stevenson, H., & Wei-Skillern, J. (2006). Social and Commercial
Entrepreneurship: Same, Different, or Both? Entrepreneurship Theory
and Practice, 30(1), 1– 22. https://doi.org/10.1111/j.1540-
6520.2006.00107.x
Bagnoli, M., & Watts, S. G. (2003). Selling to Socially Responsible
Consumers: Competition and The Private Provision of Public Goods.
Journal of Economics, 12(3), 419– 445. https://doi.org/10.1111/j.1430-
9134.2003.00419.x
Baker, R. A. (1974). The Southern Baptist Convention and its people,
1607-1972. Broadman Press.
Bekkers, R., & Wiepking, P. (2011). A Literature Review of Empirical
Studies of Philanthropy. Nonprofit and Voluntary Sector Quarterly,
40(5), 924– 973. https://doi.org/10.1177/0899764010380927
Bergstrom, T., Blume, L., & Varian, H. (1986). On the private provision of
public goods. Journal of Public Economics, 29(1), 25– 49.
https://doi.org/10.1016/0047-2727(86)90024-1
Berman, E. (2000). Sect, Subsidy, and Sacrifice: An Economist’ s View of

37
Ultra-Orthodox Jews. Quarterly Journal of Economics, 115(3), 905–
953. https://doi.org/10.1162/003355300554944
Berman, E. (2003). Hamas, Taliban and the Jewish underground: an
economist’ s view of radical religious militias (No. 10004). National
Bureau of Economic Research. Retrieved from
http://www.nber.org/papers/w10004
Berman, E., & Laitin, D. D. (2008). Relgion, Terrorism, and Public Goods:
Testing the Club Model. Journal of Public Economics, 92(10), 1942–
1967. https://doi.org/10.1016/j.jpubeco.2008.03.007
Bose, F., & Komarek, T. M. (2015). Are Religion and Environmentalism
Complements or Substitutes?: A Club-Based Approach. ISSN
Interdisciplinary Journal of Research on Religion, 11, 1556– 3723.
Retrieved from http://www.religjournal.com.
Buchanan, J. M. (1965). An Economic Theory of Clubs. Economica,
32(125), 1. https://doi.org/10.2307/2552442
Cornes, R., & Sandler, T. (1996). The Theory of Externalities, Public
Goods, and Club Goods. Cambridge University Press.
https://doi.org/10.1017/CBO9781139174312
Dacin, M. T., Dacin, P. A., & Tracey, P. (2011). Social Entrepreneurship:
A Critique and Future Directions. Organization Science, 22(5), 1203–
1213. https://doi.org/10.1287/orsc.1100.0620
Dawes, R. M., & Thaler, R. H. (1988). Anomalies : Cooperation. Journal
of Economic Perspectives, 2(3), 187– 197.
Defourny, J., & Nyssens, M. (2010). Conceptions of Social Enterprise and
Social Entrepreneurship in Europe and the United States:
Convergences and Divergences. Journal of Social Entrepreneurship,
1(1), 32– 53. https://doi.org/10.1080/19420670903442053
Ekelund, R., Hé bert, R., & Tollison, R. (2006). The marketplace of
Christianity. Camnbridge: MIT Press.
Elkington, J., & Hartigan, P. (2008). The power of unreasonable people :
how social entrepreneurs create markets that change the world.
Harvard Business School Press.
Esposito, R., & Pelsinger, S. (2014). People, Planet, Profit ... Religion.
Stanford Social Innovation Review. Retrieved from
https://ssir.org/articles/entry/people_planet_profit...religion
Finke, R., & Stark, R. (2005). The Churching of America, 1776-2005:
Winners and losers in our religious economy. Rutgers University Press.

38
Retrieved from
https://books.google.com/books?hl=en&lr=&id=CUu34waWUMoC&o
i=fnd&pg=PR5&dq=The+churching+of+america&ots=1sn-
bRUeuB&sig=JuEMEkbqtUU528jlW71TBnh10xY
Fischbacher, U., & Gächter, S. (2010). Social Preferences, Beliefs, and the
Dynamics of Free Riding in Public Goods Experiments. American
Economic Review, 100(1), 541–556.
https://doi.org/10.1257/aer.100.1.541
Gerber, A. S., Gruber, J., & Hungerman, D. M. (2016). Does Church
Attendance Cause People to Vote? Using Blue Laws’ Repeal to
Estimate the Effect of Religiosity on Voter Turnout. British Journal of
Political Science British Journal of Political Science British Journal of
Political ScienceJ.Pol.S, 4678(46), 481–500.
https://doi.org/10.1017/S0007123414000416
Gneezy, A., Gneezy, U., Riener, G., & Nelson, L. D. (2012). Pay-what-you-
want, identity, and self-signaling in markets. Proceedings of the
National Academy of Sciences of the United States of America,
109(19), 7236–40. https://doi.org/10.1073/pnas.1120893109
Gruber, J. (2005). Public finance and public policy. Worth Publishers.
Gruber, J., & Hungerman, D. M. (2006). The Church v.s the Mall: What
Happens When Religion Faces Increased Secular Competition? NBER
WORKING PAPER SERIES. Retrieved from
http://www.nber.org/papers/w12410
Gruber, J., & Hungerman, D. M. (2008). The Church versus the Mall :
What Happens When Religion Faces Increased Secular Competition.
The Quarterly Journal of Economics, 123(2), 831–862.
Hamilton, B. H. (2000). Does Entrepreneurship Pay? An Empirical Analysis
of the Returns to Self‐Employment. Journal of Political Economy,
108(3), 604–631. https://doi.org/10.1086/262131
Hand, M. (2016). The Research Gap in Social Entrepreneurship. Stanford
Social Innovation Review, May, 2–5. Retrieved from
https://ssir.org/articles/entry/the_research_gap_in_social_entrepreneursh
ip
Hausman, J. (1981). Exact Consumer’s Surplus and Deadweight Loss.
American Economic Review, 71(4), 662–676. Retrieved from

39
http://www.jstor.org/stable/1806188?seq=1#page_scan_tab_contents
Hungerman, D. (2010). Rethinking the study of religious markets. In
Handbook of the Economics of Religion (pp. 257–275). Oxford: Oxford
University Press. Retrieved from
https://www3.nd.edu/~dhungerm/Hungerman_Chapter.pdf
Hungerman, D. M. (2014). Do Religious Proscriptions Matter? Evidence
from a Theory-Based Test. Journal of Human Resources, 49(4), 1053–
1093. https://doi.org/10.3386/w17375
Iannaccone, L. R. (1992). Sacrifice and Stigma: Reducing Free-riding in
Cults, Communes, and Other Collectives. Journal of Political
Economy, 100(2), 271–291. https://doi.org/10.1086/261818
Iannaccone, L. R., & Bose, F. (2012). Funding the Faiths: Toward a
Theory of Religious Finance. The Oxford Handbook of the Economics
of Religion. https://doi.org/10.1093/oxfordhb/9780195390049.013.0017
Iyer, S. (2016). The New Economics of Religion. Journal of Economic
Literature, 54(2), 395–441. https://doi.org/10.1257/jel.54.2.395
James Andreoni, & A. Abigail Payne. (2008). Crowding out Both Sides of
the Philanthropy Market: Evidence from a Panel of Charities February
2008 By James Andreoni and A. Abigail Payne*. Levine’s
Bibliography, (February). Retrieved from
http://www2.warwick.ac.uk/fac/soc/economics/news/forums/conferen
ces/peuk/andreoni_payne2_feb_25_2008.pdf
Kitzmueller, M., & Shimshack, J. (2012). Economic Perspectives on
Corporate Social Responsibility. Journal of Economic Literature, 50(1),
51–84. https://doi.org/10.1257/jel.50.1.51
Laurence, R. (1992). Sacrifice and Stigma : Reducing Free-riding in Cults ,
Communes , and Other Collectives Author ( s ): Laurence R .
Iannaccone Source : Journal of Political Economy , Vol . 100 , No . 2 (
Apr ., 1992 ), pp . 271-291 Published by : The University of Chicago.
Journal of Political Economy, 100(2), 271–291.
Lindner, E. (2012). Yearbook of American & Canadian Churches. Abingdon
Press.
Manning, R., Markusen, J. R., McMillan, J., Manning, R., Markusen, J., &
McMillan, J. (1985). Paying for Public Inputs. American Economic
Review, 75(1), 235–38.
Marquis, C., & Park, A. (2014). Inside the Buy-One Give-One Model.

40
Stanford Social Innovation Review, (Winter 2014), 28–33.
Mas-Colell, A., Whinston, M. D., & Green, J. R. (1995). Microeconomic
theory. Oxford University Press. Retrieved from
https://books.google.com/books/about/Microeconomic_Theory.html?id
=KGtegVXqD8wC
McKeever, B. (2015). The Nonprofit Sector in Brief. The Non-Profit Sector
in Brief 2015, 2007(October), 1–16. Retrieved from
http://nonprofitaustin.org/wp-content/uploads/2012/10/412434-
NonprofitAlmanacBrief2011.pdf
Mckeever, B. S. (2015). The Nonprofit Sector in Brief 2015: Public
Charities, Giving, and Volunteering. Retrieved from
http://www.urban.org/sites/default/files/alfresco/publication-
pdfs/2000497-The-Nonprofit-Sector-in-Brief-2015-Public-Charities-
Giving-and-Volunteering.pdf
Oster, S. M. (1995). Strategic Management for Nonprofit Organizations :
Theory and Cases. Oxford University Press.
Powell, W. W., & Steinberg, R. (2006). The nonprofit sector : a research
handbook. Yale University Press. Retrieved from
https://www.jstor.org/stable/j.ctt5vktdq
Roundy, P. T., & Taylor, V. A. (2016). Founded by Faith: Social
Entrepreneurship as a Bridge between Religion and Work. Journal of
Ethics & Entrepreneurship, 6(1), 13–37.
Samuelson, P. A. (1954). The Pure Theory of Public Expenditure. The
Review of Economics and Statistics, 36(4), 387.
https://doi.org/10.2307/1925895
Santos, F. E. M. (2012). A Positive Theory of Social Entrepreneurship.
Journal of Business Ethics, 111(3), 335–351.
https://doi.org/10.1007/s10551-012-1413-4
Smietana, B. (2015, August). Southern Baptists Will Cut 600 to 800
Missionaries and Staff. Christianity Today, web only. Retrieved from
http://www.christianitytoday.com/ct/2015/august-web-only/southern-
baptists-will-cut-800-missionaries-imb-david-platt.html
Stark, R. (1996). Why religious movements succeed or fail: A revised
general model. Journal of Contemporary Religion, 11(2), 133–146.
https://doi.org/10.1080/13537909608580764
Stark, R. (2015). 1 . The Rise of a New World Faith | Religious Studies

41
Center.
US Supreme Court. Burwell v. Hobby Lobby (2013).
Varian, H. R. (2014). Intermediate Microeconoimcs. New York: W.W.
Norton.
Zaleski, P. A., & Zech, C. E. (1992). Determinants of Contributions to
Religious Organizations: Free Riding and Other Factors. American
Journal of Economics and Sociology, 51(4), 459–472.
https://doi.org/10.1111/j.1536-7150.1992.tb02729.x
Zaleski, P. A., & Zech, C. E. (1995). The Effect of Religious Market
Competition on Church Giving. Review of Social Economy, 53(3),
350–367. https://doi.org/Article
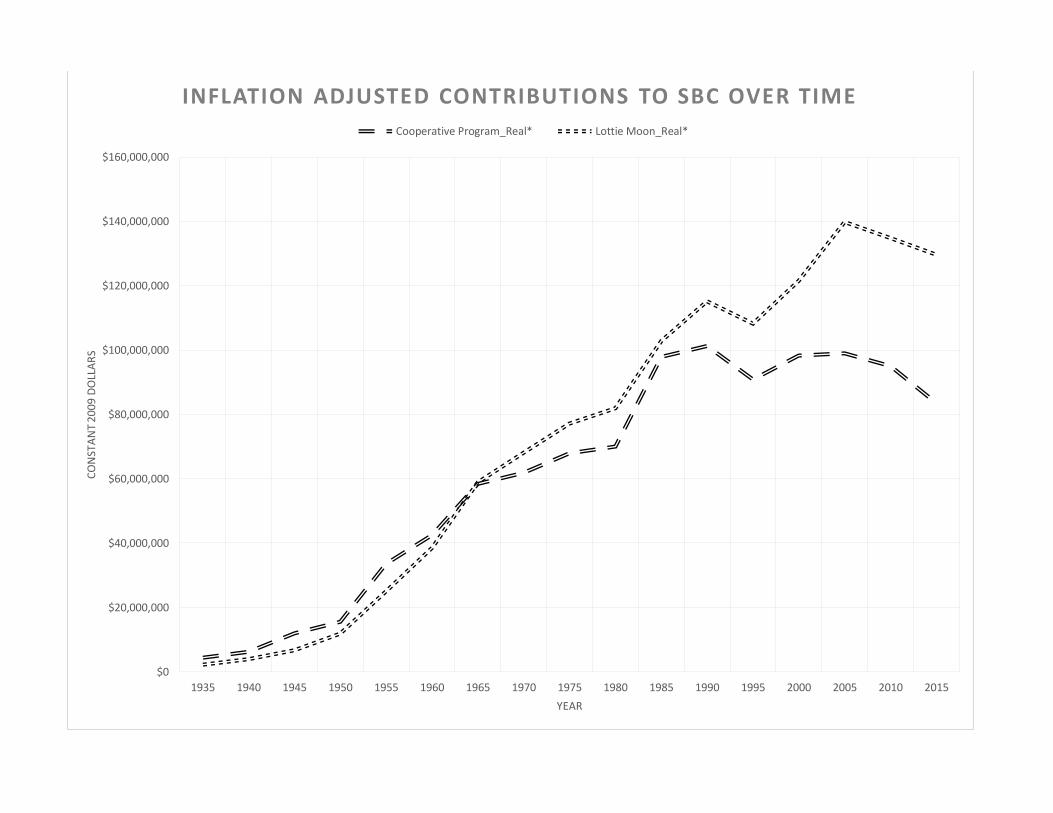
$0
$20,000,000
$40,000,000
$60,000,000
$80,000,000
$100,000,000
$120,000,000
$140,000,000
$160,000,000
1935 1940 1945 1950 1955 1960 1965 1970 1975 1980 1985 1990 1995 2000 2005 2010 2015
CO
NST
AN
T 20
09 D
OLL
AR
S
YEAR
INFLATION ADJUSTED CONTRIBUTIONS TO SBC OVER TIME
Cooperative Program_Real* Lottie Moon_Real*

Table 1: Real Trends in contributions to Cooperative Program and Lottie Moon
Year CP _ Nominal LM _ NominalCooperative
Program_Real*
Lottie
Moon_Real*
Avg % Annual
Change Real
CP
Avg % Annual
Change Real
LM
1935 $338,027 $170,390 $4,379,158 $2,207,415
1940 $490,460 $310,553 $6,224,113 $3,941,025 8% 16%
1945 $1,357,584 $761,033 $12,010,829 $6,733,016 19% 14%
1950 $2,201,287 $1,672,547 $15,582,126 $11,839,364 6% 15%
1955 $5,308,927 $3,964,437 $33,602,931 $25,092,962 23% 22%
1960 $7,463,141 $6,758,025 $42,561,397 $38,540,205 5% 11%
1965 $10,900,000 $11,000,000 $58,385,559 $58,921,206 7% 11%
1970 $13,800,000 $15,200,000 $61,852,898 $68,127,829 1% 3%
1975 $20,600,000 $23,400,000 $67,919,552 $77,151,335 2% 3%
1980 $30,800,000 $36,000,000 $70,065,288 $81,894,493 1% 1%
1985 $55,400,000 $58,200,000 $97,910,996 $102,859,567 8% 5%
1990 $68,300,000 $77,700,000 $101,275,208 $115,213,523 1% 2%
1995 $69,400,000 $82,600,000 $90,890,041 $108,177,484 -2% -1%
2000 $81,700,000 $101,000,000 $98,278,620 $121,494,990 2% 2%
2005 $91,300,000 $129,000,000 $98,958,390 $139,820,726 0% 3%
2010 $96,600,000 $137,000,000 $95,029,168 $134,772,215 -1% -1%
2015 $91,500,000 $142,000,000 $83,537,231 $129,642,479 -2% -1%
Notes:
DPCERD3A086NBEA
Personal consumption expenditures (implicit price deflator), Index 2009=100,
Annual, Not Seasonally Adjusted
* 2009 Dollars

Table 2: State by Year contributions to the Cooperative Program (nominal)
State 1935 1940 1945 1950 1955 1960 1965 1970 1975 1980 1985 1990 1995 2000 2005 2010 2015
Texas $22,082 $60,858 $113,277 $241,096 $989,846 $1,437,043 $1,837,603 $2,296,876 $3,426,390 $5,316,293 $9,786,000 ######### ######### ######### ######### ######### #########
Georgia $11,326 $32,247 $93,576 $157,638 $415,116 $632,830 $1,022,871 $1,338,341 $1,853,057 $2,552,643 $4,675,000 $7,862,848 $7,267,189 $9,096,831 ######### $9,808,252 $8,508,358
Alabama $18,901 $25,245 $58,268 $112,547 $249,315 $471,983 $689,929 $901,768 $1,464,579 $2,071,264 $3,770,000 $5,191,159 $6,047,446 $7,787,857 $8,172,579 $9,499,485 $8,630,313
Florida $12,757 $19,128 $56,394 $117,166 $281,304 $413,491 $679,679 $974,180 $1,561,710 $2,009,664 $4,377,000 $5,364,491 $4,979,271 $5,789,534 $7,083,455 $6,987,742 $6,123,790
Tennessee $36,616 $51,467 $148,334 $212,805 $416,787 $558,984 $701,823 $901,243 $1,280,441 $1,976,365 $3,352,000 $4,341,631 $4,809,197 $6,319,007 $6,988,282 $7,578,115 $7,062,514
South Carolina $33,549 $44,030 $116,952 $207,875 $447,804 $464,434 $759,149 $879,306 $1,228,074 $1,832,727 $3,096,000 $4,163,908 $4,370,444 $5,625,051 $6,442,857 $5,960,987 $5,631,280
North Carolina $33,055 $53,120 $120,948 $204,145 $420,686 $582,247 $852,500 $1,131,842 $1,609,186 $2,417,208 $3,890,000 $4,518,728 $3,923,131 $4,469,208 $4,917,369 $5,037,345 $5,273,277
Mississippi $13,548 $13,560 $64,599 $106,035 $229,794 $328,686 $484,883 $636,933 $933,839 $1,492,085 $2,811,000 $3,481,663 $4,125,904 $4,515,962 $5,477,357 $6,000,189 $5,768,968
Oklahoma $885 $10,875 $59,931 $102,429 $333,432 $437,476 $580,335 $704,382 $1,160,546 $1,837,488 $3,706,000 $3,434,052 $3,636,436 $3,904,818 $4,457,152 $4,993,859 $5,249,593
Kentucky $37,542 $52,218 $141,841 $166,391 $259,216 $325,700 $534,330 $587,188 $786,842 $1,399,940 $2,424,000 $3,291,450 $3,341,243 $3,626,865 $3,800,390 $4,330,007 $4,900,215
Louisiana $7,116 $11,526 $60,999 $79,129 $240,278 $364,732 $448,232 $571,236 $800,224 $1,459,425 $2,540,000 $2,590,934 $2,985,122 $3,617,129 $3,921,137 $4,402,362 $3,841,547
Arkansas $3,940 $11,097 $39,153 $85,048 $191,195 $251,467 $367,658 $443,207 $774,482 $1,139,230 $2,038,000 $2,651,350 $3,208,455 $3,628,205 $3,936,523 $4,152,773 $4,500,161
Virginia $80,671 $60,858 $157,229 $186,891 $287,799 $432,429 $704,576 $843,565 $1,191,803 $1,464,272 $2,331,000 $2,938,747 $2,103,200 $2,146,888 $2,888,518 $3,338,765 $2,672,559
Missouri $11,487 $26,816 $69,096 $127,991 $269,542 $350,462 $516,459 $636,303 $892,666 $1,298,273 $2,193,000 $2,520,120 $2,655,017 $3,067,805 $3,152,780 $2,861,377 $2,843,186
Illinois $591 $3,073 $25,317 $35,924 $83,556 $94,972 $150,186 $203,770 $346,442 $568,479 $835,000 $901,651 $1,031,757 $1,232,444 $1,330,319 $1,217,596 $1,268,498
California $1,073 $4,953 $41,924 $69,686 $137,435 $166,586 $261,184 $381,729 $656,000 $798,441 $873,328 $1,012,300 $1,037,465 $1,106,097 $1,112,784
Ohio $3,697 $16,777 $56,319 $108,265 $188,188 $290,913 $494,000 $639,248 $719,260 $845,709 $898,117 $864,953 $894,726
Maryland $10,796 $8,451 $18,233 $19,918 $51,605 $75,991 $129,764 $154,901 $221,291 $284,408 $461,000 $593,467 $568,099 $671,246 $887,263 $927,869 $904,151
New Mexico $406 $724 $6,324 $14,535 $44,656 $56,083 $73,497 $80,000 $113,747 $182,214 $308,000 $369,430 $389,890 $448,362 $537,244 $614,270 $408,616
Kansas/Nebraska $472 $7,078 $17,243 $14,714 $28,331 $49,332 $86,016 $177,000 $258,392 $284,789 $430,121 $498,542 $555,122 $316,955
Arizona $275 $412 $2,022 $6,238 $18,209 $19,058 $36,074 $37,809 $73,855 $135,723 $284,000 $378,495 $218,802 $308,330 $376,418 $426,352 $389,335
Indiana $9,062 $24,863 $43,552 $91,257 $139,071 $214,000 $236,170 $286,000 $369,568 $401,182 $518,100 $374,996
Colorado $12,768 $16,564 $20,617 $59,284 $104,619 $170,000 $140,871 $218,410 $250,305 $295,582 $307,034 $261,159
Michigan $7,246 $20,086 $29,403 $40,455 $73,571 $106,000 $173,440 $185,878 $214,406 $262,757 $233,850 $121,992
West Virginia $0 $16,289 $25,613 $50,000 $70,047 $98,806 $163,454 $221,078 $252,151 $229,640
Hawaii $2,525 $7,451 $10,738 $20,188 $24,127 $57,000 $88,317 $126,545 $129,509 $169,095 $187,170 $183,718
Alaska $2,968 $2,353 $5,905 $11,859 $19,790 $30,203 $64,000 $79,269 $94,623 $90,428 $104,484 $114,234 $119,717
Nevada $0 $31,000 $49,702 $70,617 $114,060 $135,497 $136,153 $157,199
Pennsylvania $21,187 $31,033 $52,000 $82,070 $70,718 $84,833 $102,264 $111,318 $102,803
New York $18,345 $22,946 $43,000 $68,156 $71,908 $76,612 $102,537 $113,588 $91,674
District of Columbia $2,484 $4,755 $4,017 $11,642 $17,708 $18,711 $28,555 $18,181 $43,021 $36,269 $49,000 $68,390 $37,253 $113,496 $101,737 $15,864 $8,111
Oregon/Washington $420 $5,412 $8,706 $18,655 $28,660 $68,354 $133,303 $227,000
Utah-Idaho $5,065 $11,250 $16,389 $33,000 $34,596 $20,603 $51,879 $73,745 $87,205 $70,046
New England $27,000 $48,880 $58,228 $51,372 $64,682 $67,971 $57,646
Wyoming $22,000 $31,365 $40,710 $53,673 $70,273 $86,094 $62,723
Minnesota/Wisconsin $25,000 $36,809 $43,803 $57,517 $26,300 $31,265 $31,793
Montana $18,343 $26,138 $34,578 $49,905 $51,084 $65,386
Iowa $18,153 $31,446 $45,036 $46,028 $55,913 $47,240
Source: Southern Baptist Historical Library and Archives

Table 3: State by Year contributions to the Lottie Moon Christmas offering (nominal)
State 1935 1940 1945 1950 1955 1960 1965 1970 1975 1980 1985 1990 1995 2000 2005 2010 2015
Texas $36,797 $62,143 $234,421 $533,026 $1,438,343 $2,063,919 $2,801,142 $3,426,613 $4,581,906 $6,672,384 $11,100,000 $12,900,000 $13,600,000 $14,600,000 $19,700,000 $21,400,000 $22,300,000
North Carolina $14,188 $39,093 $75,682 $158,172 $345,538 $620,725 $1,119,144 $1,577,996 $2,455,274 $3,741,796 $6,478,000 $9,004,020 $9,054,222 $11,000,000 $13,200,000 $14,900,000 $13,700,000
Georgia $9,425 $18,565 $42,286 $86,427 $198,971 $408,783 $738,967 $1,134,676 $1,641,096 $2,546,191 $4,420,000 $6,696,433 $6,952,087 $8,683,521 $11,600,000 $11,700,000 $12,000,000
Alabama $6,797 $13,571 $29,993 $72,168 $170,278 $341,434 $589,850 $916,692 $1,540,903 $2,520,531 $3,944,000 $5,820,187 $6,711,133 $8,110,818 $10,900,000 $11,600,000 $12,500,000
Tennessee $8,589 $19,258 $35,090 $77,364 $173,294 $377,798 $679,730 $1,009,777 $1,589,694 $2,544,214 $3,921,000 $5,909,125 $6,572,871 $7,839,044 $11,000,000 $11,000,000 $11,900,000
Mississippi $8,802 $14,212 $37,153 $76,081 $170,714 $321,670 $528,600 $800,502 $1,301,661 $2,237,460 $3,632,000 $4,747,519 $5,543,059 $11,500,000 $8,099,894 $8,885,779 $9,859,931
South Carolina $9,979 $21,644 $44,345 $96,409 $215,754 $374,843 $701,757 $1,059,332 $1,661,606 $2,446,291 $3,607,000 $5,339,971 $5,514,302 $6,783,387 $8,424,691 $8,413,190 $8,455,741
Florida $3,565 $7,598 $22,031 $50,293 $136,265 $290,853 $555,312 $814,037 $1,438,599 $2,116,685 $3,412,000 $4,192,099 $4,267,349 $5,178,410 $6,977,545 $6,590,858 $6,117,859
Virginia $26,241 $41,071 $80,703 $151,026 $226,844 $322,236 $485,215 $651,184 $1,065,056 $1,631,272 $2,582,000 $3,902,926 $3,945,694 $4,474,905 $6,423,859 $6,675,756 $6,886,210
Oklahoma $6,190 $12,909 $30,231 $79,327 $163,667 $271,338 $553,335 $599,739 $976,327 $1,525,994 $2,568,000 $2,541,423 $2,921,721 $3,482,039 $4,634,123 $5,274,238 $6,013,547
Arkansas $10,284 $8,889 $22,904 $51,990 $113,983 $190,393 $297,839 $423,294 $759,327 $1,146,976 $1,977,000 $2,814,433 $2,941,839 $2,833,624 $5,269,520 $5,661,870 $5,593,660
Louisiana $4,019 $11,701 $28,401 $63,943 $184,858 $322,686 $436,810 $608,189 $897,003 $1,475,067 $2,295,000 $2,520,004 $2,714,442 $3,265,955 $3,819,963 $5,021,315 $5,945,379
Kentucky $11,507 $18,689 $33,094 $66,339 $127,589 $228,462 $365,795 $488,707 $767,324 $1,238,183 $1,858,000 $2,638,551 $2,862,395 $3,257,941 $4,633,454 $5,005,676 $5,258,771
Missouri $9,182 $12,629 $26,083 $60,382 $145,752 $265,185 $407,758 $541,380 $802,309 $1,226,207 $1,717,000 $2,600,593 $2,526,880 $3,232,978 $4,129,081 $4,182,508 $4,160,550
California $942 $5,607 $31,551 $85,809 $174,543 $255,110 $406,488 $602,502 $918,000 $1,252,479 $1,150,830 $1,402,808 $1,837,207 $1,725,683 $1,841,759
Illinois $1,453 $2,992 $6,492 $18,867 $35,846 $74,718 $126,001 $183,694 $278,822 $432,634 $593,000 $784,789 $788,843 $862,772 $1,109,222 $1,320,858 $1,322,932
Maryland $1,835 $2,248 $3,724 $6,580 $15,107 $35,883 $80,031 $139,015 $215,007 $291,880 $382,000 $579,449 $564,236 $634,701 $997,469 $923,994 $1,036,796
Ohio $1,836 $9,745 $53,373 $104,805 $172,392 $267,128 $365,000 $447,278 $663,162 $700,604 $999,184 $863,470 $991,705
New Mexico $691 $1,792 $4,488 $13,187 $29,403 $60,676 $88,406 $100,931 $151,945 $238,653 $457,000 $513,217 $537,079 $557,065 $807,045 $1,023,218 $1,008,475
Arizona $177 $462 $1,222 $1,300 $19,458 $18,611 $54,409 $63,920 $107,850 $196,279 $303,000 $468,140 $495,846 $470,480 $766,292 $760,708 $750,950
Kansas/Nebraska $607 $5,625 $17,822 $34,298 $57,374 $98,695 $47,270 $272,000 $342,905 $391,465 $501,728 $925,223 $892,276 $590,496
Colorado $14,680 $39,657 $39,746 $119,012 $206,573 $262,000 $339,303 $359,028 $353,045 $522,165 $514,807 $727,228
Indiana $4,912 $23,688 $42,330 $88,698 $144,595 $191,000 $244,322 $270,126 $366,622 $568,321 $583,863 $504,785
Michigan $763 $10,622 $32,244 $31,678 $70,000 $97,000 $134,972 $139,222 $172,758 $245,953 $263,763 $167,023
New York $38,243 $79,933 $100,000 $146,121 $116,372 $149,229 $207,178 $275,014 $241,557
Hawaii $0 $15,015 $21,762 $29,504 $35,631 $57,000 $101,329 $120,556 $131,333 $206,065 $183,454 $264,470
Pennsylvania $33,601 $45,365 $78,000 $121,593 $117,478 $146,166 $218,762 $196,611 $197,901
West Virginia $1,289 $19,101 $33,608 $57,000 $74,898 $109,265 $138,073 $199,445 $267,036 $215,797
Alaska $218 $3,719 $8,230 $11,287 $25,816 $36,010 $85,000 $117,868 $138,700 $131,547 $149,468 $145,967 $104,646
Utah-Idaho $8,605 $17,601 $27,316 $47,000 $62,303 $54,654 $109,129 $192,119 $163,267 $173,519
Nevada $0 $44,000 $66,618 $94,726 $95,661 $140,255 $227,979 $146,909
District of Columbia $670 $1,086 $1,748 $3,453 $6,422 $12,798 $29,194 $32,756 $36,592 $47,672 $54,000 $68,249 $68,091 $54,771 $85,052 $80,746 $175,944
New England $48,000 $87,079 $78,067 $90,402 $23,285 $1,175 $310,782
Minnesota/Wisconsin $34,000 $52,346 $53,785 $64,720 $98,955 $120,193 $153,015
Oregon-Washington $0 $7,120 $17,564 $33,856 $48,701 $45,535 $161,263 $247,000
Wyoming $29,000 $46,751 $55,144 $76,738 $99,822 $108,167 $111,102
Iowa $4,414 $44,835 $72,735 $86,112 $115,809 $131,638
Montana $4,064 $47,997 $53,220 $81,976 $93,808 $120,357
Source: Southern Baptist Historical Library and Archives
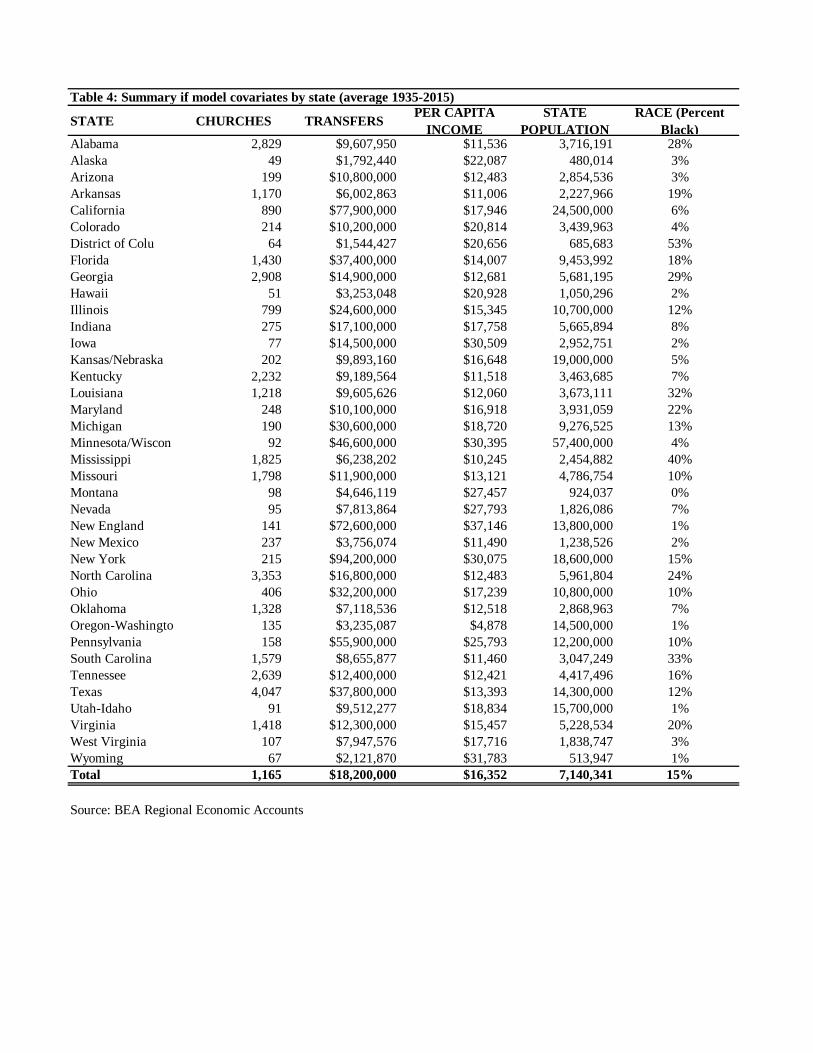
Table 4: Summary if model covariates by state (average 1935-2015)
STATE CHURCHES TRANSFERSPER CAPITA
INCOME
STATE
POPULATION
RACE (Percent
Black)Alabama 2,829 $9,607,950 $11,536 3,716,191 28%
Alaska 49 $1,792,440 $22,087 480,014 3%
Arizona 199 $10,800,000 $12,483 2,854,536 3%
Arkansas 1,170 $6,002,863 $11,006 2,227,966 19%
California 890 $77,900,000 $17,946 24,500,000 6%
Colorado 214 $10,200,000 $20,814 3,439,963 4%
District of Colu 64 $1,544,427 $20,656 685,683 53%
Florida 1,430 $37,400,000 $14,007 9,453,992 18%
Georgia 2,908 $14,900,000 $12,681 5,681,195 29%
Hawaii 51 $3,253,048 $20,928 1,050,296 2%
Illinois 799 $24,600,000 $15,345 10,700,000 12%
Indiana 275 $17,100,000 $17,758 5,665,894 8%
Iowa 77 $14,500,000 $30,509 2,952,751 2%
Kansas/Nebraska 202 $9,893,160 $16,648 19,000,000 5%
Kentucky 2,232 $9,189,564 $11,518 3,463,685 7%
Louisiana 1,218 $9,605,626 $12,060 3,673,111 32%
Maryland 248 $10,100,000 $16,918 3,931,059 22%
Michigan 190 $30,600,000 $18,720 9,276,525 13%
Minnesota/Wiscon 92 $46,600,000 $30,395 57,400,000 4%
Mississippi 1,825 $6,238,202 $10,245 2,454,882 40%
Missouri 1,798 $11,900,000 $13,121 4,786,754 10%
Montana 98 $4,646,119 $27,457 924,037 0%
Nevada 95 $7,813,864 $27,793 1,826,086 7%
New England 141 $72,600,000 $37,146 13,800,000 1%
New Mexico 237 $3,756,074 $11,490 1,238,526 2%
New York 215 $94,200,000 $30,075 18,600,000 15%
North Carolina 3,353 $16,800,000 $12,483 5,961,804 24%
Ohio 406 $32,200,000 $17,239 10,800,000 10%
Oklahoma 1,328 $7,118,536 $12,518 2,868,963 7%
Oregon-Washingto 135 $3,235,087 $4,878 14,500,000 1%
Pennsylvania 158 $55,900,000 $25,793 12,200,000 10%
South Carolina 1,579 $8,655,877 $11,460 3,047,249 33%
Tennessee 2,639 $12,400,000 $12,421 4,417,496 16%
Texas 4,047 $37,800,000 $13,393 14,300,000 12%
Utah-Idaho 91 $9,512,277 $18,834 15,700,000 1%
Virginia 1,418 $12,300,000 $15,457 5,228,534 20%
West Virginia 107 $7,947,576 $17,716 1,838,747 3%
Wyoming 67 $2,121,870 $31,783 513,947 1%
Total 1,165 $18,200,000 $16,352 7,140,341 15%
Source: BEA Regional Economic Accounts

Table 5: Summary of model covariates by year
YEAR CHURCHES* TRANSFERS*PER CAPITA
INCOME
STATE
POPULATION
RACE( Percent
Black)
1935 24,613 $522,534 $359 2,630,211 22%
1940 25,018 $736,323 $457 2,756,316 21%
1945 25,969 $2,364,886 $1,055 3,141,800 20%
1950 27,072 $6,573,122 $1,331 3,331,455 18%
1955 29,594 $8,281,214 $1,766 3,725,875 17%
1960 32,245 $15,700,000 $2,144 4,507,155 15%
1965 33,487 $22,500,000 $2,705 4,919,763 15%
1970 34,795 $47,400,000 $3,924 5,220,459 14%
1975 34,622 $140,000,000 $6,116 6,246,007 14%
1980 35,030 $235,000,000 $9,788 7,099,695 14%
1985 36,145 $400,000,000 $14,054 8,518,447 13%
1990 37,376 $555,000,000 $18,485 8,235,548 13%
1995 - $820,000,000 $22,534 8,868,091 13%
2000 - $22,200,000 $28,804 9,508,640 13%
2005 37,676 $1,010,000,000 $34,383 10,100,000 13%
2010 44,625 $1,410,000,000 $38,942 10,700,000 13%
2015 45,166 $2,160,000,000 $46,096 11,300,000 13%
* indicates total sum by year, other columns are state-year averages

Table 6: Year of Blue Laws Repeal by State
State Year of Appeal
FL 1969
IA 1955
IN 1977
KS 1965
MN 1985
ND 1991
OH 1973
PN 1978
SC 1985
SD 1977
TN 1981
TX 1985
UT 1973
VT 1982
VI 1975
WA 1966

Year Mean Std. Dev. Freq.
1935 0.45 0.68 18
1940 0.62 0.91 19
1945 1.12 2.50 20
1950 1.13 1.67 22
1955 1.46 3.71 23
1960 1.68 2.70 28
1965 1.31 1.93 28
1970 1.62 2.74 29
1975 2.61 4.86 31
1980 2.63 4.24 32
1985 9.57 29.76 35
1990 3.84 8.80 37
2005 4.75 11.53 37
2010 3.68 9.77 36
2015 3.73 9.93 37
Table 7: Religious Cost by Year (State Pop (in 10,000)
divided by # of SBC Churches)

Table 8: Model Summary Statistics
Variable Description Obs Mean Std. Dev. Min Max
Per Church LM LM contributions per church 431 $1,618 $1,225 $0 $7,712
LM_real by state real LM contributions 512 $2,398,153 $3,823,920 $0 $21,400,000
Per Church CP CP Contributions per church 431 $1,412 $961 $11 $4,832
CP_real by state real CP contributions 512 $2,028,244 $2,853,141 $0 $17,300,000
Religious Cost state population (in 10,000) per church 432 3.1 10.7 0.1 138.7
Secular Cost dummy for Blue Laws repeal by state 157 0.6 0.5 0.0 1.0
Per Capita Income Per Capita Income by State 513 $16,352 $15,491 $174 $73,302
Government Transfers Government Transfers by State 513 $18,200,000 $35,000,000 $6,238 $324,000,000
Race Percent Black by State 513 0.1 0.1 0.0 0.7
Notes:
LM indicates Lottie Moon Christmas Offerings. CP indicates church contributions to the Cooperative program. Both are in real USD.

Table 9: Regression results for Per-Church Contributions to the Lottie Moon (LM)
Fixed-effects (within) regression Number of obs = 431
Group variable: st_id Number of groups = 38
R-sq: Obs per group:
within = 0.8460 min = 4
between = 0.0988 avg = 11.3
overall = 0.2406 max = 15
F(32,361) = 61.99
corr(u_i, Xb) = -0.6558 Prob > F = 0
Per Church_LM Coef. Std. Err. t P>t [95% Conf. Interval]
Religious Cost 266.0454 179.378 1.48 0.139 -86.71171 618.8024
Per Capita Income -5.97E-02 0.009152 -6.52 0.00E+00 -7.77E-02 -0.0417099
Government Transfers -2.92E-06 1.10E-06 -2.65 8.00E-03 -5.08E-06 -7.55E-07
Race -2494.71 718.397 -3.47 0.001 -3907.479 -1081.942
Year
1940 71.76081 189.8355 0.38 0.706 -301.5615 445.0831
1945 241.2024 182.1421 1.32 0.186 -116.9905 599.3952
1950 358.069 186.7062 1.92 0.056 -9.099437 725.2374
1955 885.8073 179.0385 4.95 0 533.7179 1237.897
1960 1140.035 178.1969 6.4 0 789.6009 1490.47
1965 1808.489 180.7587 10 0 1453.017 2163.961
1970 2032.888 179.1628 11.35 0 1680.554 2385.222
1975 2566.657 180.6289 14.21 0 2211.44 2921.874
1980 2833.41 193.6369 14.63 0 2452.612 3214.208
1985 3545.69 203.9307 17.39 0 3144.648 3946.731
1990 3825.523 230.7511 16.58 0 3371.738 4279.308
2005 5422.252 344.4665 15.74 0 4744.839 6099.665
2010 5099.131 382.095 13.35 0 4347.719 5850.542
2015 5443.388 439.9322 12.37 0 4578.236 6308.54
sigma_u 1571.5753
sigma_e 474.46405
rho 0.91646788
F test that all u_i=0: F(37, 361) = 22.64 Prob > F = 0.0000
Marginal Effects
Per Church_LM dy/dx Std. Err. z P>z [95% Conf. Interval]
Religious Cost 101.7419 16.20318 6.28 0 69.98425 133.4996
Notes: For presentation purposes, interaction terms year by religious costs are not reported.

Table 10: Regression Results for Per Church Contributions to the Cooperative Program (CP)
Fixed-effects (within) regression Number of obs = 431
Group variable: st_id Number of groups = 38
R-sq: Obs per group:
within = 0.8114 min = 4
between = 0.3783 avg = 11.3
overall = 0.0850 max = 15
F(32,361) = 48.53
corr(u_i, Xb) = -0.6739 Prob > F = 0
Per Church_CP Coef. Std. Err. t P>t [95% Conf. Interval]
Religious Cost 204.1817 144.502 1.41 0.159 -79.98974 488.3532
Per Capita Income -0.0529381 0.0073724 -7.18 0 -0.0674363 -0.038439
Government Transfers -5.57E-07 8.80E-07 -0.63 0.527 -2.29E-06 1.17E-06
Race -3413.671 578.721 -5.9 0 -4551.759 -2275.583
Year
1940 43.93514 152.9263 0.29 0.774 -256.8031 344.6734
1945 363.4899 146.7287 2.48 0.014 74.93955 652.0403
1950 458.8751 150.4054 3.05 0.002 163.0942 754.6559
1955 1158.642 144.2285 8.03 0 875.0081 1442.275
1960 1220.045 143.5506 8.5 0 937.7441 1502.345
1965 1650.781 145.6143 11.34 0 1364.423 1937.14
1970 1659.031 144.3287 11.49 0 1375.201 1942.862
1975 2087.252 145.5097 14.34 0 1801.099 2373.406
1980 2256.798 155.9886 14.47 0 1950.038 2563.559
1985 3064.652 164.281 18.65 0 2741.584 3387.72
1990 3199.113 185.8867 17.21 0 2833.556 3564.67
2005 4174.318 277.4928 15.04 0 3628.613 4720.024
2010 3902.736 307.8053 12.68 0 3297.42 4508.053
2015 4026.778 354.3974 11.36 0 3329.836 4723.721
sigma_u 1302.7437
sigma_e 382.21527
rho 0.92074319
F test that all u_i=0: F(37, 361) = 26.62 Prob > F = 0.0000
Marginal Effects
Per Church_CP dy/dx Std. Err. z P>z [95% Conf. Interval]
Religious Cost 59.24154 13.05284 4.54 0 33.65844 84.82464
Notes: For presentation purposes, interaction terms year by religious costs are not reported.

Table 11: Marginal Effects for Per Church Cooperative Program (CP) Contributions on REPEAL
Coef. Std. Err. t P>t [95% Conf. Interval]
Secular Cost 1271.55 346.37 3.67 0.00 584.84 1958.26
dy/dx Std. Err. t P>t [95% Conf. Interval]
Std. Err. t P>t [95% Conf. Interval]
Florida 1271.550 346.371 3.67 0.000 584.837 1958.264
Indiana 552.0756 350.0873 1.58 0.118 -142.0064 1246.158
Iowa (not estimable)
Kansas/Nebraska 708.237 359.648 1.97 0.052 -4.800 1421.274
Ohio 1392.225 337.5731 4.12 0 722.9537 2061.497
Oregon-Washington 305.541 571.786 0.53 0.594 -828.081 1439.163
Pennsylvania 52.1734 561.9395 0.09 0.926 -1061.926 1166.273
South Carolina -185.378 356.097 -0.52 0.604 -891.375 520.620
Tennessee 1071.1 308.9897 3.47 0.001 458.4983 1683.702
Texas 1792.808 331.704 5.4 0.000 1135.173 2450.443
Utah-Idaho 4.727707 556.212 0.01 0.993 -1098.017 1107.472
Virginia -158.634 310.033 -0.510 0.610 -773.304 456.036

Table 12: Marginal Effects for Per-Church Lottie Moon (LM) Contributions on REPEAL
Coef. Std. Err. t P>t [95% Conf. Interval]
Secular Cost 746.74 423.60 1.76 0.08 -93.09 1586.57
dy/dx Std. Err. t P>t [95% Conf. Interval]
Florida 746.7392 423.5988 1.76 0.081 -93.08666 1586.565
Indiana 252.776 428.144 0.590 0.556 -596.062 1101.614
Iowa (not estimable)
Kansas/Nebraska 950.810 439.837 2.160 0.033 78.791 1822.829
Ohio 1007.819 412.8399 2.44 0.016 189.3235 1826.314
Oregon-Washington 492.989 699.275 0.700 0.482 -893.391 1879.368
Pennsylvania -514.3508 687.2321 -0.75 0.456 -1876.855 848.1536
South Carolina 32.274 435.494 0.070 0.941 -831.135 895.684
Tennessee 1540.669 377.8834 4.08 0 791.4779 2289.859
Texas 1789.164 405.662 4.410 0.000 984.899 2593.428
Utah-Idaho -168.3599 680.2276 -0.25 0.805 -1516.977 1180.257
Virginia 561.406 379.159 1.480 0.142 -190.313 1313.126

Table 13: Regression Results for Total State Lottie Moon (LM) Offering
Fixed-effects (within) regressionNumber of obs = 431
Group variable: st_id Number of groups = 38
R-sq: Obs per group:
within = 0.8727 min = 4
between = 0.2886 avg = 11.3
overall = 0.0830 max = 15
F(32,361) = 77.32
corr(u_i, Xb) = -0.3142 Prob > F = 0
Total State Coef. Std. Err. t P>t [95% Conf. Interval]
Religious Cost -0.5539755 0.155241 -3.57 0 -0.85927 -0.24869
Per Capita Income -0.0000596 7.92E-06 -7.52 0 -7.5E-05 -4.4E-05
Government Transfers 6.49E-10 9.59E-10 0.68 0.499 -1.24E-09 2.54E-09
Race -2.277586 0.621729 -3.66 0 -3.50025 -1.05492
Year
1940 0.5499223 0.164291 3.35 0.001 0.226834 0.87301
1945 1.376199 0.157633 8.73 0 1.066205 1.686193
1950 1.777966 0.161583 11 0 1.460204 2.095728
1955 2.308528 0.154947 14.9 0 2.003816 2.61324
1960 2.433297 0.154219 15.78 0 2.130017 2.736577
1965 2.794781 0.156436 17.87 0 2.487141 3.102421
1970 2.908504 0.155055 18.76 0 2.60358 3.213427
1975 3.191894 0.156323 20.42 0 2.884475 3.499312
1980 3.439988 0.167581 20.53 0 3.110431 3.769546
1985 3.923086 0.17649 22.23 0 3.576009 4.270164
1990 4.201123 0.199701 21.04 0 3.8084 4.593847
2005 5.280064 0.298115 17.71 0 4.693804 5.866324
2010 5.432684 0.33068 16.43 0 4.782382 6.082985
2015 5.675856 0.380735 14.91 0 4.927119 6.424593
sigma_u 2.0402662
sigma_e 0.41062005
rho 0.96107196
F test that all u_i=0: F(37, 361) =98.88 Prob > F = 0.0000
Marginal Effects
Total State ey/ex Std. Err. z P>z [95% Conf. Interval]
Religious Cost -0.0053739 0.0017 -3.16 0.002 -0.00871 -0.00204
Notes: For presentation purposes, interaction terms year by religious costs are not reported.

Table 14: Regression Results for Total State Lottie Moon (CP) Offering
Fixed-effects (within) regressionNumber of obs = 429
Group variable: st_id Number of groups = 38
R-sq: Obs per group:
within = 0.9262 min = 4
between = 0.1253 avg = 11.3
overall = 0.0830 max = 15
F(32,361) = 140.76
corr(u_i, Xb) = -0.3956 Prob > F = 0
Total State CP Coef. Std. Err. t P>t [95% Conf. Interval]
Religious Cost -0.5037357 0.142714 -3.53 0 -0.7844 -0.22308
Per Capita Income -3.31E-05 7.29E-06 -4.54 0 -4.74E-05 -1.88E-05
Government Transfers -1.87E-09 8.83E-10 -2.11 0.035 -3.60E-09 -1.29E-10
Race -2.313254 0.572498 -4.04 0 -3.43913 -1.18738
Year
1940 0.5591727 0.151003 3.7 0 0.262211 0.856135
1945 0.9829681 0.144889 6.78 0 0.69803 1.267906
1950 1.580404 0.148989 10.61 0 1.287404 1.873405
1955 2.156273 0.142421 15.14 0 1.876189 2.436357
1960 2.682713 0.142139 18.87 0 2.403184 2.962243
1965 3.172143 0.144005 22.03 0 2.888943 3.455343
1970 3.321681 0.142568 23.3 0 3.041307 3.602055
1975 3.567422 0.143685 24.83 0 3.284851 3.849992
1980 3.746365 0.154032 24.32 0 3.443446 4.049284
1985 4.047675 0.162235 24.95 0 3.728625 4.366726
1990 4.217226 0.183595 22.97 0 3.856169 4.578282
2005 5.135359 0.274177 18.73 0 4.596164 5.674554
2010 5.209614 0.304142 17.13 0 4.611489 5.807738
2015 5.554424 0.350213 15.86 0 4.865698 6.243149
sigma_u 2.1273473
sigma_e 0.37740842
rho 0.96948677
Marginal Effects
Total State CP ey/ex Std. Err. z P>z [95% Conf. Interval]
Religious Cost -0.0085351 0.001967 -4.34 0 -0.01239 -0.00468
Notes: For presentation purposes, interaction terms year by religious costs are not reported.

Table 15: Marginal Effects for Total Contributions by REPEAL
eyex Std. Err. t P>t [95% Conf. Interval]
log_CP
Secular Cost -0.46 0.51 -0.89 0.38 -1.47 0.56
log_LM
Secular Cost 0.06 0.18 0.32 0.75 -0.29 0.40

Table 16: Two sample t test for the effect of Religious Cost on per church CP and LM
Obs Mean Std. Err. Std. Dev. [95% Conf. Interval]
Per Church LM 431 59.24154 13.05284 270.9840 33.65844 84.82464
Per Church CP 431 101.7419 16.20318 336.3868 69.98425 133.4996
combined 862 80.4917 10.4225 306.0032 60.0352 100.9482
diff -42.5004 20.8067 -83.33826 -1.6625
diff = mean(x) - mean(y) t = -2.0426
Ho: diff = 0 degrees of freedom = 860
Ha: diff < 0 Ha: diff != 0 Ha: diff >0
Pr(T < t) = 0.0207 Pr(|T| > |t|) = 0.0414 Pr(T > t) = 0.9793

Table 17: Two sample t test for the effect of REPEAL on Per Church CP and Per Church LM
Obs Mean Std. Err. Std. Dev. [95% Conf. Interval]
Per Church LM 128 746.74 423.60 4792.4733 -93.09 1586.57
Per Church CP 128 1271.55 346.37 3918.7349 414.9430 871.6012
combined 256 1009.1450 273.5482 4376.7710 470.4433 1547.8460
diff 524.8108 547.1823 -552.7813 1602.4030
diff = mean(x) - mean(y) t = .9591
Ho: diff = 0 degrees of freedom = 254
Ha: diff < 0 Ha: diff != 0 Ha: diff >0
Pr(T < t) =0.8308 Pr(|T| > |t|) = 0.3384 Pr(T > t) = 0.1692