financing the u.s. power fleet - latest oil, energy & metals … · · 2013-04-18800 mw gas...
TRANSCRIPT

Financing the U.S. Power Fleet Generation reliability and transformation of the power fleet Las Vegas, April 9th, 2013
Jorge Camina
Head of Project & Acquisition Finance U.S. Santander Global Banking & Markets

p.2 Financing the Power Industry in U.S. About Santander
A growing franchise in the U.S. Largest bank in the Eurozone by market cap and 9th in the world1: serving 100
million customers Santander in the U.S.: 1.7 million customers, $178bn assets, 777 branches
and 14,000 employees
We have financed 34 deals with either debt or equity in the North American power space in the last 24 months: 8.2 GW capacity, $14bn of EV
Among these, 11 solar - PV and CSP - (1.7GW), and 16 wind (2.6GW) Santander led 6 bank-institutional hybrid deals in 2012, raising + $2.3bn debt “Greenest Bank in the World in 2012” by Bloomberg
Committed to the Power Industry

p.3 Financing the Power Industry in U.S. Santander : Debt Provider to Power Projects in the U.S.
US 2012
US$ 756,000,000Left Lead CoordinatorJoint Lead Arranger
Joint Bookrunner
Centinela Solar
170 MW Solar PV Plant in California
CAD 2012
CAD$ 296,000,000Left Lead CoordinatorJoint Lead Arranger
Joint Bookrunner
Des Moulins Phase I
136 MW Wind Farm in Quebec
US 2012
US$ 352,000,000
Flat Ridge 2
470 MW Wind Farmin Kansas
Left Lead CoordinatorJoint Lead Arranger
Joint Bookrunner
US 2012
US$ 355,000,000Senior Managing Agent
Co-Documentation Agent
Broad River
Acquisition of 847 MW gas-fired power plant
US 2012
US$ 272,000,000Mandated Lead Arranger
Syndication Agent
Alpine Solar
68 MW Solar PV Plant in California
US 2012
US$ 444,000,000Left Lead CoordinatorJoint Lead Arranger
Joint Bookrunner
California Ridge
214 MW Wind Farm in Illinois
US 2012
US$ 476,000,000Joint Lead Arranger
Joint Bookrunner
Imperial Solar South
130 MW Solar PV Plant in California
US 2012
US$ 465,000,000Left Lead CoordinatorJoint Lead Arranger
Joint Bookrunner
Arlington Valley
127 MW Solar PV Plant in Arizona
US 2011
US$ 1,779,000,000
Joint Lead Arranger
Desert Sunlight
550 MW Solar PV Plant in California
US 2012
US$ 650,000,000Joint Lead Arranger
Co-Documentation Agent
Alta Wind VII & IX
300 MW Wind Farms in California
US 2011
US$ 631,000,000Joint Lead Arranger
Co-Documentation Agent
Alta Wind VI & VIII
Two 150 MW Wind Farms in California
US$ 422,000,000
US 2011
Joint Lead ArrangerJoint Bookrunner
Lakefield
210 MW Wind Farm in Minnesota
US 2011
US$ 796,000,000
Co-Agent
CPV Sentinel
800 MW Gas Fired Power Plant in California
US$ 144,000,000
Mandated Lead Arranger
Lost Creek
Refinancing of 150 MW Wind Farm in Missouri
US 2011
US$ 727,000,000
Co-Agent
Sharyland
300 miles Transmission Lines in Texas
US 2011

p.4 Financing the Power Industry in U.S. Santander : Equity Provider to Power Projects in the U.S.
US 2012
US$ 2,000,000,000
US 2012
CONFIDENTIAL
US 2012
CONFIDENTIAL
US 2011
US$ 21,000,000
US 2012
US$ 138,000,000
US 2011
US$ 1,000,000,000 CONFIDENTIAL
US 2011US 2011
US$ 123,000,000 US$ 123,000,000
US 2011
CONFIDENTIAL
US 2010
Shiloh III
102 MW Wind Farm
Solana
280 MW CSP
Mountain Air
138 MW Wind Farm
Punta Lima
23.4 MW Wind Farm
SPP Project
4.4 MW Solar PV
Project Arranger Tax Equity Investor
Project Arranger Equity Investor
Project Arranger Equity Investor
Project Arranger Tax Equity Investor
Project Arranger Equity Investor
Project Arranger Equity Investor
Palm Valley Solar
4.5 MW Solar PV
Project Arranger Equity Investor
Tonopah Solar
110 MW CSP
Project Arranger Equity Investor
Flatt Water
60 MW Wind Farm
Equity Provider
Austin Solar
35 MW Solar PV
Equity Provider
PRIVATE CLIENT
Macho Springs
50 MW Wind Farm

p.5 Financing the U.S. Power Fleet 2013: Slow down in financing pipeline in the power Industry (Supply)
Supply U.S. Electricity Demand down 0.3% in 2012 (10.6 Bn KW/hr/d) Slow down after a period of unprecedented support to the Renewable Energy
industry through various programs: DOE, ITC Cash Grant, etc. Diminishing stock of PPAs in the wind & solar industry: getting closer to the
RPS targets in California Tailwinds from the manufacturer cost curve in Solar PV: improving success
ratio of aggressive PPA pricings and accelerating RPS compliance Mostly Generation driving the need of debt. Transmission not yet demanding
significant private capital, with exceptions like the CREZ program in Texas Coal Retirement will drive growth but may not happen as quickly and may be
semi-merchant driven

p.6 Financing the U.S. Power Fleet 2013: The IPP Power sector has been a key driver of Project Finance Lending in the last 5 yrs
Power represented 86% of the Project Finance Market in 2011, 54% in 2012
U.S. Project Finance market volumes have remained stable at $ 35 Bn
12.2 8.0 8.1
17.4
6.6
7.9
6.7 11.6
18.3
14.1
6.0
6.8
5.5
1.2
8.2 3.9
6.1 4.7
2.0 1.9 1.4
3.9
2.0
3.9
0
5
10
15
20
25
30
35
40
2008 2009 2010 2011 2012
Conventional Power Renewable Energy Oil and Gas Transportation - Infra. Other
The Project Finance Market in the U.S. 2008 - 2012

p.7
Demand Strong demand for financing contracted power: traditional PF Banks, LifeCos
and Bond Market (ie Topaz) Low Default track record in contracted power Relative Value with Corporate Credits: $15 Bn of the Heinz acquisition facility
were flexed-down this month (6/7 Yrs Term Loan B @ L+225 / 275 Bps) High Yield Investors chasing yield in the Infrastructure space: Sabine Pass 1.5
Bn trading at 5% yield (BB-; 5 year construction) European banks are mostly back (French & German) Japanese lenders targeting to maintain volume in a weaker pipeline:
tightening pricing & increasing appetite for semi-merchant deals Growing appetite for power assets and presence of U.S. regional banks
Financing the U.S. Power Fleet 2013: Debt appetite is strong (Demand)

p.8 Financing the U.S. Power Fleet Power: key driver of Project Finance Lending in the last 5 yrs
Yield of non-IG credits continued dropping, reaching below 6% levels. Appetite for yield is driving more assets managers from more traditional HY
structures to the power & infrastructure space
5.0
5.5
6.0
6.5
7.0
7.5
8.0
8.5
9.0
9.5
10.0
Jan-11 Jul-11 Jan-12 Jul-12 Jan-13
JPMorgan High Yield Bond Index YTW (%)
7 to 10 yrs 10+ yrs
JPM High Yield Index (YTW %)

p.9 Financing the Power Industry in U.S. Supply / Demand Imbalance
Competition in pricing and tenors in the short term, despite capital regulatory constraints kicking in full by 2018
Increased interest in other power asset categories, from purely utility scale contracted power with commercially proven technologies to:
– Increasing interest in Distributed Generation, Commercial & Residential – Merchant & Semi-merchant projects will get more attention: Term Loan B
players will find more competition from Commercial Banks – Less commercially proven technologies (ie CSP)
Partially alleviated by strong demand from multibillion LNG Exporting facilities (estimated in >15 Bn debt needs in the U.S for the next 12 months)
The end of the cash grant era leads to the comeback of ITC Bridges Back to UW to capture deal-flow?
Near term outcome 2013-2014

p.10
:
1. There is no carve-out in Basel III in the treatment of Project Finance
2. Commercial Banks will see their appetite for long tenors significantly reduced
3. Pricing & Return pressures: Increase in pricing and pressure en ROA
48%
38%
25%
16% 12%
8% 5%
PrivateEquity
Equity Property Credit 10years
Credit 7years
Credit 5years
Credit 3years
Financing the Power Industry in U.S The Project Finance Business Model is in the middle of a transition
Basel III – increased costs for long term financings challenging for PF business
The new capital regulations kick-in full by 2018
Capital requirements by asset class under Basel III
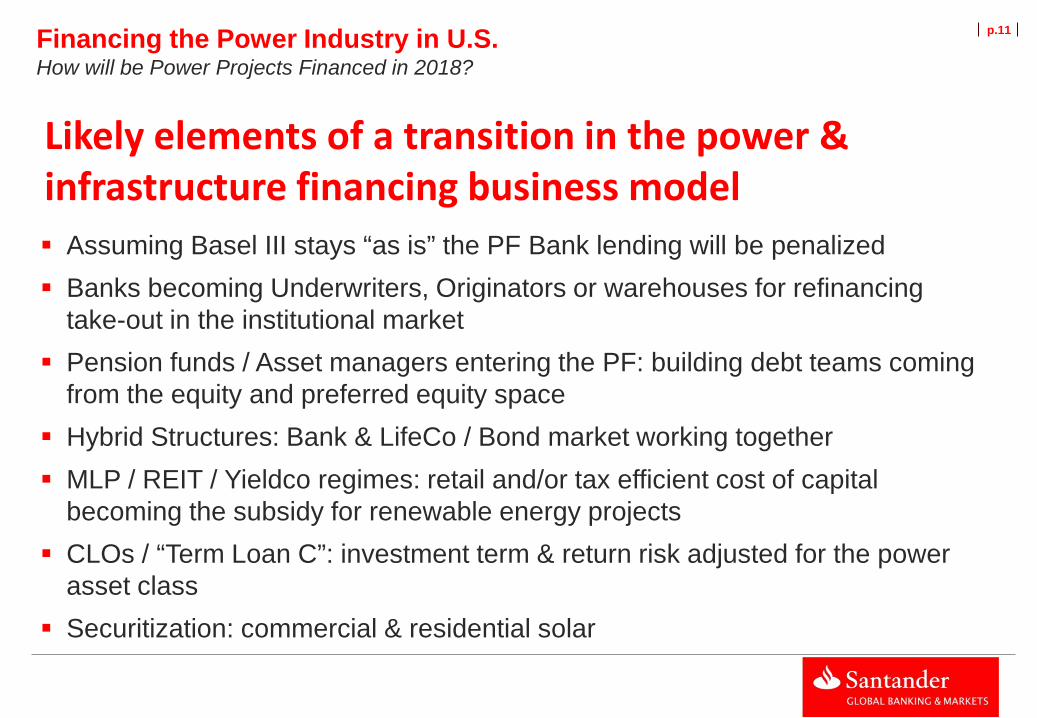
p.11 Financing the Power Industry in U.S. How will be Power Projects Financed in 2018?
Likely elements of a transition in the power & infrastructure financing business model Assuming Basel III stays “as is” the PF Bank lending will be penalized Banks becoming Underwriters, Originators or warehouses for refinancing
take-out in the institutional market Pension funds / Asset managers entering the PF: building debt teams coming
from the equity and preferred equity space Hybrid Structures: Bank & LifeCo / Bond market working together MLP / REIT / Yieldco regimes: retail and/or tax efficient cost of capital
becoming the subsidy for renewable energy projects CLOs / “Term Loan C”: investment term & return risk adjusted for the power
asset class Securitization: commercial & residential solar
