finding comparable temporal categorical …ben/papers/wongsuphasawat2009finding.pdffinding...
TRANSCRIPT
Finding Comparable Temporal Categorical Records:A Similarity Measure with an Interactive Visualization
Krist Wongsuphasawat∗ Ben Shneiderman†
Department of Computer Science & Human-Computer Interaction LabUniversity of Maryland, College Park, MD 20742
ABSTRACT
An increasing number of temporal categorical databases are beingcollected: Electronic Health Records in healthcare organizations,traffic incident logs in transportation systems, or student records inuniversities. Finding similar records within these large databasesrequires effective similarity measures that capture the searcher’s in-tent. Many similarity measures exist for numerical time series, buttemporal categorical records are different. We propose a tempo-ral categorical similarity measure, the M&M (Match & Mismatch)measure, which is based on the concept of aligning records by sen-tinel events, then matching events between the target and the com-pared records. The M&M measure combines the time differencesbetween pairs of events and the number of mismatches. To accom-modate customization of parameters in the M&M measure and re-sults interpretation, we implemented Similan, an interactive searchand visualization tool for temporal categorical records. A usabil-ity study with 8 participants demonstrated that Similan was easy tolearn and enabled them to find similar records, but users had diffi-culty understanding the M&M measure. The usability study feed-back, led to an improved version with a continuous timeline, whichwas tested in a pilot study with 5 participants.
Keywords: Similan, M&M Measure, Similarity Search, TemporalCategorical Records
Index Terms: H.5.2 [Information Interfaces and Presentation]:User Interfaces—Graphical user interfaces (GUI); I.5.3 [PatternRecognition]: Clustering—Similarity measures; H.3.3 [Informa-tion Storage and Retrieval]: Information Search and Retrieval—Search process
1 INTRODUCTION
Various organizations are increasingly collecting temporal categor-ical data. Electronic Health Records (EHRs) are being collectedby leading health organizations. These EHRs contain millions ofrecords with patient histories. Transportation systems are beingmonitored at an unprecedented scope which is resulting in gigan-tic traffic incident logs. Academic institutes are also keeping trackof educational advancement of their students. Challenges arisewhen there is a need to find similar records within these large-scaledatabases. For example, clinicians want to find patients with simi-lar symptoms to a target patient in order to guide the treatment ofthe target patient. A major challenge of this problem is definingsimilarity measures for temporal categorical data.
Many methods for computing a similarity measure between timeseries have been proposed. However, modifying them to suittemporal categorical data remains an open problem. This paperpresents a temporal categorical similarity measure called the M&M
∗e-mail: [email protected]†e-mail: [email protected]
measure, which is based on aligning temporal data by sentinelevents [26], then matching events between two records. If theevents are identical between records, then the M&M measure is thesum of the distances (time difference) between the matched pairs.A lower distance represents higher similarity.
The problem becomes more complex when the set of events inthe target record does not exactly match those in another record.To accommodate unmatched events, we convert this into an as-signment problem and use the Hungarian Algorithm [12, 16] tomatch events that produce the minimum distance. Consequently,the M&M measure is redefined as a combination of the number ofmismatches and the distance.
Furthermore, we believe that an interactive user interface willprovide help in finding and understanding results. We developed aninteractive interface, Similan, that allows users to adjust parametersof the M&M measure and see the results in real time. (See Fig-ure 1.) Similan adopts the alignment concept from LifeLines2[26]and allows users to preprocess the dataset by aligning events bya sentinel event. Similan displays all events in a timeline for eachrecord. Our extension to the rank-by-feature framework [23] allowsusers to select a target record and then adjust the ranking criteria toexplore the impact of result order.
Records are simultaneously visualized on a coordinated scatter-plot according to the number of mismatches and the distance func-tion. The comparison panel provides more advanced exploration.When users select one record for a detailed comparison with thetarget record, they see links between events, enabling them to un-derstand how close the relationship is.
This paper is organized as follows: Section 2 covers the relevanthistory of similarity searching, temporal data visualization and re-lated areas. Section 3 provides a brief explanation of the M&Mmeasure. Section 4 introduces Similan and describes the user inter-face. Section 5 explains the M&M measure in more details. Sec-tion 6 describes a usability study done to evaluate the interface. Wefollow by a brief discussion about the new version in Section 7,describe future work in Section 8, and conclude in Section 9.
2 RELATED WORK
A growing body of recent work is focused on similarity searching,mainly in the medical domain. For example, the national healthinsurance system in Australia records details on medical servicesand claims provided to its population. Tsoi et al. [25] proposed amethod to classify patients from medical claims data into variousgroups. Their aim is to detect similar temporal behavioral patternsamong patients in the dataset. PatientsLikeMe [10] is an onlinecommunity where patients with life-altering diseases share and dis-cuss personal health experiences. Users enter their structured dataon symptoms, treatments, and health outcomes into the site. Thisinformation is rendered as data visualizations on both an individualand an aggregate level. Users can also search for similar patients byspecifying demographic information. Unlike PatientsLikeMe, thiswork focuses on a sequence of events (symptoms, treatments, andoutcomes) in patient records, which is a special type of time seriescalled temporal categorical data.
27
IEEE Symposium on Visual Analytics Science and Technology October 12 - 13, Atlantic City, New Jersey, USA 978-1-4244-5283-5/09/$25.00 ©2009 IEEE
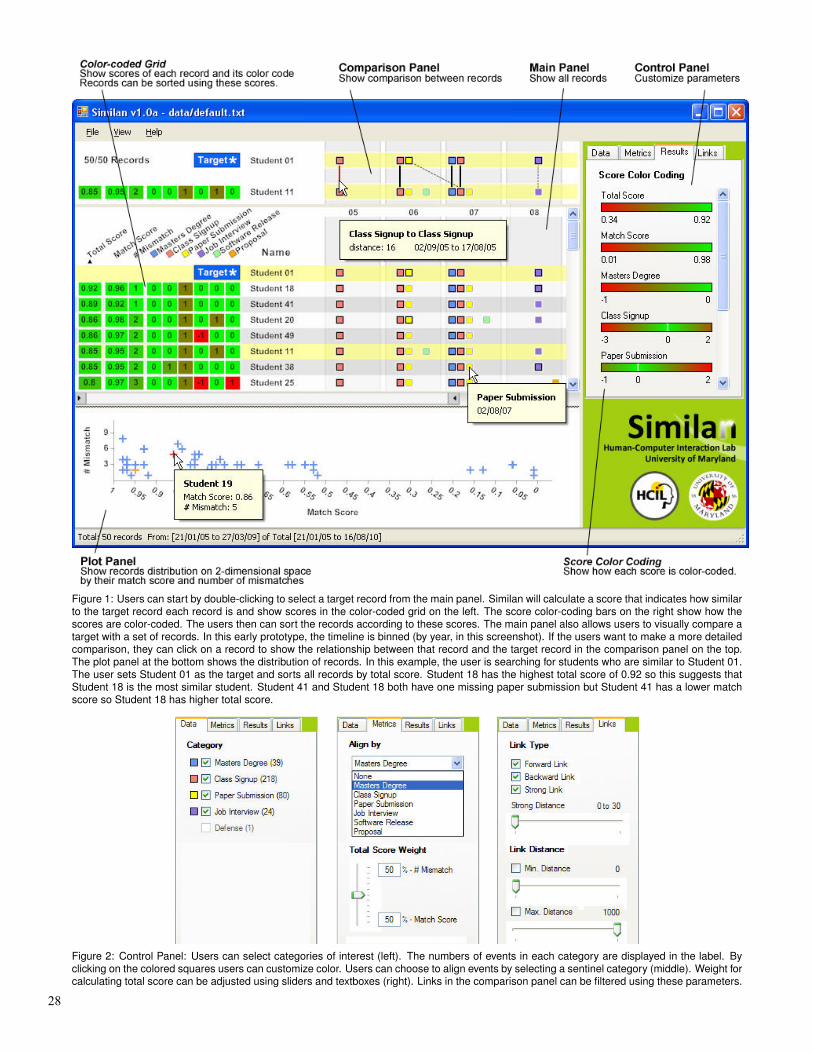
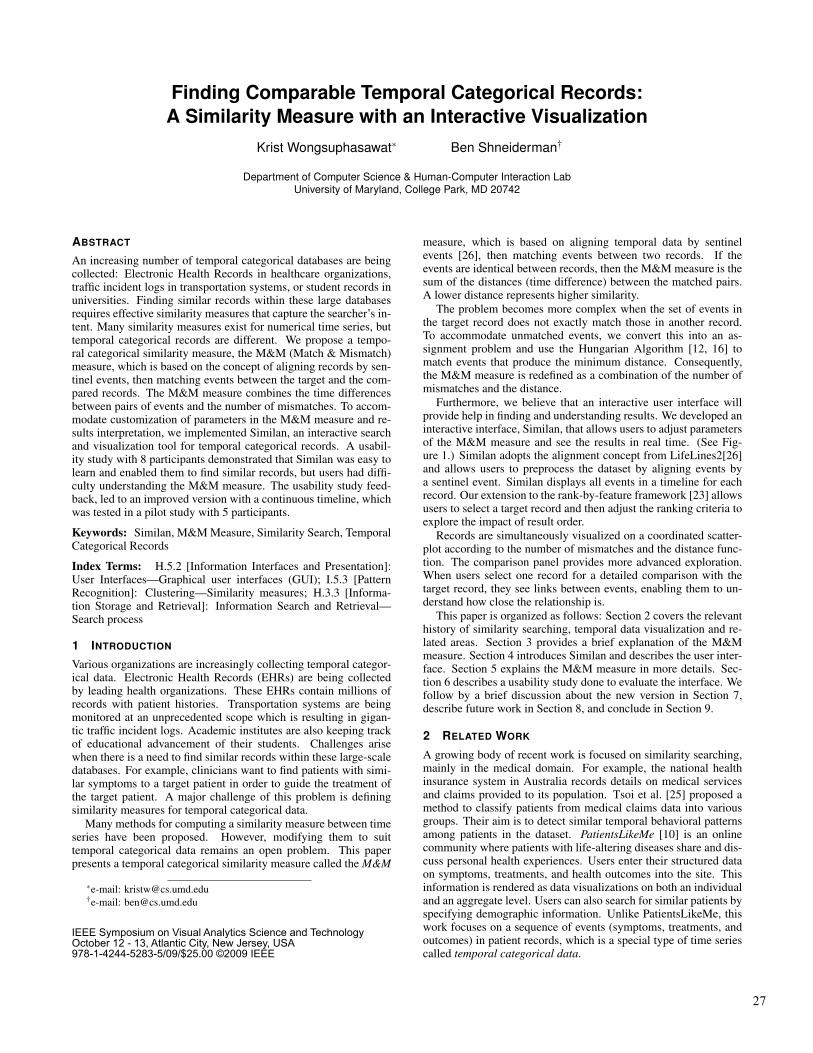
Figure 1: Users can start by double-clicking to select a target record from the main panel. Similan will calculate a score that indicates how similarto the target record each record is and show scores in the color-coded grid on the left. The score color-coding bars on the right show how thescores are color-coded. The users then can sort the records according to these scores. The main panel also allows users to visually compare atarget with a set of records. In this early prototype, the timeline is binned (by year, in this screenshot). If the users want to make a more detailedcomparison, they can click on a record to show the relationship between that record and the target record in the comparison panel on the top.The plot panel at the bottom shows the distribution of records. In this example, the user is searching for students who are similar to Student 01.The user sets Student 01 as the target and sorts all records by total score. Student 18 has the highest total score of 0.92 so this suggests thatStudent 18 is the most similar student. Student 41 and Student 18 both have one missing paper submission but Student 41 has a lower matchscore so Student 18 has higher total score.
Figure 2: Control Panel: Users can select categories of interest (left). The numbers of events in each category are displayed in the label. Byclicking on the colored squares users can customize color. Users can choose to align events by selecting a sentinel category (middle). Weight forcalculating total score can be adjusted using sliders and textboxes (right). Links in the comparison panel can be filtered using these parameters.
28
A time series is a sequence of data values, measured at succes-sive times, spaced at (often uniform) intervals. One notation is:
X = {(t,v) | t ∈ Time}
Temporal categorical data, e.g. athlete injuries, is one type of timeseries. However, unlike the numerical time series, e.g. stock in-dices, every v is not a numerical value (1, 2.9, 3.5, ...), but a cat-egory (“Jammed finger”, “Broken leg”, etc.). For temporal cate-gorical data, we will call each (t,v) an event. The i-th event in thesequence is denoted by xi.
Stock Indices (Numerical) Injuries (Categorical)(10/8/07, 540.35) (10/18/07, “Jammed finger”)(10/9/07, 555.32) (11/10/07, “Broken leg”)... ...(12/1/07, 410.94) (12/31/08, “torn ACL”)
Many similarity measures between numerical time series havebeen proposed. According to the surveys of previous methods byDing et al. [8] and Saeed and Mark [22] , similarity measures fortime series can be grouped into various types.
The first type is lock-step measures, which compare the i-th pointof one time series (xi) to the i-th point of another (yi). The moststraightforward measure is the Euclidean distance. However, sincethe mapping between the points of two time series is fixed, thesedistances measures are sensitive to noise and misalignments in time.
Second, elastic measures are distance measures that allowcomparison of one-to-many points (e.g., Dynamic time warping(DTW)) and one-to-many / one-to-none points (e.g., Longest Com-mon Substring (LCSS)). DTW [5] is an algorithm for measuringsimilarity between two sequences which may vary in time or speedwith certain restrictions. The sequences are ”stretched” or ”com-pressed” non-linearly in the time dimension to provide a bettermatch with another time series. DTW is particularly suited tomatching sequences with missing information. However, DTW re-quires monotonicity of the mapping in the time dimension.
Another group of similarity measures are developed based onthe concept of the edit distance [21], the number of operationsrequired to transform one string into another string. The lower thenumber is, the more similar the strings are. Hamming distance [11],Levenshtein distance [13] or Jaro-Winkler distance [27] are someexamples. The best known such distance is the LCSS distance. [3]
Another related area is biological sequence searching. There ex-ist many algorithms for comparing biological sequence informa-tion, such as the amino-acid sequences of different proteins or thenucleotides of DNA sequences. Some examples of these algorithmsare BLAST [2], FASTA [17] and the TEIRESIAS algorithm [20].
The transform-based techniques project time series onto a setof functions such as sinusoids or principal components. The datatransformation reduces the dimensionality of the original time se-ries and facilitates the use of machine learning techniques [14] orother methods in matching time series.
However, most of the existing methods are designed for numer-ical time series and require v to be a numerical value. This moti-vates the need of a similarity measure for temporal categorical data(when v is a category). The M&M measure is then proposed tosupport this type of data. The M&M measure is also different fromexisting approaches in other aspects. It is different from lock-stepmeasures because it does not fix the mapping of i-th events together.Unlike elastic measures, it does not allow one-to-many but allowsone-to-none mapping. It is also not limited to monotonicity of themapping as in DTW. It is different from edit distances and biologi-cal sequence searching because the data is sampled at non-uniformintervals and more than one event can occur at the same time whiletwo characters or amino acids cannot occur at the same position inthe string or biological sequence.
The first step of the M&M measure is to match every event (t,v)in the target record with an event from the compared record. Newchallenges arise since there are many possible ways to match eventsbut the M&M measure requires matching which will yield the max-imum similarity. This problem can be reduced to a problem calledthe assignment problem [12], which is described as follows [7]:
“There are a number of agents and a number of tasks. Any agentcan be assigned to perform any task, incurring some cost that mayvary depending on the agent-task assignment. It is required to per-form all tasks by assigning exactly one agent to each task in such away that the total cost of the assignment is minimized.”
If the numbers of agents and tasks are equal and the total as-signment cost for all tasks is equal to the sum of the costs for eachagent, then the problem is called the linear assignment problem.When the assignment problem has no additional qualifications, theterm linear assignment is used. If there are n tasks, the Hungarianalgorithm [12, 16, 6] can solve the assignment problem in poly-nomial time (O(n3)). The first version, known as the Hungarianmethod, was invented by Kuhn [12]. After Munkres [16] revisedthe algorithm, it has been known as the Hungarian algorithm, theMunkres assignment algorithm, or the Kuhn-Munkres algorithm.Later, Bertsekas [6] proposed a new and more efficient algorithmfor the assignment problem.
Using an absolute time scale alone does not address all of thetasks users face when comparing temporal categorical data. In par-ticular, tasks that involve temporal comparisons relative to impor-tant events such as a heart attack are not supported. Wang et al. [26]proposed a concept of aligning temporal data by sentinel (impor-tant) events, e.g. heart attack. The time in each record is then re-computed, referenced from the time that the sentinel event in eachrecord occurs. Making time at which the sentinel event, the eventsbefore the sentinel event and the events after the sentinel event oc-cur become zero, negative and positive, respectively. Before apply-ing the similarity measure, Similan allows users to preprocess thedata by aligning them by sentinel events.
Seo and Shneiderman [23] presented a conceptual frameworkfor interactive feature detection named rank-by-feature framework.In the rank-by-feature framework, users can select an interestingranking criterion, and then all possible axis-parallel projections ofa multidimensional data set are ranked by the selected ranking crite-rion. Similan, inspired by this rank-by-feature idea, allows users torank the dataset by many criteria derived from the M&M measure.
In order to facilitate the result interpretation, the data recordsshould be visualized in a meaningful way. Ma et al. proposedEvent Miner, a tool that integrates data mining and visualization foranalysis of temporal categorical data. [15] However, Event Minerwas designed for analyzing only one record. Pattern Finder [9] isan integrated interface for visual query and result-set visualizationfor search and discovery of temporal patterns. There has been anumber of published visualization works on temporal categoricaldata on timelines. A design using timelines for medical recordswas proposed by Powsner and Tufte [19], who developed a graph-ical summary using a table of individual plots of test results andtreatment data. LifeLines [18] presented personal history recorddata organized in expandable facets and allowed both point eventand interval event representations. Alonso et al.[1]’s experimentto compare a tabular format and the LifeLines representation sug-gested that overall LifeLines led to much faster response times andcan reduce some of the biases of the tabular format. However, theirdesign does not assist comparison between records.
3 INTRODUCTION TO THE M&M MEASURE
We define a new similarity measure for temporal categorical recordscalled M&M (Match & Mismatch).
The first step of the M&M measure is to match the events in thetarget record with events in the compared records. Since there can
29
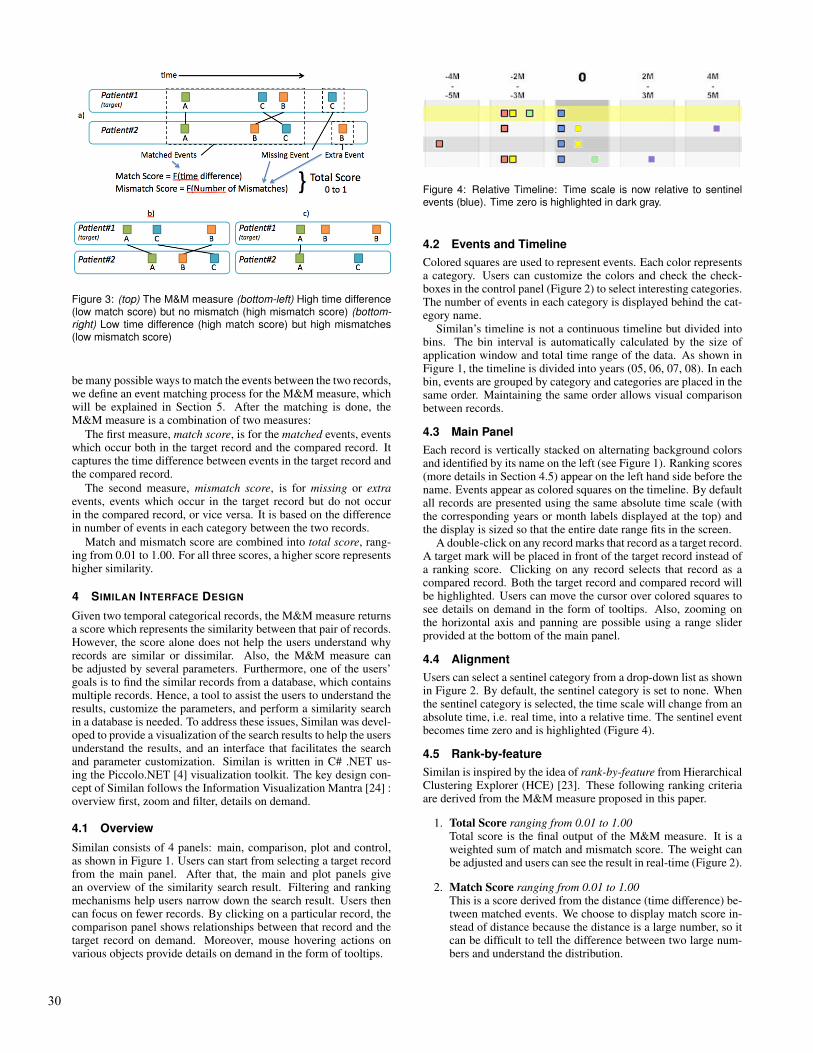
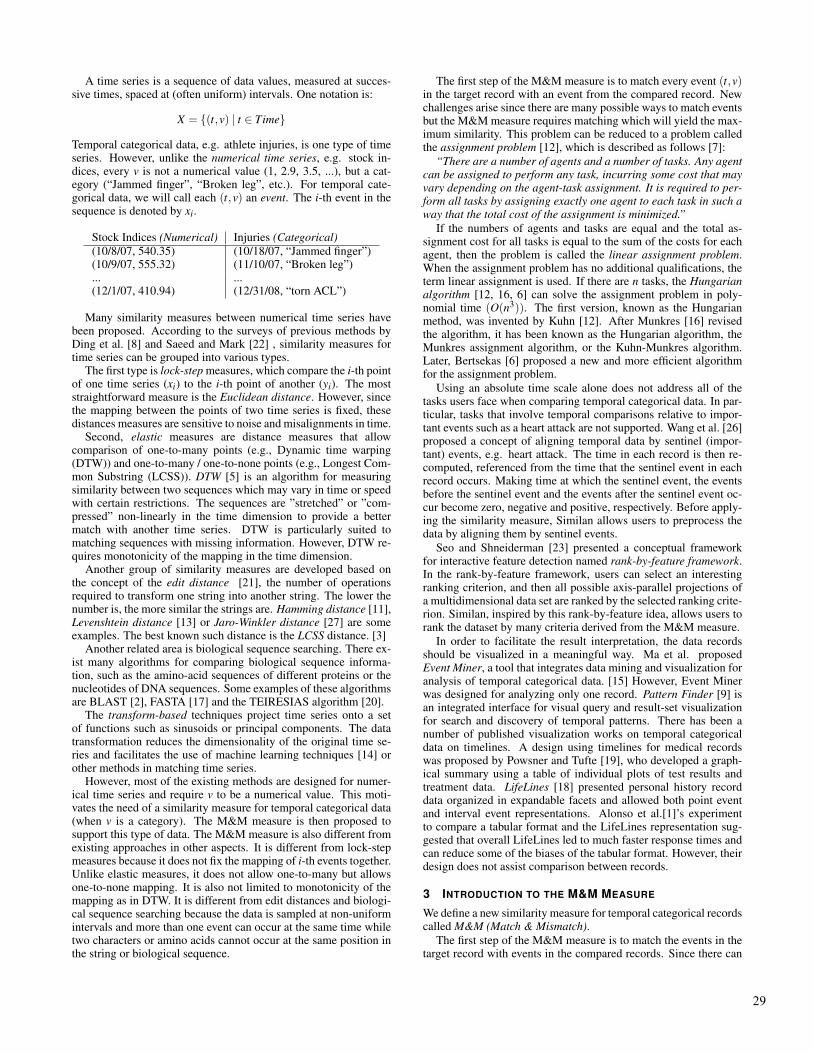
Figure 3: (top) The M&M measure (bottom-left) High time difference(low match score) but no mismatch (high mismatch score) (bottom-right) Low time difference (high match score) but high mismatches(low mismatch score)
be many possible ways to match the events between the two records,we define an event matching process for the M&M measure, whichwill be explained in Section 5. After the matching is done, theM&M measure is a combination of two measures:
The first measure, match score, is for the matched events, eventswhich occur both in the target record and the compared record. Itcaptures the time difference between events in the target record andthe compared record.
The second measure, mismatch score, is for missing or extraevents, events which occur in the target record but do not occurin the compared record, or vice versa. It is based on the differencein number of events in each category between the two records.
Match and mismatch score are combined into total score, rang-ing from 0.01 to 1.00. For all three scores, a higher score representshigher similarity.
4 SIMILAN INTERFACE DESIGN
Given two temporal categorical records, the M&M measure returnsa score which represents the similarity between that pair of records.However, the score alone does not help the users understand whyrecords are similar or dissimilar. Also, the M&M measure canbe adjusted by several parameters. Furthermore, one of the users’goals is to find the similar records from a database, which containsmultiple records. Hence, a tool to assist the users to understand theresults, customize the parameters, and perform a similarity searchin a database is needed. To address these issues, Similan was devel-oped to provide a visualization of the search results to help the usersunderstand the results, and an interface that facilitates the searchand parameter customization. Similan is written in C# .NET us-ing the Piccolo.NET [4] visualization toolkit. The key design con-cept of Similan follows the Information Visualization Mantra [24] :overview first, zoom and filter, details on demand.
4.1 Overview
Similan consists of 4 panels: main, comparison, plot and control,as shown in Figure 1. Users can start from selecting a target recordfrom the main panel. After that, the main and plot panels givean overview of the similarity search result. Filtering and rankingmechanisms help users narrow down the search result. Users thencan focus on fewer records. By clicking on a particular record, thecomparison panel shows relationships between that record and thetarget record on demand. Moreover, mouse hovering actions onvarious objects provide details on demand in the form of tooltips.
Figure 4: Relative Timeline: Time scale is now relative to sentinelevents (blue). Time zero is highlighted in dark gray.
4.2 Events and TimelineColored squares are used to represent events. Each color representsa category. Users can customize the colors and check the check-boxes in the control panel (Figure 2) to select interesting categories.The number of events in each category is displayed behind the cat-egory name.
Similan’s timeline is not a continuous timeline but divided intobins. The bin interval is automatically calculated by the size ofapplication window and total time range of the data. As shown inFigure 1, the timeline is divided into years (05, 06, 07, 08). In eachbin, events are grouped by category and categories are placed in thesame order. Maintaining the same order allows visual comparisonbetween records.
4.3 Main PanelEach record is vertically stacked on alternating background colorsand identified by its name on the left (see Figure 1). Ranking scores(more details in Section 4.5) appear on the left hand side before thename. Events appear as colored squares on the timeline. By defaultall records are presented using the same absolute time scale (withthe corresponding years or month labels displayed at the top) andthe display is sized so that the entire date range fits in the screen.
A double-click on any record marks that record as a target record.A target mark will be placed in front of the target record instead ofa ranking score. Clicking on any record selects that record as acompared record. Both the target record and compared record willbe highlighted. Users can move the cursor over colored squares tosee details on demand in the form of tooltips. Also, zooming onthe horizontal axis and panning are possible using a range sliderprovided at the bottom of the main panel.
4.4 AlignmentUsers can select a sentinel category from a drop-down list as shownin Figure 2. By default, the sentinel category is set to none. Whenthe sentinel category is selected, the time scale will change from anabsolute time, i.e. real time, into a relative time. The sentinel eventbecomes time zero and is highlighted (Figure 4).
4.5 Rank-by-featureSimilan is inspired by the idea of rank-by-feature from HierarchicalClustering Explorer (HCE) [23]. These following ranking criteriaare derived from the M&M measure proposed in this paper.
1. Total Score ranging from 0.01 to 1.00Total score is the final output of the M&M measure. It is aweighted sum of match and mismatch score. The weight canbe adjusted and users can see the result in real-time (Figure 2).
2. Match Score ranging from 0.01 to 1.00This is a score derived from the distance (time difference) be-tween matched events. We choose to display match score in-stead of distance because the distance is a large number, so itcan be difficult to tell the difference between two large num-bers and understand the distribution.
30
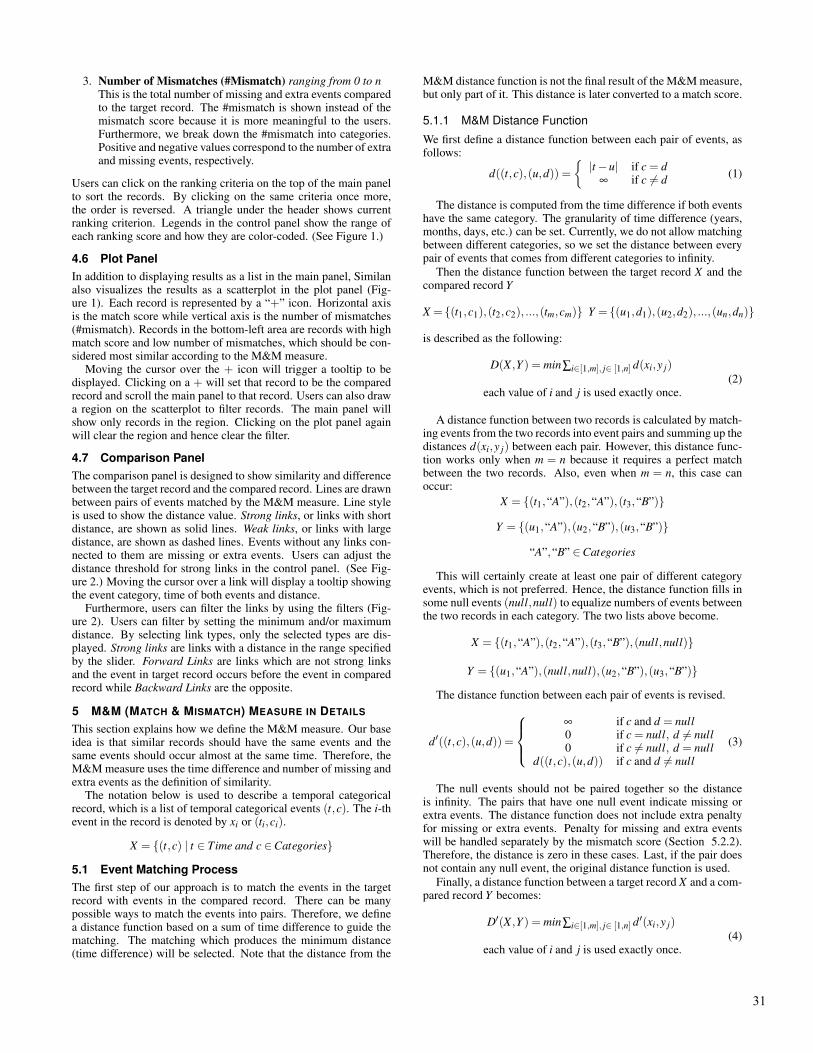
3. Number of Mismatches (#Mismatch) ranging from 0 to nThis is the total number of missing and extra events comparedto the target record. The #mismatch is shown instead of themismatch score because it is more meaningful to the users.Furthermore, we break down the #mismatch into categories.Positive and negative values correspond to the number of extraand missing events, respectively.
Users can click on the ranking criteria on the top of the main panelto sort the records. By clicking on the same criteria once more,the order is reversed. A triangle under the header shows currentranking criterion. Legends in the control panel show the range ofeach ranking score and how they are color-coded. (See Figure 1.)
4.6 Plot PanelIn addition to displaying results as a list in the main panel, Similanalso visualizes the results as a scatterplot in the plot panel (Fig-ure 1). Each record is represented by a “+” icon. Horizontal axisis the match score while vertical axis is the number of mismatches(#mismatch). Records in the bottom-left area are records with highmatch score and low number of mismatches, which should be con-sidered most similar according to the M&M measure.
Moving the cursor over the + icon will trigger a tooltip to bedisplayed. Clicking on a + will set that record to be the comparedrecord and scroll the main panel to that record. Users can also drawa region on the scatterplot to filter records. The main panel willshow only records in the region. Clicking on the plot panel againwill clear the region and hence clear the filter.
4.7 Comparison PanelThe comparison panel is designed to show similarity and differencebetween the target record and the compared record. Lines are drawnbetween pairs of events matched by the M&M measure. Line styleis used to show the distance value. Strong links, or links with shortdistance, are shown as solid lines. Weak links, or links with largedistance, are shown as dashed lines. Events without any links con-nected to them are missing or extra events. Users can adjust thedistance threshold for strong links in the control panel. (See Fig-ure 2.) Moving the cursor over a link will display a tooltip showingthe event category, time of both events and distance.
Furthermore, users can filter the links by using the filters (Fig-ure 2). Users can filter by setting the minimum and/or maximumdistance. By selecting link types, only the selected types are dis-played. Strong links are links with a distance in the range specifiedby the slider. Forward Links are links which are not strong linksand the event in target record occurs before the event in comparedrecord while Backward Links are the opposite.
5 M&M (MATCH & MISMATCH) MEASURE IN DETAILS
This section explains how we define the M&M measure. Our baseidea is that similar records should have the same events and thesame events should occur almost at the same time. Therefore, theM&M measure uses the time difference and number of missing andextra events as the definition of similarity.
The notation below is used to describe a temporal categoricalrecord, which is a list of temporal categorical events (t,c). The i-thevent in the record is denoted by xi or (ti,ci).
X = {(t,c) | t ∈ Time and c ∈Categories}
5.1 Event Matching ProcessThe first step of our approach is to match the events in the targetrecord with events in the compared record. There can be manypossible ways to match the events into pairs. Therefore, we definea distance function based on a sum of time difference to guide thematching. The matching which produces the minimum distance(time difference) will be selected. Note that the distance from the
M&M distance function is not the final result of the M&M measure,but only part of it. This distance is later converted to a match score.
5.1.1 M&M Distance Function
We first define a distance function between each pair of events, asfollows:
d((t,c),(u,d)) ={|t−u| if c = d
∞ if c 6= d (1)
The distance is computed from the time difference if both eventshave the same category. The granularity of time difference (years,months, days, etc.) can be set. Currently, we do not allow matchingbetween different categories, so we set the distance between everypair of events that comes from different categories to infinity.
Then the distance function between the target record X and thecompared record Y
X = {(t1,c1),(t2,c2), ...,(tm,cm)} Y = {(u1,d1),(u2,d2), ...,(un,dn)}
is described as the following:
D(X ,Y ) = min∑i∈[1,m], j∈ [1,n] d(xi,y j)
each value of i and j is used exactly once.(2)
A distance function between two records is calculated by match-ing events from the two records into event pairs and summing up thedistances d(xi,y j) between each pair. However, this distance func-tion works only when m = n because it requires a perfect matchbetween the two records. Also, even when m = n, this case canoccur:
X = {(t1,“A”),(t2,“A”),(t3,“B”)}
Y = {(u1,“A”),(u2,“B”),(u3,“B”)}
“A”,“B” ∈Categories
This will certainly create at least one pair of different categoryevents, which is not preferred. Hence, the distance function fills insome null events (null,null) to equalize numbers of events betweenthe two records in each category. The two lists above become.
X = {(t1,“A”),(t2,“A”),(t3,“B”),(null,null)}
Y = {(u1,“A”),(null,null),(u2,“B”),(u3,“B”)}
The distance function between each pair of events is revised.
d′((t,c),(u,d)) =
∞ if c and d = null0 if c = null, d 6= null0 if c 6= null, d = null
d((t,c),(u,d)) if c and d 6= null
(3)
The null events should not be paired together so the distanceis infinity. The pairs that have one null event indicate missing orextra events. The distance function does not include extra penaltyfor missing or extra events. Penalty for missing and extra eventswill be handled separately by the mismatch score (Section 5.2.2).Therefore, the distance is zero in these cases. Last, if the pair doesnot contain any null event, the original distance function is used.
Finally, a distance function between a target record X and a com-pared record Y becomes:
D′(X ,Y ) = min∑i∈[1,m], j∈ [1,n] d′(xi,y j)
each value of i and j is used exactly once.(4)
31
5.1.2 Minimum Distance Perfect MatchingThe problem is how to match every event in X to an event in Y toyield minimum distance. This problem can be converted into anassignment problem. (See Section 2.)
Let events from X (xi = (ti,ci)) become agents and events fromY (y j = (u j,d j)) become tasks. Cost of the assignment is d′(xi,y j).Then use the Hungarian Algorithm to solve the problem. The dis-tance matrix between X and Y is displayed below.
y1 y2 . . . yn
x1 d′(x1,y1) d′(x1,y2) . . . d′(x1,yn)x2 d′(x2,y1) d′(x2,y2) . . . d′(x2,yn)...
......
. . ....
xm d′(xm,y1) d′(xm,y2) . . . d′(xm,yn)
The time complexity of the Hungarian Algorithm is O(n3) when
n is the number of events in each record. If there are m recordsin the database, the time to perform a matching between the targetrecord and all records, assuming that each record has approximatelyn events is O(mn3).
5.2 ScoresOnce the event matching process is completed. The match, mis-match and total score can be derived from the matching.
5.2.1 Match ScoreThe distance from M&M distance function captures the time differ-ence between the two records. However, the distance can be a largenumber, which users find difficult to compare. Hence, we normal-ize the distance into a match score, ranging from 0.01 to 1.00. Ahigher score represents higher similarity. Only records with zerodistance will yield a score of 1.00. Otherwise, the highest possiblematch score for non-zero distance is bounded to 0.99. The lowestscore is bounded to 0.01 because we think that zero score may mis-lead the users to think that the target and compared record are notsimilar at all. Let n be total number of records in the dataset. X andY are target and compared record, respectively. The match score(M(X ,Y )) is calculated from the following equations:
D′max = Max j∈[1,n]D′(X ,Y j) (5)
M(X ,Yi) =
{1.00 if D′(X ,Yi) = 0
D′max−D′(X ,Yi)D′max
∗ .98+ .01 otherwise (6)
5.2.2 Mismatch ScoreWhen the number of events in two records are not equal, there aremissing or extra events. A missing event is an event that occurs ina target record but does not occur in a compared record. An extraevent is an event that does not occur in a target record but occurs in acompared record. For example, imagine a target record for a patientwho has chest pains, followed by elevated pulse rate, followed by aheart attack diagnosis. If the compared record has only chest painsand heart attack diagnosis, it has one missing event.
We count a number of mismatches (N(X ,Y )), a sum of numberof missing or extra events in each category, and normalize it intoa mismatch score (MM(X ,Y )), ranging from 0.01 to 1.00. Onlyrecords with no mismatch events will yield a score of 1.00. Otherrecords will have score within range 0.01 to 0.99.
Nmax = Max j∈[1,n]N(X ,Y j) (7)
MM(X ,Yi) =
{1.00 if N(X ,Yi) = 0
Nmax−N(X ,Yi)Nmax
∗ .98+ .01 otherwise(8)
5.2.3 Total ScoreThe match score and mismatch score are combined into total score(T (X ,Yi)) using weighted sum.
T (X ,Yi) = w∗M(X ,Yi)+(1−w)∗MM(X ,Yi) ; w ∈ [0,1] (9)
Increasing the weight w gives match score more significance whiledecreasing w gives mismatch score more significance. The defaultvalue for weight is 0.5. (Both are equally significant.) For example,the users may not care whether there is any missing or extra eventso the weight should be set to 1. Therefore, the Similan interfaceallows users to manually adjust this weight and see the results inreal-time. (See Section 4.5.)
5.3 DiscussionOur concept that the similar records should have the same events(low number of mismatches) and the same events should occur al-most at the same time (low time difference) is transformed into theM&M measure. Time difference and number of mismatches aretwo important aspects of similarity captured by the M&M measure.Records with high match score are records with low time differencewhile records with high mismatch score are records with low num-ber of mismatches. The M&M measure can be adjusted to give sig-nificance to match or mismatch score. By default, the match scoreand mismatch score are assigned equally weights, so the most sim-ilar record should be the record with low time difference and alsolow number of mismatches.
6 EVALUATION
A usability study for Similan was conducted with 8 participants.The goals in this study were to examine the learnability of Similan,assess the benefits of a scatterplot, learn how the number of eventsand categories affect user performance, and determine if users couldunderstand the M&M measure in the context of its use. We alsoobserved the strategies the users chose and what problems they en-countered while using the tool. Synthetic data based on graduateschool academic events, such as admission, successful dissertationproposal, and graduation, are used. This choice of data was in-tended to make the tasks more comprehensible and meaningful toparticipants, who were technically oriented graduate students.
6.1 Usability Study Procedure and TasksTwo versions of Similan were used in this usability study: one withfull features (S-Full) and another without a scatterplot (S-NoPlot).All usability sessions were conducted on an Apple laptop (15 inchwidescreen, 2.2 Ghz CPU, 2GB RAM, Windows XP Professional)using an optical mouse.
The study had two parts. In the first part, participants had anintroduction to the M&M measure and training with the Similaninterface without a scatterplot (S-NoPlot). Then, the participantswere asked to perform this task with different parameters:
Given a target student and dataset of 50 students. Each studentrecord has x categories of events and the total number of events isbetween y to z events. Find 5 students that are most similar to thetarget student using S-NoPlot.
Task 1 : x = 2 , y = 4 and z = 6; Task 2 : x = 4 , y = 6 and z = 10;Task 3 : x = 6 , y = 8 and z = 16
In the second part, participants were introduced to the scatterplotand asked to perform task 4, 5 and 6 which are performing task 1,2 and 3, respectively, but using S-Full instead of S-NoPlot.
The datasets used in task 1-3 and 4-6 were the same but the stu-dents were renamed and the initial orderings were different. Task1 and 4 were used only for training purpose. The results were col-lected from tasks 2, 3, 5 and 6.
In addition to observing the participants behavior and commentsduring the sessions, we provided them with a short questionnaire,
32
which asked specific questions about the Similan interface. An-swers were recorded using a seven-option Likert scale and free re-sponse sections for criticisms or comments.
6.2 ResultsFor the first part of this 30-minute study, all participants were ob-served to use the following strategy: first select the target student,and then use the ranking mechanisms to rank students by the totalscore. In their first usage, some participants also selected the stu-dent who had the highest total score to see more detail in the com-parison panel. Afterwards, they just studied the visualization andreported that these students with high total score are the answers.
For the second part of the study, which focused on the scatterplot,most of the participants were observed to use the following strategy:first select the target student, draw a selection in the plot panel, andthen use main panels ranking mechanisms to rank students by thetotal score. However, a few participants did not use the scatterplotto do the task at all. They used the same strategy as in the first part.
Users spent comparable time on tasks 2 and 3 and on tasks 5 and6. There was no difference in performance times between tasks 2and 3 or between tasks 5 and 6, even though there were more eventsin tasks 3 and 6. This is understandable since participants reportedthat they trusted the ranking provided by the interface. However,users spent more time doing the tasks while using the scatterplot.
All of the participants trusted the total score ranking criterionand used it as the main source for their decisions. They explainedthat the visualization in the main panel convinced them that theranking gave them the correct answers. Therefore, in the later tasks,after ranking by total score and having a glance at the visualization,they simply answered that the top five are the most similar.
All of them agreed that the main panel is useful for its rankingfeatures and the comparison panel is useful in showing the similar-ity between the target and a compared student. However, they haddifferent opinions about the scatterplot. Some of the participantsmentioned that it was useful when they wanted to find similar stu-dents. They explained that the similar students can easily be foundat the bottom left of the scatterplot. One participant said that shehad to choose two parameters (#mismatch and match score) whenshe used the scatterplot. On the other hand, while using the mainpanel, she had to choose only one parameter (total score), whichshe preferred more. A few of them even mentioned that it is notnecessary to use the scatterplot to find similar students. Althoughthey had different opinions about its usefulness in finding similarstudents, they all agreed that the scatterplot gives a good overviewof the students’ distribution. It can show clusters of students, whichcould not be discovered from other panels. Also, one participantpointed out that the main and comparison panels are helpful inshowing how students are similar, while the plot is more helpfulin explaining how students are dissimilar.
Participants had positive comments on Similan’s simple, intu-itive and easy to learn interface. Most of the participants got startedwithout assistance from the experimenter. Nevertheless, some userinterface design concerns were noted. Some participants noticedthat the binned timeline could be misleading in some situations.
Overall, participants liked the simple yet attractive Similan’s in-terface and strongly believed that Similan can help them find stu-dents who are similar to the target student. Ranking in the mainpanel appears to be useful. By contrast, participants had difficul-ties in learning the M&M measure, since it combines two kinds ofscores. The scatterplot did not benefit the tasks in this study but webelieve it may prove useful for more complex databases.
7 NEW VERSION
According to the user feedback, using a binned timeline can be mis-leading in some situations. A pair of events in the same bin canhave a longer distance than a pair of events in different bins. Also,
order of events within the same bin is hidden. Therefore, we de-velop a new prototype that adopts the continuous timeline used inLifelines2 [26] and includes several improvements (Figure 5.)
We did a pilot study with 5 participants to compare the binnedtimeline in original version and continuous timeline in the new ver-sion and received these comments: The continuous timeline re-quires more space for each record and looks more complicated. Thebinned timeline is more compact, simpler and therefore more read-able. It gives users less detail to interpret. However, the continuoustimeline does not mislead users when comparing distances or or-dering. Both types of timeline have advantages and disadvantagesdepending on the task. The binned timeline is suitable for generaltasks that do not require fine-grain information while the continuoustimeline is more suitable when fine-grain information is required.
8 FUTURE WORK
Currently, the M&M measure takes all missing and extra eventsinto account. In some situations, missing events are not consideredimportant but extra events are, or vice versa. In a more complexsituation, missing 1 of 2 events is not important but missing 2 of2 events can be considered critical. Moreover, missing an event ofcategory A may be not as critical as category B. The M&M mea-sure also does not allow matching of events between different cate-gories. Allowing matching between different categories may makethe similarity measure become more flexible.
Dealing with a large database is a challenging problem. Tem-poral categorical databases, e.g. EHRs, can contain millions ofrecords. The O(n3) time complexity of the Hungarian algorithmis a concern, but the number of events for each match is low, so thetime to compare against a large data set grows only linearly withthe number of records. Anyway, we are improving the algorithm toreduce its time complexity. A signature-based approach may alsobe used to reduce unnecessary computation.
More filtering mechanisms can be added to help users explorethe search results. Also, records may be classified into groups orclusters according to total score, match score, #mismatch, etc.
The existing tools [9, 26] allow users to specify an exact queryand retrieve records that satisfy the query. However, by using an ex-act query, some records may be overlooked because there are someminor details that make them dissatisfy the query. We propose away to let users specify a loosely defined query by creating a cus-tom record that contains the events that they are interested in. TheM&M measure then can be used to calculate the similarity score ofbetween each record and the query record.
9 CONCLUSION
Temporal categorical data are continuously being gathered by vari-ous organizations. Finding similar records within these large-scaledatabases is a challenging task, especially defining the similaritymeasure. This paper proposes the M&M measure, a novel sim-ilarity measure for temporal categorical data. Briefly, the M&Mmeasure is a combination of time differences between events, andnumber of missing and extra events.
We also introduce Similan, an interactive tool that facilitates sim-ilarity searching and search results visualization for temporal cate-gorical data. The alignment feature allows users to pre-process thedataset by aligning events by a sentinel category. Users are allowedto rank the temporal categorical records by many ranking criteriaderived from the M&M measure. The scatterplot provides an over-all distribution of search results. The comparison panel providesadvanced exploration of relationships between records.
A usability study had been conducted to evaluate the interface.Users found Similan to be comprehensible but they had a hard timeunderstanding the M&M measure. Users expressed strong opin-ions that Similan can help them find similar records from temporalcategorical data.
33
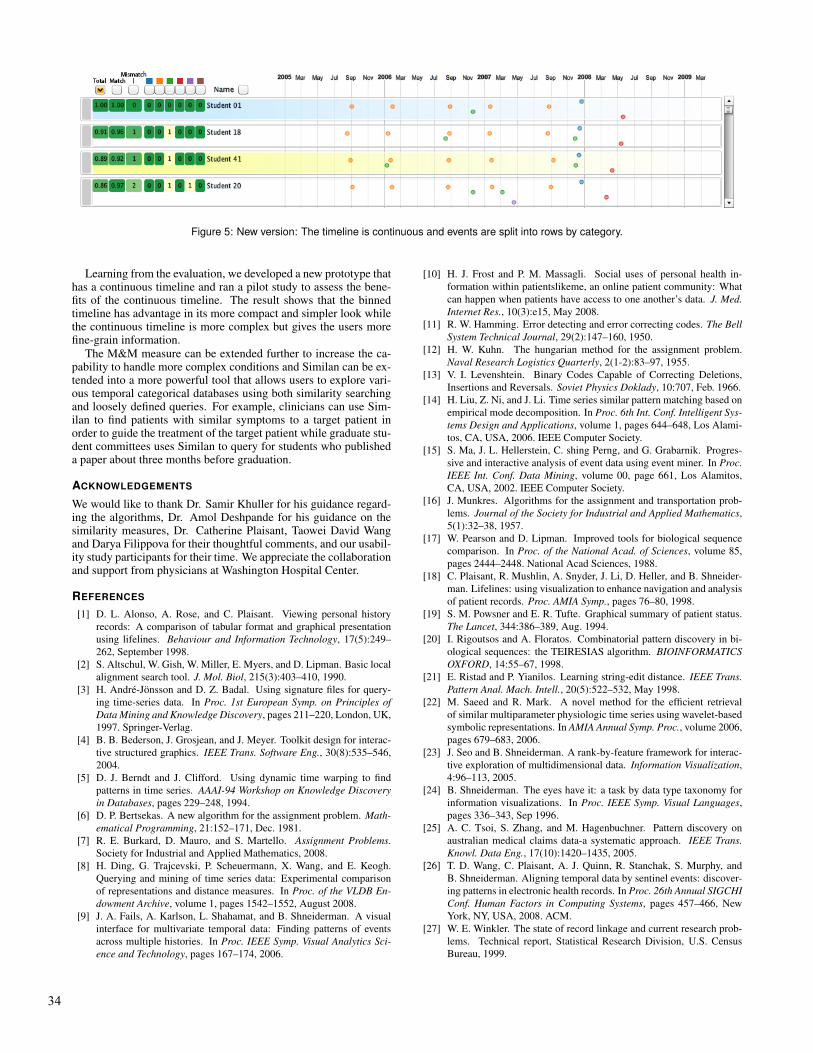
Figure 5: New version: The timeline is continuous and events are split into rows by category.
Learning from the evaluation, we developed a new prototype thathas a continuous timeline and ran a pilot study to assess the bene-fits of the continuous timeline. The result shows that the binnedtimeline has advantage in its more compact and simpler look whilethe continuous timeline is more complex but gives the users morefine-grain information.
The M&M measure can be extended further to increase the ca-pability to handle more complex conditions and Similan can be ex-tended into a more powerful tool that allows users to explore vari-ous temporal categorical databases using both similarity searchingand loosely defined queries. For example, clinicians can use Sim-ilan to find patients with similar symptoms to a target patient inorder to guide the treatment of the target patient while graduate stu-dent committees uses Similan to query for students who publisheda paper about three months before graduation.
ACKNOWLEDGEMENTS
We would like to thank Dr. Samir Khuller for his guidance regard-ing the algorithms, Dr. Amol Deshpande for his guidance on thesimilarity measures, Dr. Catherine Plaisant, Taowei David Wangand Darya Filippova for their thoughtful comments, and our usabil-ity study participants for their time. We appreciate the collaborationand support from physicians at Washington Hospital Center.
REFERENCES
[1] D. L. Alonso, A. Rose, and C. Plaisant. Viewing personal historyrecords: A comparison of tabular format and graphical presentationusing lifelines. Behaviour and Information Technology, 17(5):249–262, September 1998.
[2] S. Altschul, W. Gish, W. Miller, E. Myers, and D. Lipman. Basic localalignment search tool. J. Mol. Biol, 215(3):403–410, 1990.
[3] H. Andre-Jonsson and D. Z. Badal. Using signature files for query-ing time-series data. In Proc. 1st European Symp. on Principles ofData Mining and Knowledge Discovery, pages 211–220, London, UK,1997. Springer-Verlag.
[4] B. B. Bederson, J. Grosjean, and J. Meyer. Toolkit design for interac-tive structured graphics. IEEE Trans. Software Eng., 30(8):535–546,2004.
[5] D. J. Berndt and J. Clifford. Using dynamic time warping to findpatterns in time series. AAAI-94 Workshop on Knowledge Discoveryin Databases, pages 229–248, 1994.
[6] D. P. Bertsekas. A new algorithm for the assignment problem. Math-ematical Programming, 21:152–171, Dec. 1981.
[7] R. E. Burkard, D. Mauro, and S. Martello. Assignment Problems.Society for Industrial and Applied Mathematics, 2008.
[8] H. Ding, G. Trajcevski, P. Scheuermann, X. Wang, and E. Keogh.Querying and mining of time series data: Experimental comparisonof representations and distance measures. In Proc. of the VLDB En-dowment Archive, volume 1, pages 1542–1552, August 2008.
[9] J. A. Fails, A. Karlson, L. Shahamat, and B. Shneiderman. A visualinterface for multivariate temporal data: Finding patterns of eventsacross multiple histories. In Proc. IEEE Symp. Visual Analytics Sci-ence and Technology, pages 167–174, 2006.
[10] H. J. Frost and P. M. Massagli. Social uses of personal health in-formation within patientslikeme, an online patient community: Whatcan happen when patients have access to one another’s data. J. Med.Internet Res., 10(3):e15, May 2008.
[11] R. W. Hamming. Error detecting and error correcting codes. The BellSystem Technical Journal, 29(2):147–160, 1950.
[12] H. W. Kuhn. The hungarian method for the assignment problem.Naval Research Logistics Quarterly, 2(1-2):83–97, 1955.
[13] V. I. Levenshtein. Binary Codes Capable of Correcting Deletions,Insertions and Reversals. Soviet Physics Doklady, 10:707, Feb. 1966.
[14] H. Liu, Z. Ni, and J. Li. Time series similar pattern matching based onempirical mode decomposition. In Proc. 6th Int. Conf. Intelligent Sys-tems Design and Applications, volume 1, pages 644–648, Los Alami-tos, CA, USA, 2006. IEEE Computer Society.
[15] S. Ma, J. L. Hellerstein, C. shing Perng, and G. Grabarnik. Progres-sive and interactive analysis of event data using event miner. In Proc.IEEE Int. Conf. Data Mining, volume 00, page 661, Los Alamitos,CA, USA, 2002. IEEE Computer Society.
[16] J. Munkres. Algorithms for the assignment and transportation prob-lems. Journal of the Society for Industrial and Applied Mathematics,5(1):32–38, 1957.
[17] W. Pearson and D. Lipman. Improved tools for biological sequencecomparison. In Proc. of the National Acad. of Sciences, volume 85,pages 2444–2448. National Acad Sciences, 1988.
[18] C. Plaisant, R. Mushlin, A. Snyder, J. Li, D. Heller, and B. Shneider-man. Lifelines: using visualization to enhance navigation and analysisof patient records. Proc. AMIA Symp., pages 76–80, 1998.
[19] S. M. Powsner and E. R. Tufte. Graphical summary of patient status.The Lancet, 344:386–389, Aug. 1994.
[20] I. Rigoutsos and A. Floratos. Combinatorial pattern discovery in bi-ological sequences: the TEIRESIAS algorithm. BIOINFORMATICSOXFORD, 14:55–67, 1998.
[21] E. Ristad and P. Yianilos. Learning string-edit distance. IEEE Trans.Pattern Anal. Mach. Intell., 20(5):522–532, May 1998.
[22] M. Saeed and R. Mark. A novel method for the efficient retrievalof similar multiparameter physiologic time series using wavelet-basedsymbolic representations. In AMIA Annual Symp. Proc., volume 2006,pages 679–683, 2006.
[23] J. Seo and B. Shneiderman. A rank-by-feature framework for interac-tive exploration of multidimensional data. Information Visualization,4:96–113, 2005.
[24] B. Shneiderman. The eyes have it: a task by data type taxonomy forinformation visualizations. In Proc. IEEE Symp. Visual Languages,pages 336–343, Sep 1996.
[25] A. C. Tsoi, S. Zhang, and M. Hagenbuchner. Pattern discovery onaustralian medical claims data-a systematic approach. IEEE Trans.Knowl. Data Eng., 17(10):1420–1435, 2005.
[26] T. D. Wang, C. Plaisant, A. J. Quinn, R. Stanchak, S. Murphy, andB. Shneiderman. Aligning temporal data by sentinel events: discover-ing patterns in electronic health records. In Proc. 26th Annual SIGCHIConf. Human Factors in Computing Systems, pages 457–466, NewYork, NY, USA, 2008. ACM.
[27] W. E. Winkler. The state of record linkage and current research prob-lems. Technical report, Statistical Research Division, U.S. CensusBureau, 1999.
34