finding the poor vs. measuring their poverty: exploring
TRANSCRIPT
1
Finding the Poor vs. Measuring their Poverty:
Exploring the Drivers of Targeting Effectiveness in Indonesia*
Adama Bah† Samuel Bazzi
‡ Sudarno Sumarto
§ Julia Tobias
**
April 2015
Abstract
Centralized targeting registries are increasingly used to allocate social assistance benefits in
developing countries. This paper provides the first attempt to identify the relative importance of two
key design issues for targeting accuracy: (i) which households to survey for inclusion in the registry
and (ii) how to rank surveyed households. We evaluate Indonesia’s Unified Database for Social
Protection Programs (UDB), the largest targeting registry in the world, used to provide social
assistance to over 25 million households. Linking administrative data with an independent household
survey, we find that the UDB system is more progressive than previous targeting approaches.
However, simulating an alternative targeting system based on complete enumeration, we find a one-
third decrease in undercoverage of the poor compared to focusing on households that have been
registered in the UDB. Overall, our results suggest large gains in targeting accuracy from improving
the initial registration stage relative to the ranking stage.
JEL classification: D61, I32, I38
Keywords: Targeting, Proxy-Means Testing, Social Protection, Poverty
* We thank the team involved with the SUSETI survey from the World Bank Jakarta Office, Jameel Poverty Action Lab (J-
PAL), and Survey Meter for their cooperation in expanding the survey to accommodate the needs of our research. We also
thank TNP2K’s Unified Database team for access to data. We are grateful to Ronaldo Octaviano, Real Rahadinnal, Jurist
Tan, and Amri Ilma for assistance with the survey design and data cleaning. We thank Tarsicio Castaneda, David Coady,
John Voss and Matthew Wai-Poi for providing helpful comments. Support for this research has been provided by the
Australian Government through the Poverty Reduction Support Facility (PRSF). Any findings and conclusions expressed in
this papers are ours alone and do not reflect the views of the Government of Indonesia or the Government of Australia. † The National Team for the Acceleration of Poverty Reduction (TNP2K), Indonesia Vice-President Office, and CERDI-
University of Auvergne, France – Email: [email protected] ‡ Department of Economics, Boston University, MA, USA – Email: [email protected]
§ The National Team for the Acceleration of Poverty Reduction (TNP2K), Indonesia Vice-President Office and SMERU
Research Institute – Email: [email protected] **
Global Development Innovation Ventures, London, UK – Email: [email protected]

1 Introduction
Social assistance programs are currently estimated to cover as many as one billion people in the
developing world (International Labor Organization 2010). These programs are often targeted to the
neediest population groups, identified on the basis of socioeconomic status, in order to maximize their
effectiveness in improving social welfare given a limited budget. However, identifying and reaching
the intended beneficiaries can be challenging, especially in developing countries where a large part of
the population works in the informal sector and official income registries do not exist. Over the past
20 years, low- and middle-income countries have increasingly used centralized targeting registries to
select recipients of social assistance programs.1 For such registries, basic household and individual
information is typically collected for a subset of the population that is considered potentially eligible
for social assistance (as conducting a full census of all households is usually cost-prohibitive).2 This
information is then used to determine eligibility, most commonly based on proxy-means testing
(PMT).3
This paper deals with two key challenges that arise in the development of any targeting registry. The
first challenge is how to identify households for inclusion in the registry, or in other words who to
survey within the entire population. Properly addressing this issue is essential to ensuring that poor
households are included in the registry in the first place, thereby avoiding what we refer to as
‘misenumeration’ errors. The second challenge is how to assess the eligibility of those surveyed, or
how to estimate their socioeconomic status in order to rank or classify them. The main concern in this
step is to minimize what we refer to as ‘misclassification’ errors that stem from (surveyed) poor
households being deemed ineligible and from non-poor (surveyed) households being wrongly
classified as poor.
Misenumeration and misclassification have strong implications for targeting accuracy, which is
commonly assessed using two key measures: leakage (or ‘inclusion error’), when non-intended
beneficiaries receive program benefits, and undercoverage (or ‘exclusion error’), when intended
beneficiaries do not receive program benefits (Cornia and Stewart 1995). Many programs and
countries today suffer from the adverse consequences of inaccurate targeting (Acosta et al. 2011). To
date, however, little is known about the relative importance of household registration and ranking in
1 Examples of countries using centralized targeting registries besides Indonesia include Brazil, Chile, Colombia, India,
Mexico and the Philippines (see, for example, Castañeda et al. 2005 for a review of the experience of Latin American
countries; Dreze and Khera 2010 for the Indian Below-Poverty Line Census). 2 Compared to common population census questionnaires, targeting registry questionnaires collect more detailed
socioeconomic information at household and individual levels. They are therefore generally administered to a subset of the
population rather than to the full population, in order to limit costs. 3 PMT scores are constructed on the basis of simple socioeconomic indicators that are relatively easy to collect and less
prone to misreporting than expenditures or income. These indicators are combined into a single measure of welfare using
weights typically derived from consumption regressions estimated from an auxiliary survey. Using these predicted measures
of welfare can be a cost-effective way to identify beneficiaries of social programs to the extent that they are sufficiently
accurate.

3
determining the accuracy of targeting registries, as most existing studies focus on errors due to
misclassification.4
This paper provides the first attempt to assess the relative contribution of the household registration
and ranking processes to the overall accuracy of a centralized targeting registry. We do so using
Indonesia’s newly developed household targeting registry and aim to identify priority actions for
improving targeting effectiveness. Established in 2012, the Unified Database for Social Protection
Programs (UDB) is intended to cover the poorest 40 percent of the Indonesian population. Over 25
million households have been registered in the UDB using an innovative approach based on a pre-
listing of households to be surveyed, constructed through census-based poverty mapping (Elbers et al.
2003) and complemented with suggestions from local communities. These households were
subsequently ranked by their predicted welfare estimated using district-specific5 PMT formulas. The
UDB has been used to deliver over US$ 4 billion annually (IDR 43 trillion) in central government
social assistance (based on 2013 figures).6 This includes the largest social assistance programs in the
country: a rice subsidy program (known as Raskin), a health insurance program (known as
Jamkesmas), and an unconditional cash transfer program (known as BLT). Before the establishment
of the UDB, beneficiaries of these programs were selected using ad hoc targeting approaches.
Our analysis proceeds in three steps. First, we evaluate the targeting performance of the UDB against
the performance of past approaches to beneficiary selection used for the three main social assistance
programs. We use data from an independent survey known as SUSETI, which was matched with
UDB administrative data. The SUSETI contains information on household expenditures per capita,
which is not observed in the UDB, as well as information on the receipt of Raskin, Jamkesmas and
BLT at baseline (i.e., before the establishment of the UDB).
We find that targeting using the UDB is more progressive than previous approaches to beneficiary
selection. In particular, the UDB leads to a substantial reduction in leakage of benefits to non-poor
households. This decrease in leakage is largest for Raskin, for which the proportion of the richest 60%
of households receiving benefits is expected to fall from nearly 75% to 25%. Our findings highlight
4 This includes evaluations of targeting effectiveness (e.g., Skoufias et al. 2001; Banerjee et al. 2007), as well as most of the
optimal targeting literature, which can be divided between studies comparing different targeting methods and studies
focusing on the design of PMT formulas for ranking. Studies comparing the relative advantages of different targeting
methods (e.g., Coady et al. 2004, Banerjee et al. 2007, Alatas et al. 2012, 2013a, Karlan and Thuysbaert 2013) find that no
method clearly dominates in terms of commonly used objective performance measures. However, in general the evidence
suggests that community targeting is best for identifying the very poorest households. Other studies focusing on the design
of optimal PMT formulas (e.g., Sumarto et al. 2007, Muller and Bibi 2010, Bah 2013) show that targeting errors are
unavoidable when using simple indicators, although the degree of error can be minimized with more careful selection of the
proxies for consumption. One notable exception is Alatas et al. (2013b), which shows that self-targeting has the potential to
reduce misenumeration errors at the registration stage. 5 Indonesia’s administrative divisions proceed from province to district to subdistrict to village to hamlet. There were 497
districts at the time of the establishment of the UDB. 6 In June 2013, the Government of Indonesia announced a reduction in fuel subsidies, accompanied by a set of 4
compensation programs to mitigate its effect on poor and vulnerable households.

4
the tradeoffs between undercoverage and leakage found in many studies of targeting effectiveness
(Grosh and Baker 1995). There are indeed more limited improvements in terms of undercoverage,
which can be due to both misenumeration and misclassification errors.
Second, we disentangle the contribution of the enumeration and the PMT-based ranking processes to
targeting errors, and in particular undercoverage. Through an assessment of the counterfactual
performance that would be observed if all households had been enumerated (as in a census), we find
evidence of enumeration gaps in the UDB that lead to undercoverage of poor households. Under this
hypothetical scenario, severe undercoverage of all programs falls by about one-third relative to a
targeting system based only on those households actually included in the UDB. Depending on the
social planner’s welfare function (i.e., the relative weights on the poorest households in the
population), our findings suggest large gains from reallocating scarce administrative resources
towards increasing survey coverage to minimize undercoverage of poor households in the UDB. In
particular, we show that increased enumeration costs to cover the full population would amount to
about 11 percent of the value of additional benefits that would be received annually by households
from the poorest 30 percent. In other words, there should be a stronger focus on ensuring an adequate
number of households are surveyed. If poor households are not enumerated in the first place, even a
perfect PMT algorithm cannot prevent their exclusion.
Third, we identify household- and community-level correlates of misenumeration and
misclassification. Ownership of household assets that are difficult to observe and that are not recorded
in the UDB is associated with a lower probability of being registered in the UDB. However, for
households that are nevertheless registered, ownership of such assets is associated with a greater
potential to be misclassified as poor. Our findings also suggest some form of strategic interaction with
other social programs during the UDB registration process. For example, the receipt by households of
informal support from (religious) NGOs is associated with a higher likelihood of registration in the
UDB. Lastly, in line with Alatas et al. (2012), our results highlight the need to involve local
communities, which use different definitions of poverty and have superior information on the welfare
status of their members, in order to accurately identify the poor. However, such mechanisms should
include safeguards to prevent potential abuses from local (neighborhood) officials. We find that
households residing in villages with elected neighborhood heads are more prone to exclusion errors.
This may be due to “voter capture” whereby preferential treatment in the targeting process may be
given to those residents who participate in neighborhood activities including local elections
(Kurasawa 2009).
Our paper contributes to the literature in public and development economics on optimal targeting of
social programs. Most studies use a single survey to identify intended and actual recipients, i.e., who
is poor and who is receiving government benefits. However, as argued by Coady and Parker (2009)

5
and Coady et al. (2013), relying solely on household self-reporting of beneficiary status does not
allow for a full understanding of what happens at the multiple stages of the targeting process, before
benefits are delivered to households. Using actual administrative data on household eligibility for
government social programs linked with data on household expenditures from an independent survey
allows us to identify the relative contribution to overall targeting accuracy of (i) the decision of which
potentially eligible households to survey, and (ii) the estimation of their socioeconomic status based
on the data collected. Our findings relate to those of Coady and Parker (2009) and Coady et al. (2012),
who consider a three-step program-specific targeting process comprising information, self-selection to
apply and ranking stages. For the Indonesian targeting registry’s two-step process—registration based
on enumeration pre-listings complemented by community suggestions and ranking—we find large
gains in performance from improving the initial registration stage relative to the ranking stage. As a
result, we are able to prioritize policy options to minimize the potential exclusion of the poorest
households from increasingly used targeting registries of the sort we study in Indonesia.
Our findings have important implications for ongoing policy debates in developing countries
concerning the design of efficient and equitable targeting registries. Overall, our results provide
further evidence on the difficulty of accurate targeting in countries like Indonesia where there is
considerable clustering of households around the poverty line. Nevertheless, our research design
allows us to clarify how improvements in the enumeration process can lead to large gains in overall
targeting effectiveness.
The remainder of the paper is organized as follows. Section 2 provides background information on
Indonesia’s UDB. Section 3 presents the SUSETI survey and its features. Section 4 assesses the
predicted targeting accuracy of the UDB. Section 5 explores the determinants of UDB accuracy.
Section 6 concludes with policy recommendations.
2 The Unified Database for Social Protection Programs7
In this section, we describe the two main steps in establishing a centralized targeting registry of 25
million households ranked according to their socioeconomic status: data collection (enumeration) and
PMT modeling (ranking).8 First, the data collection stage involved pre-identifying all potentially
eligible households that should be surveyed. Given the lack of accurate pre-existing data on which
households are poorest, the government adopted a new approach combining administrative data from
7 Henceforth, references to “poor” (“non-poor”) are meant to distinguish households in the bottom 40 (upper 60) percent of
the consumption distribution and hence those meant to be included (excluded) from the UDB. 8 Detailed information on the full process followed in establishing the UDB is available in TNP2K (2014).

6
the 2010 Population Census and input from local communities.9 Second, the PMT modeling stage
entailed incorporating proxies for consumption-based welfare measures and accounting for the
socioeconomic diversity across regions. Figure A1 in the appendix provides a diagram explaining the
multi-stage process of establishing the database that we describe here.
2.1 Data collection
The establishment of the UDB was motivated by evidence that inaccurate targeting of Indonesia’s
main social protection programs was a major obstacle to the effectiveness of the national poverty
reduction strategy. Previous studies revealed that these programs suffered from significant
undercoverage of poor households and leakage to non-poor households (e.g., World Bank, 2012). The
targeting errors were believed to be due largely to coverage and quality gaps in the previous censuses
of the poor used to identify beneficiaries of the unconditional cash transfer programs (BLT)
implemented in 2005 and 2008.10
Households surveyed in these data collection efforts were identified
based mainly on subjective consultation of enumerators from the Central Statistical Bureau (known as
BPS) with village leaders (see, e.g., SMERU 2006).
The UDB was intended to cover a greater number of households and to avoid relying exclusively on
subjective nominations from community leaders. The registration of households in the UDB followed
a two-step approach: first, a ‘pre-listing’ of households to be surveyed produced through a poverty
mapping exercise; and, second, incorporation of suggestions from the community in the field to
amend and complete the survey pre-listing.
The first step was intended to mitigate undercoverage that had plagued previous data collection efforts
in 2005 and 2008 and to ensure that a sufficient number of households would be surveyed. A poverty
mapping exercise was conducted using the Elbers et al. (2003) methodology and the 2010 Population
Census to estimate household welfare (approximated by per capita consumption) for the entire
population. Target enumeration quotas were estimated using district-specific consumption-based
poverty lines from the 2010 national socioeconomic survey (known as Susenas) to account for income
differences across Indonesia’s 497 districts.11
All households in each village with a predicted per
capita consumption level below the enumeration quota cutoff were included on a pre-listing (by name
and address) to be surveyed for inclusion in the UDB.
9 Alternative approaches include surveying households that request it or conducting a census in the poorest areas (e.g.,
Skoufias et al. 2001; Camacho and Conover 2011; Karlan and Thuysbaert 2013). 10
These two cash transfer programs were designed to provide temporary compensation to protect poor households against
the shocks associated with fuel subsidy reductions. See Bazzi et al. (2014) for an evaluation of the 2005 program’s impact on
household consumption. In 2013, the BLT program was renamed BLSM. For simplicity and since the program is still often
referred to by its original name, we use the acronym “BLT” in this paper to refer to both the previous and newer variants of
this program. 11
Administered to a sample of households representative at the district level, Susenas includes a detailed consumption
module which is used to estimate poverty lines.

7
In the second step, suggestions from communities were incorporated during the enumeration in the
field by BPS staff responsible for the registration of households on the pre-listings. In nearly all
districts, enumerators and/or community leaders removed from the survey pre-listings those
households that were considered non-poor or could not be found (e.g., due to relocation or death). The
guidelines for enumerators also stipulated that households that were not on the pre-listings could be
registered if the household (i) “appeared poor” to the enumerators, or (ii) was designated as poor by
other poor households in the community.
The initial budget allowed for coverage of 50% of the Indonesian population. In practice, only 43% of
all households were surveyed nationally, with varying coverage across districts. This was lower than
expected and can be traced to the second step in the data collection process. Some households on the
pre-listing were not actually surveyed in the field (e.g., for the reason of being considered non-poor),
which may have resulted in the exclusion of some households. Also, a limited number of households
were added to the pre-listings due to reluctance among enumerators and community leaders (SMERU,
2012).12
2.2 PMT Modeling
The UDB registration survey collected household-level information such as demographics, housing
characteristics, sanitation, access to basic domestic energy services, and asset ownership, along with
information on individual household members including age, gender, schooling, and occupation.
Using this information, households were ranked by their predicted welfare following a proxy-means
testing (PMT) approach. PMT formulas were constructed based on district-specific consumption
regressions to explicitly account for heterogeneity across regions.
Although the PMT approach can be a cost-effective means of identifying beneficiaries of social
programs in the absence of an up-to-date household registry with reliable income data, it is also prone
to errors (e.g., Grosh and Baker 1995). In particular, targeting errors may occur due to weak
predictive performance of the consumption models within the estimation sample (e.g., due to
constraints on the set of socioeconomic variables available for use in the PMT regressions). Further,
overfitting, which is more likely to occur when a large number of predictors are included in the
models and/or when the estimation is based on a small sample, may limit the validity and precision of
the PMT formulas outside the estimation sample.
12
In some communities, there was a reluctance to survey a high number of households, particularly households not
considered to be poor. There were some concerns from community leaders that surveying many households would build
households’ expectations about receiving program benefits that might later be disappointed (SMERU, 2012). There was also
limited understanding that being surveyed would not automatically result in being selected for programs, and some leaders
may have feared that surveying non-poor households would make these households likely to get selected to receive programs
for which they are not eligible. Similar issues had created social unrest in several communities in the past, especially during
the implementation of the 2005 census of the poor for the first BLT program (SMERU, 2006). It should also be noted that
surveyors were paid a fixed monthly salary rather than being paid per household surveyed, which may have reduced
incentives to achieve greater coverage of households.

8
In the remainder of the paper, we investigate the overall accuracy of Indonesia’s targeting database of
25 million households established through the data collection and PMT classification stages described
above.
3 The Indonesian Household Socio-Economic Survey (SUSETI)
Targeting accuracy is measured based on the discrepancy between intended and actual recipients, i.e.,
who is poor (often based on household expenditures) and who is receiving government benefits.
Evaluations of targeting accuracy commonly use data on both of these key indicators from a single
survey (see, e.g., Coady et al. 2004). As a result, many evaluations rely on households to self-report
whether or not they receive benefits rather than using more reliable albeit typically unavailable
administrative data. Building upon Coady and Parker’s (2009) innovative evaluation of targeting
effectiveness in Mexico, we evaluate the UDB’s targeting performance using actual administrative
data on household eligibility status for government social programs, which we compare to data on
their expenditures. Relying on administrative data from the UDB allows a better understanding of
what happens at the multiple stages of the targeting process before benefits are delivered to
households, including the decision of which potentially poor households should be surveyed, as well
as the process of estimating their socioeconomic status based on the data collected.
We use data from the Indonesian Household Socio-Economic Survey (known as SUSETI), rather than
the nationally representative SUSENAS, given that the former could be linked to administrative data
from the UDB and contains detailed information on household living conditions. In this section we
first present the SUSETI, which was collected by an independent survey firm, before comparing the
socioeconomic characteristics of SUSETI households registered in the UDB, and those not included.
3.1 The SUSETI and Its Link with the Unified Database
The SUSETI sample comprises 5,682 households13
located in 600 villages spread across 6 districts in
the provinces of Lampung (Central Lampung and Bandar Lampung districts), South Sumatra (Ogan
Komering Ilir and Palembang districts), and Central Java (Wonogiri and Pemalang districts). The
provinces were selected to represent a wide range of Indonesia’s diverse cultural and economic
geography, and the 6 districts were selected among areas where the Indonesian conditional cash
transfer program (known as PKH) was to expand in 2011.14
In one randomly selected
hamlet/neighborhood (known as RT) within each of the 600 villages, the SUSETI questionnaire was
13
The survey initially included 5,998 households, but there is an attrition of about 5% (or 316) original households between
the baseline and end line waves. We focus in the paper on the 5,682 households surveyed in both waves. Attritors do not
systematically differ from non-attritors along baseline characteristics used in SUSETI and in the UDB to construct PMT.
Results available upon request. 14
For more detailed information on the design and sampling of the survey, which was originally collected to compare
different targeting methods in a high-stakes experiment, see Alatas et al. (2013a, b).

9
administered to nine households randomly selected among those that met the PKH demographic
eligibility criteria of having an expectant mother or at least one child under the age of sixteen.15
A
longer version of the same questionnaire was also used to collect data from each neighborhood head.
The SUSETI comprises a baseline, collected in March 2011, and an endline, following the same
households, collected in February 2012. Given the purposes of this study, we use the baseline data
since it includes a more comprehensive set of socioeconomic variables and because the survey was
administered closer to the July-August 2011 timing of the data collection for the UDB.16
Although the SUSETI sample is not statistically representative of the whole country (or even the
given districts), it has several unique features that make our results internally valid in terms of our
primary goal of evaluating and decomposing the targeting performance of the UDB. First, the survey
incorporated a rigorous matching process to enable the identification of households registered in the
UDB. We conducted desk-based matching using the names and addresses of household heads and
spouses, and the matching results were also verified in the field.17
The field-based verification process
makes “false positive” matches very unlikely, but a small number of “false negative” matches may
exist (i.e., SUSETI households who are also in the UDB but the match was not detected), due to the
difficulty in recognizing different versions of names. The expected effects of such potential under-
matching would be to slightly inflate the estimated errors of exclusion and to slightly deflate
estimated errors of inclusion.
A second important feature of the SUSETI is the availability of information on receipt of Indonesia’s
main social protection programs (Raskin, Jamkesmas and BLT) prior to the establishment of the
UDB. These programs relied in the past on different methods of identifying beneficiaries, such as
using previous censuses of the poor (BLT) and/or nominations from community leaders. This allows
us to compare the performance of the centralized UDB targeting registry, with more ad hoc (baseline)
targeting approaches. We are therefore able to evaluate the change in targeting accuracy for programs
transitioning to using the UDB.18
15
According to nationally representative household survey data from 2010 (Susenas), within the entire Indonesian
population, about two-thirds of households have at least one child aged below sixteen. 16
An additional reason for using the baseline data is that the survey was administered before the government conducted any
socialization or targeting for PKH, while the endline was administered after the PKH program started. Thus, we avoid using
the consumption data in the endline as it may potentially reflect non-random shocks associated with the PKH program. 17
Before the SUSETI endline survey was conducted, a listing of all households to be surveyed was constructed based on
baseline respondents. This list was electronically matched with the UDB using household characteristics such as the
addresses and names of the household head and spouse. This list was also matched with the enumeration pre-listing, in order
to identify households that were initially on this list but that were not registered in the UDB. During the endline survey
fielding, enumerators and community leaders were asked to verify that the electronic matches were correctly identified. They
were also asked to manually identify any other matches not yet identified by comparing the SUSETI listing with the UDB
registry. 18
At the time of the fielding of the SUSETI (and matching with the UDB), in early 2012, the UDB had not yet been used for
targeting purposes. However, it was known which households were to be included in the beneficiary lists from the UDB
provided to these programs, based on their PMT score rankings.
10
The SUSETI also includes all the indicators used to calculate households’ PMT scores in the UDB.
This allows simulating the PMT process used in Indonesia under the hypothetical scenario of all
households having been surveyed for inclusion in the UDB, rather than only the subset of households
expected to be poor. We are thus able to distinguish between targeting errors that are due to
“enumeration errors”, i.e. poor households not registered in the UDB, and those associated with the
PMT estimation process.
Finally, the SUSETI contains other types of information relevant to identifying determinants of
targeting errors such as households’ participation in the community, difficult-to-observe assets and
exposure to shocks. The survey component administered to the head of each hamlet/neighborhood
also collects information on community-level characteristics such as its geographic remoteness, the
mode of selection of the head and his/her social networks with other community members.19
Table 1: Results of Dataset Matching: Share of UDB households in the total population and in the SUSETI.
Total Population
SUSETI sample
District UDB All
Share in UDB
(%)
UDB All
Share in UDB
(%)
Central Lampung 58,576 132,554 44
739 1408 52
Bandar Lampung 81,003 223,730 36
215 459 47
Ogan Komering Ilir 82,110 226,705 36
344 1056 33
Palembang 53,693 149,010 36
380 826 46
Wonogiri 50,040 138,369 36
276 984 28
Pemalang 121,031 211,100 57
490 949 52
All 446,453 1,081,468 41
2444 5682 43
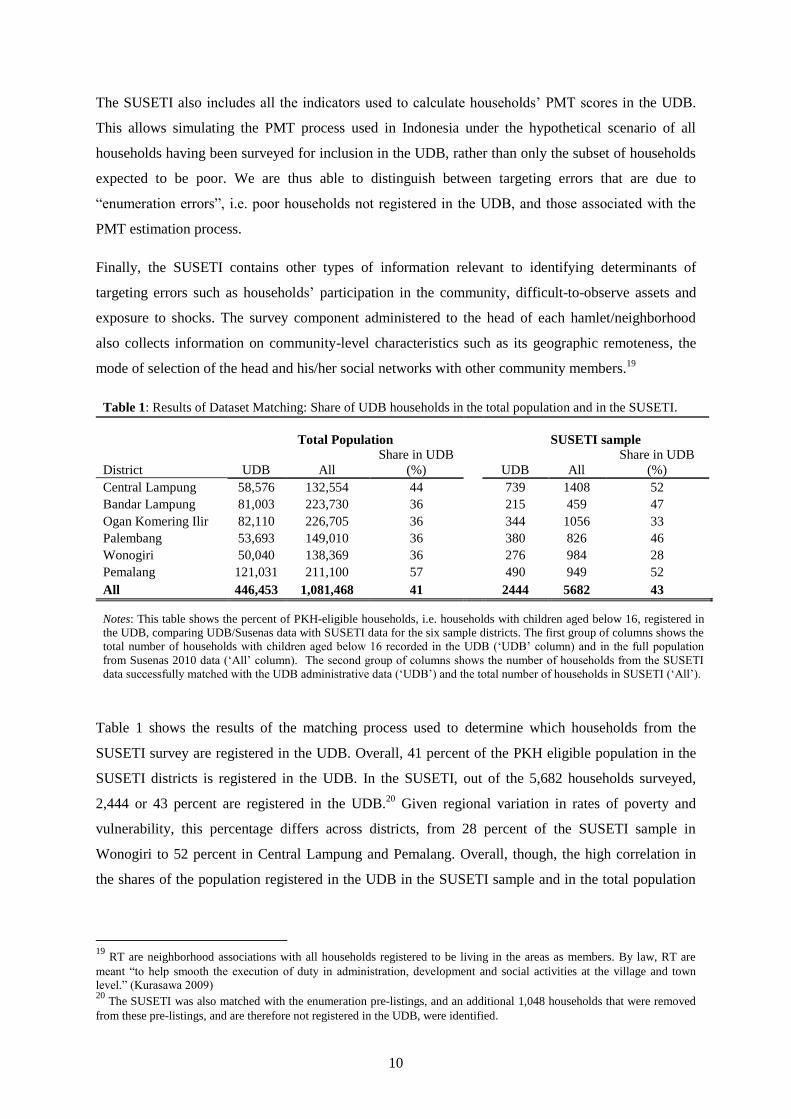
Notes: This table shows the percent of PKH-eligible households, i.e. households with children aged below 16, registered in
the UDB, comparing UDB/Susenas data with SUSETI data for the six sample districts. The first group of columns shows the
total number of households with children aged below 16 recorded in the UDB (‘UDB’ column) and in the full population
from Susenas 2010 data (‘All’ column). The second group of columns shows the number of households from the SUSETI
data successfully matched with the UDB administrative data (‘UDB’) and the total number of households in SUSETI (‘All’).
Table 1 shows the results of the matching process used to determine which households from the
SUSETI survey are registered in the UDB. Overall, 41 percent of the PKH eligible population in the
SUSETI districts is registered in the UDB. In the SUSETI, out of the 5,682 households surveyed,
2,444 or 43 percent are registered in the UDB.20
Given regional variation in rates of poverty and
vulnerability, this percentage differs across districts, from 28 percent of the SUSETI sample in
Wonogiri to 52 percent in Central Lampung and Pemalang. Overall, though, the high correlation in
the shares of the population registered in the UDB in the SUSETI sample and in the total population
19
RT are neighborhood associations with all households registered to be living in the areas as members. By law, RT are
meant “to help smooth the execution of duty in administration, development and social activities at the village and town
level.” (Kurasawa 2009) 20
The SUSETI was also matched with the enumeration pre-listings, and an additional 1,048 households that were removed
from these pre-listings, and are therefore not registered in the UDB, were identified.

11
increases confidence in the accuracy of the matching exercise, which is important to ensuring valid
estimates of targeting errors in the UDB.21
3.2 Comparison of UDB-Registered and Non-Registered Households
Table 2 provides an initial glimpse into the UDB’s performance in reaching the poorest households,
with a comparison of the socioeconomic characteristics of SUSETI households registered in the UDB
and those not included (‘non-UDB’). Households registered in the UDB appear significantly poorer,
with monthly per capita expenditure levels 1.4 times lower on average than those of non-UDB
households. Compared to non-UDB households, UDB households tend to have significantly more
family members and children. UDB household heads also have about two fewer years of schooling,
and fewer among them are male and working, compared to non-UDB household heads.
Table 2: Socioeconomic Characteristics of UDB and non-UDB Households in the SUSETI
All
households UDB non-UDB t-stat
Demographic Characteristics
Household size 4.8
4.9 4.6 -6.03***
Number of children aged 0-15 years 1.7
1.8 1.6 -7.36***
Household head aged 44.4
44.1 44.5 1.28
Male household head 0.95
0.93 0.95 2.50**
Household head schooling years 6.9
5.9 7.7 16.84***
Household head works 0.93
0.92 0.94 2.15**
Household head works in agricultural sector 0.45
0.46 0.44 -1.79*
(Baseline) household expenditures per capita, IDR 575,766
471,443 654,499 16.54***
Receipt of Social Assistance Programs
Raskin subsidized rice 0.80
0.92 0.71 -19.59***
Jamkesmas health waiver program 0.44
0.59 0.33 -20.19***
BLT unconditional cash transfer in 2008 0.40
0.58 0.26 -25.44***
Raskin, Jamkesmas & BLT 2008 simultaneously 0.26 0.41 0.15 -23.30***
Notes: This table reports averages for all households in the SUSETI followed by a breakdown for households in the UDB
and not in the UDB. Cells with values less than one are variables reporting a proportion. Per capita expenditures are nominal
Rupiah values as reported in the baseline survey. The t-stat is based on a two-sided test for difference in means between the
two groups. Stars indicate significance at the 1% ***, 5% **, and 10% * level.
Table 2 also shows that UDB households are more likely than non-UDB households to have
previously received benefits from any of the national social protection programs distributed prior to
21
Matching rates in the urban districts of Bandar Lampung and Palembang appear relatively higher than the share of the
population registered in the UDB, suggesting that there may be local-level characteristics that affect the matching rate.
However, we obtain similar results to Table 1 when considering district-specific average village shares of UDB households
in the population and in the SUSETI sample.
12
the implementation of the UDB.22
For the BLT cash transfer program distributed in 2008, 58 percent
of UDB households report to have been recipients compared to 26 percent of non-UDB households,
and the figures are similar for the Jamkesmas health fee waiver program (59 percent and 33 percent,
respectively). For the Raskin subsidized rice program, 92 percent of UDB households report to have
received benefits compared to 71 percent of non-UDB households.23
UDB households appear also
more likely to have receive the three programs simultaneously, 41 percent, compared to non-UDB
households, 15 percent.
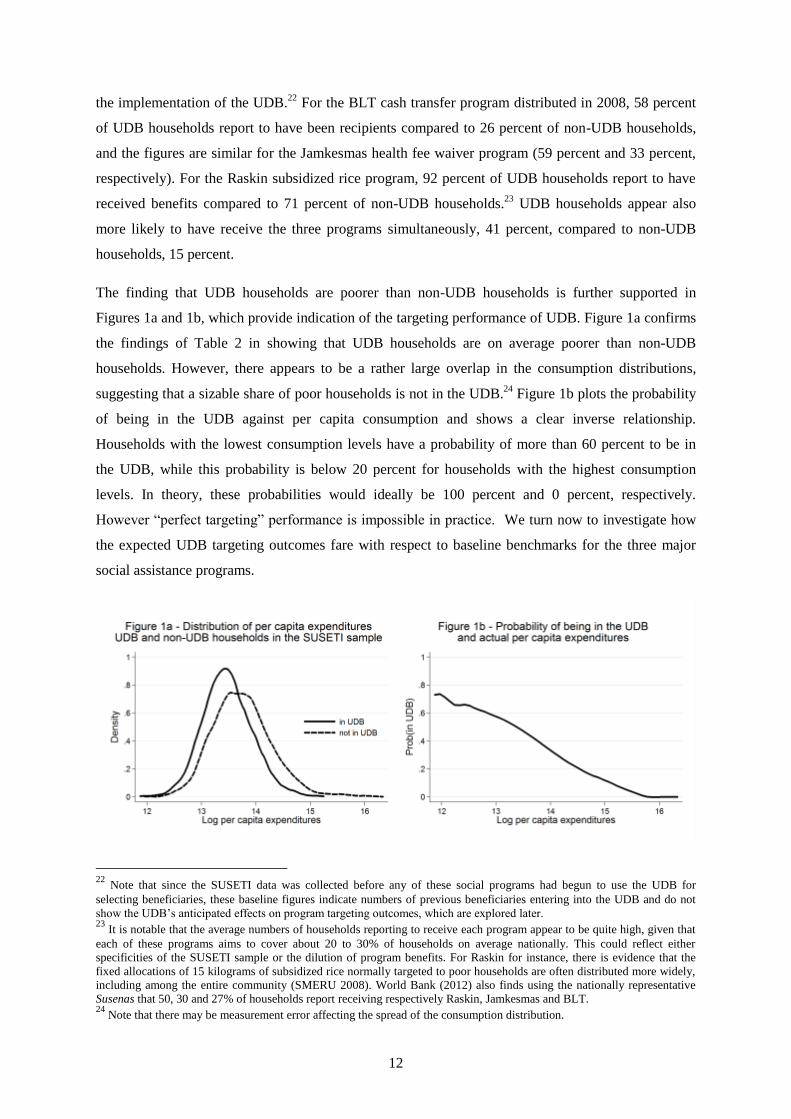
The finding that UDB households are poorer than non-UDB households is further supported in
Figures 1a and 1b, which provide indication of the targeting performance of UDB. Figure 1a confirms
the findings of Table 2 in showing that UDB households are on average poorer than non-UDB
households. However, there appears to be a rather large overlap in the consumption distributions,
suggesting that a sizable share of poor households is not in the UDB.24
Figure 1b plots the probability
of being in the UDB against per capita consumption and shows a clear inverse relationship.
Households with the lowest consumption levels have a probability of more than 60 percent to be in
the UDB, while this probability is below 20 percent for households with the highest consumption
levels. In theory, these probabilities would ideally be 100 percent and 0 percent, respectively.
However “perfect targeting” performance is impossible in practice. We turn now to investigate how
the expected UDB targeting outcomes fare with respect to baseline benchmarks for the three major
social assistance programs.
22
Note that since the SUSETI data was collected before any of these social programs had begun to use the UDB for
selecting beneficiaries, these baseline figures indicate numbers of previous beneficiaries entering into the UDB and do not
show the UDB’s anticipated effects on program targeting outcomes, which are explored later. 23
It is notable that the average numbers of households reporting to receive each program appear to be quite high, given that
each of these programs aims to cover about 20 to 30% of households on average nationally. This could reflect either
specificities of the SUSETI sample or the dilution of program benefits. For Raskin for instance, there is evidence that the
fixed allocations of 15 kilograms of subsidized rice normally targeted to poor households are often distributed more widely,
including among the entire community (SMERU 2008). World Bank (2012) also finds using the nationally representative
Susenas that 50, 30 and 27% of households report receiving respectively Raskin, Jamkesmas and BLT. 24
Note that there may be measurement error affecting the spread of the consumption distribution.

13
Notes: Figure 1(a) plots the kernel density of log household expenditures per capita separately for SUSETI households
registered (not registered) in the UDB. Figure 1(b) plots the local linear probability of being in the UDB against log
expenditures.
4 Evaluating the Targeting Performance of the UDB
In this section, we analyze in greater depth the targeting performance of the UDB, taking advantage of
the matched SUSETI-UDB data. Section 4.1 explains the methodology used to assess baseline and
expected targeting accuracy of social programs in Indonesia. Section 4.2 presents the UDB targeting
performance. Section 4.3 takes the analysis further by disentangling errors resulting from the
enumeration process and PMT classification errors.
4.1 Methodology for Assessing the Targeting Accuracy of the UDB
A large literature examines different measures and methodologies for estimating targeting accuracy
(see Coady et al. 2004 for a review). Commonly used measures of targeting outcomes include
undercoverage and leakage (Cornia and Stewart 1995), the distributional characteristic (Coady and
Skoufias 2004), and the Coady-Grosh-Hoddinott measure (Coady et al. 2004). In this paper, we use
undercoverage and leakage as our main measures of targeting outcomes, in line with most of the
literature. Undercoverage, or exclusion error, is defined as the share of households below a given
poverty threshold that are not receiving program benefits. We consider more specifically two
thresholds, and define undercoverage using the 30th percentile of household actual (adjusted) per
capita consumption in the SUSETI sample, and severe undercoverage using the 10th percentile.
25
Conversely, leakage, or inclusion error, is defined as the share of households that are above a given
threshold and yet receive benefits. Similar to undercoverage, we use two thresholds, and define
leakage using the 60th percentile, and severe leakage using the 80
th percentile of the adjusted per
capita consumption distribution. Key results are robust to alternative thresholds.
As described earlier, we assess the targeting performance of the UDB against the baseline targeting
performance of the main social assistance programs (Raskin, Jamkesmas and BLT). More
specifically, we consider the performance expected from the use of lists of eligible beneficiaries from
the UDB. Focusing on pre-determined eligibility based on the UDB rather than on reported receipt of
benefits allows us to emphasize the potential for the newly established UDB to improve targeting
outcomes, setting aside other program implementation issues that may affect benefit delivery.
However, some discrepancy between the expected and actual UDB targeting errors may occur
depending on the degree of compliance with the beneficiary lists extracted from the UDB in the field.
For Jamkesmas and BLT, the amount of discrepancy is expected to be relatively small since eligibility
25
These levels correspond closely to the thresholds used by the Indonesian government to determine eligibility for its main
social assistance programs; BLT, Jamkesmas and Raskin all cover roughly the poorest 30% of households in the country,
while the eligibility threshold for PKH is close to the poorest 10%.

14
cards were printed directly based on the UDB. For Raskin, more discrepancy is anticipated between
expected and actual targeting outcomes due to the longstanding community practice of sharing rice
benefits across nominally eligible and ineligible households.26
Baseline targeting errors are calculated by comparing reported program receipt to household per
capita consumption. Expected UDB targeting errors are calculated by comparing, for households
registered in the UDB, actual per capita consumption (from SUSETI) with the PMT scores (from the
UDB) used to produce beneficiary lists based on each program’s eligibility threshold. Any household
in the SUSETI sample not found in the UDB through the matching process is considered to be a non-
recipient.
The comparison of baseline and expected UDB targeting errors (undercoverage and leakage) reveals
the change in targeting performance due to the transition of the programs to using the UDB for
beneficiary selection. Switching to the UDB implies changes not only in which households will
receive program benefits but also in the total number of beneficiaries (i.e., program coverage).
Therefore, we first present standard undercoverage and leakage measures to assess the overall change
in targeting performance between baseline and with the UDB. We then isolate the change expected
solely from beneficiary identification using the UDB lists by computing UDB undercoverage and
leakage at an unchanged (baseline) coverage level.
Lastly, we also address a notable limitation of standard undercoverage and leakage measures (see, for
example, Coady and Skoufias 2004; Coady et al. 2004), which weight equally all households
regardless of their position in the consumption distribution. For instance, when measuring
undercoverage for a program intended to cover the poorest three deciles of the consumption
distribution, no distinction is made between the exclusion of a household in the poorest 5 percent and
that of a household in the 29th percentile, even though from a welfare perspective, excluding the
former represents a more serious error. We therefore also present the expected incidence of benefits
across all consumption deciles to provide a more detailed assessment of the distributional
performance of the UDB.
4.2 Results: UDB targeting performance
In this section, we evaluate the overall targeting performance of the UDB through the changes in
targeting accuracy that can be expected from the transition of the three main Indonesian social
assistance programs to using the UDB. Column (1) of Table 3a shows that at baseline, 80%, 44%, and
39% of all SUSETI households report having previously received Raskin, Jamkesmas, and BLT
26
One of the objectives of establishing the UDB is to reduce benefit dilution which decreases significantly the share of
benefits received by the target population. Raskin beneficiaries, for instance, purchased on average 3.8 kilograms of rice
monthly, instead of the intended 15 kilograms, “due to community-level sharing of benefits by non-target households”
(World Bank 2012).

15
respectively. Compared to Jamkesmas and BLT, Raskin’s substantially higher coverage levels lead to
(i) very low baseline undercoverage: less than 11% of the poorest three deciles have not received the
subsidised rice benefits and (ii) high leakage: 74% of the richest four deciles have received benefits.
Jamkesmas and BLT have similar baseline targeting errors, with leakage rates of 34% and 39%,
respectively, and undercoverage rates of 45% and 51%. These patterns in targeting errors are in line
with previous research analyzing the targeting performance of Indonesia’s social protection programs
before the establishment of the UDB (World Bank 2012).
Table 3a - Baseline and Expected UDB Program Targeting Accuracy
(1) (2)
Targeting Measures Baseline (%) Expected UDB (%)
Panel A: Raskin
Coverage level 80 31
Leakage 74.4 23.5
Severe Leakage 66.7 16.4
Undercoverage 10.9 54.0
Severe Undercoverage 7.7 49.6
Panel B: Jamkesmas
Coverage level 44 33
Leakage 38.7 24.9
Severe Leakage 32.5 17.4
Undercoverage 44.9 52.6
Severe Undercoverage 42.8 48.4
Panel C: BLT 2008
Coverage level 39
Leakage 34.2
Severe Leakage 27.0
Undercoverage 50.5
Severe Undercoverage 48.1
Notes: This table reports estimates of targeting errors, computed separately for the Raskin, Jamkesmas, and BLT
2008 programs. Leakage captures the fraction of the richest 60% of households that received the given program;
severe leakage captures the fraction of the richest 20% that received the given program. Severe undercoverage
captures the fraction of the poorest 10% that did not receive the given program; undercoverage captures the
fraction of the poorest 30% that did not receive the given program. In all columns, households are ranked
according to their adjusted household expenditures per capita at baseline. The definition of program receipt varies
across columns. In column (1), program receipt is as reported by households in SUSETI. In column (2), program
receipt equals one if the household's PMT score in the UDB places it within the pool of intended program
recipients. For the BLT08, there is no expected UDB since the program is not implemented using the UDB at the
time this analysis is undertaken.
Results presented in Column (2) of Table 3a show first that Raskin and Jamkesmas coverage levels
decrease significantly with the UDB compared to baseline. This reduction in the number of
beneficiaries automatically leads to an increase in undercoverage for both Raskin (from 11% to 54%)
and Jamkesmas (from 45% to 53%). Another consequence of the expected decrease in coverage is
that leakage to non-poor households is expected to decrease significantly with Raskin and Jamkesmas

16
using the UDB. These improvements are most apparent for Raskin, where the baseline leakage of
74% is expected to decrease by 50 percentage points with use of the UDB. For Jamkesmas, baseline
leakage rates are expected to fall from 39% to 25%, and severe leakage even further from 33% to
17%, with use of the UDB.
Similar patterns are observed when focusing on the ‘severe’ measures of undercoverage and leakage
listed in Table 3a, which are lower across all programs, at baseline and with the UDB.
The difference between baseline and expected UDB errors is difficult to interpret, given the
substantial change in program coverage levels associated with the transition to using the UDB to
select beneficiaries. It is therefore useful to keep coverage levels constant as an alternate way to assess
the change in targeting performance expected from programs that transition to using the UDB. We do
this using both baseline BLT 2008 and Jamkesmas UDB coverage levels, and identify households that
would be eligible for a program with such coverage based on the UDB. We choose to match BLT
2008 coverage levels because previous research (World Bank 2012) indicates that the BLT 2008 has
the highest targeting accuracy among the three social programs we consider, and thus using it as a
benchmark provides the strictest possible test of the UDB’s performance relative to baseline.27
We
also match Jamkesmas UDB coverage levels, which decrease by about 10 percentage points compared
to baseline coverage levels, in order to provide an assessment of baseline selection mechanism and
ensure that the change in targeting performance obtained with the UDB is not solely explained by
decrease in coverage level.28
Results presented in Table 3b show that holding coverage levels constant, whether at BLT 2008
baseline or at Jamkesmas UDB-predicted levels, using the UDB to select beneficiaries leads to a
decrease in both undercoverage and leakage compared to baseline beneficiary selection mechanisms.
For the Jamkesmas program, using baseline selection mechanism to the same number of beneficiaries
as predicted eligible by the UDB would increase leakage from 25% to 29%, and severe leakage from
17% to 24%, as shown in Column (1), Panel B of Table 3b. For the BLT program, as shown in
Column (2), Panel C of Table 3b, using the UDB at constant baseline coverage levels would reduce
undercoverage of the program from 51% to 48%, which, extrapolated, would correspond nationally to
about 500,000 additional households from the poorest 30 percent receiving this program with the
UDB compared to baseline. Severe undercoverage decreases from 48% to 44%, leading to the
program covering nearly 250,000 more households from the poorest 10 percent with the UDB. This
decrease in exclusion errors further suggests that the main reason for the increase in undercoverage
27
In addition, only 43 percent of SUSETI households are matched with the UDB, which is lower than Raskin and
Jamkesmas baseline coverage levels, at 80 and 44 percent respectively. 28 For the Raskin program, as noted above, the longstanding practice of benefit sharing equally within communities makes it
highly unlikely that a decrease in program coverage would lead to a decrease in the number of beneficiaries. In this case, it is
expected based on existing evidence on the program implementation that the entire community would still receive benefits,
albeit a smaller in smaller size.

17
expected with usage of the UDB for Raskin and Jamkesmas noted earlier in this section is the
concurrent decrease in their coverage levels, compared to baseline. Leakage also decreases for this
simulated BLT program from 34% to 32%. To summarize, holding coverage levels constant, the UDB
is predicted to improve both undercoverage and leakage relative to baseline.
Table 3b - Comparing Baseline and UDB Program Targeting Accuracy at the Same Coverage Levels
(1) (2)
Targeting Measures Baseline (%) UDB (%)
Panel B: Jamkesmas - actual UDB coverage levels and baseline beneficiary selection
Coverage level 33 33
Leakage 28.9 24.9
Severe Leakage 24.2 17.4
Undercoverage 58.8 52.6
Severe Undercoverage 57.2 48.4
Panel C: BLT 2008 - actual baseline coverage levels and UDB-based beneficiary selection
Coverage level 39 39
Leakage 34.2 31.5
Severe Leakage 27 24
Undercoverage 50.5 47.7
Severe Undercoverage 48.1 44.2
Notes: This table reports estimates of targeting errors at the same coverage levels, defined and computed
separately for the Jamkesmas and BLT 2008 programs. In all columns, households are ranked according to their
adjusted household expenditures per capita at baseline. The definition of program receipt varies across programs
and columns. Jamkesmas: In column (1), program receipt is reconstructed for each decile using the share of
households which reported to receive the program at baseline in SUSETI in each decile, applied to the number of
households deemed eligible for the program based on the UDB. In column (2), program receipt equals one if the
household's PMT score in the UDB places it within the pool of intended program recipients. BLT08: in column
(1) program receipt is as reported by households in SUSETI. In column (2), the BLT08 program receipt is based
on ranking the household PMT scores and taking all households with PMT scores up to the number of households
reporting BLT08 receipt in SUSETI.

18
Notes: This figure shows the probability of receiving each program at baseline and with the UDB as a function of adjusted
per capita expenditures, estimated using local linear regressions. Baseline program receipt and per capita expenditures are
from the SUSETI. UDB program receipt is based on beneficiary lists from the UDB. For BLT, UDB program receipt is is
based on ranking household PMT scores and taking all households with PMT scores up to the number of households
reporting BLT 2008 receipt in the SUSETI.
We finally turn to the distribution of program receipt across household per capita consumption
deciles. Figure 2 shows that targeting for all programs is rather progressive. At both baseline and with
the UDB, a larger share of households from the poorest consumption deciles is receiving benefits
from each program, compared to households from the richest consumption deciles. The graphs
confirm that the UDB leads to an improvement in the targeting performance of the three main
Indonesian social assistance programs. There is a considerable reduction in leakage with the UDB
compared to baseline. The probability to receive benefits decreases faster as per capita expenditures
increase with the UDB compared to baseline for all programs, despite the large decrease in coverage
observed for Raskin and, to a lesser extent, for Jamkesmas. At a constant coverage level (for BLT),
the difference is lower but remains significant. The difference in the slopes of the lines predicting the
probability of receiving any of the three programs at baseline and with the UDB is positive and
significant.29
This implies that targeting using the UDB is more progressive than with the previous
approaches to beneficiary selection used in Indonesia.
4.3 Disentangling Misenumeration and Misclassification
As described earlier, targeting errors in the UDB can be attributed to two factors: (1) misenumeration,
or undercoverage of poor households during the enumeration process, and (2) misclassification of
29
This is confirmed by the results of a Wald test, available upon request.
0
.2
.4
.6
.8
1
Pro
bab
ility
of
rece
ivin
g t
he
pro
gra
m
12 12.5 13 13.5 14 14.5 15
Log per capita expenditures
Raskin
12 12.5 13 13.5 14 14.5 15
Log per capita expenditures
Jamkesmas
12 12.5 13 13.5 14 14.5 15
Log per capita expenditures
BLT
Figure 2 - Program Benefit IncidenceBaseline and UDB
Baseline UDB

19
households during the PMT modeling stage. In this section, we attempt to disentangle these two
sources of errors, using ‘reconstructed’ PMT scores calculated for all households in the SUSETI
sample, instead of focusing only on those matched households who are actually registered in the
current UDB. This allows us to assess the performance of the UDB that would be observed if all
households had been registered and scored in the UDB, rather than only surveying households
expected to be poor (based on the pre-listings from poverty mapping and consultation with
community members). By simulating outcomes under this census scenario, we are able to remove
errors due to poor households not being enumerated and instead isolate the role of the PMT process in
contributing to targeting errors.
We reconstruct PMT scores for all households in the SUSETI sample by applying the PMT
algorithms used by UDB planners to the underlying PMT variables collected from each household in
SUSETI. We then calculate targeting errors by comparing program eligibility status (based on the
reconstructed PMT scores and on UDB-based coverage levels – see column (2) of Table 3a) against
household expenditure rankings (from SUSETI).
Table 4 shows the improvement in targeting errors expected under this full census scenario relative to
the UDB targeting errors presented earlier. More specifically, the measures presented in Table 4 are
computed as the difference between the targeting errors presented in Columns (1) and (2) of Tables 3a
and 3b and the ones obtained when assigning program receipt to all households with reconstructed
PMT scores below the given program eligibility threshold, as a share of the expected UDB errors
from Table 3a (Table 3b for BLT 2008):
𝐶𝑃𝑈 =𝑈𝑃𝑀𝑇𝑈𝐷𝐵
− 𝑈𝑃𝑀𝑇𝑆𝑆𝑇
𝑈𝑃𝑀𝑇𝑈𝐷𝐵
(1)
Where 𝑈 refers to the different measures of undercoverage and leakage used in the previous section;
𝑃𝑀𝑇𝑈𝐷𝐵 refers to household eligibility status based on actual PMT scores from the UDB; and
𝑃𝑀𝑇𝑆𝑆𝑇 refers to eligibility status based on PMT scores reconstructed using the underlying PMT
variables from SUSETI. A negative (positive) sign indicates a decrease (increase) in targeting errors if
all households had been registered in the UDB. Both leakage and undercoverage rates in the UDB are
projected to improve under this scenario across all programs by 11-17% and 13-17%, respectively.
The improvements are even more striking for severe leakage and particularly severe undercoverage,
with gains in the latter ranging from 27-36% across programs. In other words, it appears that
expanding the number of households enumerated in the national targeting survey holds significant
potential to improve targeting outcomes, particularly by reducing exclusion of the poor.
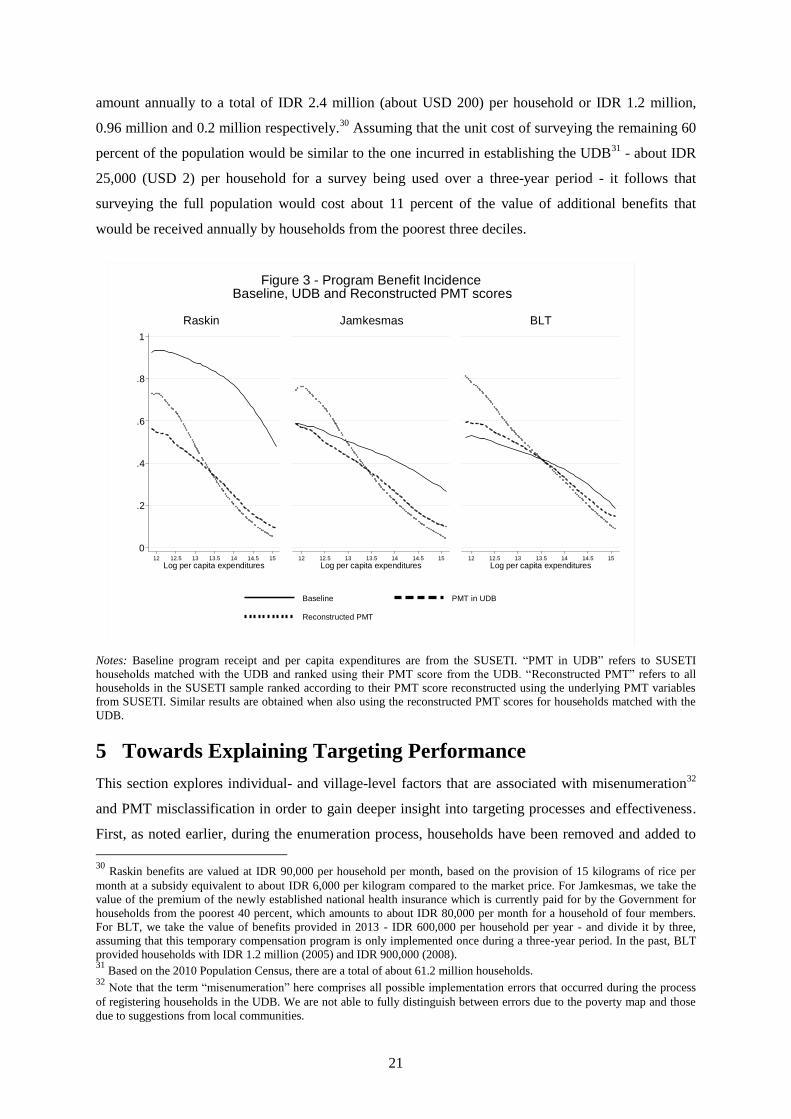
In Figure 3, we add the predicted probability of receiving program benefits based on the PMT scores
reconstructed for all households using the data collected in SUSETI to the comparison of benefit

20
incidence between baseline and UDB-based (for households registered in the UDB) program receipt
presented in Figure 2. In line with results from Table 4, households from the poorest three
consumption deciles have a higher probability of receiving program benefits when considering PMT-
specific predictions for all SUSETI households, as opposed to UDB households only. The census
scenario (reconstructed PMT scores) also leads to some improvements in leakage, as shown by the
lower program receipt probability for households from the richest half of the population.
Table 4: Expected Change in Targeting Accuracy with Full Census Enumeration
Targeting Measures Expected UDB
(%)
Full census
enumeration
(%)
Change in targeting
errors – census
compared to UDB
(%)
(1) (2) (3)
Panel A: Raskin
Leakage 23.5 19.6 -16.6
Severe Leakage 16.4 13.2 -19.5
Undercoverage 54.0 47 -13.0
Severe Undercoverage 49.6 36.1 -27.2
Panel B: Jamkesmas
Leakage 24.9 20.9 -16.1
Severe Leakage 17.4 14.2 -18.4
Undercoverage 52.6 45.2 -14.1
Severe Undercoverage 48.4 33.5 -30.8
Panel C: BLT 2008
Leakage 31.5 27.9 -11.4
Severe Leakage 24.0 19.5 -18.8
Undercoverage 47.7 39.7 -16.8
Severe Undercoverage 44.2 28.5 -35.5
Notes: This table reports estimates of UDB targeting errors based on the PMT scores of households actually
registered in the UDB (column 1), and on reconstructed PMT scores (from SUSETI variables) for all SUSETI
households, i.e. simulating a scenario of full census enumeration (column 2). For column (2), program receipt equals
one for all households with reconstructed PMT score rankings that fall below the number of households in SUSETI
that are eligible for program receipt based on the UDB. The BLT08 eligiblity is based on the same procedure as in
the previous table, i.e. on ranking the household PMT scores and taking all households with PMT scores up to the
number of households reporting BLT08 receipt in SUSETI. Change (column 3) is calculated based on equation (1).
We use the results of this exercise to demonstrate the cost-effectiveness of expanding enumeration to
cover the full population. It is estimated that, under a census scenario, households from the poorest
three deciles would be more likely to receive Raskin and Jamkesmas by about 6 percentage points,
and more likely to receive BLT by about 8 percentage points. From this we extrapolate that an
additional 1.1 million households from the poorest three deciles would receive benefits from these
three programs under a full enumeration scenario. Benefit levels of Raskin, Jamkesmas and BLT
21
amount annually to a total of IDR 2.4 million (about USD 200) per household or IDR 1.2 million,
0.96 million and 0.2 million respectively.30
Assuming that the unit cost of surveying the remaining 60
percent of the population would be similar to the one incurred in establishing the UDB31
- about IDR
25,000 (USD 2) per household for a survey being used over a three-year period - it follows that
surveying the full population would cost about 11 percent of the value of additional benefits that
would be received annually by households from the poorest three deciles.
Notes: Baseline program receipt and per capita expenditures are from the SUSETI. “PMT in UDB” refers to SUSETI
households matched with the UDB and ranked using their PMT score from the UDB. “Reconstructed PMT” refers to all
households in the SUSETI sample ranked according to their PMT score reconstructed using the underlying PMT variables
from SUSETI. Similar results are obtained when also using the reconstructed PMT scores for households matched with the
UDB.
5 Towards Explaining Targeting Performance
This section explores individual- and village-level factors that are associated with misenumeration32
and PMT misclassification in order to gain deeper insight into targeting processes and effectiveness.
First, as noted earlier, during the enumeration process, households have been removed and added to
30
Raskin benefits are valued at IDR 90,000 per household per month, based on the provision of 15 kilograms of rice per
month at a subsidy equivalent to about IDR 6,000 per kilogram compared to the market price. For Jamkesmas, we take the
value of the premium of the newly established national health insurance which is currently paid for by the Government for
households from the poorest 40 percent, which amounts to about IDR 80,000 per month for a household of four members.
For BLT, we take the value of benefits provided in 2013 - IDR 600,000 per household per year - and divide it by three,
assuming that this temporary compensation program is only implemented once during a three-year period. In the past, BLT
provided households with IDR 1.2 million (2005) and IDR 900,000 (2008). 31
Based on the 2010 Population Census, there are a total of about 61.2 million households. 32
Note that the term “misenumeration” here comprises all possible implementation errors that occurred during the process
of registering households in the UDB. We are not able to fully distinguish between errors due to the poverty map and those
due to suggestions from local communities.
0
.2
.4
.6
.8
1
Pro
bab
ility
of
rece
ivin
g t
he
pro
gra
m
12 12.5 13 13.5 14 14.5 15
Log per capita expenditures
Raskin
12 12.5 13 13.5 14 14.5 15
Log per capita expenditures
Jamkesmas
12 12.5 13 13.5 14 14.5 15
Log per capita expenditures
BLT
Figure 3 - Program Benefit IncidenceBaseline, UDB and Reconstructed PMT scores
Baseline PMT in UDB
Reconstructed PMT

22
the pre-listing of households to be surveyed constructed using the 2010 Population Census and the
Elbers et al. (2003) poverty mapping methodology. Misenumeration may occur as a result of the
addition and removal of households, if households added (removed) have on average a higher (lower)
socioeconomic status than those that end up being registered in the UDB. Second, during the PMT
modeling process, a limited number of observable household characteristics were used to predict
welfare levels. Misclassification may occur if these observable characteristics only capture a limited
share of the relevant overall variation in household welfare.
5.1 Unpacking the Enumeration Process
In this section, we consider which of the different methods used for registering households in the
UDB led to surveying poorer households. In addition to the initial roster of households to be surveyed
(pre-listing or PL), community suggestions were used to identify additional poor households during
the data collection. We also matched the SUSETI with the enumeration pre-listings, and identified
1,048 households that were removed from these pre-listings for the reason of being considered to be
rich, and are therefore not registered in the UDB. Figure 4 shows that the consumption distribution of
UDB households surveyed with the pre-listing is slightly more to the left (poorer) compared to that of
UDB households identified through community suggestions (“in UDB, not on pre-listing”), and both
of these distributions are poorer compared to households not in the UDB, in line with Figures 1a and
1b. Households that were removed from the survey enumeration pre-listing, and therefore not
registered in the UDB, have a consumption distribution that is similar to other households not
registered in the UDB.

23
To analyze further factors that predict household registration in the UDB or removal from the
enumeration pre-listing for being considered rich (see section 2.1), we estimate the following Probit
models:33
Pr(𝑈𝐷𝐵ℎ = 1 | 𝑃𝐶𝐸ℎ , 𝑿ℎ , 𝒁𝑣ℎ) = Φ(𝛼1 + 𝛽1ln(𝑃𝐶𝐸ℎ) + 𝑿ℎ′ 𝜸𝟏 + 𝒁𝑣ℎ
′ 𝜹𝟏) (2)
Pr(𝑅𝑒𝑚𝑜𝑣𝑒𝑑ℎ = 1| 𝑃𝐶𝐸ℎ , 𝑿ℎ , 𝒁𝑣ℎ) = Φ(𝛼2 + 𝛽2ln(𝑃𝐶𝐸ℎ) + 𝑿ℎ′ 𝜸𝟐 + 𝒁𝑣ℎ
′ 𝜹𝟐), (3)
Where 𝑈𝐷𝐵ℎ is equal to one if household ℎ is registered in the UDB, zero otherwise; and
𝑅𝑒𝑚𝑜𝑣𝑒𝑑ℎ is equal to one if household ℎ has been removed from the enumeration pre-listing, zero
otherwise. The set of variables X and Z are selected to reflect household- and community-level
characteristics that are not included in the process of determining enumeration quotas or the
calculation of PMT scores but that may affect misenumeration through their correlation with
household welfare and/or with local implementation features.34
At the household level, we consider as
relevant for the enumeration process several factors associated with household “hidden assets”35
,
33 Probit coefficients can be multiplied by 0.4 to obtain estimates of a magnitude comparable to that of linear probability
model estimates and quantify the marginal effect of changes in the independent variables on the conditional probability of
registration in the UDB or removal from the enumeration pre-listing (Cameron and Trivedi 2005). 34
Table A1 in Annex lists all variables and their summary statistics. 35
We use the term “hidden assets” to refer to assets that difficult to observe directly by enumerators, and therefore more
subject to being misreported. It is commonly advocated to avoid using such easily manipulable indicators for estimating
PMT scores, due to their increased probability of misreporting, especially when respondents are aware that the survey is
being conducted for the purpose of selecting beneficiaries of social assistance programs. In Colombia, Camacho and
Conover (2011) provide evidence that when the PMT formula becomes known there is an increase in misreporting to
increase one’s chances of receiving program benefits.
0
.2
.4
.6
.8
1
De
nsity
12 13 14 15 16Log household expenditures per capita
in UDB and on pre-listing in UDB, not on pre-listing
Not in UDB, on pre-listing Not in UDB, not on pre-listing
Figure 4 - Distribution of per capita expenditures, by registration channel

24
exposure to shocks, and social connectedness and position within the community. Controlling for
expenditure levels, we expect households owning hidden assets to be less likely to be registered in the
UDB and more likely to be removed from the enumeration pre-listing. On the contrary, households
that experience shocks, have more social connections and are considered poor within their community
should be more likely to be registered in the UDB. At the community level, we consider indicators of
the relative economic status of the community, as well as the potential for elite capture, proxied by the
characteristics of community (neighborhood) heads and the remoteness of the village. We expect
households living in relatively poorer communities that are less vulnerable to elite capture to be more
likely to be registered in the UDB. It should be emphasized that these regressions are merely
conditional correlations, and we do not intend to assign a causal interpretation.
Results for equation (2) are presented in Columns (1) and (2) of Table 5, while results for equation (3)
are presented in Columns (3) and (4). The negative and significant coefficient associated with
household per capita consumption is in line with the findings of Figure 1b. Interestingly, per capita
consumption has no significant correlation with the probability of being removed from the
enumeration pre-listing for the reason of being “rich”. This is consistent with recent evidence
suggesting that the definition of being poor used by communities may be only partially correlated
with household per capita consumption (Alatas et al. 2012). Alternatively, it could indicate a certain
degree of elite capture over the process of determining which households are registered in the UDB.
Conditional on their level of consumption, households that own partially hidden assets such as land or
gold are less likely to be registered in the UDB and more likely to be removed from the pre-list,
suggesting that communities may not have abused this possibility to remove households. This is
consistent with the argument that local communities have better information on the socioeconomic
status of their members (Dreze and Sen 1989).
Controlling for socioeconomic status, several proxies for social connectedness are associated with a
higher probability of being registered in the UDB. Migration is associated with a higher chance of
being registered in the UDB. Two likely explanations are that (i) migration is a way for households to
cope with economic hardship and hence these households are relatively poor, and (ii) migrants have to
register with the village head suggesting that these households, and those that have family connections
in the neighborhood (which also increase the probability of being in the UDB), are known to
community leaders and therefore less likely to be ‘missed’ during the enumeration process,
conditional on their expenditure levels. Meanwhile, proxies for household position within the
community, in particular the receipt of assistance from the community, are also associated with a
higher probability of being registered in the UDB. Interestingly, receiving non-governmental
assistance is associated with a higher probability of being removed from the enumeration pre-listing

25
and also a higher probability of ultimately being included in the UDB. Receipt of zakat36
, however, is
associated with a higher probability of being in the UDB and with a lower probability of being
removed from the pre-listing. Again, this suggests the coexistence of different definitions of poverty
used by communities (Alatas et al. 2012). There may also be a concern for fairness within
communities, and as a result, households that have access to alternative forms of support when facing
hardship may be more likely to be removed from the pre-listing.
At the community level, having an RT head who considers the district to be poorer than other districts
is associated with a higher probability of being enumerated. This is in line with the findings of
SMERU (2012) indicating that community leaders were reluctant to survey a high number of
households, and particularly those not considered to be poor, as this would raise households’
expectations about receiving program benefits. Among indicators of the potential for elite capture,
households in communities where the RT head declares to know very well each community member
have a lower probability of being removed from the enumeration pre-listing. Village remoteness is
negatively associated with being registered in the UDB and positively with being removed from
enumeration pre-listings, all else equal. These areas may be more difficult or more costly for
enumerators to reach, and supervision of enumerators may be lacking in these areas, potentially
leading to local leaders having more leeway in removing people from the pre-listing (even if they
deserve to be registered in the UDB).
36
The reception of zakat is also included in the non-governmental assistance dummy (and in the annual per capita value),
which also comprises assistance received from religious or political institutions, as well as from national and international
NGOs, firms/corporations and other private donors. Assistance received in response to disaster is excluded.

26
Table 5: Hidden household- and village-level characteristics associated with being registered in the UDB
Pr(in the UDB) Pr(HH removed from PL)
(1) (2) (3) (4)
Log per capita expenditures -0.512*** -0.501*** -0.029 -0.019
(0.051) (0.052) (0.056) (0.058)
Asset: Land -0.162*** -0.173*** 0.277*** 0.264***
(0.061) (0.058) (0.075) (0.077)
Asset: Jewelry or Gold/Savings >= Rp 500,000 -0.346*** -0.334*** 0.117** 0.124**
(0.038) (0.037) (0.050) (0.049)
Asset: Livestock with value>= Rp 500,000 -0.028 -0.047 0.272*** 0.249***
(0.055) (0.054) (0.051) (0.052)
HH experienced a shock in past year 0.046 0.031 0.070* 0.066
(0.048) (0.047) (0.038) (0.041)
Nb of family members living in the same RW/RT 0.022** 0.016* 0.012 0.009
(0.010) (0.010) (0.010) (0.011)
At least 1 HHM migrated 0.085** 0.095** 0.030 0.037
(0.042) (0.040) (0.040) (0.040)
At least 1 HHM participates in a community group 0.024 0.035 0.009 0.004
(0.047) (0.050) (0.072) (0.070)
Assistance from non-gvt institution, past year 0.473* 0.384 0.784** 0.720**
(0.256) (0.253) (0.335) (0.340)
Reception of zakat, past year 0.435*** 0.462*** -0.214*** -0.218***
(0.044) (0.041) (0.061) (0.061)
Log per capita value of total non-gvt assistance, past year -0.042 -0.032 -0.087** -0.077**
(0.028) (0.027) (0.035) (0.035)
UDB enumeration quotas, %village population
0.921***
0.674***
(0.171)
(0.163)
Village is much or slightly poorer than other villages in district
-0.014
-0.083
(0.079)
(0.087)
Village has similar income level as other villages in district
-0.059
-0.079
(0.081)
(0.083)
District is much or slightly poorer than other districts
0.092*
-0.070
(0.052)
(0.043)
Log distance btw village and district capital
-0.061
-0.093*
(0.052)
(0.056)
RT head knows each community member very well
-0.087
-0.009
(0.061)
(0.068)
RT head is elected
-0.110*
0.125**
(0.056)
(0.059)
Observations 5,680 5,680 5,680 5,680
Pseudo R-squared 0.113 0.129 0.0557 0.0673
Notes: This table reports the results of Probit estimates of the probability of being registered in the UDB - columns (1) and (2) - and of
being removed from the enumeration pre-listing for being considered rich - columns (3) and (4). Excluding log per capita expenditures
from the regressions does not alter any of the main qualitative and quantitative results. All regressions include district fixed effects, and
standard errors are clustered at the subdistrict level. *** p<0.01, ** p<0.05, * p<0.1
27
5.2 Unpacking the PMT Classification
In this section, we examine the determinants of the gap between a household’s actual per capita
consumption and its PMT score, which indicates the extent of targeting errors due to PMT
misclassification. In particular, we estimate the following two regressions:
ln (𝑃𝐶𝐸ℎ
𝑃𝑀𝑇_𝑈𝐷𝐵ℎ) = 𝛼1 + 𝑿ℎ
′ 𝜸𝑈𝐷𝐵1 + 𝒁𝑣ℎ
′ 𝜹𝑈𝐷𝐵1 + 𝜀𝑣ℎ
1 (4)
ln (𝑃𝐶𝐸ℎ
𝑃𝑀𝑇_𝑆𝑆𝑇ℎ) = 𝛼2 + 𝑿ℎ
′ 𝜸𝑆𝑆𝑇2 + 𝒁𝑣ℎ
′ 𝜹𝑆𝑆𝑇2 + 𝜀𝑣ℎ
2 (5)
The more positive the dependent variable is for a household, the greater the extent that the PMT score
underestimates actual consumption (i.e., potential inclusion error). Conversely, the more
negative ln (𝑃𝐶𝐸ℎ
𝑃𝑀𝑇ℎ) is, the greater the extent that the PMT score overestimates actual consumption (i.e.
potential exclusion error). The difference between equations (4) and (5) is similar to the difference
between the targeting error results presented in Tables 3 and 4. Equation (4) estimates the correlation
between misclassification and household and community characteristics conditional on being actually
registered in the UDB, and uses household PMT scores from the UDB. By relaxing this sample
restriction and considering all SUSETI households based on their reconstructed PMT scores in
equation (5), we are able to isolate the influence of the PMT process. Results for equation (4) are
presented in columns 1 and 2 of Table 6, and results for equation (5) are in columns 3 and 4.
Across all specifications, ownership of hidden assets of a value equal to or above IDR 500,000 (about
40 USD) is associated with under-prediction of household consumption by the PMT formulas. All
else equal, actual expenditures of households owning such assets are between 6 and 14% higher on
average than their estimated PMT scores. This is relatively unsurprising. However, these partially
hidden assets are not typically used in PMT-based scoring because they are not easily verifiable and
are therefore more likely to be manipulated by households. The occurrence of a shock at the
household level in the past year is also significantly associated with potential leakage – with actual
per capita expenditures on average 4% higher than PMT scores, conditional on being registered in the
UDB. This can be considered an “acceptable” inclusion error, as shocks may render these households
vulnerable to being poor. Moreover, receiving non-governmental assistance and/or zakat is associated
with having a PMT score, or predicted welfare level, between 10 and 50% higher than actual per
capita expenditures. This further suggests that communities use a different definition of poverty.
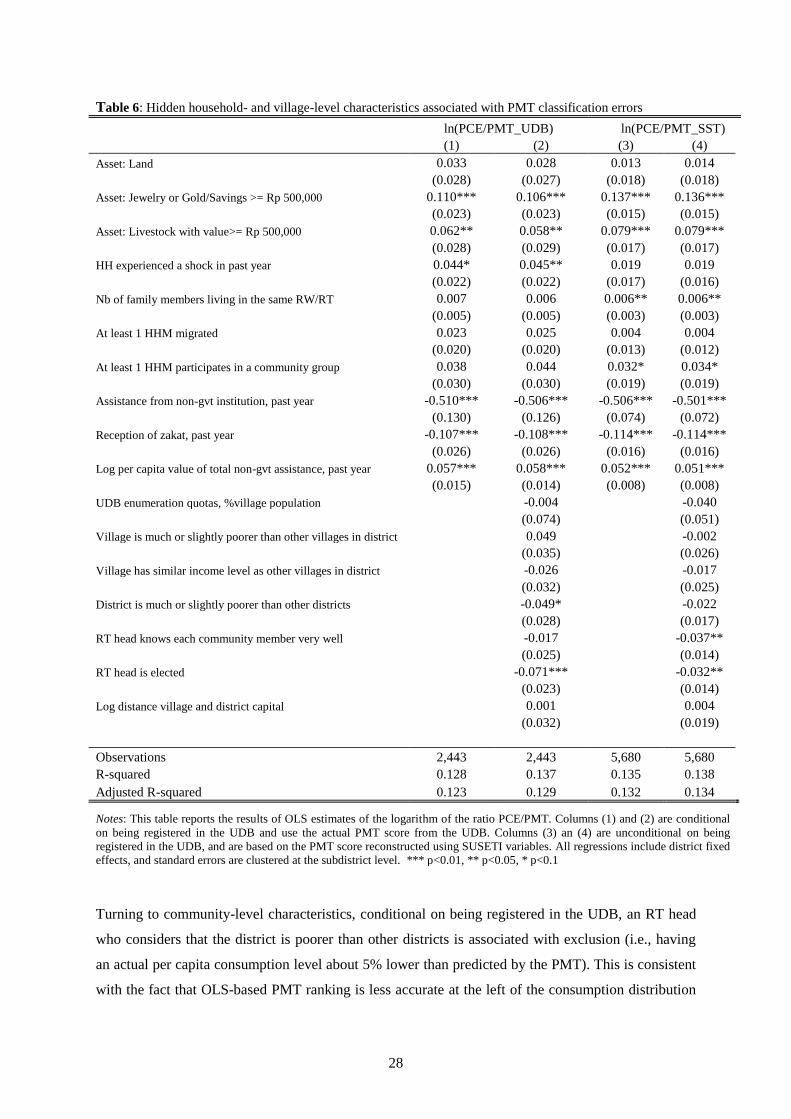
28
Table 6: Hidden household- and village-level characteristics associated with PMT classification errors
ln(PCE/PMT_UDB) ln(PCE/PMT_SST)
(1) (2) (3) (4)
Asset: Land 0.033 0.028 0.013 0.014
(0.028) (0.027) (0.018) (0.018)
Asset: Jewelry or Gold/Savings >= Rp 500,000 0.110*** 0.106*** 0.137*** 0.136***
(0.023) (0.023) (0.015) (0.015)
Asset: Livestock with value>= Rp 500,000 0.062** 0.058** 0.079*** 0.079***
(0.028) (0.029) (0.017) (0.017)
HH experienced a shock in past year 0.044* 0.045** 0.019 0.019
(0.022) (0.022) (0.017) (0.016)
Nb of family members living in the same RW/RT 0.007 0.006 0.006** 0.006**
(0.005) (0.005) (0.003) (0.003)
At least 1 HHM migrated 0.023 0.025 0.004 0.004
(0.020) (0.020) (0.013) (0.012)
At least 1 HHM participates in a community group 0.038 0.044 0.032* 0.034*
(0.030) (0.030) (0.019) (0.019)
Assistance from non-gvt institution, past year -0.510*** -0.506*** -0.506*** -0.501***
(0.130) (0.126) (0.074) (0.072)
Reception of zakat, past year -0.107*** -0.108*** -0.114*** -0.114***
(0.026) (0.026) (0.016) (0.016)
Log per capita value of total non-gvt assistance, past year 0.057*** 0.058*** 0.052*** 0.051***
(0.015) (0.014) (0.008) (0.008)
UDB enumeration quotas, %village population
-0.004
-0.040
(0.074)
(0.051)
Village is much or slightly poorer than other villages in district
0.049
-0.002
(0.035)
(0.026)
Village has similar income level as other villages in district
-0.026
-0.017
(0.032)
(0.025)
District is much or slightly poorer than other districts
-0.049*
-0.022
(0.028)
(0.017)
RT head knows each community member very well
-0.017
-0.037**
(0.025)
(0.014)
RT head is elected
-0.071***
-0.032**
(0.023)
(0.014)
Log distance village and district capital
0.001
0.004
(0.032)
(0.019)
Observations 2,443 2,443 5,680 5,680
R-squared 0.128 0.137 0.135 0.138
Adjusted R-squared 0.123 0.129 0.132 0.134
Notes: This table reports the results of OLS estimates of the logarithm of the ratio PCE/PMT. Columns (1) and (2) are conditional
on being registered in the UDB and use the actual PMT score from the UDB. Columns (3) an (4) are unconditional on being
registered in the UDB, and are based on the PMT score reconstructed using SUSETI variables. All regressions include district fixed
effects, and standard errors are clustered at the subdistrict level. *** p<0.01, ** p<0.05, * p<0.1
Turning to community-level characteristics, conditional on being registered in the UDB, an RT head
who considers that the district is poorer than other districts is associated with exclusion (i.e., having
an actual per capita consumption level about 5% lower than predicted by the PMT). This is consistent
with the fact that OLS-based PMT ranking is less accurate at the left of the consumption distribution

29
(Grosh and Baker 1995), making the distinction between relatively poor households more difficult.37
Also consistent with this premise is the correlation of the RT head being elected with having a PMT
score higher than actual consumption, both conditional and unconditional on being registered in the
UDB. Indeed, although each district government has produced specific regulations regarding the
organization of neighborhood associations since 1999(Kurasawa 2009), RT heads are more often
elected in rural areas, which are characterized by a higher poverty incidence.
6 Concluding remarks
This paper evaluates the effectiveness of the world’s largest targeting system for delivering social
program benefits. We show that the use of the Unified Database for Social Protection Programs
(UDB) in Indonesia is expected to significantly reduce leakage of benefits to non-poor households.
However, undercoverage remains relatively high and is due largely to the difficulties of enumerating
the right households for inclusion in the UDB. We indeed predict a decrease in undercoverage by
about 30 percent under a simulation that considers enumerating and estimating PMT scores for all
households (as in a census), compared to focusing only on households that have been registered in the
UDB. This is the first paper to identify the relative importance of enumeration versus PMT errors in
determining the overall effectiveness of a large-scale targeting system.
About 25 million households were surveyed for the UDB using the combination of poverty maps and
suggestions from communities, at a relatively low cost of around USD 2 per household. Based on the
findings that targeting accuracy may be improved through more extensive coverage of households, we
propose two practical strategies that could be used to achieve this for Indonesia’s UDB, as well as for
other countries developing similar national targeting registries.
The first proposed strategy is to increase the number of households enumerated in the national
targeting registry survey. One option is to conduct a census of the full population (rather than only
select households expected to be poor), as we have simulated in this paper. While it is commonly
argued that it is too expensive to visit the entire population, we find that surveying the remaining 60
percent of the population would (only) cost about 11 percent of the value of additional benefits that
would be received by households from the poorest three deciles nationally – assuming a one-third
improvement in undercoverage and that the data collected is used for three years. If conducting a full
census is nevertheless considered cost-prohibitive, a related option would be to first identify the
poorest areas based on small-area poverty maps, and then survey all households in these geographic
areas.
37
Part of the literature advocates using alternative statistical approaches, given the inaccuracy of OLS-based PMT
estimations at the bottom of the distribution. Muller and Bibi (2010), for instance, provide evidence that censored quantile
regressions anchored on the first decile minimize undercoverage.

30
The second proposed strategy, which could be combined with the first, is to transform the household
targeting system registration into a more open process in order to allow greater entry. Other countries,
like Colombia and the Philippines, combine a complete census in the poorest areas with on-demand
applications (also referred to as self-targeting) in other areas, in an attempt to survey as many poor
households as possible while maintaining relatively low total registration costs. In an on-demand
approach, households that consider themselves eligible for a given program are allowed to apply for
being included in the registry. In a randomized pilot experiment in Indonesia, Alatas et al. (2013b)
find that self-targeting leads to similar undercoverage as full enumeration at a lower overall cost,
since it surveys fewer households. However, further research is needed to assess the cost-effectiveness
of these different strategies, especially given evidence from this study that self-targeting excludes
some of the poorest households—that do not apply—and leads to higher costs directly incurred by
households (Alatas et al. 2013b).
Either of these strategies could be further bolstered with greater focus on improving the cost-
effectiveness of the household registration process. For instance, one cost-effective alternative may
be to shorten the targeting questionnaire to allow a larger number of households to be surveyed at a
lower cost, which might not necessarily come at the expense of targeting accuracy. Indeed, Bah
(2013) shows that going from 10 to 30 indicators included in a PMT formula does not significantly
increase the accuracy of predicted household poverty levels nor reduce targeting errors.38
Lastly, the targeting accuracy results in this paper are based on the assumption of perfect (or strong)
correspondence between the beneficiary lists from the UDB registry and the households who actually
end up receiving social program benefits. A growing literature examining the political economy of
targeting provides evidence that in practice, official beneficiary lists may be modified in the field,
which may positively or negatively affect targeting outcomes.39
In Indonesia, past research suggests
some departures although overall adherence to official beneficiary lists has typically been quite high
(World Bank 2012). Such targeting rule violations may prove beneficial if they allow the community
to exert their greater ability to identify the very poor (Alatas et al. 2012), or if the capture of program
benefits by the local elite is limited or generates relatively small welfare losses (Alatas et al. 2013a).
By contrast, in the case of India’s Below-Poverty Line (BPL) cards, Niehaus and Atanassova (2013)
provide evidence that targeting rule violations by local officials are due to corrupt behavior, which
38
Dreze and Khera (2010) go even further by proposing to use simplified targeting criteria so that “every household can
attribute its inclusion in, or exclusion from, the list to a single criterion”. Results from Niehaus and Atanassova (2013)
justify this argument: increasing the number of poverty indicators used to assess household socioeconomic status can have
adverse effects in terms of targeting outcomes as it makes eligibility less transparent and therefore more subject to
manipulation by corrupt agents at the local level. 39
Camacho and Conover (2011) identify manipulation of eligibility scores by local officials, especially around the time of
local elections in Colombia. In the case of India’s Below-Poverty Line (BPL) cards, Niehaus and Atanassova (2013) provide
evidence of targeting rule violations by local officials that are due to corrupt behavior. They argue that the addition of
poverty indicators into targeting formulas undermines targeting effectiveness. As a result, BPL’s “de facto” allocation is
much less progressive than the “de jure” allocation, as the use of more poverty indicators makes eligibility less transparent
and thereby facilitates violations of the official rules.

31
renders BPL’s “de facto” allocation much less progressive than the “de jure” allocation. Future
research should combine the methods for evaluating targeting effectiveness that we advocate in this
paper with an assessment of eligibility adherence in the field to identify which effects prevail overall.
References
Acosta, P., P. Leite, and J. Rigolini (2011), “Should Cash Transfers Be Confined to the Poor?
Implications for Poverty and Inequality in Latin America”, IZA Policy Paper No. 34.
Alatas, V., A. Banerjee, R. Hanna, B. A. Olken, and J. Tobias (2012), “Targeting the Poor: Evidence
from a Field Experiment in Indonesia”, The American Economic Review, 102(4): 1206-40.
Alatas, V., A. Banerjee, R. Hanna, B. A. Olken, R. Purnamasari, and M. Wai-Poi (2013a), “Does Elite
Capture Matter? Local Elites and Targeted Welfare Programs in Indonesia”, Working Paper 18798,
National Bureau of Economic Research.
Alatas, V., A. Banerjee, R. Hanna, B. A. Olken, R. Purnamasari, and M. Wai-Poi (2013b), “Ordeal
Mechanisms in Targeting: Theory and Evidence from a Field Experiment in Indonesia”, Working
Paper 19127, National Bureau of Economic Research
Bah, A. (2013), “Finding the Best Indicators to Identify the Poor”, Working Paper 01-2013, Jakarta,
Indonesia: The National Team for the Acceleration of Poverty Reduction (TNP2K).
Banerjee, A., E. Duflo, R. Chattopadhyay, and J. Shapiro. 2007. “Targeting Efficiency: How Well can
We Identify the Poor?,” Institute for Financial Management and Research Centre for Micro Finance,
Working Paper Series No. 21.
Bazzi, S., S. Sumarto, and A. Suryahadi (2014), “It’s All in the Timing: Cash Transfers and
Consumption Smoothing in a Developing Country”, Unpublished manuscript.
Camacho, A., and E. Conover (2011), “Manipulation of Social Program Eligibility”, American
Economic Journal: Economic Policy, 3(2): 41-65.
Cameron, A. C., and P. K. Trivedi (2005), Microeconometrics: Methods and Applications.
Cambridge, UK: Cambridge University Press.
Castañeda, T., K. Lindert, B. de la Brière, L. Fernandez, C. Hubert, O. Larrañaga, M. Orozco, and R.
Viquez (2005), “Designing and Implementing Household Targeting Systems: Lessons from Latin
America and the United States”, Social Protection Discussion Paper Series No. 0526. The World
Bank: Washington, DC.

32
Coady, D., M. Grosh, and J. Hoddinott (2004), “Targeting Outcomes Redux”, The World Bank
Research Observer, 19(1): 61-85.
Coady, D., and E. Skoufias (2004), “On the Targeting and Redistributive Efficiencies of Alternative
Transfer Instruments”, Review of Income and Wealth 50(1): 11-27.
Coady, D., and E. Skoufias (2007), “Are the Welfare Losses from Imperfect Targeting Important?”
Economica 74: 756-776.
Coady, D. P., and S. W. Parker (2009), “Targeting Performance under Self‐selection and
Administrative Targeting Methods”, Economic Development and Cultural Change, 57(3): 559-587.
Coady, D., Martinelli, C., and S. W. Parker (2013), “Information and participation in social
programs”, The World Bank Economic Review, 27(1): 149-170.
Cornia, G. A., and F. Stewart (1995), “Two Errors of Targeting”. In D. van de Walle and K. Nead
(Eds.), Public Spending and the Poor: Theory and Evidence (pp. 350-386). Baltimore, MD: Johns
Hopkins University.
Dreze, J., and A. Sen. (1989), Hunger and Public Action. Oxford: Oxford University Press.
Dreze, J., and R. Khera (2010), “The BPL Census and a Possible Alternative,” Economic & Political
Weekly, 45(9): 54-63.
Elbers, C., J. O. Lanjouw, and P. Lanjouw (2003), “Micro-Level Estimation of Poverty and
Inequality,” Econometrica, 71(1), 355-364.
Grosh, M., and J. Baker (1995), “Proxy-Means Tests for Targeting Social Programs: Simulations and
Speculation”, Working Paper No. 118, Living Standards Measurement Study, Washington DC: The
World Bank.
International Labor Organization (2010), Extending Social Security to all: A Guide through
Challenges and Options. Geneva: International Labour Organisation.
Karlan, D., and B. Thuysbaert (2013), “Targeting Ultra-poor Households in Honduras and Peru”, Yale
University Economic Growth Center Discussion Paper No. 1033; Yale Economics Department
Working Paper No. 125. Available at SSRN: http://ssrn.com/abstract=2351553
Kurasawa, A. (2009), “Swaying between State and Community: the Role of RT/RW in post-Suharto
Indonesia”. In Local Organizations and Urban Governance in East and Southeast Asia: Straddling
State and Society, eds. B. L. Read and R. Pekkanen, pp. 58-83. London and New York: Routledge.

33
Muller, C., and S. Bibi, (2010), “Refining Targeting against Poverty Evidence from Tunisia”, Oxford
Bulletin of Economics and Statistics, 72(3): 381-410.
Niehaus, P., and A. Atanassova (2013), “Targeting with Agents”, American Economic Journal:
Economic Policy, 5(1): 206-238.
Skoufias, E., B. Davis, and S. De La Vega (2001), “Targeting the Poor in Mexico: an Evaluation of
the Selection of Households into PROGRESA”, World Development, 29(10): 1769-84.
Skoufias, E., and D. P. Coady (2007) “Are the welfare losses from imperfect targeting important?”,
Economica, 74(296): 756-776.
SMERU (2006), Rapid Appraisal of the Implementation of the 2005 Direct Cash Transfer Program in
Indonesia: A Case Study in Five Kabupaten/Kota, Research Report, Jakarta, Indonesia: SMERU
Research Institute.
SMERU (2012), Rapid Appraisal of the 2011 Data Collection of Social Protection Programs (PPLS
2011), Jakarta, Indonesia: SMERU Research Institute and Tim Nasional Percepatan Penanggulangan
Kemiskinan (TNP2K).
Sumarto, S., D. Suryadarma, and A. Suryahadi (2007), “Predicting Consumption Poverty using Non-
Consumption Indicators: Experiments using Indonesian Data,” Social Indicators Research, 81(3):
543-578.
TNP2K (2014), Pembangunan Basis Data Terpadu Untuk Mendukung Program Perlindungan Sosial,
Jakarta, Indonesia: Tim Nasional Percepatan Penanggulangan Kemiskinan (TNP2K).
World Bank (2012), Targeting Poor and Vulnerable Households in Indonesia. Public expenditure
review (PER). Washington D.C. - The World Bank. http://documents.worldbank.org/curated/en/
2012/01/15879773/targeting-poor-vulnerable-households-indonesia

34
Figure A1: the Establishment of the UDB

Table A1: List of household- and community-level explanatory variables
Variables Mean SD Min Max
Panel A: household-level variables
Hidden assets
Asset: Land 85.34
Asset: Jewelry or Gold/Savings >= Rp 500,000 44.30
Asset: Livestock with value>= Rp 500,000 22.26
Exposure to shock
HH experienced a shock in past year 24.08
Social connectedness
Nb of family members living in the same RW/RT 2.36 2.26 0.00 20.00
At least 1 HHM migrated 40.87
At least 1 HHM participates in a community group 78.85
Position within the community
Assistance from non-gvt institution, past year 86.73
Reception of zakat, past year 34.95
(Log) Per capita value of total non-gvt assistance, past year 8.09 3.31 0.00 15.43
Panel B: community-level variables
Community relative economic status
UDB enumeration quotas, %village population 0.51 0.21 0.04 0.99
Village is much or slightly poorer than other villages in district 48.24
Village has similar income level as other villages in district 39.05
District is much or slightly poorer than other districts 50.07
Potential for elite capture
(Log) distance btw village and district capital 3.58 0.59 1.10 5.25
RT head knows each community member very well 72.91
RT head is elected 53.29
Notes: At the household level, partially hidden assets considered include land, jewelry, savings and livestock of a value larger than IDR 500,000
(about USD 40). The shock variable is a dummy equal to one if the household has experienced the death or serious illness of a household member,
the loss of employment, harvest or business failure or a natural disaster between the baseline and end line SUSETI surveys (i.e. between January 2011 and February 2012). Social connectedness variables include the number of other family members living in the same neighborhood, as well as
dummy variables for whether at least one household member migrated and participates in a community group. Variables translating household’s
socioeconomic position as viewed by the community include the reception of assistance from the non-governmental institutions and its per capita value, and the reception of zakat (religious assistance distributed through the mosque). The reception of zakat is also included in the non-
governmental assistance dummy (and in the annual per capita value), which excludes disaster-related assistance, but includes assistance received
from religious or political institutions, as well as from national and international NGOs, firms/corporations and other private donors. At the community level, indicators of the relative position of the community include the UDB enumeration quotas as a share of total village population, as
well as RT heads’ perception regarding whether the village in which the neighborhood is located is poorer or similar to other villages within the
district, and whether the district is poorer than other districts in the province. Indicators of the potential or elite capture include the (logarithm) of the distance between the village and the district capital, from the 2011 Village Census survey (PODES – Potensi Desa) conducted in Indonesia
every 3 years, and dummies equal to one if the RT head is elected and if he/she declares knowing very well each member of the community.