finnish banking 2016 - finanssiala · the finnish economy began to recover towards the end of 2016....
TRANSCRIPT

22 May 2017
FINNISH BANKING 2016
Financial overview of Finnish banks
1
Finnish Banking 2016
Contents
1 Economic environment ..................................................................................................................... 2
2 Banks’ performance in a nutshell ..................................................................................................... 3
3 Banks operating in Finland ............................................................................................................... 4 3.1 Market shares of credit institutions in Finland ............................................................... 5 3.2 Banking group employees and offices .......................................................................... 6 3.3 Faster growth in lending than in the rest of the euro area ............................................. 7 3.4 Banks’ funding favoured longer maturity periods .......................................................... 9 3.5 Low interest rate level and compulsory payments weigh down net interest income .... 10 3.6 Finnish banks’ capital adequacy strongest in Europe ................................................. 12 3.7 Banking sector’s profitability weakened slightly .......................................................... 13
2
Finnish Banking 2016
Finnish Banking 2016
1 Economic environment
The Finnish economy began to recover towards the end of 2016. Unemployment decreased and consumer confidence improved. Construction investments increased notably and private consumption grew. Inflation was still slow and housing prices grew very moderately.
The European Central Bank (ECB) maintained its expansionary monetary policy stance. In March 2016, the ECB dropped its key interest rates to zero and its deposit facility rate to negative 0.4%. The ECB also expanded its asset purchase programme.
The regulatory environment was rather active in 2016. The Finnish Financial Supervisory Authority (FIN-FSA) implemented national loan cap regulation at the start of July. The loan-to-value cap on mortgage loans limits a housing loan to a maximum of 90% (95% for first-time home buyers) of the current value of the collateral posted at the time of loan approval. FIN-FSA also decided that credit institutions which use their own internal ratings-based (IRB) approaches would be set a minimum level for the average risk weight on their mortgage portfolios. The risk weight floor was initially set at 10%, but FIN-FSA raised the requirement to 15% in its March 2017 decision. The floor is to come into effect on 1 January 2018.
Additional capital buffer requirements for credit institutions that have systemic importance in the domestic financial market (O-SII buffers) entered into force at the start of 2016. FIN-FSA imposed the additional buffers to four credit institutions: Nordea Bank Finland and OP Financial Group are required to meet additional capital buffers of 2%, and Municipality Finance and Danske Bank Finland are required to meet additional capital buffers of 0.5%.
In terms of European events, the Single Resolution Mechanism ‒ the second pillar of the Banking Union ‒ became operational at the start of 2016. The Single Resolution Board is in charge of the resolution of major banks in the euro area as the decision-making body of the mechanism.
At the end of 2016, the Commission published a regulatory package that, among other aims, was meant to improve the resilience of banks. The package also introduced a binding net stable funding ratio (NSFR) requirement, which is expected to come into effect sometime in 2019–2020.

3
Finnish Banking 2016
2 Banks’ performance in a nutshell
The zero interest rate environment continues to put strain on banks' net interest income, which in total fell about 4% from the previous year. Net interest income weakened also because the stability fees paid to the Single Resolution Fund were recorded as interest expenses.
The operating costs of the sector rose by 2%. Underlying factors included, for example, growing investments in digitalisation and service development. On the other hand, impairment losses from credits and other commitments shrank nearly by one fifth.
Finnish banks’ Common Equity Tier 1 (CET1) capital ratio rose to 21.7% at the end of the year. The revised capital requirements regulation was implemented in Finland in 2014. Since the entry into force of the new Basel III regulation, the CET1 has increased as much as 6.9 percentage points. The Finnish banking sector’s risk-bearing capacity is now among the strongest in Europe; the average CET1 ratio in the EU banking sector was 14.4% at the end of 2016.
The Finnish banking sector’s return on equity (ROE) was about 8.2%, whereas other similar Nordic banks had an average ROE of 12.5%.1 The average ROE for all EU banking sectors was 3.3%.
Banks operating in Finland meet the Liquidity Coverage Ratio (LCR) requirement by a wide margin. At the end of 2016, the Finnish banking sector's LCR was 143%. The LCR came gradually into effect as from October 2015. The LCR requirement was 70% in 2016 but was increased to 80% at the turn of 2017. From January 2018 onward, the requirement will be implemented to its full extent of 100%. This means banks need a much larger liquidity buffer with which to tide over short-term severe disturbances in the market. The majority of Finnish banks’ liquidity buffers consist of central bank deposits, covered bonds and government bonds.
The leverage ratio of the Finnish banking sector improved to 5.9% at the end of the year. In November 2016, the EU Commission proposed that the leverage ratio requirement be set at 3%. This binding requirement is expected to come into effect in January 2019 at the earliest.

4
Finnish Banking 2016
3 Banks operating in Finland
At the end of 2016, there were 274 credit institutions operating in Finland. This is 7 fewer than at the end of 2015. The change was mainly due to mergers among cooperative banks and savings banks. Credit institutions include deposit banks and other credit institutions that do not take deposits, such as finance houses, credit card companies, mortgage credit banks, and Municipality Finance plc.
Most Finnish credit institutions are part of a banking group or amalgamation. Calculated by group, there were 12 Finnish2 banking groups or amalgamations3 at the end of 2016.
The largest Finnish banking group by its market share is OP Financial Group, which in recent years has expanded its operations outside of the traditional financial sector. OP Financial Group is under the ECB’s direct supervision.
The second largest banking group at year-end 2016 was Nordea Finland Group. In March 2016, the Nordea annual general meeting approved the plan to merge its Nordic subsidiaries into the Swedish parent bank, turning them into branches. The merger was carried out on 2 January 2017. The main responsibility for the supervision of all the Nordea branches now lies with the Swedish Financial Supervisory Authority, removing them from under the direct supervision of the ECB. In Finland the merger process included the setting up of Nordea Mortgage Bank plc, which issues mortgage-backed covered bonds.
Danske Bank Finland and Municipality Finance are nearly equal in terms of their balance sheets. They are both under the direct supervision of the ECB. Danske Bank has announced its plans to become a branch in Finland like Nordea.
Except for the abovementioned four, all the other credit institutions in Finland are under the direct supervision of the Finnish Financial Supervisory Authority (FIN-FSA).
Finnish banking groups and foreign deposit-taking banks’ Finnish branches employed a total of 28,491 people at the end of 2016. A banking group's number of employees also includes persons who, for example, work in insurance and asset management, if the parent group provides these services. The statistics also include the small number of employees in Finnish banking groups' branches abroad.
At the end of 2016, Finnish banking groups had 1,063 offices in Finland, which is 49 offices fewer than the year before. The pared down number of offices is the result of mergers, improved efficiency of functions, and customer service moving to digital channels.
2 Finnish here refers to parent and subsidiary companies and deposit-bank amalgamations that are subject to the Finnish
Limited Liability Companies Act. 3 Nordea Bank Finland, OP Financial Group, Danske Bank Group, Municipality Finance, Savings Bank Group, Aktia Group, S-
Bank group, Bank of Åland plc, Pop Bank Group, Hypo Group, Oma Säästöpankki, and Evli Group.

5
Finnish Banking 2016
3.1 Market shares of credit institutions in Finland4
Figure 1. Credit institutions’ non-MFI loans in Finland, market shares on 31 Dec 2016
Figure 2. Credit institutions’ non-MFI deposits in Finland, market shares on 31 Dec 2016
4 OP Financial Group: OP Corporate Bank plc, Helsinki Area Cooperative Bank, OP Card Company plc, OP Mortgage Bank,
OP Process Services Ltd, and banks in the Amalgamation of OP Financial Group cooperative banks. Nordea Bank Finland: Nordea Bank Finland plc, Nordea Mortgage Bank plc, and Nordea Finance Finland Ltd Danske Bank Group: Danske Bank plc and Helsinki Branch of Danske Bank A/S Handelsbanken group: Svenska Handelsbanken AB (publ), Branch Operation in Finland, Handelsbanken Finans Abp, Handelsbanken Finans Aktiebolag (publ), Branch Operation in Finland, and Stadshypotek AB (publ), Branch Operation in Finland Aktia Bank plc group: Aktia Bank plc and Aktia Real Estate Mortgage Bank plc Savings Bank Group: Savings Bank Group: Savings banks and Central Bank of Savings Banks Finland Ltd (excl. Oma Säästöpankki, which is included in category "others") POP Bank Group: POP Banks and Bonum Bank Others: Other credit institutions operating in Finland, e.g. S-Bank and Municipality Finance

6
Finnish Banking 2016
3.2 Banking group employees and offices

7
Finnish Banking 2016
3.3 Faster growth in lending than in the rest of the euro area
The Finnish corporate loan portfolio (housing companies included) grew by a bit under 5% in 2016. This was mainly from loans to housing companies. Since 2010, corporate lending in Finland has grown faster than in the rest of the euro area. In the euro area, the corporate loan portfolio kept shrinking between 2012 and 2015, but turned upward during 2016. Among the largest euro countries, corporate lending has shrunk in Spain but grown in France and Germany. In Italy growth has been close to zero. ECB’s expansionary monetary policy has been aimed at improving financial conditions in the real economy, and indeed seems to be taking effect in the recovering corporate loan portfolios.
Figure 3. Corporate lending in the euro area and Finland (12-month growth rate, %)
Finnish households’ housing loan portfolio also grew faster than in the rest of the euro area. The low interest rate level was a major contributing factor to this growth rate, but it was also helped by the grace periods offered by certain banks. The Finnish economy recovered towards the end of the year with improved employment and consumer confidence evident in the increased demand for housing loans.
The Finnish Financial Supervisory Authority (FIN-FSA) implemented a national loan cap regulation in Finland at the start of July 2016. The loan-to-value cap on mortgage loans limits a housing loan to a maximum of 90% (95% for first-time home buyers) of the current value of the collateral posted at the time of loan approval.
FIN-FSA also decided that credit institutions which use their own internal ratings-based (IRB) approaches would be set a minimum level for the average risk weight on their mortgage portfolios. The risk weight floor was initially set at 10%, but FIN-FSA raised the requirement to 15% in its March 2017 decision. The floor is to come into effect on 1 January 2018.
The abovementioned regulatory measures are so-called macro-prudential tools, utilised for purposes such as restraining households’ over-indebtedness.
8
Finnish Banking 2016
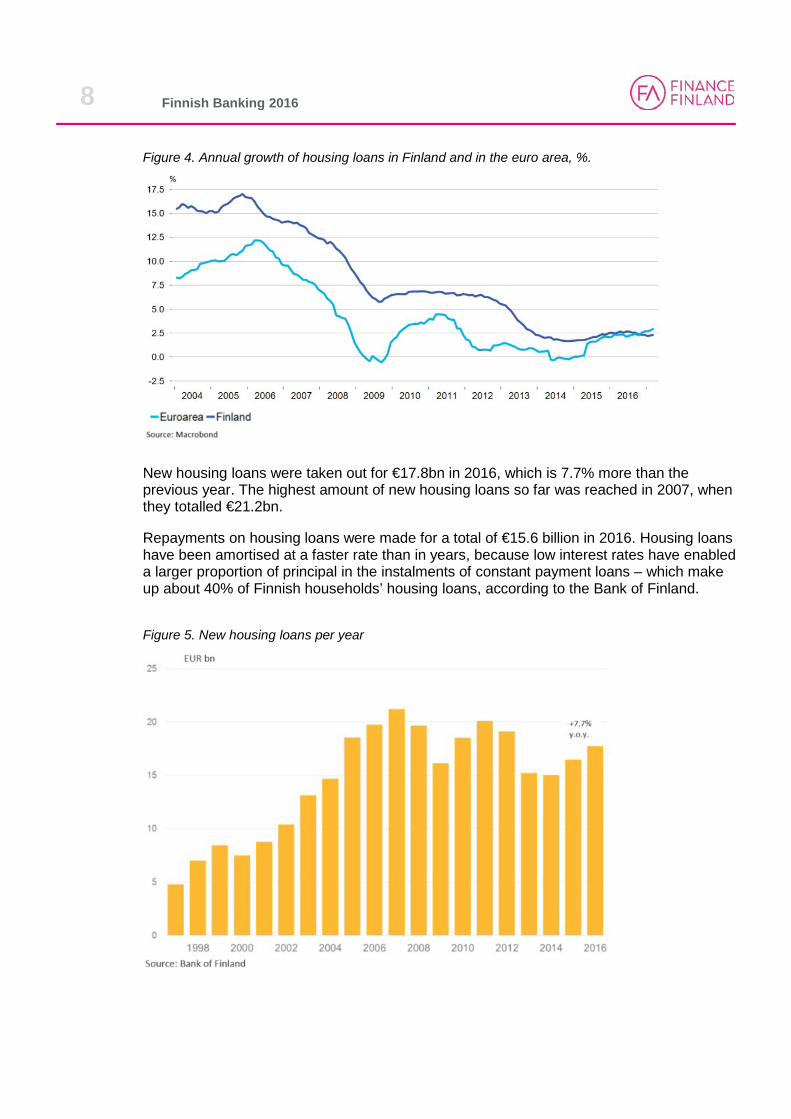
Figure 4. Annual growth of housing loans in Finland and in the euro area, %.
New housing loans were taken out for €17.8bn in 2016, which is 7.7% more than the previous year. The highest amount of new housing loans so far was reached in 2007, when they totalled €21.2bn.
Repayments on housing loans were made for a total of €15.6 billion in 2016. Housing loans have been amortised at a faster rate than in years, because low interest rates have enabled a larger proportion of principal in the instalments of constant payment loans – which make up about 40% of Finnish households’ housing loans, according to the Bank of Finland.
Figure 5. New housing loans per year
9
Finnish Banking 2016
3.4 Banks’ funding favoured longer maturity periods
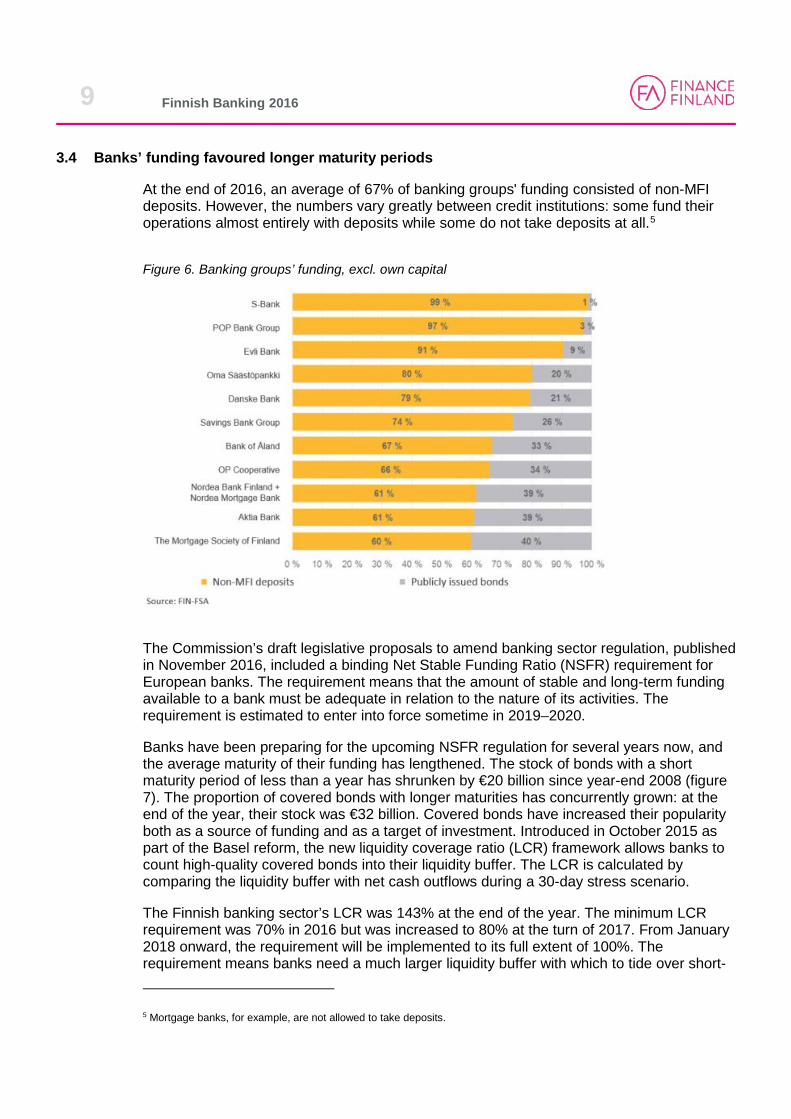
At the end of 2016, an average of 67% of banking groups' funding consisted of non-MFI deposits. However, the numbers vary greatly between credit institutions: some fund their operations almost entirely with deposits while some do not take deposits at all.5
Figure 6. Banking groups’ funding, excl. own capital
The Commission’s draft legislative proposals to amend banking sector regulation, published in November 2016, included a binding Net Stable Funding Ratio (NSFR) requirement for European banks. The requirement means that the amount of stable and long-term funding available to a bank must be adequate in relation to the nature of its activities. The requirement is estimated to enter into force sometime in 2019–2020.
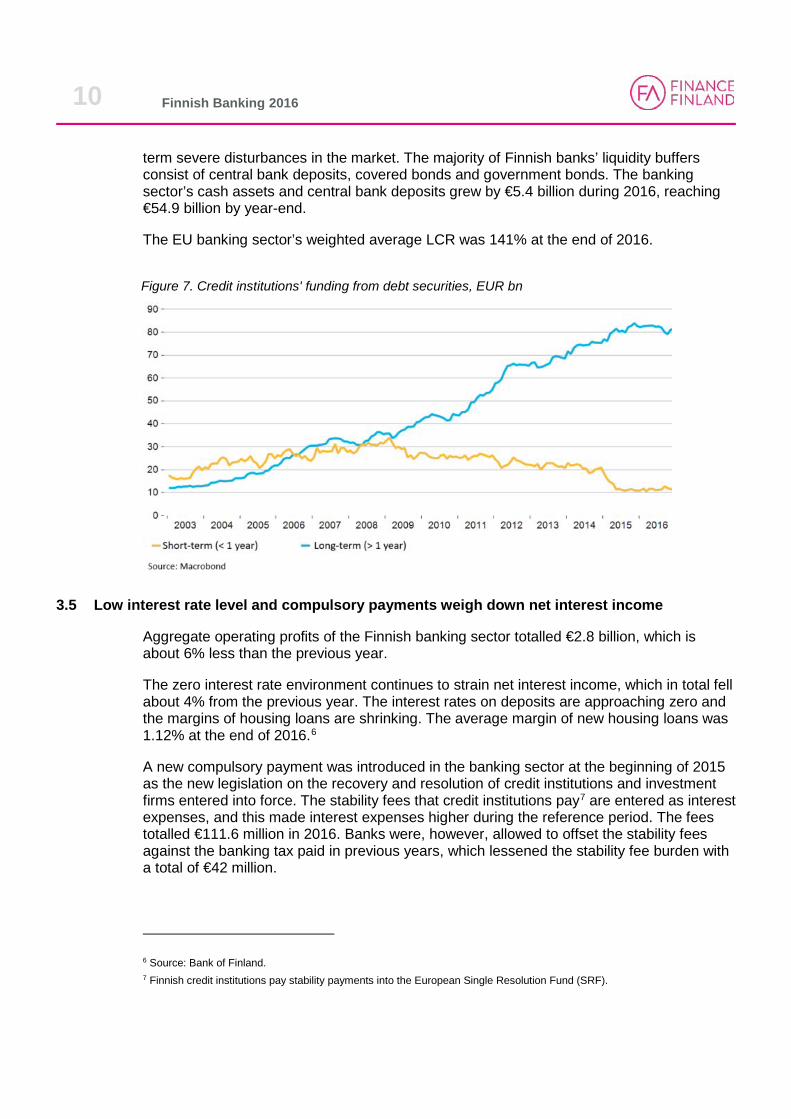
Banks have been preparing for the upcoming NSFR regulation for several years now, and the average maturity of their funding has lengthened. The stock of bonds with a short maturity period of less than a year has shrunken by €20 billion since year-end 2008 (figure 7). The proportion of covered bonds with longer maturities has concurrently grown: at the end of the year, their stock was €32 billion. Covered bonds have increased their popularity both as a source of funding and as a target of investment. Introduced in October 2015 as part of the Basel reform, the new liquidity coverage ratio (LCR) framework allows banks to count high-quality covered bonds into their liquidity buffer. The LCR is calculated by comparing the liquidity buffer with net cash outflows during a 30-day stress scenario.
The Finnish banking sector’s LCR was 143% at the end of the year. The minimum LCR requirement was 70% in 2016 but was increased to 80% at the turn of 2017. From January 2018 onward, the requirement will be implemented to its full extent of 100%. The requirement means banks need a much larger liquidity buffer with which to tide over short- 5 Mortgage banks, for example, are not allowed to take deposits.
10
Finnish Banking 2016
term severe disturbances in the market. The majority of Finnish banks’ liquidity buffers consist of central bank deposits, covered bonds and government bonds. The banking sector’s cash assets and central bank deposits grew by €5.4 billion during 2016, reaching €54.9 billion by year-end.
The EU banking sector’s weighted average LCR was 141% at the end of 2016.
Figure 7. Credit institutions' funding from debt securities, EUR bn
3.5 Low interest rate level and compulsory payments weigh down net interest income
Aggregate operating profits of the Finnish banking sector totalled €2.8 billion, which is about 6% less than the previous year.
The zero interest rate environment continues to strain net interest income, which in total fell about 4% from the previous year. The interest rates on deposits are approaching zero and the margins of housing loans are shrinking. The average margin of new housing loans was 1.12% at the end of 2016.6
A new compulsory payment was introduced in the banking sector at the beginning of 2015 as the new legislation on the recovery and resolution of credit institutions and investment firms entered into force. The stability fees that credit institutions pay7 are entered as interest expenses, and this made interest expenses higher during the reference period. The fees totalled €111.6 million in 2016. Banks were, however, allowed to offset the stability fees against the banking tax paid in previous years, which lessened the stability fee burden with a total of €42 million.
6 Source: Bank of Finland. 7 Finnish credit institutions pay stability payments into the European Single Resolution Fund (SRF).
11
Finnish Banking 2016
Banks are currently charged interest for their central bank deposits. Since March 2016, ECB’s deposit facility rate has been -0.4%. Banks paid interest on their central bank deposits for a total of €136 million in 2016.8
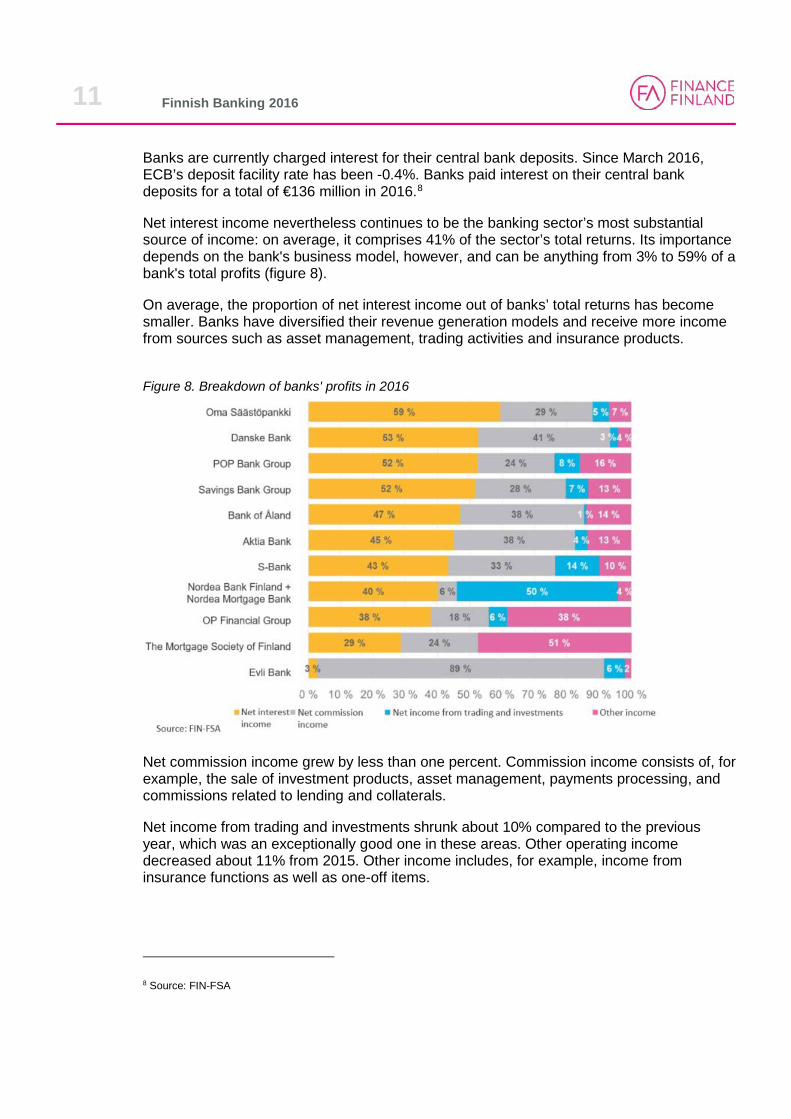
Net interest income nevertheless continues to be the banking sector’s most substantial source of income: on average, it comprises 41% of the sector’s total returns. Its importance depends on the bank's business model, however, and can be anything from 3% to 59% of a bank's total profits (figure 8).
On average, the proportion of net interest income out of banks’ total returns has become smaller. Banks have diversified their revenue generation models and receive more income from sources such as asset management, trading activities and insurance products.
Figure 8. Breakdown of banks' profits in 2016
Net commission income grew by less than one percent. Commission income consists of, for example, the sale of investment products, asset management, payments processing, and commissions related to lending and collaterals.
Net income from trading and investments shrunk about 10% compared to the previous year, which was an exceptionally good one in these areas. Other operating income decreased about 11% from 2015. Other income includes, for example, income from insurance functions as well as one-off items.
8 Source: FIN-FSA
12
Finnish Banking 2016
The operating costs of the sector increased by nearly 3%. Underlying factors included, for example, growing investments in digitalisation and service development.
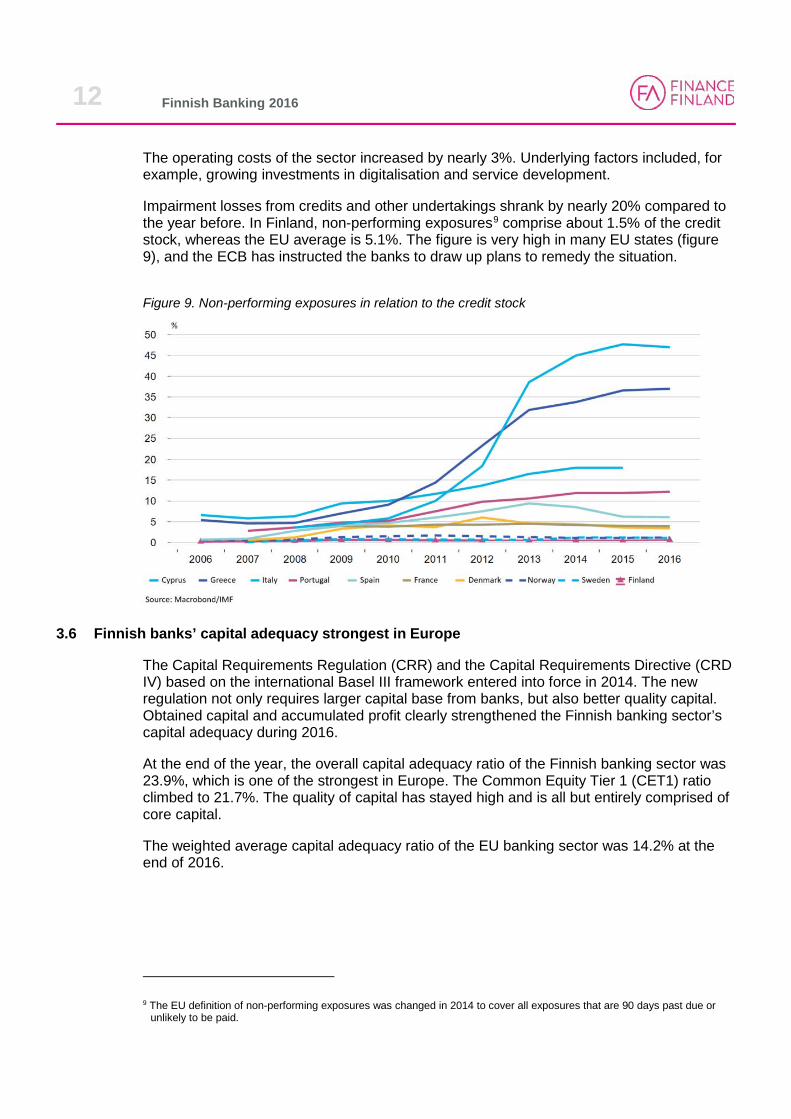
Impairment losses from credits and other undertakings shrank by nearly 20% compared to the year before. In Finland, non-performing exposures9 comprise about 1.5% of the credit stock, whereas the EU average is 5.1%. The figure is very high in many EU states (figure 9), and the ECB has instructed the banks to draw up plans to remedy the situation.
Figure 9. Non-performing exposures in relation to the credit stock
3.6 Finnish banks’ capital adequacy strongest in Europe
The Capital Requirements Regulation (CRR) and the Capital Requirements Directive (CRD IV) based on the international Basel III framework entered into force in 2014. The new regulation not only requires larger capital base from banks, but also better quality capital. Obtained capital and accumulated profit clearly strengthened the Finnish banking sector’s capital adequacy during 2016.
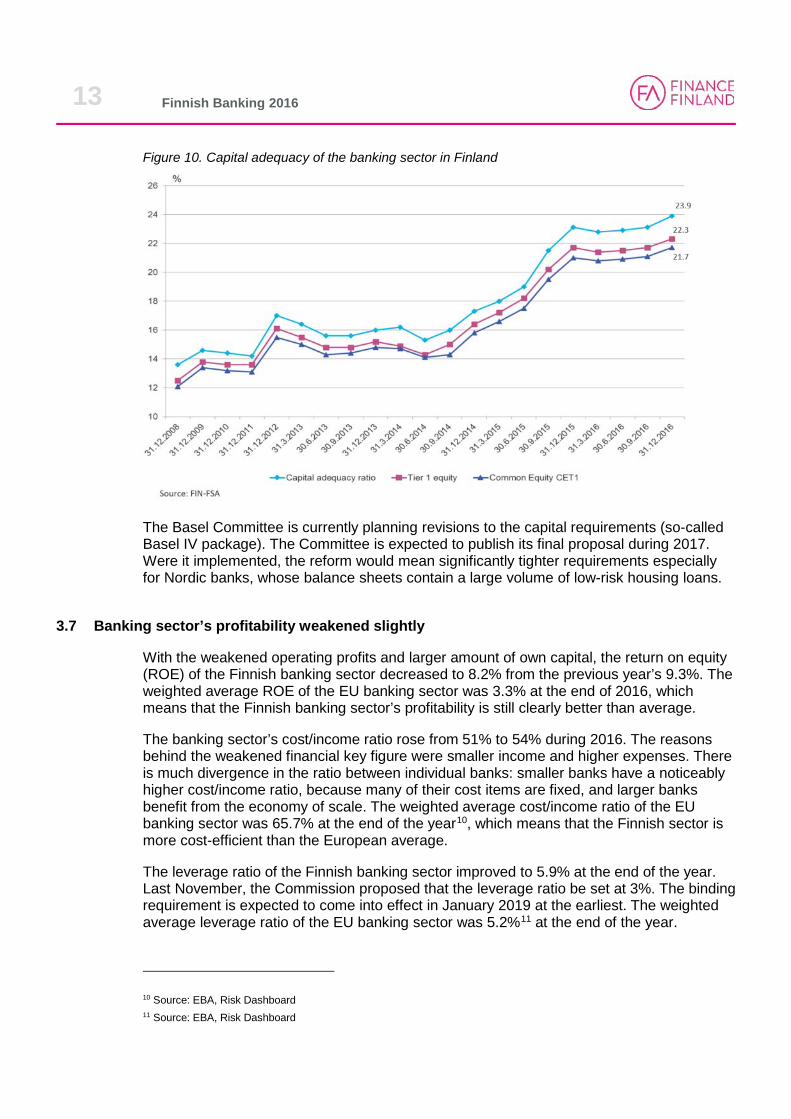
At the end of the year, the overall capital adequacy ratio of the Finnish banking sector was 23.9%, which is one of the strongest in Europe. The Common Equity Tier 1 (CET1) ratio climbed to 21.7%. The quality of capital has stayed high and is all but entirely comprised of core capital.
The weighted average capital adequacy ratio of the EU banking sector was 14.2% at the end of 2016.
9 The EU definition of non-performing exposures was changed in 2014 to cover all exposures that are 90 days past due or
unlikely to be paid.
13
Finnish Banking 2016
Figure 10. Capital adequacy of the banking sector in Finland
The Basel Committee is currently planning revisions to the capital requirements (so-called Basel IV package). The Committee is expected to publish its final proposal during 2017. Were it implemented, the reform would mean significantly tighter requirements especially for Nordic banks, whose balance sheets contain a large volume of low-risk housing loans.
3.7 Banking sector’s profitability weakened slightly
With the weakened operating profits and larger amount of own capital, the return on equity (ROE) of the Finnish banking sector decreased to 8.2% from the previous year’s 9.3%. The weighted average ROE of the EU banking sector was 3.3% at the end of 2016, which means that the Finnish banking sector’s profitability is still clearly better than average.
The banking sector’s cost/income ratio rose from 51% to 54% during 2016. The reasons behind the weakened financial key figure were smaller income and higher expenses. There is much divergence in the ratio between individual banks: smaller banks have a noticeably higher cost/income ratio, because many of their cost items are fixed, and larger banks benefit from the economy of scale. The weighted average cost/income ratio of the EU banking sector was 65.7% at the end of the year10, which means that the Finnish sector is more cost-efficient than the European average.
The leverage ratio of the Finnish banking sector improved to 5.9% at the end of the year. Last November, the Commission proposed that the leverage ratio be set at 3%. The binding requirement is expected to come into effect in January 2019 at the earliest. The weighted average leverage ratio of the EU banking sector was 5.2%11 at the end of the year.
10 Source: EBA, Risk Dashboard 11 Source: EBA, Risk Dashboard

14
Finnish Banking 2016