first analysis of dhcal data josé repond argonne national laboratory linear collider workshop lcws...
TRANSCRIPT
1
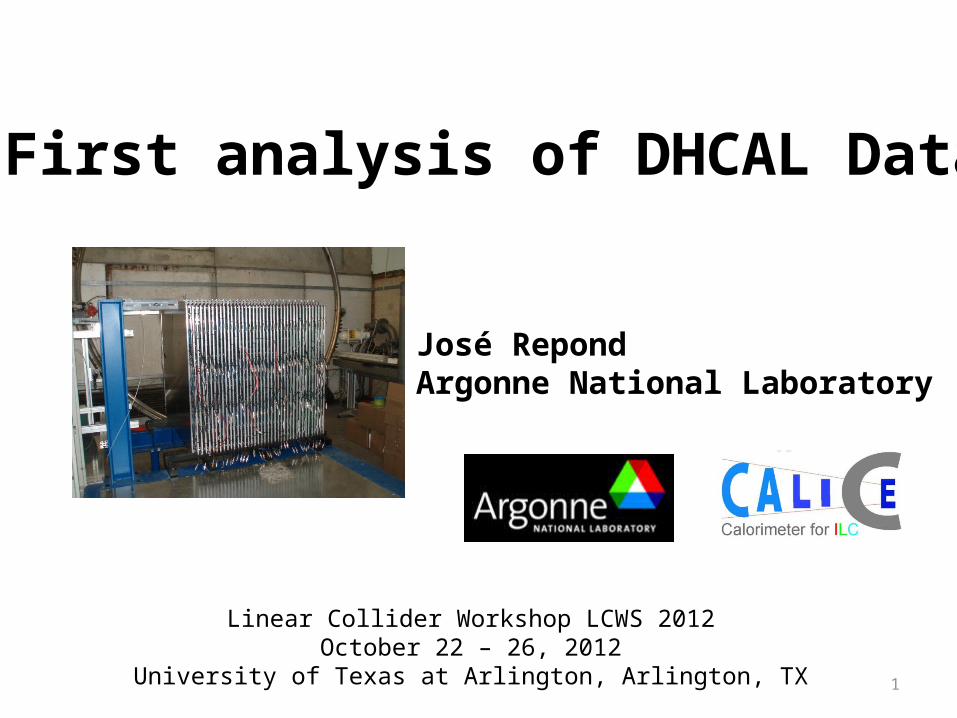
First analysis of DHCAL Data
José RepondArgonne National Laboratory
Linear Collider Workshop LCWS 2012October 22 – 26, 2012
University of Texas at Arlington, Arlington, TX
2
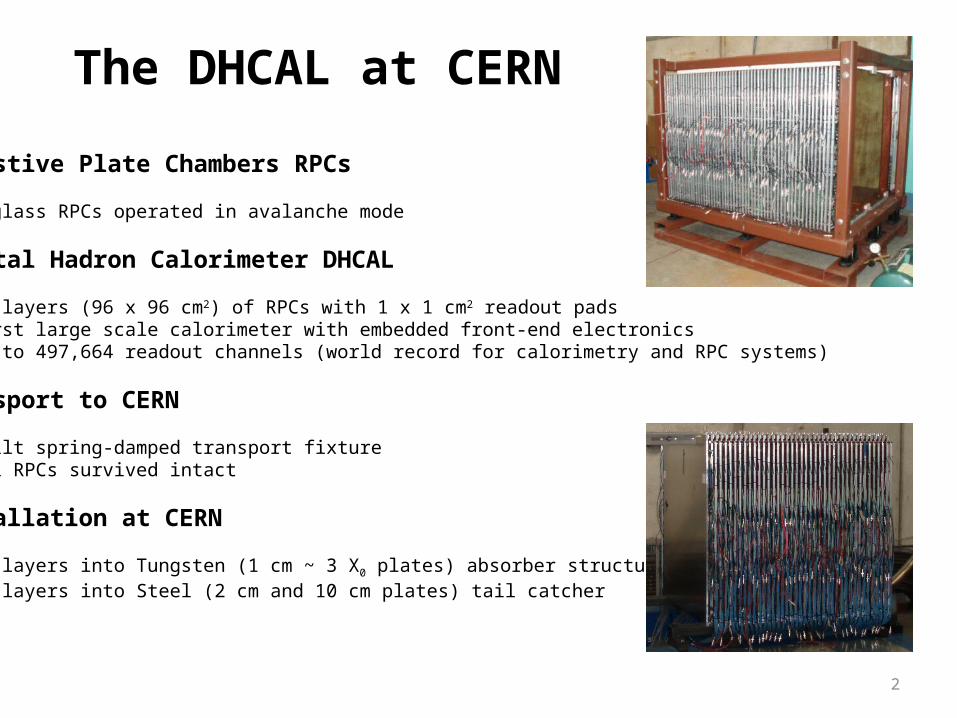
The DHCAL at CERN
Resistive Plate Chambers RPCs
2-glass RPCs operated in avalanche mode
Digital Hadron Calorimeter DHCAL
54 layers (96 x 96 cm2) of RPCs with 1 x 1 cm2 readout pads First large scale calorimeter with embedded front-end electronics Up to 497,664 readout channels (world record for calorimetry and RPC systems)
Transport to CERN
Built spring-damped transport fixture All RPCs survived intact
Installation at CERN
39 layers into Tungsten (1 cm ~ 3 X0 plates) absorber structure 15 layers into Steel (2 cm and 10 cm plates) tail catcher

3
DHCAL Data SummaryTestbeam Configuration Muons3 Secondary
beam3Total3
Fermilab1 DHCAL 6.9 9.3 16.2
SiW ECAL + DHCAL 2.5 5.1 7.6
CERN2 DHCAL 5.6 23.4 29.1
TOTAL 15.0 37.8 52.8
1Contains a significant fraction of ‘calibration events’2Contains no ‘calibration events’3Numbers in millions
Data taking about x4 more efficient at CERN due to
- Longer days (24 versus 12 hours) - Higher spill frequency (every 45 versus every 60 seconds) - Longer spills (9.7 versus 3.9 seconds) - More uniform extractions (no detectable microstructure) - Machine downtime similar at CERN and FNAL

4
Beams at CERNPS
Covers 1 – 10 GeV/c Mixture of pions, electrons, protons, (Kaons) Two Cerenkov counters for particle ID 1-3 400-ms-spills every 45 second (RPC rate capability OK) Data taking with ~500 triggers/spill
SPS
Covers 12 – 300 GeV/c Mostly set-up to either have electrons or pions (18 Pb foil) Two Cerenkov counters for particle ID 9.7-s-spills every 45 – 60 seconds RPC rate capability a problem (running with limited rate: 250 – 500 triggers/spill)
300 GeV/c
RPC rate limitations
~6 % loss of hits (in the following not yet corrected) Time constant ~ 1 second
5
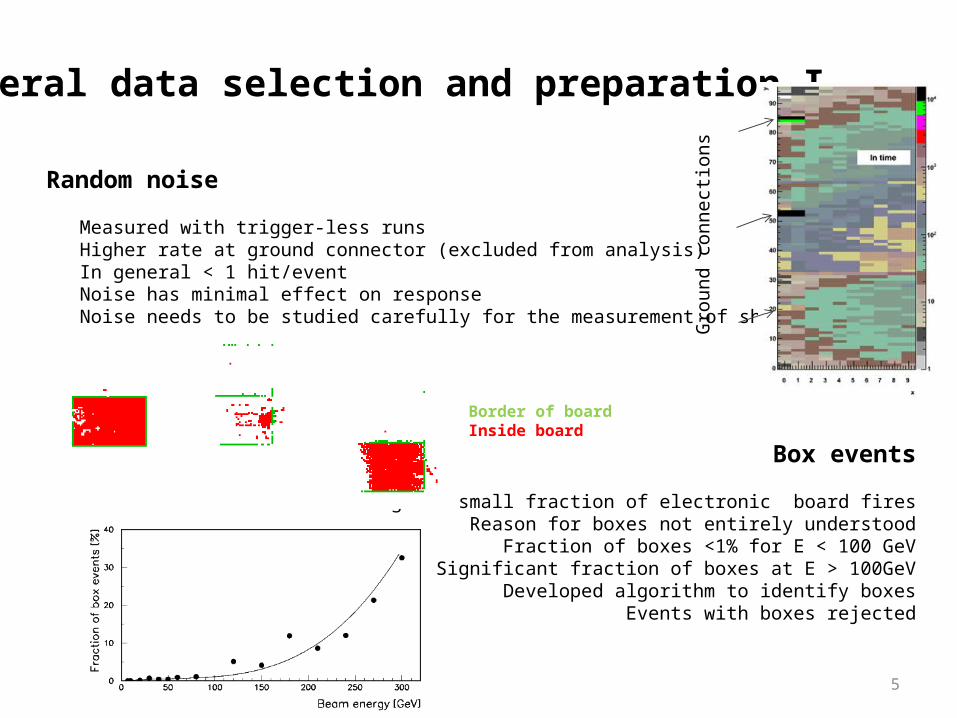
General data selection and preparation I
Random noise
Measured with trigger-less runs Higher rate at ground connector (excluded from analysis) In general < 1 hit/event Noise has minimal effect on response Noise needs to be studied carefully for the measurement of shower shapes
Box events
Large or small fraction of electronic board fires Reason for boxes not entirely understood
Fraction of boxes <1% for E < 100 GeVSignificant fraction of boxes at E > 100GeV
Developed algorithm to identify boxesEvents with boxes rejected
Gro
und
conn
ectio
ns
Border of boardInside board

6
General data selection and preparation II
Double hits
Duplicate hits with the same coordinate, but different time-stamps are eliminated This is a very small fraction of the hits
Time-stamp bins
Data are recorded in 7 time-stamp bins (each 100 ns) First two time-stamps are before the trigger (→ estimation of the noise level) Only hits in bins 3 and 4 included in analysis (← reduction of possible noise)

7
Simulation of RPC response RPC simulation
Spread of charge in pad plane using 2 exponentials 6 parameters to be tuned
Use clean muon events
Tune to average response per layer Able to tune 5 parameters Muons not sensitive to dcut (Describes local inefficiency for 2nd avalanche close to 1st one)
CALICE PRELIMINARY
Use clean positron events
Tune last parameter: dcut
Caveat
Tuning performed with Fermilab data Slightly different operating conditions at CERN
Muon response
More details → L. Xia’s talk

8
Overview of CERN data samplePolarity Momentum 18 mm Pb absorber No Pb absorber Beam blocker Total
Negative 1 540,660 540,6602 964,361 964,3613 1,006,185 1,006,1854 1,030,302 1,030,3025 1,185,235 1,185,2356 1,268,235 1,268,2357 1,546,744 1,546,7448 1,196,804 1,196,8049 2,044,224 2,044,224
10 1,007,922 1,007,92212 300,666 300,66615 305,735 305,73520 465,904 438,356 904,26030 594,132 410,731 1,004,86340 510,736 303,020 813,75650 886,201 886,20160 497,739 497,73980 722,268 722,268
100 526,323 64,658 590,981120 505,465 505,465180 123,448 123,448210 350,302 350,302240 283,554 283,554270 206,733 206,733300 436,133 704,141 1,140,274
Total 6,414,673 13,308,103 704,141 20,426,917Positive 4 1,137,898 1,137,898 6 655,638 655,638
8 527,234 527,23410 359,768 359,76860 10,125 10,125
150 289,888 230,515 520,403180 303,917 211,482 4,920,679 5,436,078
Total 593,805 3,132,660 4,920,679 8,647,144Grand total 7,008,478 16,440,763 5,624,820 29,074,061
9
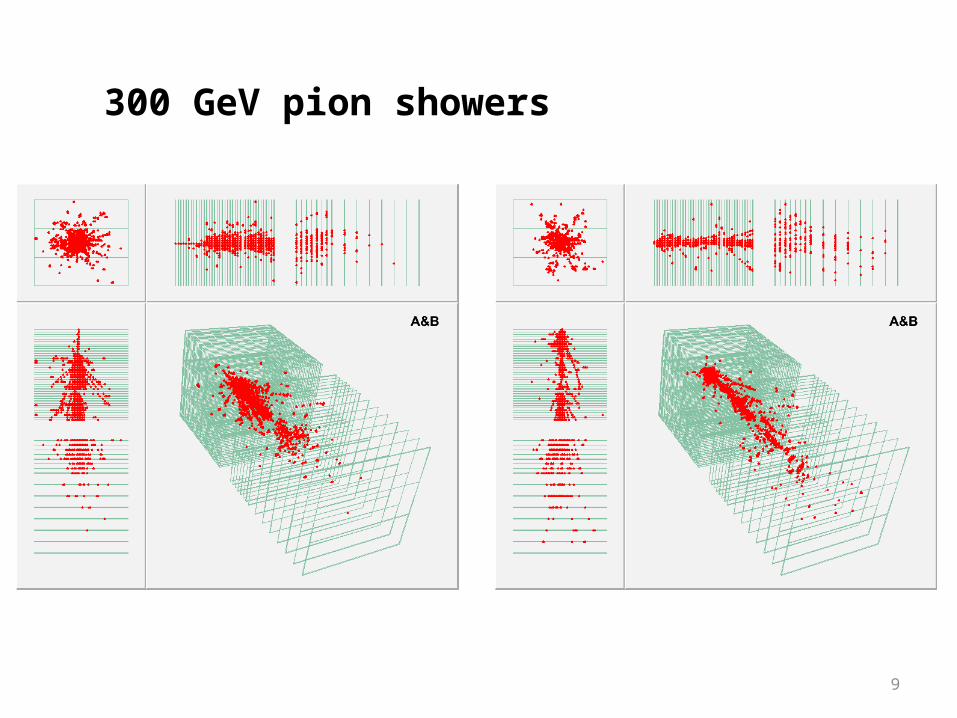
300 GeV pion showers
10
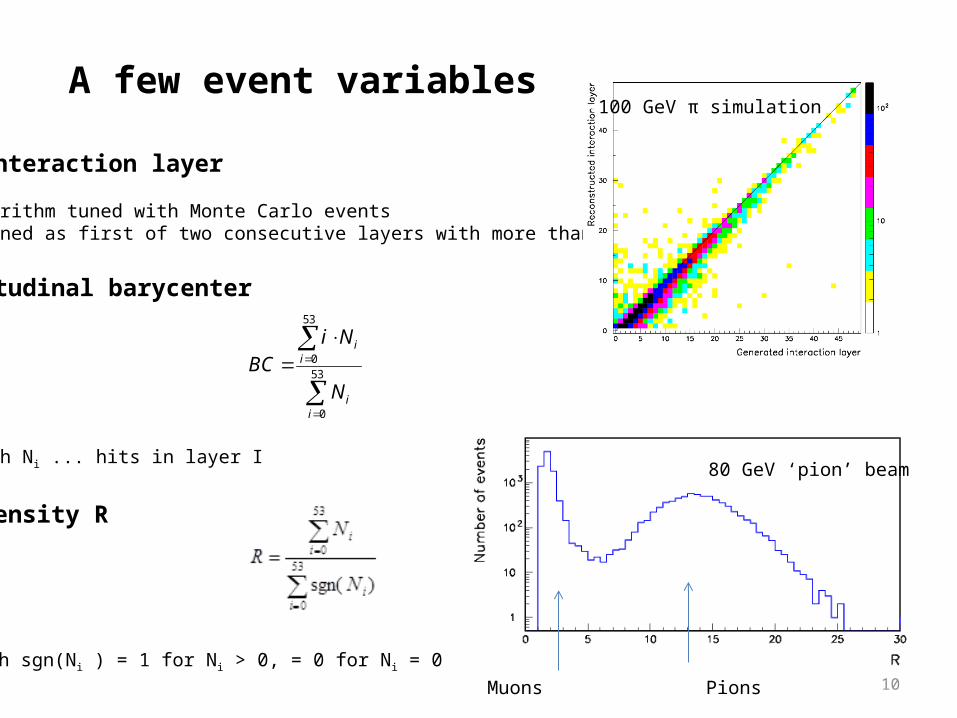
A few event variables
The interaction layer
Algorithm tuned with Monte Carlo events Defined as first of two consecutive layers with more than 3 hits
Longitudinal barycenter
with Ni ... hits in layer I
Hit density R
with sgn(Ni ) = 1 for Ni > 0, = 0 for Ni = 0
53
0
53
0
ii
ii
N
NiBC
80 GeV ‘pion’ beam
Muons Pions
100 GeV π simulation

11
Particle Cerenkov
BC R IL N0
μ >20 <3.0 - >0 >10
e± C1·C2=1 <8 >4.0 for E>12 GeV
- >4 forE>12 GeV
- -
π- C1+C2=0
- >2.0 – 5.0 >2 for E>3 GeV
- -
π+ C1=0 and C2=1 (p ≤ 10 GeV/c) C1·C2=1(p > 10 GeV/c)
- >2.0 – 5.0 >2 for E>3 GeV
- -
p C1+C2=0 - >2.0 – 5.0 -
last
lastiiN
4
last
iiN
0
Event selection
BC … Longitudinal barycenterR … Average number of hits per active layerIL … Interaction layerN0 … Hits in layer 0
General cut: 1 cluster in layer 0 with less than 12 hitsParticle selection:
12
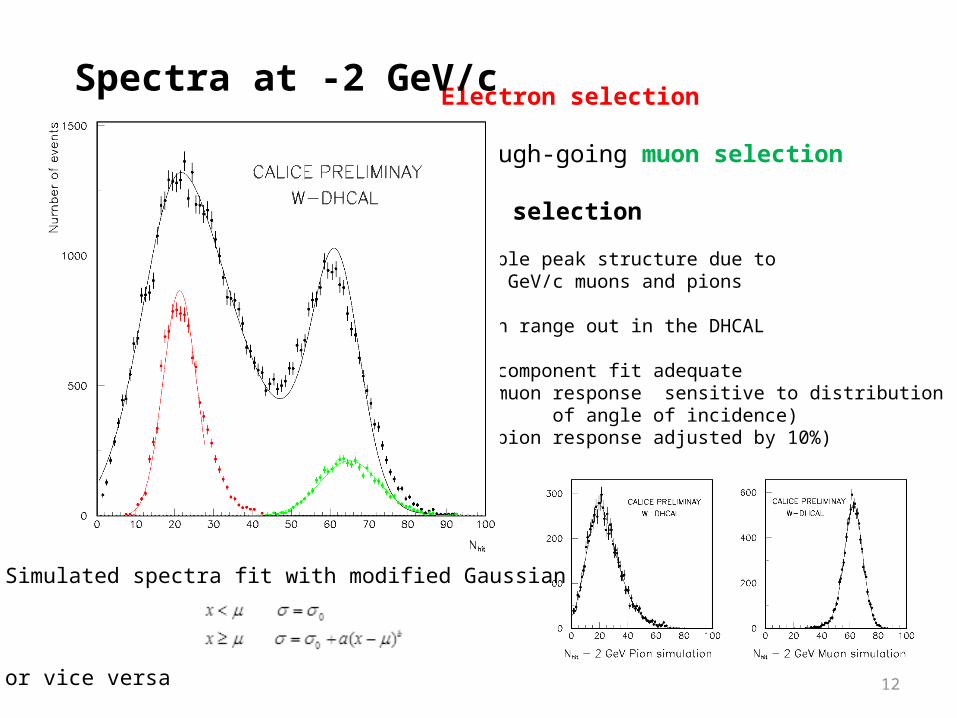
Electron selection
Through-going muon selection
Pion selection
Double peak structure due to 2 GeV/c muons and pions
Both range out in the DHCAL
2 component fit adequate (muon response sensitive to distribution of angle of incidence) (pion response adjusted by 10%)
Spectra at -2 GeV/c
Simulated spectra fit with modified Gaussian
or vice versa
13
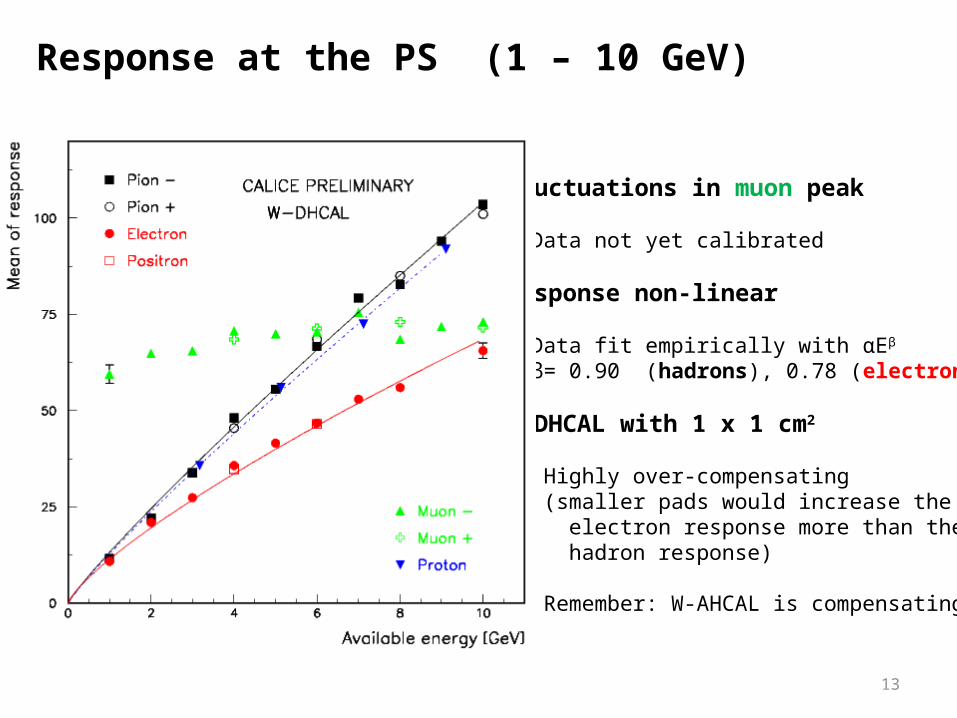
Response at the PS (1 – 10 GeV)
Fluctuations in muon peak
Data not yet calibrated
Response non-linear
Data fit empirically with αEβ
β= 0.90 (hadrons), 0.78 (electrons)
W-DHCAL with 1 x 1 cm2
Highly over-compensating (smaller pads would increase the electron response more than the hadron response)
Remember: W-AHCAL is compensating!

14
Resolution at the PS (1 – 10 GeV)
Resolutions corrected for non-linear response
Data fit with quadratic sum of constant and stochastic term
Ec
E
Particle α c
Pions (68.0±0.4% (5.4±0.7)%
Electrons (29.4±0.3)% 16.6±0.3)%
(No systematics yet)
15
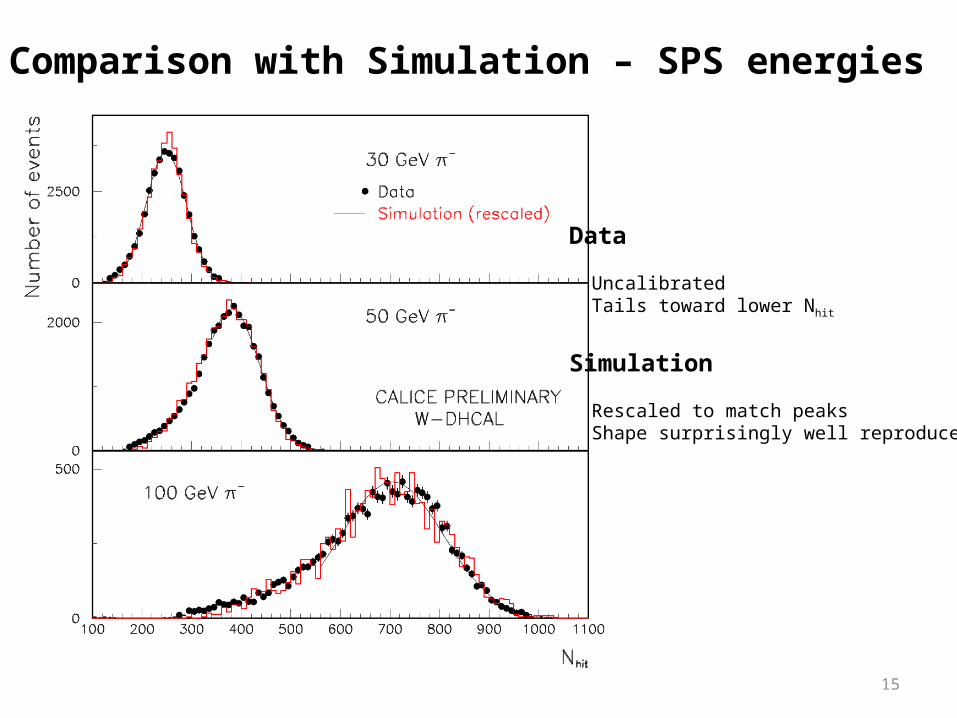
Comparison with Simulation – SPS energies
Data
Uncalibrated Tails toward lower Nhit
Simulation
Rescaled to match peaks Shape surprisingly well reproduced
16
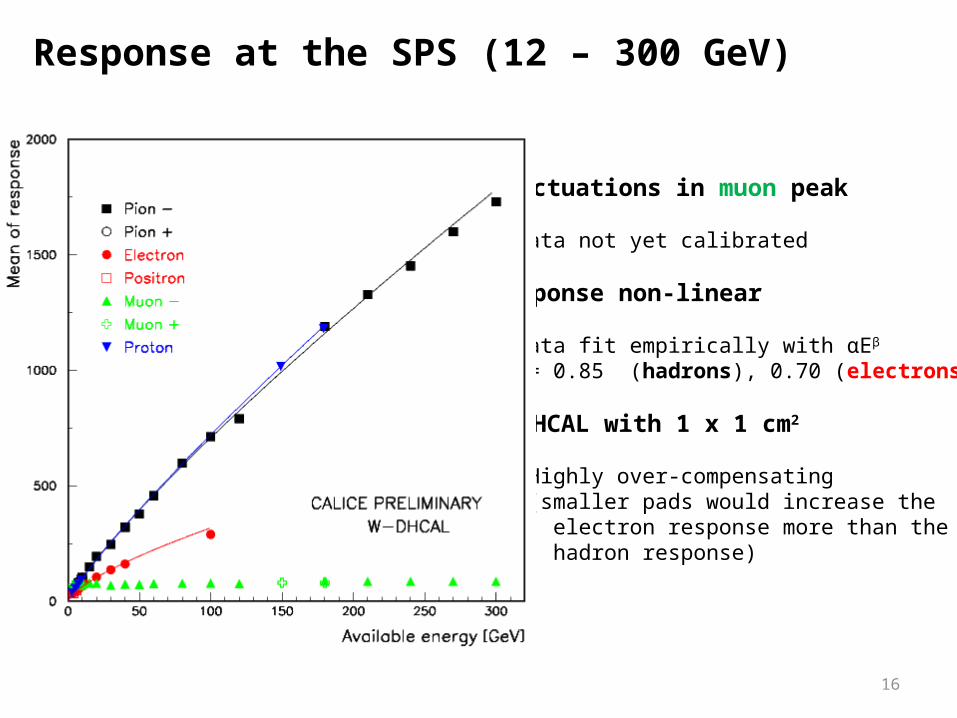
Response at the SPS (12 – 300 GeV)
Fluctuations in muon peak
Data not yet calibrated
Response non-linear
Data fit empirically with αEβ
β= 0.85 (hadrons), 0.70 (electrons)
W-DHCAL with 1 x 1 cm2
Highly over-compensating (smaller pads would increase the electron response more than the hadron response)

17
Conclusions
W-DHCAL: Great data set with 53 Million events spanning 1 – 300 GeV in energy
Detailed systematic studies of the data have begun
→ There is a lot to do and understand
Presented preliminary look at the W-DHCAL data
● Response saturates both at the PS (1 – 10 GeV) and the SPS (12 – 300 GeV)
→ Smaller readout pads needed for Tungsten absorbers
● Approximately 50% more hits with Steel absorbers
● Simulations start to look like the data
→ Major features of data understood