first quarter 2015 conference call & webcast may 1,...
TRANSCRIPT

TURNING VISION INTO REALITY
First Quarter 2015
Conference Call & Webcast
May 1, 2015
TSX: FM; LSE: FQM

Certain statements and information herein, including all statements that are not historical facts, contain forward-looking statements and forward-looking information within the meaning of applicable securities laws. The forward looking statements include estimates, forecasts and statements as to the Company’s expectations of production and sales volumes, expected timing of completion of project development at Kansanshi, Sentinel, Enterprise and Cobre Panama, the impact of ore grades on future production, the potential of production disruptions, capital expenditure and mine production costs, the outcome of mine permitting, the outcome of legal proceedings which involve the Company, information with respect to the future price of copper, gold, cobalt, nickel, zinc, pyrite, PGE, and sulphuric acid, estimated mineral reserves and mineral resources, First Quantum’s exploration and development program, estimated future expenses, exploration and development capital requirements, the Company’s hedging policy, and goals and strategies. Often, but not always, forward-looking statements or information can be identified by the use of words such as “plans”, “expects” or “does not expect”, “is expected”, “budget”, “scheduled”, “estimates”, “forecasts”, “intends”, “anticipates” or “does not anticipate” or “believes” or variations of such words and phrases or statements that certain actions, events or results “may”, “could”, “would”, “might” or “will” be taken, occur or be achieved.
With respect to forward-looking statements and information contained herein, the Company has made numerous assumptions including among other things, assumptions about the price of copper, gold, nickel, zinc, pyrite, PGE, cobalt and sulphuric acid, anticipated costs and expenditures and the ability to achieve the Company’s goals. Although management believes that the assumptions made and the expectations represented by such statements or information are reasonable, there can be no assurance that a forward-looking statement or information herein will prove to be accurate. Forward-looking statements and information by their nature are based on assumptions and involve known and unknown risks, uncertainties and other factors which may cause the actual results, performance or achievements, or industry results, to be materially different from any future results, performance or achievements expressed or implied by such forward-looking statements or information. These factors include, but are not limited to, future production volumes and costs, costs for inputs such as oil, power and sulphur, political stability in Zambia, Peru, Mauritania, Finland, Spain, Turkey, Panama, Argentina and Australia, adverse weather conditions in Zambia, Finland, Spain, Turkey, Panama and Mauritania, labour disruptions, mechanical failures, water supply, procurement and delivery of parts and supplies to the operations, the production of off-spec material.
See First Quantum’s Annual Information Form for additional information on risks, uncertainties and other factors relating to the forward-looking statements and information. Although we have attempted to identify factors that would cause actual actions, events or results to differ materially from those disclosed in the forward-looking statements or information, there may be other factors, many of which are beyond the control of First Quantum, that might cause actual results, performances, achievements or events not to be anticipated, estimated or intended. Accordingly, readers should not place undue reliance on forward-looking statements or information.
While First Quantum may elect to update the forward-looking statements at any time, First Quantum does not undertake to update them at any particular time or in response to any particular event, other than as may be required by applicable securities laws. Investors and others should not assume that any forward-looking statement contained in this presentation represents management's estimate as of any date other than the date of this presentation.
Neither First Quantum nor any of its directors or officers has verified the accuracy or completeness of information or statements contained herein which are made by or derived from third-party sources (including any projections or estimates made by third-party research analysts). Such third-party sources may have failed to identify events or facts which may have occurred or which may affect the significance or accuracy of any such information or statements. First Quantum has no means of verifying the accuracy or completeness of such information or statements made by or derived from third-party sources or whether there has been any failure by such sources to identify events that may have occurred or may affect the significance or accuracy of any information or statements.
This presentation does not constitute an offer to buy or an invitation to sell, or the solicitation of an offer to buy or invitation to sell, any securities of First Quantum. Such an offer may only be made pursuant to the offer and takeover bid circular First Quantum has filed with the Canadian securities regulators and pursuant to registration or qualification under the securities laws of any other such jurisdiction.
In accordance with applicable Canadian securities regulatory requirements, all mineral reserve and mineral resource estimates disclosed herein have been prepared in accordance with Canadian National Instrument 43-101 - Standards of Disclosure for Mineral Projects ("NI 43-101"), classified in accordance with Canadian Institute of Mining Metallurgy and Petroleum's "CIM Standards on Mineral Resources and Reserves Definitions and Guidelines" (the "CIM Guidelines"). The terms "mineral resources", "measured mineral resources", "indicated mineral resources" and "inferred mineral resources" are recognized by Canadian securities regulatory authorities, however, they may not be recognized by the securities regulatory authorities of other jurisdictions. Pursuant to the CIM Guidelines, mineral resources have a higher degree of uncertainty than mineral reserves as to their existence as well as their economic and legal feasibility. Inferred mineral resources, when compared with measured or indicated mineral resources, have the least certainty as to their existence, and it cannot be assumed that all or any part of an inferred mineral resource will be upgraded to an indicated or measured mineral resource as a result of continued exploration. Pursuant to NI 43-101, inferred mineral resources may not form the basis of any economic analysis, including any feasibility study. Accordingly, readers are cautioned not to assume that all or any part of a mineral resource exists, will ever be converted into a mineral reserve, or is or will ever be economically or legally mineable or recovered.
Note: all dollar amounts in US dollars unless otherwise indicated; C$ indicates Canadian dollars
Cautionary Note Regarding Forward-Looking Statements
2

Kansanshi Smelter
3

Kansanshi Smelter
4

Kansanshi Smelter - Casting
5

Cobre Panama – Mill Area
6

Cobre Panama – Port and Powerstation Foundations
7

Cobre Panama – Port Area Wharf and Material Offloading Facility
8

Copper C1 cost and Nickel C1 cost both in line with prior year quarter, despite lower production
Cu production lower, as expected, to limit acid consumption prior to smelter ramp up
Comparative results year on year impacted by lower copper price, sales volumes and higher Zambian royalty
Q1 2015 Highlights
9
(1) Earnings attributable to shareholders of the Company and EBITDA have been adjusted to exclude impacts which are not reflective of underlying performance to
arrive at comparative earnings and comparative EBITDA. A reconciliation of Comparative EBITDA and Earnings is provided in the Q1 2015 MD&A.
Copper Nickel
Ni production in line with expectations with Ravensthorpe at reduced capacity
Copper ('000 tonnes) 96 (17)
Nickel ('000 tonnes) 6 (6)
Gold ('000 ounces) 53 (7)
Production Q1 2015 vs Q1 2014
$ million
Comparative EBITDA 120 373
Comparative (Loss) / Earnings (12) 130
Comparative EPS (Basic) ($) (0.02) 0.22
Q1 2015 Q1 2014
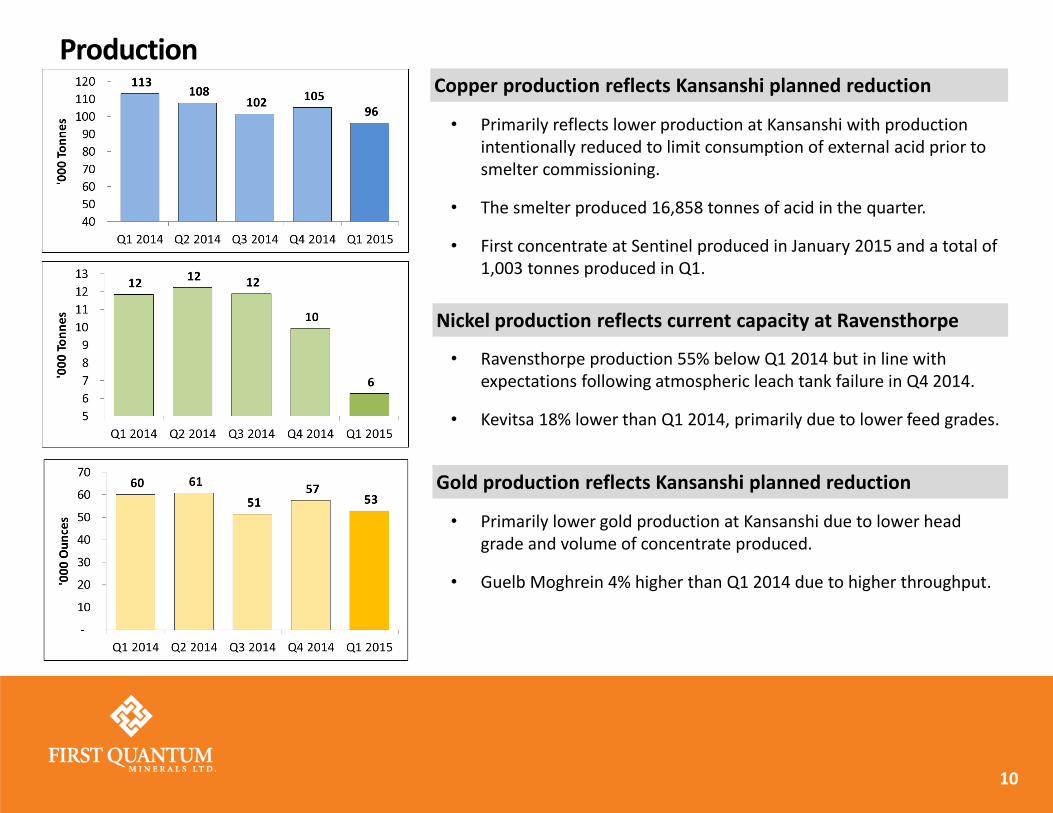
• Ravensthorpe production 55% below Q1 2014 but in line with expectations following atmospheric leach tank failure in Q4 2014.
• Kevitsa 18% lower than Q1 2014, primarily due to lower feed grades.
• Primarily lower gold production at Kansanshi due to lower head grade and volume of concentrate produced.
• Guelb Moghrein 4% higher than Q1 2014 due to higher throughput.
• Primarily reflects lower production at Kansanshi with production intentionally reduced to limit consumption of external acid prior to smelter commissioning.
• The smelter produced 16,858 tonnes of acid in the quarter.
• First concentrate at Sentinel produced in January 2015 and a total of 1,003 tonnes produced in Q1.
Production
10
Nickel production reflects current capacity at Ravensthorpe
Gold production reflects Kansanshi planned reduction
Copper production reflects Kansanshi planned reduction
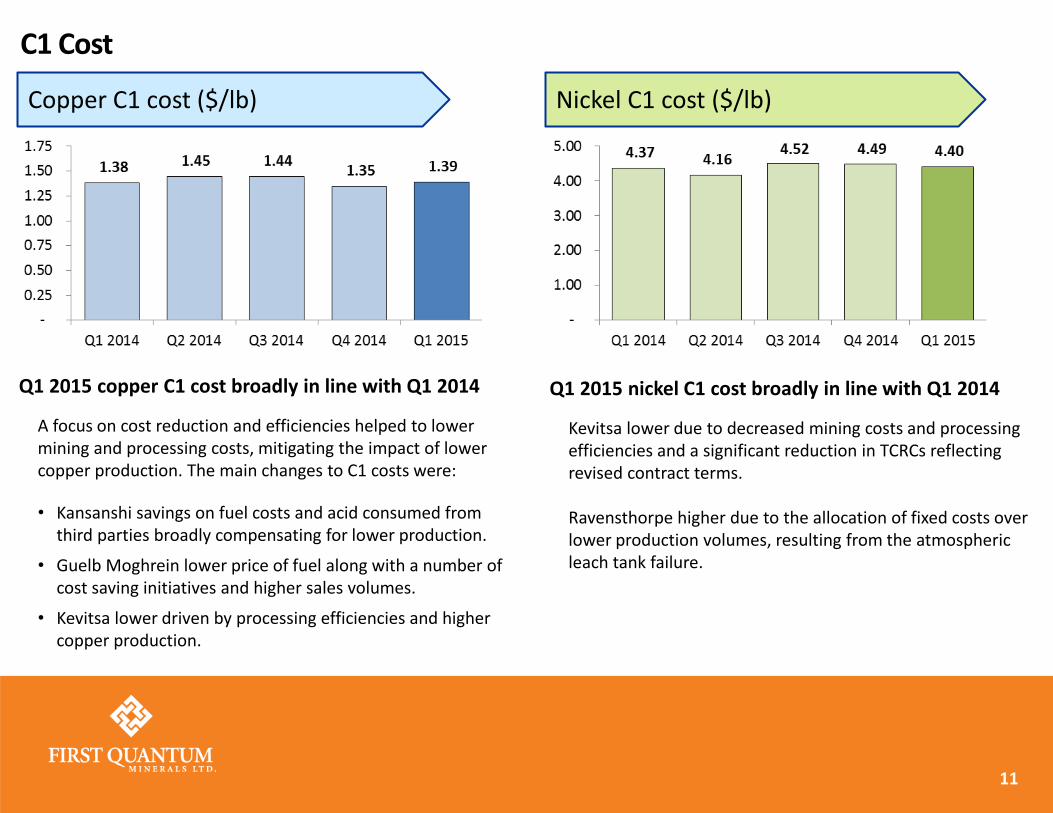
Q1 2015 copper C1 cost broadly in line with Q1 2014
A focus on cost reduction and efficiencies helped to lower mining and processing costs, mitigating the impact of lower copper production. The main changes to C1 costs were:
• Kansanshi savings on fuel costs and acid consumed from third parties broadly compensating for lower production.
• Guelb Moghrein lower price of fuel along with a number of cost saving initiatives and higher sales volumes.
• Kevitsa lower driven by processing efficiencies and higher copper production.
C1 Cost
11
Copper C1 cost ($/lb) Nickel C1 cost ($/lb)
Q1 2015 nickel C1 cost broadly in line with Q1 2014
Kevitsa lower due to decreased mining costs and processing efficiencies and a significant reduction in TCRCs reflecting revised contract terms. Ravensthorpe higher due to the allocation of fixed costs over lower production volumes, resulting from the atmospheric leach tank failure.

$ million
Revenue 650 821 891
Gross Profit 26 183 282
EBITDA 33 300 364
Comparative EBITDA 120 278 373
Comparative (Loss) / Earnings (12) 58 130
Comparative EPS (Basic) ($) (0.02) 0.10 0.22
Net Debt (5,929) (5,546) (3,729)
Q1 2015 Q1 2014Q4 2014
Comparative EBITDA impacted by lower metal prices and sales volumes
Financial Overview
12
Gross profit impacted by lower copper prices and sales volumes, primarily at Kansanshi, and impact of higher Zambian royalty rate ($48m). Q1 Comparative EBITDA 68% lower than the Q1 2014 driven by lower revenue and higher royalty.
(1) Earnings attributable to shareholders of the Company and EBITDA have been adjusted to exclude impacts which are not reflective of underlying performance to arrive
at comparative earnings and comparative EBITDA. Items excluded from comparative measures include impairment charges of $72m. A full reconciliation of
Comparative EBITDA and Earnings is provided on page 29 of the Q1 2015 MD&A.

Q1 Gross Profit
Gross profit impacted by lower metal prices and sales volumes
13
Reduced copper sales at Kansanshi and Kevitsa plus lower nickel sales with Ravensthorpe at reduced capacity
Impact of higher royalty rate at Kansanshi
$ million
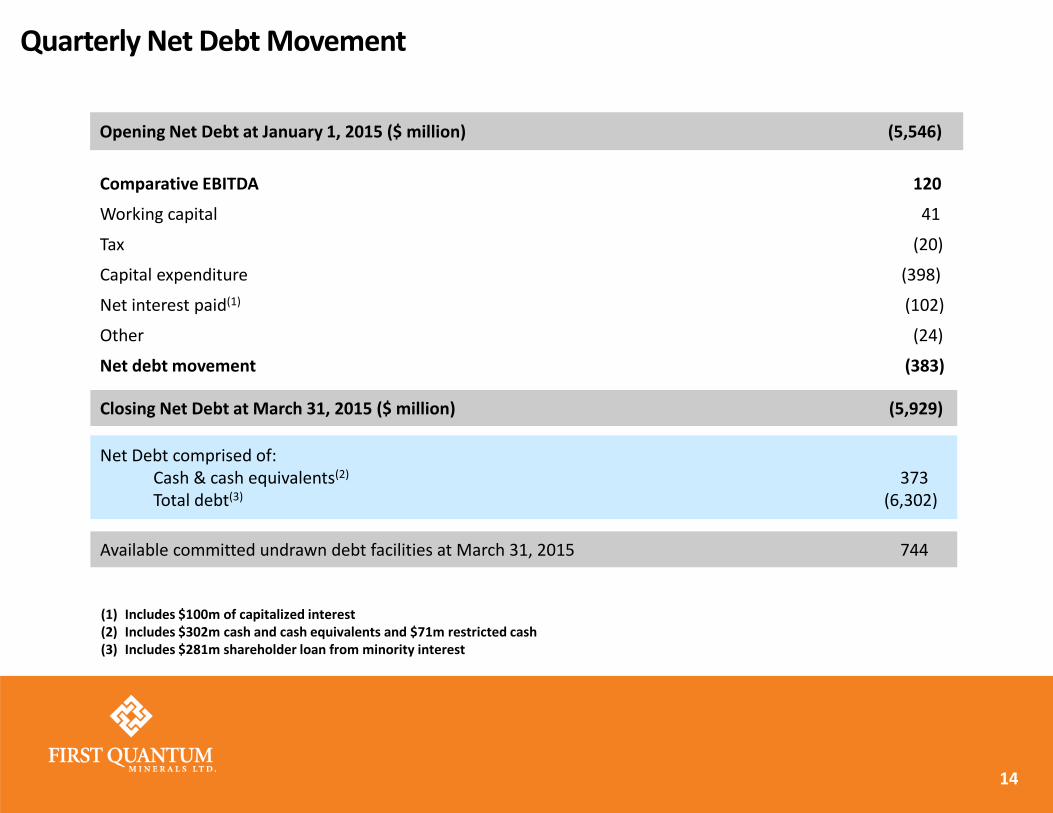
Quarterly Net Debt Movement
(1) Includes $100m of capitalized interest (2) Includes $302m cash and cash equivalents and $71m restricted cash (3) Includes $281m shareholder loan from minority interest
Comparative EBITDA 120
Working capital 41
Tax (20)
Capital expenditure (398)
Net interest paid(1) (102)
Other (24)
Net debt movement (383)
Opening Net Debt at January 1, 2015 ($ million) (5,546)
Closing Net Debt at March 31, 2015 ($ million) (5,929)
Available committed undrawn debt facilities at March 31, 2015 744
Net Debt comprised of: Cash & cash equivalents(2) 373 Total debt(3) (6,302)
14
Zambian Developments
15
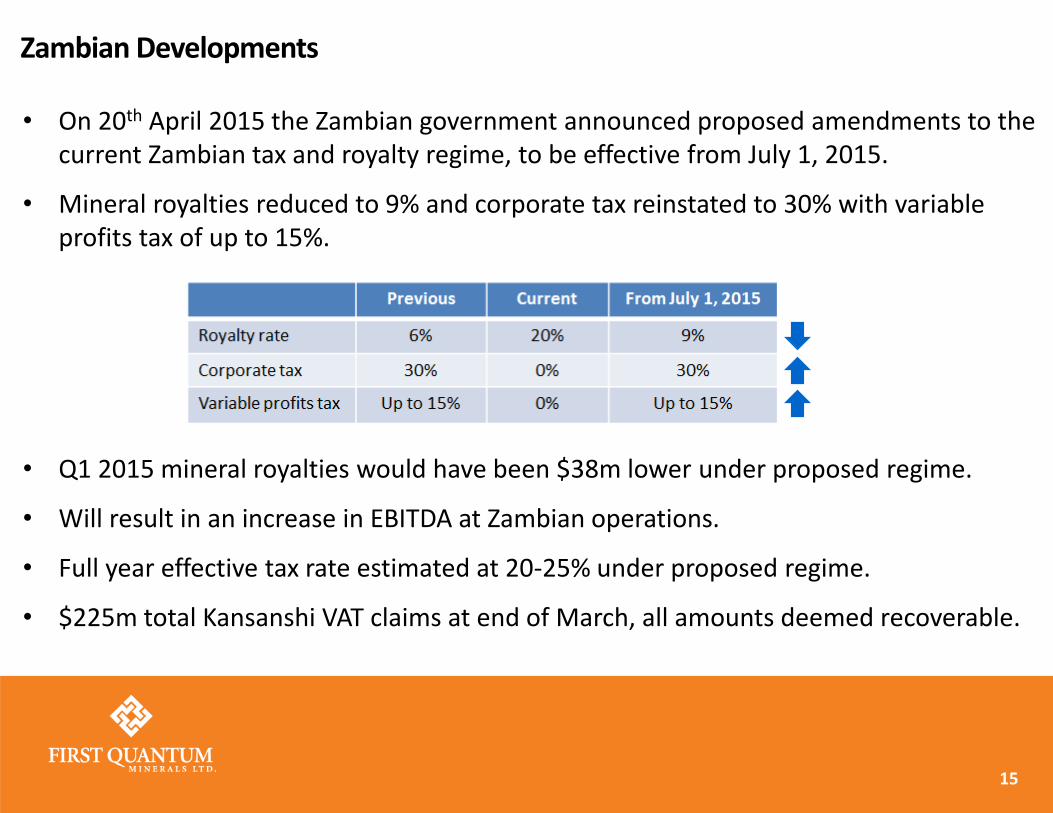
• On 20th April 2015 the Zambian government announced proposed amendments to the current Zambian tax and royalty regime, to be effective from July 1, 2015.
• Mineral royalties reduced to 9% and corporate tax reinstated to 30% with variable profits tax of up to 15%.
• Q1 2015 mineral royalties would have been $38m lower under proposed regime.
• Will result in an increase in EBITDA at Zambian operations.
• Full year effective tax rate estimated at 20-25% under proposed regime.
• $225m total Kansanshi VAT claims at end of March, all amounts deemed recoverable.

2015 Market Guidance
Copper C1 cost(2)
$1.30 – $1.55 per lb Nickel C1 cost
$4.80 – $5.30 per lb
Copper C1 cost guidance unchanged
Expected total 2015 capital expenditure is approximately $1.4 billion, excluding capitalization of any pre-commercial production costs, and capitalized interest (previously a range of $1.2-1.4 billion).
Capital expenditure guidance
Nickel C1 cost guidance unchanged
Production guidance for current operations remains unchanged
Copper production(1)
410 – 440k tonnes
Zinc production 40 – 45k tonnes
Nickel production 32 – 40k contained tonnes
Gold production 218 – 247k ounces
Palladium production 26 – 29k ounces
Platinum production 25 – 35k ounces
(1) Excludes Sentinel mine which is expected to produce between 120-150k tonnes copper following commissioning during the year (previous guidance was 150-200k tonnes copper).
(2) Inclusive of post-commercial production at Sentinel.
16

TURNING VISION INTO REALITY
First Quarter 2015
Conference Call & Webcast
May 1, 2015
TSX: FM; LSE: FQM