fiscal development - financefinance.gov.pk/survey/chapters/04-fiscal development08.pdf · the...
TRANSCRIPT

Chapter 04
FISCAL DEVELOPMENT I. Introduction
Fiscal year 2007-08 proved to be a difficult year for Pakistan, with several political and economic events transpiring unexpectedly. These events include heightened political tensions, soaring global oil prices, the international and domestic food inflation phenomena, a slowdown in global economic activity, and the troubled law and order situation prevalent in the country. However, the most important aspect was the non-responsive stance on account of political expediency, that is, not responding to the policy challenges emerging on Pakistan’s economic scene during most part of the fiscal year 2007-08. All these events have had adverse consequences for fiscal discipline. Because of the instability experienced at the onset of 2007-08, the fiscal deficit is expected to miss the target of 4.0 percent of GDP this year by a wide margin. The hard earned macroeconomic stability underpinned by fiscal discipline appears to have been evaporated. In other words, financial indiscipline during the outgoing fiscal year has already caused severe macroeconomic imbalances, for which, Pakistan is likely to pay a heavy price in terms of deceleration in growth and investment, and the associated rise in the levels of poverty; widening of current account deficit and the attendant rise in public and external debt; a loss of foreign exchange reserves and the associated pressure on the exchange rate; and most importantly, higher inflation and the associated rise in interest rates.
A sound fiscal position is vital for achieving macroeconomic stability, which is increasingly recognized as being critical for sustained economic growth and poverty reduction. The sooner Pakistan improves its fiscal position by making sharp fiscal adjustments, the lesser the price it is likely to pay for its fiscal indiscipline. A sharp fiscal adjustment can reduce large external current account
imbalances, restore the confidence of global investors, ease financing constraints, support growth and contain inflation. With a new government coming to power late in the fiscal year 2007-08, the need to adjust policies and counter the burden on the fiscal position has become a challenging task.
II. Fiscal Policy Developments
Pakistan’s fiscal policy position remained focused on sustained economic growth in unison with declining debt services, alleviating poverty and investing in physical and human infrastructure. The last seven years (2001-07) saw Pakistan improve its fiscal position considerably, given that the overall fiscal deficit, that averaged nearly 7.0 percent of GDP in the 1990s, had declined to an average of 3.8 percent (including earthquake spending). The underlying fiscal deficit targeted at 4.0 percent of GDP for 2007-08 is most likely to be surpassed owing to a variety of factors stated earlier.
A study of Table 4.1 discloses a change in pattern of both government revenues as well as expenditures over the last 17 years. Under revenues, tax-to-GDP and hence revenue-to-GDP ratios have shown a declining trend, owing mainly to structural deficiencies in the tax collection system. The expenditures of the government follow a similar pattern, with total expenditures showing an overall decline since the beginning of the 1990s. It should be pointed out that despite an overall decrease in total expenditures, it is heartening to see that development expenditure has shown a steady increase in recent years.
Fiscal deficit as percent of GDP has steadily declined during the same period, picking up slightly in the last two fiscal years, mainly on account of earthquake spending. The declining

pattern of the fiscal deficit was more to do with falling expenditures than rising revenues. Since 1999-2000, the fiscal deficit has been contained primarily due to an improvement in total revenues and also partly due to the rationalization of expenditure. The shifting of expenditure from current to development while leaving total expenditures stagnant at around 18 percent of GDP has helped improve the fiscal position while maintaining the focus of the government’s developmental needs for the country.
Moving forward, an additional reduction in fiscal deficit in the future should be largely driven from improvements in total revenue, more specifically, through the taxation system. The improvement in the tax collection effort should not just be the responsibility of the Federal Government but also the Provincial Governments, who must contribute their share by enhancing their provincial tax-to-GDP ratio from the current stagnant level of 0.5 percent to at least 1.0 percent of GDP in the medium-term.
Table 4.1: Fiscal Indicators as Percent of GDP
Year Real GDP Growth
Overall Fiscal Deficit
Expenditure Revenue Total Current Development Total Rev. Tax Non-Tax
FY91 5.4 8.8 25.7 19.3 6.4 16.9 12.7 4.2 FY92 7.6 7.5 26.7 19.1 7.6 19.2 13.7 5.5 FY93 2.1 8.1 26.2 20.5 5.7 18.1 13.4 4.7 FY94 4.4 5.9 23.4 18.8 4.6 17.5 13.4 4.1 FY95 5.1 5.6 22.9 18.5 4.4 17.3 13.8 3.5 FY96 6.6 6.5 24.4 20.0 4.4 17.9 14.4 3.5 FY97 1.7 6.4† 22.3 18.8 3.5 15.8 13.4 2.4 FY98 3.5 7.7 23.7 19.8 3.9 16.0 13.2 2.8 FY99 4.2 6.1 22.0 18.6 3.4 15.9 13.3 2.7 FY00 3.9 5.4 18.7 16.5 2.2 13.5 10.7 2.8 FY01 1.8 4.3† 17.2 15.5 1.7 13.3 10.6 2.7 FY02 3.1 4.3† 18.8 15.9 2.9 14.2 10.9 3.3 FY03 4.7 3.7 18.6 16.3 2.3 14.9 11.5 3.4 FY04 7.5 2.4 16.7 13.5 3.2 14.3 11.0 3.3 FY05 9.0 3.3† 18.4 14.5 3.9 13.8 10.1 3.7 FY06 5.8 4.2*† 18.7 14.4 4.3 14.2 10.4 3.8 FY07 6.8 4.3*† 20.2 15.8 4.4 14.9 11.0 3.9
FY08 B 7.2 4.0 18.8 13.8 5.0 14.8 11.0 3.8 Note 1: The base of Pakistan’s GDP has been changed from 1980-81 to 1999-2000, therefore, wherever GDP appears in denominator the numbers prior to 1999-2000 are not comparable. † Statistical discrepancy (both positive and negative) has been adjusted in arriving at overall fiscal deficit numbers. * Include earthquake related expenditure worth 0.8 and 0.5 percent of GDP for 2005-06 and 2006-07 respectively. III. Reforms in Tax Policy and Tax Administration
An adequate level of revenue generation is a sine quo non for public policy to meet expenditure obligations. Conversely, inadequacy of revenue generation directly affects the government’s resource position and the availability of socially desirable public goods. In Pakistan’s economic history, the mismatch between revenue collections and budgetary requirements was a norm rather than an exception. The reform efforts remained ineffective due to the inherent weaknesses in the tax system and an ineffective tax administration.
Pakistan’s tax structure is characterized by a number of structural weaknesses. First, due to a number of wide-ranging exemptions and concessions as well as rampant tax evasion, the tax base is narrow and punctured. Second, tax rates have been pitched at high levels, which created a vicious cycle of tax-base erosion and higher tax rates. Third, there is the issue of multiplicity of taxes, with an individual firm facing numerous types of taxes. Fourth, there is over dependence on indirect taxes, which until recently, accounted for nearly 60 percent share in revenues. This has increased the regressivity of the tax system and imposed a higher burden of taxation. Fifth, the tax

system is complex and tedious which, along with high rates, has bred corruption and encouraged evasion.
The combined result of such characteristics is the low and stagnant tax-to-GDP ratio on one hand, and low tax elasticity on the other. The tax-GDP-ratio, which represents the country’s fiscal effort, has remained stagnant in the neighborhood of 12 to 14 percent over the last three decades. Successive governments have introduced a number of wide-ranging reforms since the 1990s. The government specifically planned to make the tax policy more equitable; bring more taxpayers into the net; reduce the tax rate; streamline the tax laws so as to make them taxpayer friendly; improve tax enforcement and put in place a tax administration system that is efficient and responsive.
III.I. Major Reforms in Direct Taxes:
Major reforms introduced in the Direct Tax structure include the promulgation of the Income Tax Ordinance, 2001, which came into effect from 13th September 2001. The objective was to simplify the language of the Ordinance by removing ambiguities for ensuring uniformity in treatment of various categories of taxpayers, reduce the dependency on withholding taxes, encourage voluntary compliance backed by strong audit, and minimum tax exemption.
The introduction of Universal Self Assessment Scheme (USAS) for all categories of taxpayers, without any conditionality, has been a major breakthrough. The basic threshold of income tax is continuously being raised and the removal of a large number of income tax exemptions have been put in place. A two-tier agricultural income tax was initiated during the same period. A self-assessment scheme for filing of corporate tax was introduced. Some revenue reducing measures, principally cuts in corporate income tax rates have been put in place in recent years. This also ensured parity between the rates applicable to private, public and banking companies. Wealth tax was also abolished.
III.II. Major Reforms in Indirect Taxes:
a) The enactment of the Sales Tax Act, 1990 introduced its value added version renamed as General Sales Tax (GST).1 This was levied on goods only (with many exemptions) and that too at the manufacturing and import stages. A major leap forward was taken in 1995-96 when GST was converted into a full-fledged VAT mode tax with all its basic features; self-assessment, functional distribution, input tax credit facility and audit based procedures. To further increase its base, its coverage was extended to importers in 1997 and to wholesalers and retailers in 1998. With the expansion of service sector in 1990s, the anomaly that goods are being taxed but not the services was removed and the scope of GST was extended in 2000.
b) The major policy change introduced in the 2005 budget regarding Federal Excise was the system of self-assessment by withdrawal of federal excise staff from the manufacturing units. The idea was to improve the confidence of the taxpayers which should promote voluntary compliance. Similarly, the Federal Excise Act was transformed in conformity with the Sales Tax Act and the registration procedure was changed. The sales tax registration number will also be sufficient for the federal excise taxpayers. The mode of payment was rationalized to provide relief to the taxpayers. On some services and goods FED is payable in VAT mode i.e. in the same manner as provided in the Sales Tax Act of 1990.
c) Pakistan has made significant efforts in liberalizing its trade regime during the last two decades. The maximum tariff rate had declined from 225 percent in 1990-91 to 45 percent by 1996-97. It was further reduced to a maximum tariff rate of 25 percent (barring automobile sector) during fiscal year 2007-08. The average tariff rate stood at just 6 percent in fiscal year 2007-08 as compared to 65 percent in 1990-91. The number of tariff slabs was reduced from 13 to 4 during the same period. Quantitative import restrictions have already been eliminated except those relating to security, health, religious and cultural concerns. 1 The terms VAT, GST or Sales Tax have been used interchangeably in this paper implying same meaning.

The number of statutory orders that exempted certain industries from import duties was phased out by June 2004 and import duties on 4,000 items were reduced. Import liberalization measures were adopted for agricultural and petroleum products. Restrictions on agriculture exports were also removed.
III.III. Tax Administration Reforms:
The tax administration reform strategy stresses upon Policy, Administrative and Organizational reforms.
Policy reforms: This includes the simplification of laws, introduction of universal self-assessment, elimination of exemptions, reducing dependence on withholding taxes, and an effective dispute resolution mechanism.
Administrative reforms: This includes the transformation of the income tax organization on more functional lines, the re-engineering of manual processes of all taxes, increasing the effectiveness of FBR, and improving skills and integrity of the workforce.
Organizational reforms: This includes re-organization of FBR headquarters, reductions in the number of tiers, and the reduction in workforce from existing levels with enhanced financial packages. Simultaneously, the Government has constituted a Cabinet Committee for Federal Revenue (CCFR) to provide functional autonomy to the FBR.
The aim of these reforms is to have a fully integrated tax management system. There is a strong realization in the FBR that, apart from customs, other tax wings i.e. Sales Tax and Income Tax should be developed on similar standards so that at the end, FBR has one comprehensive integrated system. The change in name of the revenue board from CBR to FBR signifies a complete paradigm shift from an adversarial relationship between the taxpayers and collectors, to taxpayers’ facilitation and education to mobilize resources. The government has also approved a medium-term program for reforming tax administration in November 2001. Since then,
major efforts have been made to improve tax administration.
Some of the milestones already achieved under tax administration reform are summarized below:
• Establishment of Large and Medium Taxpayer Units: LTU was established on July 1, 2002 in Karachi, encompassing the three domestic taxes i.e. sales tax, central excise duty, and income tax. Medium Taxpayer Unit had started working in Lahore w.e.f. October, 1, 2002 to facilitate taxpayers. Before the FBR administrative reforms, Direct Taxes were being collected through the administrative set up of regional and zonal Commissionerates. This has now been converted into 13 RTOs in all the major cities and 3 LTUs Karachi, Lahore and Islamabad. The concept is to provide maximum facilitation to the taxpayers while consolidating the taxpayer’s data by co-locating the Direct Taxes, Sales Tax and the Federal Excise Duty
• Universal Self Assessment System: USAS is the corner-stone of the reform strategy of FBR. While sales tax is already on a self assessment basis, income tax has also been brought under the USAS through the Income Tax Ordinance 2001.
• Customs Administration Reform (CARE): The CARE project was established in April 2005. This project has introduced computerized Processing of Customs documents (PACCS) under which Goods Declaration (GD) can be filed by an importer on-line without physical interaction with customs officials. Model Customs Collectorates (MCCs) have been built around the functioning of PACCS as per reformed administrative structure that has evolved under the CARE initiative. The effectiveness and efficiency of the CARE program has encouraged the FBR to roll it out at 11 MCCs during FY06-07 and FY07-08, including four regional hubs.
• Sales Tax Automated Refund Repository (STARR) Project: The re-engineering and automation of the sales tax refund system was
identified as an essential component of the reform in sales tax. The implementation of the first phase had been completed and the system was evaluated and reviewed for the development and implementation of the second phase of the project. The second phase was implemented in July 2003 and on its completion the sales tax refund system will be transformed into a simpler, fully automated, risk-based system, enabling quick refunds and identifying high risk cases for scrutiny and audit. The STARR system has been upgraded and now refund claims are processed through Risk-based Refund Analysis System (RRAS). Existing sales tax offices located in Karachi have been consolidated in a single unit called the Model Sales Tax House, Karachi.
• Taxpayers Facilitation Centers (TFCs): With a view to promote voluntary compliance in a self assessment system of tax administration, taxpayer education and facilitation was given a priority.
• Income Tax Organization Structure: A new income tax organizational structure containing functions of taxpayer services, information processing, audit, enforcement, collection, legal, information technology, HRM and internal control was developed.
• Tax Administration Reform Program (TARP): The objectives of TARP include: (i) the implementation of universal self-assessment, (ii) creation of a functional organization, (iii) building of a taxpayer service function, (iv) use of modern work layout for conducting tax administration, (v) creation of database for management reporting, (vi) audit selection, (vii) statistical analysis, and (viii) automation in FBR and its field formations. An amount of US$ 24 million was utilized for establishment of the following projects under TARP: a) Establishment of 13 RTOs at Karachi, Hyderabad, Sukkur, Quetta, Lahore, Faisalabad, Multan, Gujranwala, Sialkot, Rawalpindi, Peshawar, Sahiwal, and
Abbotabad. b) Establishment of third LTU at Islamabad. c) Establishment of 12 MCCs d) Establishment of 65 TFCs throughout the country e) Construction of transit accommodation with RTOs.
To enhance the operations of the revenue board and increase tax collection many modern and innovative techniques have been adopted such as:
• E-Filling: The facility to file tax returns online.
• IC3: The Integrated Cargo/Container Control Program, which involves inspecting US-bound cargo at Pakistan’s seaports through a screening and imaging process.
• Improving Direct Tax Collection: The FBR is using a National Taxpayer Number for all taxpayers. However, it was recommended that the FBR uses the Computerized National Identification Card (CNIC) number for individuals while continuing the use of NTN for businesses.
• Case Tracking System for collection/enforcement: This system will track a case and provide its status (received, closed and inventoried, etc.) as it proceeds through the system.
• Computerized audit selection system: This system will select cases for audit based on an audit selection criteria established by member audit.
IV. Outcomes of Reforms
The structure of taxation in Pakistan has changed considerably following a number of tax and tariff reforms that started in the 1990s and were intensified during the recent decade. With a gradual reduction on the dependence on foreign trade taxes (collected through customs) and a concurrent increase in GST and direct tax collections, the composition of tax collections has been successfully modernized (see, Table 4.2 and Fig-4.1).

Fig-4.1: Structure of Taxes
1990-91
Customs 45.0%
Direct Taxes 18.0%
Excise 22.5%
Sales 14.4%
2007-08 (B.E)Direct Taxes 39.6%
Excise 8.8%
Customs 14.9%
Sales 36.3%
Excise duties accounted for about a fifth of FBR’s collection until 1998/99, targeting levies on utility services, bank advances, and other goods and services at the point of production. Since then, gradual cuts in excise duties, as well as removal of selected items from the excise net, have led to a sharp decline in collection, with excises comprising of only 8.8% of total FBR revenues or 0.8 percent of GDP in FY07-08.
Pakistan’s tax revenue-to-GDP ratio stood at only 10 percent of GDP during 2007/08 compared to an average of 18 percent for other developing countries indicating that substantial tax policy measures are still needed to broaden the tax base. The buoyancy and elasticity of the taxation system does not exhibit the desired improvements and needs to be focused upon. The country’s tax regime resembles the one generally practiced throughout Latin American countries, where indirect tax, in particular sales tax, occupies a relatively high share within the overall tax revenues. The indirect tax-to-GDP ratio stood at around 6 percent, and direct tax-to-GDP ratio was calculated to be 4 percent and less than 2 percent if withholding taxes are excluded. The government recognizes the need to broaden the tax base and reduce marginal tax rates which would stimulate investment and production. This would also promote voluntary tax compliance. Broadening of the tax base will also ensure the fair distribution of the tax burden among various sectors of the economy. The overall services sector including wholesale and retail trade as well as agriculture, are potential candidates for broadening of the tax bases.
During the decade ending in 1999-2000, the average growth of FBR tax collections stood at 12 percent. This growth rate was calculated at 14.5 percent during the period between 2000-2008. The slight increase from 12 to 14.5 percent confirms the positive impact of reforms but also reveals that more defined efforts are required to enhance overall collections. It is however encouraging to know that during the last few years the growth in revenue collection has been impressive at close to 20 percent.
The share of Direct Taxes in federal tax receipts has increased from around 18 percent in the early 1990s to 32 percent in 2000-01. It further increased to 39.6 percent in 2007-08. One of the implications of this change is that direct taxes have now emerged as the leading revenue contributors to federal taxation receipts – a transition that has always been desired on equity and efficiency grounds. Consequently, the direct-tax-to-GDP ratio continues to increase from 3.8% in FY06-07 to 4.1% in FY07-08. It is distressing however, that direct taxation in Pakistan accounts for only 4% of GDP whereas in other competing developing countries this ratio is as high as 7%.2
Indirect taxes currently account for 62 percent of the total revenues. The largest among these is the GST, which accounts for 39 percent of the total tax collections and its share in indirect taxes stood at 60.3 percent for FY07-08. VAT or GST in
2 For instance, the income and corporate tax to GDP ratio in Indonesia is 6.8%, Philippines 5.7%, Malaysia 7%, Thailand 6.3%, and India 3.7%. In the case of Bangladesh it is only 1.7% [Source: Information down loaded

Pakistan is a recent phenomenon. Nonetheless, its growth has been faster than any other tax. It has increased sharply both at domestic and import stage, from Rs. 16.0 billion in FY90-91 to Rs. 375 billion in FY07-08.
Induced largely by trade liberalization, the customs collection declined sharply over the past decade, but rose sharply from FY02-03 because of higher imports. As a share of GDP, customs collections
declined from 3.4 percent in FY94 to 1.1 percent in FY02. During the last few years, imports were growing in excess of 30 percent due to an unprecedented surge in domestic demand. Consequently, the current fiscal year witnessed an increase in gross and net collection from Rs. 132.2 billion in FY06-07 to 154 billion in FY07-08. Custom duties accounted for 24.7 percent of the total indirect taxes for the current year as compared to 25.5 percent last year.
Table 4.2: Structure of Federal Tax Revenue (Rs. Billion) Year Total
(FBR) Tax Rev as % of GDP
Direct Taxes
Indirect Taxes Customs Sales Excise Total
1990-91 111.0 11.0 20.0 [18.0]*
50 (54.9)^
16.0 (17.6)^
25.0 (27.5)^
91.0 [82.0]*
1996-97 282.0 12.0 85.0 [30.1]
86 (43.7)
56.0 (28.4)
55.0 (27.9)
197.0 [69.9]
1997-98 293.7 11.0 103.3 [35.0]
74.5 (39.1)
53.9 (28.3)
62.0 (32.6)
190.4 [65.0]
1998-99 308.5 10.0 110.4 [35.8]
65.0 (33.0)
72.0 (36.3)
60.8 (30.7)
198.1 [64.2]
1999-00 346.6 9.1 112.6 [32.5]
61.6 (26.4)
116.7 (49.9)
55.6 (23.7)
234.0 [67.5]
2000-01 392.3 9.4 124.6 [31.8]
65.0 (24.3)
153.6 (57.4)
49.1 (18.3)
267.7 [68.2]
2001-02 403.9 9.2 142.5 [35.3]
47.8 (18.3)
166.6 (63.7)
47.2 (18.0)
261.6 [64.7]
2002-03 460.6 9.6 148.5 [32.2]
59.0 (18.9)
205.7 (65.9)
47.5 (15.2)
312.2 [67.8]
2003-04 518.8 9.2 165.3 [31.9]
89.9 (25.4)
219.1 (62.0)
44.6 (12.6)
353.6 [68.1]
2004-05 588.4 8.9 176.9 [30.1]
117 (28.5)
235.5 (57.2)
58.7 (14.3)
411.4 [68.9]
2005-06 713.4 9.4 224.6 [31.5]
138 (28.3)
294.6 (60.4)
55.0 (11.3)
487.9 [68.5]
2006-07 847.2 9.7 333.7 [39.4]
132.3 (25.8)
309.4 (60.3)
71.8 (13.9)
513.5 [60.6]
2007-08 (B.E) 1025.0 10.3 408.2 [39.6]
154 (24.7)
375 (60.3)
91.0 (14.6)
622.3 [60.4]
*as % of total taxes ^ as % of indirect taxes Source: Federal Board of Revenue V. Trends in Expenditure
The Government’s plan of better fiscal transparency and improving expenditure management is still at the forefront of policy despite the impediments faced by the country during this fiscal year. The total expenditure of the government has remained more or less stable in a narrow band of 17 to 18 percent of GDP during the last nine years. There has been a substantial
decline in interest payments, from as high as 6.9 percent of GDP or Rs 262 billion in 1999-00 to 4.2 percent of GDP or Rs 369 billion in 2006-07. Interest payment are budgeted at 3.8 percent of GDP or Rs. 375 billion for FY07-08. This has provided fiscal relief, which has allowed expenditures to restructure in favour of development expenditure. Consequently, the share of current expenditure in total expenditure has

declined from 89 percent in 1999-00 to 82.3 percent in 2006-07. Current expenditures are budgeted at 73.4 percent for FY07-08. In absolute terms, the current expenditure stood at Rs 1375.3 billion during the last fiscal year and budgeted at Rs. 1378 billion for this fiscal year. Additionally, the share of development expenditure rose from 13.5 percent to 23.4 percent during the same period. Development expenditure bore the burden of structural adjustments during the 1990s as it declined from as high as 7.5 percent of GDP in 1991-92, to 2.5 percent of GDP by 1999-2000.
During the last eight years, development expenditure improved from 2.2 percent of GDP or Rs 89.8 billion in 2000-01 to 4.5 percent of GDP or Rs 394 billion in 2006-07. Development
expenditure is budgeted at 5.6 percent of GDP or Rs. 561 billion for FY07-08. The second largest component of current expenditure, namely, defence spending remained stagnant at around 3 percent of GDP during the last five years, and stood at Rs 275.0 billion in 2007-08. This shows that the Government is focused on removing infrastructural bottlenecks and building physical assets. The Government is also committed to achieving the goal of fiscal stabilization without compromising its spending on the social sector. Non-defence-non-interest expenditure has improved from 7.7 percent of GDP or Rs 95.6 billion in 1999-2000 to 12.3 percent of GDP or Rs 1225.1 billion in 2007-08. The historical trends observed in various components of expenditure are documented in Tables-4.3 (a+b).
Table 4.3 a): Trends in Components of Expenditure (As % of GDP)
Year Total
Expenditure (A)
Current Expenditure
(B)
Interest Payments
(C)
Defence (D)
Development Expenditure
(E)
Non Interest Non-Defence Exp (A-C-D)
Fiscal Deficit
Revenue Deficit/Surplus (TR-Total CE)
Primary deficit
(TR-NI Exp)1980-81 22.9 13.6 2.1 5.5 9.3 15.3 -6.0 3.3 -3.9 1984-85 24.7 17.7 3.5 6.7 7.0 14.5 -8.3 -1.3 -4.8 1988-89 26.1 19.9 5.0 6.6 6.3 14.5 -8.1 -1.8 -3.1 1989-90 25.9 19.3 5.5 6.9 6.5 13.6 -7.3 -0.8 -1.9 1990-91 25.6 19.2 4.9 6.3 6.4 14.3 -9.5 -3.1 -4.6 1991-92 26.5 19.0 5.2 6.3 7.5 15.1 -8.7 -1.1 -3.5 1998-99 20.9 18.6 7.5 4.9 3.3 8.6 -5.0 -2.7 2.5 1999-2000 18.5 16.4 6.9 3.9 2.5 7.7 -5.1 -3.0 1.7 2000-01 18.8 16.9 6.5 3.4 2.3 8.8 -4.3 -2.4 2.2 2001-02 18.6 15.7 6.2 3.4 2.8 9.1 -4.5 -1.7 1.6 2002-03 18.4 16.0 4.1 3.3 2.6 11.0 -3.6 -1.3 0.5 2003-04 16.4 13.8 3.5 3.2 2.9 9.7 -2.3 0.3 1.2 2004-05 17.2 14.5 3.2 3.3 3.5 10.7 -3.3 -0.7 -0.1 2005-06 18.5 14.8 3.1 3.2 4.3 12.2 -4.3 -0.6 -1.2 2006-07 19.2 15.8 4.2 2.9 4.5 12.1 -4.3 -0.9 -0.1 2007-08 B 18.8 13.8 3.8 2.8 5.6 12.3 -4.0 1.0 -0.2 B Budgeted Source: E A Wing Finance Division Note: The GDP was rebased w.e.f 1999-2000, so figures thereafter may not be comparable with earlier years
The two tables highlight the major developments on the expenditure side over the last three decades. Firstly, the rising trend in current expenditure has been arrested, mainly on account of declining interest payments and defence—the two major components of current expenditure. Interest payments have declined from a peak level of 7.5 percent of GDP in 1998-99 to almost 4.0 percent during the current year. Similarly, defence spending was at a significantly high level in 1989-90 at 6.9 percent of GDP but has declined gradually to below 3 percent today. These developments have provided more fiscal space to
the government for directing expenditures towards the development side, particularly towards physical and human infrastructure. These two tables reflect that both development and non-interest-non-defense spending have gone up substantially, particularly over the last five years. The message from these two tables is clear; going forward, the government must keep budget deficit at a lower level which would release resources from interest payment. In other words, a fiscal space would be available for investment in physical infrastructure and human development which are critical for sustaining growth and poverty reduction.

Table 4.3 b): Trends in Components of Expenditure (Rs Billion)
Year Total
Expenditure (A)
Current Expenditure
(B)
Interest Payments
(C)
Defence(D)
Development Expenditure
(E)
Non Interest Non-Defence Exp (A-C-D)
Fiscal Deficit
Revenue Deficit/Surplus (TR-Total CE)
Primary deficit
(TR-NI Exp)1980-81 63.6 37.8 5.9 15.3 25.8 42.4 -16.6 9.2 -10.7 1984-85 116.8 83.7 16.5 31.8 33.1 68.4 -39.4 -6.4 -22.9 1988-89 201.2 153.1 38.1 51.1 48.1 112.0 -62.1 -14.0 -23.9 1989-90 221.6 165.6 46.7 58.7 56.1 116.2 -62.8 -6.8 -16.1 1990-91 260.9 195.7 50.0 64.6 65.3 146.3 -97.1 -31.8 -47.1 1991-92 321.5 230.1 62.4 75.7 91.3 183.3 -104.9 -13.6 -42.5 1998-99 615.0 547.3 220.1 143.5 98.3 251.5 -146.4 -78.7 73.7 1999-2000 709.1 626.4 262.2 150.4 95.6 296.5 -196.6 -113.9 65.6 2000-01 717.9 645.7 249.3 131.2 89.8 337.4 -164.9 -92.7 84.4 2001-02 826.3 700.2 273.9 149.3 126.2 403.1 -202.2 -76.1 71.7 2002-03 898.1 781.9 199.8 159.7 129.2 538.6 -177.4 -61.2 22.4 2003-04 923.6 778.4 196.3 180.4 160.9 546.9 -129.5 15.7 66.8 2004-05 1117 943.1 210.2 211.7 228 695.1 -216.8 -42.9 -6.6 2005-06 1401.8 1121 237.1 242 326.7 922.7 -325.2 -44.4 -88.1 2006-07 1675.5 1375.3 368.8 249.9 394 1056.8 -377.5 -77.3 -8.7 2007-08 B 1874.7 1378.2 374.6 275 561 1225.1 -398.7 97.8 -24.1 B Budgeted Source: E A Wing, Finance Division
V.I. Trends in Real Expenditure
Expenditure in real terms (adjusted for inflation) is much more interesting than the nominal monetary value of expenditure, which is a direct charge on the budget. Therefore, it is worth scrutinizing the real growth patterns in expenditure and the interesting facts that it will reveal. Total real expenditure grew at a modest pace of 7.7 percent per annum, on average, in the 1980s owing to sharp acceleration of 10.5 percent in real current expenditure. Development expenditure grew by a modest 2.7 percent on average in real terms but interest payments grew by 18.1 percent, reflecting a tremendous pace of accumulation of public debt. Interestingly, real defence spending followed a higher growth path and grew by 8.9 percent on average. Such a level of fiscal indiscipline in the past forced Pakistan to undergo a painful period of structural adjustments in the 1990s. The rate of growth of real expenditure slowed in the first half
of the 1990s but at the expense of development expenditures which witnessed a contraction of 1.7 percent, on average, to contribute 2.4 percent growth in real expenditure in the period. Current expenditure, however, grew by 3.9 percent thanks to only 0.7 percent growth in defence spending and a relatively slower growth of 4.2 percent witnessed in interest payments. Non-defence-non-interest expenditure also grew by a modest 3.0 percent in real terms. Even the sharp fall in real development expenditure which contracted sharply by 3.5 percent in the second half of the 1990s could not restrict current expenditure to grow at a faster pace of 5.0 percent, mainly because of a massive 13.7 percent average growth in interest payments. Resultantly, total expenditure grew by 3.1 percent per annum in the period; however, non-interest non-defence expenditure registered a negative growth of 1.2 percent per annum. The second major item, defence spending, inched up marginally by 0.1 percent per annum.
Table 4.4: Trends in Real Expenditure(1999-2000=100) (%Growth)
Period Total Expenditure
Current Expenditure
Development Expenditure
Interest payment Defense
Non-Defense Non-Interest Expenditure
1980's 7.7 10.5 2.7 18.1 8.9 4.9 1990's 2.8 4.5 -2.6 8.9 0.4 0.9 1990-I 2.4 3.9 -1.7 4.2 0.7 3 1990-II 3.1 5.0 -3.5 13.7 0.1 -1.2 2000-04 1.4 0.14 9.4 -10.9 -0.2 11.0 2004-08* 10.9 7.4 27.2 10.7 3.3 13.8 * Budget estimate for 2007-08 Source: EA Wing, Finance Division

Total expenditure grew by 1.4 percent in the first four years (2000-04) of the current decade but accelerated to 10.9 percent during the last four years (2004-08). The main contribution came from development expenditure which grew by 9.4 percent per annum during the first four years (2000-04) and by 27.2 percent in the recent four years (2004-08). Current expenditure grew by 0.14 percent on average in the first four years (2000-04) of the decade, mainly on account of a sharper decline in interest payments and a marginal contraction in defense spending. During the last four year (2004-08) current expenditure in real term grew by 7.4 percent mainly on account of a sharper increase in interest payments and a moderate growth in defense expenditure.
V.II. Comparison of Defence, Development (PSDP) and Social Sector & Poverty-Related Expenditures
Defense expenditure at current prices showed a constantly increasing trend in the last decade.
During the current fiscal year 2007-08, defense expenditure went up by 10% from Rs 250 billion in 2006-07 to Rs 275 billion in 2007-08. The average growth of Defense expenditure at constant prices has been relatively sluggish at 4.5% owing to the government’s consistent efforts to minimize it and increase development and social sector expenditures.
A comparison of defence, development, social sector and poverty related expenditures in real term is well documented in Table 4.5. Contrary to the general perception, defence spending in real terms has grown at an average rate of 4.5 percent per annum as opposed to 15.2 percent for social sector and poverty related expenditures and 20.8 percent for development spending. In other words, development spending has grown at a much faster pace than social sector and poverty- related expenditures, its pace has over thrice the speed of growth in defence spending.
Table 4.5: Comparison of Defence, Development (PSDP) and Social Sector & Poverty-Related Expenditures
Defence Social Sector and Poverty Related-Expenditure
Development Expenditure (PSDP)
Current Prices Rs. Bn
% Change
Constant Price
Rs. Bn
% Change
Current Prices Rs. Bn
% Change
Constant Price
Rs. Bn
% Change
Current Prices Rs. Bn
% Change
Constant Price
Rs. Bn
% Change
1999-2000 150.4 - - - - - - - 95.6 - - - 2000-01 131.2 -12.8 122.9 - 122.3 - 114.6 - 89.8 -6.1 84.1 - 2001-02 149.3 13.8 136.5 11.0 167.3 36.8 153.0 33.5 126.2 40.5 115.4 37.2 2002-03 160.0 7.2 140.0 2.6 209.0 24.9 182.9 19.6 130.0 3.0 113.8 -1.4 2003-04 180.0 12.5 144.5 3.2 254.0 21.5 203.9 11.5 161.0 23.8 129.3 13.6 2004-05 212.0 17.8 159.0 10.0 316.0 24.4 237.1 16.2 228.0 41.6 171.0 32.3 2005-06 242.0 14.2 166.2 4.5 435.0 37.7 298.8 26.0 327.0 43.4 224.6 31.3 2006-07 250.0 3.3 159.3 -4.2 394.5 -9.3 251.3 -15.9 394.0 20.5 251.0 11.8 2007-08 275.0 10.0 - - 520.0 31.8 - - 508.0 28.9 - - Average 4.5 Average 15.2 Average 20.8
Source: Budget Wing, Finance Division
VI. Fiscal Performance: 2007-08
The total revenue collected during the current year stood at Rs 1545.5 billion, higher than the targeted level of Rs 1476 billion. This increase of Rs 69.5 billion from the budgeted revenues was mainly due to higher than targeted non-tax collections. Tax revenues however, exhibited a disappointing performance. Political disturbances and a less than satisfactory law and order situation seriously hampered the revenue collection efforts of the FBR. There are expectations that the FBR may fall short of its targeted level, and the year is most likely to end with tax collection amounting to Rs
1.0 trillion—Rs. 25 billion less than the original target. Notwithstanding the shortfall, the government has made an extraordinary effort to collect more resources from the non-tax revenue side. There are expectations that the government may collect an additional Rs. 103 billion in non-tax revenues, reaching to Rs. 483 billion. Slippages in provincial tax revenues amount to Rs. 8 billion [see Table 4.11].
The FBR was assigned an ambitious revenue target of Rs 1,025 billion for FY 2007-08, and to reach this target a reasonably high growth of 21% was required over the last year collection of Rs 847

billion. With a booming economy, the possibility of achieving this target was quite bright. However, revenue collection efforts were seriously hampered due to political unrest in the country during most of 2007-08. The chaotic incidents of December 2007, accompanied with a severe energy crisis and long hours of load shedding, adversely affected industrial production. Resultantly, FBR also suffered a revenue loss of Rs 35 billion. At the end of April 2008, the net collections had reached Rs 763.6 billion, higher by 16.3% over the net collection of PFY, but short of the assigned target of Rs 787.7 billion. Thus, revenue collection has so far achieved 97.0 percent of its target, which was Rs.1025 billion at the beginning of the year.
A detailed analysis reveals that the gross and net collection has increased by 12.3% and 16.3% respectively (see, Table 4.6). In absolute terms, the gross and net collections have gone up by Rs. 89.9 billion and 107.1 billion respectively. The overall refund/rebate payments during the first ten months of the current fiscal year (CFY) amounted to Rs. 55.8 billion relative to Rs. 73.0 billion paid back during the corresponding period of the past fiscal year (PFY). Among the four federal taxes, the highest growth of 28.9% was recorded in the case of federal excise receipts, followed by sales tax (19.5%), direct taxes (12.5%) and customs (11.4%).
Table 4.6: Gross and Net Revenue Receipts FY 07-08 FY 06-07 Growth% Months Gross Net Gross Net Gross Net July 55.9 50.9 54.5 46.2 2.6 10.3 August 63.0 60.1 54.0 46.3 16.7 29.8 September 100.7 94.1 101.0 91.4 -0.9 2.9 October 69.8 66.4 60.4 53.3 15.6 24.5 November 73.4 68.5 67.1 59.0 9.4 16.1 December 106.6 95.0 123.9 114.2 -13.9 -16.8 January 85.2 77.5 55.6 52.2 53.3 48.7 February 75.9 72.8 56.8 52.4 33.5 38.8 March 100.0 94.5 89.3 81.9 11.9 15.4 April 89.0 83.7 66.4 59.5 34.0 40.7 July-April 819.4 763.6 729.5 656.5 12.3 16.3
Source: Federal Board of Revenue VI.I. Detailed Analysis of Individual Taxes
Direct Taxes: The collection of direct taxes has suffered a substantial shortfall during July-March
FY 07-08 (see, Table 4.7). The gross and net collections have registered a growth of only 8.8% and 12.5%, respectively during the first ten months of the CFY.
Table 4.7: Direct Taxes: Gross and Net Revenue Receipts
Months FY 07-08 FY 06-07 Growth% Gross Net Gross Net Gross Net
July 15.2 14.1 11.6 10.1 30.8 39.9 August 15.4 15.0 12.9 11.1 19.0 35.1 September 51.1 48.4 52.0 45.3 -1.8 6.9 October 17.6 17.2 17.9 16.1 -1.8 6.8 November 20.2 18.7 17.4 13.9 16.0 34.4 December 58.5 51.2 80.4 76.2 -27.3 -32.9 January 31.1 27.1 13.5 12.5 130.0 117.3 February 25.6 25.0 14.8 13.8 73.2 81.6 March 43.1 41.0 42.8 38.9 0.8 5.4 April 28.3 26.9 17.8 15.1 58.6 78.5 July-April 306.1 284.6 281.3 252.9 8.8 12.5
Source: Federal Board of Revenue The refund payments have declined by 24.1%. The major reasons for less than expected growth in collection has been a substantial reduction in
payments with returns and a modest growth in advance tax payments partly because of procedural change in the tax regime largely due to a reduction

in taxable income of leading corporate entities. However, this shortfall has been recouped through extra tax effort. In fact, an amount of Rs 29.8 billion has been realized through demand creation during the period under review as against Rs 6.5
billion during the comparable period of PFY. Similarly, WHT has grown by 23.1%, whereas contracts and dividends have registered 36.8% and 37.5% growth in collection, respectively.
Table 4.8: Sales Taxes: Gross and Net Revenue Receipts
Months FY 07-08 FY 06-07 Growth% Gross Net Gross Net Gross Net
July 29.2 26.2 28.7 24.0 1.7 9.2 August 30.5 28.8 25.2 20.9 21.0 37.9 September 30.7 27.7 32.9 30.6 -6.8 -9.7 October 33.4 31.5 26.0 22.0 28.4 43.4 November 32.2 29.7 31.8 28.1 1.5 5.7 December 28.3 25.3 24.7 20.5 14.8 23.2 January 32.0 29.9 26.4 24.8 21.1 20.7 February 30.3 28.8 26.2 23.7 15.7 21.6 March 32.8 30.6 26.7 24.1 23.1 26.9 April 37.3 35.0 30.3 30.0 23.0 29.9 July-April 316.8 293.7 278.9 248.8 13.6 19.5
Source: Federal Board of Revenue Sales Tax: The gross and net sales tax collections amounted to Rs. 316.8 billion and Rs. 293.6 billion, showing a growth of 13.6% and 19.5%, respectively over the corresponding period of PFY (see, Table 4.8). The refund payment has declined by 30% during the same period. Most of the refunds have been paid to the textile, electrical energy and petroleum sectors. Of net collections, 46.2% was contributed by sales tax on domestic production and sales, while the rest was generated from imports. Within net domestic sales tax collections, major contribution has come from telecom services, POL products, electrical energy, natural gas (sugar, Iron & Steel) and cigarettes. Similarly, POL products, plastic & plastic
products, edible oil, vehicles, iron and steel and chemicals have major contribution in the import stage collection of sales tax.
Customs Duties: Collection under Customs duties has registered a positive growth of 10.0% and 11.4% in gross and net terms, respectively. The net and gross collection has increased from 114.4 billion and 103.1 billion in 06-07 to Rs 125.9 billion and Rs 114.8 billion during CFY (see, Table 4.9). The refund payments have declined by 2.6%. Major revenue sources have been the Automobiles, POL, machinery, edible oil, iron and steel etc. This sector has contributed around 62% of the net collection from Customs duties.
Table 4.9: Custom Duties: Gross and Net Revenue Receipts
Months FY 07-08 FY 06-07 Growth% Gross Net Gross Net Gross Net
July 9.6 8.7 10.2 8.1 -5.2 8.2 August 10.5 9.7 11.2 9.7 -5.8 0.2 September 11.4 10.5 11.2 10.1 1.7 4 October 11.2 10.2 10.9 9.8 2.3 3.8 November 12.6 11.8 12.3 11.5 2.6 2.8 December 12 10.7 12.9 11.6 -6.7 -7.6 January 15.3 13.8 10.3 9.6 48.2 43.6 February 12.2 11.2 10.2 9.3 19.3 19.9 March 16.2 15.3 13.9 13 16.9 17.5 April 14.7 12.9 11.3 10.4 30.4 24.2 July-April 125.9 114.8 114.4 103.1 10.0 11.4
Source: Federal Board of Revenue

Federal Excise Duty: A significant growth of 28.9% has been recorded in the net collection of FED due to extension of its base and levying of special excise duty @ 1% on domestic production and imports. The inclusion of a broad range of non-fund financial services and air travel into FED net has extended the scope of the tax by about 10%. The net collection during July-April 2008
has been Rs. 70.6 billion as against Rs 54.7 billion, amounting to an increase of Rs. 15.9 billion or 28.9 percent over previous year. The five major commodity groups namely cigarettes, cement, natural gas, beverages and POL products have contributed around 68% of FED receipts. The month-wise comparison of gross and net collection is reflected in Table 4.10.
Table 4.10: Federal Excise: Gross and Net Revenue Receipts
Months FY 07-08 FY 06-07 Growth% Gross Net Gross Net Gross Net
July 1.9 1.9 4.0 4.0 -53.6 -53.4 August 6.6 6.6 4.6 4.6 41.4 42.6 September 7.5 7.5 5.4 5.4 38.3 38.3 October 7.5 7.5 5.5 5.5 37.9 38 November 8.3 8.3 5.6 5.5 49.4 50.5 December 7.8 7.8 5.9 5.9 33.2 33.1 January 6.8 6.8 5.3 5.3 27.5 27.5 February 7.7 7.7 5.6 5.6 38.0 38.0 March 7.8 7.8 6.0 6.0 30.1 30.2 April 8.8 8.8 7.0 7.0 24.9 25.0 July-April 70.6 70.6 54.9 54.7 28.7 28.9
Source: Federal Board of Revenue VI-II. Review of Public Expenditure: 2007-08
The total expenditure for 2007-08 was budgeted at Rs. 1875 billion -- 11.9 percent higher than last year. Current expenditure on the other hand was budgeted at Rs. 1378 billion (almost equivalent to last year’s level) of which, Rs 862 billion was earmarked for the Federal government and the remaining Rs 416 billion was allocated for provincial governments. Development expenditure (after adjusting for net lending) was targeted at Rs 496 billion – 16.7 percent higher than last year. On the basis of revenue and expenditure projections, the overall fiscal deficit was targeted at Rs 398 billion or 4 percent of GDP as against 4.3 percent last year.
Fiscal Year 2007-08 has been a tough year for Pakistan’s economy. This year began in the backdrop of challenges emanating from domestic and external front. Surging oil, food and commodity prices accompanied by the turmoil in international financial markets and the disturbed domestic political conditions had an adverse impact on Pakistan’s budgetary position. Furthermore, over a year of inaction by the
previous government, on account of political expediency for addressing the challenges, accentuated the budgetary imbalances.
Large slippages have occurred on the expenditure side mainly on account of subsidies on oil, power, fertilizer, wheat and other foods. In addition to this, the interest payment significantly surpassed their targeted level. Oil subsidy was budgeted at Rs 15 billion and the price of oil in the international market was $50-55 per barrel (Arab Gulf Mean) during the time of the preparation of the budget 2007-08. It was also assumed that the government would pass on the rise in international price of oil to domestic consumers. Two factors had a significant impact on the budgetary outlook. Firstly oil prices continued to rise at a greater pace, reaching as high as $ 115 per barrel in May 2008--- an increase of over 116 percent during the fiscal year. Secondly, the lack of action on the part of the government aggravated the fiscal situation as the high international price of oil was not passed on to the domestic consumers. Consequently, the oil subsidy is projected to rise to Rs 175 billion— missing the targeted level by Rs 160 billion. Similarly, the higher cost of furnace oil used in

power generation, was not allowed to pass through to domestic consumers of electricity. Therefore, against the budgeted subsidy of Rs. 52.9 billion the projected power subsidy is likely to be Rs. 113 billion --- a slippage of Rs. 60 billion. At the time of the preparation of the Federal Budget 2007-08, the government never thought of importing wheat as there was a bumper wheat crop (23.3 million tones) in 2006-07. Hoarding, smuggling and mismanagement of wheat operations forced the government to import 1.7 million tonnes of wheat
at all time high prices. Since the government imported wheat at inflated prices and sold it in the domestic market at a cheaper price, the difference of Rs 40 billion had to be picked up by the government. Similarly, the government had to make extra payments on research and development in the textile sector, subsidy on imported fertilizer etc which were not a part of the 2007-08 budget. Altogether, there was a slippage of Rs. 324 billion under the item ‘others‘in current expenditures.
Table 4.11: Consolidated Revenue & Expenditure of the Government (Rs. Billion)
Prov. Actual
July-June 2005-06
Prov. Actual July-June 2006-07
Budget Estimate 2007-08
Revised Projections 2007-08*
A. Total Revenue 1077 1298 1476 1545.5 a) Tax Revenue 804 890 1096 1062.5 FBR Revenue 713.4 847.2 1025 1000 Provincial Tax Revenue 37 37 65 57 Others 54 7 6 0 b) Non-Tax Revenue 273 408 380 483 B. Total Expenditure 1402 1675 1875 2228.9 a) Current Expenditure 1121 1375 1378 1832.5 i) Federal 788 973 962 1416.5 - Interest 237 369 375 503.2 - Defense 242 250 275 277.3 - Others 309 354 312 636 ii) Provincial 333 402 416 416 b) Development Expenditure & Net Lending 367 425 496 396.4 PSDP 365 434 520 520 Net Lending 2 -9 3 -15.3 Operational Shortfall 0 0 -50 -125 Other Development expenditure - - 23.3 16.7 c) Unidentified Expenditure -86 -125 0 1 C. Overall Fiscal Deficit 325 377 398 683.4 As % of GDP 4.2 4.3 4.0 6.50% Financing of Fiscal Deficit 325 377 399 683.4 i) External Sources 149 147 193 119.4 ii) Domestic 79 159 131 564 - Bank 71 102 81 464 - Non-Bank 8 57 50 100 - Privatization Proceeds 97 71 75 0 GDP at Market Prices 7623 8723 9970 10478 *As revised on May 23rd , 2008 Source: Budget Wing, Ministry of Finance
Interest payments surpassed their targeted level by a significant margin. A sum of Rs. 375 billion was budgeted for interest payments in 2007-08. The year is likely to end with interest payments of Rs. 503.2 billion--- surpassing the targeted level by Rs 128.2 billion mainly due to two reasons. Firstly
there was a slippage on account of the National Savings Scheme (NSS) particularly with respect to Defence Savings Certificates (DSCs), amounting to Rs 54 billion. There was a massive maturity of DSCs that were issued in 1997-98 which were due for payment in 2007-08 (this is a ten year paper).

The NSS is still ill-equipped to determine how many of these certificates were encashed prematurely and how many were held till maturity. Secondly there was a slippage on account of floating debt and permanent debt mainly due to the substantial rise in the volume of borrowing as well as the rising interest rates. Therefore, a combination of underestimating the extent of maturity of the NSS instruments as well as substantial rise in the government’s borrowing requirements (because fiscal deficit was high: Rs 683 billion vs Rs 398 billion) and the consequential rise in interest rates of various instruments were responsible for the slippages in interest payments.
In order to counter massive gaps between budgeted and estimated targets in current expenditure, the government made efforts to mobilize more resources on the one hand, and postpone development spending on the other. An adjustment of Rs 100 billion was made in development expenditure. All these efforts were made to bring the budget deficit at an acceptable level in the wake of a difficult domestic and external environment.
The above developments on the revenue and expenditure sides resulted in massive slippages in the overall fiscal deficit for the year 2007-08. Against the target of Rs 398 billion or 4 percent of GDP the overall fiscal deficit is likely to be Rs 683.4 billion or 6.5 percent of GDP--- the highest in the last ten years (see, Table 4.11)
While domestic and external shocks of extra-ordinary proportions caused large slippages on the fiscal account, the financing plan of the fiscal deficit was also affected by these shocks. The overall fiscal deficit of Rs 398 billion was to be financed by external sources (Rs. 193 billion), and domestic sources (Rs 131 billion). The remaining Rs 75 billion was to come from privatization proceeds. Within domestic sources, Rs 81 billion financing was to come from banking sources while the remaining Rs 50 billion was to come from non-
bank sources. The domestic and external shocks not only increased the size of the fiscal deficit but they also changed the composition of financing. The borrowing requirements increased from Rs 324 billion (the net of privatization proceeds) to Rs 683.4 billion (with no privatization proceeds)—an increase of 111 percent.
External resource inflows were adversely affected by these shocks and against the budgeted level of Rs 193 billion, only Rs 119.4 billion is likely to materialize. Pakistan could not complete the transaction of Global Depository Receipts (GDRs) of the National Bank of Pakistan and could not launch sovereign and exchangeable bonds. Furthermore, some of the lending from the multilateral banks could not be materialized. These developments had adversely impacted the external resource inflows which remained below the budgeted level. Thus, the brunt of adjustments on the financing side fell on domestic sources. Against the budgeted financing of Rs 131 billion from domestic sources, it increased to Rs 564 billion. Within domestic sources the bulk (82.2 percent) of financing came from banks while the remaining Rs 100 billion or 17.8 percent came from non-bank sources. Most importantly, the borrowings from the State Bank of Pakistan (SBP) reached an alarming level. Such an elevated level of borrowing from the SBP is highly inflationary as well as posing serious complications for the conduct of effective monetary policy. Due to the excessive borrowing from the SBP, the money supply growth for the year 2007-08 is expected to breach the target of 13.7 percent.
VII. Provincial Budgets
The total outlay of the four provincial budgets for 2007-08 stood at Rs.521.7 billion, which is 19.0 percent higher than the outlay for last year (Rs.438.3 billion). NWFP witnessed the highest increase of 18.6 percent in budgetary outlay followed by the Punjab (16.3%). Sindh posted an increase of 9.9% while Baluchistan witnessed a decline of 8.8% in its expenditures mainly due to correction in the higher expenditures of the last

year. The overall provincial revenue receipts for 2007-08 are estimated at Rs. 645.9 billion, which is 21.5% higher than last year. Tax revenue, accounting for 80.8 percent of overall revenue receipts, amounted to Rs. 460.5 billion which is 19.2 percent higher than last year and non-tax revenue is estimated at Rs.78.8 billion which is 49.2 percent higher than last year. The total budget outlay of Rs. 755.2 billion is shared in the ratio of
67.8 percent and 32.2 percent between current and development expenditures, respectively. The allocations for development expenditure are 2.7 percent higher than last year and for current expenditure, they are higher by 17.9 percent. The main components of the Provincial budgets 2007-08 in comparison with revised estimates of last year are presented in Table-4.12.
Table 4.12: Overview of Provincial Budgets (Rs Billion)
Items Punjab Sindh NWFP Baluchistan Total
2006-07 (R.E)
2007-08 (B.E)
2006-07 (R.E)
2007-08 (B.E)
2006-07 (R.E)
2007-08 (B.E)
2006-07 (R.E)
2007-08 (B.E)
2006-07 (R.E)
2007-08 (B.E)
A. Total Tax Revenue 217.7 270.4 144.4 161.7 47.3 59.1 28.9 30.6 438.3 521.7 Provincial Taxes 31.5 37.3 16.3 18.8 3.1 3.9 1.1 1.2 52 61.2 Share in Federal Taxes 186.3 233.1 128.1 142.8 44.2 55.2 27.8 29.4 386.3 460.5 B. Non-Tax Revenue 35.2 59.8 6.9 7.8 8.7 9.2 2 2 52.8 78.8 C. All Others 6.1 8.6 9.2 11.3 10.6 11.3 14.4 14.2 40.3 45.4 Total Revenues (A+B+C) 259 338.8 160.6 180.8 66.6 79.5 45.3 46.8 531.5 645.9 a) Current Expenditure 201.1 243.5 144.2 166.7 55.2 61 34 41.1 434.5 512.3 b) Development Expenditure 137.1 150 43.9 40 29.5 39.5 25.9 13.5 236.4 242.9 i) Rev. Account 68.8 78.1 7 5.8 5.6 6.3 0 0 81.4 90.2 ii) Cap. Acount 68.3 71.9 36.9 34.2 23.9 33.2 25.9 13.5 155 152.8 Total Exp (a+b) 338.2 393.5 188.1 206.7 84.7 100.5 59.9 54.6 670.9 755.2
Source: Provincial Finance Wing, Ministry of Finance
VIII. Allocation of Revenue between the Federal Government and Provinces
The Constitution governs the relationship between the Government and the provinces with respect to the distribution of a divisible pool of taxes. According to the Constitution, every five years, the President forms a National Finance Commission (NFC) consisting of the Minister for Finance of the Federal Government, the Minister of Finance of each of the Provincial governments and other presidential appointees in consultation with the Governors of the provinces. The NFC then recommends to the President the distribution to be made between the Federal Government and the provinces with respect to the divisible pool of taxes consisting of income tax, sales tax, export duties on cotton, customs duties, excise duties (excluding excise duty on natural gas) and any other tax that may be specified by the President. Soon after the receipt of the recommendations of the NFC, the President implements these through a Presidential order specifying the share of the net proceeds of the taxes to be allocated to the provinces and the federal government. [The recommendations of the NFC together with an explanatory memorandum of action taken thereon are required to be sent to both Houses and to Provincial Assemblies]. Under the
Constitution, the President has the power to amend or modify the distribution of revenues as may be necessary or expedient. Since 1997, the share of the Federal Government in the divisible pool was fixed at 62.5% while the share of the provincial governments has been fixed at 37.5%. Beginning 2006-07, the share of the provincial governments in the divisible pool will rise annually to 41.5%, 42.5%, 43.75%, 45.0% and 46.25% thereafter in coming years. An account of transfer to provinces is given in Table-4.13.
IX. Public Debt
Public debt is the outcome of the developments taking place on the fiscal and current account deficits. A larger gap in these two deficits would cause the public debt to grow at a faster pace. Exchange rate depreciation would also cause the public debt to grow even if the government does not borrow a single dollar. Low fiscal and current account deficits, along with stability in the exchange rate, are critical in keeping the public debt at a sustainable level. Large fiscal and current account deficits lead to an accumulation of domestic and external debt which increases the country’s vulnerability to external shocks while
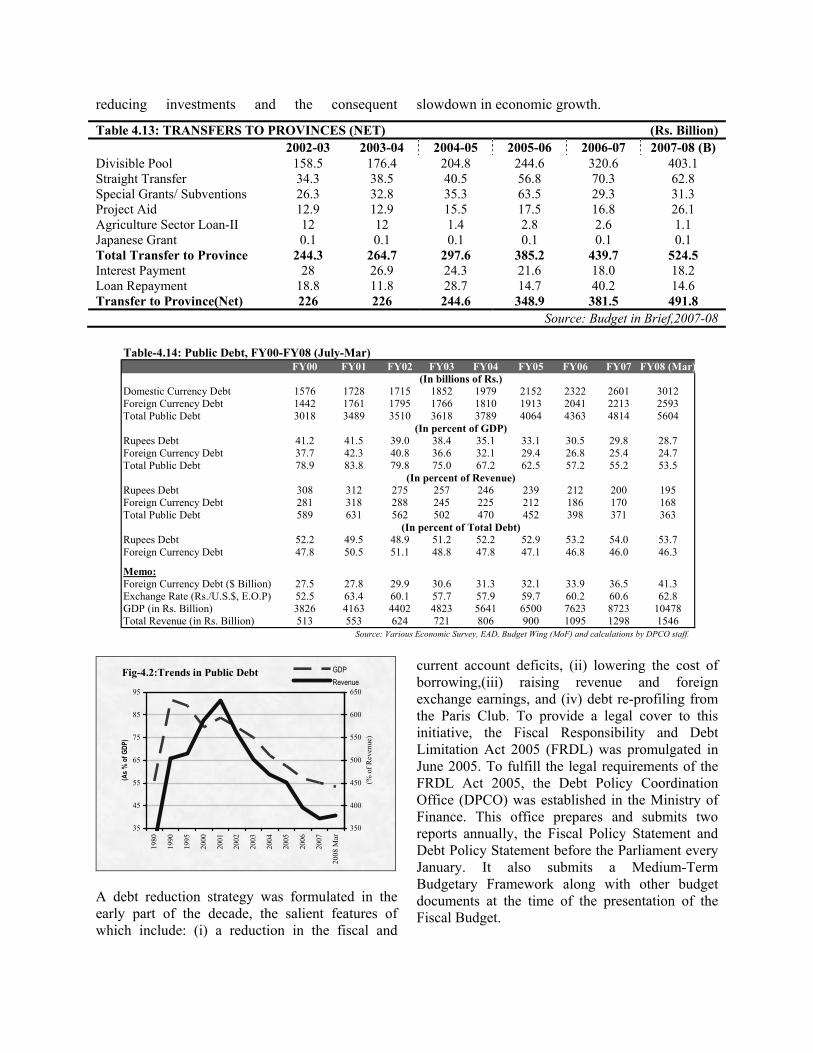
reducing investments and the consequent slowdown in economic growth.
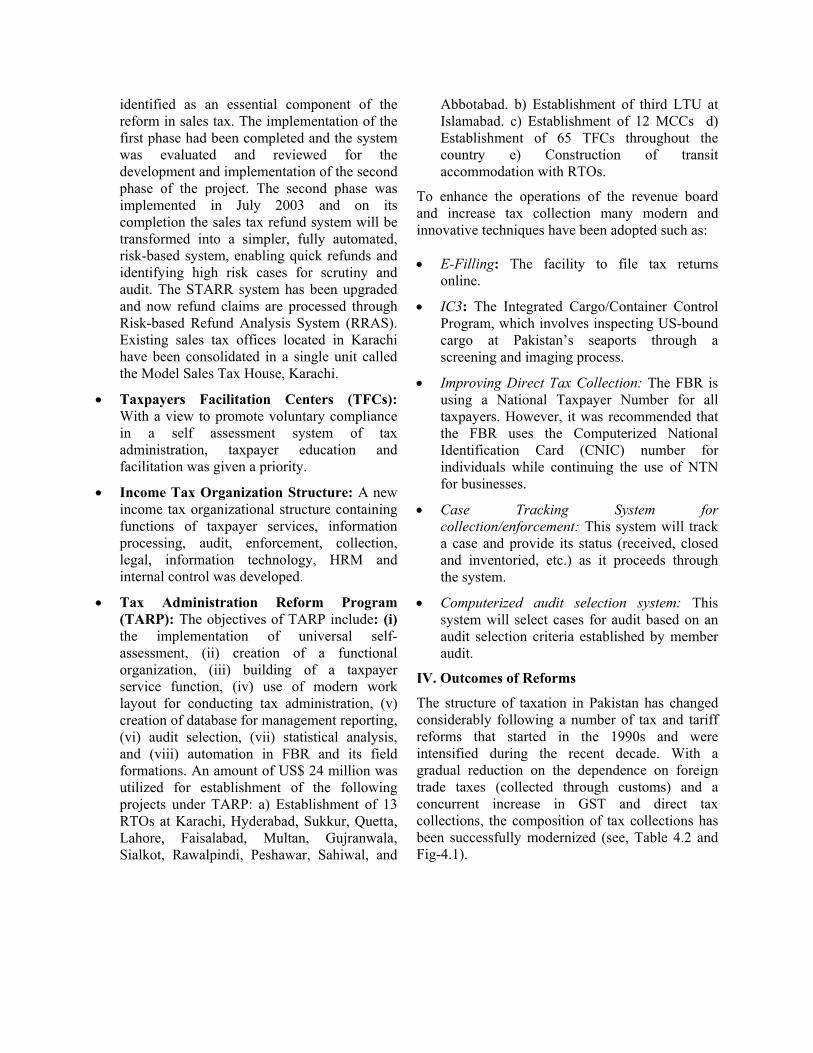
Table 4.13: TRANSFERS TO PROVINCES (NET) (Rs. Billion) 2002-03 2003-04 2004-05 2005-06 2006-07 2007-08 (B) Divisible Pool 158.5 176.4 204.8 244.6 320.6 403.1 Straight Transfer 34.3 38.5 40.5 56.8 70.3 62.8 Special Grants/ Subventions 26.3 32.8 35.3 63.5 29.3 31.3 Project Aid 12.9 12.9 15.5 17.5 16.8 26.1 Agriculture Sector Loan-II 12 12 1.4 2.8 2.6 1.1 Japanese Grant 0.1 0.1 0.1 0.1 0.1 0.1 Total Transfer to Province 244.3 264.7 297.6 385.2 439.7 524.5 Interest Payment 28 26.9 24.3 21.6 18.0 18.2 Loan Repayment 18.8 11.8 28.7 14.7 40.2 14.6 Transfer to Province(Net) 226 226 244.6 348.9 381.5 491.8
Source: Budget in Brief,2007-08
Fig-4.2:Trends in Public Debt
35
45
55
65
75
85
95
1980
1990
1995
2000
2001
2002
2003
2004
2005
2006
2007
2008
Mar
(As %
of G
DP)
350
400
450
500
550
600
650
(% o
f Rev
enue
)
GDPRevenue
A debt reduction strategy was formulated in the early part of the decade, the salient features of which include: (i) a reduction in the fiscal and
current account deficits, (ii) lowering the cost of borrowing,(iii) raising revenue and foreign exchange earnings, and (iv) debt re-profiling from the Paris Club. To provide a legal cover to this initiative, the Fiscal Responsibility and Debt Limitation Act 2005 (FRDL) was promulgated in June 2005. To fulfill the legal requirements of the FRDL Act 2005, the Debt Policy Coordination Office (DPCO) was established in the Ministry of Finance. This office prepares and submits two reports annually, the Fiscal Policy Statement and Debt Policy Statement before the Parliament every January. It also submits a Medium-Term Budgetary Framework along with other budget documents at the time of the presentation of the Fiscal Budget.
FY00 FY01 FY02 FY03 FY04 FY05 FY06 FY07 FY08 (Mar)
Domestic Currency Debt 1576 1728 1715 1852 1979 2152 2322 2601 3012Foreign Currency Debt 1442 1761 1795 1766 1810 1913 2041 2213 2593Total Public Debt 3018 3489 3510 3618 3789 4064 4363 4814 5604
Rupees Debt 41.2 41.5 39.0 38.4 35.1 33.1 30.5 29.8 28.7Foreign Currency Debt 37.7 42.3 40.8 36.6 32.1 29.4 26.8 25.4 24.7Total Public Debt 78.9 83.8 79.8 75.0 67.2 62.5 57.2 55.2 53.5
Rupees Debt 308 312 275 257 246 239 212 200 195Foreign Currency Debt 281 318 288 245 225 212 186 170 168Total Public Debt 589 631 562 502 470 452 398 371 363
Rupees Debt 52.2 49.5 48.9 51.2 52.2 52.9 53.2 54.0 53.7Foreign Currency Debt 47.8 50.5 51.1 48.8 47.8 47.1 46.8 46.0 46.3
Memo:Foreign Currency Debt ($ Billion) 27.5 27.8 29.9 30.6 31.3 32.1 33.9 36.5 41.3Exchange Rate (Rs./U.S.$, E.O.P) 52.5 63.4 60.1 57.7 57.9 59.7 60.2 60.6 62.8GDP (in Rs. Billion) 3826 4163 4402 4823 5641 6500 7623 8723 10478Total Revenue (in Rs. Billion) 513 553 624 721 806 900 1095 1298 1546
Table-4.14: Public Debt, FY00-FY08 (July-Mar)
Source: Various Economic Survey, EAD, Budget Wing (MoF) and calculations by DPCO staff.
(In percent of Total Debt)
(In billions of Rs.)
(In percent of GDP)
(In percent of Revenue)

The strategy followed so far has paid handsome dividends. Public debt as a percentage of GDP (a critical indicator of the country’s debt burden), which stood at 85 percent in end-June 2000, has declined to 55.2 percent by end-June 2007 – a reduction of almost 30 percentage points of GDP in seven years. The declining trend in public debt is likely to be reversed in 2007-08, mainly on account of a widening of the fiscal and current account deficits and a sharp depreciation of the rupee vis-à-vis the US dollar. By end-March 2008 the public debt as percentage of full year GDP stood at 53.5 percent. More damage has however, been done to public debt in the last quarter (April-June) of the current fiscal year, that is, a further widening of the fiscal and current account deficits, increased borrowing from domestic and external sources to finance the deficits, and a sharper adjustment to the exchange rate. The year 2007-08 is likely to end with public debt at around 56
percent of GDP – marking the first time in a decade to see a reversal in trends. Public debt in rupee terms has increased by 15.8 percent in the first nine months (July-March) of the fiscal year 2007-08.
Public debt is a charge on the budget and therefore, it must be viewed in relation to government revenues. Public debt stood at 589 percent of total revenues by end-June 2000 but declined to 363 percent by end-March 2008 – a reduction of 226 percentage points of revenue. Going forward, the key to the success of reducing public debt burden includes: a reduction in fiscal and current account deficits and maintaining stability in the exchange rate. A declining public debt would release government resources for public sector investment, would enable private sector to borrow more (crowding-in) for investment and thus promoting growth.
The rising stock of public debt has serious implications for debt service obligations. The debt servicing liabilities have declined sharply from 65.0 percent of total revenue in 1999-2000 to 28.5 percent of revenue in 2007-08 and from 53.5 percent of current expenditure to 31.7 percent of
current expenditure during the same period (see Figure-4.3). The subsequent fiscal space created by bridging the revenue-expenditure gap and low debt servicing cost has enabled the Government to increase poverty and social sector related expenditures from Rs. 89.8 billion or 2.2% of GDP
Fig-4.3: Debt Servicing (Consolidated)
05
10152025303540455055606570
1980
-81
1981
-82
1982
-83
1983
-84
1984
-85
1985
-86
1986
-87
1987
-88
1988
-89
1989
-90
1990
-91
1991
-92
1992
-93
1993
-94
1994
-95
1995
-96
1996
-97
1997
-98
1998
-99
99-2
000
2000
-01
2001
-02
2002
-03
2003
-04
2004
-05
2005
-06
2006
-07
2007
-08
(BE)
(as
% o
f)
Current ExpenditureTotal Revenue

in 2000-01 to a target level of Rs. 628.69 billion or 6.0% of GDP for 2007-08.
IX.I. Dynamics of the Public Debt Burden
A look at some of the main factors behind the surge in public debt over the last two decades reveals some important structural follies. The rise appears to be largely contributed by the high real cost of borrowing and stagnant government revenue. Total public debt consists of debt payable in rupees and debt payable in foreign exchange. The real cost of borrowing for these two components of public debt is measured differently. As shown in Table-4.15, the real cost of Pakistan’s domestic debt has varied substantially over time. During the 1980s, the real cost of borrowing for domestic public debt was only 1.0 percent. The interest rates on domestic debt rose sharply in early the 1990s due to financial sector liberalization but the impact of higher nominal interest rates to a large extent was wiped out by the sharp acceleration in inflation. The average real cost of borrowing for the domestic component of the public debt was 3.2 percent in the 1990’s because of double-digit inflation. Further dis-aggregation of the 1990s suggests that the real cost of domestic borrowing was negative (1.9 percent) in the first half of the 1990s but rose sharply (5.7 percent) in the second half, mainly on account of a decline in the inflation rate. During the first four years of the decade (2000-04), the real cost of borrowing for domestic debt was 5.8 percent owing to lower inflation but in the last four years (2004-08) the real cost of borrowing declined to 1.0 percent partly due to rising inflationary pressures in the economy as well as the declining nominal cost of borrowing.
The average real cost of foreign borrowing was 2.7 percent per-annum in the 1990s [See Table-4.15]. Further dis-aggregation reveals that the real cost of borrowing was much higher (5.9%) in the second half of the 1990s mainly on account of a sharp depreciation of the rupee vis-à-vis the US dollar and falling domestic inflation. During the first four years of the current decade (2000-04), the real cost of borrowing for foreign exchange denominated loan declined to 1.3 percent and further turned into
negative 4.4 percent in the last four years (2004-08). During 2004-08, the depreciation of rupee along-with higher inflation contributed to negative incidence of real cost of borrowing. The low implied cost of external borrowing has contributed to overall declining trend in real cost of borrowing during the last eight years.
As a result of the sharp fluctuation in the real cost of borrowing for both domestic and foreign debt, the dynamics of the growth in public debt also changed over the last two decades. The changing dynamics of public debt is well-documented in Table-4.16. The growth in the public debt burden averaged 2.0 percent per annum during the 1990s. Real public debt grew at a faster pace of 6.2 percent during the second half of the 1990s as did the public debt burden which rose by 3.7 percent against a marginal rise of 0.4 percent during the first half of the 1990s. The real cost of borrowing was highest at 5.6 percent per annum, on average, during the second half of the 1990s. A sharp real depreciation in the exchange rate causing real cost of borrowing to rise, slower real growth in revenue and a low level of international as well as domestic inflation had been responsible for the rise in the public debt burden in the second half of the 1990s.
As shown in Table 4.16, the primary fiscal balance turned negative, standing at -0.9 percent of GDP during 2004-08 while the real growth of debt registered an increase of 0.5 percent and at the same time revenue grew at a healthy average rate of 6.1 percent per annum. The combined effect of growth in revenue and sharp reduction in debt
External Debt Domestic Debt Public Debt
1980s 3.4 1.0 2.31990s 2.7 3.2 2.91990-I -3.0 -1.9 -2.41990-II -5.5 5.7 5.62000-04 1.3 5.8 3.62004-08* -4.4 1.0 -1.5Source: EA Wing and DPCO calculations.* Jul. 2004 - end Mar. 2008.
Table 4.15: Real Cost of Borrowing (Percent)

growth resulted in a sharp decline in the country’s debt burden during the last seven years. In order to assess the cost of borrowing, an implied interest rate is calculated as interest payments in FY08 divided by the stock at the end of previous financial year. The higher expenditure on debt servicing is mainly because of the maturities of DSCs sold in FY 1997-98. This shows that the government’s additional expenditure on domestic debt servicing was due to past financing commitments and not excessive spending in fiscal
year 2007-08. An analysis of the dynamics of the public debt burden provides useful lessons for policy-makers to manage the country’s public debt. First, every effort should be made to maintain a primary surplus in the budget. Second, the interest rate and inflation environment should remain benign. Third, the pace of revenue growth must continue to rise to increase the debt carrying capacity of the country. Center to all these lessons is the pursuance of prudent monetary, fiscal and exchange rate policies.
Table-4.16: Dynamics of Public Debt Burden
Primary Fiscal Balance Real Cost of Borrowing
Real Growth of Debt
Real Growth of Revenues
Real Growth of Debt Burden
% of GDP % Per Annum 1980s -3.7 2.3 10.6 7.6 3.0 1990s -0.3 2.9 4.9 2.9 2.0 1990-I -1.8 -2.4 3.6 3.2 0.4 1990-II 1.1 5.6 6.2 2.5 3.7 2000-04 1.7 3.6 0.3 6.1 -5.8 2004-08* -0.9 -1.5 0.5 6.1 -5.6 * July 2004 - end March 08 Source: EA Wing & DPCO Calculations
X. Domestic Debt
Most developing countries have a relatively small banking sector which limits the availability of loanable funds. Borrowing from domestic financial sources has several advantages including: avoidance of exchange rate risk, lower liquidity risk and ability to deflate debt through higher inflation. However, excessive borrowing by the public sector could lead to crowding out of the private sector as well as high interest rates and inflation. With the expansion of the financial sector in Pakistan, the government has relied more on borrowings from the domestic sector in recent years, reflecting in an increase in the share of domestic debt in total debt, standing in at 53.8 percent up to March 2008.
By end-June 2007 total domestic debt stood at Rs. 2610.2 billion which was estimated at 30 percent of GDP. The outstanding stock of domestic debt rose by Rs 409.9 billion and stood at Rs. 3020.1 billion by end-March 2008 or 30.3 percent of GDP. The domestic debt has increased by 15.7 percent
by end-March 2008 over end-June 2007 (see, Table 4.18). This growth in domestic debt when viewed at the back of an average growth of 8.1 percent of the last five years suggest that though the economy’s debt carrying capacity has improved in recent years, the current rise in debt burden was witnessed mainly due to the excessive borrowing of the government from the central bank as well as from non-bank sources to finance a large budget deficit. The increase in domestic debt mainly emanates from floating debt (27.1%) while the other two components, unfunded and permanent, witnessed a modest growth of 6.1 percent and 9.4 percent, respectively.
X.I. Composition of Domestic Debt
Pakistan’s domestic debt has undergone considerable change in its composition in recent years. The share of floating debt (a short-term instrument) in total domestic debt increased from 36 percent in end-June 2005 to 46.6 percent in end-March 2008 – more than a 10 percentage points in the last four years. The shape of long-term debt instruments (unfunded debt) decline from almost

40 percent to 33 percent in the same period. More reliance on short-term instruments to finance the fiscal deficit involves risks as more resources will be required in quick succession. Going forward, attempts should be made to rely as little as possible on short-term instruments, particularly borrowing from the SBP to finance the fiscal deficit.
X.I.i Unfunded Debt
The stock of unfunded debt has witnessed an increase for a third year running. Having fallen
from a stock of 909.5 billion in 2002-03 to Rs 854 billion in 2004-05, unfunded debt has risen to Rs 997.2 billion by the end of March 2008, an increase of 6 percent from last year or Rs 57.2 billion. This type of debt includes the various instruments that fall under the National Saving Schemes (NSS). In response to various reforms in the NSS, the unfunded debt saw a substantial increase starting in the first nine months of FY 2006-07 and the trend has continued into the current fiscal year.
Table-4.17: Outstanding Domestic Debt (Rs. Billion) End June End March
2002 2003 2004 2005 2006 2007 2008 Permanent Debt* 424.8 468.8 570.0 526.2 514.9 562.5 615.7 Floating Debt** 557.8 516.3 542.9 778.2 940.2 1107.7 1407.2 Unfunded Debt*** 792.1 909.5 899.2 854.0 859.2 940.0 997.2 Total 1774.7 1894.5 2012.2 2158.4 2314.3 2610.2 3020.1 Total Domestic Debt as % of GDP 40.3 39.3 35.7 32.8 30.0 30.0 30.3 * Market Loans, Federal Government Bonds, Income Tax Bonds, Government Bonds (L.R. – 1977), Special Government Bonds For SLIC (Original), Special Government Bonds for SLIC (Capitalization), Bearer National Fund Bonds (BNFB), Special National Fund Bonds, Fe ** Treasure Bills (3 Months), Market Treasury Bills, MTBs for Replenishment. *** Defence Savings Certificates, National Deposit Certificates, Khas Deposit Certificates, Special Savings Certificates (Reg), Special Savings Certificate (Bearer), Regular Income Certificates, Bahbood Savings Certificates, Khas Deposit Accounts, Saving P = Provisional.
Source: Debt Management Section, Ministry of Finance.
X.I.ii Floating Debt and Permanent Debt
The share of floating debt, which was undergoing a substantial decline since the 1990s, increased by 27 percent or Rs 299.5 billion amounting to Rs 1407.2 billion by end-March 2008 (see, Table 4.17).
The stock of permanent debt also exhibited a moderate increase of Rs 53.2 billion or 9.4 percent and stood at Rs 615.7 billion by end March 2008. The increase in permanent debt is associated with efforts made by the Government to access funds
from auctions of the PIBs to satiate appetite for long-term paper and to promote the idea of secondary market development. The administration has made an effort to balance between long-term and short-term securities. The trade-off between short-run and longer run maturity is intricately designed to keep debt servicing cost lower.
The major reason for the weak performance of these long term instruments can be attributed to firstly increased market depth, providing diversified investment opportunities and secondly the rigidities in profit payment structure of these instruments that penalizes investors by denying them profit on the broken period. During July-Mar FY08 period, debt servicing cost of the domestic debt increased by 52.1 percent, and stood at Rs 328 billion mainly due to increase in unfunded debt servicing cost.
X.II. Domestic Debt Burden
In recent years, the burden of interest payments on the domestic debt has declined sharply, thereby,
Figure-4.4: S tructure of Domestic Debt, FY00-FY08(In percent of total domestic debt)
10
20
30
40
50
FY00
FY01
FY02
FY03
FY04
FY05
FY06
FY07
FY08(M
ar)
Financal Year
(In
perc
ent)
Unfunded Debt
Permanent Debt
Floating Debt

releasing resources for development and social sector programs.
A cursory look at the Table-4.18 is sufficient to see that the interest payments as a percentage of total revenue have been reduced to one-half (from 41 percent to 21.6 percent) over the last eight years. Similarly, share of interest payments in total expenditure declined from 29.6 percent to 17 percent during the same period. Most importantly
interest payments declined from 5.5 percent to 3.0 percent of GDP, in the last eight years. Interest payments stood at 21.6 as a percentage of total revenue as compared to 22.1, percent last year. A declining trend was also observed in interest payments as a percentage of GDP and total expenditure which has fallen from 3.3 percent to 3.0 percent and from 17.2 percent to 17.0 percent respectively during the current fiscal year.
Table 4.18: Domestic Debt & Its Interest Payments
Fiscal Year
Domestic Debt
(Rs. Bln)
Interest Payments (Rs. Bln)
Interest Payments as % of Tax
Revenue Total
Revenue Total
Expenditure Current
Expenditure GDP (mp)
1990-91 448.2 35.7 27.5 20.8 13.7 18.2 3.5 1991-92 531.5 50.3 30.6 21.7 15.6 21.9 4.2 1992-93 615.3 62.7 35.2 26.0 18.0 23.0 4.7 1993-94 711.0 77.5 37.2 28.4 21.3 26.4 5.0 1994-95 807.7 77.9 30.2 24.1 18.2 22.5 4.2 1995-96 920.3 104.5 34.2 27.5 20.2 24.7 4.9 1996-97 1056.1 126.5 39.0 32.9 23.4 27.3 5.2 1997-98 1199.7 167.5 47.2 39.0 26.4 31.6 6.3 1998-99 1452.9 175.3 44.9 37.4 27.1 32.0 6.0 1999-00 1644.8 210.2 51.8 41.0 29.6 33.5 5.5 2000-01 1799.0 188.5 42.7 34.1 26.3 29.2 4.5 2001-02 1774.7 189.5 39.6 30.4 22.9 27.1 4.3 2002-03 1894.5 166.9 30.0 23.2 18.6 21.1 3.4 2003-04 2027.5 161.5 26.1 20.0 17.2 21.2 2.9 2004-05 2177.6 176.3 26.7 19.6 15.8 20.4 2.7 2005-06 2336.8 202.5 25.2 18.8 14.4 19.6 2.7 2006-07 2610.2 287.5 32.3 22.1 17.2 23.0 3.3 2007-08* 3140.7 318.2 29.0 21.6 17.0 23.1 3.0 *Budget Estimate Source: Budget Wing, Ministry of Finance XI. Concluding Remarks
Fiscal Year 2007-08 has been one of the most difficult years for Pakistan’s economy, as several political and economic events transpired unexpectedly, adversely affecting the country’s fiscal position. As a result, the overall fiscal deficit is likely to be 6.5 percent of GDP against the budgeted number of 4 percent. Such a large slippage on the fiscal side has already caused severe macroeconomic imbalances. The hard-earned macro economic stability underpinned by fiscal discipline appears to have been lost and Pakistan is likely to pay a heavy price in terms of deceleration in growth and investment, reversal in poverty trends, widening of current account deficit,
rise in public and external debt, depletion of foreign exchange reserves and mounting pressures on the exchange rate.
A sound fiscal position is crucial for achieving macroeconomic stability, which is widely accepted as being imperative for sustained economic growth and poverty reduction. The sooner Pakistan improves its fiscal position by making decisive fiscal adjustments, the lesser the price it is likely to pay for its fiscal indiscipline. A sharp fiscal adjustment can reduce large external current account imbalances, restore the confidence of global investors, ease financing constraints, support growth and contain inflation.

TABLE 4.1
(Rs Million)
Fiscal Year/ 2006-07 2007-08Item (R.E) (Q.E)A. REVENUE
1. Direct Taxes 334,168 405,000 2. Indirect Taxes 513,003 627,000
i. Customs 132,200 154,000 ii. Sales Tax 309,228 375,000iii. Federal Excise 71,575 98,000
3. Total Tax Revenue 847,171 1,032,000(1+2) 911,717 1,085,000
4. Surcharges (Gas & Oil) 64,546 53,000 5. Non-Tax Revenue 362,864 403,000 6. Total Revenue Receipts 1,274,581 1,488,000
Gross (3+4+5)B. EXPENDITURE
9. Current Expenditure* 973,130 1,416,500i. Defence 249,858 277,300ii. Interest 369,000 503,200iii. Grants 111,475 87,000iv. Economic Services @ 87,447 78,900v. Subsidies 74,010 373,300vi. Other 81,340 96,800
10. Development Expenditure(PSDP) 200,600 297,30011. Total Expenditure (9+10) 1,173,730 1,713,800
RE- Revised Estimate Source: Budget Wing, Finance Division, IslamabadQ.E.- Quick Estimates@ : Include Law and Order, Social, Economic and Community Services* Current expenditure here includes earthquake related spendings
FEDERAL GOVERNMENT OVERALL BUDGETARY POSITION

TABLE 4.2
(Rs Million)% Change
Fiscal Year/ 1997-98 1998-99 1999-00 2000-01 2001-02 2002-03 2003-04 2004-05 2005-06 2006-07 2007-08 2007-08/Item R.E. (Q.E) 2006-07Total Revenues (I+ii) 429,454 468,601 512,500 553,000 624,100 720,800 794,000 900,014 1,076,600 1,297,957 1,545,500 19.1
Federal 400,342 429,691 477,600 514,000 584,000 673,600 741,000 842,900 992,200 1,215,730 1,408,500 15.9Provinical 29,112 38,910 34,900 39,000 40,100 47,200 53,000 57,114 84,400 82,227 137,000 66.6
I) Tax Revenues 354,754 390,726 405,600 441,600 478,100 555,800 611,000 659,410 803,700 889,685 1,062,500 19.4Federal 338,042 375,078 386,800 422,500 459,300 534,000 583,000 624,700 766,900 852,866 1,005,500 17.9Provinical 16,712 15,648 18,800 19,100 18,800 21,800 28,000 34,710 36,800 36,819 57,000 54.8
ii) Non-Tax Revenues 74,700 77,875 106,900 111,400 146,000 165,000 183,000 240,604 272,900 408,272 483,000 18.3Federal 62,400 54,613 90,800 91,500 124,700 139,600 158,000 218,200 225,300 362,864 403,000 11.1Provinical 12,300 23,262 16,100 19,900 21,300 25,400 25,000 22,404 47,600 45,408 80,000 76.2
Total Expenditures (a+b+c 634,014 647,778 709,100 717,900 826,250 * 898,200 956,000 1,116,981 1,401,900 1,799,968 2,228,900 23.8a) Current 529,919 547,279 626,400 645,700 700,200 791,700 775,000 864,500 1,034,700 1,375,345 1,832,500 33.2
Federal 407,219 424,443 477,900 479,000 524,600 599,800 557,000 664,200 789,100 973,130 1,416,500 45.6Provinical 122,700 122,836 148,500 166,700 175,600 191,900 218,000 200,300 245,600 402,215 416,000 3.4
b) Development(PSDP) 104,095 98,286 95,600 89,800 126,250 129,200 161,000 227,718 365,100 433,658 411,700 -5.1c) Net Lending to PSE's - 2,213 -12,900 -17,600 -200 -22,700 20,000 24,763 2,100 -9,035 -15,300 -d) Statistical Discripency - - 9,700 14,800 -11,700 3,200 -32,000 0 -86,307 -124,510 0 -Overall Deficit -204,560 -179,177 -206,300 -179,700 -190,450 -180,600 -130,000 -216,967 -325,300 -377,501 -683,400 -Financing (net) 204,992 179,177 206,300 179,700 190,450 180,600 130,000 216,988 325,200 377,501 683,400 -
External (Net) 38,761 97,070 69,700 120,700 83,100 113,000 -5,900 120,432 148,900 147,150 119,400 -Domestic (i+ii) 166,231 82,108 136,600 59,000 107,350 67,600 135,900 96,556 176,300 230,351 564,000 -i) Non-Bank 118,202 155,919 96,700 92,000 85,000 119,500 61,000 8,050 8,100 56,905 100,000 -ii) Bank 48,029 -73,811 39,900 -33,000 14,000 -55,600 63,690 60,179 70,900 101,982 464,000 -iii) Privatization Proce - - - - 8,350 3,700 11,210 28,327 97,300 71,464 0 -
Memorandum ItemGDP (mp) in Rs. Billion 2,678 2,938 3,826 4,210 4,453 4,876 5,641 6,500 7,623 8,723 10,478 20.1
Total Revenue 16.0 15.9 13.4 13.1 14.0 14.8 14.1 13.8 14.1 14.9 14.7Tax Revenue 13.2 13.3 10.6 10.5 10.7 11.4 10.8 10.1 10.5 10.2 10.1Non-Tax Revenue 2.8 2.7 2.8 2.6 3.3 3.4 3.2 3.7 3.6 4.7 4.6
Expenditure 23.7 22.0 18.8 17.4 18.3 18.5 16.9 17.2 18.4 20.6 21.3Current 19.8 18.6 16.4 15.3 15.7 16.2 13.7 13.3 13.6 15.8 17.5Development 3.9 3.3 2.5 2.1 2.8 2.2 3.2 3.9 4.8 4.9 3.8
Overall Deficit Incl. E.quak 7.7 6.1 5.4 4.3 4.3 3.7 2.3 3.3 4.3 4.3 6.5Q.E: Quick Estimates Source: Budget Wing, Finance Division, IslamabadR.E: Revised Estimates
£ Beginning from 1999-2000, Pakistan's GDP was rebased at 1999-2000 Prices from two decades old base of 1980-81 Therefore, wherever, GDP appears in denominator the number of prior to 1999-2000 are not comparable.
SUMMARY OF PUBLIC FINANCE (CONSOLIDATED FEDERAL AND PROVINCIAL GOVERNMENTS)
(As Percent of GDP at Market Price)£

TABLE 4.3
(Rs Million)% change
Fiscal Year/ 1997-98 1998-99 1999-00 2000-01 2001-02 2002-03 2003-04 2004-05 2005-06 2006-07 2007-08 2007-08/Item (R.E) (Q.E) 2006-07Total Revenue (I+II) 429,454 468,601 512,500 553,000 624,100 720,800 793,700 900,014 1,076,600 1,297,957 1,545,500 19.1
Federal 400,442 429,691 477,600 514,000 584,000 673,600 743,600 842,900 992,200 1,215,730 1,408,500 15.9Provincial 29,012 38,910 34,900 39,000 40,100 47,200 50,100 57,114 84,400 82,227 137,000 66.6
I. Tax Revenues (A+B) 354,754 390,726 405,600 441,600 479,335 555,800 611,000 659,410 803,700 889,685 1,062,500 19.4Federal 338,042 375,078 386,800 422,500 460,224 534,000 583,000 624,700 766,900 852,866 1,005,500 17.9Provincial 16,712 15,648 18,800 19,100 19,111 21,800 28,000 34,710 36,800 36,819 57,000 54.8
A. Direct Taxes (1+2) 105,098 105,588 115,672 128,556 147,403 157,886 171,188 186,473 224,147 337,639 385,100 14.1 Federal 103,182 103,476 112,600 124,585 142,649 151,976 164,497 176,930 215,000 334,168 376,000 12.5 Provincial 1,916 2,112 3,072 3,971 4,754 5,910 6,691 9,543 9,147 3,471 9,100 162.2
B. Indirect Taxes(3+4+5+6+7) 249,656 285,138 289,928 313,044 331,932 397,914 439,812 472,937 579,553 552,046 677,400 22.73. Excise Duty 62,922 62,691 56,934 50,325 48,572 45,437 47,538 60,813 58,702 74,026 100,649 36.0
Federal 62,011 60,572 55,600 49,000 47,189 44,002 45,823 58,670 55,000 71,575 98,000 36.9 Provincial 911 2,119 1,334 1,325 1,383 1,435 1,715 2,143 3,702 2,451 2,649 8.1
4. Sales Tax* 53,942 68,680 116,767 153,500 166,618 195,138 220,607 235,533 294,600 309,228 375,000 21.35. Taxes on Interna-
tional Trade 74,496 78,654 61,600 65,000 47,817 68,835 90,940 117,243 138,200 132,200 154,000 16.56. Surcharges* 42,911 61,927 38,912 30,200 54,854 68,230 61,381 26,769 50,800 64,546 53,000 -17.9 6.1 Gas 6,364 9,855 13,500 12,300 18,867 21,358 16,770 16,165 26,300 34,888 53,000 51.9 6.2 Petroleum 36,547 52,072 25,400 17,900 35,987 46,872 44,611 10,604 24,500 29,658 0 -7. Other Taxes ** 15,385 13,186 15,715 14,019 14,071 20,274 80,727 59,348 88,051 36,592 47,751 30.5 7.1 Stamp Duties 4,814 5,287 6,397 5,230 5,721 6,631 10,329 10,573 10,211 10,268 12,210 18.9 7.2 Motor Vehicle Taxes 2,113 2,368 2,803 3,121 3,195 3,893 4,722 5,749 7,107 7,719 9,100 17.9 7.3 Foreign Travel Tax* 1,464 1,769 1,350 1,048 1,097 4,054 4,751 2,050 3,593 3,681 3,713 0.9 7.4 Others 6,994 3,762 5,165 4,620 4,058 5,696 60,925 40,976 67,140 14,924 22,728 52.3
II. Non-Tax Revenues 74,700 77,875 106,900 111,400 146,000 165,000 182,700 240,604 272,900 408,272 483,000 18.3Federal 62,400 54,613 90,800 91,500 124,700 139,600 160,600 218,200 225,300 362,864 403,000 11.1Provincial 12,300 23,262 16,100 19,900 21,300 25,400 22,100 22,404 47,600 45,408 80,000 76
* Revenues under these heads are exclusively Federal. Source: Budget Wing, Finance Division, Islamabad** Mainly include Provincial Revenues.Q.E Quick EstimatesR.E. Revised Estimates.
CONSOLIDATED FEDERAL AND PROVINCIAL GOVERNMENTS REVENUES

TABLE 4.4
(Rs million)Fiscal Year/ 1997-98 1998-99 1999-00 2000-01 2001-02 2002-03 2003-04 2004-05 2005-06 2006-07 2007-08Item RE (Q.E)Current Expenditure 529,911 547,279 626,400 645,700 700,200 791,700 775,000 864,500 1,034,700 1,375,345 1,832,500
Federal 407,211 424,443 477,900 479,000 524,600 599,800 557,000 664,200 789,100 973,130 1,416,500 Provincial 122,700 122,836 148,500 166,700 175,600 191,900 218,000 200,300 245,600 402,215 416,000Defence 136,164 143,471 150,400 131,200 149,254 159,700 184,904 211,717 241,063 249,858 277,300Interest 202,356 220,100 262,247 249,252 273,894 235,304 226,256 219,744 260,021 387,119 527,800
Federal 196,251 213,259 245,100 234,500 245,300 209,700 202,500 210,196 237,119 369,000 503,200Provincial 6,105 6,841 17,147 14,752 28,594 25,604 23,756 9,548 22,902 18,119 24,600
Current Subsidies 8,840 15,035 23,239 29,028 29,221 57,114 67,920 66,673 101,238 76,039 389,500Federal 6,268 9,533 14,700 19,900 25,488 50,000 62,500 57,800 86,300 74,010 373,300Provincial 2,572 5,502 8,539 9,128 3,733 7,114 5,420 8,873 14,938 2,029 16,200
Gen. Administration* 61,431 66,950 92,108 100,981 91,024 100,210 120,023 130,531 252,241 384,784 368,159Federal 27,344 26,650 47,500 70,700 56,300 60,900 75,500 81,400 103,100 146,017 175,700Provincial 34,087 40,300 44,608 30,281 34,724 39,310 44,523 49,131 149,141 238,767 192,459
All Others** 121,120 101,723 98,406 135,239 156,807 239,372 175,897 235,835 180,137 277,545 269,741Development Expenditure 104,095 98,286 95,600 89,800 126,250 129,200 161,000 227,718 365,100 433,658 411,700Net Lending to PSEs - 2,213 -12,900 -17,600 -200 -22,700 20,000 24,763 2,100 -9,035 -15,300Total Expenditure 634,006 647,778 709,100 717,900 826,250 898,200 956,000 1,116,981 1,401,900 1,799,968 2,228,900Memorandum Items:Current Expenditure 16.4 3.3 14.5 3.1 8.4 13.1 -2.1 11.5 19.7 32.9 33.2
Defense 6.8 5.4 4.8 -12.8 13.8 7.0 15.8 14.5 13.9 3.6 11.0Interest 25.6 8.8 19.1 -5.0 9.9 -14.1 -3.8 -2.9 18.3 48.9 36.3Current Subsidies -25.8 70.1 54.6 24.9 0.7 95.5 18.9 -1.8 51.8 -24.9 412.2General Administration 33.8 9.0 37.6 9.6 -9.9 10.1 19.8 8.8 93.2 52.5 -4.3All Others 11.2 -16.0 -3.3 37.4 15.9 52.7 -26.5 34.1 -23.6 54.1 -2.8
Development Expenditure 21.7 -5.6 -2.7 -6.1 40.6 2.3 24.6 41.4 60.3 18.8 -5.1Total Expenditure 17.2 2.2 9.5 1.2 15.1 8.7 6.4 16.8 25.5 28.4 23.8
Current Expenditure 83.6 84.5 88.3 89.9 84.7 88.1 81.1 77.4 73.8 76.4 82.2Defense 21.5 22.1 21.2 18.3 18.1 17.8 19.3 19.0 17.2 13.9 12.4Interest 31.9 34.0 37.0 34.7 33.1 26.2 23.7 19.7 18.5 21.5 23.7Current Subsidies 1.4 2.3 3.3 4.0 3.5 6.4 7.1 6.0 7.2 4.2 17.5General Administration 9.7 10.3 13.0 14.1 11.0 11.2 12.6 11.7 18.0 21.4 16.5All Others 19.1 15.7 13.9 18.8 19.0 26.7 18.4 21.1 12.8 15.4 12.1
Development Expenditure@ 16.4 15.5 11.7 10.1 15.3 11.9 18.9 22.6 26.2 23.6 17.8Total Expenditure 100.0 100.0 100.0 100.0 100.0 100.0 100.0 100.0 100.0 100.0 100.0
Source: Budget Wing, Finance Division * Also include law & order, social, Economic and Community Services.** Include mainly Provincial Expenditures.@ Include net lendingNote: Variation in figures of interest payments of table 4.4 and 4.5 is on account of different methodology and sources of data
collection used by Budget Resource Section and Debt Management Section of Finance Division.QE: Quick EstimatesRE: Revised Estimates
(Percent Growth over Preceeding period)
As % of Total Expenditure
CONSOLIDATED FEDERAL AND PROVINCIAL GOVERNMENTS EXPENDITURES

TABLE 4.5
(Rs million)%Change
Fiscal Year/ 1997-98 1998-99 1999-00 2000-01 2001-02 2002-03 2003-04 2004-05 2005-06 2006-07 2007-08 2007-08/Item RE BE 2006-07
A. Interest Payments 202,356 220,100 273,909 254,234 278,671 241,678 236,849 250,611 276,565 358,780 336,264 29.7A.1 Federal 196,251 213,259 256,762 239,482 250,077 216,074 202,940 216,042 244,648 335,880 318,164 37.3
Interest on Domestic Debt 167,513 175,273 210,155 188,482 189,477 166,874 161,540 176,342 202,548 287,463 443,800 41.9Interest on Foreign Debt 28,738 37,986 46,607 51,000 60,600 49,200 41,400 39,700 42,100 48,417 59,400 15.0
Foreign Loans 24,836 30,335 34,691 40,355 68,134 45,571 111,258 35,030 63,603 50,651 53,251 -20.4IMF Drawings 1,555 1,707 2,513 2,909 2,483 0.0 1,295 423 0 0 0 0.0Food Credit/Short Term Borrowings 2,347 3,133 6,167 4,187 2,483 1,840 288 445 814 1,213 385 49.0Euro Bonds - 2,811 3,236 4,690 4,812 3,609 2,242 4,720 5,774 7,762 9,365 34.4$ Denomination Bonds - 429 265 198 264 265 265 0.2
A.2 Provincial 6,105 6,841 17,147 14,752 28,594 25,604 33,909 34,569 31,917 22,900 18,100 -28.3B. Repayments/Amortization 83,961 122,980 97,071 96,160 164,905 64,234 69,765 55,724 85,411 67,304 88,011 -21.2
of Foreign Debt.Foreign Loans 59,327 77,431 78,608 74,623 68,134 46,207 45,978 54,258 63,603 54,040 62,886 17.2Food Credits 24,634 45,549 18,463 21,537 96,771 18,027 23,787 1,466 21,809 13,264 25,125 1387.6
C. Total Debt Servicing (A+B) 286,317 343,080 370,980 350,394 443,576 305,912 306,614 306,335 361,976 426,084 424,275 18.2
MEMORANDUM ITEMSInterest on Domestic Debt (Federal) 6.3 6.0 5.5 4.5 4.3 3.4 2.9 2.7 2.7 3.3 4.2Interest on Foreign Debt 1.1 1.3 1.2 1.2 1.4 1.0 0.7 0.6 0.6 0.6 0.6Repayment of Foreign Debt 3.1 4.2 2.5 2.3 3.7 1.3 1.2 0.9 1.1 0.8 0.8Total Debt Servicing 10.7 11.7 9.7 8.3 10.0 6.3 5.4 4.7 4.7 4.9 4.0
- nil Source: D.M. Section, Finance Division,IslamabadQ.E: Quick EstimatesR.E. Revised EstimatesNote:
£ Beginning from 1999-2000, Pakistan's GDP was rebased at 1999-2000 Prices from two decades old base of 1980-81 Therefore, wherever, GDP appears in denominator the number of prior to 1999-2000 are not comparable.
DEBT SERVICING
(As Percent of GDP)£
Variation in figures of interest payments of table 4.4 and 4.5 is on account of different methodology and sources of data collection used by Budget Resource Section and Debt Management Section of Finance Division.

TABLE 4.6
(Rs million)% Change
Fiscal Year/ 1998-99 1999-00 2000-01 2001-02 2002-03 2003-04 2004-05 2005-06 2006-07 2007-08 2007-08/Type of Debt R.E. Q.E. 2006-07
Permanent Debt 317,402 325,569 349,212 424,767 468,768 570,009 526,179 514,879 562,540 618,313 9.3
Floating Debt 561,590 647,428 737,776 557,807 516,268 542,943 778,163 940,233 1,107,655 1,503,373 17.8
Un-funded Debt 573,945 671,783 712,010 792,137 909,500 914,597 873,248 881,706 940,007 1,020,736 6.6
Total 1,452,937 1,644,780 1,798,998 1,774,711 1,894,536 2,027,549 2,177,590 2,336,818 2,610,202 3,142,422 11.7
Memorandum Items: Permanent Debt 21.8 19.8 19.4 23.9 24.7 28.1 24.2 22.0 21.6 19.7 Floating Debt 38.7 39.4 41.0 31.4 27.3 26.8 35.7 40.2 42.4 47.8 Un-funded Debt 39.5 40.8 39.6 44.6 48.0 45.1 40.1 37.7 36.0 32.5
Total Debt as % of GDP (mp) 49.4 43.0 42.7 39.9 38.9 35.9 33.5 30.7 29.9 30.0R.E: Revised Estimates Source: D.M. Section, Finance Division,IslamabadQ.E: Quick Estimates
INTERNAL DEBT OUTSTANDING (AT END OF PERIOD)
(Percent Share in Total Debt)