fiscal year 2018 annual service plan - septasepta.org/strategic-plan/reports/2017-fy-2018-annual...3...
TRANSCRIPT

Fiscal Year 2018Annual Service Plan
Service Planning Department

FISCAL YEAR 2018
ANNUAL SERVICE
PLAN
Service Planning Department June 2017


TABLE OF CONTENTS
INTRODUCTION 1
ANNUAL SERVICE PLAN TIMELINE 2
I. SUMMARY AND LIST OF RECOMMENDED CHANGES 3
II. ANNUAL SERVICE PLAN PROCESS 4
III. EVALUATION PROCESS 5
IV. RECOMMENDED PROJECTS 7
V. NON-RECOMMENDED PROJECTS 9
VI. POST-IMPLEMENTATION REVIEW OF PRIOR YEAR’S CHANGES 16
VII. ANNUAL ROUTE AND STATION PERFORMANCE REVIEW 20
APPENDICES 22
PROJECT MAPS 23
PROJECT COSTS/REVENUE SUMMARY CHARTS 26
COMMUNITY BENEFIT ANALYSIS COMPUTATIONS 28
ANNUAL ROUTE PERFORMANCE REVIEW 31
City Transit 32
Suburban Transit 35
Contract Operations 36
ANNUAL STATION PERFORMANCE REVIEW 37
City Transit 38
Suburban Transit 40
Regional Rail Division 44
Regional Rail Stations 45
1
INTRODUCTION
The Southeastern Pennsylvania Transportation Authority (SEPTA) is pleased to present its Annual Service Plan (ASP) for Fiscal Year 2018. This document describes the service proposals suggested by the general public, government agencies, elected officials and Authority staff, and presents the technical and financial analyses that determine whether the proposals merit implementation. The Plan includes projects for City Transit and Suburban Transit. There are no proposals for Regional Rail.
This year marks the 20th Annual Service Plan and its associated planning process. This and the previous efforts reflect SEPTA’s ongoing commitment to improve the performance and productivity of transit routes and regional rail lines through careful measurement of both ridership changes and operating cost based upon a numeric scoring methodology. This method, fully described for each proposal, includes measures for revenues, operating costs, and impacts to existing riders. Additionally, each proposal must meet minimum performance standards, adopted by the SEPTA Board, prior to review within the service plan process. In this fashion, the Authority attempts to utilize its limited resources as efficiently and effectively as possible.
This report is organized into seven sections and an appendix. Sections I and II, respectively, provide a summary of the proposals under consideration in this year’s Plan and a brief description of the Annual Service Plan Process. Section III presents a description of the evaluation process. Section IV provides a detailed description of recommended projects. Section V details projects, which were submitted for consideration but were not recommended for implementation as a result of the Comparative Evaluation Process. Section VI provides a post implementation review of projects implemented under the previous Annual Service Plan, which have been operating at least one year. Section VII, the Annual Route Performance Review, ranks the performance of routes by operating division. Finally, the appendix contains detailed analyses of scores and methodology for evaluation of proposals in this year’s Plan.
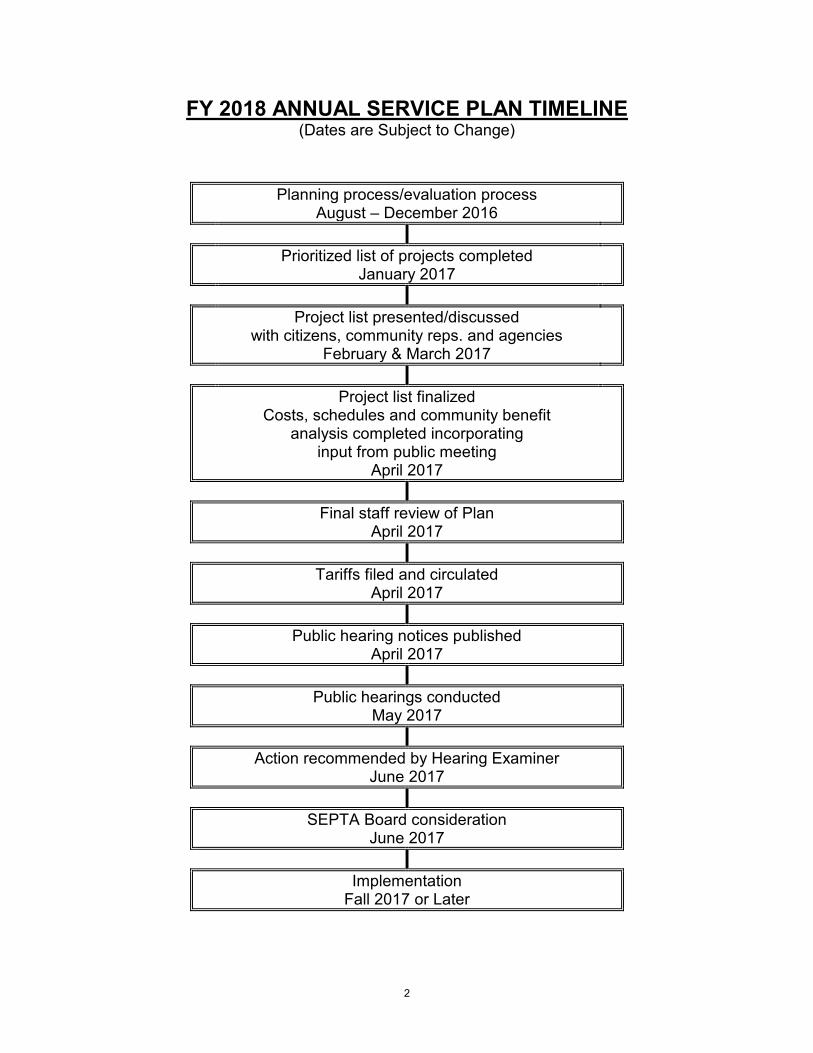
The timeline for the Plan, shown on the following page, describes the various steps and approvals required to implement the Plan’s recommendations. Implementation of approved projects is contingent upon SEPTA Board approval and available funding.
2
FY 2018 ANNUAL SERVICE PLAN TIMELINE (Dates are Subject to Change)
Planning process/evaluation process August – December 2016
Prioritized list of projects completed
January 2017
Project list presented/discussed with citizens, community reps. and agencies
February & March 2017
Project list finalized Costs, schedules and community benefit
analysis completed incorporating input from public meeting
April 2017
Final staff review of Plan April 2017
Tariffs filed and circulated
April 2017
Public hearing notices published April 2017
Public hearings conducted
May 2017
Action recommended by Hearing Examiner June 2017
SEPTA Board consideration
June 2017
Implementation Fall 2017 or Later

3
I. SUMMARY AND LIST OF RECOMMENDED CHANGES
The Fiscal Year 2018 Annual Service Plan received 125 suggestions with many requests evaluated. Three are recommended for approval. The majority of the non-recommended suggestions consisted of route, service or capital concepts that would have increased SEPTA’s operating budget without additional funding or operating resources, or would have violated SEPTA’s Service Standards. Some suggestions have merit, but require further study to determine their overall feasibility.
Recommended Projects
Transit
Boulevard Direct - New limited-stop service along the Roosevelt Boulevard with elements of Bus Rapid Transit, operating from Frankford Transportation Center to Neshaminy Mall.
Route 49 - A new north-south bus route from Brewerytown and Fairmount to Grays Ferry via University City. (Deferred for further staff study; see page 7)
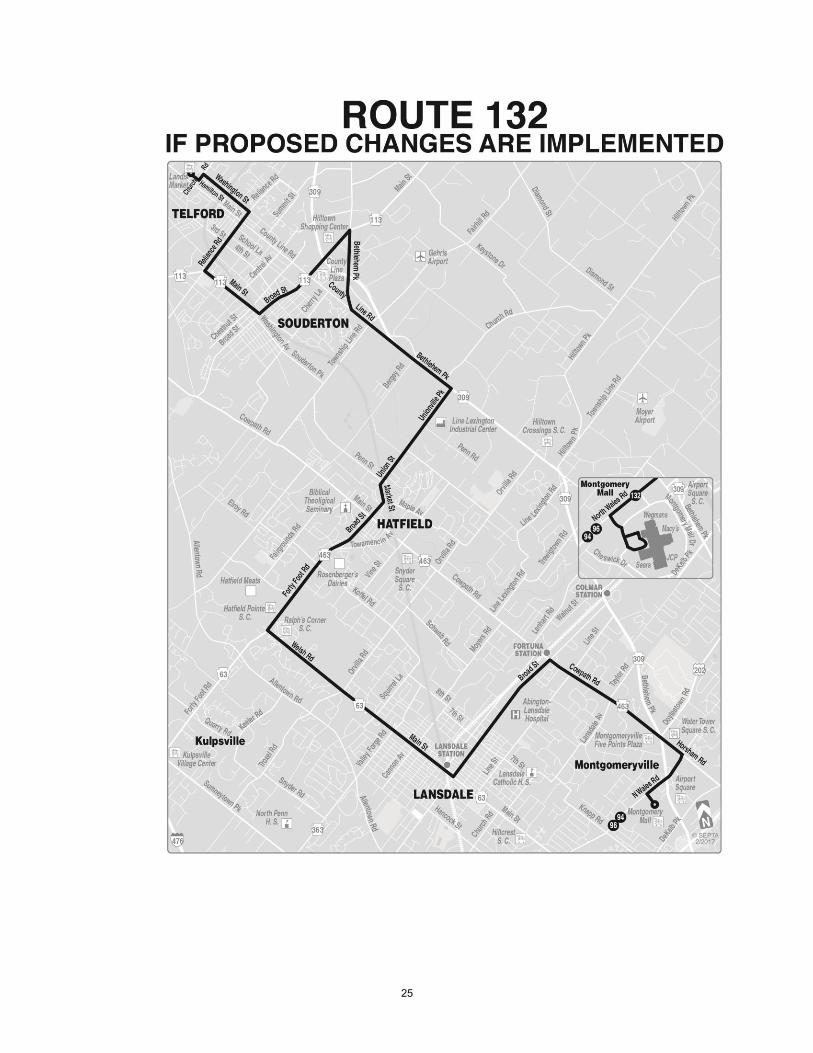
Route 132 - A route diversion along the border of Montgomery and Bucks Counties to provide service to a retail and health service corridor in Hilltown Township, east of Souderton Borough.
Regional Rail
None
Non-Recommended Projects
Refer to the chart and descriptions beginning on page 9.
Route and Station Performance Review
In addition, ten routes fall below the operating performance standards set forth in the Service Standards and Process documents for each operating division. For City Transit, six routes fall under the Route Economic Performance Guideline Standard. For Suburban Transit, four routes fall below this Standard. For Regional Rail Division, no routes fall below the Route Economic Performance Guideline Standard. In regards to Regional Rail Stations, eight stations presently fall below the guideline of 75 boards or alights per weekday.

4
II. ANNUAL SERVICE PLAN PROCESS
The following paragraphs describe the Annual Service Plan process. The dates referred to in the text are those to be used in the FY 2018 Plan. Proposals
All route and service adjustments which impact SEPTA's Operating Budget will be planned and implemented according to the Annual Service Plan. These include suggestions that originate from elected officials, City of Philadelphia Office of Transportation and Infrastructure Systems, county planning commissions, SEPTA’s Citizen Advisory Committee, community groups, transit advocates, passengers and SEPTA employees. All route and service adjustments will be investigated, planned and implemented through SEPTA's Service Planning Department. Suggestions from outside sources and from other SEPTA Departments are to be submitted to Service Planning by August 31 of each year for consideration. Planning Process/Evaluation Process
Projects considered as part of the FY 2018 Annual Service Plan were presented to affected groups and agencies. This work included the following steps of the route planning process: identification of areas to be studied (for projects initiated by SEPTA staff), evaluation of input from elected officials, planning professionals and citizens, performance of field work, completion and analysis of passenger traffic checks, and preparation of schedule specifications. Projects were then evaluated as explained in Section III. Project List Presented/Discussed with Affected Groups and Agencies
On February 15, 2017, an Open House meeting was held with outside groups, agencies and interested citizens affected by, or concerned with, proposed Annual Service Plan Projects. The purpose of this meeting was to receive input from interested parties prior to initiation of the tariff and public hearing process. This permitted serious concerns to be addressed before the Plan was finalized. Budget Impact
Any item having a cost impact that is not included in SEPTA’s Fiscal Year 2018 Operating Budget will be required to receive external subsidy in order for implementation to be considered. Tariff Preparation and Circulation
Tariffs for route projects will be prepared, filed and circulated for in-house SEPTA approval. During this time public hearing dates will be tentatively arranged. When concurrences are received, hearing dates will be finalized and public notices will be published.

5
Public Hearings
Public hearings will be held at accessible locations. Hearings will be arranged, advertised and conducted according to SEPTA's tariff regulations and enabling legislation. Post-Hearing Revisions
Any revisions necessitated by the public hearing process will then be finalized. Where revisions to projects affect cost and/or revenue, the benefit point analysis will be re-calculated to assure that the overall benefit of a project has not been compromised. The Hearing Examiner's Report and Recommendations will be considered by the SEPTA Board at their regularly scheduled meeting, usually held on the fourth Thursday of the month. SEPTA Board Approval
The SEPTA Board will consider all elements of the Annual Service Plan. The Plan may be adopted in whole or in part. Implementation
Final implementation dates will be set, pending SEPTA Board approval and available funding. Post-Implementation Review
After a period of one year, all major service changes (including area restructuring), new routes and service extensions are subject to review. Passenger traffic checks and/or Automatic Passenger Counter (APC) data will be conducted at least four times during this period. Routes that are implemented later than September, due to budgetary reasons, will be evaluated and reported in the following fiscal year Annual Service Plan process.
As a result of this review, a decision will be made to retain the service change as is, modify it in some way, or possibly discontinue it. A determination may be made at this time to extend the review period for further evaluation prior to making a final decision.
III. EVALUATION PROCESS
As described in the Service Standards and Process documents for each operating division, service proposals, both from within and outside of SEPTA, are to be submitted in writing to SEPTA's Service Planning Department. Once received, all proposals meeting basic service standards and impacting the Operating Budget will be evaluated. City and Suburban Transit and Contract Operation projects are evaluated using the Comparative Evaluation Process, whereas projects for Regional Rail Division use the Evaluation Process for Budget related items. Both are explained below.

6
CITY AND SUBURBAN TRANSIT AND CONTRACT OPERATIONS
Comparative Evaluation Process
City and Suburban Transit and Contract Operation projects employ the Comparative Evaluation Process. This process provides an objective and systematic procedure to compare these service proposals with respect to their passenger and community benefits, relative to the cost of providing the services. This comparison will indicate which proposals return the greatest overall benefit for each subsidy dollar spent. This evaluation will consist of three parts: 1) ridership forecast, 2) cost analysis and 3) community benefit analysis.
The community benefit analysis requires further explanation. It is an evaluation according to a set of non-economic criteria, which are not captured in a financial analysis but which are important to the community. Each of these qualitative considerations is assigned a weight in "benefit points." The factors considered and their relative weightings are listed below. Upon completion of the community benefit analysis, the final scores for each division are calculated; however, the process differs for each operating division as further described below.
For City and Suburban Transit and Contract Operations, a Final Benefit Score (FBS) is calculated by dividing the proposal’s cost into its benefit points. The higher resulting score indicates the route proposal is beneficial to the Authority and our customers, thus advancing to the public hearing process. The resulting scores provide a comparison of services indicating the community benefit received for the expenditure of SEPTA resources.
Criteria for Comparative Evaluation
Category Benefit Points Category Benefit Points
Each "Owl" passenger 1.25 Improved travel time 0.4 Each other passenger 1.0 Added travel time -0.4 Each other passenger lost -1.0 Decreased walking distance 0.4 Eliminated transfer 0.6 Increased walking distance -0.4 Additional transfer required -0.6
All of the projects for City and Suburban Transit included in the Fiscal Year 2018 Annual Service Plan were subject to the Comparative Evaluation Process. The analysis is included within each project description section.
Regional Rail Evaluation Process
Regional Rail Division employs the evaluation process set forth in the Service Standards and Process document. This evaluation will consist of three parts: cost analysis, passenger revenue forecast, and operating ratio analysis.

7
IV. RECOMMENDED PROJECTS
Listed below are the projects and descriptions included in SEPTA’s FY 2018 Annual Service Plan. A Community Benefit Analysis has been performed for all of these projects. Implementation of the recommended projects will proceed pending the outcome of the public hearing process, SEPTA Board approval and available funding.
BOULEVARD DIRECT
This proposal would introduce a new type of SEPTA service to Roosevelt Boulevard. The service mode will be known as “Direct Bus”, and will provide direct, efficient service along major transit corridors in the SEPTA service area. The mode will also include distinct branding, on-street transit stations, and other operational enhancements.
This Route, which will be advertised to the public as the “Boulevard Direct”, will travel
between Frankford Transportation Center and the Neshaminy Mall in Bensalem, Bucks County, making limited stops at key intersections. This service will be supported by the construction of 10 bus stations at these intersections along Roosevelt Boulevard in the City of Philadelphia, which were planned and designed in partnership with the City as part of its Route for Change program. The Route will be the first of the “Direct Bus” series. It is anticipated that, if successful, this service could be implemented on other corridors in SEPTA’s service area, pending evaluation and available funding.
PROPOSED ROUTE 49 (DEFERRED)
This proposal would establish a new bus route to operate from Brewerytown and Fairmount to Grays Ferry via University City. The new north-south route aims to further develop SEPTA's grid-network transit system. This seven-days-a-week service would provide an important connection from nearby neighborhoods to the growing jobs and health resources located in University City. Additionally, the proposed routing would create a direct transit option between 30th Street Station and the Parkway attractions. The Route 49 proposal has significant interest and support from customers, residents and elected officials, and comments were received during the hearing process to modify/extend the routing to serve additional riders. Based upon the comments received, the Hearing Examiner recommends that the Authority consider the suggestions to extend the northern terminus to the 33rd and Dauphin Streets Loop and issues raised by the neighbors in South Philadelphia. Staff concurs and will further analyze the routing. The revised routing will be presented for public review during Fiscal Year 2018 along with the Board consideration of a revised routing.

8
ROUTE 132
This proposal would make a route diversion along the border of Montgomery and Bucks Counties to provide transit to a retail and health service corridor in Hilltown Township, east of Souderton Borough. Currently, the corridor is not directly served by transit. Area residents wishing to gain access must walk along a five-lane highway section and in some cases through an expressway interchange. As part of the project, SEPTA would work with local and state officials in an effort to improve access from the new routing to the adjacent businesses.

9
V. NON-RECOMMENDED PROJECTS (OUTSIDE SUBMISSIONS)
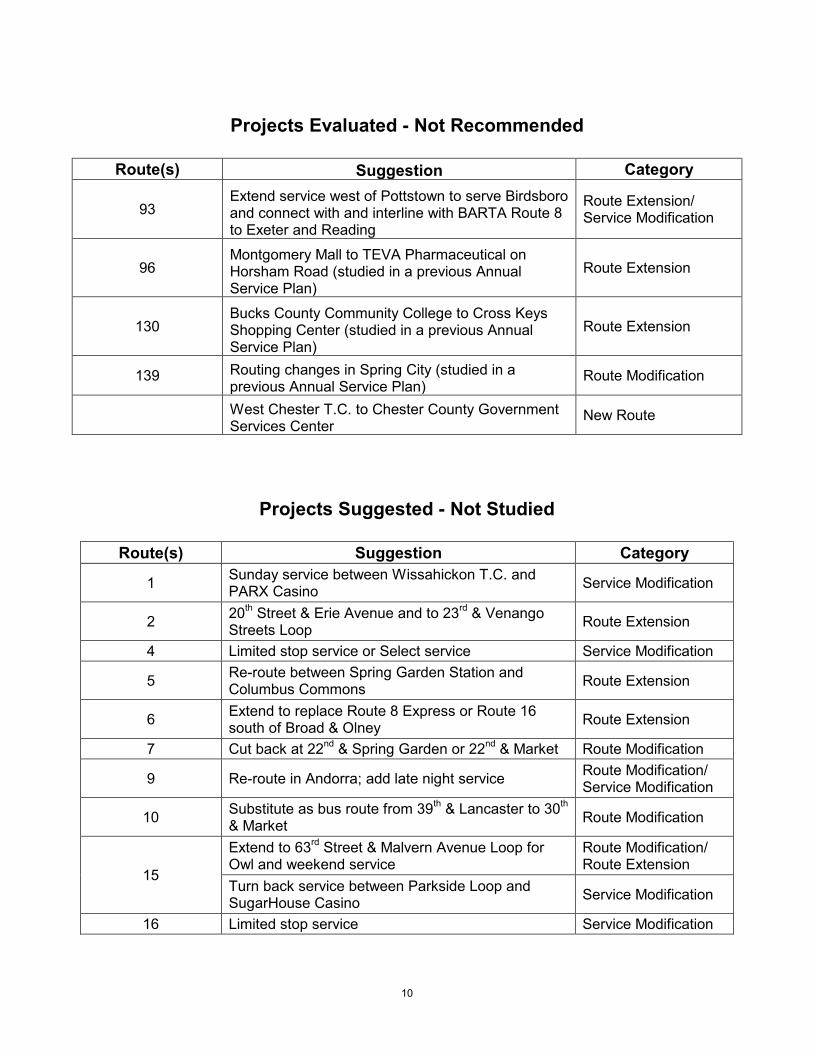
Service Planning staff received 125 submissions for the FY 2018 Annual Service Plan. At the February 15, 2017 Open House, several posters were created to show the public the various submissions and how they were categorized. This information is shown below and is broken down into the following categories: Projects Undergoing Evaluation, Projects Deferred for Future Annual Service Plan Evaluation, Projects Evaluated -- Not Recommended, Projects Suggested -- Not Studied.
In a cursory analysis, the projects determined as “Not Recommended” or “Not Studied”
can be classified as one or more elements of the criteria noted below:
Duplicative Service Examined and rejected as part of a previous Annual Service Plan Negative effect on Community Benefit Analysis Existing riders would have no alternative service Ridership not projected to cover operating costs Insufficient operating and financial resources to establish service
Projects Undergoing Evaluation
Route(s) Suggestion Category
88 Extend Pennypack Woods trips to Gregg Street Loop
Route Extension
Projects Deferred for Future Annual Service Plan Evaluation
Route(s) Suggestion Category
90, 93 and 131 Re-route via Main Street and Swede Street to Norristown T.C.
Route Modification
98 Extend to Audubon to replace Route 131 or to Phoenixville Route Extension
107 Retain between 69th Street T.C. and Glenolden
Route Modification
Paoli/Thorndale Line Parkesburg to Coatesville Route Extension
Darby T.C. to Delaware County Community College via Glenolden, Marple Crossroads and Lawrence Park
New Route
10
Projects Evaluated - Not Recommended
Route(s) Suggestion Category
93 Extend service west of Pottstown to serve Birdsboro and connect with and interline with BARTA Route 8 to Exeter and Reading
Route Extension/ Service Modification
96 Montgomery Mall to TEVA Pharmaceutical on Horsham Road (studied in a previous Annual Service Plan)
Route Extension
130 Bucks County Community College to Cross Keys Shopping Center (studied in a previous Annual Service Plan)
Route Extension
139 Routing changes in Spring City (studied in a previous Annual Service Plan)
Route Modification
West Chester T.C. to Chester County Government Services Center
New Route
Projects Suggested - Not Studied
Route(s) Suggestion Category
1 Sunday service between Wissahickon T.C. and PARX Casino Service Modification
2 20th Street & Erie Avenue and to 23rd & Venango Streets Loop Route Extension
4 Limited stop service or Select service Service Modification
5 Re-route between Spring Garden Station and Columbus Commons Route Extension
6 Extend to replace Route 8 Express or Route 16 south of Broad & Olney Route Extension
7 Cut back at 22nd & Spring Garden or 22nd & Market Route Modification
9 Re-route in Andorra; add late night service Route Modification/ Service Modification
10 Substitute as bus route from 39th & Lancaster to 30th & Market Route Modification
15
Extend to 63rd Street & Malvern Avenue Loop for Owl and weekend service
Route Modification/ Route Extension
Turn back service between Parkside Loop and SugarHouse Casino Service Modification
16 Limited stop service Service Modification

11
Projects Suggested - Not Studied
Route(s) Suggestion Category
19 Sunday service; extend service to Bensalem Service Modification
20 Re-route via Holme Avenue and Convent Road Route Modification Remove trips to PARX Casino from Keswick Road Route Modification
20 and 50 Adjust routings in Modena Park Route Modification 21 and 42 Add bus stop at 31st & Walnut Streets Service Modification
23 Cut back at Chestnut Street Route Modification 23 Return trolley service Service Modification 24 Extend weekend trips to Southampton Service Modification
25 Re-route from Spring Garden Station to Front & Market Route Modification
26 Operate via Frankford Avenue; extend late night service to Frankford T.C.
Route Modification/ Service Modification
27 Plymouth Meeting to Marketplace at Plymouth and Regal Theatre on Ridge Pike Route Extension
Re-route off Vine Street Expressway Route Modification 28 Cottman & Torresdale to Erie-Torresdale Station Route Extension
30 Merge with Route 43 or operate on Haverford Avenue Route Modification
31 34th & Market to Front & Christian Route Extension Re-route via Haverford Avenue, City Avenue, 77th Street and Overbrook Avenue Route Modification
32 Operate via 30th Street, Clearfield Avenue and 29th Street
Route Modification
34 Extend to Lansdowne Route Extension 35 Change routing Route Modification 43 39th and Powelton Streets to Parkwest Town Center Route Extension
44 Serve Wissahickon T.C. Route Extension Re-route via City Avenue and Old Lancaster Road, add early morning and late night service
Route Modification/ Service Modification
46 Re-route to allow for a direct connection to Route G Route Modification
47 Split into two routes Route Modification Work with City to allow southbound service on 8th Street between Thompson and Girard
Route Modification
47M Re-route southbound to 10th Street; expand span of service
Route Modification/ Service Modification
Eliminate service Service Modification

12
Projects Suggested - Not Studied
Route(s) Suggestion Category
52 Eliminate Gladwyne service; extend to Decker Square or Narberth
Route Modification/ Route Extension
61 Cut back at Wissahickon T.C. Route Modification 62 Make a full-time route Service Modification
64 Extend early morning and late night service to 50th & Parkside Service Modification
65 Reinstate late night service; re-route via Chelten Avenue, Pulaski Avenue and Rittenhouse Street to Wayne Avenue
Route Modification/ Service Modification
66 Extend to Bensalem to replace Route 133; discontinue trackless service
Route Extension/ Service Modification
68 Follow Route 113 routing between Church Lane & Pembroke Avenue and 69th Street T.C. Route Modification
73 Extend to Front & Girard Route Extension 77 Late night service Service Modification
80 Make the alternate routing via Glendale Station and Mt. Carmel Avenue the base routing Route Modification
91 Discontinue Service Modification
92 Re-route from Paoli to West Chester via Exton; discontinue Brandywine Business Park
Route Modification
97 Skip Conshohocken; extend from Ridge Pike in Barren Hill area to Andorra
Route Modification/ Route Extension
102 Express service during rush hour Service Modification 103 Sunday service to Ardmore Service Modification
103 Re-routing via City Avenue, Haverford Avenue and Lansdowne Avenue Route Modification
115 Sunday service to Havertown Service Modification 118 Sunday service Service Modification 126 Extend to Broomall Route Extension 127 Hourly and Sunday service Service Modification 130 Sunday service to Newtown Service Modification
132 Extend to Quakertown Route Extension Hourly service Service Modification
139 Sunday service Service Modification
G Increase frequency to Lankenau Medical Center Service Modification Replace service to Food Center with Route 7 trips Service Modification
H Green Street & Walnut Lane to Andorra Route Extension Extend to Temple University Hospital Route Extension

13
Projects Suggested - Not Studied
Route(s) Suggestion Category
J Re-route from Friends Hospital to Arrott T.C. then via Frankford Avenue to Orthodox Street
Route Modification
L Stenton Avenue & Hortter Street.to Metroplex Shopping Center and East Norriton
Route Extension
Re-route to serve Metroplex Route Modification
K Re-route via 66th Avenue and Wyncote Avenue to Wister Street. Extend to either 35th & Allegheny or Wissahickon T.C.
Route Extension/ Route Modification
R Re-route via Allegheny Avenue and 29th Street Route Modification
XH Extend to Temple University Hospital; re-route between Manheim Street & Wayne Avenue and Greene Street
Route Extension/ Route Modification
LUCY Extend to west portico of 30th Street Station Route Modification Add bus stop at 31st & Market Streets Service Modification
Broad-Ridge Spur Discontinue Service Modification Market-Frankford
Line Re-vamp A & B service and change hours of operation Service Modification
201 Extend to UPS and Prudential Eastern Operations in Horsham
Route Extension
204 Improve weekend service Service Modification 206 Restore night and Saturday service Service Modification
Broad Street Line Make North Philadelphia an express stop; make express trains local to AT&T
Service Modification
Market-Frankford Line 24-hour service Service Modification
Cynwyd Line Discontinue Route Modification Fox Chase Line Fox Chase to Newtown Route Extension
Lansdale/ Doylestown Line
Lansdale to Quakertown Route Extension Thirty-minute service on weekdays and Saturdays Service Modification Express trains to Lansdale Service Modification
Manayunk/ Norristown Line Norristown to Pottstown Route Extension
Media/Elwyn Line Close Angora Station Service Modification Paoli/Thorndale
Line Increase service to Thorndale Service Modification Sunday service to Thorndale Service Modification
14
Projects Suggested - Not Studied
Route(s) Suggestion Category
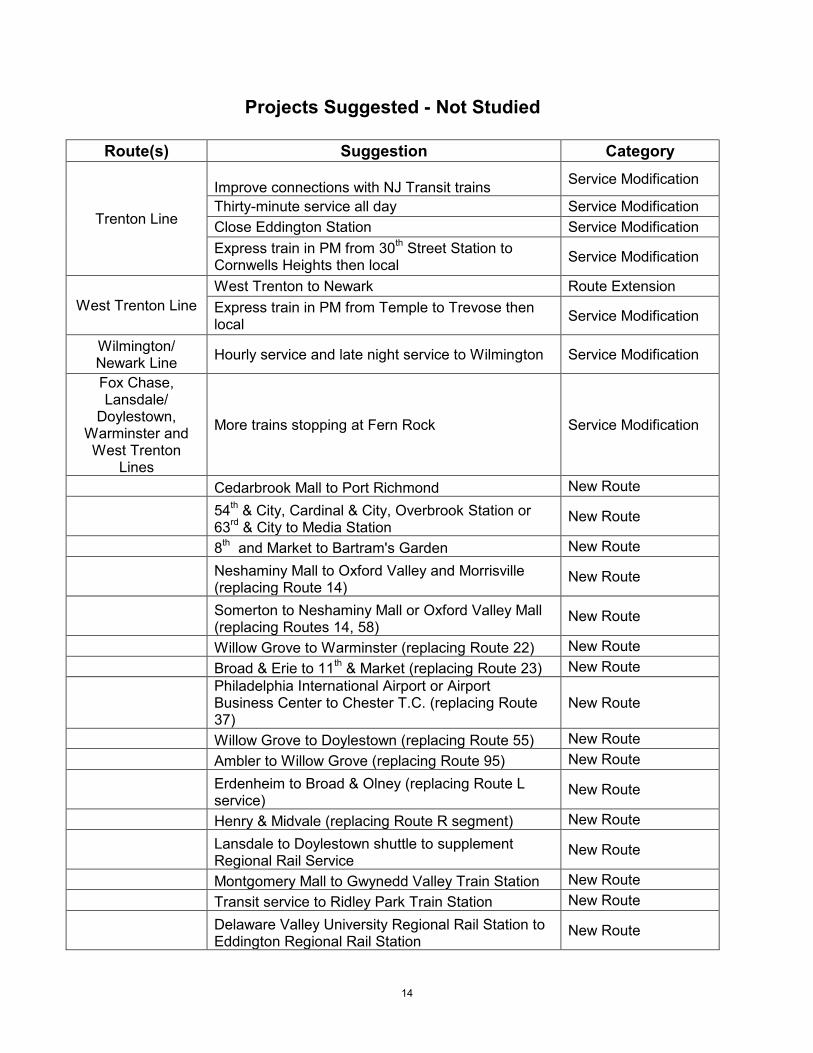
Trenton Line
Improve connections with NJ Transit trains Service Modification
Thirty-minute service all day Service Modification Close Eddington Station Service Modification Express train in PM from 30th Street Station to Cornwells Heights then local Service Modification
West Trenton Line West Trenton to Newark Route Extension Express train in PM from Temple to Trevose then local Service Modification
Wilmington/ Newark Line Hourly service and late night service to Wilmington Service Modification
Fox Chase, Lansdale/
Doylestown, Warminster and West Trenton
Lines
More trains stopping at Fern Rock Service Modification
Cedarbrook Mall to Port Richmond New Route
54th & City, Cardinal & City, Overbrook Station or 63rd & City to Media Station
New Route
8th and Market to Bartram's Garden New Route
Neshaminy Mall to Oxford Valley and Morrisville (replacing Route 14)
New Route
Somerton to Neshaminy Mall or Oxford Valley Mall (replacing Routes 14, 58)
New Route
Willow Grove to Warminster (replacing Route 22) New Route Broad & Erie to 11th & Market (replacing Route 23) New Route
Philadelphia International Airport or Airport Business Center to Chester T.C. (replacing Route 37)
New Route
Willow Grove to Doylestown (replacing Route 55) New Route Ambler to Willow Grove (replacing Route 95) New Route
Erdenheim to Broad & Olney (replacing Route L service)
New Route
Henry & Midvale (replacing Route R segment) New Route
Lansdale to Doylestown shuttle to supplement Regional Rail Service
New Route
Montgomery Mall to Gwynedd Valley Train Station New Route Transit service to Ridley Park Train Station New Route
Delaware Valley University Regional Rail Station to Eddington Regional Rail Station
New Route

15
Projects Suggested - Not Studied
Route(s) Suggestion Category Feeder service to Trenton Regional Rail trains New Route

16
VI. POST-IMPLEMENTATION REVIEW OF PRIOR YEAR’S CHANGES
The Post Implementation Review section of the Annual Service Plan discusses items which were initiated through the Annual Service Plan process and have been operating for at least one year.
Routes 12 and 40 – Penn’s Landing Access Improvements
To better integrate bus service into future developments near Penn’s Landing, Routes 12 and 40 were approved for extensions to provide direct access to Columbus Boulevard. In June 2015, Route 12 was extended eastward from 3rd & Pine Streets to Columbus Boulevard & Dock Street. To date, ridership along the extension is 77%, 58% and 93% of projected ridership for weekdays, Saturday and Sunday, respectively.
Route 40, which originates in West Park, was approved to have its eastern terminus
extended from 2nd & South Streets to Front & South Streets. This extension would provide improved access to Penn’s Landing via a connection to the South Street pedestrian bridge. Additionally, the new terminus location would allow the recovery of a second bus, which will result in improved service on the route. SEPTA staff is still working to secure the use of a parking lot on Front Street for the new end of line recovery point for Route 40.
Route 23 and New Route 45 – Splitting Route 23 for Improved Service
In November of 2015, Route 23, which formerly operated between Chestnut Hill and South Philadelphia, was split into two distinct routes; a shortened Route 23 operating between Chestnut Hill and Center City as far as Locust Street and a new Route 45, which now operates over the southern portion of former Route 23 as far as Noble Street. This change was made to improve on-time performance and reduce bus bunching that was endemic to the route. Prior to the split, Route 23 typically reported an on-time performance around 64%. Since then, while Route 23 has seen a modest improvement in on-time performance (up to 69%), Route 45’s on-time performance has been 85%. This marks a 20% improvement for customers formerly on the southern portion of old Route 23.
Route 53 – Hunting Park Avenue Extension
In response to requests from the public, a route extension was implemented in February 2016. Previously, Route 53 operated from West Mt. Airy to Hunting Park Station. The service modification included a route extension along Hunting Park Avenue between 9th and G Streets
17
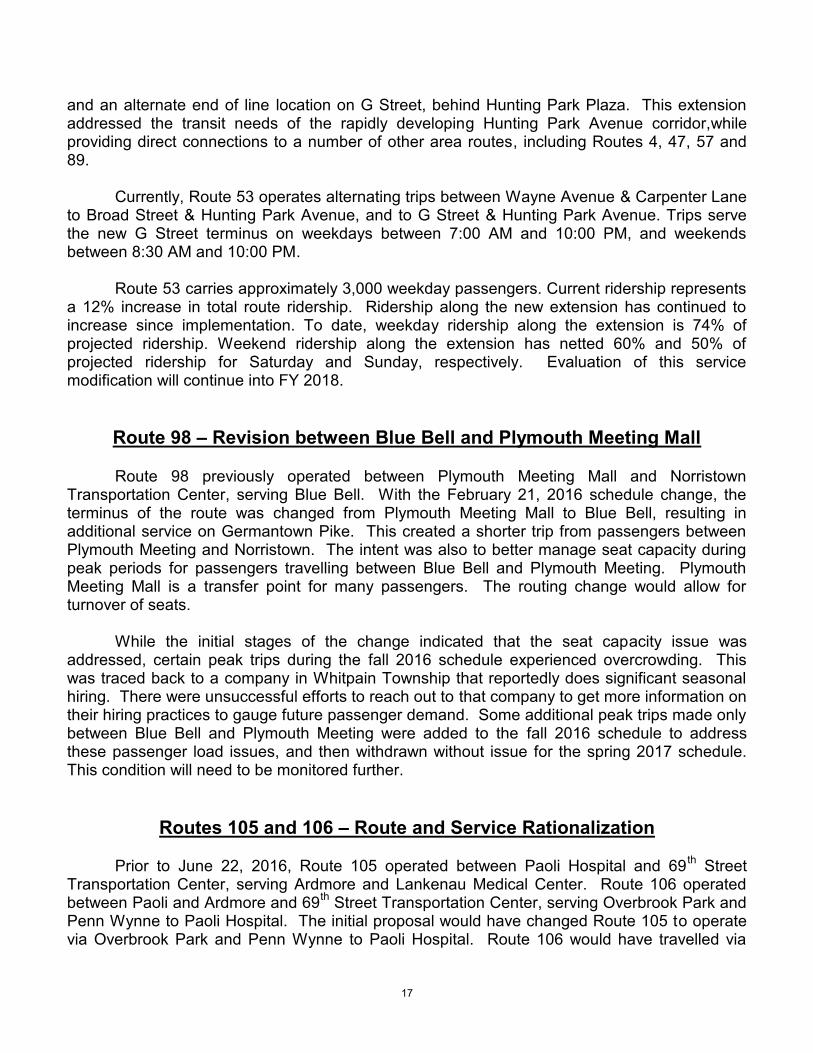
and an alternate end of line location on G Street, behind Hunting Park Plaza. This extension addressed the transit needs of the rapidly developing Hunting Park Avenue corridor,while providing direct connections to a number of other area routes, including Routes 4, 47, 57 and 89.
Currently, Route 53 operates alternating trips between Wayne Avenue & Carpenter Lane
to Broad Street & Hunting Park Avenue, and to G Street & Hunting Park Avenue. Trips serve the new G Street terminus on weekdays between 7:00 AM and 10:00 PM, and weekends between 8:30 AM and 10:00 PM.
Route 53 carries approximately 3,000 weekday passengers. Current ridership represents
a 12% increase in total route ridership. Ridership along the new extension has continued to increase since implementation. To date, weekday ridership along the extension is 74% of projected ridership. Weekend ridership along the extension has netted 60% and 50% of projected ridership for Saturday and Sunday, respectively. Evaluation of this service modification will continue into FY 2018.
Route 98 – Revision between Blue Bell and Plymouth Meeting Mall
Route 98 previously operated between Plymouth Meeting Mall and Norristown Transportation Center, serving Blue Bell. With the February 21, 2016 schedule change, the terminus of the route was changed from Plymouth Meeting Mall to Blue Bell, resulting in additional service on Germantown Pike. This created a shorter trip from passengers between Plymouth Meeting and Norristown. The intent was also to better manage seat capacity during peak periods for passengers travelling between Blue Bell and Plymouth Meeting. Plymouth Meeting Mall is a transfer point for many passengers. The routing change would allow for turnover of seats.
While the initial stages of the change indicated that the seat capacity issue was addressed, certain peak trips during the fall 2016 schedule experienced overcrowding. This was traced back to a company in Whitpain Township that reportedly does significant seasonal hiring. There were unsuccessful efforts to reach out to that company to get more information on their hiring practices to gauge future passenger demand. Some additional peak trips made only between Blue Bell and Plymouth Meeting were added to the fall 2016 schedule to address these passenger load issues, and then withdrawn without issue for the spring 2017 schedule. This condition will need to be monitored further.
Routes 105 and 106 – Route and Service Rationalization
Prior to June 22, 2016, Route 105 operated between Paoli Hospital and 69 th Street
Transportation Center, serving Ardmore and Lankenau Medical Center. Route 106 operated between Paoli and Ardmore and 69th Street Transportation Center, serving Overbrook Park and Penn Wynne to Paoli Hospital. The initial proposal would have changed Route 105 to operate via Overbrook Park and Penn Wynne to Paoli Hospital. Route 106 would have travelled via

18
Overbrook, 63rd and Malvern, and Lankenau Medical Center to Ardmore and Rosemont. Schedules for Routes 105 and 106 would be simplified with improved rush hour service on both routes. The practice of beginning and ending trips along Cricket Terrace in Ardmore for both routes would be discontinued. As a result of public opposition at the public hearings, the Hearing Examiner recommended that the proposal as constructed should be deferred. The proposal was revised and submitted at a public hearing in November 2015, whereby Route 105 would operate between 69th Street Transportation Center to Rosemont, via Overbrook, 63rd and Malvern, Lankenau Medical Center, Wynnewood Shopping Center and Ardmore. Route 106 would operate between 69th Street Transportation Center and Paoli Hospital via Overbrook Park, Penn Wynne and Ardmore. Service on both routes to and from Cricket Terrace in Ardmore would be discontinued. This proposal was recommended by the Hearing Examiner and approved by the SEPTA Board. The revised service was implemented on June 22, 2016.
Overall ridership on the two routes, as measured by Automatic Passenger Counters, was up significantly over the 2,137 trips projected in the FY 2016 Annual Service Plan. For the fall 2016 schedule period, Route 105 averaged 1,302 passengers per weekday, while Route 106 averaged 1,410 for a total for the two routes of 2,712. It is impossible to isolate regular passengers from those who used either of the routes as an alternate because of reduced service on the Paoli/Thorndale Regional Rail Line during parts of this schedule period. Ridership will continue to be monitored for future trends.
Route 119 – Routing Change in Upper Chichester
This route operates between Cheyney University and Chester Transportation Center, serving Marcus Hook. With the February 22, 2016 schedule change, service was discontinued along Meetinghouse Road and portions of Market Street. All trips are now using Chichester Avenue through the communities of Boothwyn and Linwood, providing a faster trip for through riders. The improved cycle time that allows for additional peak service has improved load management on one of the early morning trips. The number of daily weekday passengers that benefitted from the faster travel time was significantly exceeded. Instead of 204 daily trips, the number in fall 2016 was 514, based on Automatic Passenger Counter data. Overall weekday ridership also exceeds that projected by more than 100 passenger trips per day.
Route 128 – Service to Parx Casino
The route connects Neshaminy Mall and Oxford Valley Mall, serving Bristol and Levittown. With the February 21, 2016 schedule change, service was extended on Street Road from Hulmeville Road to Richlieu Road, providing direct access from Croydon, Bristol and Levittown to Parx Casino. A lightly patronized section on Hulmeville and Galloway Roads was discontinued.
19
Based on counts at the stop level, the new segment carried 69 more passengers per
weekday in fall 2016 than the old segment did in fall 2015. This exceeds the expectations presented in the FY 2016 Annual Service Plan, which projected a net increase of 31 daily weekday passengers.
Route 310 – Restructuring of Service and the Creation of New Route 311
The proposal changed the one-way loop operation of Route 310 by splitting the route into two smaller routes. It was intended to simplify confusing service patterns, offer faster travel times to and from all destinations, decrease walking distances for some riders, address overcrowding, and improve rider distribution to and from the various employment and commercial centers in Horsham, Upper Dublin and Upper Moreland Townships. In addition, enhanced service frequencies and span of service were proposed on Saturdays. The re-designed service was intended to meet Montgomery County’s goal of improved public transportation in the Horsham and Pennsylvania Business Centers.
Because of the timing of delivery of new 30-foot buses that are being used on Routes 310 (Horsham Breeze Red) and 311 (Horsham Breeze Blue), the implementation of this route split occurred February 27, 2017. Only limited data is available to analyze the route performance. It is anticipated that some schedule adjustments will be made. The Partnership Transportation Management Association (PTMA) is working with SEPTA’s Marketing Department on strategies to market the route. In addition, SEPTA has received support from Workforce Property Trust, the owners of the Pennsylvania Business Campus to distribute information about the two routes. Further analysis will be included in the FY 2019 Annual Service Plan.

20
VII. ANNUAL ROUTE AND STATION PERFORMANCE REVIEW
As defined in the Service Standards and Process documents for each operating division, the Annual Route Performance Review ranks all of SEPTA’s routes for compliance to the established Route Economic Performance Guideline Standards. City and Suburban Transit routes and Regional Rail routes are ranked on an operating ratio basis; Regional Rail stations are also evaluated for compliance to the Station Economic Performance Guideline Standards.
CITY TRANSIT
For the Fiscal Year 2018 Annual Service Plan, the minimum acceptable operating ratio for City Transit Division (CTD) is 18% (60% of average City Transit operating ratio of 30%). The minimum acceptable operating ratio for City Transit routes with suburban characteristics is 16% (60% of Combined City and Suburban Transit average of 27%).
A complete list of City Transit routes ranked on an operating basis can be found in the
Appendix. For the Fiscal Year 2018 Annual Service Plan, the following routes fall below the minimum operating ratio standard.
Routes That Rank Below the Minimum Acceptable Operating Ratio for City Transit (18% CTD / 16% CTD Routes with Suburban Characteristics)
Route Operating Ratio Route Operating Ratio
1 17% 77 * 15% 88 * 15% 35 * 13% 27 * 15%
* Routes with suburban characteristics
21
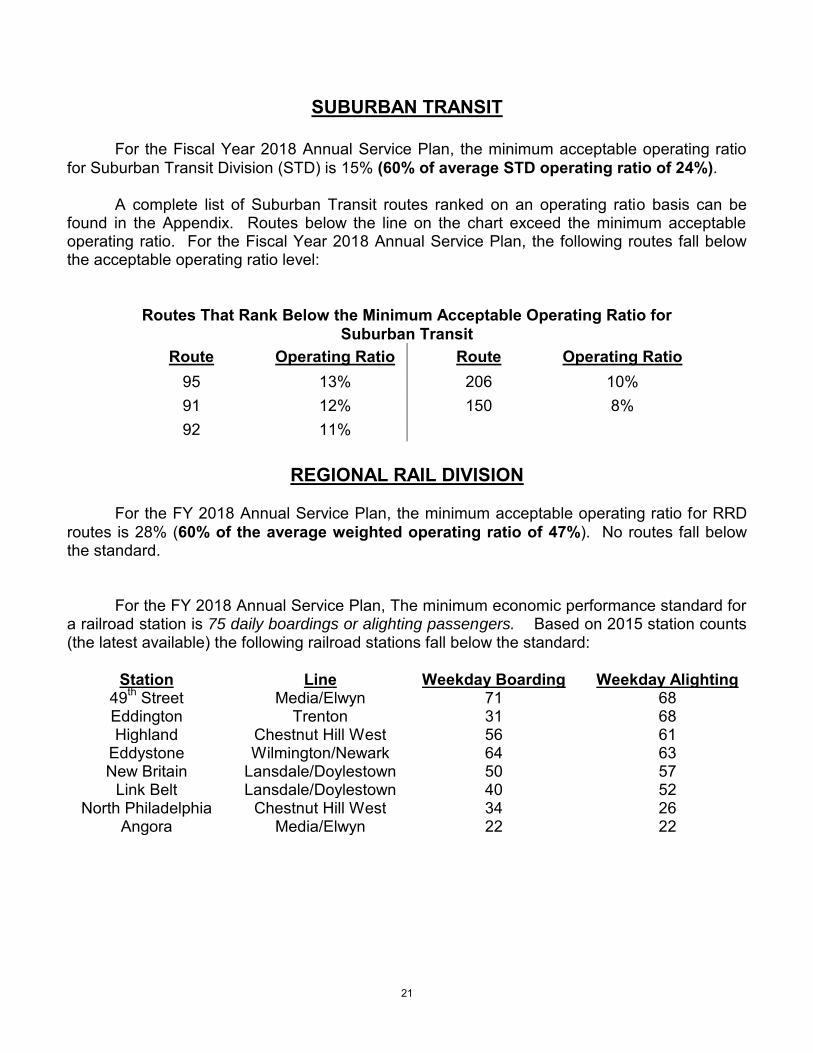
SUBURBAN TRANSIT
For the Fiscal Year 2018 Annual Service Plan, the minimum acceptable operating ratio for Suburban Transit Division (STD) is 15% (60% of average STD operating ratio of 24%).
A complete list of Suburban Transit routes ranked on an operating ratio basis can be found in the Appendix. Routes below the line on the chart exceed the minimum acceptable operating ratio. For the Fiscal Year 2018 Annual Service Plan, the following routes fall below the acceptable operating ratio level:
Routes That Rank Below the Minimum Acceptable Operating Ratio for Suburban Transit
Route Operating Ratio Route Operating Ratio 95 13% 206 10% 91 12% 150 8% 92 11%
REGIONAL RAIL DIVISION
For the FY 2018 Annual Service Plan, the minimum acceptable operating ratio for RRD
routes is 28% (60% of the average weighted operating ratio of 47%). No routes fall below the standard.
For the FY 2018 Annual Service Plan, The minimum economic performance standard for
a railroad station is 75 daily boardings or alighting passengers. Based on 2015 station counts (the latest available) the following railroad stations fall below the standard:
Station Line Weekday Boarding Weekday Alighting
49th Street Media/Elwyn 71 68 Eddington Trenton 31 68 Highland Chestnut Hill West 56 61
Eddystone Wilmington/Newark 64 63 New Britain Lansdale/Doylestown 50 57
Link Belt Lansdale/Doylestown 40 52 North Philadelphia Chestnut Hill West 34 26
Angora Media/Elwyn 22 22

22
APPENDICES

23
PROJECT MAPS

24
25

26
PROJECT COST/REVENUE SUMMARY CHARTS
Proposed Routes 14 & Boulevard Direct
Annual Existing Proposed Change
Miles 1,260,880 1,561,140 300,260 Hours 105,328 121,747 16,419 Peak Vehicles 28 33 5 Passengers 3,776,947 4,564,947 788,000 Revenue $4,079,103 $4,930,143 $851,040
Expenses - Fully Allocated $16,305,931 $19,315,593 $3,009,662 Net Cost - Fully Allocated $12,226,828 $14,385,450 $2,158,622 Operating Ratio - Fully Allocated 25% 26% 1%
Incremental Expenses $12,231,931 $14,664,586 $2,432,655
Proposed Route 132
Annual Existing Proposed Change
Miles 185,972 191,945 5,973 Hours 12,072 12,145 73 Peak Vehicles 2 2 0 Passengers 111,500 115,756 4,256 Revenue $169,599 $188,682 $19,083
Expenses - Fully Allocated $1,080,423 $1,092,771 $12,348 Net Cost - Fully Allocated $910,824 $904,089 ($6,735) Operating Ratio - Fully Allocated 16% 16% 0%
Incremental Expenses $920,883 $986,611 $65,728
27
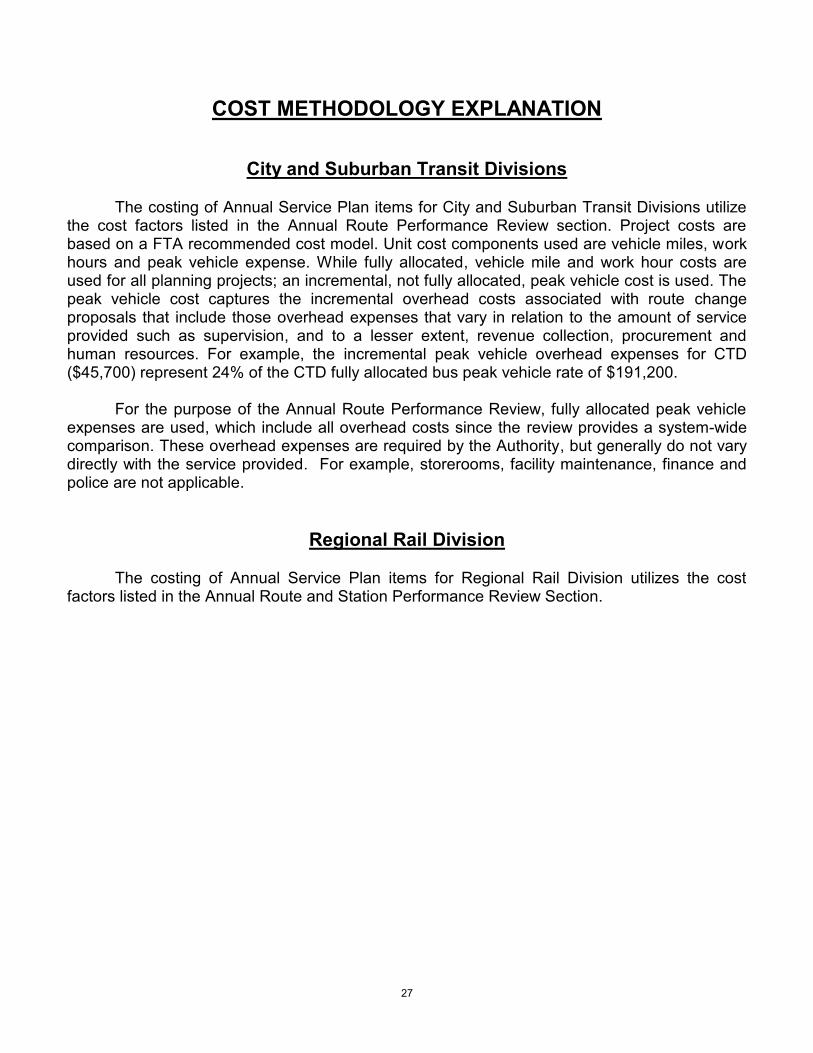
COST METHODOLOGY EXPLANATION
City and Suburban Transit Divisions The costing of Annual Service Plan items for City and Suburban Transit Divisions utilize the cost factors listed in the Annual Route Performance Review section. Project costs are based on a FTA recommended cost model. Unit cost components used are vehicle miles, work hours and peak vehicle expense. While fully allocated, vehicle mile and work hour costs are used for all planning projects; an incremental, not fully allocated, peak vehicle cost is used. The peak vehicle cost captures the incremental overhead costs associated with route change proposals that include those overhead expenses that vary in relation to the amount of service provided such as supervision, and to a lesser extent, revenue collection, procurement and human resources. For example, the incremental peak vehicle overhead expenses for CTD ($45,700) represent 24% of the CTD fully allocated bus peak vehicle rate of $191,200. For the purpose of the Annual Route Performance Review, fully allocated peak vehicle expenses are used, which include all overhead costs since the review provides a system-wide comparison. These overhead expenses are required by the Authority, but generally do not vary directly with the service provided. For example, storerooms, facility maintenance, finance and police are not applicable.
Regional Rail Division
The costing of Annual Service Plan items for Regional Rail Division utilizes the cost factors listed in the Annual Route and Station Performance Review Section.
28
COMMUNITY BENEFIT ANALYSIS COMPUTATIONS
Note: All calculations are annualized using 255 weekdays, 52 Saturdays and 58 Sundays, unless otherwise noted.

29
Proposed Routes 14 and Boulevard Direct
Benefit Existing Proposed
Service Points Psgrs Points Psgrs Points
Weekday Ridership 1.0 12,347 12,347 14,847 14,847
Owl Ridership 1.25 0 0 0 0 Eliminated Transfer 0.6 0 0 0 0 Additional Transfer -0.6 0 0 0 0 Improved Travel Time 0.4 0 0 4,939 1,976 Added Travel Time -0.4 0 0 0 0 Decreased Walking Distance 0.4 0 0 0 0 Increased Walking Distance -0.4 0 0 0 0
Total
12,347
16,823
Saturday Ridership 1.0 6,174 6,174 8,643 8,643
Owl Ridership 1.25 0 0 0 0 Eliminated Transfer 0.6 0 0 0 0 Additional Transfer -0.6 0 0 0 0 Improved Travel Time 0.4 0 0 2,469 740 Added Travel Time -0.4 0 0 0 0 Decreased Walking Distance 0.4 0 0 0 0 Increased Walking Distance -0.4 0 0 0 0
Total
6,174
9,383
Sunday Ridership 1.0 3,087 3,087 4,321 4,321
Owl Ridership 1.25 0 0 0 0 Eliminated Transfer 0.6 0 0 0 0 Additional Transfer -0.6 0 0 0 0 Improved Travel Time 0.4 0 0 1,235 370 Added Travel Time -0.4 0 0 0 0 Decreased Walking Distance 0.4 0 0 0 0 Increased Walking Distance -0.4 0 0 0 0
Total
3,087
4,691
Total Annualized Points
3,648,539
5,049,758
FBS Calculation Annual Benefit Points
3,648,539
5,049,758 Annual Expenses
$12,231,931
$14,664,586
FBS
0.30
0.34

30
Proposed Route 132
Benefit Existing Proposed SERVICE Points Psgrs Points Psgrs Points
Weekday Ridership 1.0
394 394
408 408
Owl Ridership 1.25
0 0
0 0 Eliminated Transfer 0.6
0 0
0 0
Additional Transfer -0.6
0 0
0 0 Improved Travel Time 0.4
0 0
0 0
Added Travel Time -0.4
0 0
0 0 Decreased Walking Distance 0.4
0 0
0 0
Increased Walking Distance -0.4
0 0
0 0 Total
394
408
Saturday Ridership 1.0
166 166
174 174
Owl Ridership 1.25
0 0
0 0 Eliminated Transfer 0.6
0 0
0 0
Additional Transfer -0.6
0 0
0 0 Improved Travel Time 0.4
0 0
0 0
Added Travel Time -0.4
0 0
0 0 Decreased Walking Distance 0.4
0 0
0 0
Increased Walking Distance -0.4
0 0
0 0 Total
166
174
Sunday Ridership 1.0
42 42
46 46
Owl Ridership 1.25
0 0
0 0 Eliminated Transfer 0.6
0 0
0 0
Additional Transfer -0.6
0 0
0 0 Improved Travel Time 0.4
0 0
0 0
Added Travel Time -0.4
0 0
0 0 Decreased Walking Distance 0.4
0 0
0 0
Increased Walking Distance -0.4
0 0
0 0 Total
42
46
ANNUALIZED
111,553
115,756
FBS Calculation Annual Benefit Points
111,553
115,756 Annual Expenses
$1,080,423
$1,092,771
FBS
0.10
0.11

31
ANNUAL ROUTE PERFORMANCE REVIEW
DEFINITIONS AND CHARTS
32
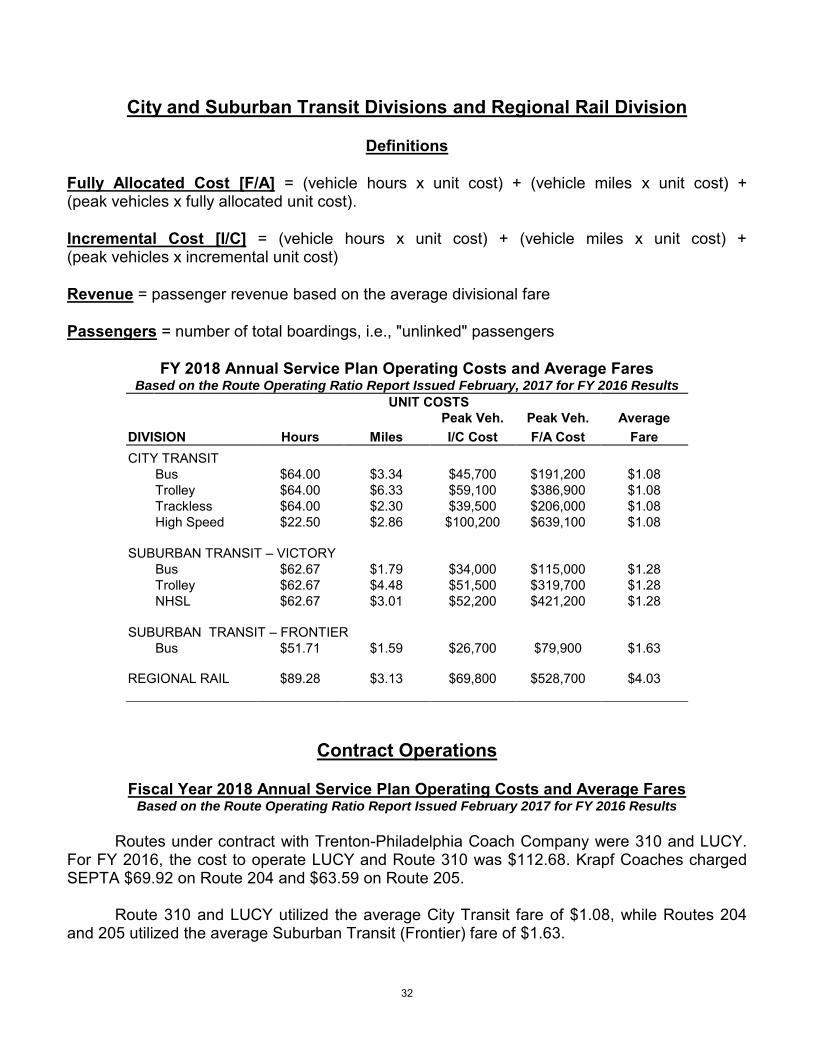
City and Suburban Transit Divisions and Regional Rail Division
Definitions Fully Allocated Cost [F/A] = (vehicle hours x unit cost) + (vehicle miles x unit cost) + (peak vehicles x fully allocated unit cost). Incremental Cost [I/C] = (vehicle hours x unit cost) + (vehicle miles x unit cost) + (peak vehicles x incremental unit cost) Revenue = passenger revenue based on the average divisional fare Passengers = number of total boardings, i.e., "unlinked" passengers
FY 2018 Annual Service Plan Operating Costs and Average Fares Based on the Route Operating Ratio Report Issued February, 2017 for FY 2016 Results UNIT COSTS
Peak Veh. Peak Veh. Average DIVISION Hours Miles I/C Cost F/A Cost Fare
CITY TRANSIT Bus $64.00 $3.34 $45,700 $191,200 $1.08 Trolley $64.00 $6.33 $59,100 $386,900 $1.08 Trackless $64.00 $2.30 $39,500 $206,000 $1.08 High Speed $22.50 $2.86 $100,200 $639,100 $1.08
SUBURBAN TRANSIT – VICTORY Bus $62.67 $1.79 $34,000 $115,000 $1.28 Trolley $62.67 $4.48 $51,500 $319,700 $1.28 NHSL $62.67 $3.01 $52,200 $421,200 $1.28
SUBURBAN TRANSIT – FRONTIER Bus $51.71 $1.59 $26,700 $79,900 $1.63
REGIONAL RAIL $89.28 $3.13 $69,800 $528,700 $4.03
Contract Operations
Fiscal Year 2018 Annual Service Plan Operating Costs and Average Fares Based on the Route Operating Ratio Report Issued February 2017 for FY 2016 Results
Routes under contract with Trenton-Philadelphia Coach Company were 310 and LUCY.
For FY 2016, the cost to operate LUCY and Route 310 was $112.68. Krapf Coaches charged SEPTA $69.92 on Route 204 and $63.59 on Route 205.
Route 310 and LUCY utilized the average City Transit fare of $1.08, while Routes 204 and 205 utilized the average Suburban Transit (Frontier) fare of $1.63.

33
CITY TRANSIT Annual Route Performance Review – Based on FY 2016 ROR Report
Fully
CTD Vehicle Vehicle Peak Weekday Annual Passenger Allocated Oper. Route Hours Miles Vehicles Passengers Passengers Revenue Expenses Ratio 78 * 2,235 41,560 - 225 57,375 $258,188 $281,850 92%
60 51,809 382,440 12 12,187 3,729,222 $4,026,553 $6,887,526 59% 79 30,582 195,520 6 5,872 1,796,832 $1,940,093 $3,757,485 52% 54 42,136 265,130 9 8,116 2,483,496 $2,681,505 $5,303,038 51% 59 25,047 196,823 7 5,202 1,591,812 $1,718,727 $3,497,702 49% 6 39,563 274,700 8 6,958 2,129,148 $2,298,905 $4,979,130 46% 66 59,357 521,473 16 11,216 3,431,766 $3,705,381 $8,294,237 45%
47M 10,253 67,930 4 2,223 680,238 $734,473 $1,647,878 45% 46 30,367 204,160 8 5,420 1,658,520 $1,790,754 $4,154,982 43% R 54,852 549,210 13 9,927 3,037,662 $3,279,855 $7,830,489 42% 75 20,715 175,212 7 3,977 1,216,962 $1,313,990 $3,170,748 41% 56 61,509 551,370 19 11,690 3,577,140 $3,862,345 $9,410,952 41% 33 77,592 531,620 20 13,061 3,996,666 $4,315,320 $10,565,499 41% 3 54,658 440,480 13 9,132 2,794,392 $3,017,189 $7,454,915 41% 52 88,445 683,780 24 14,900 4,559,400 $4,922,921 $12,533,105 39% 11 55,395 467,459 16 14,822 4,586,909 $4,952,623 $12,692,358 39% 17 79,381 530,930 22 12,400 3,794,400 $4,096,928 $11,060,090 37% 26 66,292 575,120 24 11,460 3,506,760 $3,786,354 $10,752,389 35% 18 121,180 1,169,820 28 17,760 5,434,560 $5,867,857 $17,016,319 35% 10 56,682 479,979 17 13,645 4,223,128 $4,559,838 $13,240,830 34% K 61,698 571,470 16 9,228 2,823,768 $3,048,907 $8,916,582 34% 42 85,610 624,635 18 11,327 3,466,062 $3,742,411 $11,006,921 34% 47 112,067 991,720 28 16,299 4,987,494 $5,385,147 $15,838,233 34% 70 57,286 592,100 12 8,146 2,492,676 $2,691,417 $7,938,318 34% 65 55,140 576,990 14 8,311 2,543,166 $2,745,933 $8,132,907 34% 13 60,825 551,587 18 14,512 4,491,464 $4,849,568 $14,345,792 34% 31 33,864 285,570 8 4,704 1,439,424 $1,554,189 $4,650,700 33% 23 132,200 1,114,315 25 17,672 5,407,632 $5,838,782 $17,898,012 33% 48 60,101 415,200 15 7,903 2,418,318 $2,611,130 $8,101,232 32% G 97,862 1,053,140 30 15,011 4,593,366 $4,959,595 $15,516,656 32% 64 44,048 401,560 10 5,845 1,788,570 $1,931,173 $6,072,282 32% 29 31,144 226,290 9 4,255 1,302,030 $1,405,841 $4,469,825 32% 16 53,456 481,389 11 6,772 2,072,232 $2,237,451 $7,132,223 31% 4 54,101 487,201 14 7,267 2,223,702 $2,400,998 $7,766,515 31% 21 71,094 516,385 15 8,545 2,614,770 $2,823,246 $9,142,742 31% 8 13,029 114,170 7 2,852 727,260 $785,244 $2,553,584 31% 15 60,504 407,861 12 10,147 3,140,497 $3,390,889 $11,094,804 31% 36 63,949 601,811 21 14,406 4,458,107 $4,813,552 $16,024,082 30% 40 56,712 544,580 11 6,833 2,090,898 $2,257,605 $7,551,665 30%

34
CITY TRANSIT Annual Route Performance Review – Based on FY 2016 ROR Report
Fully
CTD Vehicle Vehicle Peak Weekday Annual Passenger Allocated Oper. Route Hours Miles Vehicles Passengers Passengers Revenue Expenses Ratio
34 58,992 484,630 22 13,723 4,246,669 $4,585,256 $15,352,594 30% XH 38,170 363,801 10 4,713 1,442,178 $1,557,163 $5,569,975 28% 7 49,432 455,350 10 5,408 1,654,848 $1,786,789 $6,596,517 27% 73 20,702 179,990 7 2,657 813,042 $877,866 $3,264,495 27% 14 99,856 1,221,490 24 12,214 3,737,484 $4,035,474 $15,059,361 27% 22 43,626 518,980 10 5,158 1,578,348 $1,704,190 $6,437,457 27% 58 71,634 808,450 19 8,586 2,627,316 $2,836,792 $10,917,599 26% J 28,294 258,120 6 2,979 911,574 $984,254 $3,820,137 26% H 47,606 453,729 15 5,761 1,762,866 $1,903,419 $7,430,239 26% 57 87,580 876,360 28 10,634 3,254,004 $3,513,446 $13,885,762 25% 39 25,016 192,810 5 2,433 744,498 $803,857 $3,201,009 25% 25 39,819 384,410 11 4,466 1,366,596 $1,475,555 $5,935,545 25% 53 25,743 212,460 6 2,615 800,190 $863,989 $3,504,368 25% 2 49,043 391,590 13 5,166 1,580,796 $1,706,833 $6,932,263 25%
"400" 21,612 288,624 51 15,300 2,754,000 $2,973,576 $12,098,372 25% 43 32,023 285,850 8 3,354 1,026,324 $1,108,153 $4,533,811 24% L 71,999 709,110 19 7,837 2,398,122 $2,589,324 $10,609,163 24% 5 34,236 290,180 9 3,567 1,091,502 $1,178,527 $4,881,105 24% 62 2,702 39,644 2 601 153,255 $165,474 $687,739 24% 19 15,979 187,580 5 1,812 554,472 $598,680 $2,605,173 23% 9 44,488 543,790 12 4,819 1,474,614 $1,592,185 $6,957,891 23% 84 37,978 450,940 7 3,657 1,119,042 $1,208,263 $5,275,132 23% 50 25,783 313,997 5 2,311 764,941 $825,930 $3,654,862 23% 24 28,334 281,040 7 2,776 849,456 $917,183 $4,090,450 22% 30 15,924 148,610 4 1,521 465,426 $502,534 $2,280,293 22% 45 29,200 185,395 12 4,299 782,418 $844,800 $3,847,019 22% 32 50,812 499,380 13 4,801 1,469,106 $1,586,238 $7,405,497 21% 12 32,155 218,450 6 2,506 766,836 $827,976 $3,934,743 21% 55 63,004 735,600 13 5,471 1,674,126 $1,807,604 $8,974,760 20% 67 48,003 579,070 15 4,658 1,425,348 $1,538,991 $7,874,286 20% 28 21,885 252,620 5 1,882 575,892 $621,808 $3,200,391 19% 80 4,497 61,640 1 475 121,125 $130,782 $684,886 19% 20 60,767 739,683 15 5,282 1,616,292 $1,745,159 $9,227,629 19% 89 27,363 275,690 5 2,037 623,322 $673,019 $3,628,037 19% 38 36,629 377,710 9 2,932 897,192 $968,725 $5,326,607 18% 61 46,426 400,846 10 3,384 1,035,504 $1,118,065 $6,222,090 18% 37 47,354 645,650 9 3,730 1,141,380 $1,232,382 $6,907,927 18% 44 44,417 526,620 13 3,824 1,170,144 $1,263,440 $7,087,199 18% 68 24,596 409,510 4 1,985 607,410 $655,839 $3,706,707 18% 1 30,134 409,440 10 2,905 833,735 $900,209 $5,208,106 17% 88 31,051 265,200 7 1,932 591,192 $638,328 $4,211,432 15% 27 59,208 774,140 17 4,390 1,343,340 $1,450,444 $9,625,340 15% 77 15,380 164,420 3 946 289,476 $312,556 $2,107,083 15% 35 5,250 51,730 1 282 86,292 $93,172 $699,978 13%

35
SUBURBAN TRANSIT Annual Route Performance Review – Based on FY 2016 ROR Report
Fully
Vehicle Vehicle Peak Daily Avg. Annual Passenger Allocated Operating Route Hours Miles Vehicles Pass'g'rs Passengers Revenue Expenses Ratio
109 43,759 477,084 8 5,082 1,450,950 $1,807,303 $4,516,833 40%98 17,674 158,515 3 1,164 344,540 $524,069 $1,406,205 37%
102 18,438 172,182 5 4,095 966,070 $1,203,337 $3,525,385 34%108 53,630 564,518 10 5,217 1,492,060 $1,858,510 $5,522,043 34%113 67,902 717,403 13 6,700 1,896,100 $2,361,782 $7,035,287 34%131 8,242 80,925 3 599 169,520 $257,852 $794,798 32%103 16,021 141,532 4 1,365 387,890 $483,156 $1,717,519 28%110 26,059 317,059 6 2,275 650,650 $810,450 $2,890,971 28%104 39,846 624,949 9 3,513 1,004,720 $1,251,479 $4,651,433 27%97 16,512 175,185 3 790 233,840 $355,687 $1,372,690 26%96 28,807 369,161 6 1,468 434,530 $660,951 $2,557,272 26%
105 18,158 218,401 5 1,512 432,430 $538,635 $2,104,118 26%114 28,474 365,252 6 2,244 641,780 $799,401 $3,128,631 26%99 29,715 444,596 7 1,502 440,800 $670,488 $2,804,338 24%
123 * 17,012 343,075 4 919 262,830 $503,477 $2,140,589 24%106 6,514 66,189 3 587 163,190 $203,269 $871,777 23%126 11,514 122,115 3 839 239,950 $298,882 $1,285,289 23%112 16,975 175,949 6 1,324 378,660 $471,659 $2,068,948 23%90 12,542 140,607 3 572 161,880 $246,231 $1,112,285 22%94 11,446 195,815 4 591 174,940 $266,096 $1,223,482 22%
125 * 39,165 675,816 9 1,881 534,200 $991,262 $4,699,856 21%129$ 21,373 424,251 4 879 260,180 $395,752 $1,886,166 21%93 27,582 475,601 7 1,272 376,510 $572,698 $2,743,462 21%
120 9,065 149,612 2 608 173,890 $216,597 $1,066,059 20%101 28,840 276,962 10 4,235 999,060 $1,248,720 $6,246,140.56 20%117 37,022 526,529 7 2,194 627,480 $781,589 $4,068,183 19%
124 * 39,787 735,294 9 1,486 436,360 $756,661 $3,946,964 19%111 27,249 378,646 7 1,672 478,190 $595,633 $3,190,851 19%201 3,640 41,896 1 159 40,550 $61,679 $334,877 18%115 21,371 312,580 5 1,271 363,510 $452,788 $2,474,151 18%139 11,219 236,071 3 472 133,580 $203,185 $1,196,042 17%118 10,090 144,455 3 599 166,520 $207,417 $1,236,059 17%127$ 9,561 205,116 3 370 104,710 $159,271 $961,943 17%107 17,735 209,088 5 965 268,270 $334,157 $2,060,929 16%130$ 18,819 330,175 4 584 172,860 $262,932 $1,638,142 16%128$ 12,564 234,784 3 418 118,290 $179,927 $1,140,098 16%132 12,072 185,972 2 394 111,500 $169,599 $1,080,423 16%119 14,071 250,965 3 733 209,640 $261,128 $1,676,308 16%133 2,727 38,246 1 100 28,300 $43,046 $281,847 15%95 21,172 256,015 5 577 163,290 $248,376 $1,902,242 13%91 933 4,792 - - 4,400 $6,693 $55,884 12%92 14,959 277,691 3 383 108,390 $164,869 $1,455,779 11%
206 4,735 68,067 2 128 32,640 $50,248 $513,086 10%150 ** 3,652 98,030 1 42 11,890 $35,670 $424,975 8%
CITY AND SUBURBAN TRANSIT FOOTNOTES: $ - Outside Subsidy from Bucks County included in revenue [*] – Passenger revenue reflects premium fare [**] – Out of Service routings in Revenue Service

36
CONTRACT OPERATIONS Annual Route Performance Review – Based on FY 2016 ROR Report
Revenue Revenue Average FullyVehicle Vehicle Peak Weekday Annual Passenger Passenger Allocated Operating
Route Hours Miles Vehicles Passengers Passengers Miles Revenue Expenses Ratio
310 / Breeze 9,396 116,517 3 725 206,740 1,674,594 $336,986 $1,058,727 32%
205 2,596 33,410 3 79 20,030 180,270 $32,649 $161,990 20%
204 8,852 135,585 3 178 52,027 353,784 $84,804 $611,140 14%
316 / LUCY 11,390 105,087 12 3,778 963,440 1,348,816 125,052 $1,283,500 10%
Total 32,234 390,599 21 4,760 1,242,237 3,557,464 $ 579,491 $ 3,115,357 19% Note: LUCY operating expense is fully funded by the University City District

37
ANNUAL STATION PERFORMANCE REVIEW

38
CITY TRANSIT DIVISION Annual Station Performance Review – Based on FY 2016 Data
MARKET-FRANKFORD LINE AVERAGE WEEKDAY
SCHEDULED TRIPS
STATION ECONOMIC
PERFORMANCE Frankford T.C. 17,343 380 45.6 Arrott T.C. 4,404 380 11.6 Church 1,148 341 3.4 Erie-Torresdale 4,214 380 11.1 Tioga 1,703 341 5.0 Allegheny 5,393 380 14.2 Somerset 2,036 341 6.0 Huntingdon 2,763 341 8.1 York-Dauphin 1,509 341 4.4 Berks 2,321 341 6.8 Girard 4,536 380 11.9 Spring Garden 2,973 380 7.8 2nd Street 3,453 378 9.1 5th Street 3507 378 9.3 8th Street 9,800 378 25.9 11th Street 8,145 378 21.5 13th Street 7,027 378 18.6 15th Street 29,905 378 787.0 30th Street 7,219 377 19.1 34th Street 6,382 377 16.9 40th Street 5,731 377 15.2 46th Street 4,517 377 12.0 52nd Street 6,893 377 18.3 56th Street 5,498 377 14.6 60th Street 4,898 377 13.0 63rd Street 2,066 323 6.4 Millbourne 391 323 1.2 69th Street T.C. 15,394 378 40.7
NOTE: Ridership totals based on turnstile entry and excludes free interchange ridership
39
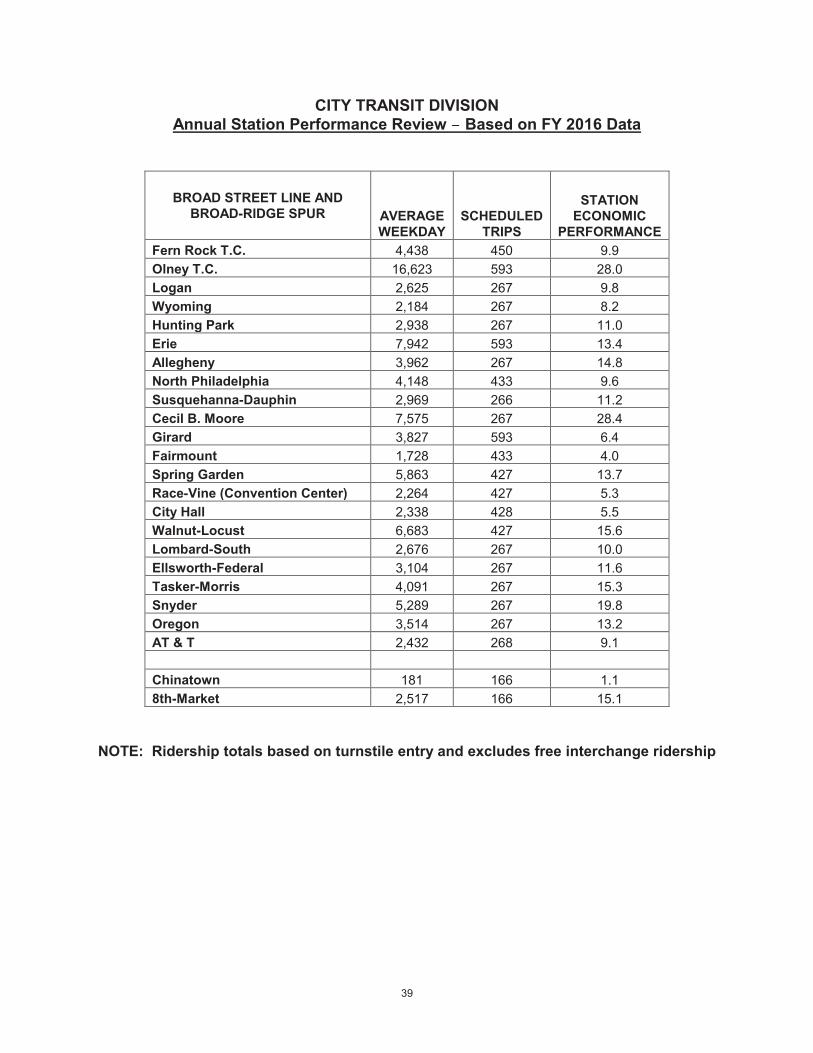
CITY TRANSIT DIVISION Annual Station Performance Review – Based on FY 2016 Data
BROAD STREET LINE AND BROAD-RIDGE SPUR AVERAGE
WEEKDAY SCHEDULED
TRIPS
STATION ECONOMIC
PERFORMANCE Fern Rock T.C. 4,438 450 9.9 Olney T.C. 16,623 593 28.0 Logan 2,625 267 9.8 Wyoming 2,184 267 8.2 Hunting Park 2,938 267 11.0 Erie 7,942 593 13.4 Allegheny 3,962 267 14.8 North Philadelphia 4,148 433 9.6 Susquehanna-Dauphin 2,969 266 11.2 Cecil B. Moore 7,575 267 28.4 Girard 3,827 593 6.4 Fairmount 1,728 433 4.0 Spring Garden 5,863 427 13.7 Race-Vine (Convention Center) 2,264 427 5.3 City Hall 2,338 428 5.5 Walnut-Locust 6,683 427 15.6 Lombard-South 2,676 267 10.0 Ellsworth-Federal 3,104 267 11.6 Tasker-Morris 4,091 267 15.3 Snyder 5,289 267 19.8 Oregon 3,514 267 13.2 AT & T 2,432 268 9.1 Chinatown 181 166 1.1 8th-Market 2,517 166 15.1
NOTE: Ridership totals based on turnstile entry and excludes free interchange ridership

40
SUBURBAN TRANSIT DIVISION
Annual Station Performance Review – Based on FY 2016 Data
NORRISTOWN HIGH SPEED LINE
BOARDS LEAVES TOTAL SCHEDULED
TRIPS
STATION ECONOMIC
PERFORMANCE Norristown T.C. 1,966 1,927 3,893 124 31.40 Bridgeport 113 93 206 124 1.66 DeKalb St. 200 135 335 124 2.70 Hughes Park 377 365 742 161 4.61 Gulph Mills 728 757 1,485 161 9.22 Matsonford 42 37 79 150 0.53 County Line 28 29 57 150 0.38 Radnor 336 274 610 161 3.79 Villanova 119 100 219 150 1.46 Ithan Ave. (Stadium) 82 78 160 150 1.07 Garrett Hill 123 129 252 150 1.68 Roberts Rd. 60 49 109 150 0.73 Bryn Mawr 499 535 1,034 188 5.50 Haverford 124 144 268 188 1.43 Ardmore Ave. 83 77 160 164 0.98 Ardmore Junction 617 634 1,251 199 6.29 Wynnewood Rd. 172 168 340 164 2.07 Beechwood-Brookline 193 198 391 164 2.38 Penfield 277 324 601 188 3.20 Township Line Rd. 105 82 187 164 1.14 Parkview 43 42 85 164 0.52 69th Street T.C. 4,796 4,902 9,698 199 48.73
41
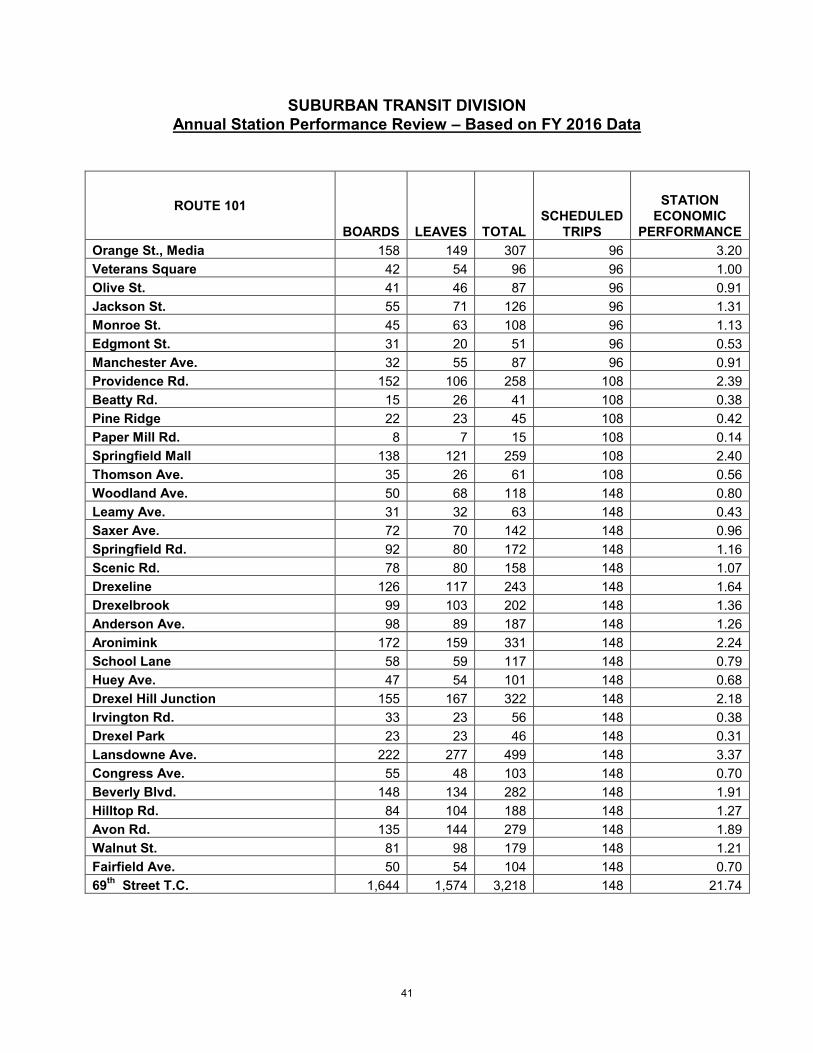
SUBURBAN TRANSIT DIVISION Annual Station Performance Review – Based on FY 2016 Data
ROUTE 101
BOARDS LEAVES TOTAL SCHEDULED
TRIPS
STATION ECONOMIC
PERFORMANCE Orange St., Media 158 149 307 96 3.20 Veterans Square 42 54 96 96 1.00 Olive St. 41 46 87 96 0.91 Jackson St. 55 71 126 96 1.31 Monroe St. 45 63 108 96 1.13 Edgmont St. 31 20 51 96 0.53 Manchester Ave. 32 55 87 96 0.91 Providence Rd. 152 106 258 108 2.39 Beatty Rd. 15 26 41 108 0.38 Pine Ridge 22 23 45 108 0.42 Paper Mill Rd. 8 7 15 108 0.14 Springfield Mall 138 121 259 108 2.40 Thomson Ave. 35 26 61 108 0.56 Woodland Ave. 50 68 118 148 0.80 Leamy Ave. 31 32 63 148 0.43 Saxer Ave. 72 70 142 148 0.96 Springfield Rd. 92 80 172 148 1.16 Scenic Rd. 78 80 158 148 1.07 Drexeline 126 117 243 148 1.64 Drexelbrook 99 103 202 148 1.36 Anderson Ave. 98 89 187 148 1.26 Aronimink 172 159 331 148 2.24 School Lane 58 59 117 148 0.79 Huey Ave. 47 54 101 148 0.68 Drexel Hill Junction 155 167 322 148 2.18 Irvington Rd. 33 23 56 148 0.38 Drexel Park 23 23 46 148 0.31 Lansdowne Ave. 222 277 499 148 3.37 Congress Ave. 55 48 103 148 0.70 Beverly Blvd. 148 134 282 148 1.91 Hilltop Rd. 84 104 188 148 1.27 Avon Rd. 135 144 279 148 1.89 Walnut St. 81 98 179 148 1.21 Fairfield Ave. 50 54 104 148 0.70 69th Street T.C. 1,644 1,574 3,218 148 21.74
42
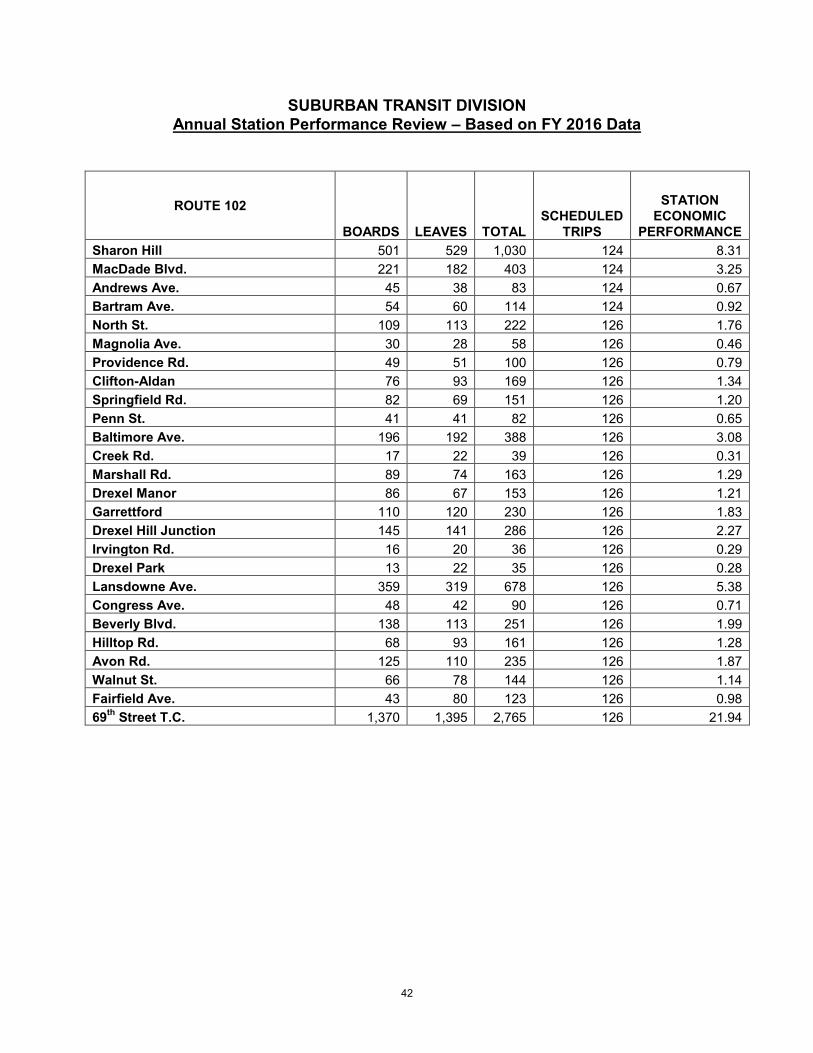
SUBURBAN TRANSIT DIVISION Annual Station Performance Review – Based on FY 2016 Data
ROUTE 102
BOARDS LEAVES TOTAL SCHEDULED
TRIPS
STATION ECONOMIC
PERFORMANCE Sharon Hill 501 529 1,030 124 8.31 MacDade Blvd. 221 182 403 124 3.25 Andrews Ave. 45 38 83 124 0.67 Bartram Ave. 54 60 114 124 0.92 North St. 109 113 222 126 1.76 Magnolia Ave. 30 28 58 126 0.46 Providence Rd. 49 51 100 126 0.79 Clifton-Aldan 76 93 169 126 1.34 Springfield Rd. 82 69 151 126 1.20 Penn St. 41 41 82 126 0.65 Baltimore Ave. 196 192 388 126 3.08 Creek Rd. 17 22 39 126 0.31 Marshall Rd. 89 74 163 126 1.29 Drexel Manor 86 67 153 126 1.21 Garrettford 110 120 230 126 1.83 Drexel Hill Junction 145 141 286 126 2.27 Irvington Rd. 16 20 36 126 0.29 Drexel Park 13 22 35 126 0.28 Lansdowne Ave. 359 319 678 126 5.38 Congress Ave. 48 42 90 126 0.71 Beverly Blvd. 138 113 251 126 1.99 Hilltop Rd. 68 93 161 126 1.28 Avon Rd. 125 110 235 126 1.87 Walnut St. 66 78 144 126 1.14 Fairfield Ave. 43 80 123 126 0.98 69th Street T.C. 1,370 1,395 2,765 126 21.94

43
SUBURBAN TRANSIT DIVISION Annual Station Performance Review – Based on FY 2016 Data
ROUTES 101 AND 102 TRUNK STATIONS
BOARDS LEAVES TOTAL SCHEDULED
TRIPS
STATION ECONOMIC
PERFORMANCE Drexel Hill Junction 331 339 670 274 2.45 Irvington Rd. 54 47 101 274 0.37 Drexel Park 39 50 89 274 0.32 Lansdowne Ave. 640 657 1,297 274 4.73 Congress Ave. 114 99 213 274 0.78 Beverly Blvd. 315 273 588 274 2.15 Hilltop Rd. 167 217 384 274 1.40 Avon Rd. 287 281 568 274 2.07 Walnut St. 162 195 357 274 1.30 Fairfield Ave. 102 148 250 274 0.91 69th Street T.C. 3,327 3,277 6,604 274 24.10

44
REGIONAL RAIL DIVISION Annual Route Performance Review – Based on FY 2016 ROR Report
Vehicle Vehicle Peak Avg. Daily Annual Annual Operating Line Hours Miles Cars Passengers Passengers Revenue Ratio
Warminster 62,960 1,255,369 20 9,586 2,795,265 12,406,041 64%
Elwyn 60,948 1,024,526 23 11,378 3,131,111 11,710,355 60%
Norristown 48,853 1,093,017 23 11,187 3,220,787 11,304,962 57%
West Trenton 100,551 2,238,255 36 11,906 3,309,804 16,813,804 50%
Paoli/Thorndale 166,472 3,524,233 67 22,938 6,532,827 30,708,612 49%
Fox Chase 35,004 588,203 14 5,588 1,498,563 5,155,057 48%
Doylestown 157,381 3,319,962 41 17,706 5,046,099 19,780,708 46%
Wilmington 88,507 2,182,516 34 10,226 2,860,285 12,184,814 43%
Cynwyd 2,034 36,001 2 623 158,881 600,570 42%
Trenton 109,896 2,933,430 37 12,656 3,634,919 17,156,818 38%
C H West 40,401 681,117 14 5,651 1,596,983 5,206,165 37%
C H East 42,927 725,979 11 5,584 1,593,031 4,444,556 36%
Airport 48,364 840,516 10 6,767 2,322,271 $ 4,435,538 28%
Totals 964,298 20,443,124 332 131,796 37,700,826 $ 151,908,000 47%
45
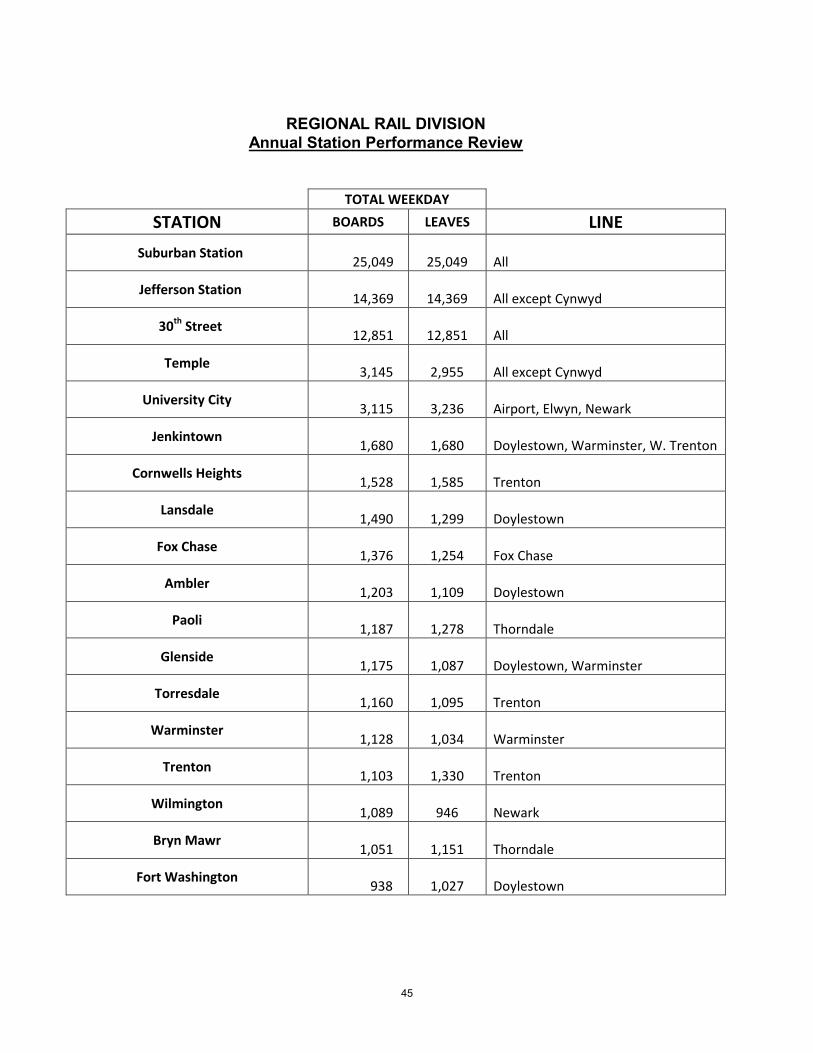
REGIONAL RAIL DIVISION
Annual Station Performance Review
TOTAL WEEKDAY
STATION BOARDS LEAVES LINE
Suburban Station 25,049
25,049 All
Jefferson Station 14,369
14,369 All except Cynwyd
30th
Street 12,851
12,851 All
Temple 3,145
2,955 All except Cynwyd
University City 3,115
3,236 Airport, Elwyn, Newark
Jenkintown 1,680
1,680 Doylestown, Warminster, W. Trenton
Cornwells Heights 1,528
1,585 Trenton
Lansdale 1,490
1,299 Doylestown
Fox Chase 1,376
1,254 Fox Chase
Ambler 1,203
1,109 Doylestown
Paoli 1,187
1,278 Thorndale
Glenside 1,175
1,087 Doylestown, Warminster
Torresdale 1,160
1,095 Trenton
Warminster 1,128
1,034 Warminster
Trenton 1,103
1,330 Trenton
Wilmington 1,089
946 Newark
Bryn Mawr 1,051
1,151 Thorndale
Fort Washington 938
1,027 Doylestown

46
REGIONAL RAIL DIVISION Annual Station Performance Review
TOTAL WEEKDAY
STATION BOARDS LEAVES LINE
Ardmore 884
919 Thorndale
Overbrook 884
919 Thorndale
Strafford 882
709 Thorndale
Malvern 850
908 Thorndale
Wynnewood 839
723 Thorndale
Norristown 828
882 Norristown
Fern Rock 813
773 Doylestown, Warminster, W. Trenton
North Wales 799
763 Doylestown
Exton 797
726 Thorndale
Swarthmore 772
644 Elwyn
Narberth 771
764 Thorndale
Elkins Park 729
466 Doylestown, Warminster, W. Trenton
Somerton 718
707 West Trenton
East Falls 709
615 Norristown
Philmont 685
688 West Trenton
Marcus Hook 681
602 Newark
Wayne 669
614 Thorndale
Holmesburg Junction 668
561 Trenton
Ivy Ridge 666
626 Norristown
Conshohocken 654
707 Norristown
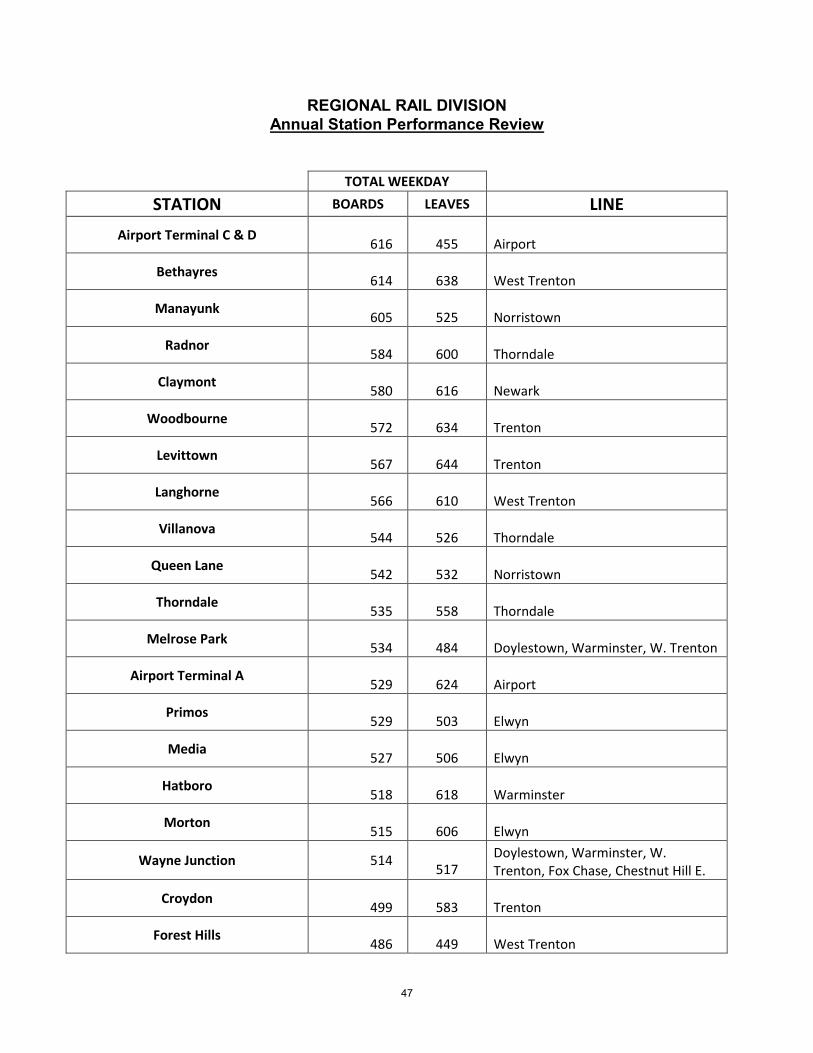
47
REGIONAL RAIL DIVISION Annual Station Performance Review
TOTAL WEEKDAY
STATION BOARDS LEAVES LINE
Airport Terminal C & D 616
455 Airport
Bethayres 614
638 West Trenton
Manayunk 605
525 Norristown
Radnor 584
600 Thorndale
Claymont 580
616 Newark
Woodbourne 572
634 Trenton
Levittown 567
644 Trenton
Langhorne 566
610 West Trenton
Villanova 544
526 Thorndale
Queen Lane 542
532 Norristown
Thorndale 535
558 Thorndale
Melrose Park 534
484 Doylestown, Warminster, W. Trenton
Airport Terminal A 529
624 Airport
Primos 529
503 Elwyn
Media 527
506 Elwyn
Hatboro 518
618 Warminster
Morton 515
606 Elwyn
Wayne Junction 514
517 Doylestown, Warminster, W. Trenton, Fox Chase, Chestnut Hill E.
Croydon 499
583 Trenton
Forest Hills 486
449 West Trenton
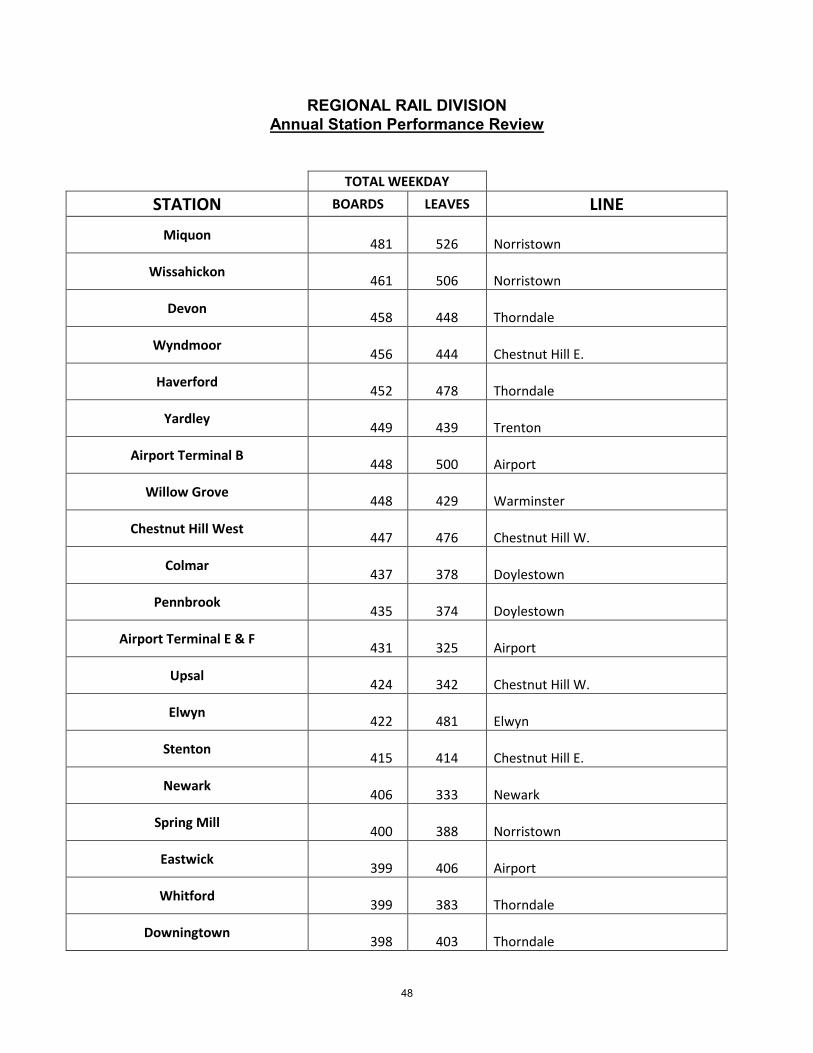
48
REGIONAL RAIL DIVISION Annual Station Performance Review
TOTAL WEEKDAY
STATION BOARDS LEAVES LINE
Miquon 481
526 Norristown
Wissahickon 461
506 Norristown
Devon 458
448 Thorndale
Wyndmoor 456
444 Chestnut Hill E.
Haverford 452
478 Thorndale
Yardley 449
439 Trenton
Airport Terminal B 448
500 Airport
Willow Grove 448
429 Warminster
Chestnut Hill West 447
476 Chestnut Hill W.
Colmar 437
378 Doylestown
Pennbrook 435
374 Doylestown
Airport Terminal E & F 431
325 Airport
Upsal 424
342 Chestnut Hill W.
Elwyn 422
481 Elwyn
Stenton 415
414 Chestnut Hill E.
Newark 406
333 Newark
Spring Mill 400
388 Norristown
Eastwick 399
406 Airport
Whitford 399
383 Thorndale
Downingtown 398
403 Thorndale

49
REGIONAL RAIL DIVISION Annual Station Performance Review
TOTAL WEEKDAY
STATION BOARDS LEAVES LINE
Carpenter 395
424 Chestnut Hill W.
Secane 393
375 Elwyn
Chelten Avenue 391
430 Chestnut Hill W.
Ryers 378
419 Fox Chase
Doylestown 358
340 Doylestown
Trevose 345
365 West Trenton
Rosemont 344
397 Thorndale
Elm Street 344
258 Norristown
Wallingford 340
355 Elwyn
Berwyn 333
288 Thorndale
Moylan Rose Valley 319
291 Elwyn
Bristol 304
382 Trenton
Allen Lane 302
325 Chestnut Hill W.
Cheltenham 301
360 Fox Chase
Roslyn 298
253 Warminster
Lansdowne 297
438 Elwyn
West Trenton 291
353 West Trenton
Merion 286
284 Thorndale
Oreland 285
307 Doylestown
Norwood 282
250 Newark

50
REGIONAL RAIL DIVISION Annual Station Performance Review
TOTAL WEEKDAY
STATION BOARDS LEAVES LINE
Churchmans Crossing 280
286 Newark
St. Davids 269
252 Thorndale
Chester T.C. 267
315 Newark
Sedgwick 265
270 Chestnut Hill E.
Neshaminy Falls 261
297 West Trenton
Noble 255
225 West Trenton
Ridley Park 251
247 Newark
Mount Airy 248
228 Chestnut Hill E.
North Hills 245
209 Doylestown
Gwynedd Valley 242
234 Doylestown
Prospect Park 240
249 Newark
Daylesford 239
257 Thorndale
Clifton-Aldan 226
260 Elwyn
Bridesburg 221
198 Trenton
Chestnut Hill East 215
253 Chestnut Hill E.
Penllyn 209
218 Doylestown
North Phila. 208
214 Trenton
Lawndale 198
226 Fox Chase
Sharon Hill 194
136 Newark
Tacony 192
209 Trenton

51
REGIONAL RAIL DIVISION Annual Station Performance Review
TOTAL WEEKDAY
STATION BOARDS LEAVES LINE
St. Martins 191
152 Chestnut Hill W.
Tulpehocken 189
200 Chestnut Hill W.
Main Street 182
183 Norristown
Folcroft 178
192 Newark
Gladstone 178
252 Elwyn
Olney 174
148 Fox Chase
North Broad 169
149 Norristown, Doylestown
Glenolden 168
193 Newark
Meadowbrook 168
128 West Trenton
Washington Lane 167
201 Chestnut Hill E.
Ardsley 166
178 Warminster
Rydal 142
137 West Trenton
Chalfont 127
139 Doylestown
Fortuna 126
110 Doylestown
Bala 126
121 Cynwyd
Gravers 125
149 Chestnut Hill E.
Cynwyd 119
95 Cynwyd
Crestmont 108
98 Warminster
Darby 107
118 Newark
Allegheny 98
96 Norristown

52
REGIONAL RAIL DIVISION Annual Station Performance Review
TOTAL WEEKDAY
STATION BOARDS LEAVES LINE
Fernwood-Yeadon 95
126 Elwyn
Highland Ave. 89
94 Newark
Wister 86
90 Chestnut Hill E.
Germantown 84
125 Chestnut Hill E.
Curtis Park 82
92 Newark
Wynnefield Ave. 76
79 Cynwyd
49th
Street 71
68 Elwyn
Crum Lynne 70
106 Newark
Del Val College 64
86 Doylestown
Eddystone 64
63 Newark
Highland 56
61 Chestnut Hill W.
New Britain 50
57 Doylestown
Link Belt 39
50 Doylestown
North Phila. 34
26 Chestnut Hill W.
Eddington 31
68 Trenton
Angora 22
22 Elwyn
SYSTEM TOTAL 124,907 124,284

53
REGIONAL RAIL DIVISION
Annual Station Performance Review
Low Station Performance Overview
Highland Station
This station is located on the Chestnut Hill West Line 0.50 miles from Chestnut Hill West and 0.50 miles from St. Martins Station.
A 61-space parking lot provides off-street parking. The station area is not served by surface transit directly, but bus Route 23
operates nearby on Germantown Avenue and connects with the Broad Street Line at Erie Avenue Station.
Current ridership totals 56 boardings and 61 alightings. Ridership has remained constant from the 2013 Railroad Census (51 boardings and 55 alightings).
The station’s close proximity to Chestnut Hill West and St. Martins, both of which offer heated waiting rooms, ticket offices and parking, contributes to its lesser utilization. The station continues to serve as an overflow facility when parking demand increases at Chestnut Hill West.
Highland Station falls below the economic threshold of 75 weekday boardings or 75 alightings. However, the available parking capacity makes this station a convenient alternative to Chestnut Hill West or Chestnut Hill East Stations when parking demand increases.
North Philadelphia (Chestnut Hill West)
This station is adjacent to the North Philadelphia Station on the Trenton Line Sidewalks and stairways provide a physical connection between Chestnut Hill
West and Trenton Line trains. Current ridership totals 34 boardings and 26 alightings.
North Philadelphia falls below the economic threshold of 75 weekday boardings or 75 alightings.

54
REGIONAL RAIL DIVISION Annual Station Performance Review
Low Station Performance Overview 49th Street Station
This station is located on the Media/Elwyn Line 1.50 miles from University City
and 1.20 miles from Angora. 49th Street has no off-street parking. The station area is served by trolley Route 13 offering direct service to Center
City. Current weekday ridership totals 71 boardings and 68 alightings. Accessible mini-high level platforms and new staircases were installed to
enhance security and attract future riders.
49th Street falls below the economic threshold of 75 weekday boardings or 75 alightings. Ridership has risen slightly as 62 boardings and 52 alightings were noted in the 2013 census.
Eddystone Station
This station is located on the Marcus Hook/Wilmington Line 1.20 miles from Crum Lynne and 1.10 miles from Chester T.C.
A small 12-space parking lot provides off-street parking. The station area is also served by bus Route 37, which connects with the Broad
Street Line at Snyder Station. Current ridership totals 64 boardings and 63 alightings. Investment has been made recently at Eddystone with the installation of new
passenger shelters. These new improvements will improve the facility and security for passengers
currently using the station, and will help to attract more riders.
Eddystone falls below the economic threshold of 75 weekday boardings or 75 alightings. Ridership has remained flat as 63 boardings and 65 alightings were noted in the 2013 Census.

55
REGIONAL RAIL DIVISION Annual Station Performance Review
Low Station Performance Overview
New Britain Station
This station is located on the Lansdale/Doylestown Line 1.80 miles from Chalfont and 1.30 miles from Del Val College.
New Britain has a 39-space parking lot. The station area is not directly served by surface transit with Route 55 being the
closest route on Easton Road. Route 55 connects with the Broad Street Line at Olney T.C.
Current ridership totals 50 boardings and 57 alightings. Investment has been made at New Britain with the installation of an accessible
high-level platform, new passenger shelter with the goal to improve security for passengers using the station and to attract future riders.
New Britain falls below the economic threshold of 75 weekday boardings or 75 alightings. Ridership has remained constant from the 2013 Railroad Census (50 boardings and 57 alightings). High-level platforms were constructed to facilitate loading and unloading of riders and ADA complaint. Travel times to/from Center City have been reduced and it is hoped that these schedule and infrastructure improvements will attract more ridership.
Link Belt Station
This station is located on the Lansdale/Doylestown Line 2.30 miles from Chalfont and 0.60 miles from Colmar.
Link Belt has no off-street parking. Ridership is primarily reverse peak comprised of workers destined to a nearby auto parts packaging plant.
Current ridership totals 39 boardings and 50 alightings. Investment has been made at Link Belt with the installation of an accessible
high-level platform and these improvements have contributed towards enhanced security for passengers using the station.
Link Belt falls below the economic threshold of 75 weekday boardings or 75 alightings. Ridership has slightly declined from 2013 as 46 boardings and 66 alightings were noted.
56
REGIONAL RAIL DIVISION Annual Station Performance Review
Low Station Performance Overview
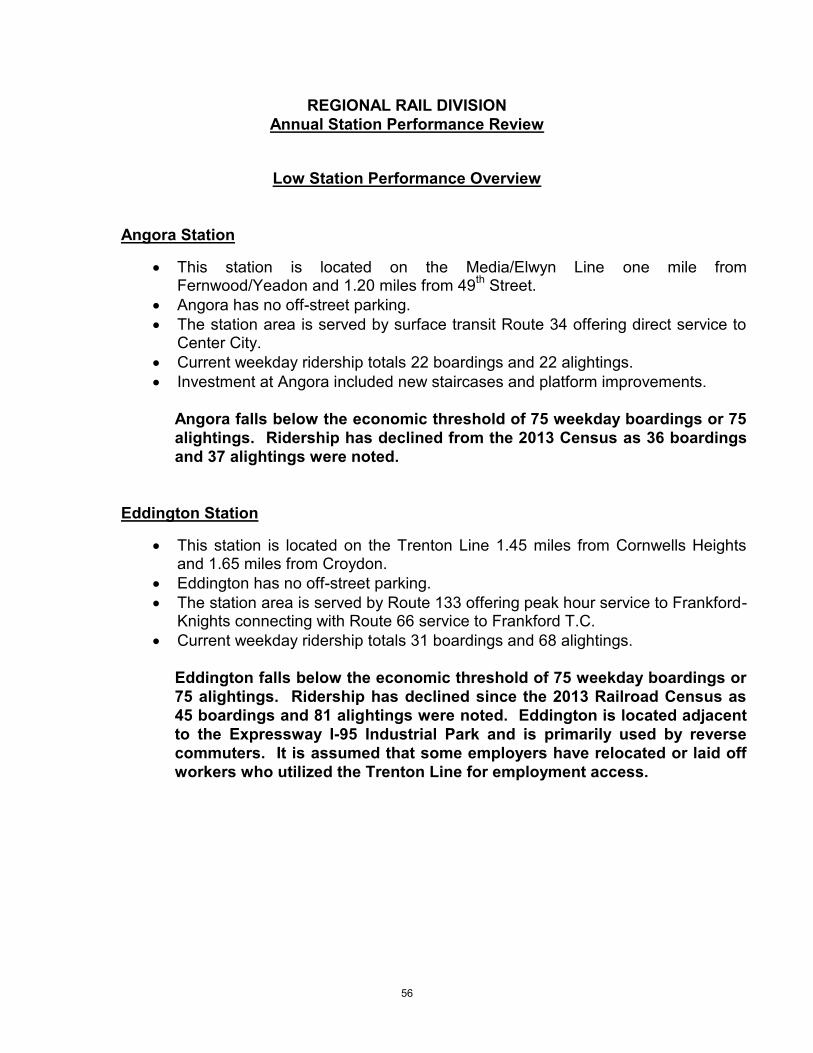
Angora Station
This station is located on the Media/Elwyn Line one mile from Fernwood/Yeadon and 1.20 miles from 49th Street.
Angora has no off-street parking. The station area is served by surface transit Route 34 offering direct service to
Center City. Current weekday ridership totals 22 boardings and 22 alightings. Investment at Angora included new staircases and platform improvements.
Angora falls below the economic threshold of 75 weekday boardings or 75 alightings. Ridership has declined from the 2013 Census as 36 boardings and 37 alightings were noted.
Eddington Station
This station is located on the Trenton Line 1.45 miles from Cornwells Heights and 1.65 miles from Croydon.
Eddington has no off-street parking. The station area is served by Route 133 offering peak hour service to Frankford-
Knights connecting with Route 66 service to Frankford T.C. Current weekday ridership totals 31 boardings and 68 alightings.
Eddington falls below the economic threshold of 75 weekday boardings or 75 alightings. Ridership has declined since the 2013 Railroad Census as 45 boardings and 81 alightings were noted. Eddington is located adjacent to the Expressway I-95 Industrial Park and is primarily used by reverse commuters. It is assumed that some employers have relocated or laid off workers who utilized the Trenton Line for employment access.


