fisher assessment - maine.gov and squirrels (red, gray, and flying) are also common foods in winter...
TRANSCRIPT

FISHER ASSESSMENT
March 3, 1986
Prepared by: Alan Clark
Maine Department of Inland Fisheries and Wildlife Hedin Hall, BMHI Complex
P.O. Box 1298 Bangor, Maine 04401

NATURAL HISTORY
The fisher is a member of the Mustelid family along with several other common
Maine furbearers including marten, skunk, weasel, mink, and otter. Generally, male
fisher are about 20% longer than females and weight nearly twice as much (Coulter
1966, Rego 1984). For both males and females, adults (greater than 1 year of age) are
larger than juveniles (less than 1 year of age) when captured in the fall. Although the
average weight of adult males is 10-11 pounds, some exceptionally large individuals
may exceed 20 pounds (Coulter 1966, Blanchard 1964).
The fur of female fisher is usually darker and silkier than the fur of males. In
older males, the fur may be coarse and grizzled. For this reason, female pelts are
generally worth from 1½ to 2 times male pelts. When prime, fisher pelts have stiff
glossy guard hairs and dense silky under fur, and the leather side of the pelt is white.
The change from summer to winter pelage begins in September and is usually complete
by November. Fur quality is at its best from November to late January (Coulter 1966,
Strickland et al. 1982). The timing of pelt primeness is determined by day length (Jenks
and Clark 1984).
Female fisher attain sexual maturity and breed at one year of age. Males are
sexually mature at one year of age, but because females are induced ovulators (the egg
not being released until the stimulation of breeding) and because the baculum of young
males is not fully grown they may not be effective in inducing ovulation. Fisher breed in
March or April. The fertilized egg grows to approximately I mm in diameter (called a
blastocyst) and then ceases development. This cessation of development (delayed

implantation) lasts from 10-11 months. Growth resumes with implantation in the winter
and the young are born in late March or April, (Strickland et al. 1982).
Adult fisher produce an average of three young per litter with a range of 1-5. About
95% of the adult female fisher become pregnant each year. The average number of
young per female and percent of females which bear young increases with age. The
average number of young produced apparently does not vary between geographic
regions within Maine (Shea et al. 1985). Young are born in dens which are usually
cavities in large trees (Strickland et al 1982 and Steve Arthur, Pers. Comm.). Little is
known about mortality of young during the first six months of life; how appear to be
independent by October 1 although they may continue to temporarily associate with
adults or juveniles, especially around major food sources.
Fisher habitat use is governed by the availability of food, topography, cover, den
locations, and weather. Strickland et al. (1982) describe food as the most important
factor. However, Allen (1983) identifies winter cover as the most important factor based
on the assumption that ample food will be present wherever winter shelter is adequate.
Fisher use a wide variety of forest habitats. They avoid open areas (roads,
fields, open bogs and large clear-cuts) with no overhead cover, however edges
surrounding these areas are extensively used. They appear to prefer diverse mixed
forest with a variety of tree species and ages (Strickland et al. 1982). Logs, brush piles,
trees, and ground burrows are utilized for cover and protection while resting.
Fisher eat snowshoe hare, porcupine, small rodents, and carrion of deer, moose,
and beaver (Strickland et al. 1982). Studies in Waldo County, Maine have shown that

apples and squirrels (red, gray, and flying) are also common foods in winter (Rego
1984, Steve Arthur, Pers. Comm.). Fisher are the most successful predator of
porcupines and most of this predation appears to be by male fisher (Rego 1984).
Home ranges of fisher in the Northeast vary from 5-10 square miles (Kelley 1977,
Steve Arthur, Pers. Comm.). Males have larger home ranges than females. Males
abandon home ranges during the breeding season and travel widely. Strickland et al.
(1982) hypothesized high mortality of males at this time due to fighting. Male home
ranges do not appear to overlap other males, and female home ranges also appear to
be exclusive (Kelley 1977, Steve Arthur, Pers. Comm.).
In summary, aspects of the life history of fisher have important management
implications which include: their low reproductive rate; the importance of older males
successful reproduction; and the higher economic value and fur quality of females.

HISTORY
Habitat Trends
For many years the fisher was thought to be an animal whose range was
restricted to the most heavily wooded spruce-fur regions of Maine. However, recent
population expansions have shown the fisher to be much more adaptable than
previously believed.
Fisher are closely associated with forested areas throughout its range.
Therefore, the amount of fisher habitat in Maine has followed the shift from forestland to
farmland and back to forestland over the past 200 years. From European settlement
until 1880, forestland declined with the expansion of agriculture. From 1880 to 1920,
the amount of agricultural land declined rapidly when abandoned agricultural land,
predominantly in southern and central Maine, reverted to forest. Since 1925, the rate of
increase in forestland has slowed. By 1950, approximately 80% of Maine was forested.
Since 1971, forestland has remained stable at about 90% of the land area.
Abandoned farmland with its greater diversity of food, may be more suitable for
fisher than the original forests. Wild fires in the past may have initially removed areas of
fisher habitat for a period, but this may have been compensated for by increased forest
diversity after the burns reforested. Little is known of the impact of clear-cuts on fisher
habitat but may parallel that of forest fires.

Population Trends
The original range of fisher included at least the northern and western parts of
the State. Manly Hardy, a furbuyer and trapper from Brewer during the mid-1800's to
1900, noted that although some areas of Maine had no fisher, other areas had a harvest
of 3-4 fishers to every 50-100 pine marten.
Fisher populations declined to low levels by the 1920's and 30's due to heavy
exploitation of the fisher and loss of forest habitat. Although extremely valuable
(ranging as high as 100 dollars when weekly wages were only a few dollars), the
average annual harvest for 1928-33 was only 34 animals (based on voluntary
reporting). The fisher population in Maine probably reached its lowest point in the
1930's when fisher were reported as being rare or absent in all but two Warden Districts
(Aldous and Mendall 1941).
The population began recovering in the early 1940’s (Marston 1942). Coulter
(1966) found densities of one fisher per 1-4.5 square miles in intensive tracking studies
on the Moosehead plateau. The population increased and expanded westerly and
southerly from the Moosehead plateau along the fringes of the western mountains.
Fisher spread to southern and central sections of the State, where abandoned farmland
had reverted to forests. Population irruptions occurred - first in the southerly portions
and then central Maine. Following these initial irruptions, the populations stabilized at a
lower level. Despite presence of a few fisher in Wildlife Management Units (WMUs) 5
and 6 and a transplant of seven animals in Milbridge in 1972, the population does not
appear to have become established in eastern Maine as it has in other portions of the
State.

Use and Demand Trends
The fisher has been an important forbearer in Maine since early times. Pelt
values have fluctuated with fashion trends, reaching highs of one hundred dollars even
in the 1920's. During these high price periods, fisher were trapped, hunted with dogs,
and pursued by men on foot who camped on their trail until they caught them. Effort
declined during low price periods. During the past 15 years, pelt prices steadily
increased; trapping methods became more effective; and consequently the annual
harvest in some areas has exceeded previously estimated densities for this species.
Harvest Regulations
The history of fisher harvest regulations has been characterized by a period of
increasing protection and more intensive management (Table 1). Open seasons on
fisher were held each year from the beginning of our records (1866-67) until 1937.
During this time fisher could be hunted and trapped. Season length was gradually
shortened from an initial 228 days to 45 days the year prior to the 1937 closure. The
season was reopened in 1950 for the month of January with a provision that all pelts be
tagged, The season was closed again from 1951 to 1955. Between 1955 and 1975,
the seasons on fisher varied from one to four months. The Department gained
regulatory authority for setting fisher seasons on January 1, 1972 and maintained a
November trapping season.
In the Fall of 1976, regulations were adopted which changed the previous pattern
of trapping seasons. In recognition of the fact that fisher were taken incidentally


throughout the season, a uniform land trapping season was adopted which lengthened
the fisher season, but hunting of fisher was prohibited. An attempt was made to reduce
the harvest by also adopting a land trapper season limit of three fisher and prohibiting
the use of Conibear traps on land. Although the 1976 harvest was reduced, the 1977
harvest increased. In 1978, the season bag limit was eliminated following an analysis
which indicated it was not effective due to multiple individuals tagging one trapper's
harvest. Since 1979, land trapping seasons have been gradually lengthened, and in
1984 a uniform late opening date was adopted to improve pelt quality.
Harvest Trends
Little information is available on the harvest of fisher prior to the reopening of the
season in 1955. As described previously, the Maine State Planning Board report for
1934 estimated an average annual harvest of 34 fisher for the years 1928-1933. Since
1955, the estimated harvest increased dramatically except in years when the season
was shortened (Table 1). Harvest estimates declined when pelt tagging, a more
accurate harvest estimation procedure, was adopted.
Since 1975, there has been an annual harvest cycle. Each harvest increase has
been followed by a harvest decrease the following year. The average harvest for this
time period has been approximately 1,900 with a range of 1,407 to 2,235.
Users
Very little information is available on the number of trappers who trap for fisher in
Maine. Records are available on trapping license sales, but not all trappers trap for

fisher. The number of individuals who tag a fisher is a minimum indicator of effort
because individuals who are unsuccessful, or whose fisher pelts are tagged by another
trapper, are not included. A detailed user survey following the 1980 trapping season
found an average of 61% of those who trap in the fall set at least one trap for fisher.
This ranged from a low of 26% of the trappers who live in WMU’s 5 and 6 to a high of
69% of the trappers who live in WMU’s 1, 2, and 3. Since 1976, there has been no
legal hunting of fisher.
An unknown number of individuals observe fisher while engaged in other outdoor
activities (e.g. bear and deer hunting , camping).
Past Management Goals
During the first planning period (1975-1979), the overall goal was to increase the
abundance and harvest of fisher use by encouraging use in areas where a surplus of
use opportunity exists (WMU'S 2 and 7) and by establishing populations in unoccupied
habitats (WMU’s 5 and 6). The harvest objective was to maintain a harvest of 4,000
fishers by 1,000 trappers. This goal and objective were not met (Table 2).
Accomplishment of the objective required the establishment of optimum (maximum)
fisher populations in all available habitat. Although the number of fisher increased
slightly in WMU's 5 and 6, substantial fisher population and harvest increases did not
occur. Harvests did increase in WMU7, but not in WMU 2.
For the second planning period (1980-84) the harvest objective was revised. The
management goal was to maintain statewide harvest and species abundance at 1976-
78 levels. During this period the management objective to a harvest of 1,600


annually, with the take adequately distributed among WMU’s, was exceeded every year.
Consequently, the harvest objective was unofficially revised upward to 1900 in 1981.
The average annual harvest did not exceed the revised objective. The second part to
the management objective to increase use in WMU’s with surplus supplies and
decrease use in WMU’s experiencing excessive demand – was partially met. Fisher
pelt prices continued to increase, and trapping seasons were extended, while license
sales decreased. Harvest increased in underutilized WMU’s 2 and 3 and decreased in
overutilized WMU’s 7 and 8.

HABITAT ASSESSMENT
Statewide
Status
The 1980 Maine Forest Resurvey (USFS, 1982) estimated that 27, 420 mi2
(90%) of Maine's land area was forested. Fisher are restricted to forest habitat which
provides overhead cover. To accommodate this restriction, the area of forest in
seedling and nonstocked stands was subtracted from the total forest area. The revised
estimate of fisher habitat was calculated to be 25,606 mi2 or 78% of Maine’s land area
(Table 3).
The quality (suitability) of Maine's fisher habitat was assessed by applying forest
survey data to a Habitat Suitability Index (HSI) model. The HSI Model numerically
evaluates an area’s suitability for fisher based on measurable biological and physical
characteristics. The limiting components of fisher habitat were assumed to be winter
food and winter cover. As previously mentioned, there is no definitive information to
suggest which of these is most critical, therefore an HSI was constructed for each of
these components (Appendix I). The winter food HSI included habitat measures
thought to be related to the abundance of major foods (e.g. snowshoe hare, squirrels,
small mammals, deer carrion). These were understory density, amount of edge, tree
canopy diversity, and occurrence of wild apples. The winter cover HSI included
measures of softwood composition, tree canopy closure and stand size. For all WMU’s,
the winter food HSI was more limiting than cover. Therefore, the fisher suitability values
used in this assessment are values obtained from the winter food HSI (Tables 3 and 4).


While the HSI model is useful for making general evaluations and comparisons of
areas for fisher, it represents a rather gross and insensitive approximation of
complexities of habitat suitability. The model indicates that almost all of Maine is fisher
habitat, but the quality of this habitat is related to the amount of food it can produce for
fisher. A habitat unit represents 1 mi2 of prime fisher habitat.
Changes
In the 1980 species assessment statewide fisher habitat was estimated to be
26,730 mi2. The current estimate is about 25,066 mi2. The reason for this decline is a
difference in what is considered to be fisher habitat.
In 1980, all forest habitat in the State (based on the 1971 Forest survey) was
considered to be fisher habitat. Although forest habitat increased in the 1982 forest
survey which is the basis for this evaluation, fisher habitat quantity is less in 1985,
because the area of forest in nonstocked and seedling habitat is no longer considered
habitat and has been subtracted from total forest area/
Changes in fisher habitat quality between the 1980 and 1985 assessments are
not comparable because no effort was made in 1980 to assess the quality of the fisher
habitat. Also, variables used in the HSI model were not measured in the 1971 forest
survey.
Projections
Total area of forests will change by little by 1990; however the amount of fisher
habitat is expected to decrease by approximately 5% to 23,886 mi2 (Table 4). Forest

harvesting is expected to increase 50% by 1990, primarily to provide fuel wood for
energy generation. Most harvesting will be by clear-cutting, resulting in an increase in
nonstocked and seedling stand areas. The area in these stand size classes (which are
not considered to be fisher habitat) is also expected to increase by 50%, resulting in a
decrease in fisher habitat.
The quality of habitat is expected to remain constant through 1990. Currently,
Maine's forests are maturing and tree growth is exceeding harvest. While long-range
projections call for harvests to exceed growth in approximately 20 years, the current
rate of harvest (3% of forestland annually) will not likely increase by 1990. Rather,
operations will be more intensive with harvesting by mechanized harvesting equipment.
This may decrease the amount of edge, but this will be offset by an increase in
understory density as the clear-cuts regrow. As this pattern continues over time,
diversity and fisher habitat quality may decline.
Wildlife Management Units
Status
The quantity of fisher habitat among WMU varied directly in proportion to the
area in forestland and inversely to the forest area in nonstocked and seedling stands.
WMU 2 has the most fisher habitat while WMU 7 has the least (Table 3).
Suitability of habitat as measured by the HSI model, also varied between
WMU'S. WMU 7 received the highest suitability rating while WMU's 2 and 3 were
lowest (Table 3).

Changes
Wildlife management unit changes in the quantity of fisher habitat between 1980
and 1985 were not uniform. Estimates of fisher habitat substantially increased in WMU
1, but greatly decreased in WMU 2. Fisher habitat in WMU's 4, 5, 6, and 7 decreased
from 6 to 10% but there was little or no change in WMU's 7 and 8.
A statement was made in the 1980 assessment that accelerating land
development in WMU's 7 and 8 was expected to decrease the amount of forestland
utilized by fisher. In this assessment, human population densities at levels which occur
in rural Maine were not considered a factor which reduces the amount of habitat for
fisher. Although quality of habitat might be affected by human population density, the
exact relationship is not known.
Projections
Although habitat conditions in some parts of the state will experience more
change than others, such deviations are difficult to predict on a WMU basis. For this
reason, the 50% increase in total area of seedling and nonstocked stands was applied
to all WMU'S. This resulted in a 3 to 6% decrease in quantity of fisher habitat with
WMU 4 having the least and WMU 6 the most decrease (Tables 3 and 4).
All WMU's are expected to maintain the same quality habitat.

POPULATION ASSESSMENT - CARRYING CAPACITY
Statewide
Status
A reliable estimate of long-term carrying capacity on optimum fisher range is not
available. Both Coulter (1966) in Maine and Hamilton and Cook (1955) in New York
reported maximum densities of one fisher per mi2 in winter based on track counts in
snow. Coulter did not believe this density could be maintained. Kelley (1977) found
densities as high as 0.67 per mi2 in New Hampshire. For this assessment, an estimate
of 0.67 fisher/mi2 (range 0.5-1/Mi2) is used as the maximum supportable fisher density
on optimum range.
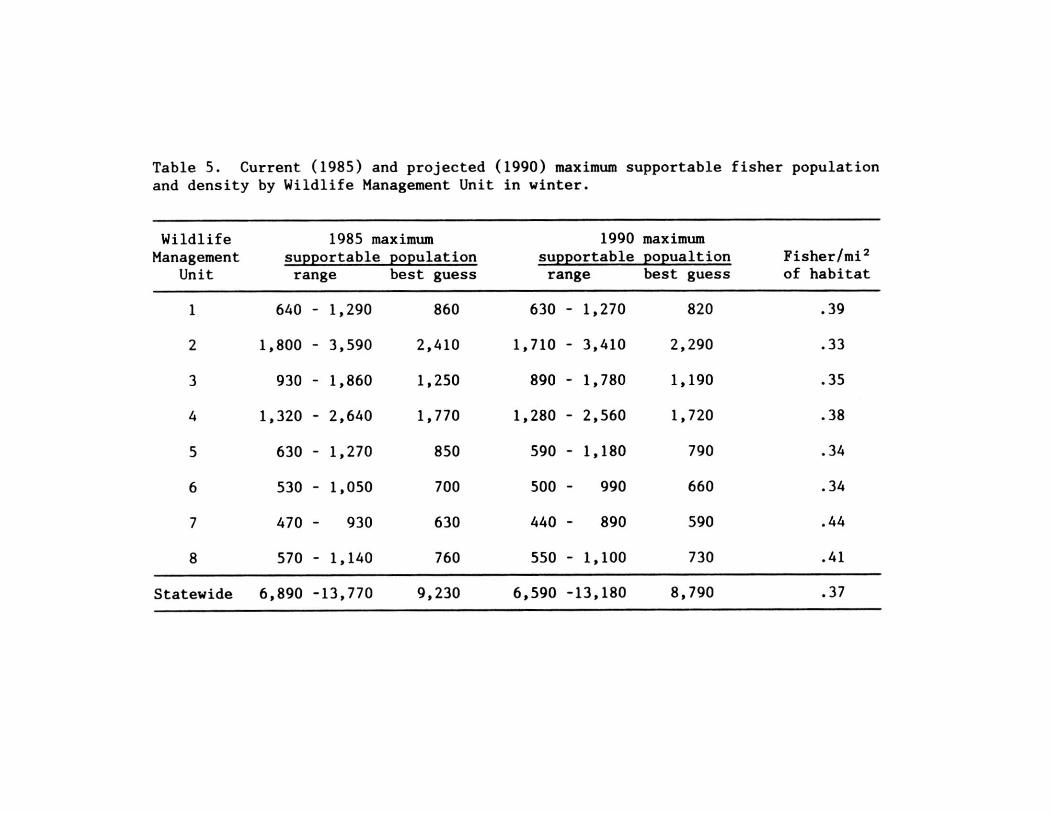
The number of habitat units present in each WMU (Table 3) was multiplied by the
maximum supportable density to obtain an estimated maximum supportable population
for the WMU (Table 5). Habitat units were obtained by combining estimates of the
quantity and quality of fisher habitat (habitat units = fisher habitat x HSI) to provide a
single numerical estimate of fisher habitat. one habitat unit represents 1 Mi2 of prime
fisher habitat. A statewide winter maximum supportable population of 9,230 fisher
(range 6,890-13,770) was obtained by this procedure.
Changes
In the 1980 assessment, the maximum number of fisher that Maine's habitat
could support in the fall was estimated to be 5,345 in 1980 based on one fisher per 5
square miles of habitat. The basis for this estimate was not given. The estimate used
for this assessment is 72% higher than the 1980 estimate.
Projections
The quantity of fisher habitat is expected to decline by 1990 while the quality will
remain constant. As a result, carrying capacity is predicted to decrease by 5% to 8,790
fishers by 1990 (Table 5).
Wildlife Management Units
Status
Differences in carrying capacities between WMU's are the result of differences in
the quantity and quality of fisher habitat. Both of these varied between WMU's (Table
3). Generally, the larger WMU's (WMU's 2, 3, and 4) have higher carrying capacities in
total numbers of fisher but WMU's with better habitat (WMU's 7 and 8) can support
more fisher per unit of habitat (Table 5).
Changes
Changes in estimated fisher carrying capacities between 1980 and 1985 are not
comparable due to different estimation procedure.
Projections
WMU projections of carrying capacity for 1990 are based on expected changes
in the quantity of fisher habitat. Decreases in carrying capacity are predicted to range
from 3% in WMU 4 to 6% in WMU 6 (Table 5).

POPULATION ASSESSMENT - CURRENT ESTIMATED POPULATION
Statewide
Status
Very little is known of fisher population densities. Coulter (1966) estimated
densities of 0.2-1/mi2 in the winter on the Moosehead plateau. These were believed to
be very high densities. Similar peak densities were estimated in New York. Kelley
(1977) estimated fisher densities of 0.33-0.67/Mi2 in the White Mountains of New
Hampshire. Steve Arthur (Pers. Comm.), based on a telemetry study in what is
believed to be optimal fisher habitat with the highest fisher populations in Maine,
estimates the fall density as 0.6-1/Mi2 of fisher habitat in WMU 7. Winter track counts
have been used in the Pierce Ponds area of WMU 3 (1982 and 1983) and the St. Croix
Lake are of WMU 1 (1983 and 1984) to obtain an index to fisher population densities.
The index is twice as high in the St. Croix study area as the Pierce Pond study area.
These studies and harvest data (harvest/mi2 and harvest/user were used to
estimate relative abundance among WMU's and then to estimate populations for each
WMU (Table 6). An assumption was made, based on computer trials of a population
model, that a harvest of more than 25-30% of the fall population will result in a
population decline. Details on the procedure are contained in the WMU section. The
statewide fall fisher population estimate was 8,610 and was obtained by summing the
individual WMU'S. A winter population was estimated by subtracting harvest and
natural mortality (40%) from the fall estimate.


A range map, based on recent harvest records was prepared (Figure 1).
Extensive land areas with moderate trapping effort but only occasional captures of
fisher were excluded.
Changes
The 1980 species update estimated a statewide population of 5,252 animals or
one fisher per 5 square miles of habitat. The current population estimate is 65% higher
than the previous one but does not indicate a population increase but rather a
refinement in technique. Population estimates for this update are more than twice this
prediction.
Projections
Population densities within suitable habitat are not predicted to change over the
next 5 years, but the amount of fisher habitat is expected to decline due to an increase
in wood harvesting. Therefore, the fisher population for 1990 is predicted to decline to
8,230, a decrease of 4%.
Wildlife Management Units
Status
Fisher densities and amount of habitat are believed to vary greatly by WMU;
therefore, population levels vary considerably (Table 6). Harvest, winter track counts,
and telemetry information was used to estimate fisher populations by WMU.


WMU 7. WMU 7 has the highest density of fisher in Maine. The fisher density,
estimated from a telemetry study in Waldo County, is 0.8/Mi2 of habitat in the fall.
WMU 1 and 8. Density of fisher in these units is lower than in WMU 7. Average
harvest per unit of habitat in WMU 8 is higher than WMU 1; however, effort is also
higher in WMU 8. Fisher densities are estimated to be 0.6/mi2 of habitat in the fall.
WKU 3. Winter track counts were conducted in a study area in WMU 3 in 1981
and 1982 and a study area in WMU 1 in 1983-85. Fisher track indices for WMU 3 were
approximately 50% of WMU 1, so the fisher density is estimated to be 0.3/Mi2 of habitat
in the fall.
WMU 2. The harvest in WMU 2, though increasing, is still lower than in WMU 3
despite intensive marten trapping in some areas and approximately the same number of
users per unit of habitat as 3. Fisher density was estimated to be 0.2/mi2 of habitat in
the fall which is lower than WMU 3 and equivalent to the lowest reported by Coulter
(1966).
WMU 4. This unit contains some of the best fisher habitat in Maine, but other
portions of the unit have poorer habitat and low harvests. Harvest per unit of habitat
approximates WMU 1 although effort is slightly higher than in Unit 1. Therefore, the
fisher density was estimated to be 0.5/mi2 of fisher habitat; slightly less than in WMU 1.
WMU 5 and 6. These units have very low fisher populations. Not all of the
WMU's are occupied by reproducing populations and range may not be expanding.
Harvests are low and not increasing. Therefore, it was assumed harvests are at or
exceeding maximum allowable levels (25-30%) and fisher density is estimated to be
0.08/Mi2 of habitat in WMU 5 and 0.03/mi2 of habitat in WMU 6 in the fall.

Changes
Population estimates for all WMU's except 6 are higher in this assessment than
estimated in 1980. WMU 6 decreased by 33% while the remaining WMU's increased
from 17% (WMU 7) to 220% (WMU 1).
Current population estimates are higher than projections made in 1980
assessment in all WMU's except 6.
Projections
Fisher population densities in all WMU's are predicted to remain the same for the
next 5 years. The amount of habitat is expected to decline as previously reported. As a
result, fisher populations by WMU are expected to decrease by 3 to 6%.
Several factors could make this prediction inaccurate. If harvests in WMU's 7
and 8 are excessive, populations may decrease significantly in these WMU's by 1990.
Several severe winters or a decline in snowshoe hare populations could also cause
fisher densities to decrease in WMU's 1, 2, and 3. A population increase may be
occurring in WMU 2. If this continues, populations in this unit could rapidly increase with
its low exploitation rate.

POPULATION ASSESSMENT - RELATIONSHIP OF ESTIMATED POPULATION TO MAXIMUM SUPPORTABLE POPULATION
Maine's 1985 winter fisher population (5,165) is 56% of the estimated carrying
capacity (9,230) (Table 7).
The 1980 population assessment estimated statewide populations to be slightly
less than carrying capacity. This same update predicted future population levels in
balance with carrying capacity. Estimates made in this update do not agree with these
former estimates. Fisher populations are now believed to be higher than previously
thought and carrying capacity is estimated to be much higher.
If assumptions listed in both the carrying capacity and actual population sections
are correct, both carrying capacity and population levels will decrease proportionally by
1990.


USE AND DEMAND ASSESSMENT - HARVEST
Statewide
Status
Trapping seasons have gradually been lengthened and delayed over the last five
years. From 1979 to 1984, the season was lengthened from 37 to 49 days in northern
Maine, while southern Maine went from 22 to 38 days. The season in the western
mountains was initially lengthened and then shortened to previous levels as it was
assigned to southern Maine in 1982. Land and water trapping seasons were made
concurrent to distribute pressure. Trapping seasons were extended into December to
improve pelt primeness, but restrictions were placed on traps set above the ground or
snow to protect fisher and marten. Finally in 1984, a uniform opening date was adopted
statewide to also distribute pressure.
Harvests from 1979-84 have fluctuated from 2,235 (1979) to 1,663 in 1982. The
mean harvest for 1981-84 was 1,860 fishers (Table 7). Since 1975, fisher harvests
have shown a high low cycle (Table 1). During this ten year period, the harvest has not
increased or decreased two consecutive years. The cause of this is not known. It could
be the result of over-exploitation in the high harvest years so that the population is
depressed the following year. Another cause could be decreased susceptibility to
trapping in the low harvest years due to a change in fisher behavior (the availability of
mast crops making fisher less susceptible to baiting or attracting them to different
areas). Finally, the reduced harvests could be in response to lower reproduction or

survival of young. Due to this pattern of harvests, looking at a single year's harvest can
be misleading.
Strickland and Douglas (1981) and Strickland et al. (1982) have suggested that
the ratio of all juveniles to adult (2+ years old) females in the harvest is an index to the
exploitation rate of the population. This ratio will decline when harvests are heavy and
increase when exploitation is lower. This is because juveniles are believed to be more
susceptible than adults. They predict a critical level of 4.0 based on Ontario data, which
may not be applicable elsewhere.
Since 1979, biological samples have been taken first from WMU's 3, 6, and 8,
and then statewide (Table 8). The radio tracked harvest as predicted but did not
exceed the critical level identified by Ontario. Although harvest decreased nearly 20%
in 1984, the ratio remained near the 1983 level.
The average annual harvest is 14% below the allowable harvest (based on a
25% harvest removal rate) which was estimated to be 2,170 (Table 7).
Changes
Average fisher harvest in the 1980 assessment was based on a three-year
average harvest which contain two low years. The current average harvest is 14%
higher than the 1979 harvest. If the harvest in the last assessment is adjusted by
adding a fourth year (1979) to the average, the current average is only 3% higher than
the past (1976-79) average.
The 1979 species assessment predicted a harvest decline to 1,235 by 1982.
The 1982 harvest was actually 1,663 (+35%).


Projections
An estimate of the average harvest in 1990 was obtained by projecting the trend
observed between the four year average harvest in the last assessment and the four
year average harvest used in this assessment for each WMU and then summing for a
statewide estimate. The estimated average harvest obtained was 1920 for years 1986-
89, a 3% increase over the current average (Table 9).
This harvest estimate is % below the estimated allowable harvest in 1990.
Wildlife Management Unit
Status
There is considerable variation in the fisher harvest between WMU's due to
differences in fisher populations, trapping effort, and access (Table 7). Harvest per unit
of habitat is highest in WMU 7 and lowest in WMU's 2, 4, and 5.
Although the statewide harvest is below the allowable harvest, harvests in
WMU's 5, 6, and 7 are near or exceed estimated allowable harvests.
Changes
Harvest averages in 1981-84 exceeded 1976-79 levels in WMU's 1 (44%), 2
(72%), 3 (76%) while they have declined in WMU's 5 (-12%), 7 (-23%), and 8 (-25%).
Harvests in WMU's 5 and 6 did not change.
Harvest projections made for 1982 in the last update were exceeded by the
mean harvest in all WMU's except 6.


Projections
Harvests are projected to increase in WMU’s 1 (29%), 2 (41%), and 3 (44%)
while decreasing in WMU’s 4 (-13%), 7 (-28%), and 8 (-29%) by 1990. WMU’s 5 and 6
are not projected to change.
If the projections are accurate, WMU 1 will replace 7 as the one with the highest
removal per unit of habitat. Projected harvests will exceed allowable harvests in WMU’s
1, 3, and 5.

USE AND DEMAND ASSESSMENT - TYPES OF USERS
Statewide
Status
Fisher are secretive animals that are seldom seen in the wild. As a result, non-
consumptive users are restricted to observing tracks in the winter. Trappers are the
only consumptive users, since hunting has been prohibited since 1976.
Fishers are the most economically valuable furbearer in Maine. Individual pelts
have averaged more than $100. In a 1980 trapper questionnaire (Clark 1985), trappers
ranked species by preference. Fisher were ranked second in areas of the State except
WMU's 5 and 6 where fisher populations are low.
Fisher are captured in all types of land traps; therefore, any individual who sets a
land trap can be classified as a potential fisher trapper. There are several biases in this
estimate but other information indicates it is a valid estimate (Appendix 1).
From 1981-84, an average of 812 trappers tagged at least one fisher (Table 7).
The average take was 2.3 fishers per trapper. Only 17% of the successful trappers
catch 4 or more fisher but they account for more than one-half of the harvest.
Use opportunity is influenced by both the number and accessibility of fisher.
Demand (as measured by trappers who would like to catch a fisher) exceeds the
allowable harvest; therefore, use opportunity is limited (Table 7).
Accessibility is good throughout the State, but posted land or restricted access
limits some opportunity to trap. Current regulations allow seasons to extend late into
the year when weather conditions may limit access and trapping opportunity.
Changes
An estimate of total users was not made in the last update. Total trapping
license sales have declined by 15% since a peak in 1980.
Total successful users have remained nearly the same since the last update; 791
in 1976-78 and 812 in 1981-84. The average harvest/successful fisher trapper has
increased slightly since the last update.
Use opportunity has increased statewide and estimates of fisher populations are
also higher. Seasons have been liberalized in length later in the year when trapping
conditions are more difficult due to inclement weather. Road access has increased
while the amount of posted land has not increased significantly.
The 1980 species plan projected a decrease in use opportunity by 1982. Harvest
regulations and land access were expected to be more restrictive and some type of anti-
trapping legislation was anticipated. These predictions were not realized.
Projections
Projections of users and use opportunity are more difficult to make. Trapping
license sales have decreased as average pelt prices for all furbearers except marten
and fisher have decreased. Mandatory trapper training will be in effect for first-time
trappers in 1988, possibly discouraging recruitment. With these limitations plus the
possibility of major use-opportunity changes, linear projections do not appear
appropriate so predictions will be used.

The following assumptions will be used to guide these predictions: 1) trapping
license sales will decrease by 20% by 1990 but fisher users will not decrease as much
due to continued high prices, 2) changes in the number of users will not be uniform
statewide, 3) and success rates will remain constant in all WMU'S.
The number of fisher trappers is expected to decrease 4% (to 2,440) in 1990
(Table 9). This is one-fifth the rate trapping license sales will decrease. Successful
users will increase only slightly while harvest/successful trapper will remain the same.
Use-opportunity will decrease as the need arises to restrict harvest in face of
declining harvests in more populace units. Mandatory trapper training will restrict the
opportunity of some new trappers to participate. Continued development and land
posting will restrict access in southern Maine. Passage of legislation restricting the use
of leghold traps at the state or federal level could dramatically reduce use-opportunity.
Wildlife Management Units
Status
Total users are highest in the southern WMU’s (4, 7, and 8). Total users are
lowest in WMU's 3 and 5 but users per unit area of fisher habitat is lowest in Unit 2.
Successful users are greatest in WMU's with the highest harvest. Success rate
(harvest/successful trapper) is relatively uniform with the exception of WMU's 5 and 6.
WMU 3 (53%) followed by 7 (40%) and 1 (39%) have the highest percent of users who
are successful (as defined by tagging 1 fisher). WMU's 5 (17%) and 6 (6%) are once
again the lowest.

WMU 8 followed by 7 and 4 have the most restrictions on use-opportunity due to
human land development and posting. Density of deer hunters also restricts opportunity
in these units. Low fisher populations reduce use-opportunity in WMU's 5 and 6.
Severe weather impacts use-opportunity in WMU's 1, 2, and 3 where trapping seasons
are longer.
Fisher trapping in portions of WMU's 1, 2, and 3 is incidental to the effort
expended for marten.
Changes
Successful users are higher than 1976-78 levels in WMU's 1, 2, and 3 while
lower in WMU's 4, 7, and 8. Successful users have not changed in WMU's 5 and 6.
Projections of successful users made in 1979 for 1982 were correct for WMU's 1, 2, 3,
5,.and 6 but were much too high for WMU's 4, 7, and 8.
Projections
Users are predicted to increase in WMU’s 1, 2, 3, 5, and 6 while decreasing in
WMU's 4, 7, and 8. If marten pelt price decreases, fisher use in WMU's 1 and 2 will
decrease as a result.
Successful users will increase in WMU’s 1, 2, and 3 in anticipation of higher
harvests but will decrease in WMU’s 4, 7, and 8.
Use-opportunity will decrease in WMU’s 4, 7, and 8 as development and land
posting will continue to remove locations to trap.
SUMMARY AND CONCLUSIONS
The fisher is Maine's most economically valuable furbearer. Quality of the pelt
makes females worth up to two times the larger male. Peak pelt primeness occurs in
November and December. Although most females breed at 1 year of age, the young
are not born for nearly a year. Adult males may be responsible for the majority of
breeding. The young, usually 3, are raised by the female and disperse in late summer
or fall.
Fisher have been an economically important furbearer since the 1800's. Fisher
populations declined in the early part of this century due to limited habitat from land
clearing and trapping exploitation. Populations' Iows were reached by the 1930's when
a closed season was declared from the mid-1930's to the mid-1950's. Population
recoveries began in the 1940'S, and increases and range expansion moved from the
Moosehead Plateau westerly and southerly along the western mountains. Large and
rapid population increases (irruptions) occurred as fisher spread into the unoccupied
habitat created by the revertion of farmland in southern and central Maine.
Fisher were hunted and trapped until 1976, when hunting was prohibited. From
the reopening of the season until 1975, the season varied in length from 1 to 4 months.
Since 1976, a variety of regulations (trap restrictions, limits, common season dates,
etc.) have been tried to limit fisher harvests. ince 1979, seasons have been gradually
lengthened and opening dates delayed. Since 1975, an annual cycling of harvests
(each high year is followed by a low year) have occurred with a mean harvest of 1,900.
From 700 to 1,000 individuals tag at least one fisher but over 2,000 trappers indicated

they trap for them (Table 10). Harvest objectives have varied from 4,000 to 1,600 for
the two planning periods (Table 10).
Fisher habitat is composed of food and cover. Winter habitat is believed to be
limiting for fisher. Fisher will utilize any forest habitat which provides overhead cover.
Over 25,000 mi2 (78%) of Maine's land area meets this requirement. The quality of
fisher habitat is determined by the quantity and variety of food. Fisher habitat has
decreased slightly since the last update. A 5% decrease in habitat due to increased
intensive forest harvesting is expected for 1990. The best quality of fisher habitat
occurs in WMU's 7 and 8. WMU's 2 and 4 have the greatest quantity.
Fisher carrying capacity based on habitat was estimated for the winter as
approximately 9,000 animals. This is a large increase over the last estimate. Carrying
capacity is expected to decrease slightly by 1990.
Fisher population estimates are based on population densities from radio-
collared fisher in WMU 7, winter track counts, harvest levels, computer models, and
personal opinion. The current fall estimate is approximately 8,500 fisher. This is much
higher than the 1980 estimate. Fisher densities are highest in WMU 7 and lowest in
WMU's 5 and 6. Fisher populations are estimated to be at approximately, one-half of
carrying capacity. Most of this shortfall occurs in WMU's 2, 5, and 6. Populations are
not expected to change significantly by 1990.
Currently, 2,500 trappers are attempting to trap fisher. Approximately 800 are
successful with an average catch of 2.3 fisher resulting in a statewide harvest of 1,860.
Success rates are highest in WMU's 3 and 7 and lowest in WMU 6 which has few fisher.
Fisher harvests on the average have been stable since the last update as has


successful users and success rate. This pattern is expected to continue to 1990. Total
users may decrease slightly by 1990 while use-opportunity has a greater potential for
decline due to land posting and development, mandatory trapper training, and more
restrictive harvest regulations. Most of these changes will impact southern and central
Maine (WMU's 4, 7, and 8).

LITERATURE CITED
Aldous, C. M. and H. C. Mendall. 1941. The status of big game and fur animals in
Maine. Maine Cooperative Wildlife Research Unit. Mimeo. 24 pages and maps. Allen, A. W.. 1983. Habitat Suitability Index Models: Fisher. U. S. Department of the
Interior, Fish and Wildlife Service. FWS/OBS-82/10.45. 19pp. Blanchard, H. M. 1964. Weight of a large fisher. J. Mammal. 45:487-488. Clark, A. G. 1985. Characteristics of trappers in Maine, 1976 to 1980. Unpub. M.S.
Thesis, Virginia Tech. University, Blacksburg. 156pp. Coulter, M. W. 1966. Ecology and management of fisher in Maine. Unpub. Ph.D.
Diss., State University College of For., Syracuse University. 183pp. Hamilton, W. J., Jr. and A. H. Cook. 1955. The biology and management of the fisher
in New York. N.Y. Fish Game J. 2:13-35. Jenks, J. A. and A. G. Clark. 1984. An annotated bibliography on pelt primeness.
Unpub. PR Report W-69-R-202. Augusta, Maine. 28pp. Kelley, G. M. 1977. Fisher (Martes pennanti) biology in the White Mountain National
Forest and adjacent areas. Unpub. Ph.D. Diss., University of Massachusetts, Amherst. 178pp.
Marston, M. A. 1942. Winter behavior of deer in northwestern Maine. Unpub. M.S.
Thesis, University of Maine, Orono. 53pp. Rego, P. W. 1984. Factors influencing harvest levels of fisher in southcentral and
southeastern Maine. Unpub. M.S. Thesis, University of Maine, Orono, Maine. 54pp.
Shea, M. E., N. L. Rollins, R. T. Bowyer, and A. G. Clark. Corpora lutea, number as
related to fisher age and distribution in Maine. J. Wildlife Manage. 49(1):37-40. Strickland, M. A. and C. W. Douglas. 1981. The status of fisher in North America and
its management in southern Ontario. Pp. 1443-1458 in Chapman, J. A. and D. Pursley, eds. Worldwide Furbearer Conference Proceedings. Worldwide Furbearer Conference, Inc., Frostburg MD. 2056pp.
_____, C. W. Douglas, M. Novak, and N. P. Hunziinger. 1982. Fisher. Pp. 586-598 in
Chapman, J. A. and G. A. Feldhamer. Wild mammals of North America. Johns Hopkins University Press, Baltimore. pp. 1147.
FISHER MANAGEMENT GOALS AND OBJECTIVES 1985-1990
GOAL: Maintain fisher population at no lower than current (1985) levels throughout the State. Abundance objective: Maintain preharvest fisher populations at no lower than 1985 levels in all WMU's (estimated at 0.8/mi2 habitat in WMU 7, 0.6/mi2 habitat in WMU's 1 and 8, 0.51/mi2 in WMU 4, 0.3/mi2 habitat in WMU 3, 0.2/mi2 habitat in WMU 2, 0.08/mi2 habitat in WMU 5, and 0.03/mi2 habitat in WMU 6) through 1990. Harvest objective: Maintain average harvest at 1,900 fisher per year or whatever level needed to stabilize the population (allow harvest to increase if population increases) and maintain use-opportunity (season length and timing) at current levels through 1990. Capability of Habitat: The habitat is capable of supporting fisher populations at current levels in all WMU'S. The population in WMU 7 is near carrying capacity and if habitat declines, population levels may not be maintained. If development continues to increase in WMU 8, habitat quantity and quality will be degraded resulting in lowered carrying capacity and population. Feasibility: The abundance objective can be accomplished if excessive harvests or habitat degradation due to development do not decrease fisher populations. Populations could increase in most units if estimates of population carrying capacity are reasonably accurate. The harvest portion of the harvest objective can be accomplished if major decreases in population do not occur. If the pelt price of fisher remains high while the value of other furs declines further, harvest levels could increase beyond current levels. If populations increase, harvest could also increase over current levels. Harvests in WMU's 4, 7, and 8 could decrease due to access problems if land posting continues to increase. The use opportunity part (maintain current seasons) of the harvest objective can be accomplished if populations do not decline, excessive harvests do not occur, or season restrictions are not required to limit the harvest of other species (marten and bobcat). Desirability: The abundance objective would be desirable to trappers who want to harvest fisher on a long-term basis. Individuals who would like more fisher in low population areas (WMU's 5 and 6) may view this as undesirable. The harvest objective would be desirable for trappers who want to harvest fisher, but undesirable for individuals wanting longer (or earlier) trapping seasons for other species (coyote and red fox).

Possible Consequences: This goal and its accompanying objectives appears to have few consequences. There will be some negative feeling from individuals who would like longer seasons for coyote and red fox. To maintain populations in WMU’s 7 and 8 may require more emphasis on habitat protection and improvement. There may be negative reactions from individuals in WMU 5 and 6 where fisher populations are low and from individuals who want a more active program to increase populations in these areas. Continuing high prices for fisher without accompanying increases in pelt prices of other forbearer species may necessitate some harvest restrictions.

Summary of working Group Concerns
FISHER
Habitat 1. Forest practices including large clearcuts, mechanized harvesting and herbicides
have reduced prey and habitat, particularly in northern Maine. After clearcut, it takes 10-15 years to again become fisher habitat.
2. Forests taking longer to regrow after cuts due to nutrient loss. 3. Forests are important both for cover and prey production. 4. Forest inventory did not pick up a large increase in timber harvesting in WMU 2.
Perception of our people as well as public is this is wrong. 5. The effect of harvesting and herbicides needs to be explored. Population1. Fisher population may be limited by parasites and disease. 2. Keeping track of the sex and age ratio of fisher - more females are taken than
males. 3. The exact cause of population ups and downs is not known. 4. Need better population estimates. Harvest/Use Opportunity1. Increase in cutting has resulted in increased road access which has increased the
harvest. 2. Do not want all other trapping to revolve around fisher management. 3. Development in southern Maine effects use-opportunity more than fisher
populations. 4. Leasing of land in unorganized areas may limit use opportunity.

Fisher Problems and Strategies in Order or Priority Problem 1: Lack of information on the size and dynamics of the fisher population on a
WMU basis. Strategy 1: Develop and implement a system to monitor populations and
regulate harvests on a WMU basis. Problem 2: Lack of information on whether the HSI adequately measures habitat
quality and capacity on a WMU basis. Strategy 1: Evaluate the existing method for measuring habitat and
estimating carrying capacity (with emphasis on the effects of human development and forest management activities).
Problem 3: Lack of a timely measurement of the amount of fisher habitat by WMU and
how it is changing. Strategy 1: Implement a system to track habitat changes (clearcutting,
land-clearing, land abandonment, development) by WMU more frequently and current than land use inventory.
Problem 4: Decreasing accessibility of private lands to trapping. Strategy 1: Develop a system to monitor the amount of land being lost to
public access by WMU. Strategy 2: Develop and implement programs to maintain access to
private lands. Strategy 3: Acquire access rights to land where necessary. Problem 5: Opposition to consumptive use of fisher by non-consumptive users. Strategy 1: Develop programs to minimize conflicts and concerns of
nonconsumptive users and maintain use opportunity.