fisheries division federal aid job progress report
TRANSCRIPT
1
Fisheries Division
Federal Aid Job Progress Report
Montana Statewide Fisheries Management
Federal Aid Project Number: F-113
July 1, 2014 – June 30, 2015
Project Title: Montana Statewide Fisheries Management
Job Title: Southeastern Montana Warmwater Streams Investigation
Abstract: The Tongue River is a major tributary to the Yellowstone
River. Anthropogenic activities, particularly the
construction of dams, in the Tongue River watershed has
affected the fish assemblage. A monitoring program was
initiated in 2003 to monitor relative abundance, size
distribution, and body condition of fish populations through
time. Annual trend sampling consists of electrofishing at
six locations. Seining was part of annual trend sampling
from 2003 to 2009. In 2007 a bypass channel (Muggli
Bypass) was constructed to provide fish passage around
T&Y Diversion Dam. Modified fyke nets and
electrofishing gears were used to assess the success of the
fish passage structure. Passage was evaluated from 2008 to
2012. Twenty fish species have been documented using
the Muggli Bypass since its construction. Fish passage for
most species was deemed successful based on similar
trends in abundances between the bypass channel and the
river downstream of the bypass. However, Shovelnose
Sturgeon, which are found in the Tongue River below T&Y
Diversion Dam, have not been documented passing through
the bypass. Alterations to the Muggli Bypass may be
necessary to facilitate Shovelnose Sturgeon passage.
2
INTRODUCTION
The Tongue River is a major tributary to the Yellowstone River in eastern Montana. It
supports a rich assemblage of native warm water fish and provides spawning habitat and
fish production that contributes to Yellowstone River fish populations. Few long-term
studies have focused on the status of the Tongue River fish assemblage despite a long
history of human activity in the drainage. Although game fishes are present in the river,
sport fishing is limited by access and flow conditions. The primary human activities in
the Tongue River watershed are agriculture and the development of coal resources.
Agriculture is the primary land use practice in the Tongue River watershed. Water from
the Tongue River is used to irrigate tens-of-thousands of acres of farmland in the Tongue
River drainage. Irrigation projects have had and still have a substantial impact on the
Tongue River fish assemblage. Water withdrawal is so extensive that reaches of the
Tongue River are completely dewatered during low water years. Irrigation diversion
dams function as barriers to fish movement and have fragmented fish populations. Fish
are also lost from the Tongue River fishery through entrainment into irrigation canals.
Development of coal resources is another major industry in the watershed. Construction
of a Tongue River Railroad has been proposed to facilitate increased coal extraction and
transport. The proposed railroad would be constructed along the banks of the Tongue
River for much of its course. Numerous sites in the Tongue River watershed have been
permitted for the development of coal bed methane extraction. The extraction of coal bed
methane involves pumping methane and groundwater from coal seams. Water with high
salinity and conductivity is a byproduct in the process that is discharged into the Tongue
River above Tongue River Reservoir.
Although many of the changes occurring in the Tongue River drainage have the potential
to negatively affect the fish assemblage, there are ongoing projects intended to improve
and protect the fishery. These projects have focused primarily on reducing entrainment
and improving or creating fish passage at three major irrigation diversion dams on the
Tongue River. Since its construction in the 1880’s, the Tongue & Yellowstone (T&Y)
Diversion Dam has prevented the upstream movement of fishes beyond the dam, and
fragmented a once connected system. In 1999, the T&Y canal head gate and louver
structure was replaced to reduce fish entrainment into the irrigation canal. In August
2007, a fish passage structure, the Muggli Bypass, was constructed around T&Y
Diversion Dam (Figure 1). In October 2008 SH Diversion Dam upstream of T&Y was
removed (Figure 1). In 2005 water withdrawals from the Mobley Diversion Dam were
transferred to pumps. The dam is no longer maintained and damage from ice scour and
high flow has created some fish passage opportunity. However, Mobley Diversion Dam
still impedes fish movement during low water periods. Future efforts will focus on a
more complete removal of Mobley Diversion Dam. The completion of the Muggli
Bypass and removal of SH Dam has provided a means for fish to move upstream to the
Tongue River Dam with little restriction.
3
Collection of baseline data before possible expansion of energy development and
assessment of fish passage opportunities prompted the implementation of a monitoring
program in the Tongue River. The monitoring program began in 2003 to assess the status
of the Tongue River fish assemblage and evaluate fish population trends.
Goals and Objectives
The purpose of this project is to monitor fish population trends in the Tongue River.
Specifically, the objectives are to:
(1) assess the current relative abundance, size structure, and body condition of fish
populations in the Tongue River,
(2) evaluate changes in relative abundance, size structure, and body condition
through time, and
(3) evaluate the success of fish passage around T&Y Diversion Dam.
Through carrying out these objectives, Montana Fish, Wildlife & Parks will be able to
identify concerns or benefits that activity in the Tongue River watershed may have and
make more informed management decisions.
STUDY AREA
The Tongue River originates on the eastern side of the Big Horn Mountains in north-
central Wyoming. The Tongue River has a drainage area of 13,932 km2, approximately
70% occurring in Montana. The total length of river in Montana from the state line to its
confluence with the Yellowstone River, near Miles City, is 337 km (Figure 1). The Fort
Union Coal Formation underlies the Tongue River watershed (Elser et al. 1977).
The Tongue River in Montana has been divided into five segments separated by four
dams. There are three irrigation diversion dams: (1) Tongue and Yellowstone (T&Y)
Diversion Dam (river mile 20), (2) SH Diversion Dam (river mile 51) (no longer exists),
and (3) Mobley Diversion Dam (river mile 105), and one flood control dam, Tongue
River Dam (river mile 189) (Figure 1). There is a thermally unique sixth river segment
created by cold water released from the hypolimnion zone of Tongue River Reservoir.
This segment is approximately ten river miles long and ends downstream of the dam near
the Rosebud/Big Horn County line.

4
Figure 1. Tongue River, tributaries, diversion dams and trend sections.
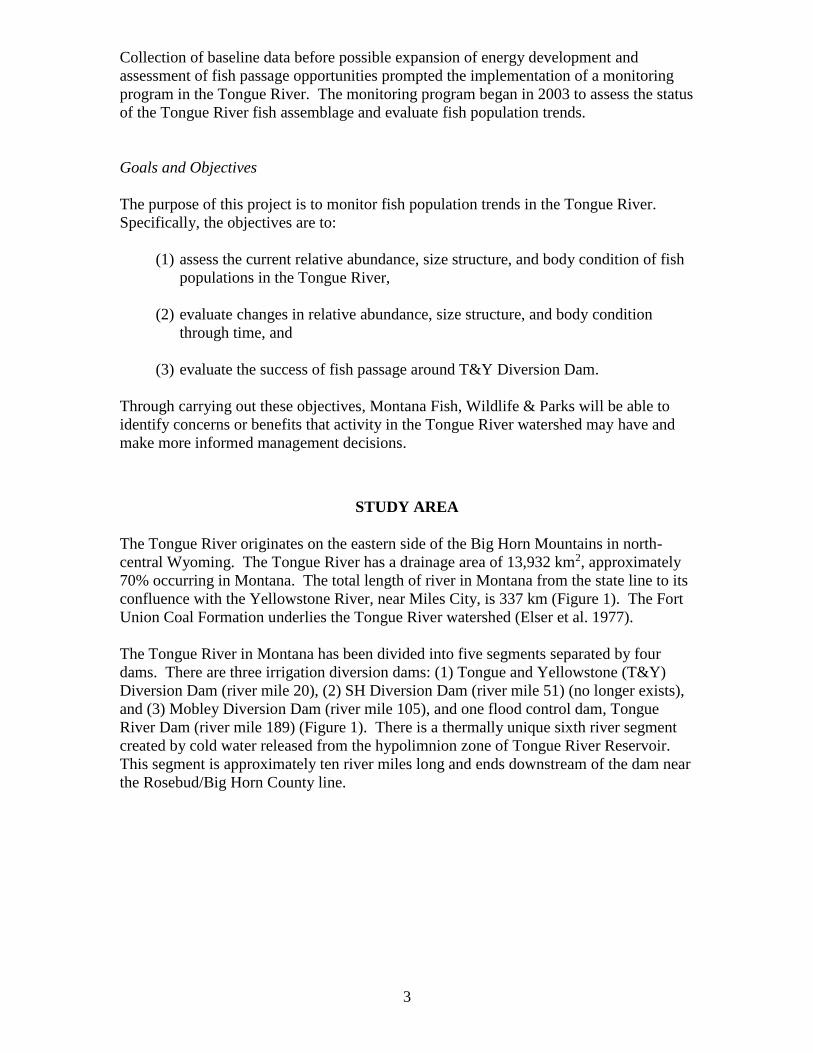
Average annual discharge of the Tongue River at Miles City from 1939 to 2014 was 408
cfs (Figure 2). Drought conditions from 2000 to 2006 resulted in below average flows in
the Tongue River. During this period, drought and irrigation demand nearly dewatered
the river during summer months. Flows were above average in 2007, 2008, 2010, 2011,
and 2014 near average in 2009 and below average in 2012 and 2013 (USGS 2014). In
Yellowstone River
Tongue River
Ashland
Miles City
Birney
T&Y Dam
SH Dam
Mobley Dam
Pumpkin Cr.
Brandenberg
Tongue River Reservoir
County Line
= Location of Trend Sections
Decker
Hanging Woman
Cr.
Otter Cr.
State Line
Section 6
Section 5
Section 4
Section 3
Section 2 (2013)
Section 2 (2007)
Section 1 (2013)
Section 1 (2007)
Bighorn/Rosebud
County Line
5
recent years the Montana Department of Natural Resources Conservation (DNRC) has
increased spring discharge from Tongue River Reservoir to reduce the amount of high
salt, coal bed methane water stored in the reservoir prior to the start of irrigation season.
Figure 2. - Mean annual discharge of the Tongue River at Miles City, 1940-2015.
Dashed line represents overall mean annual discharge for the period of record.
METHODS
Annual trend sampling
Six trend sections were established to represent the six segments of river (Figure 1).
Annual electrofishing of the Tongue River began in 2003. Electrofishing gear included a
14-foot flat bottom boat, 3500-watt generator, Coffelt VVP-15, single boom anode, ½
inch-mesh dip net and a single netter. In 2012 the Coffelt VVP-15 was replaced with the
Smith-Root VVP-15B model. In 2014 the Smith-Root VVP-15B model was replaced
with the Smith-Root GPP 5.0 model. One riverbank was continuously sampled in each
section to reduce sampling bias and to include all habitat types. Seines were incorporated
into annual trend sampling from 2003 to 2009. Trend sections were sampled in one-mile
increments and for a total distance of five miles for Birney and Hirsch trend areas and six
miles for each of the other four trend areas.
Catch per unit effort (C/f) (Fabrizio and Richards 1996; Hubert 1996; Ney 1996) was
calculated as the number of fish caught per hour of electrofishing, and used to describe
the relative abundance of each fish species. Calculations of C/f were made for each
species in each trend section, and C/f was compared between trend sections and across
years.
Proportional size distribution (PSD) (Anderson and Neumann 1996; Guy et al. 2006 and
2007) was used to describe the length structure of fish species sampled. Calculations of
PSD values were made for: Brown Trout (Milewski and Brown 1994), Channel Catfish,
0
100
200
300
400
500
600
700
800
900
1000
1940 1955 1965 1975 1985 1995 2005 2015
Dis
cha
rge
(ft3
/s)
Year

6
Sauger, Smallmouth Bass, Walleye, Northern Pike (Gablehouse 1984), Rainbow Trout
(Anderson and Neumann 1996), River Carpsucker, Shorthead Redhorse Sucker, and
White Sucker (Bister et al. 2000). Calculations of PSD values for Brown Trout and
Rainbow Trout were made using data from trend section five. Calculations of PSD
values for the other species were made using pooled data from all trend sections.
Comparisons of PSD values were made between years.
Body condition of fish species sampled was calculated using relative weight (Wr) (Wege
and Anderson 1978; Anderson and Neumann 1996; Blackwood et al. 2002). Relative
weight was calculated for Brown Trout (Milewski and Brown 1994), Channel Catfish
(Brown et al. 1995), Northern Pike (Anderson and Neumann 1996), Rainbow Trout,
Sauger (Anderson and Neumann 1996), River Carpsucker, White Sucker, Shorthead
Redhorse Sucker (Bister et al. 2000), Smallmouth Bass (Kolander et al. 1993), and
Walleye (Murphy et al 1990). Calculations of mean Wr values for Brown Trout and
Rainbow Trout were made using data from trend section five. Calculations mean Wr
values for the other species were made using pooled data from all trend sections.
Comparisons of mean Wr values were made between years.
Water Chemistry
Water chemistry and river flows were recorded on days that electrofishing and bypass
sampling occurred. A handheld water meter (YSI model 85) was used to collect water
temperature, dissolved oxygen, specific conductivity, and salinity data. A Hanna pHep
pH meter was used to measure pH. A Secchi tube was used to quantify water clarity.
River discharge was obtained from the United States Geological Survey web page (USGS
2015).
RESULTS
Annual trend sampling
All six trend sections were sampled using electrofishing gear in 2015. The locations of
the trend sections have been the same since 2009 (Figure 1). Section locations, lengths
and sampling dates are provided in Appendix 1, Table 1. Electrofishing catch rates by
trend section for 2015 are summarized in Appendix 1, Table 2.
7
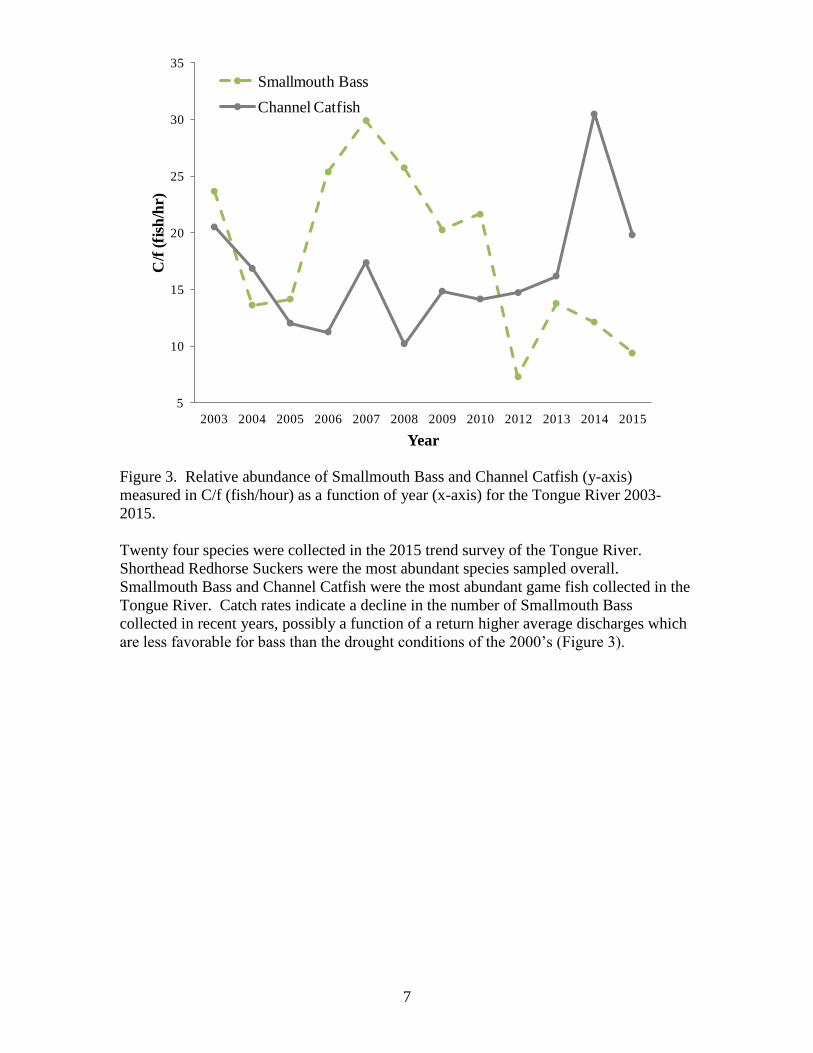
Figure 3. Relative abundance of Smallmouth Bass and Channel Catfish (y-axis)
measured in C/f (fish/hour) as a function of year (x-axis) for the Tongue River 2003-
2015.
Twenty four species were collected in the 2015 trend survey of the Tongue River.
Shorthead Redhorse Suckers were the most abundant species sampled overall.
Smallmouth Bass and Channel Catfish were the most abundant game fish collected in the
Tongue River. Catch rates indicate a decline in the number of Smallmouth Bass
collected in recent years, possibly a function of a return higher average discharges which
are less favorable for bass than the drought conditions of the 2000’s (Figure 3).
5
10
15
20
25
30
35
2003 2004 2005 2006 2007 2008 2009 2010 2012 2013 2014 2015
C/f
(fi
sh/h
r)
Year
Smallmouth Bass
Channel Catfish
8
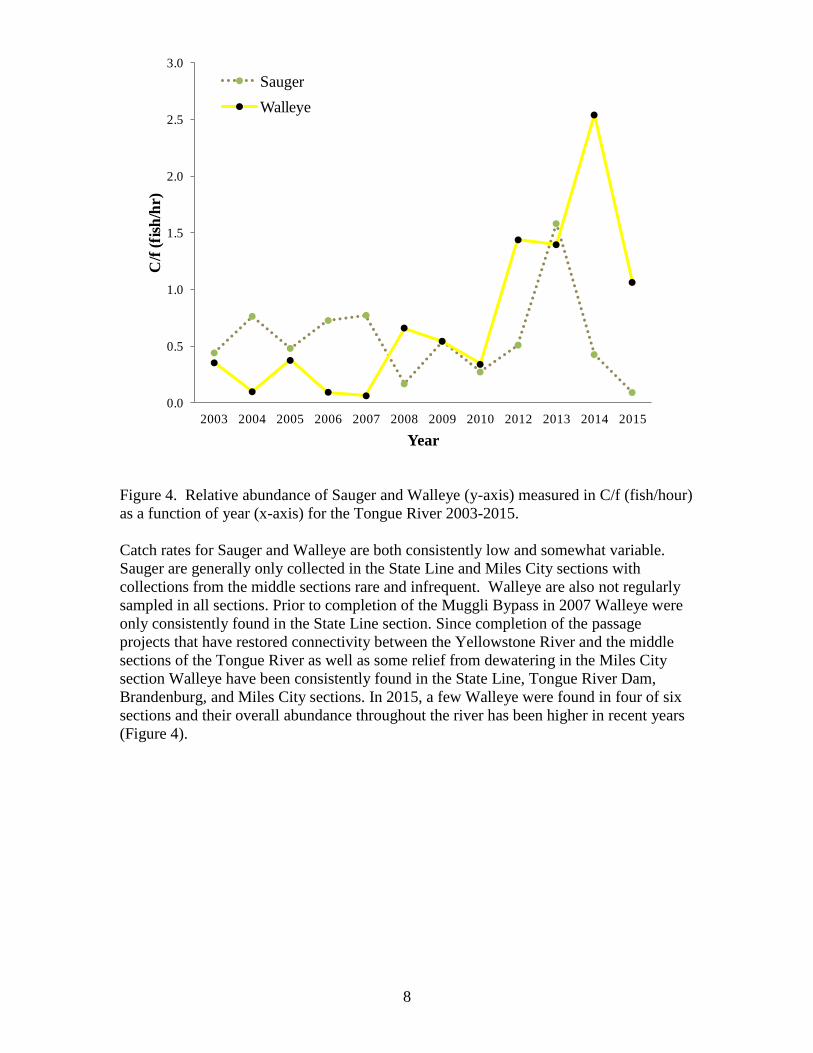
Figure 4. Relative abundance of Sauger and Walleye (y-axis) measured in C/f (fish/hour)
as a function of year (x-axis) for the Tongue River 2003-2015.
Catch rates for Sauger and Walleye are both consistently low and somewhat variable.
Sauger are generally only collected in the State Line and Miles City sections with
collections from the middle sections rare and infrequent. Walleye are also not regularly
sampled in all sections. Prior to completion of the Muggli Bypass in 2007 Walleye were
only consistently found in the State Line section. Since completion of the passage
projects that have restored connectivity between the Yellowstone River and the middle
sections of the Tongue River as well as some relief from dewatering in the Miles City
section Walleye have been consistently found in the State Line, Tongue River Dam,
Brandenburg, and Miles City sections. In 2015, a few Walleye were found in four of six
sections and their overall abundance throughout the river has been higher in recent years
(Figure 4).
0.0
0.5
1.0
1.5
2.0
2.5
3.0
2003 2004 2005 2006 2007 2008 2009 2010 2012 2013 2014 2015
C/f
(fi
sh/h
r)
Year
Sauger
Walleye
9
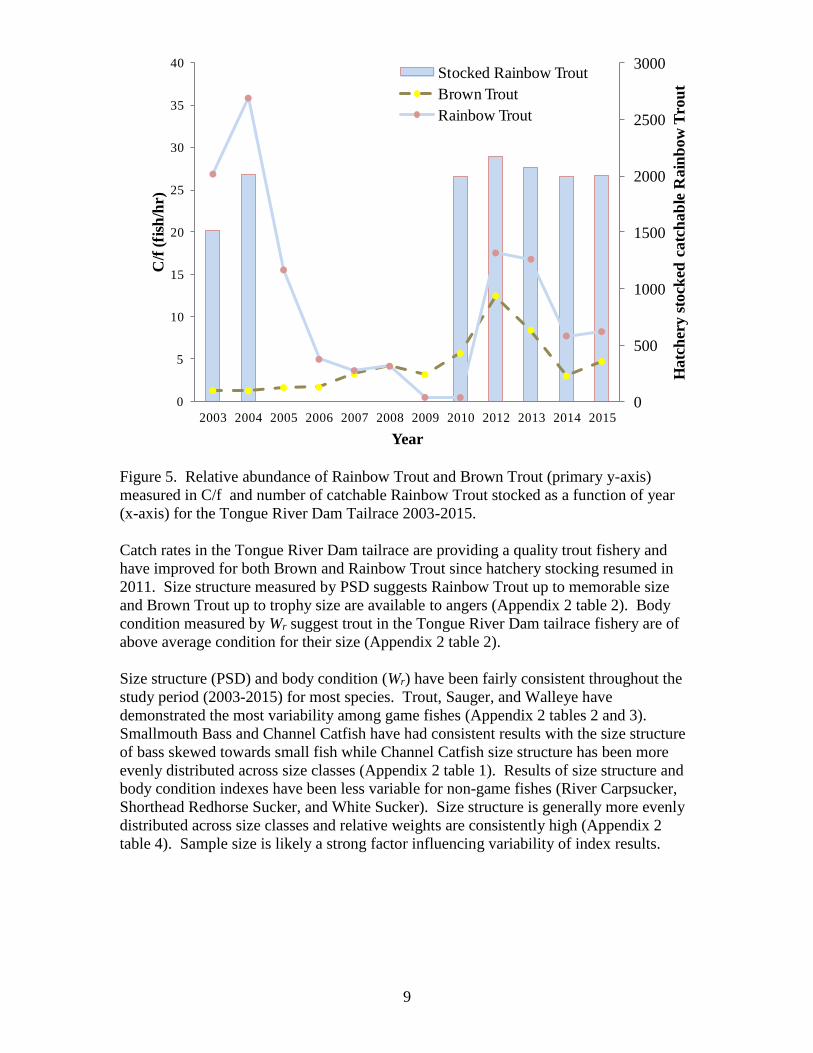
Figure 5. Relative abundance of Rainbow Trout and Brown Trout (primary y-axis)
measured in C/f and number of catchable Rainbow Trout stocked as a function of year
(x-axis) for the Tongue River Dam Tailrace 2003-2015.
Catch rates in the Tongue River Dam tailrace are providing a quality trout fishery and
have improved for both Brown and Rainbow Trout since hatchery stocking resumed in
2011. Size structure measured by PSD suggests Rainbow Trout up to memorable size
and Brown Trout up to trophy size are available to angers (Appendix 2 table 2). Body
condition measured by Wr suggest trout in the Tongue River Dam tailrace fishery are of
above average condition for their size (Appendix 2 table 2).
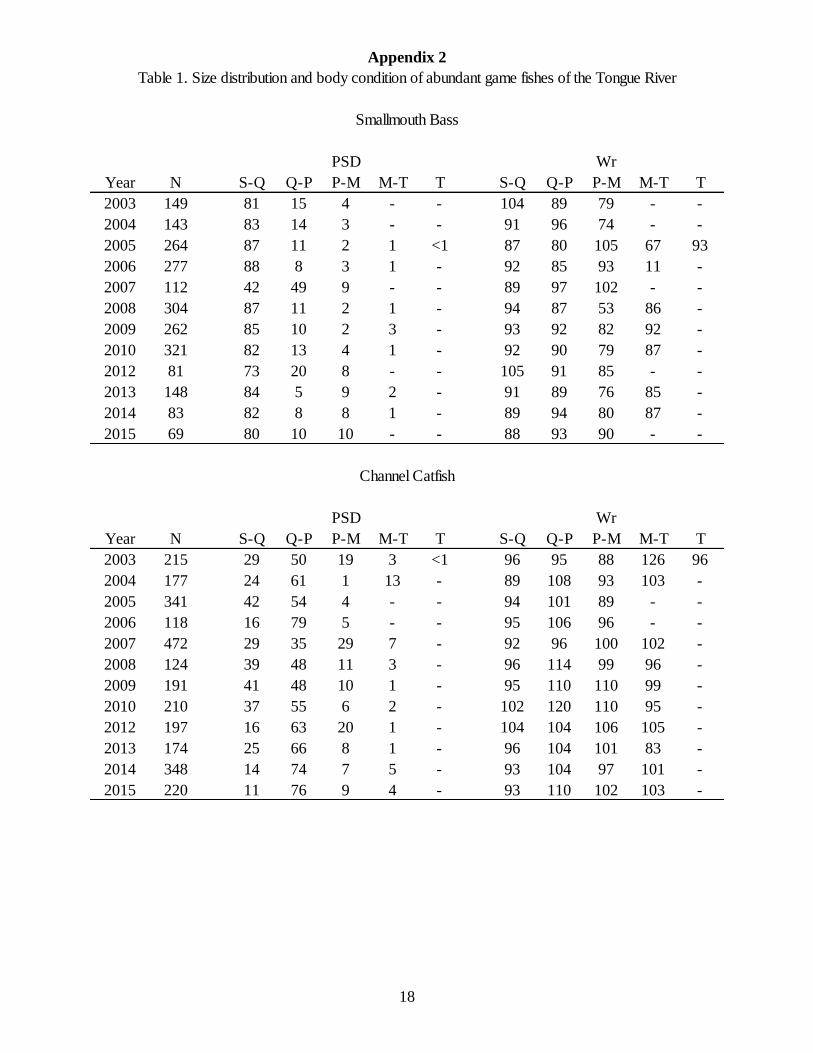
Size structure (PSD) and body condition (Wr) have been fairly consistent throughout the
study period (2003-2015) for most species. Trout, Sauger, and Walleye have
demonstrated the most variability among game fishes (Appendix 2 tables 2 and 3).
Smallmouth Bass and Channel Catfish have had consistent results with the size structure
of bass skewed towards small fish while Channel Catfish size structure has been more
evenly distributed across size classes (Appendix 2 table 1). Results of size structure and
body condition indexes have been less variable for non-game fishes (River Carpsucker,
Shorthead Redhorse Sucker, and White Sucker). Size structure is generally more evenly
distributed across size classes and relative weights are consistently high (Appendix 2
table 4). Sample size is likely a strong factor influencing variability of index results.
0
500
1000
1500
2000
2500
3000
0
5
10
15
20
25
30
35
40
2003 2004 2005 2006 2007 2008 2009 2010 2012 2013 2014 2015
Hatc
her
y s
tock
ed c
atc
hab
le R
ain
bow
Tro
ut
C/f
(fi
sh/h
r)
Year
Stocked Rainbow Trout
Brown Trout
Rainbow Trout
10
Fish passage
The Muggli Bypass was not sampled in 2015. Passage was evaluated from 2008 to 2012.
Twenty fish species have been documented using the Muggli Bypass since its
construction. Fish passage for most species was deemed successful based on similar
trends in abundances between the bypass channel and the river downstream of the bypass
(McKoy 2012). However, Shovelnose Sturgeon, which are found in the Tongue River
below T&Y Diversion Dam, have not been documented passing through the bypass. A
study to further evaluate passage at the Muggli Bypass specific to Shovelnose Sturgeon
led by Dennis Scarnecchia at the University of Idaho is proposed for 2016 if funding can
be secured. Alterations to the Muggli Bypass may be necessary to facilitate Shovelnose
Sturgeon passage.
DISCUSSION
Changes to Tongue River fish populations as a result of coal bed natural gas production
have not been documented but may exist as they are difficult to quantify. Coal bed
methane extraction is currently at a low level of development because of market prices.
Continued monitoring will be important to detect impacts to fisheries if activity expands
in the future. Low sample sizes of small bodied fishes preclude use for trend analysis.
Mini-fyke nets may be added to the sampling regime in the future to provide a more
robust sample design for small bodied fishes. Mini-fyke nets were efficient and effective
for detecting composition of the small bodied fish assemblage of the Yellowstone River
(Duncan et al. 2012), but have not been as efficient a tool in the Upper Missouri (Anne
Tews, pers. communication).
Results of this study must be viewed with some caution. The use of data combined from
all trend sections and the variation inherent to prairie stream sampling will make
detection of changes in fish populations difficult. Large sample sizes are needed to
overcome the inherent variation in field data. Continued and increased monitoring is
recommended because of the potential for further expansion of irrigation and mining
activity.
Despite the success of the Muggli Bypass, improvements are needed to increase its
effectiveness. Shovelnose Sturgeon is the only species observed in abundance below the
dam that has not been documented successfully navigating the bypass. The bypass was
designed specifically to pass Shovelnose Sturgeon. Water velocity and turbulence
between boulders in the lower third of the channel are hypothesized to prevent sturgeon
from using the constructed bypass channel. Water velocities in the lower third of the
bypass were rarely below 7 ft/s during periods of high flow. Recommended water
velocity for Shovelnose Sturgeon passage is between 3 and 4 ft/s (White and Medford
2002). The high-water velocities in the bypass can be attributed to a steeper than
designed gradient in the lower third of the constructed channel that compensates for a
flatter than designed slope in the upper third of the constructed channel. Spacing of the
boulders in the channel may also be a problem. Many of the boulders were placed with a
gap of 8 to 10 inches; attempting to offset the steeper slope of the channel. The narrow
gap may be a barrier to the passage of large fish. The recommended boulder spacing was
intended to be 24 inches (White and Medford 2002).
In 2008 & 2009, when river discharge exceeded 800 cfs attraction velocities of 2 ft/s
maintained from the bypass channel to the thalweg of the river were masked by turbulent

11
water flowing over T&Y Diversion Dam. During periods of high discharge fish may
have difficulty finding the bypass channel entrance due to this back-eddy effect. To
address velocity issues in the lower third of the bypass and the masking of attraction
flows the channel was re-sloped and moved downstream 1.5 channel widths in the fall of
2009. This modification reduced the magnitude of decreased attraction flows, but
sampling results indicates problems still exist, particularly water velocities in the lower
third of the channel. Increasing the spacing between boulders, using different boulder
placement patterns, and modifying the slope of the entire bypass channel to design
specifications should be explored.
Keywords: Fish Passage, T&Y Diversion Dam, Coal Bed Methane, Tongue
River Railroad, Tongue River Reservoir, Paddlefish, Shovelnose
Sturgeon, Blue Suckers, Sauger
Prepared by: Caleb Bollman
Date: November 13, 2015
12
LITERATURE CITED
Anderson, R. O., and R. M. Neumann. 1996. Length, weight, and associated structural
indices. Pages 477-482 in B.R. Murphy and D.W. Willis, editors. Fisheries
Techniques. Second Edition. American Fisheries Society, Bethesda, Maryland
USA.
Anderson, R. O., and A. S. Weithman. 1978. The concept of balance for coolwater fish
populations. Pages 371–381 in R. L. Kendall, editor. Selected Coolwater Fishes
of North America. American Fisheries Society, Special Publication 11, Bethesda,
Maryland.
Bister, T. J., D. W. Willis, M. L. Brown, S. M. Jordon, R. M. Neumann, M. C. Quist, and
C. S. Guy. 2000. Proposed standard weight (Ws) equations and standard length
categories for 18 warmwater nongame and riverine fish species. North American
Journal of Fisheries Management 20:570-574.
Blackwood, B. G., M. L. Brown, and D. W. Willis. 2002. Relative weight (Wr) status
and current use in fisheries assessment and management. Reviews in Fisheries
Science 8:1-44.
Brown, M. L., F. Jaramillo, Jr., D. M. Gatlin, III, and B. R. Murphy. 1995. A revised
standard weight (Ws) equation for channel catfish. Journal of Freshwater
Ecology 10:295-302.
Duncan, M.B., R.G. Bramblett, and A.V. Zale. 2012. Distribution, Habitats, and
Tributary Linkages of Small and Nongame Fishes in the Lower Yellowstone
River. Masters Thesis. Montana State University – Bozeman.
Elser, A. A., R.C. McFarland and D. Schwehr 1977. The effects of altered streamflow on
fish of the Yellowstone and Tongue Rivers, Montana. Yellowstone Impact Study.
Technical Report No. 8. Water Resources Division. MT Dept. of Natural
Resources and Conservation.
Fabrizio M. C., and R. A. Richards. 1996. Commericial fisheries surveys. Pages 625-
650 in B.R. Murphy and D.W. Willis, editors. Fisheries Techniques. Second
edition. American Fisheries Society, Bethesda, Maryland.
Gabelhouse, D. W. 1984. A length-categorization system to assess fish stocks. North
American Journal of Fisheries Management 4:273-285.
Guy, C. S., R. M. Neumann, and D. W. Willis. 2006. New terminology for proportional
stock density (PSD) and relative stock density (RSD): proportional size structure
(PSS). Fisheries 31:86-87.
Guy, C. S., R. M. Neumann, D. W. Willis, and R. O. Anderson. 2007. Proportional size
distribution (PSD): a further refinement of populations size structure index
terminology. Fisheries 32:348
Hubert, W. A. 1996. Passive Capture Techniques. Pages 157-181 in B. R. Murphy and
D. W. Willis, editors. Fisheries Techniques. Second edition. American Fisheries
Society, Bethesda, Maryland.
Kolander, T. D., D. W. Willis, and B. R. Murphy. 1993. Proposed revision of the
standard weight equation for smallmouth bass. North American Journal of
Fisheries Management 13:398-400.
McKoy, K. P. 2012. Tongue River Report. Southeastern Montana Warmwater
Investigation, F-78-R-3. Montana Department of Fish, Wildlife & Parks.
Helena, Montana.

13
Milewski, C. L., and M. L. Brown. 1994. Proposed standard weight equation and length
category standards for stream-dwelling brown trout. Journal of Freshwater
Ecology 9:111-116.
Murphy, B. R., M. L. Brown, and T. A. Springer. 1990. Evaluation of the relative
weight (Wr) index, with new applications to walleye. North American Journal of
Fisheries Management 10-85-97.
Ney, J. J. 1996. Practical use of biological statistics. Pages 167-192 in C. C. Kohler and
W. A. Hubert, editors. Inland Fisheries Management in North America. Second
Edition. American Fisheries Society, Bethesda, Maryland.
USGS (United States Geological Services) 2014. Water Resources, Real-Time Data for
Montana Report, United States Geological Services.
http://waterdata.usgs.gov/mt/nwis/current/?type=flow
Wege, G. J., and R. O. Anderson. 1978. Relative weight (Wr); a new index of condition
for largemouth bass. Pages 79-91 in G. D. Novinger and J. G. Dillard, editors.
New Approaches to the Management of Small Impoundments. American
Fisheries Society, Symposium 4, Bethesda, Maryland.
White, R.G., B. Mefford. 2002. Assessment of Behavior and Swimming Ability of
Yellowstone River Sturgeon for Design of Fish Passage Devices. Unpublished
Report. Joint Study by Montana State University in Bozeman, MT. and Bureau of
Reclamation Water Resources Research Laboratory in Denver, CO.

14
Appendix 1
Table 1. Summary of Tongue River sections and water quality, 2015.
1 2 3 4 5 6
Miles City Hirsch Brandenberg Birney TR Dam State Line
Date Sampled 6/29/2015 7/7/2015 7/6/2015 7/2/2015 6/26/2015 7/1/2015
Latitude Start 46.24965 46.04761 45.79204 45.29517 45.13826 44.99895
Longitude Start -105.75239 -105.93967 -106.2625 -106.55943 -106.76613 -106.88046
Latitude Stop 46.30922 46.07395 45.82378 45.32088 45.17137 45.01026
Longitude Stop -105.76711 -105.9238 -106.23109 -106.52174 -106.72897 -106.82236
River Mile Start/Stop 20-15 51-46 90-85 165-160 189-184 209-199
Water Temperature (Fahrenheit) 84.2 71.2 70.3 73.9 71.6 78.3
Specific Conductivity (mS/cm) 463 514 479.9 342 314.4 404.1
Salinity (ppt) 0.2 0.2 0.2 0.2 0.2 0.2
Turbidity (cm) 9.0 18.0 14.0 87.0 85.0 36.0
pH 8.3 8.1 8.0 8.7 8.9 8.5
River Flow (cfs) 903 514 591 529 956 614
Section Number and Name

15
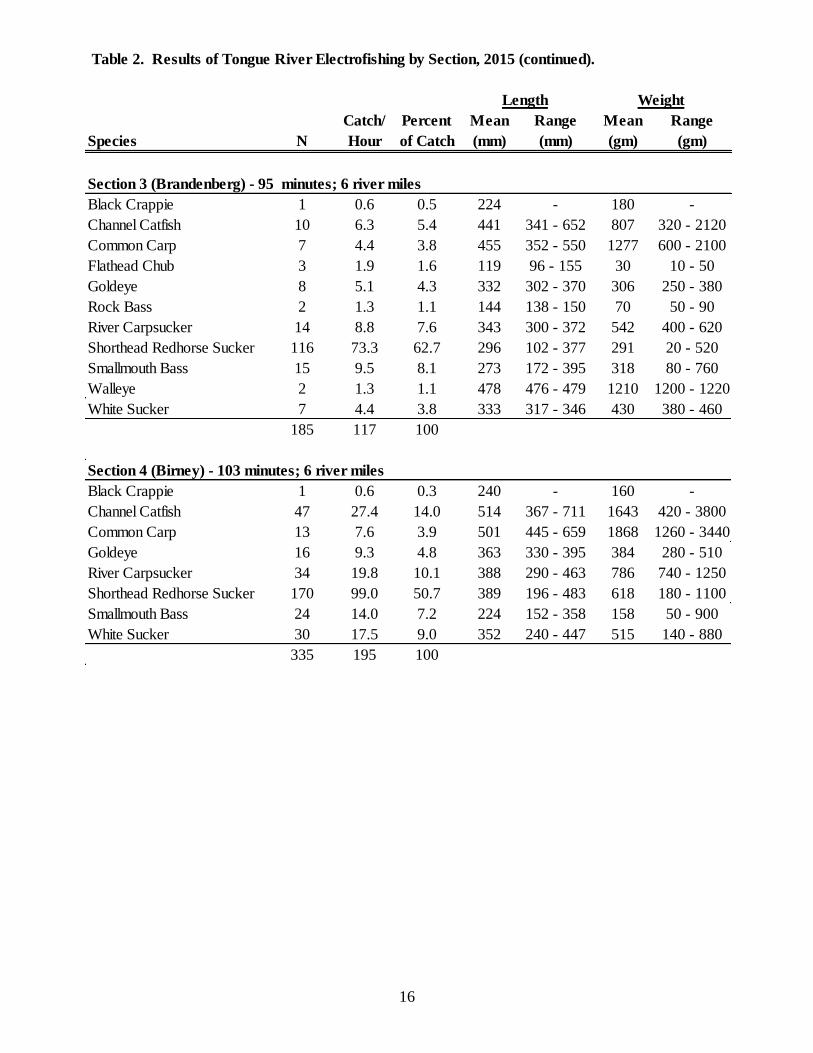
Table 2. Results of Tongue River electrofishing by section, 2015.
Catch/ Percent Mean Range Mean Range
Species N Hour of Catch (mm) (mm) (gm) (gm)
Section 1 Miles City (T&Y Dam - Yellowstone R.) - 115 minutes; 6 river miles
Channel Catfish 29 15.1 17.0 448 223 - 749 1077 70 - 4481
Common Carp 5 2.6 2.9 407 283 - 504 952 300 - 1560
Flathead Chub 17 8.9 9.9 142 94 - 194 34 10 - 80
Freshwater Drum 3 1.6 1.8 385 328 - 443 773 370 - 1160
Goldeye 24 12.5 14.0 318 235 - 376 247 150 - 370
River Carpsucker 58 30.3 33.9 389 262 - 534 750 190 - 2200
Shorthead Redhorse Sucker 28 14.6 16.4 279 167 - 416 246 40 - 660
Smallmouth Bass 3 1.6 1.8 215 103 - 304 173 20 - 340
Western Silvery Minnow 2 1.0 1.2 115 111 - 118 10 -
White Sucker 2 1.0 1.2 295 264 - 325 275 210 - 340
171 89 100
Section 2 (Hirsch) - 89 minutes; 5 river miles
Channel Catfish 2 1.3 1.5 292 178 - 405 245 40 - 450
Common Carp 9 6.1 6.6 459 388 - 515 1263 750 - 1890
Flathead Chub 6 4.0 4.4 145 91 - 169 32 30 - 40
Goldeye 7 4.7 5.1 328 311 - 356 254 210 - 310
River Carpsucker 7 4.7 5.1 311 226 - 353 387 180 - 540
Shorthead Redhorse Sucker 95 64.0 69.3 289 103 - 369 263 10 - 540
Smallmouth Buffalo 1 0.7 0.7 355 - 680 -
Smallmouth Bass 6 4.0 4.4 236 228 - 253 182 160 - 190
Walleye 1 0.7 0.7 449 - 970 -
White Sucker 3 2.0 2.2 310 264 - 353 377 240 - 510
137 92 100
Length Weight
16
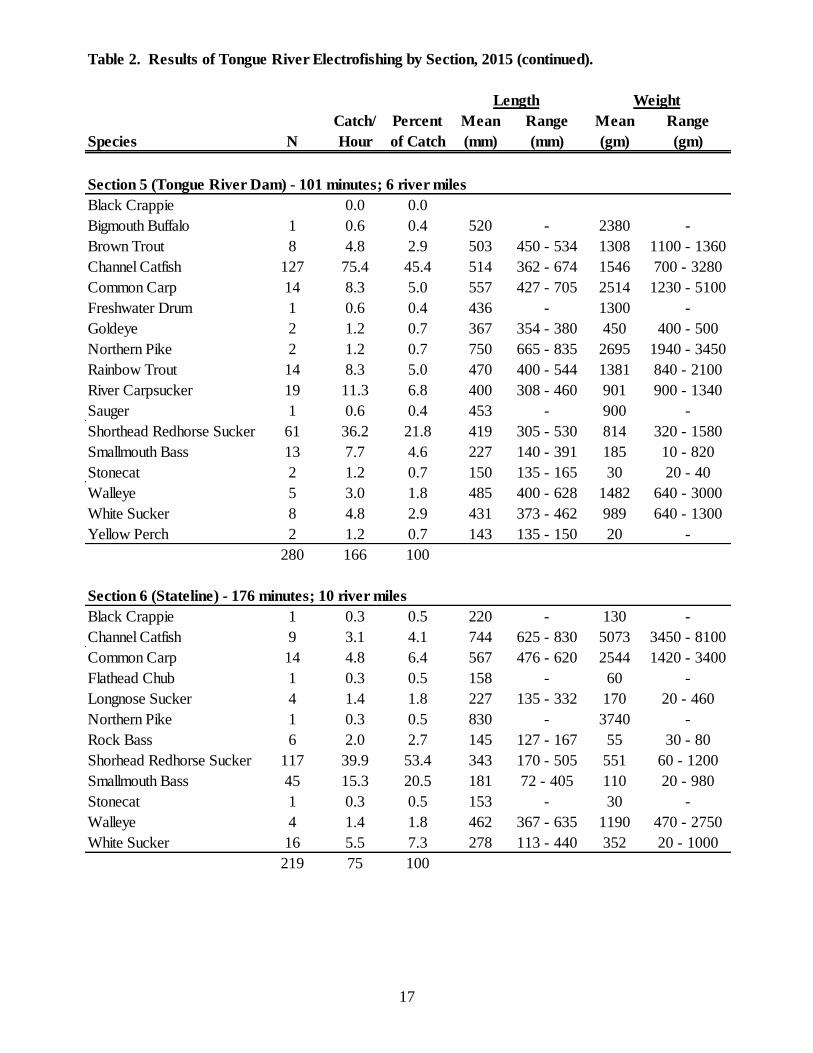
Table 2. Results of Tongue River Electrofishing by Section, 2015 (continued).
Catch/ Percent Mean Range Mean Range
Species N Hour of Catch (mm) (mm) (gm) (gm)
Section 3 (Brandenberg) - 95 minutes; 6 river miles
Black Crappie 1 0.6 0.5 224 - 180 -
Channel Catfish 10 6.3 5.4 441 341 - 652 807 320 - 2120
Common Carp 7 4.4 3.8 455 352 - 550 1277 600 - 2100
Flathead Chub 3 1.9 1.6 119 96 - 155 30 10 - 50
Goldeye 8 5.1 4.3 332 302 - 370 306 250 - 380
Rock Bass 2 1.3 1.1 144 138 - 150 70 50 - 90
River Carpsucker 14 8.8 7.6 343 300 - 372 542 400 - 620
Shorthead Redhorse Sucker 116 73.3 62.7 296 102 - 377 291 20 - 520
Smallmouth Bass 15 9.5 8.1 273 172 - 395 318 80 - 760
Walleye 2 1.3 1.1 478 476 - 479 1210 1200 - 1220
White Sucker 7 4.4 3.8 333 317 - 346 430 380 - 460
185 117 100
Section 4 (Birney) - 103 minutes; 6 river miles
Black Crappie 1 0.6 0.3 240 - 160 -
Channel Catfish 47 27.4 14.0 514 367 - 711 1643 420 - 3800
Common Carp 13 7.6 3.9 501 445 - 659 1868 1260 - 3440
Goldeye 16 9.3 4.8 363 330 - 395 384 280 - 510
River Carpsucker 34 19.8 10.1 388 290 - 463 786 740 - 1250
Shorthead Redhorse Sucker 170 99.0 50.7 389 196 - 483 618 180 - 1100
Smallmouth Bass 24 14.0 7.2 224 152 - 358 158 50 - 900
White Sucker 30 17.5 9.0 352 240 - 447 515 140 - 880
335 195 100
Length Weight
17
Table 2. Results of Tongue River Electrofishing by Section, 2015 (continued).
Catch/ Percent Mean Range Mean Range
Species N Hour of Catch (mm) (mm) (gm) (gm)
Section 5 (Tongue River Dam) - 101 minutes; 6 river miles
Black Crappie 0.0 0.0
Bigmouth Buffalo 1 0.6 0.4 520 - 2380 -
Brown Trout 8 4.8 2.9 503 450 - 534 1308 1100 - 1360
Channel Catfish 127 75.4 45.4 514 362 - 674 1546 700 - 3280
Common Carp 14 8.3 5.0 557 427 - 705 2514 1230 - 5100
Freshwater Drum 1 0.6 0.4 436 - 1300 -
Goldeye 2 1.2 0.7 367 354 - 380 450 400 - 500
Northern Pike 2 1.2 0.7 750 665 - 835 2695 1940 - 3450
Rainbow Trout 14 8.3 5.0 470 400 - 544 1381 840 - 2100
River Carpsucker 19 11.3 6.8 400 308 - 460 901 900 - 1340
Sauger 1 0.6 0.4 453 - 900 -
Shorthead Redhorse Sucker 61 36.2 21.8 419 305 - 530 814 320 - 1580
Smallmouth Bass 13 7.7 4.6 227 140 - 391 185 10 - 820
Stonecat 2 1.2 0.7 150 135 - 165 30 20 - 40
Walleye 5 3.0 1.8 485 400 - 628 1482 640 - 3000
White Sucker 8 4.8 2.9 431 373 - 462 989 640 - 1300
Yellow Perch 2 1.2 0.7 143 135 - 150 20 -
280 166 100
Section 6 (Stateline) - 176 minutes; 10 river miles
Black Crappie 1 0.3 0.5 220 - 130 -
Channel Catfish 9 3.1 4.1 744 625 - 830 5073 3450 - 8100
Common Carp 14 4.8 6.4 567 476 - 620 2544 1420 - 3400
Flathead Chub 1 0.3 0.5 158 - 60 -
Longnose Sucker 4 1.4 1.8 227 135 - 332 170 20 - 460
Northern Pike 1 0.3 0.5 830 - 3740 -
Rock Bass 6 2.0 2.7 145 127 - 167 55 30 - 80
Shorhead Redhorse Sucker 117 39.9 53.4 343 170 - 505 551 60 - 1200
Smallmouth Bass 45 15.3 20.5 181 72 - 405 110 20 - 980
Stonecat 1 0.3 0.5 153 - 30 -
Walleye 4 1.4 1.8 462 367 - 635 1190 470 - 2750
White Sucker 16 5.5 7.3 278 113 - 440 352 20 - 1000
219 75 100
Length Weight
18
Appendix 2
Year N S-Q Q-P P-M M-T T S-Q Q-P P-M M-T T
2003 149 81 15 4 - - 104 89 79 - -
2004 143 83 14 3 - - 91 96 74 - -
2005 264 87 11 2 1 <1 87 80 105 67 93
2006 277 88 8 3 1 - 92 85 93 11 -
2007 112 42 49 9 - - 89 97 102 - -
2008 304 87 11 2 1 - 94 87 53 86 -
2009 262 85 10 2 3 - 93 92 82 92 -
2010 321 82 13 4 1 - 92 90 79 87 -
2012 81 73 20 8 - - 105 91 85 - -
2013 148 84 5 9 2 - 91 89 76 85 -
2014 83 82 8 8 1 - 89 94 80 87 -
2015 69 80 10 10 - - 88 93 90 - -
Year N S-Q Q-P P-M M-T T S-Q Q-P P-M M-T T
2003 215 29 50 19 3 <1 96 95 88 126 96
2004 177 24 61 1 13 - 89 108 93 103 -
2005 341 42 54 4 - - 94 101 89 - -
2006 118 16 79 5 - - 95 106 96 - -
2007 472 29 35 29 7 - 92 96 100 102 -
2008 124 39 48 11 3 - 96 114 99 96 -
2009 191 41 48 10 1 - 95 110 110 99 -
2010 210 37 55 6 2 - 102 120 110 95 -
2012 197 16 63 20 1 - 104 104 106 105 -
2013 174 25 66 8 1 - 96 104 101 83 -
2014 348 14 74 7 5 - 93 104 97 101 -
2015 220 11 76 9 4 - 93 110 102 103 -
PSD Wr
Smallmouth Bass
Channel Catfish
PSD Wr
Table 1. Size distribution and body condition of abundant game fishes of the Tongue River
19
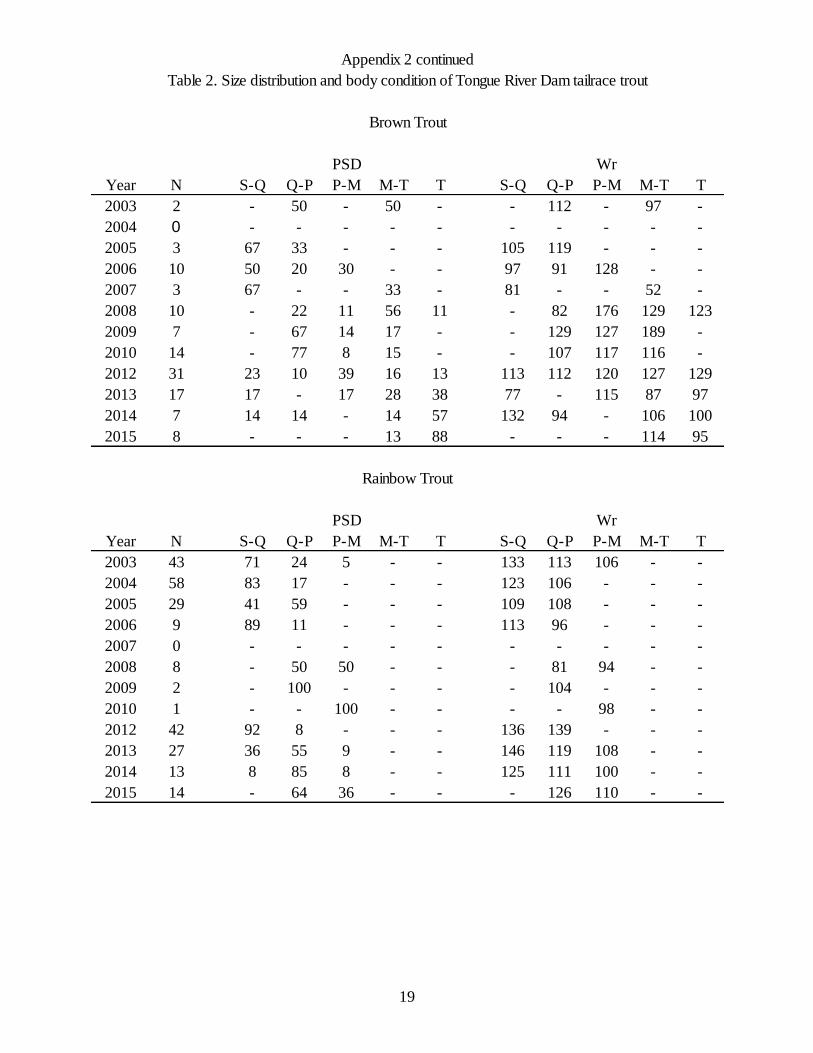
Year N S-Q Q-P P-M M-T T S-Q Q-P P-M M-T T
2003 2 - 50 - 50 - - 112 - 97 -
2004 0 - - - - - - - - - -
2005 3 67 33 - - - 105 119 - - -
2006 10 50 20 30 - - 97 91 128 - -
2007 3 67 - - 33 - 81 - - 52 -
2008 10 - 22 11 56 11 - 82 176 129 123
2009 7 - 67 14 17 - - 129 127 189 -
2010 14 - 77 8 15 - - 107 117 116 -
2012 31 23 10 39 16 13 113 112 120 127 129
2013 17 17 - 17 28 38 77 - 115 87 97
2014 7 14 14 - 14 57 132 94 - 106 100
2015 8 - - - 13 88 - - - 114 95
Year N S-Q Q-P P-M M-T T S-Q Q-P P-M M-T T
2003 43 71 24 5 - - 133 113 106 - -
2004 58 83 17 - - - 123 106 - - -
2005 29 41 59 - - - 109 108 - - -
2006 9 89 11 - - - 113 96 - - -
2007 0 - - - - - - - - - -
2008 8 - 50 50 - - - 81 94 - -
2009 2 - 100 - - - - 104 - - -
2010 1 - - 100 - - - - 98 - -
2012 42 92 8 - - - 136 139 - - -
2013 27 36 55 9 - - 146 119 108 - -
2014 13 8 85 8 - - 125 111 100 - -
2015 14 - 64 36 - - - 126 110 - -
PSD Wr
PSD Wr
Brown Trout
Rainbow Trout
Appendix 2 continued
Table 2. Size distribution and body condition of Tongue River Dam tailrace trout

20
Year N S-Q Q-P P-M M-T T S-Q Q-P P-M M-T T
2003 5 20 40 40 - - 97 88 91 - -
2004 8 13 - 38 50 - 46 - 86 101 -
2005 9 13 50 25 13 - 63 82 79 67 -
2006 8 - 25 75 - - - 83 88 - -
2007 58 29 43 26 2 - 84 86 83 98 -
2008 2 - - 100 - - - - 99 - -
2009 8 - 29 57 14 - - 71 86 94 -
2010 4 - 50 50 - - - 87 90 - -
2012 8 80 - - - 20 96 - - - 128
2013 18 12 88 - - - 87 88 - - -
2014 5 - 20 60 20 - - 56 86 92 -
2015 1 - - 100 - - - - 96 - -
Year N S-Q Q-P P-M M-T T S-Q Q-P P-M M-T T
2003 4 - 50 25 25 - - 99 112 100 -
2004 1 - - - - - - - - - -
2005 7 17 50 33 - - 82 85 91 - -
2006 1 - - - - - - - - - -
2007 55 15 67 17 - - 92 91 96 - -
2008 8 43 29 14 14 - 87 148 94 80 -
2009 7 83 17 - - - 91 88 - - -
2010 5 33 67 - - - 84 98 - - -
2012 23 33 40 20 7 - 93 97 94 100 -
2013 15 87 13 - - - 92 101 - - -
2014 30 23 40 30 7 - 86 90 95 90 -
2015 12 8 67 17 8 - 93 109 104 95 -
PSD Wr
Sauger
Walleye
PSD Wr
Appendix 2 continued
Table 3. Size distribution and body condition of Sauger and Walleye of the Tongue River
21
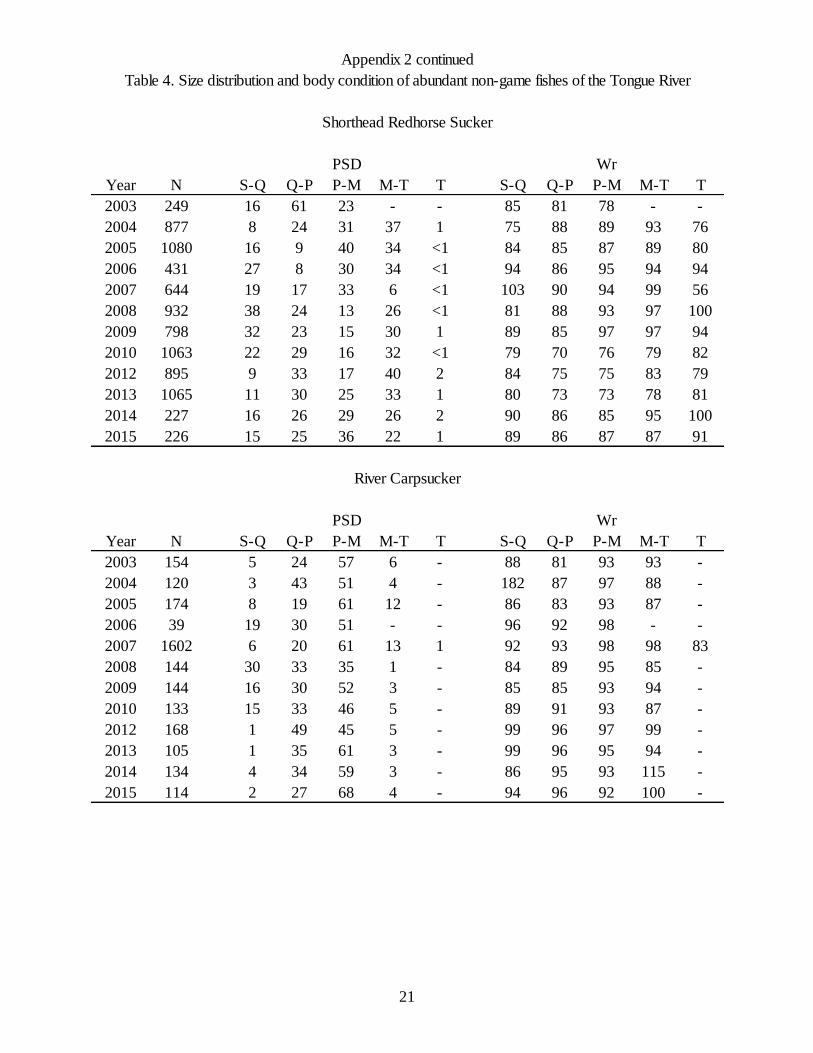
Year N S-Q Q-P P-M M-T T S-Q Q-P P-M M-T T
2003 249 16 61 23 - - 85 81 78 - -
2004 877 8 24 31 37 1 75 88 89 93 76
2005 1080 16 9 40 34 <1 84 85 87 89 80
2006 431 27 8 30 34 <1 94 86 95 94 94
2007 644 19 17 33 6 <1 103 90 94 99 56
2008 932 38 24 13 26 <1 81 88 93 97 100
2009 798 32 23 15 30 1 89 85 97 97 94
2010 1063 22 29 16 32 <1 79 70 76 79 82
2012 895 9 33 17 40 2 84 75 75 83 79
2013 1065 11 30 25 33 1 80 73 73 78 81
2014 227 16 26 29 26 2 90 86 85 95 100
2015 226 15 25 36 22 1 89 86 87 87 91
Year N S-Q Q-P P-M M-T T S-Q Q-P P-M M-T T
2003 154 5 24 57 6 - 88 81 93 93 -
2004 120 3 43 51 4 - 182 87 97 88 -
2005 174 8 19 61 12 - 86 83 93 87 -
2006 39 19 30 51 - - 96 92 98 - -
2007 1602 6 20 61 13 1 92 93 98 98 83
2008 144 30 33 35 1 - 84 89 95 85 -
2009 144 16 30 52 3 - 85 85 93 94 -
2010 133 15 33 46 5 - 89 91 93 87 -
2012 168 1 49 45 5 - 99 96 97 99 -
2013 105 1 35 61 3 - 99 96 95 94 -
2014 134 4 34 59 3 - 86 95 93 115 -
2015 114 2 27 68 4 - 94 96 92 100 -
PSD Wr
PSD Wr
Shorthead Redhorse Sucker
River Carpsucker
Appendix 2 continued
Table 4. Size distribution and body condition of abundant non-game fishes of the Tongue River

22
Year N S-Q Q-P P-M M-T T S-Q Q-P P-M M-T T
2003 258 39 35 23 3 - 94 89 98 84 -
2004 354 37 12 36 14 - 99 97 99 103 -
2005 127 26 12 38 25 - 84 84 96 97 -
2006 127 46 34 20 - - 87 102 99 - -
2007 231 38 47 13 6 - 98 88 85 91 -
2008 243 25 31 26 17 1 94 93 99 101 27
2009 253 21 29 30 22 - 109 87 97 102 -
2010 414 19 31 35 15 - 89 90 95 97 -
2012 361 18 31 27 25 - 100 97 97 100 -
2013 401 15 25 40 20 - 91 92 92 93 -
2014 137 12 22 42 25 - 84 91 97 98 -
2015 63 8 24 56 13 - 83 93 94 95 -
PSD Wr
White Sucker
Appendix 2 continued
Table 4 continued. Size distribution and body condition of abundant non-game fishes of the Tongue River
23
Appendix 3
Tongue River Fish Entrainment Study
On the T&Y Canal
1997, 2004, 2005, 2013
By
K. McKoy, K. M. Backes, V. Riggs, and D. Peters
Montana Fish, Wildlife and Parks
Region 7 - Miles City
ABSTRACT
The point of diversion for the T&Y Canal is located at river mile 20.4 on the Tongue
River. Nets were placed in the irrigation ditch spanning the entire channel in 1997, 2004, 2005
and 2013 to determine fish entrainment. In 1998/1999, the headworks structure of the T&Y
Canal was rehabilitated and louver style fish screens and a bypass channel which returned fish to
the Tongue River were added. The louvered fish screens and bypass channel return fish back to
the Tongue River that would otherwise be lost to the system down the irrigation ditch. In 2004,
2005 and 2013, after installation of the fish louvre, an additional net was placed in the bypass
channel to evaluate entrained fish that were screened out and returned to the river. All fish
sampled were identified to species, weighed in grams, and measured in millimeters total length.

24
In 1997 flathead chubs were the most abundant species at 32% of total catch, common carp were
the most abundant species in 2004 and 2005 in both the T&Y Canal and Bypass Channel at 47%
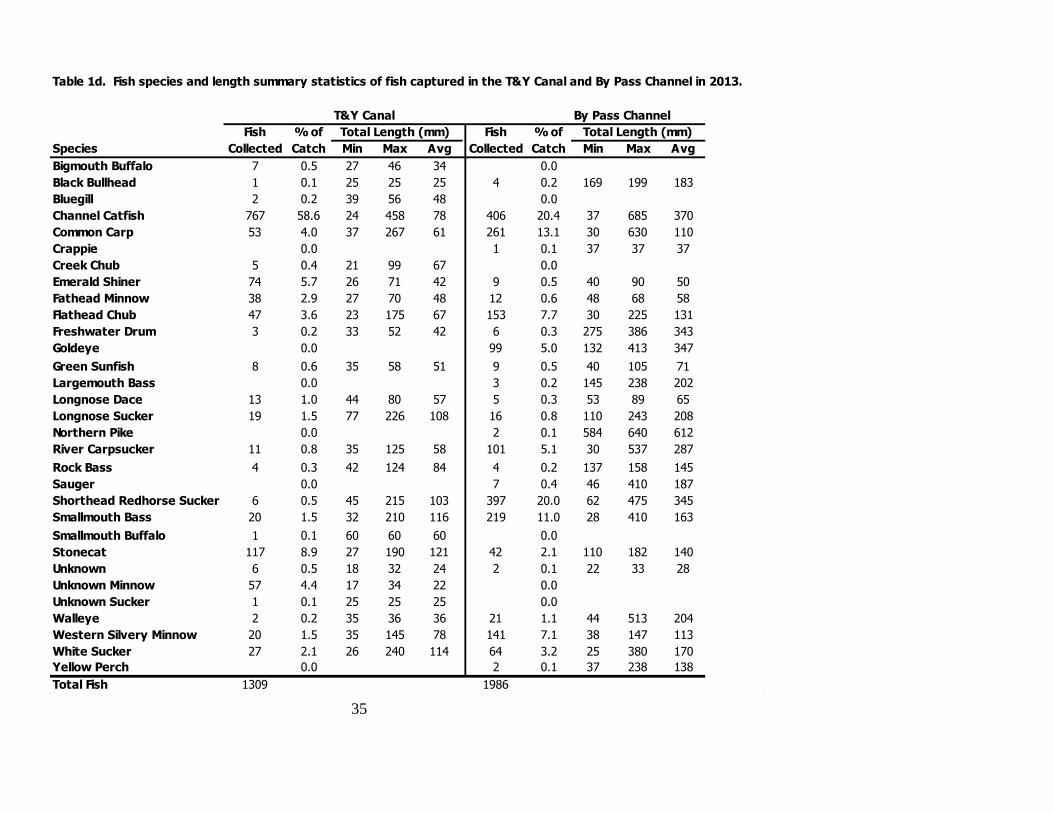
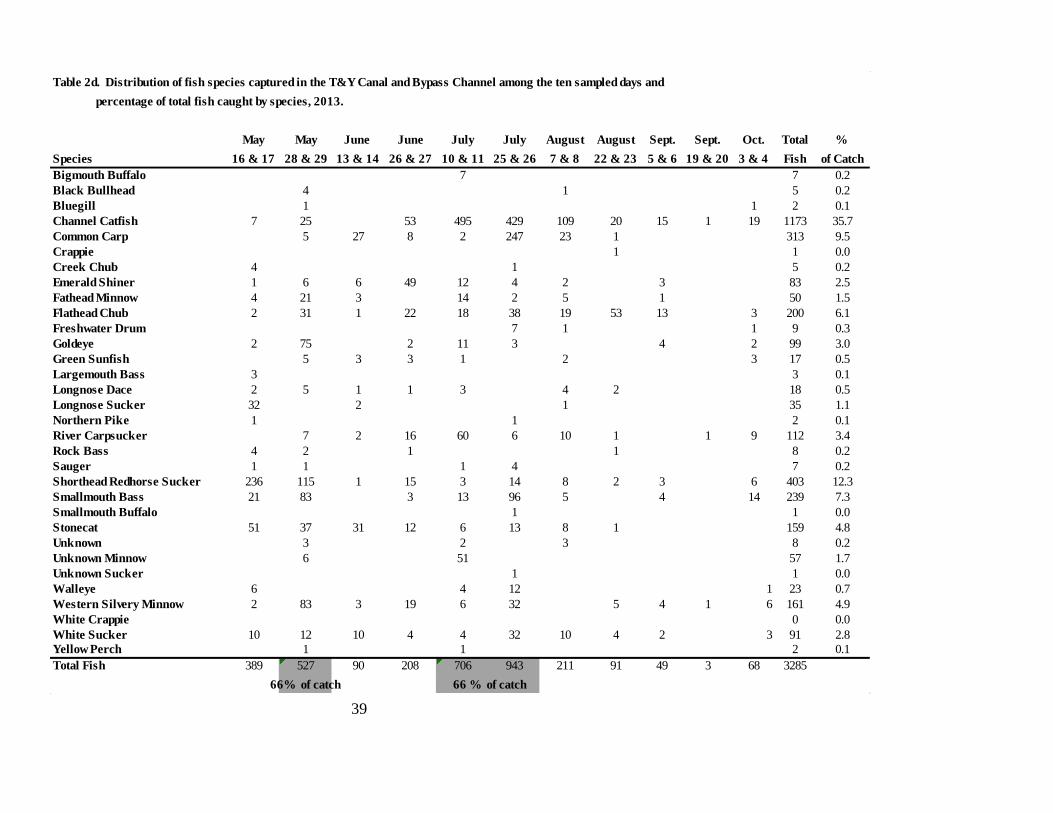
and 32% in 2004 and 36% and 33% in 2005. In 2013 channel catfish were the most abundant
species in the canal at 59%, but in the bypass both channel catfish and shorthead redhorse
suckers each accounted for 20% of the total catch.
INTRODUCTION
In 1998/1999, the headworks structure of the T&Y Canal was rehabilitated and louver
style fish screens and a bypass channel which returned fish to the Tongue River were added
(Bureau of Reclamation 2002). The T&Y rehabilitation project was completed with the
cooperation of the T&Y Irrigation District, Bureau of Reclamation, and Montana Fish, Wildlife
& Parks. T&Y Diversion Dam is located at river mile 20.4 on the Tongue River and has been an
upstream fish passage barrier to shovelnose sturgeon, goldeye, sauger, and other fish species
since it was constructed in 1886. Construction of the Muggli Fish Passage in 2007 has provided
passage around the diversion dam for most of the species in the fish assemblage. The Muggli
Fish Passage, along with the removal of other irrigation diversion dams has opened passage all
the way to Tongue River Reservoir Dam.
The Tongue and Powder Rivers are two of the largest tributaries entering the lower 240
miles of the Yellowstone River system. The Yellowstone River supports a diverse assemblage
of native and non-native warm and cool-water fish species. Some of the species are threatened or
endangered and others are state species of special concern. Tributary streams play a vital role
for spawning, rearing, and migration of the species within the Lower Yellowstone fish
assemblage.
The Yellowstone River and tributary streams also provide irrigation water to agricultural
enterprises throughout the basin. The highly migratory nature of many of the native fish species
and their ability to navigate through or around irrigation inlet structures was not well understood
in the past. However a growing body of information is beginning to identify substantial
problems related to fish migration and entrainment associated with some water diversion
designs. Changes to the T&Y headworks structure and diversion dam were made in an effort to
reduce entrainment and improve fish passage while maintaining water supply for irrigation of
agricultural lands.
In 1997 objectives for the entrainment study were to identify: 1) composition of fish and
debris entrained into the T&Y Canal, 2) seasonal trends in entrainment, and 3) diurnal trends in
entrainment. The objectives of the sampling effort in 2004, 2005 and 2013 were to identify: 1)
composition of fish entrained into the T&Y Canal and fish returned to the Tongue River by the
bypass channel, 2) seasonal trends in entrainment, and 3) diurnal trends in entrainment.
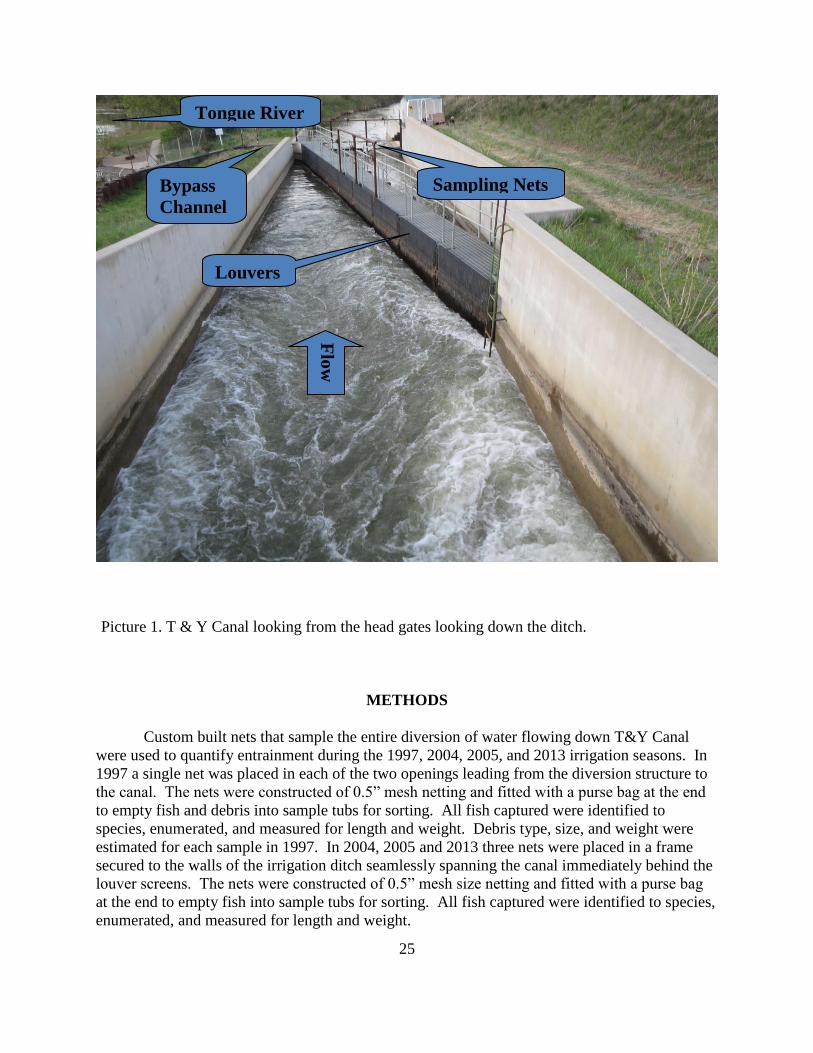
25
Picture 1. T & Y Canal looking from the head gates looking down the ditch.
METHODS
Custom built nets that sample the entire diversion of water flowing down T&Y Canal
were used to quantify entrainment during the 1997, 2004, 2005, and 2013 irrigation seasons. In
1997 a single net was placed in each of the two openings leading from the diversion structure to
the canal. The nets were constructed of 0.5” mesh netting and fitted with a purse bag at the end
to empty fish and debris into sample tubs for sorting. All fish captured were identified to
species, enumerated, and measured for length and weight. Debris type, size, and weight were
estimated for each sample in 1997. In 2004, 2005 and 2013 three nets were placed in a frame
secured to the walls of the irrigation ditch seamlessly spanning the canal immediately behind the
louver screens. The nets were constructed of 0.5” mesh size netting and fitted with a purse bag
at the end to empty fish into sample tubs for sorting. All fish captured were identified to species,
enumerated, and measured for length and weight.
Louvers
Bypass
Channel
Sampling Nets
Flo
w
Tongue River
26
Canal sampling was conducted bi-weekly throughout the irrigation season. The irrigation
season varied between years, starting as early as May 16 and ending as late as October 10. In
general irrigation went from mid May through late September/early October. In 1997 each day
was sub-sampled by two hour periods through a complete 24 hour cycle. Additional sub-
sampling was required of each two hour period due to large quantities of debris that collected in
the nets. Sample periods within each two hour subsample ranged from 4 to 75 minutes
depending upon relative debris quantities moving into the net during the different sample
periods. In 2004, 2005 and 2013 each day was sub-sampled by one hour periods through a
complete 24 hour cycle. Total number of fish and quantity of debris was calculated by
extrapolating the subsample results to the total period length using the appropriate expansion
factor.
RESULTS & DISCUSSION
Fish Species Composition
1997
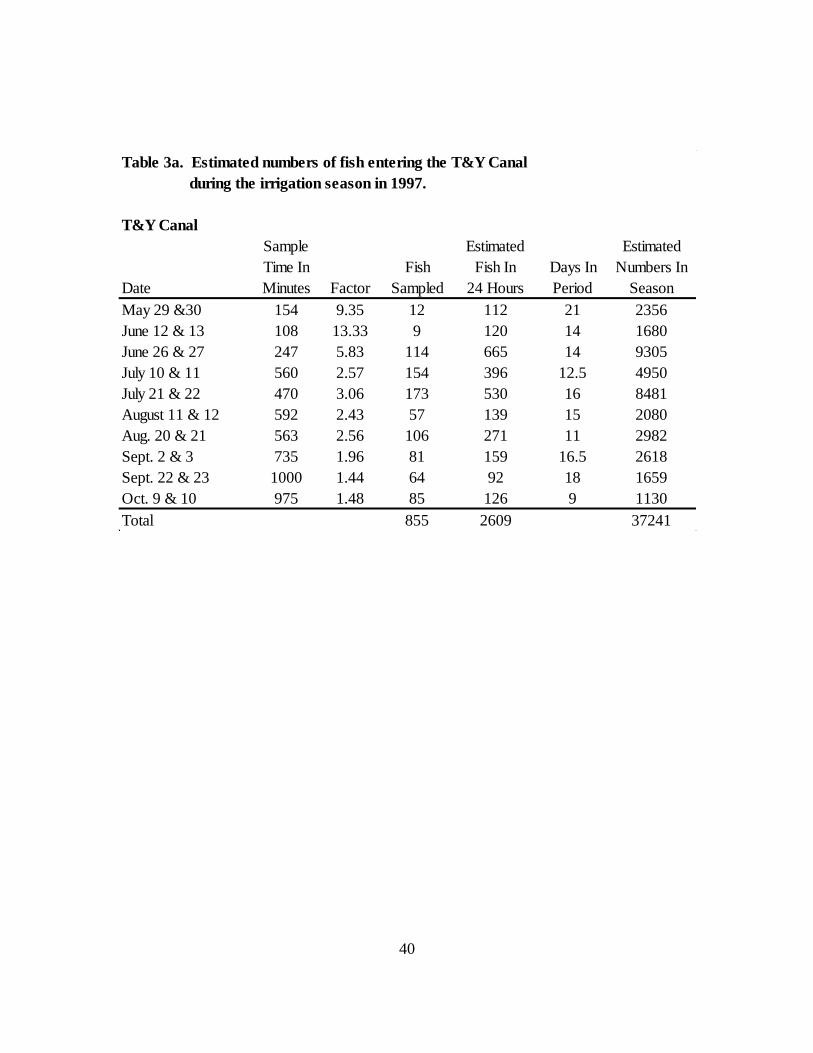
An estimated 37,288 fish weighing 1,847 lbs. were entrained in the T&Y Canal during
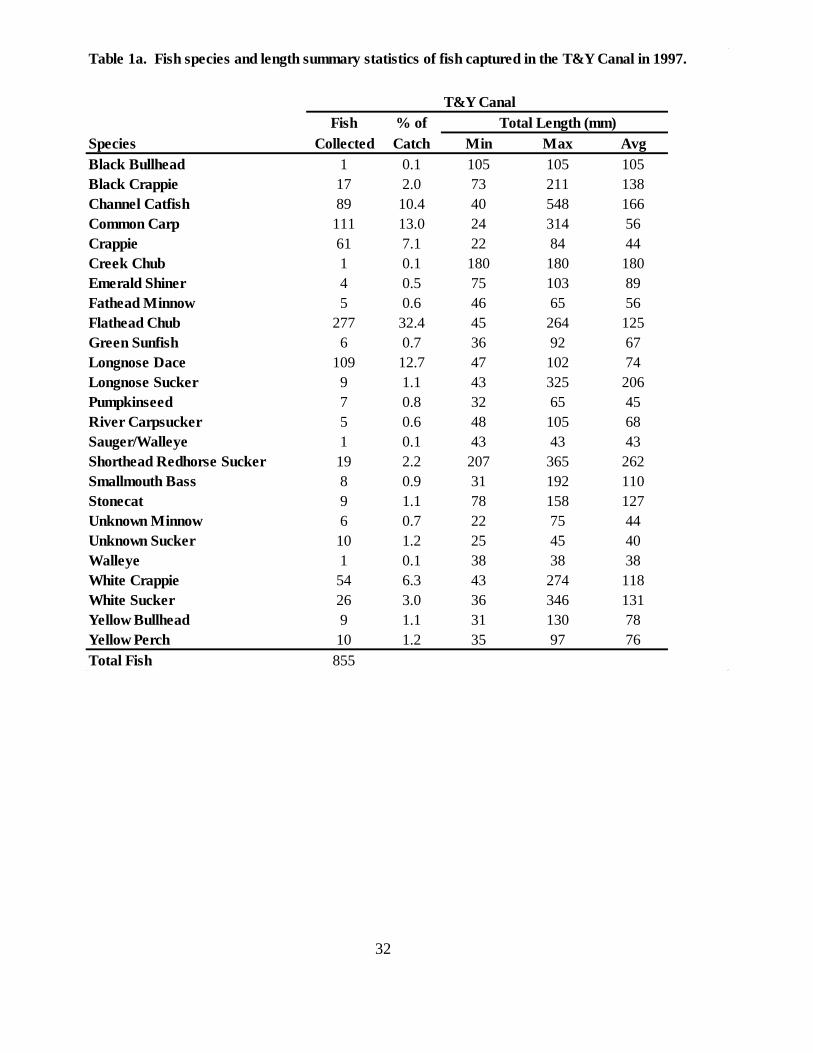
the 1997 irrigation season (Table 3a). Fish from 22 species were observed being entrained in
1997. Non-cyprinid species captured were generally juvenile fish evident by the short mean
length noted in Table 1a. Flathead chubs were the most abundant species entrained accounting
for 32% of the total number of fish observed (Figure 2a). Other abundant species observed being
entrained included: common carp (13%), longnose dace (13%), crappie (15%), and channel
catfish (10%).
Prior to 1997, the nearest sampling to the T&Y Canal was 70 miles upstream of the canal
(T & Y Canal 1998, Peters et al.). In the fall of 1993, three sections of the Tongue River near
Ashland were sampled using electrofishing gear. Twelve trips down the 5.5 mile long section
were completed and resulted in the catch of 1,725 fish (Table 4). The species of fish observed in
electrofishing samples in 1993 were similar to those entrained in the T&Y Canal in 1997 but the
species that comprised the largest proportion of electrofishing samples in 1993 (Backes et al.
1993) differed from those entrained in the T&Y Canal in 1997. Flathead chubs, longnose dace,
channel catfish, and crappie seem to be entrained in the canal in numbers disproportionate to
their abundance in electrofishing samples upstream.
The sampling efficiency for most of the species with electrofishing is unknown, so inferences
about population size for all species could not be made. Recapture information on smallmouth
bass and channel catfish yielded an approximate sampling efficiency of 10%, similar to the 14%
+-5% Yeager found electrofishing for sauger in the Yellowstone River (Rhoten et al. 2010).
Assuming a 10% average capture efficiency for all species in the sample results in an estimated
17,250 fish for this 5.5 mile section of river. The 37,288 fish estimated to be entrained during
the 1997 irrigation season is roughly twice that of the estimated population of fish found in the
5.5 mile segment of the Tongue River sampled by Backes in 1993. This limited amount of
Tongue River reference work suggests the number of fish annually entrained in the T&Y Canal
could represent a substantial component of the population of Tongue River fish upstream of the
diversion.
27
During sampling in 1997 debris that collected in the nets was sorted and quantified. Four
classes of debris were identified including: gravel, sticks, coal, and vegetation. The calculated
weight of gravel, coal and sticks collected in the sample nets appears to be positively correlated
to stream discharge (Table 7 and Figure 3). The weight of vegetation debris in the canal did not
appear to be related to stream discharge.
The collection net on the west side of the canal captured 8 to 80 times more gravel than
the net on the east side of the canal which may be valuable in understanding the existing
hydraulics acting at this site.
Estimated gravel entry into the canal was highest during our June 12-13 sample period
when an estimated 13,534 lbs per day (24 hrs) entered the canal. We felt the origin of gravel
entering the canal was from upstream headcutting of the gravel bar located immediately
upstream of the diversion during the non-irrigation season. Modifications planned to the
diversion structure need to address this non-irrigation season gravel bar development. Channel
hydraulics changed by the opening and closing of the head gate may be a significant source of
canal gravel and other debris accumulations. If solutions to both debris accumulation and fish
entrainment could be addressed simultaneously the acceptance of fish friendly designs by the
agricultural community may be greatly enhanced.
2004
An estimated 26,376 fish were entrained in the T&Y Canal during the 2004 irrigation
season (Table 3b). Fish from 14 species were observed being entrained in 2004. Common carp
were the most abundant species entrained comprising 47% of the total catch (Figure 2b). Other
abundant species entrained in 2004 included: flathead chub, channel catfish, and various
suckers.
An estimated 13,424 fish were returned to the Tongue River by the bypass channel
during the 2004 irrigation season (Table 3b). Fish from 17 species were observed being returned
to the Tongue River by the bypass channel in 2004. Common carp were the most abundant
species returned comprising 32% of the total catch (Figure 2c). Other abundant species returned
by the bypass channel in 2004 included: channel catfish, flathead chub and various suckers
(Table 1b). Fish being returned to the river by the bypass channel were generally longer than
fish entrained in the canal. This was expected because louvers will approach 100 percent
exclusion efficiency with larger, stronger swimming fish (T&Y canal report 1998). However,
efficiencies will decline for smaller, weaker swimming fish (T&Y canal report 1998). An
exception to this occurs when small sample sizes do not accurately represent the actual size
distribution of fish observed (Table 1b).
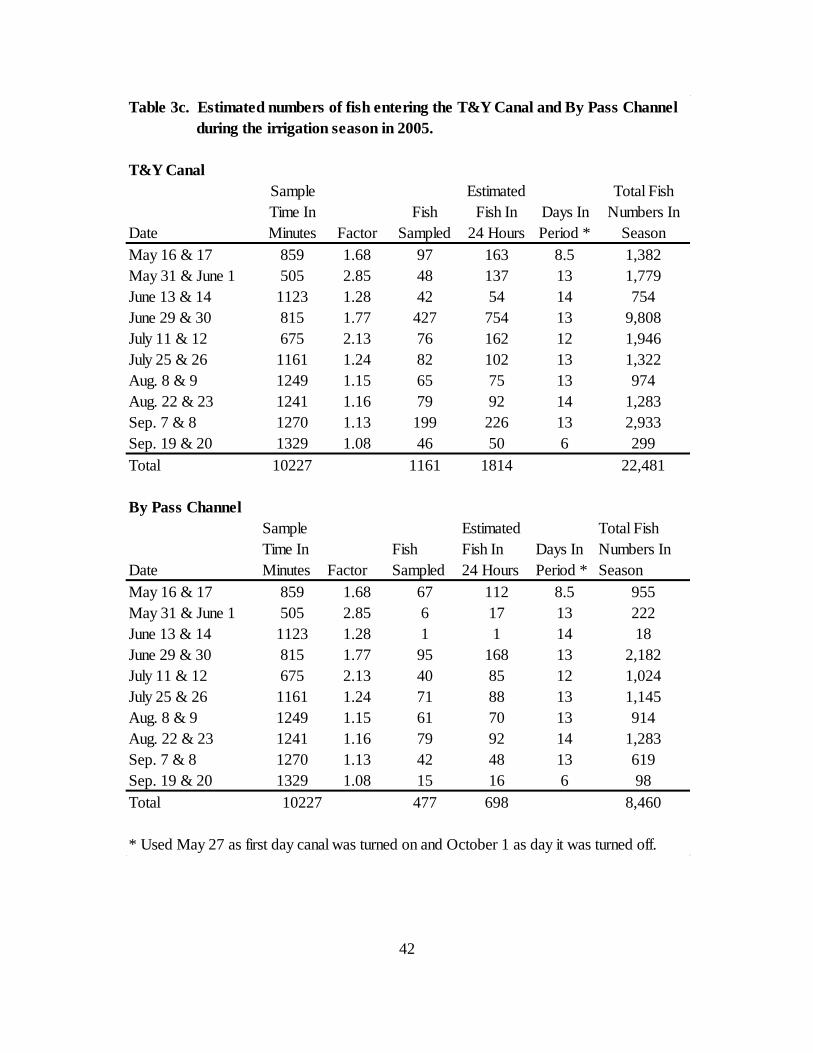
2005
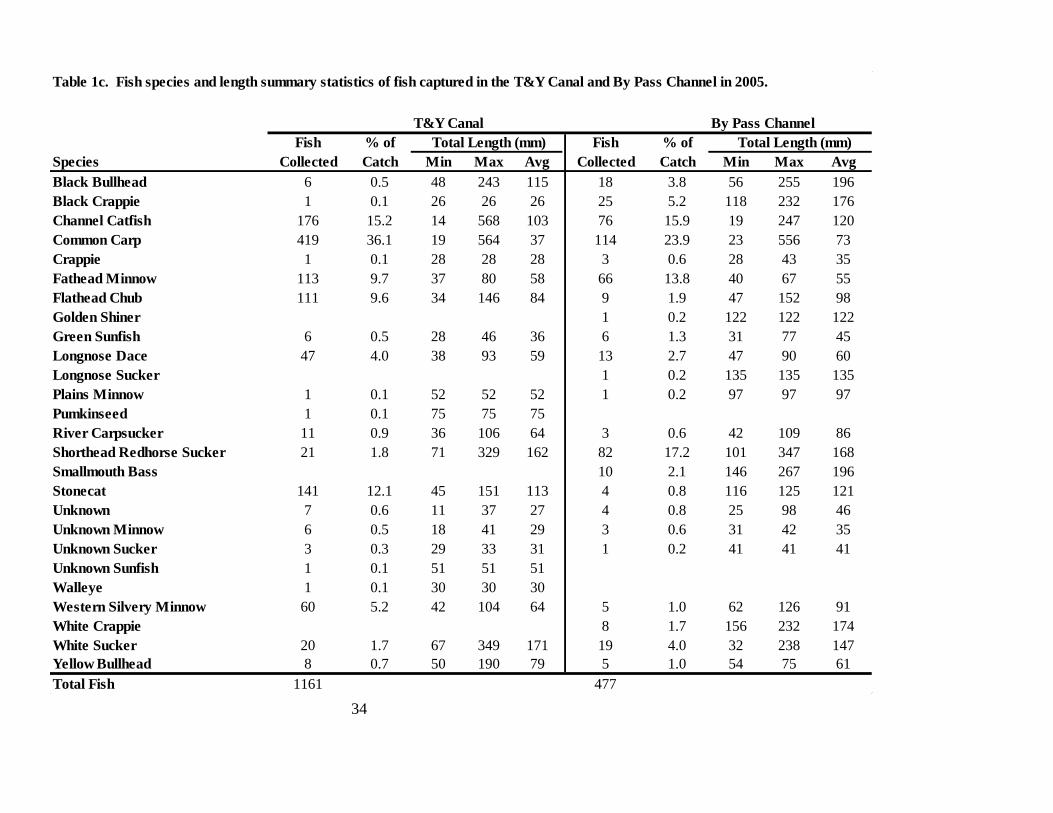
An estimated 22,481 fish were entrained into the T&Y Canal during the 2005 irrigation
season (Table 3c). Fish from 17 species were observed being entrained in 2005. Common carp
were the most abundant species entrained comprising 36% of total catch (Figure 2d). Other
abundant species entrained in 2005 included: channel catfish, stonecat and flathead chubs.
An estimated 8,460 fish were returned to the Tongue River by the bypass channel during
the 2005 irrigation season (Table 3c). Fish from 19 species were observed being returned to the
Tongue River by the bypass channel in 2004. Common carp were the most abundant species
returned comprising 33% of the total catch (Figure 2e). Other abundant species returned in 2005
28
included: shorthead redhorse suckers, channel catfish and fathead minnows (Table 1c). Similar
to 2004, fish being returned to the river by the bypass channel in 2005 were generally longer than
fish entrained in the canal. White suckers were one species that were on average smaller in the
bypass channel than in the canal.
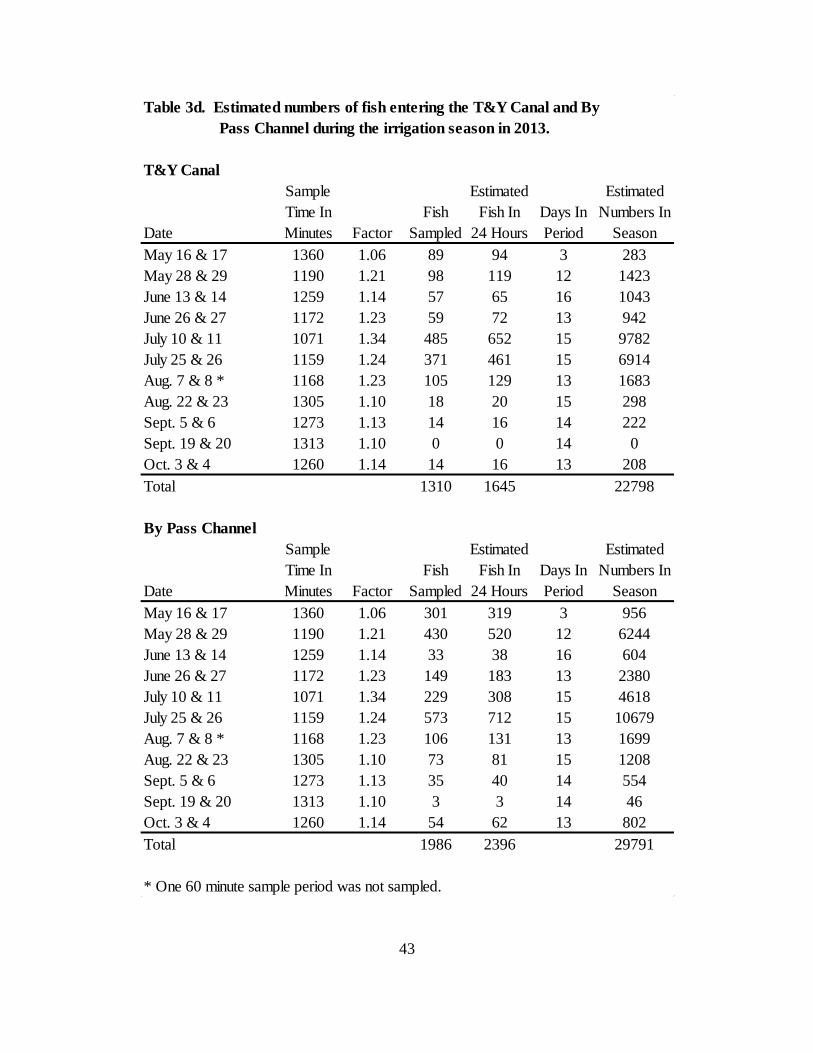
2013
An estimated 22,798 fish were entrained into the T&Y Canal during the 2013 irrigation
season (Table 3d). Fish from 22 species were observed being entrained in 2013. Channel catfish
were the most abundant species entrained comprising 59% of total catch (Figure 2f). Other
abundant species entrained in 2013 included stonecat and various minnows.
An estimated 29,791 fish were returned to the Tongue River by the bypass channel
during the 2013 irrigation season (Table 3d). Fish from 24 species were observed being
returned to the Tongue River by the bypass channel in 2013. Channel catfish and shorthead
redhorse suckers were the most abundant species returned comprising 20% each of the total
catch (Figure 2g). Other abundant species returned in 2013 included common carp and
smallmouth bass. The catch from 2013 included seven different species which had not been
previously sampled: bigmouth buffalo, bluegill, freshwater drum, goldeye, largemouth bass,
northern pike, and smallmouth buffalo. All of the species listed above, except largemouth bass,
have been documented using the Muggli Fish Passage.
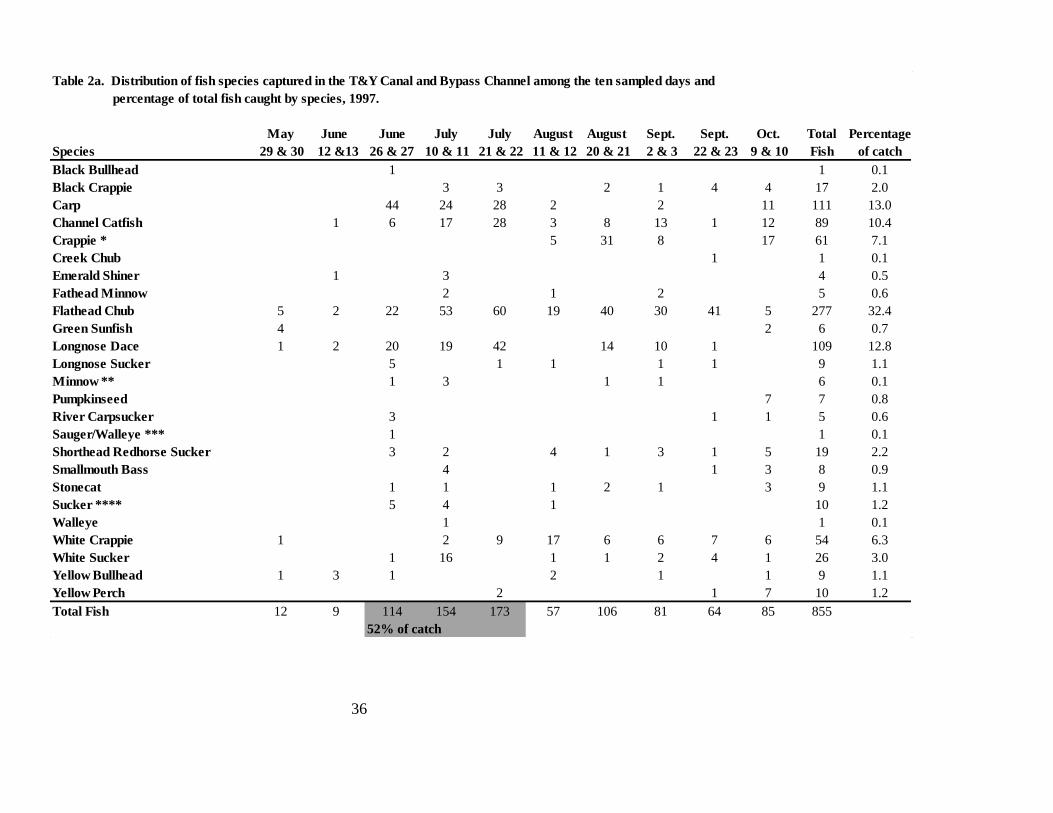
Seasonal Trends in Entrainment
In 1997 of the total number of fish entrained in T&Y Canal 52 percent were entrained
between June 26 and July 22 (Figure 1a). Flathead chub, common carp, longnose dace, channel
catfish, white sucker and black crappie were the most abundant species entrained in the canal
during this two month peak entrainment period (Table 2a). These species account for 88% of the
total number of fish entrained during the peak movement period.
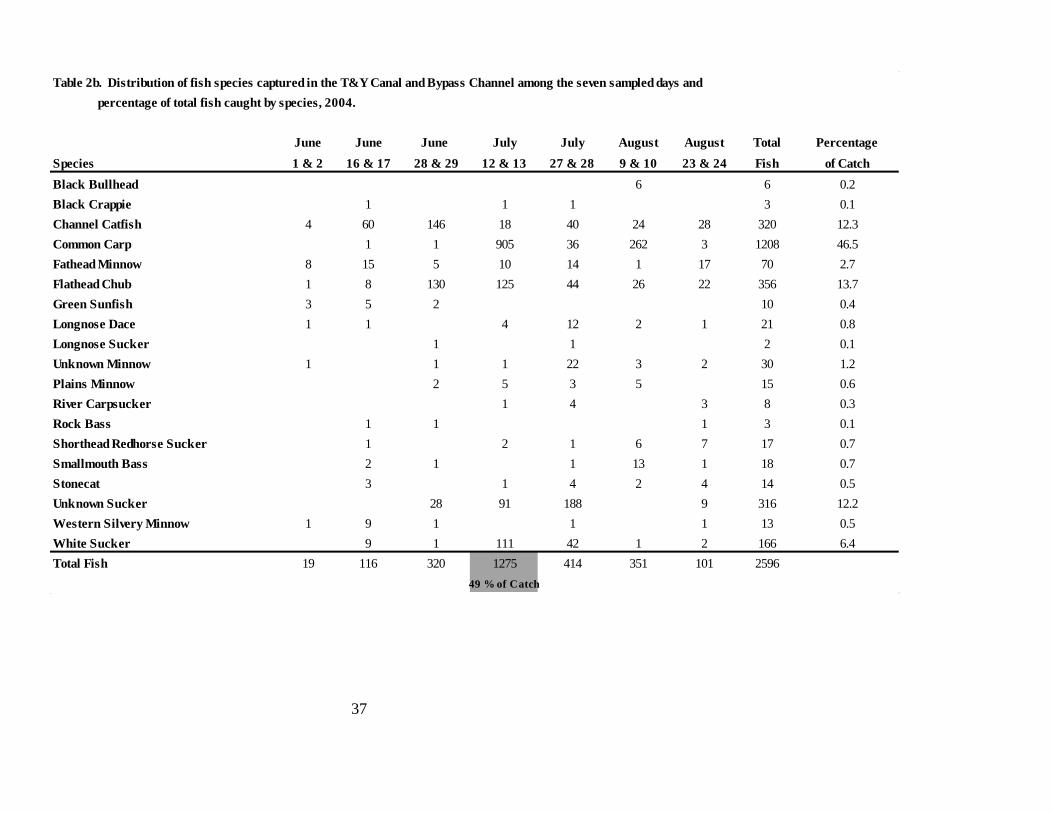
In 2004, 75% of the total number of fish entrained into T&Y Canal during the irrigation
season were entrained between July 12 and 13 (Figure 1b). Daily fish entrainment during this
peak period was 6.6 times that of any other date. Common carp, unknown suckers, flathead
chubs and channel catfish were the most abundant species entrained in the canal during this
period (Table 2b). These species comprised 87% of the total fish captured of all species during
the peak movement period. Peak return of fish through the bypass channel was observed August
9 and 10 comprising 32% of total number of fish returned during the irrigation season.
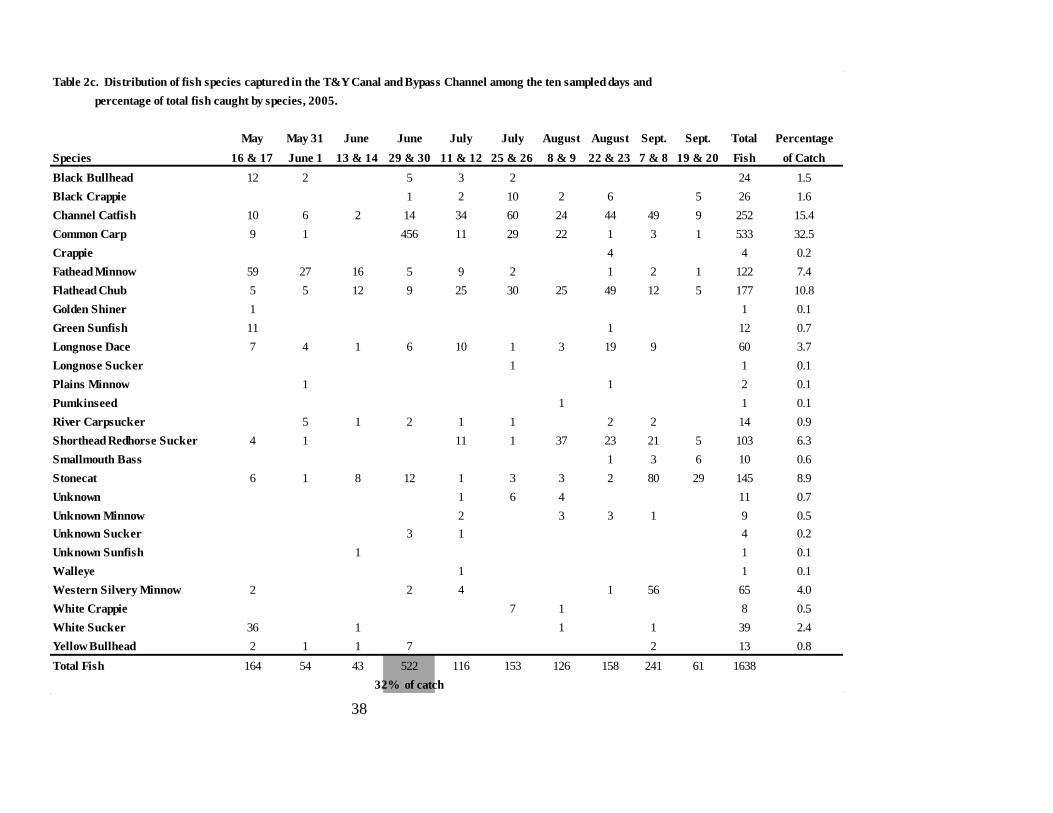
In 2005, 44% of the total number of fish entrained into T&Y Canal during the irrigation
season were entrained between June 29 and 30 (Figure 1c). Common carp, channel catfish and
flathead chub were the most commonly entrained species in the canal during this period (Table
2c). These comprised 84% of the total fish entrained during the peak movement period. After
peak movement the species composition changed to more stonecat, shorthead redhorse suckers,
channel catfish and flathead chub. Peak return of fish through the bypass channel was also
observed June 29 and 30 comprising 26% number of fish returned during the irrigation season.
29
In 2013, 43% of the total number of fish entrained into T&Y Canal during the irrigation
season were entrained between July 10 and 26 (Figure 1d). Channel catfish, common carp,
smallmouth bass, flathead chub and western silvery/plains minnows were the most abundant
species entrained in the canal (Table 2d), and accounted for 80% of all the total catch during the
peak movement period. Peak return of fish through the bypass channel was observed July 25
and 26 comprising 36% of total number of fish returned during the irrigation season.
Diurnal Trends in Entrainment
Light has been identified as a factor influencing the movement of various fish species in
fisheries literature. Some species have demonstrated peak movement primarily during daylight
hours while others most often move at night. We captured all species more frequently at night or
twilight (n = 296) than during the day (n = 83) (Schmetterling and Adams 2004).
In 1997 the lowest rate of entrainment occurred during the early morning hours 2 am to
10 am at the T&Y Canal averaging 11.3 fish captured per 2 hrs (Table 5a). The highest
entrainment rate occurred during the afternoon and early evening between 2 pm and 8 pm with
an average of 33.5 fish captured per 2 hrs or 3 times more fish than the early morning hours.
In 2004 the lowest rate of entrainment occurred during the morning hours 6 am to 12
noon at T&Y Canal averaging 2.8 fish captured per 2 hours (Table 5b). The highest entrainment
rate occurred during the late evening and early morning between 10 pm and 2 am with an
average of 35.5 fish captured per 2 hours or 13 times more fish than the morning hours. In the
bypass channel in the lowest rate of return occurred during the morning hours 8 am to 12 noon
averaging 1.35 fish captured per 2 hours (Table 5b). The highest rate of return occurred during
the late evening and early morning between 10 pm and 2 am with an average of 21.65 fish
captured per 2 hours 16 times more fish than the early morning hours.
In 2005 the lowest rate of entrainment occurred during the morning hours 6 am to 10 am
in the canal averaging 5.3 fish captured per 2 hours (Table 5c). The highest entrainment rate
occurred during the late evening and early morning between 8 pm and 2 am with an average of
22.8 fish captured per 2 hours or 4 times more fish than the early morning hours. In the bypass
channel the lowest rate of return occurred during the morning hours between 6 am and 12 noon
averaging 3.0 fish captured per 2 hours (Table 5c). The highest rate of return occurred during
the late evening hours from 8 pm to 12 midnight with an average of 22.8 fish captured per 2
hours 7.6 times more fish than the morning hours.
In 2013 the lowest rate of entrainment occurred during the morning hours 6 am to 12
noon in the canal averaging 3.5 fish captured per 2 hours (Table 5d). The highest entrainment
rate occurred during the late evening and early morning hours between 10 pm and 4 am with an
average of 17.7 fish captured per 2 hours or 5 times more fish than the morning hours. In the
bypass channel the lowest rate of return occurred during the morning hours between 6 am and 10
am averaging 5.6 fish captured per 2 hours (Table 5d). The highest rate of return occurred
during the late evening and early morning hours between 10 pm and 4 am with an average of
24.8 fish captured per 2 hours or 4 times more fish than the morning hours.
30
Factors Influencing Entrainment
In 1997 Tongue River stream discharge, percentage of irrigation withdrawal related to
Tongue River discharge and Tongue River turbidity were evaluated as possible factors
influencing numbers of fish entering the T&Y Canal. Turbidity is directly correlated to stream
discharge with high turbidity occurring when stream discharge is also high. One exception to
this pattern occurred in October when a rain event and suspected local run-off resulted in
turbidity measurements that exceed high flow turbidity.
In 1997 no clear relationship appeared to exist between stream discharge, percent
diverted water discharge, or turbidity and fish entry into the T&Y canal (Table 6a). Low
numbers of fish entered the canal at both high flows and low flows. High entrainment rates
occurred at both high discharge, 1525 cfs on June 26-27 sample, and moderate discharge 549 cfs,
July 21-22.
In 2004 it appeared that fish were both entrained down the canal and returned to the river
by the bypass channel during periods of low flow (Table 6b). Tongue River discharge in 2004
was lower than any other sampled year. More fish entered the canal at 19 cfs a low flow and few
fish entered the canal and bypass at 100 cfs, a higher flow.
In 2005 it appeared that most fish entered the canal and bypass at higher discharge (Table
6c). The highest rate of fish entrainment down the canal and return to the river through the
bypass occurred at a high discharge of 2250 cfs.
In 2013 it appeared that fish entry into the T&Y Canal and bypass was highest at lower
discharge (Table 6d). The highest rate of fish entrainment down the canal and return to the river
through the bypass occurred at 84 cfs.
31
LITERATURE CITED
Backes, K.M. 1993. Fish population investigations for the Tongue River, 1993. Special Report
State of Montana, Dept. Of Fish, Wildlife and Parks, Fisheries Division - Region 7, 11pp.
Clancy, C. 1975. Vital statistics and instream flow requirement of fish in the Montco Mine Area
of the Tongue River, Montana. Montana Dept. Of Fish, Wildlife and Parks. 55 pp.
Mefford, B., Campbell, R. Tongue and Yellowstone Rivers Diversion Dam Fishway Feasability
Study. Bureau of Reclamation Technical Service Center. 3pp.
Backes, K.M., Riggs, V., Peters, D. 1998. Tongue River Fish Entrainment Study on the T&Y
Canal. Montana Fish, Wildlife and Parks - Region 7.
Rhoten, J., Jaeger, M., Riggs, V., Schmitz, B., Backes, K.M. 2010. Sauger sampling efficiency
in the Yellowstone River. Montana Fish, Wildlife and Parks.
Schmetterling, D., Adams, S. 2004. Summer movements within the Fish Community of a small
montane stream. North American Journal of Fisheries Management. Vol. 24, Issue 4, 2004
Pages 1163-1172.
32
Table 1a. Fish species and length summary statistics of fish captured in the T&Y Canal in 1997.
T&Y Canal
Fish % of Total Length (mm)
Species Collected Catch Min Max Avg
Black Bullhead 1 0.1 105 105 105
Black Crappie 17 2.0 73 211 138
Channel Catfish 89 10.4 40 548 166
Common Carp 111 13.0 24 314 56
Crappie 61 7.1 22 84 44
Creek Chub 1 0.1 180 180 180
Emerald Shiner 4 0.5 75 103 89
Fathead Minnow 5 0.6 46 65 56
Flathead Chub 277 32.4 45 264 125
Green Sunfish 6 0.7 36 92 67
Longnose Dace 109 12.7 47 102 74
Longnose Sucker 9 1.1 43 325 206
Pumpkinseed 7 0.8 32 65 45
River Carpsucker 5 0.6 48 105 68
Sauger/Walleye 1 0.1 43 43 43
Shorthead Redhorse Sucker 19 2.2 207 365 262
Smallmouth Bass 8 0.9 31 192 110
Stonecat 9 1.1 78 158 127
Unknown Minnow 6 0.7 22 75 44
Unknown Sucker 10 1.2 25 45 40
Walleye 1 0.1 38 38 38
White Crappie 54 6.3 43 274 118
White Sucker 26 3.0 36 346 131
Yellow Bullhead 9 1.1 31 130 78
Yellow Perch 10 1.2 35 97 76
Total Fish 855

33
Table 1b. Fish species and length summary statistics of fish captured in the T&Y Canal and By Pass Channel in 2004.
T&Y Canal By Pass Channel
Fish % of Total Length (mm) Fish % of Total Length (mm)
Species Collected Catch Min Max Avg Collected Catch Min Max Avg
Black Bullhead 6 0.7 221 335 245
Black Crappie 1 0.1 112 112 112 2 0.2 133 230 182
Channel Catfish 126 7.1 16 227 68 194 23.7 15 290 145
Common Carp 946 53.3 29 137 41 262 32.0 37 595 72
Fathead Minnow 56 3.2 18 67 50 14 1.7 41 68 53
Flathead Chub 202 11.4 32 143 78 154 18.8 33 165 81
Green Sunfish 8 0.5 49 86 62 2 0.2 61 85 73
Longnose Dace 16 0.9 28 90 52 5 0.6 30 65 41
Longnose Sucker 2 0.2 255 290 273
Unknown Minnow 10 0.6 18 36 26 20 2.4 21 43 35
Plains Minnow 8 0.5 78 111 90 7 0.9 74 110 93
River Carpsucker 7 0.4 26 130 60 1 0.1 25 25 25
Rock Bass 2 0.1 62 108 85 1 0.1 63 63 63
Shorthead Redhorse Sucker 7 0.4 45 198 119 10 1.2 76 319 175
Smallmouth Bass 18 2.2 110 338 228
Stonecat 10 0.6 44 153 99 4 0.5 29 132 96
Unknown Sucker 220 12.4 12 125 27 96 11.7 20 48 35
Western Silvery Minnow 5 0.3 40 72 54 8 1.0 52 85 72
White Sucker 152 8.6 23 97 51 14 1.7 58 248 81
Total Fish 1776 820
34
Table 1c. Fish species and length summary statistics of fish captured in the T&Y Canal and By Pass Channel in 2005.
T&Y Canal By Pass Channel
Fish % of Total Length (mm) Fish % of Total Length (mm)
Species Collected Catch Min Max Avg Collected Catch Min Max Avg
Black Bullhead 6 0.5 48 243 115 18 3.8 56 255 196
Black Crappie 1 0.1 26 26 26 25 5.2 118 232 176
Channel Catfish 176 15.2 14 568 103 76 15.9 19 247 120
Common Carp 419 36.1 19 564 37 114 23.9 23 556 73
Crappie 1 0.1 28 28 28 3 0.6 28 43 35
Fathead Minnow 113 9.7 37 80 58 66 13.8 40 67 55
Flathead Chub 111 9.6 34 146 84 9 1.9 47 152 98
Golden Shiner 1 0.2 122 122 122
Green Sunfish 6 0.5 28 46 36 6 1.3 31 77 45
Longnose Dace 47 4.0 38 93 59 13 2.7 47 90 60
Longnose Sucker 1 0.2 135 135 135
Plains Minnow 1 0.1 52 52 52 1 0.2 97 97 97
Pumkinseed 1 0.1 75 75 75
River Carpsucker 11 0.9 36 106 64 3 0.6 42 109 86
Shorthead Redhorse Sucker 21 1.8 71 329 162 82 17.2 101 347 168
Smallmouth Bass 10 2.1 146 267 196
Stonecat 141 12.1 45 151 113 4 0.8 116 125 121
Unknown 7 0.6 11 37 27 4 0.8 25 98 46
Unknown Minnow 6 0.5 18 41 29 3 0.6 31 42 35
Unknown Sucker 3 0.3 29 33 31 1 0.2 41 41 41
Unknown Sunfish 1 0.1 51 51 51
Walleye 1 0.1 30 30 30
Western Silvery Minnow 60 5.2 42 104 64 5 1.0 62 126 91
White Crappie 8 1.7 156 232 174
White Sucker 20 1.7 67 349 171 19 4.0 32 238 147
Yellow Bullhead 8 0.7 50 190 79 5 1.0 54 75 61
Total Fish 1161 477
35
Table 1d. Fish species and length summary statistics of fish captured in the T&Y Canal and By Pass Channel in 2013.
T&Y Canal By Pass Channel
Fish % of Total Length (mm) Fish % of Total Length (mm)
Species Collected Catch Min Max Avg Collected Catch Min Max Avg
Bigmouth Buffalo 7 0.5 27 46 34 0.0
Black Bullhead 1 0.1 25 25 25 4 0.2 169 199 183
Bluegill 2 0.2 39 56 48 0.0
Channel Catfish 767 58.6 24 458 78 406 20.4 37 685 370
Common Carp 53 4.0 37 267 61 261 13.1 30 630 110
Crappie 0.0 1 0.1 37 37 37
Creek Chub 5 0.4 21 99 67 0.0
Emerald Shiner 74 5.7 26 71 42 9 0.5 40 90 50
Fathead Minnow 38 2.9 27 70 48 12 0.6 48 68 58
Flathead Chub 47 3.6 23 175 67 153 7.7 30 225 131
Freshwater Drum 3 0.2 33 52 42 6 0.3 275 386 343
Goldeye 0.0 99 5.0 132 413 347
Green Sunfish 8 0.6 35 58 51 9 0.5 40 105 71
Largemouth Bass 0.0 3 0.2 145 238 202
Longnose Dace 13 1.0 44 80 57 5 0.3 53 89 65
Longnose Sucker 19 1.5 77 226 108 16 0.8 110 243 208
Northern Pike 0.0 2 0.1 584 640 612
River Carpsucker 11 0.8 35 125 58 101 5.1 30 537 287
Rock Bass 4 0.3 42 124 84 4 0.2 137 158 145
Sauger 0.0 7 0.4 46 410 187
Shorthead Redhorse Sucker 6 0.5 45 215 103 397 20.0 62 475 345
Smallmouth Bass 20 1.5 32 210 116 219 11.0 28 410 163
Smallmouth Buffalo 1 0.1 60 60 60 0.0
Stonecat 117 8.9 27 190 121 42 2.1 110 182 140
Unknown 6 0.5 18 32 24 2 0.1 22 33 28
Unknown Minnow 57 4.4 17 34 22 0.0
Unknown Sucker 1 0.1 25 25 25 0.0
Walleye 2 0.2 35 36 36 21 1.1 44 513 204
Western Silvery Minnow 20 1.5 35 145 78 141 7.1 38 147 113
White Sucker 27 2.1 26 240 114 64 3.2 25 380 170
Yellow Perch 0.0 2 0.1 37 238 138
Total Fish 1309 1986
36
Table 2a. Distribution of fish species captured in the T&Y Canal and Bypass Channel among the ten sampled days and
percentage of total fish caught by species, 1997.
May June June July July August August Sept. Sept. Oct. Total Percentage
Species 29 & 30 12 &13 26 & 27 10 & 11 21 & 22 11 & 12 20 & 21 2 & 3 22 & 23 9 & 10 Fish of catch
Black Bullhead 1 1 0.1
Black Crappie 3 3 2 1 4 4 17 2.0
Carp 44 24 28 2 2 11 111 13.0
Channel Catfish 1 6 17 28 3 8 13 1 12 89 10.4
Crappie * 5 31 8 17 61 7.1
Creek Chub 1 1 0.1
Emerald Shiner 1 3 4 0.5
Fathead Minnow 2 1 2 5 0.6
Flathead Chub 5 2 22 53 60 19 40 30 41 5 277 32.4
Green Sunfish 4 2 6 0.7
Longnose Dace 1 2 20 19 42 14 10 1 109 12.8
Longnose Sucker 5 1 1 1 1 9 1.1
Minnow ** 1 3 1 1 6 0.1
Pumpkinseed 7 7 0.8
River Carpsucker 3 1 1 5 0.6
Sauger/Walleye *** 1 1 0.1
Shorthead Redhorse Sucker 3 2 4 1 3 1 5 19 2.2
Smallmouth Bass 4 1 3 8 0.9
Stonecat 1 1 1 2 1 3 9 1.1
Sucker **** 5 4 1 10 1.2
Walleye 1 1 0.1
White Crappie 1 2 9 17 6 6 7 6 54 6.3
White Sucker 1 16 1 1 2 4 1 26 3.0
Yellow Bullhead 1 3 1 2 1 1 9 1.1
Yellow Perch 2 1 7 10 1.2
Total Fish 12 9 114 154 173 57 106 81 64 85 855
52% of catch
37
Table 2b. Distribution of fish species captured in the T&Y Canal and Bypass Channel among the seven sampled days and
percentage of total fish caught by species, 2004.
June June June July July August August Total Percentage
Species 1 & 2 16 & 17 28 & 29 12 & 13 27 & 28 9 & 10 23 & 24 Fish of Catch
Black Bullhead 6 6 0.2
Black Crappie 1 1 1 3 0.1
Channel Catfish 4 60 146 18 40 24 28 320 12.3
Common Carp 1 1 905 36 262 3 1208 46.5
Fathead Minnow 8 15 5 10 14 1 17 70 2.7
Flathead Chub 1 8 130 125 44 26 22 356 13.7
Green Sunfish 3 5 2 10 0.4
Longnose Dace 1 1 4 12 2 1 21 0.8
Longnose Sucker 1 1 2 0.1
Unknown Minnow 1 1 1 22 3 2 30 1.2
Plains Minnow 2 5 3 5 15 0.6
River Carpsucker 1 4 3 8 0.3
Rock Bass 1 1 1 3 0.1
Shorthead Redhorse Sucker 1 2 1 6 7 17 0.7
Smallmouth Bass 2 1 1 13 1 18 0.7
Stonecat 3 1 4 2 4 14 0.5
Unknown Sucker 28 91 188 9 316 12.2
Western Silvery Minnow 1 9 1 1 1 13 0.5
White Sucker 9 1 111 42 1 2 166 6.4
Total Fish 19 116 320 1275 414 351 101 2596
49 % of Catch
38
Table 2c. Distribution of fish species captured in the T&Y Canal and Bypass Channel among the ten sampled days and
percentage of total fish caught by species, 2005.
May May 31 June June July July August August Sept. Sept. Total Percentage
Species 16 & 17 June 1 13 & 14 29 & 30 11 & 12 25 & 26 8 & 9 22 & 23 7 & 8 19 & 20 Fish of Catch
Black Bullhead 12 2 5 3 2 24 1.5
Black Crappie 1 2 10 2 6 5 26 1.6
Channel Catfish 10 6 2 14 34 60 24 44 49 9 252 15.4
Common Carp 9 1 456 11 29 22 1 3 1 533 32.5
Crappie 4 4 0.2
Fathead Minnow 59 27 16 5 9 2 1 2 1 122 7.4
Flathead Chub 5 5 12 9 25 30 25 49 12 5 177 10.8
Golden Shiner 1 1 0.1
Green Sunfish 11 1 12 0.7
Longnose Dace 7 4 1 6 10 1 3 19 9 60 3.7
Longnose Sucker 1 1 0.1
Plains Minnow 1 1 2 0.1
Pumkinseed 1 1 0.1
River Carpsucker 5 1 2 1 1 2 2 14 0.9
Shorthead Redhorse Sucker 4 1 11 1 37 23 21 5 103 6.3
Smallmouth Bass 1 3 6 10 0.6
Stonecat 6 1 8 12 1 3 3 2 80 29 145 8.9
Unknown 1 6 4 11 0.7
Unknown Minnow 2 3 3 1 9 0.5
Unknown Sucker 3 1 4 0.2
Unknown Sunfish 1 1 0.1
Walleye 1 1 0.1
Western Silvery Minnow 2 2 4 1 56 65 4.0
White Crappie 7 1 8 0.5
White Sucker 36 1 1 1 39 2.4
Yellow Bullhead 2 1 1 7 2 13 0.8
Total Fish 164 54 43 522 116 153 126 158 241 61 1638
32% of catch
39
Table 2d. Distribution of fish species captured in the T&Y Canal and Bypass Channel among the ten sampled days and
percentage of total fish caught by species, 2013.
May May June June July July August August Sept. Sept. Oct. Total %
Species 16 & 17 28 & 29 13 & 14 26 & 27 10 & 11 25 & 26 7 & 8 22 & 23 5 & 6 19 & 20 3 & 4 Fish of Catch
Bigmouth Buffalo 7 7 0.2
Black Bullhead 4 1 5 0.2
Bluegill 1 1 2 0.1
Channel Catfish 7 25 53 495 429 109 20 15 1 19 1173 35.7
Common Carp 5 27 8 2 247 23 1 313 9.5
Crappie 1 1 0.0
Creek Chub 4 1 5 0.2
Emerald Shiner 1 6 6 49 12 4 2 3 83 2.5
Fathead Minnow 4 21 3 14 2 5 1 50 1.5
Flathead Chub 2 31 1 22 18 38 19 53 13 3 200 6.1
Freshwater Drum 7 1 1 9 0.3
Goldeye 2 75 2 11 3 4 2 99 3.0
Green Sunfish 5 3 3 1 2 3 17 0.5
Largemouth Bass 3 3 0.1
Longnose Dace 2 5 1 1 3 4 2 18 0.5
Longnose Sucker 32 2 1 35 1.1
Northern Pike 1 1 2 0.1
River Carpsucker 7 2 16 60 6 10 1 1 9 112 3.4
Rock Bass 4 2 1 1 8 0.2
Sauger 1 1 1 4 7 0.2
Shorthead Redhorse Sucker 236 115 1 15 3 14 8 2 3 6 403 12.3
Smallmouth Bass 21 83 3 13 96 5 4 14 239 7.3
Smallmouth Buffalo 1 1 0.0
Stonecat 51 37 31 12 6 13 8 1 159 4.8
Unknown 3 2 3 8 0.2
Unknown Minnow 6 51 57 1.7
Unknown Sucker 1 1 0.0
Walleye 6 4 12 1 23 0.7
Western Silvery Minnow 2 83 3 19 6 32 5 4 1 6 161 4.9
White Crappie 0 0.0
White Sucker 10 12 10 4 4 32 10 4 2 3 91 2.8
Yellow Perch 1 1 2 0.1
Total Fish 389 527 90 208 706 943 211 91 49 3 68 3285
66% of catch 66 % of catch
40
Table 3a. Estimated numbers of fish entering the T&Y Canal
during the irrigation season in 1997.
T&Y Canal
Sample Estimated Estimated
Time In Fish Fish In Days In Numbers In
Date Minutes Factor Sampled 24 Hours Period Season
May 29 &30 154 9.35 12 112 21 2356
June 12 & 13 108 13.33 9 120 14 1680
June 26 & 27 247 5.83 114 665 14 9305
July 10 & 11 560 2.57 154 396 12.5 4950
July 21 & 22 470 3.06 173 530 16 8481
August 11 & 12 592 2.43 57 139 15 2080
Aug. 20 & 21 563 2.56 106 271 11 2982
Sept. 2 & 3 735 1.96 81 159 16.5 2618
Sept. 22 & 23 1000 1.44 64 92 18 1659
Oct. 9 & 10 975 1.48 85 126 9 1130
Total 855 2609 37241

41
Table 3b. Estimated numbers of fish entering the T&Y Canal and By Pass Channel
during the irrigation season in 2004.
T&Y Canal
Sample Estimated Estimated
Time In Fish Fish In Days In Numbers In
Date Minutes Factor Sampled 24 Hours Period Season
June 1 & 2 1345 1.07 15 16 7.5 120
June 16 & 17 1327 1.09 57 62 12 742
June 28 & 29 1321 1.09 66 72 14 1007
July 12 & 13 1380 1.04 1274 1329 15 19941
July 27 & 28 1327 1.09 212 230 13 2991
Aug. 9 & 10 1363 1.06 59 62 14 873
Aug. 23 & 24 1322 1.09 92 100 7 701
Total 1775 1872 26376
By Pass Channel
Sample Estimated Estimated
Time In Fish Fish In Days In Numbers In
Date Minutes Factor Sampled 24 Hours Period Season
June 1 & 2 1345 1.07 4 4 7.5 32
June 16 & 17 * 1267 1.14 59 67 12 805
June 28 & 29 1321 1.09 254 277 14 3876
July 12 & 13 ** 720 2.00 1 2 15 30
July 27 & 28 1327 1.09 202 219 13 2850
Aug. 9 & 10 1363 1.06 292 308 14 4319
Aug. 23 & 24 *** 60 24.00 9 216 7 1512
Total 821 1094 13424
* One 60 minute sample period was not sampled.
** By Pass blocked with boards, sampled water that trickled around boards for 12 sample periods.
*** By Pass blocked with boards, removed boards for one 60 minute sample period.
42
Table 3c. Estimated numbers of fish entering the T&Y Canal and By Pass Channel
during the irrigation season in 2005.
T&Y Canal
Sample Estimated Total Fish
Time In Fish Fish In Days In Numbers In
Date Minutes Factor Sampled 24 Hours Period * Season
May 16 & 17 859 1.68 97 163 8.5 1,382
May 31 & June 1 505 2.85 48 137 13 1,779
June 13 & 14 1123 1.28 42 54 14 754
June 29 & 30 815 1.77 427 754 13 9,808
July 11 & 12 675 2.13 76 162 12 1,946
July 25 & 26 1161 1.24 82 102 13 1,322
Aug. 8 & 9 1249 1.15 65 75 13 974
Aug. 22 & 23 1241 1.16 79 92 14 1,283
Sep. 7 & 8 1270 1.13 199 226 13 2,933
Sep. 19 & 20 1329 1.08 46 50 6 299
Total 10227 1161 1814 22,481
By Pass Channel
Sample Estimated Total Fish
Time In Fish Fish In Days In Numbers In
Date Minutes Factor Sampled 24 Hours Period * Season
May 16 & 17 859 1.68 67 112 8.5 955
May 31 & June 1 505 2.85 6 17 13 222
June 13 & 14 1123 1.28 1 1 14 18
June 29 & 30 815 1.77 95 168 13 2,182
July 11 & 12 675 2.13 40 85 12 1,024
July 25 & 26 1161 1.24 71 88 13 1,145
Aug. 8 & 9 1249 1.15 61 70 13 914
Aug. 22 & 23 1241 1.16 79 92 14 1,283
Sep. 7 & 8 1270 1.13 42 48 13 619
Sep. 19 & 20 1329 1.08 15 16 6 98
Total 10227 477 698 8,460
* Used May 27 as first day canal was turned on and October 1 as day it was turned off.
43
Table 3d. Estimated numbers of fish entering the T&Y Canal and By
Pass Channel during the irrigation season in 2013.
T&Y Canal
Sample Estimated Estimated
Time In Fish Fish In Days In Numbers In
Date Minutes Factor Sampled 24 Hours Period Season
May 16 & 17 1360 1.06 89 94 3 283
May 28 & 29 1190 1.21 98 119 12 1423
June 13 & 14 1259 1.14 57 65 16 1043
June 26 & 27 1172 1.23 59 72 13 942
July 10 & 11 1071 1.34 485 652 15 9782
July 25 & 26 1159 1.24 371 461 15 6914
Aug. 7 & 8 * 1168 1.23 105 129 13 1683
Aug. 22 & 23 1305 1.10 18 20 15 298
Sept. 5 & 6 1273 1.13 14 16 14 222
Sept. 19 & 20 1313 1.10 0 0 14 0
Oct. 3 & 4 1260 1.14 14 16 13 208
Total 1310 1645 22798
By Pass Channel
Sample Estimated Estimated
Time In Fish Fish In Days In Numbers In
Date Minutes Factor Sampled 24 Hours Period Season
May 16 & 17 1360 1.06 301 319 3 956
May 28 & 29 1190 1.21 430 520 12 6244
June 13 & 14 1259 1.14 33 38 16 604
June 26 & 27 1172 1.23 149 183 13 2380
July 10 & 11 1071 1.34 229 308 15 4618
July 25 & 26 1159 1.24 573 712 15 10679
Aug. 7 & 8 * 1168 1.23 106 131 13 1699
Aug. 22 & 23 1305 1.10 73 81 15 1208
Sept. 5 & 6 1273 1.13 35 40 14 554
Sept. 19 & 20 1313 1.10 3 3 14 46
Oct. 3 & 4 1260 1.14 54 62 13 802
Total 1986 2396 29791
* One 60 minute sample period was not sampled.

44
Table 4. Maximum, minimum, and mean length and weight for all fish collected in twelve passes by K.M. Backes
in 1993 near river mile 91.1 downstream of Ashland, MT.
Range in Mean Range in Mean
Species Number Length (mm) Length (mm) Weight (gm) Weight (gm)
Black bullhead 1 250 240
Black crappie 23 162-187 176 50-110 77
Carp 108 183-603 466 100-3340 1536
Channel catfish 86 105-787 295 5-5300 647
Flathead chub 84 100-194 144 5-70 25
green sunfish 3 96-118 107 80-100 90
Longnose dace 77 43-115 82 5-30 18
Longnose sucker 130 90-381 223 5-550 151
Mountain sucker 5 65-181 128 5-60 27
River carpsucker 93 94-346 285 15-510 292
Rock bass 66 99-218 183 70-240 141
Shorthead redhorse 200 122-358 285 20-410 234
Smallmouth bass 11 147-442 257 50-1410 379
Stonecat 50 77-221 164 5-100 50
Walleye 3 194-201 197 50-70 60
White Crappie 10 153-212 194 50-120 93
White sucker 114 61-376 229 5-650 204
Yellow bullhead 113 98-234 184 20-180 87

45
Table 5a. Diurnal timing of fish movements into the T&Y Canal by two hour sampling intervals, 1997.
Fish Entry Into the T&Y Canal by Two Hour Intervals
10:00 AM Noon 2:00 PM 4:00 PM 6:00 PM 8:00 PM 10:00 PM 12:00 AM 2:00 AM 4:00 AM 6:00 AM 8:00 AM
to to to to to to to to to to to to
Date Noon 2:00 PM 4:00 PM 6:00 PM 8:00 PM 10:00 PM 12:00 AM 2:00 AM 4:00 AM 6:00 AM 8:00 AM 10:00 AM Total Percentage
May 29 &30 11 0 16 13 9 0 24 0 0 12 24 0 109 4.2
June 12 & 13 0 24 0 45 15 30 0 0 0 15 0 0 129 5.0
June 26 & 27 69 36 54 84 77 96 66 50 20 48 30 0 630 24.3
July 10 & 11 34 61 51 84 36 30 34 60 9 12 13 12 435 16.8
July 21 & 22 48 45 58 69 72 21 81 24 24 15 42 12 511 19.7
August 11 & 12 15 21 9 20 12 15 10 4 8 4 24 4 146 5.6
Aug. 20 & 21 17 12 26 59 34 26 14 22 12 6 16 12 256 9.9
Sept. 2 & 3 14 4 30 22 24 16 16 12 6 5 5 7 162 6.2
Sept. 22 & 23 3 8 20 13 14 6 10 2 3 0 1 2 84 3.3
Oct. 9 & 10 9 5 14 17 8 11 9 8 5 8 20 15 126 4.9
Total 220.8 215.8 277.9 425.8 301.1 250.9 263.2 181.6 87.2 125.2 174.4 64.2 2588
Mean 22.1 21.6 27.8 42.6 30.1 25.1 26.3 18.2 8.7 12.5 17.4 6.4
Percentage 8.5 8.3 10.7 16.5 11.6 9.7 10.2 7.0 3.4 4.8 6.7 2.5
Average = 33.5 Average = 11.3
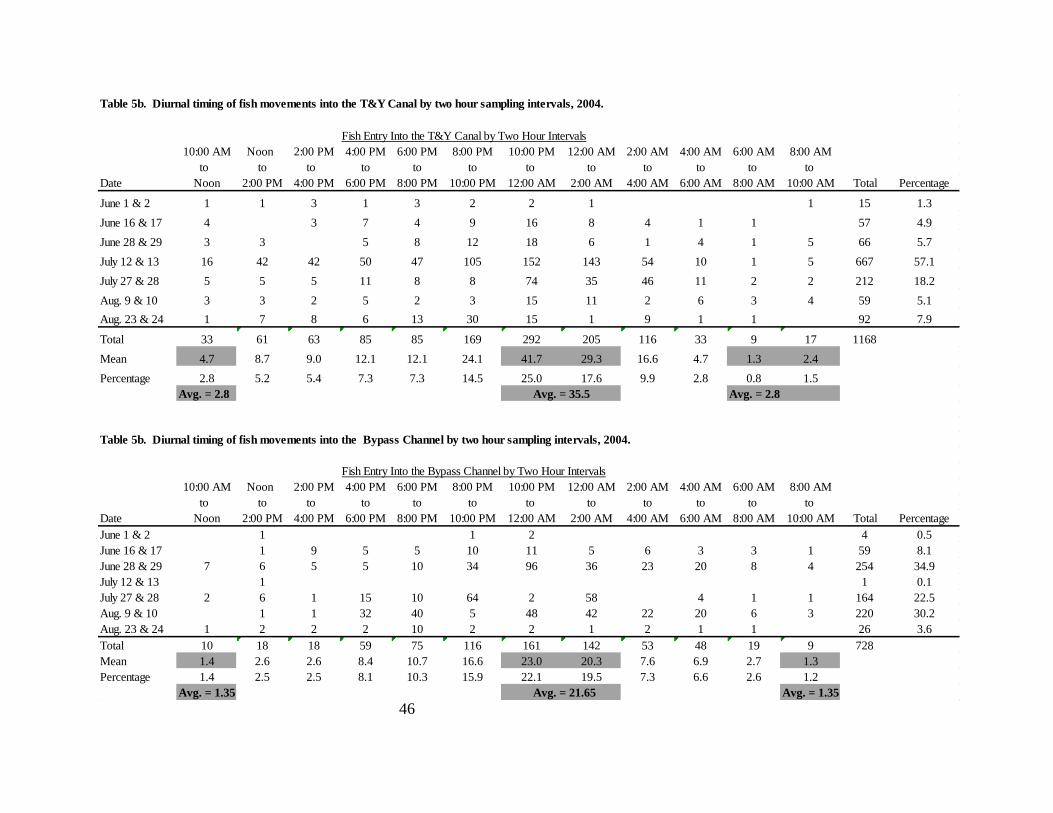
46
Table 5b. Diurnal timing of fish movements into the T&Y Canal by two hour sampling intervals, 2004.
Fish Entry Into the T&Y Canal by Two Hour Intervals
10:00 AM Noon 2:00 PM 4:00 PM 6:00 PM 8:00 PM 10:00 PM 12:00 AM 2:00 AM 4:00 AM 6:00 AM 8:00 AM
to to to to to to to to to to to to
Date Noon 2:00 PM 4:00 PM 6:00 PM 8:00 PM 10:00 PM 12:00 AM 2:00 AM 4:00 AM 6:00 AM 8:00 AM 10:00 AM Total Percentage
June 1 & 2 1 1 3 1 3 2 2 1 1 15 1.3
June 16 & 17 4 3 7 4 9 16 8 4 1 1 57 4.9
June 28 & 29 3 3 5 8 12 18 6 1 4 1 5 66 5.7
July 12 & 13 16 42 42 50 47 105 152 143 54 10 1 5 667 57.1
July 27 & 28 5 5 5 11 8 8 74 35 46 11 2 2 212 18.2
Aug. 9 & 10 3 3 2 5 2 3 15 11 2 6 3 4 59 5.1
Aug. 23 & 24 1 7 8 6 13 30 15 1 9 1 1 92 7.9
Total 33 61 63 85 85 169 292 205 116 33 9 17 1168
Mean 4.7 8.7 9.0 12.1 12.1 24.1 41.7 29.3 16.6 4.7 1.3 2.4
Percentage 2.8 5.2 5.4 7.3 7.3 14.5 25.0 17.6 9.9 2.8 0.8 1.5
Avg. = 2.8 Avg. = 35.5 Avg. = 2.8
Table 5b. Diurnal timing of fish movements into the Bypass Channel by two hour sampling intervals, 2004.
Fish Entry Into the Bypass Channel by Two Hour Intervals
10:00 AM Noon 2:00 PM 4:00 PM 6:00 PM 8:00 PM 10:00 PM 12:00 AM 2:00 AM 4:00 AM 6:00 AM 8:00 AM
to to to to to to to to to to to to
Date Noon 2:00 PM 4:00 PM 6:00 PM 8:00 PM 10:00 PM 12:00 AM 2:00 AM 4:00 AM 6:00 AM 8:00 AM 10:00 AM Total Percentage
June 1 & 2 1 1 2 4 0.5
June 16 & 17 1 9 5 5 10 11 5 6 3 3 1 59 8.1
June 28 & 29 7 6 5 5 10 34 96 36 23 20 8 4 254 34.9
July 12 & 13 1 1 0.1
July 27 & 28 2 6 1 15 10 64 2 58 4 1 1 164 22.5
Aug. 9 & 10 1 1 32 40 5 48 42 22 20 6 3 220 30.2
Aug. 23 & 24 1 2 2 2 10 2 2 1 2 1 1 26 3.6
Total 10 18 18 59 75 116 161 142 53 48 19 9 728
Mean 1.4 2.6 2.6 8.4 10.7 16.6 23.0 20.3 7.6 6.9 2.7 1.3
Percentage 1.4 2.5 2.5 8.1 10.3 15.9 22.1 19.5 7.3 6.6 2.6 1.2
Avg. = 1.35 Avg. = 21.65 Avg. = 1.35
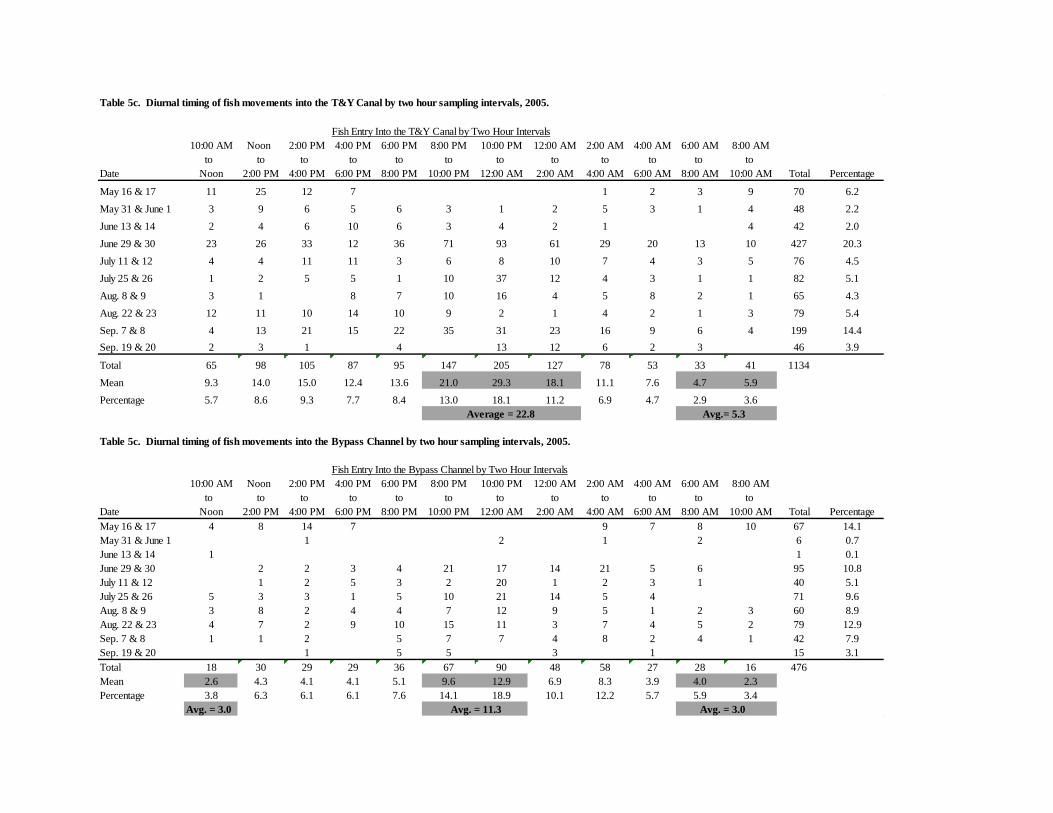
47
Table 5c. Diurnal timing of fish movements into the T&Y Canal by two hour sampling intervals, 2005.
Fish Entry Into the T&Y Canal by Two Hour Intervals
10:00 AM Noon 2:00 PM 4:00 PM 6:00 PM 8:00 PM 10:00 PM 12:00 AM 2:00 AM 4:00 AM 6:00 AM 8:00 AM
to to to to to to to to to to to to
Date Noon 2:00 PM 4:00 PM 6:00 PM 8:00 PM 10:00 PM 12:00 AM 2:00 AM 4:00 AM 6:00 AM 8:00 AM 10:00 AM Total Percentage
May 16 & 17 11 25 12 7 1 2 3 9 70 6.2
May 31 & June 1 3 9 6 5 6 3 1 2 5 3 1 4 48 2.2
June 13 & 14 2 4 6 10 6 3 4 2 1 4 42 2.0
June 29 & 30 23 26 33 12 36 71 93 61 29 20 13 10 427 20.3
July 11 & 12 4 4 11 11 3 6 8 10 7 4 3 5 76 4.5
July 25 & 26 1 2 5 5 1 10 37 12 4 3 1 1 82 5.1
Aug. 8 & 9 3 1 8 7 10 16 4 5 8 2 1 65 4.3
Aug. 22 & 23 12 11 10 14 10 9 2 1 4 2 1 3 79 5.4
Sep. 7 & 8 4 13 21 15 22 35 31 23 16 9 6 4 199 14.4
Sep. 19 & 20 2 3 1 4 13 12 6 2 3 46 3.9
Total 65 98 105 87 95 147 205 127 78 53 33 41 1134
Mean 9.3 14.0 15.0 12.4 13.6 21.0 29.3 18.1 11.1 7.6 4.7 5.9
Percentage 5.7 8.6 9.3 7.7 8.4 13.0 18.1 11.2 6.9 4.7 2.9 3.6
Average = 22.8 Avg.= 5.3
Table 5c. Diurnal timing of fish movements into the Bypass Channel by two hour sampling intervals, 2005.
Fish Entry Into the Bypass Channel by Two Hour Intervals
10:00 AM Noon 2:00 PM 4:00 PM 6:00 PM 8:00 PM 10:00 PM 12:00 AM 2:00 AM 4:00 AM 6:00 AM 8:00 AM
to to to to to to to to to to to to
Date Noon 2:00 PM 4:00 PM 6:00 PM 8:00 PM 10:00 PM 12:00 AM 2:00 AM 4:00 AM 6:00 AM 8:00 AM 10:00 AM Total Percentage
May 16 & 17 4 8 14 7 9 7 8 10 67 14.1
May 31 & June 1 1 2 1 2 6 0.7
June 13 & 14 1 1 0.1
June 29 & 30 2 2 3 4 21 17 14 21 5 6 95 10.8
July 11 & 12 1 2 5 3 2 20 1 2 3 1 40 5.1
July 25 & 26 5 3 3 1 5 10 21 14 5 4 71 9.6
Aug. 8 & 9 3 8 2 4 4 7 12 9 5 1 2 3 60 8.9
Aug. 22 & 23 4 7 2 9 10 15 11 3 7 4 5 2 79 12.9
Sep. 7 & 8 1 1 2 5 7 7 4 8 2 4 1 42 7.9
Sep. 19 & 20 1 5 5 3 1 15 3.1
Total 18 30 29 29 36 67 90 48 58 27 28 16 476
Mean 2.6 4.3 4.1 4.1 5.1 9.6 12.9 6.9 8.3 3.9 4.0 2.3
Percentage 3.8 6.3 6.1 6.1 7.6 14.1 18.9 10.1 12.2 5.7 5.9 3.4
Avg. = 3.0 Avg. = 11.3 Avg. = 3.0

48
Table 5d. Diurnal timing of fish movements into the T&Y Canal by two hour sampling intervals.
Fish Entry Into the T&Y Canal by Two Hour Intervals
10:00 AM Noon 2:00 PM 4:00 PM 6:00 PM 8:00 PM 10:00 PM 12:00 AM 2:00 AM 4:00 AM 6:00 AM 8:00 AM
to to to to to to to to to to to to
Date Noon 2:00 PM 4:00 PM 6:00 PM 8:00 PM 10:00 PM 12:00 AM 2:00 AM 4:00 AM 6:00 AM 8:00 AM 10:00 AM Total Percentage
May 16 & 17 2 6 6 4 2 8 17 26 11 5 2 89 6.8
May 28 & 29 5 8 8 8 8 10 12 8 13 13 3 2 98 7.5
June 13 & 14 3 5 6 9 10 4 6 5 2 2 2 3 57 4.4
June 26 & 27 3 29 10 10 1 1 1 1 2 1 59 4.5
July 10 & 11 25 21 19 4 2 7 102 99 130 60 6 10 485 37.1
July 25 & 26 6 47 85 60 33 37 52 21 17 5 5 3 371 28.3
Aug. 7 & 8 3 2 13 10 6 10 16 16 17 3 6 3 105 8.0
Aug. 22 & 23 1 1 2 2 3 3 5 17 1.3
Sept. 5 & 6 2 3 1 2 1 2 3 14 1.1
Sept. 19 & 20 0 0.0
Oct. 3 & 4 2 1 2 5 4 14 1.1
Total 47 121 151 107 63 80 211 180 194 98 30 27 1309
Mean 4.3 11.0 13.7 9.7 5.7 7.3 19.2 16.4 17.6 8.9 2.7 2.5
Percentage 3.6 9.2 11.5 8.2 4.8 6.1 16.1 13.8 14.8 7.5 2.3 2.1
Avg. = 3.5 Avg. = 17.7 Avg. = 3.5
Table 5d. Diurnal timing of fish movements into the Bypass Channel by two hour sampling intervals.
Fish Entry Into the Bypass Channel by Two Hour Intervals
10:00 AM Noon 2:00 PM 4:00 PM 6:00 PM 8:00 PM 10:00 PM 12:00 AM 2:00 AM 4:00 AM 6:00 AM 8:00 AM
to to to to to to to to to to to to
Date Noon 2:00 PM 4:00 PM 6:00 PM 8:00 PM 10:00 PM 12:00 AM 2:00 AM 4:00 AM 6:00 AM 8:00 AM 10:00 AM Total Percentage
May 16 & 17 6 5 3 3 17 55 94 98 14 4 2 301 15.2
May 28 & 29 30 24 32 43 31 32 39 38 53 57 40 11 430 21.7
June 13 & 14 5 3 2 2 1 1 3 3 8 2 3 33 1.7
June 26 & 27 3 13 13 7 9 12 41 24 19 4 4 149 7.5
July 10 & 11 12 10 14 15 19 46 32 30 34 11 3 3 229 11.5
July 25 & 26 33 149 88 30 37 57 66 48 28 22 6 9 573 28.9
Aug. 7 & 8 * 2 4 9 4 6 18 13 20 18 5 4 3 106 5.3
Aug. 22 & 23 6 3 4 1 16 11 8 1 2 15 6 73 3.7
Sept. 5 & 6 1 1 6 6 12 2 2 1 2 2 35 1.8
Sept. 19 & 20 1 1 1 3 0.2
Oct. 3 & 4 2 1 3 2 1 5 4 19 12 5 54 2.7
Total 94 217 167 116 111 212 267 271 279 129 80 43 1986
Mean 8.5 19.7 15.2 10.5 10.1 19.3 24.3 24.6 25.4 11.7 7.3 3.9
Percentage 4.7 10.9 8.4 5.8 5.6 10.7 13.4 13.6 14.0 6.5 4.0 2.2
Avg.= 24.8 Avg. = 5.6
* = NET NOT OPERATING FOR 1 HOUR DURING THIS TIME
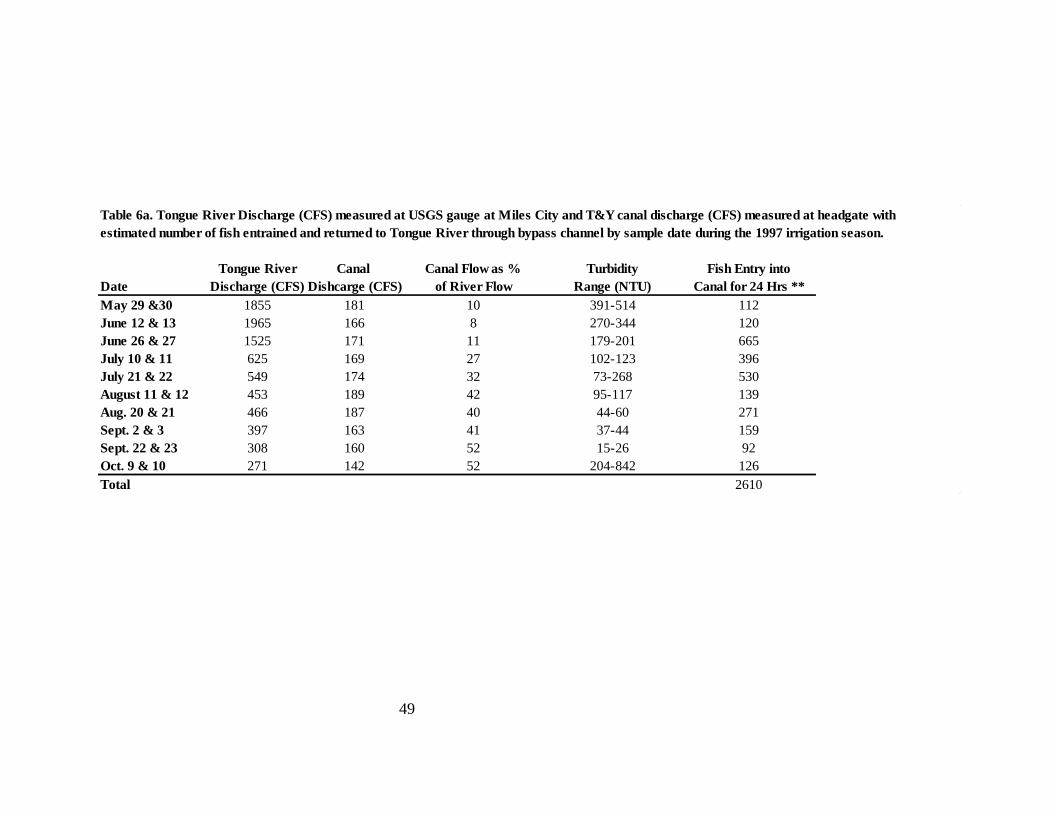
49
Table 6a. Tongue River Discharge (CFS) measured at USGS gauge at Miles City and T&Y canal discharge (CFS) measured at headgate with
estimated number of fish entrained and returned to Tongue River through bypass channel by sample date during the 1997 irrigation season.
Tongue River Canal Canal Flow as % Turbidity Fish Entry into
Date Discharge (CFS) Dishcarge (CFS) of River Flow Range (NTU) Canal for 24 Hrs **
May 29 &30 1855 181 10 391-514 112
June 12 & 13 1965 166 8 270-344 120
June 26 & 27 1525 171 11 179-201 665
July 10 & 11 625 169 27 102-123 396
July 21 & 22 549 174 32 73-268 530
August 11 & 12 453 189 42 95-117 139
Aug. 20 & 21 466 187 40 44-60 271
Sept. 2 & 3 397 163 41 37-44 159
Sept. 22 & 23 308 160 52 15-26 92
Oct. 9 & 10 271 142 52 204-842 126
Total 2610
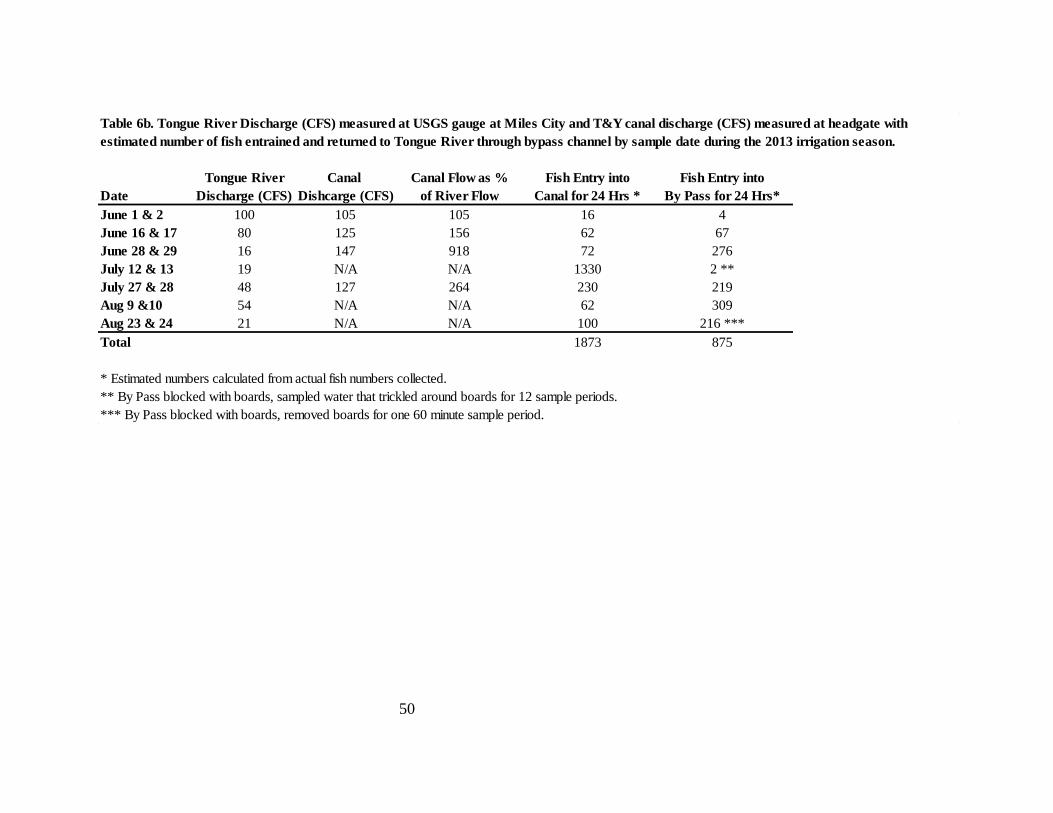
50
Table 6b. Tongue River Discharge (CFS) measured at USGS gauge at Miles City and T&Y canal discharge (CFS) measured at headgate with
estimated number of fish entrained and returned to Tongue River through bypass channel by sample date during the 2013 irrigation season.
Tongue River Canal Canal Flow as % Fish Entry into Fish Entry into
Date Discharge (CFS) Dishcarge (CFS) of River Flow Canal for 24 Hrs * By Pass for 24 Hrs*
June 1 & 2 100 105 105 16 4
June 16 & 17 80 125 156 62 67
June 28 & 29 16 147 918 72 276
July 12 & 13 19 N/A N/A 1330 2 **
July 27 & 28 48 127 264 230 219
Aug 9 &10 54 N/A N/A 62 309
Aug 23 & 24 21 N/A N/A 100 216 ***
Total 1873 875
* Estimated numbers calculated from actual fish numbers collected.
** By Pass blocked with boards, sampled water that trickled around boards for 12 sample periods.
*** By Pass blocked with boards, removed boards for one 60 minute sample period.

51
Table 6c. Tongue River Discharge (CFS) measured at USGS gauge at Miles City and T&Y canal discharge (CFS) measured at headgate with
estimated number of fish entrained and returned to Tongue River through bypass channel by sample date during the 2005 irrigation season.
Tongue River Canal Canal Flow as % Fish Entry into Fish Entry into
Date Discharge (CFS) Dishcarge (CFS) of River Flow Canal for 24 Hrs * By Pass for 24 Hrs*
May 16 & 17 1330 79 6 97 67
May 31 & June 1 1600 107 7 48 6
June 13 & 14 1350 86 6 42 1
June 29 & 30 2250 104 5 427 95
July 11 & 12 403 158 39 76 40
July 25 & 26 117 161 137 82 71
Aug. 8 & 9 80 167 209 65 61
Aug. 22 & 23 198 162 82 79 79
Sep. 7 & 8 182 140 77 199 42
Sep. 19 & 20 210 62 30 46 15
Total 1161 477
* Actual numbers of fish collected in 24 hour period.
** River flows came from provisional data, they need to be changed when corrected values are available.
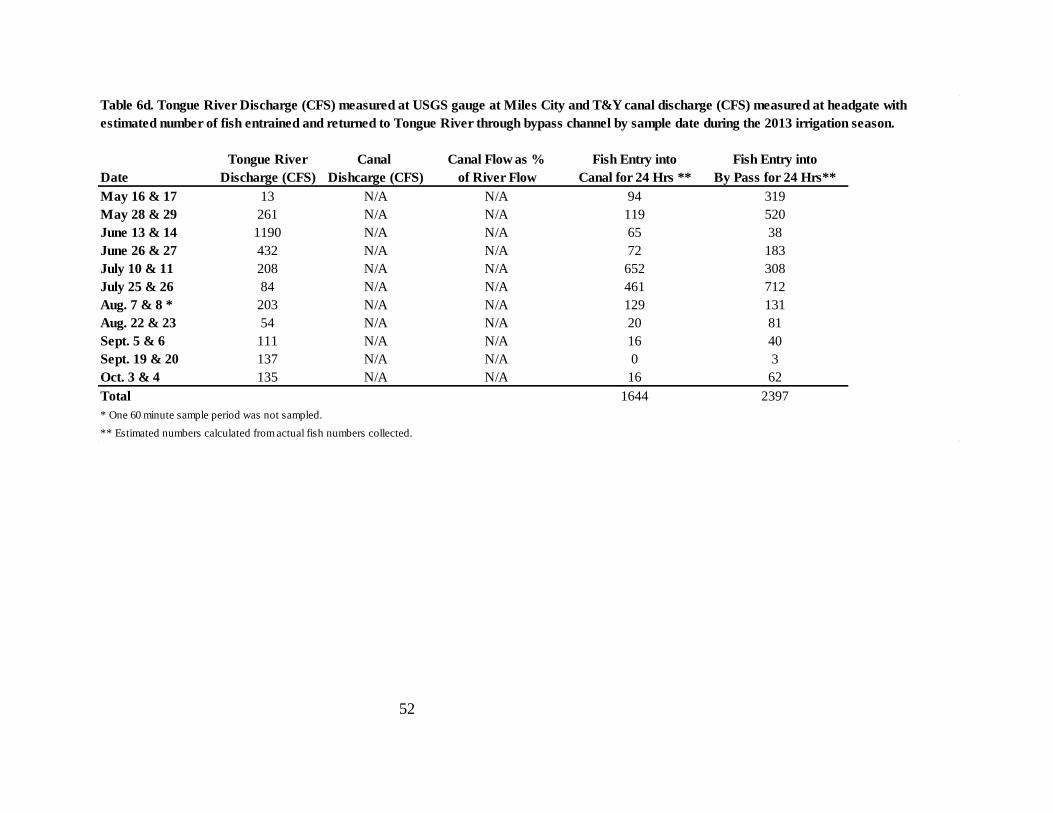
52
Table 6d. Tongue River Discharge (CFS) measured at USGS gauge at Miles City and T&Y canal discharge (CFS) measured at headgate with
estimated number of fish entrained and returned to Tongue River through bypass channel by sample date during the 2013 irrigation season.
Tongue River Canal Canal Flow as % Fish Entry into Fish Entry into
Date Discharge (CFS) Dishcarge (CFS) of River Flow Canal for 24 Hrs ** By Pass for 24 Hrs**
May 16 & 17 13 N/A N/A 94 319
May 28 & 29 261 N/A N/A 119 520
June 13 & 14 1190 N/A N/A 65 38
June 26 & 27 432 N/A N/A 72 183
July 10 & 11 208 N/A N/A 652 308
July 25 & 26 84 N/A N/A 461 712
Aug. 7 & 8 * 203 N/A N/A 129 131
Aug. 22 & 23 54 N/A N/A 20 81
Sept. 5 & 6 111 N/A N/A 16 40
Sept. 19 & 20 137 N/A N/A 0 3
Oct. 3 & 4 135 N/A N/A 16 62
Total 1644 2397
* One 60 minute sample period was not sampled.
** Estimated numbers calculated from actual fish numbers collected.
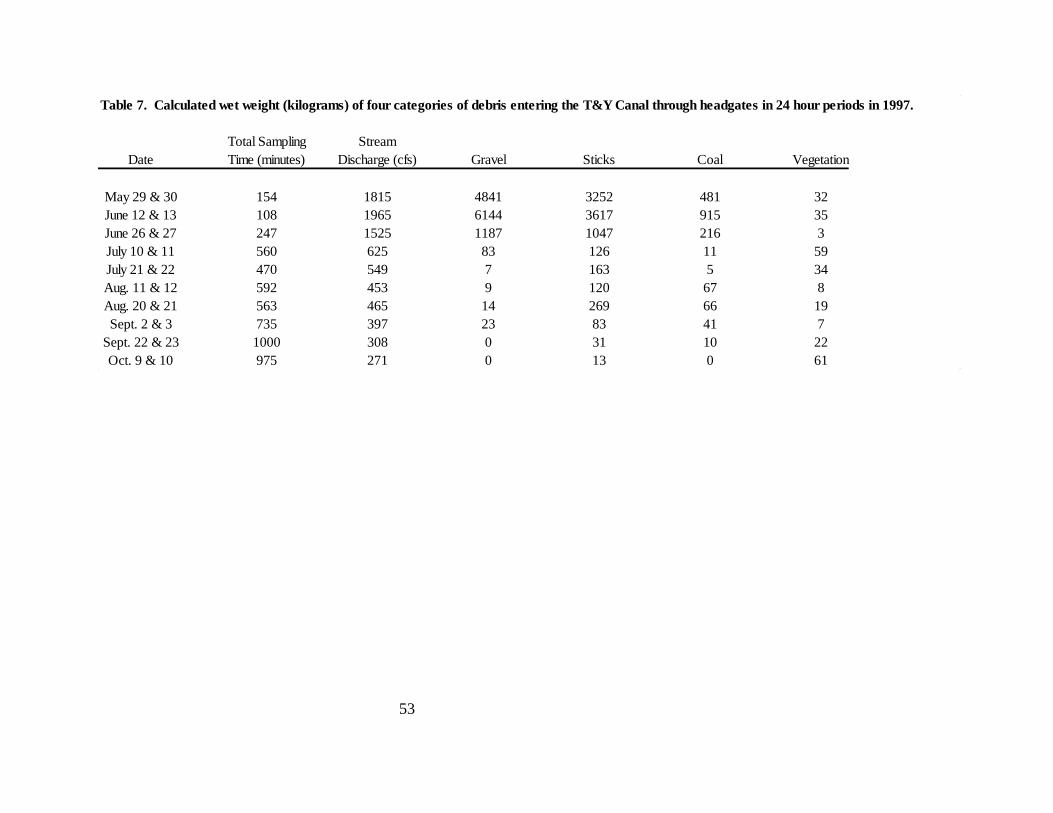
53
Table 7. Calculated wet weight (kilograms) of four categories of debris entering the T&Y Canal through headgates in 24 hour periods in 1997.
Total Sampling Stream
Date Time (minutes) Discharge (cfs) Gravel Sticks Coal Vegetation
May 29 & 30 154 1815 4841 3252 481 32
June 12 & 13 108 1965 6144 3617 915 35
June 26 & 27 247 1525 1187 1047 216 3
July 10 & 11 560 625 83 126 11 59
July 21 & 22 470 549 7 163 5 34
Aug. 11 & 12 592 453 9 120 67 8
Aug. 20 & 21 563 465 14 269 66 19
Sept. 2 & 3 735 397 23 83 41 7
Sept. 22 & 23 1000 308 0 31 10 22
Oct. 9 & 10 975 271 0 13 0 61
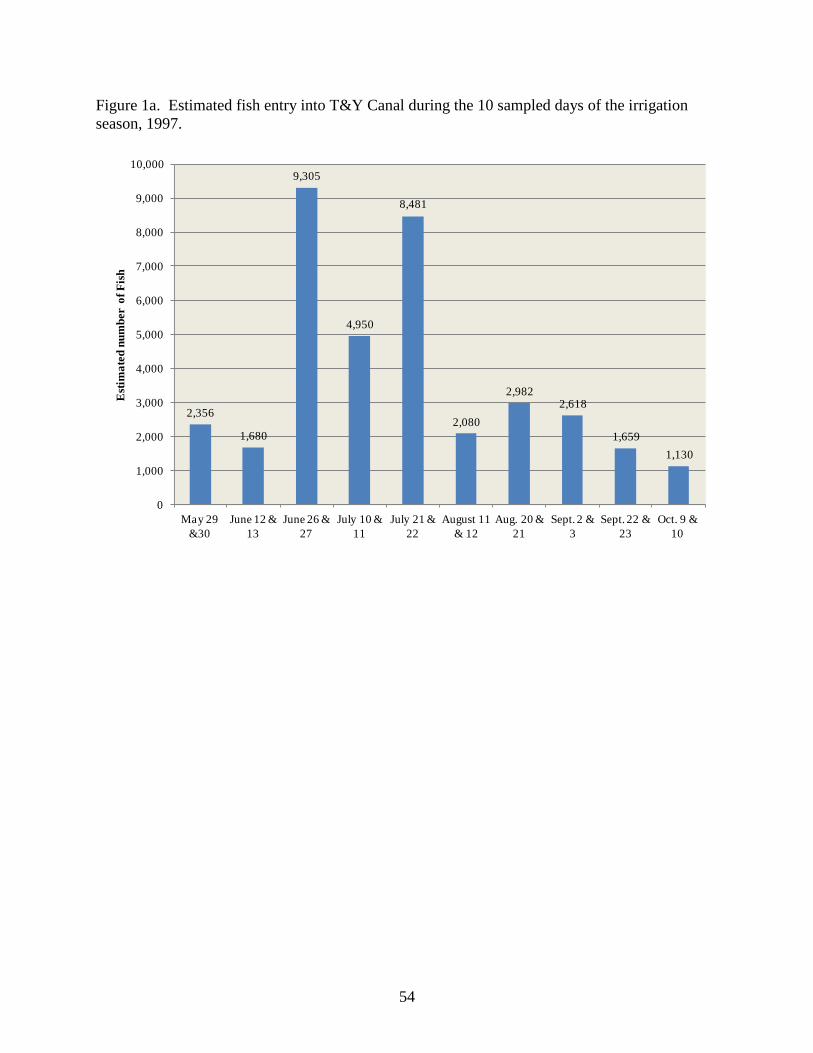
54
Figure 1a. Estimated fish entry into T&Y Canal during the 10 sampled days of the irrigation
season, 1997.
2,356
1,680
9,305
4,950
8,481
2,080
2,9822,618
1,659
1,130
0
1,000
2,000
3,000
4,000
5,000
6,000
7,000
8,000
9,000
10,000
May 29
&30
June 12 &
13
June 26 &
27
July 10 &
11
July 21 &
22
August 11
& 12
Aug. 20 &
21
Sept. 2 &
3
Sept. 22 &
23
Oct. 9 &
10
Est
ima
ted
nu
mb
er o
f F
ish
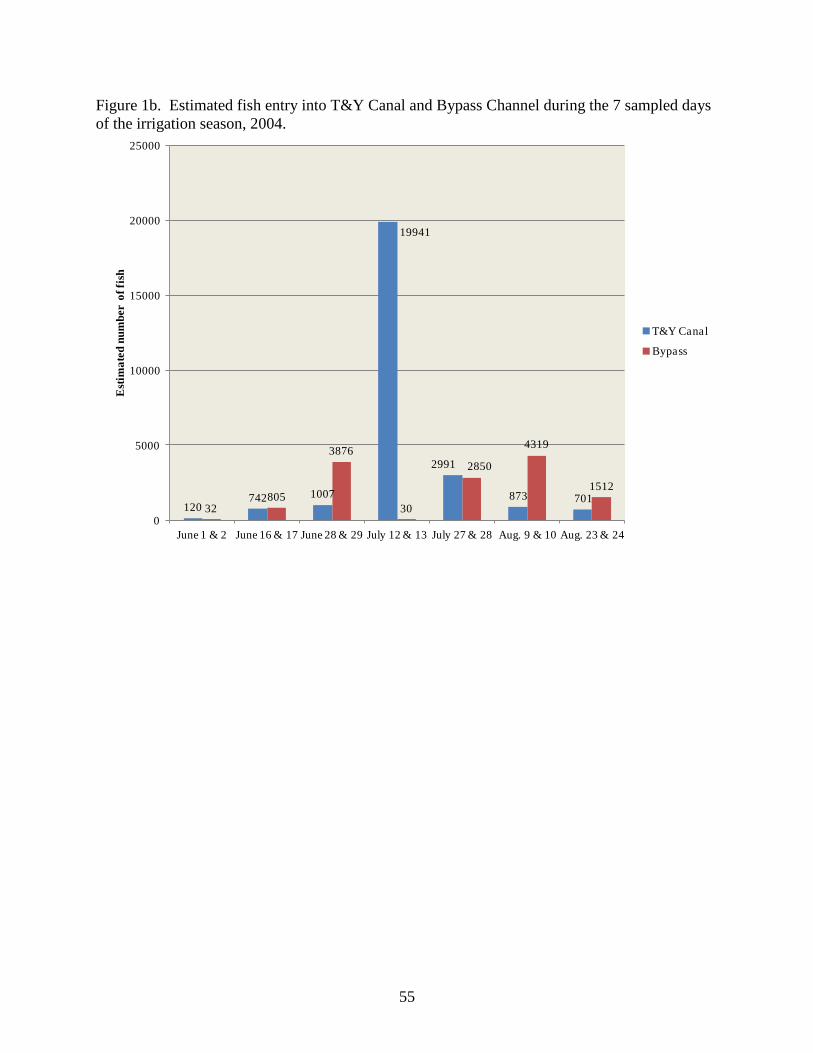
55
Figure 1b. Estimated fish entry into T&Y Canal and Bypass Channel during the 7 sampled days
of the irrigation season, 2004.
120742 1007
19941
2991
873 70132
805
3876
30
2850
4319
1512
0
5000
10000
15000
20000
25000
June 1 & 2 June 16 & 17 June 28 & 29 July 12 & 13 July 27 & 28 Aug. 9 & 10 Aug. 23 & 24
Est
ima
ted
nu
mb
er o
f fi
sh
T&Y Canal
Bypass

56
Figure 1c. Estimated fish entry into T&Y Canal and Bypass Channel during the 10 sampled
days of the irrigation season, 2005.
1,3821,779
754
9,808
1,946
1,322974
1,283
2,933
299
955
22218
2,182
1,024 1,145 9141,283
619
98
0
2,000
4,000
6,000
8,000
10,000
12,000
May 16 &
17
May 31 &
June 1
June 13 &
14
June 29 &
30
July 11 &
12
July 25 &
26
Aug. 8 &
9
Aug. 22 &
23
Sep. 7 & 8 Sep. 19 &
20
Est
ima
ted
nu
mb
er o
f fi
sh
Canal
Bypass

57
Figure 1d. Estimated fish entry into T&Y Canal and Bypass Channel during the 11 sampled
days of the irrigation season,2013.
Figure 2a. Fish species composition T & Y Canal, 1997.
283
1423
1043 942
9782
6914
1683
298 2220
208
956
6244
604
2380
4618
10679
1699
1208
554
46
802
0
2000
4000
6000
8000
10000
12000
May 16 &
17
May 28 &
29
June 13 &
14
June 26 &
27
July 10 &
11
July 25 &
26
Aug. 7 & 8
*
Aug. 22 &
23
Sept. 5 & 6 Sept. 19 &
20
Oct. 3 & 4
Est
ima
ted
Nu
mb
er o
f F
ish
T&Y Canal
Bypass
32.4
15.4
13
12.7
10.4
16.1FH CH
CR
CARP
LN DC
C CAT
OTHER
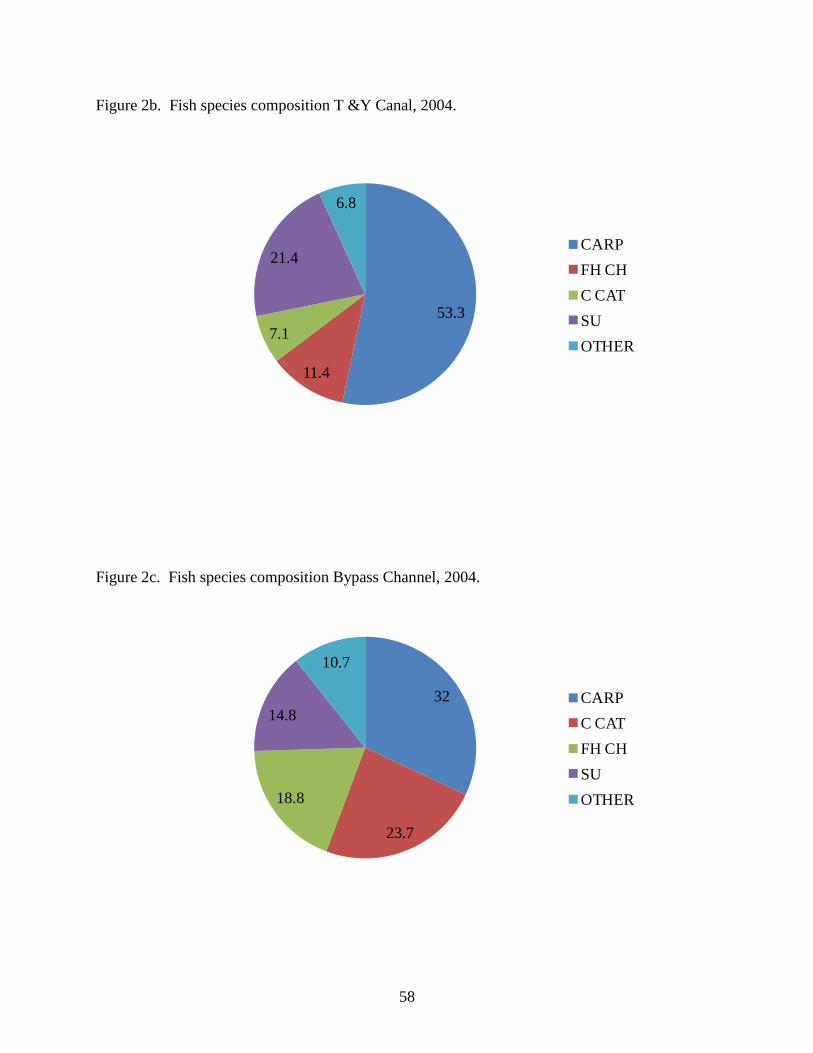
58
Figure 2b. Fish species composition T &Y Canal, 2004.
Figure 2c. Fish species composition Bypass Channel, 2004.
53.3
11.4
7.1
21.4
6.8
CARP
FH CH
C CAT
SU
OTHER
32
23.7
18.8
14.8
10.7
CARP
C CAT
FH CH
SU
OTHER
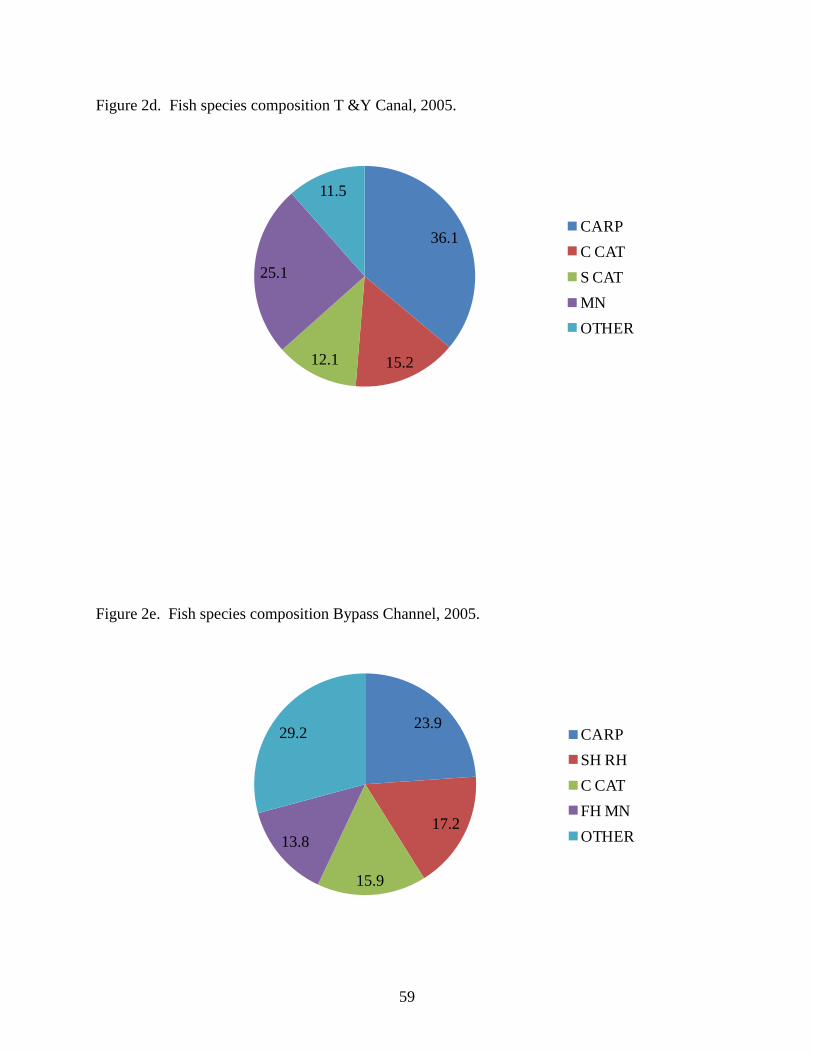
59
Figure 2d. Fish species composition T &Y Canal, 2005.
Figure 2e. Fish species composition Bypass Channel, 2005.
36.1
15.212.1
25.1
11.5
CARP
C CAT
S CAT
MN
OTHER
23.9
17.2
15.9
13.8
29.2 CARP
SH RH
C CAT
FH MN
OTHER
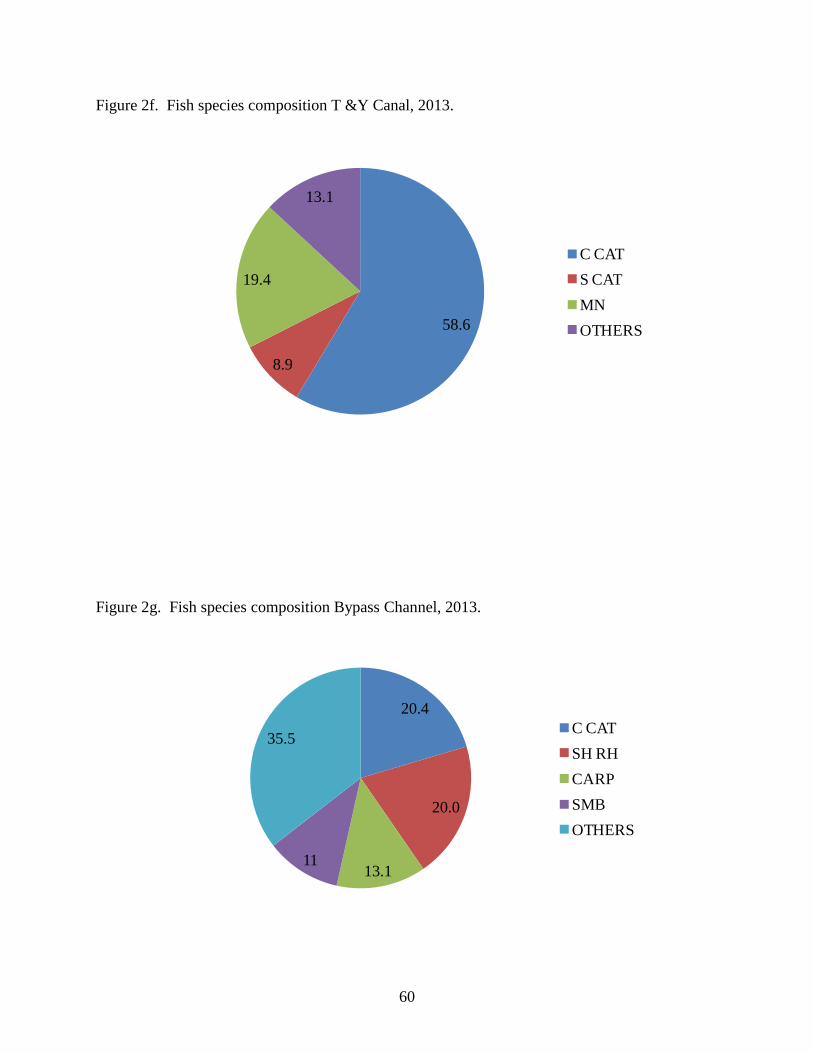
60
Figure 2f. Fish species composition T &Y Canal, 2013.
Figure 2g. Fish species composition Bypass Channel, 2013.
58.6
8.9
19.4
13.1
C CAT
S CAT
MN
OTHERS
20.4
20.0
13.111
35.5C CAT
SH RH
CARP
SMB
OTHERS

61
date
May
29
June
12
June
26
July 1
0
July 2
1
Aug
ust 1
1
Aug
ust 2
0
Sep
tem
ber 2
Sep
tem
ber 2
2
Oct
ober
9
de
bri
s w
eig
ht (k
g)
0
1000
2000
3000
4000
5000
6000
7000
dis
cha
rge
(cfs
)
0
200
400
600
800
1000
1200
1400
1600
1800
2000
2200
gravel
sticks
coal
vegetation
date vs stream cfs
Figure 3. Calculated weight (kg) of debris entering the T & Y Canal and Tongue River
discharge (CFS)
during the 1997 irrigation season.