five steps to effective financial management (mc03)
TRANSCRIPT

American Academy of Ophthalmic Executives® (AAOE®)
Ernest N. Morial Convention Center | New Orleans, LA
Five Steps to Effective Financial Management (MC03) Nov. 12, 2021 | 1:30 to 4:30 p.m.

AAOE® Program of 2021 November 12-15, 2021 | New Orleans, LA
Ernest N. Morial Convention Center
Master Class (MCO3) Five Steps to Effective Financial Management
Senior Instructor: Sara Burns Rapuano, MBA, OCS, CPC
Co-instructors:
Arvind Saini, MD, MBA, AAOE Board Member

AAOE 2021 | Master Class Presenters
Sara Burns Rapuano, MBA, CPC, COE, OCS Senior Vice President of RCM Services at Eye Health America Sara Burns Rapuano has been involved in ophthalmology practice management for over 25 years. The first 20 of those years were spent at Wills Eye Hospital in Philadelphia working with physician practices as well as ASCs. In addition to the day-to-day financial and operational management issues, she has experience in implementation of practice management software and electronic health records, medical coding and compliance, third-party payer contracting, and medical practice consolidation. She is currently the SVP of Revenue Cycle Management for Eye Health America. She has lectured both locally and nationally on operational and reimbursement issues.
Arvind Saini, MD, MBA Integrity Eye — Managing Partner AAOE Board Member Dr. Arvind Saini is a comprehensive ophthalmologist and cornea specialist. He was inspired to be an ophthalmologist by his grandmother, who underwent cataract surgery and a corneal transplant when he was a child. Growing up, he was also influenced by an ophthalmologist in his community who established an international charitable hospital, something he aspires to do. Dr. Saini is an assistant professor at Loma Linda University and has authored articles in ophthalmology. In addition to clinical medicine, he has a natural interest in management and organizational development. He was an ophthalmology medical director for a regional IPA and was the president of a multispecialty medical group. Most recently, after working in multiple private practice settings, he founded Integrity Eye, which is a private practice in Southern California. He was selected to the Leadership Development Program of the AAO and has served on the technology committee of the AAO. He currently serves on the AAO Young Ophthalmologist committee, Product Advisory committee, and board of directors of the American Academy of Ophthalmic Executives (AAOE). He also is on the board of directors of the San Diego Eye Bank, board of the California Academy of Eye Physicians and Surgeons, and is an OMIC committee member.
Dr. Saini feels privileged to be an ophthalmologist and to help people see and educate his patients on eye health. In his free time, he enjoys playing tennis, golf, gardening, and spending time with his family.

POWERPOINT SLIDES

Five Steps to Effective Financial ManagementSara Rapuano, MBA, OCSArvind Saini, MD, MBA

Financial DisclosureWe have no financial interests or relationships to disclose relative to this topic.
Sara Burns Rapuano, MBA, OCSSVP of Revenue Cycle ManagementEye Health America
Arvind Saini, MD, MBAOphthalmologist and Practice OwnerIntegrity Eye

Course OutlineBenchmark monthly revenue targets by doctor, by location and by specialty.Benchmark
Identify your biggest revenue drivers through strategic analysis.Identify
Re-Evaluate your financial accounting chart of accounts.Re-Evaluate
Implement straight-forward cost accounting principles into your financial system.Implement
Set smart achievable goals informed by revenue and costs.Set

Benchmark To compare is to improve.

Why Benchmark?In Gregory Feltenberger’s book Benchmarking Success*, he points out two key principles of benchmarking:
• If you don’t measure it, you can’t manage it and
• If you don’t value it, you won’t change it.
*Feltenberger, Gregory S. Benchmarking Success, MGMA Publisher. 2017

Why Benchmark?Feltenberger goes on to point out that
• without the measurement being clearly understood by the practice key stakeholders, it will be hard to get buy in for any proposed changes.
• We as managers need to convey the value that can be realized if we make a proposed change in our operations.

Why do we measure KPIs and benchmark?
To provide a deeper understanding of where your
practice is.
To help you establish where you want to go.
To provide the information to help you plan how to get there.

Benchmarking and Lean Principles
Benchmarking helps us identify waste.
Benchmarking gives us actionable data to
reduce wastes.
It is critical to present your benchmarking data in a clear and concise
manner to help engage the staff and physicians in change management.
It is also critical to highlight reasons you might not meet your target benchmarks.

Lean Principles
TransportationInventory
MotionOver
ProcessingDefects
Waiting
Over Production
Human Talent

“An organization’s ability to learn, and translate that learning into action rapidly, is the ultimate competitive advantage.”
– Jack Welch

Benchmark• Monthly revenue by doctor• Monthly revenue by type of service

Revenue Trends – By Physician
$650,000
$921,000
$579,000
$0
$200,000
$400,000
$600,000
$800,000
$1,000,000
Comparative Payments YTD
Doctor 1
Doctor 2
Doctor 3 $0$10,000$20,000$30,000$40,000$50,000$60,000$70,000
Doctor 1 - Payment Trend
$0$20,000$40,000$60,000$80,000
$100,000
Doctor 2 - Payment Trend
$0$10,000$20,000$30,000$40,000$50,000$60,000$70,000$80,000
Doctor 3 - Payment Trend

Revenue Trends – Type of Service
$0$50,000
$100,000$150,000$200,000$250,000$300,000
Visit Revenue Trend
Doctor 1
Doctor 2
Doctor 3
All
$0$10,000$20,000$30,000$40,000$50,000$60,000$70,000$80,000$90,000
Billable Meds Revenue Trend
Doctor 1
Doctor 2
Doctor 3
All
$0$20,000$40,000$60,000$80,000
$100,000$120,000
Procedure Revenue Trend
Doctor 1
Doctor 2
Doctor 3
All
$0$100,000$200,000$300,000$400,000$500,000
Total Revenue Trend
Doctor 1
Doctor 2
Doctor 3
All

IdentifyIdentify your biggest revenue drivers through strategic analysis.

Operational Revenue Drivers
Patient volumePayor mix of patientsService Type
Services provided to each patient
Charge capture and coding processes
Operational Drivers
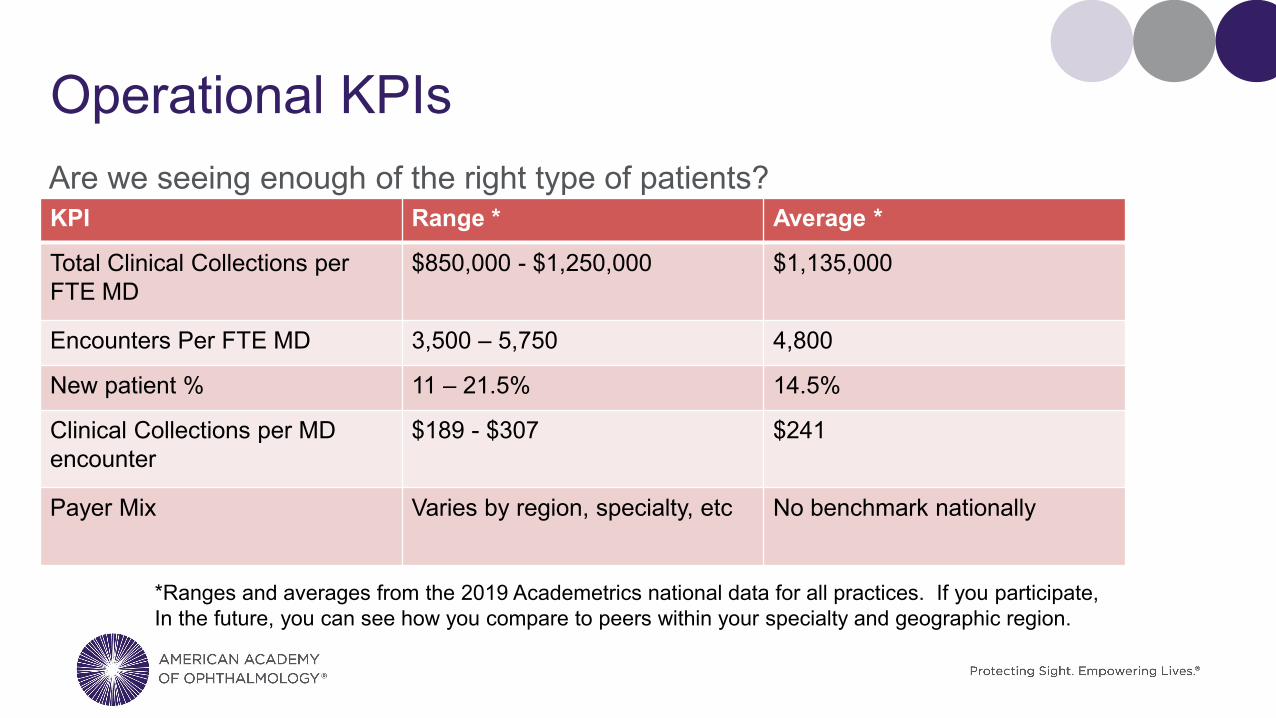
Operational KPIsAre we seeing enough of the right type of patients?KPI Range * Average *
Total Clinical Collections per FTE MD
$850,000 - $1,250,000 $1,135,000
Encounters Per FTE MD 3,500 – 5,750 4,800
New patient % 11 – 21.5% 14.5%
Clinical Collections per MD encounter
$189 - $307 $241
Payer Mix Varies by region, specialty, etc No benchmark nationally
*Ranges and averages from the 2019 Academetrics national data for all practices. If you participate, In the future, you can see how you compare to peers within your specialty and geographic region.

RCM Revenue Drivers
o Patient financial clearance effectiveness
o Time of service collection effectiveness
Pre-Visit Real-Time Post-Visit
o Rejection managemento Claims denial
managemento AR collection follow upo Patient statement and
collection process
o Claims scrubbing and submission process effectiveness
o Payment posting accuracy
Revenue Cycle Management

RCM KPIsAre we collecting efficiently and effectively for the services provided? You can break down these KPIs by payer or financial class
KPI Range AverageA/R Days Outstanding (Charge capture lag + bill lag + payment lag + posting lag)
18-32 days* 24*
Gross Collection Rate (% is dependent upon your fee schedule)
Stable or improving ratios
Stable or improving ratios
Net collection rate for Medicare - (lower rates are indicative of coding errors)
89- 100% 98%
AR over 90 days (Net of credits) 12-15%**Bad Debt % - Only meaningful if you have a bad debt write off policy (demonstrates front end financial clearance effectiveness)
N/A N/A
*. Ranges and averages from the 2019 Academetrics national data for all practices.** The Physicians Billing Process benchmarks. Reference at the end of presentation

RCM Cost to Collect is Also CriticalEmployee Indicators BenchmarkClaims per back end billing employee (This includes: ins F/U, denial management, pat acct resolution, refunds, payment posting and cash management, claims submission and management
10,000
Collections per FTE Billing Staff (Varies depending upon how much self pay services are provided)
$1,137,000 - $1,872,000 Range
$1,450,000
Billing Staff Payroll Ratio 2.00%-4.00% Range 2.8%

Payer Mix Liquidation AnalysisPayer % Charges %Accounts Receivable Liquidations RateMedicare 45% 20% FasterMedicare Advantage 20% 28% SlowerBlue Shield 15% 10% FasterOther Commercial 15% 30% SlowerMedicaid 3% 8% SlowerWorkman’s Comp 2% 4% Slower

Practice Efficiency RatiosKPI Range* Average*Clinical Operating expense as a % of Net Collections (OH Ratio)
55% - 70% 60%
Clinical Operating Expenses per Encounter
$105 - $165 $125
Staff Payroll Ratio = Total non-provider payroll/total collections
20%-28% 24%
FTE Staff per FTE Provider 4-7 5.8
*Ranges and averages from the 2019 Academetrics national data for all practices. If you participate, In the future, you can see how you compare to peers within your specialty and geographic region.

IdentifyCan we make the identify function more automated?

Manual/Excel Reporting vs. BI Technology• Manual reporting involves downloading data from our practice management
systems and manipulating it in an Excel format. o If it requires too much work and manipulation you have room for error and room for it to
take a back seat to other initiatives.
• Business Intelligence (BI) Technology is technology that generates that intelligence for you. o Many PM systems have Bi technology “bakes in” to the software. NextGen Financial Analytics ModMed Financial dashboards Microsoft Power BI is available to all who own Microsoft Office

What is Microsoft Power BI?

Power BI – AR Balances

Power BI – Revenue Cycle Management Values

Power BI – New and Established

Power BI- Charge Details

ModMed Dashboard

ModMed Dashboard

Re-EvaluateRe-Evaluate your financial accounting chart of accounts.

Financial Accounting• Financial accounting is historical
accounting-a period of time o We are recording what has been done.
• A good bookkeeper can accurately record financial transactions.
• We can have very accurate financial accounting and still lack the data that we need to manage our practice finances and make sound financial decisions

Financial Accounting• We use financial accounting information to:
o Make sure we have enough money in the bank to meet payroll and pay vendor billso Record our income and expenses for preparation of tax returns. Record assets on the balance sheet to be depreciated
o Demonstrate our financial health if we are applying for a loan. o Can track monthly income statements identify changes in revenue Identify trends in expenses and expense categories
o The cash flow statement can summarize all of our cash in and cash out expenses

Financial Accounting Basic Terms• Chart of accounts
• Assets
• Liabilities
• Income
• Expense
• Cash accounting vs. accrual accounting
• Journal entry

Chart of Accounts – Assets• Bank accounts (checking and savings)
• Accounts receivable
• Inventory o retinal injectionso CXL medicationso Botoxo Amniotic membranes
• Furnishings
• Medical and computer equipment

Chart of Accounts – Liabilities
Current Liabilities
• Credit cards due• Accounts payable to
vendors• Payroll due• Payroll and
corporate taxes due
Non-Current Liabilities
• Equipment loans• Line of credit• lease due

Chart of Accounts – Revenue
Other Revenue
Supplies sold (AREDs vitamins, tears, Medibeads, etc.)Legal review fees
Revenue
Patient visit revenuePatient surgery revenueBillable medication revenueMedical records feesResearch revenue

Managerial Accounting• Managerial accounting is the process of
identifying, measuring, analyzing and using financial information to help make prospective management decisions.
• If we know what drives our revenue and expenses, we can make effective decisions to help drive our revenue up and our expenses down.
• This is the Big Data of practice management.
Strategic Decisions
AR management
Cash Flow Analysis
Fixed Costs, Variable Costs, &
Overhead
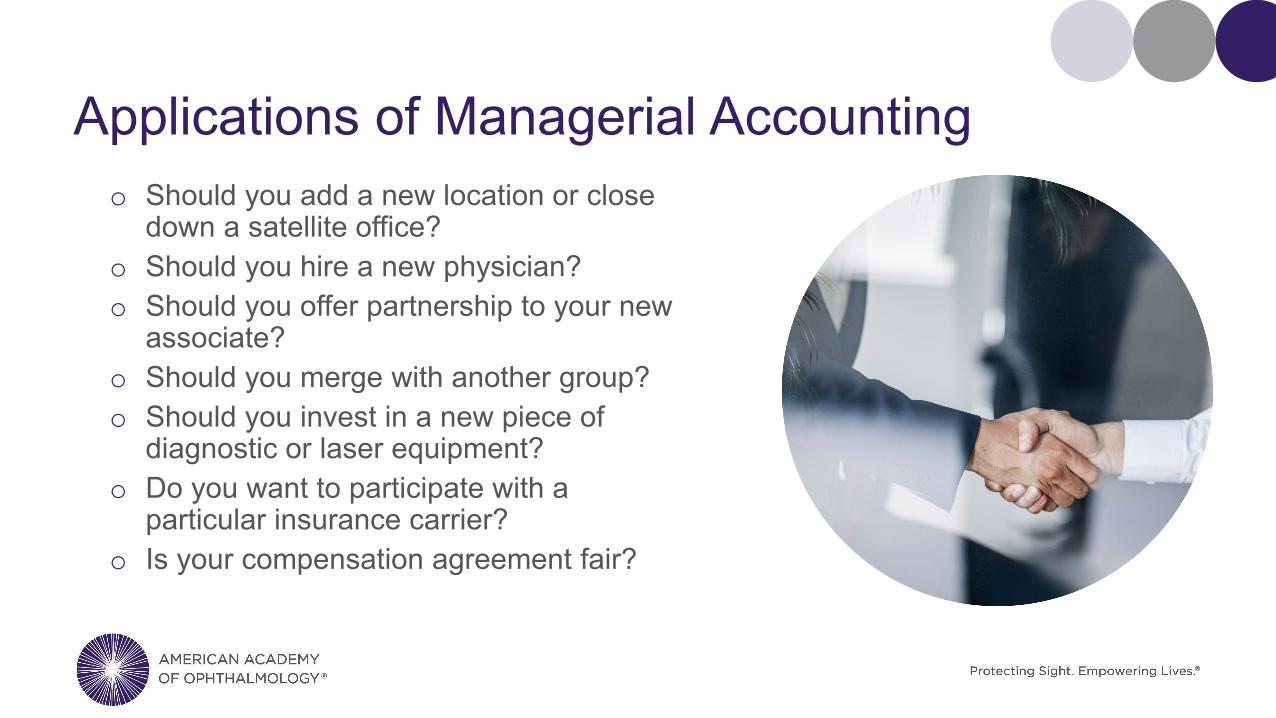
Applications of Managerial Accountingo Should you add a new location or close
down a satellite office?o Should you hire a new physician?o Should you offer partnership to your new
associate?o Should you merge with another group?o Should you invest in a new piece of
diagnostic or laser equipment? o Do you want to participate with a
particular insurance carrier?o Is your compensation agreement fair?

ImplementHow can we implement straight-forward cost-accounting principles into your financial accounting system

Cost Accounting Basic• Identify what cost centers you want to track.
o Physicianso Locationso Specialtieso Opticalo Part B Drugs
• We are trying to create an effective income statement for whatever you define as your cost centers. o We need to identify costs that should be allocated or “accounted” to each cost center.o We need to define an allocation method for each of those costs.

Chart of Accounts – Expenses• Rent (potentially by location)
• MD salary
• Staff Salary (potentially by location or by category)
• Employer portion of payroll taxes
• Benefitso Health Insuranceo Dental insurance
• 401K Match funding
• Medical supplies - billable
• Medical supplies – not billable
• Office supplies (by location)
• Dues and fees (by MD)
• Travel and entertainment (by MD)
• Outside services

Expense Categories and Cost Centers• Sub Accounts would allow you to breakdown the rent by location as you pay the bills. Such as:
o Rent – Location 1o Rent – Location 2o Rent - Location 3
• A “class” in QuickBooks or cost center would allow you to reclass or allocate an item to a cost center either as the bill is paid or at month end. o Avastin - Class assigned for each physiciano Lucentis - Class assigned for each physiciano Eyelea - Class assigned for each physician
• These cost centers will allow us to create an income statement for each cost center.

Fixed vs. Variable Costs• Fixed expenses are those that will cost you the
same amount each month whether you see 1 patient or 1,000 patients.
• Variable expenses are those that increase with patient volume.
• Many expenses are fixed for a range of service volume.
• Understanding what drives an expense is the first component in determining how to allocate that expense.

Examples: Fixed vs. Variable CostsCost Fixed or Variable
Rent Fixed within a range of servicesEquipment Fixed with a range of servicesTechnician payroll and benefits Variable
Admin payroll and benefits Fixed within a range of servicesMedications – billable VariableMedication – non billable VariableOffice supplies VariableBilling services Variable if contracted out/fixed within a range if
in houseSupport services (IT, legal, payroll, accounting) Fixed within a range of services
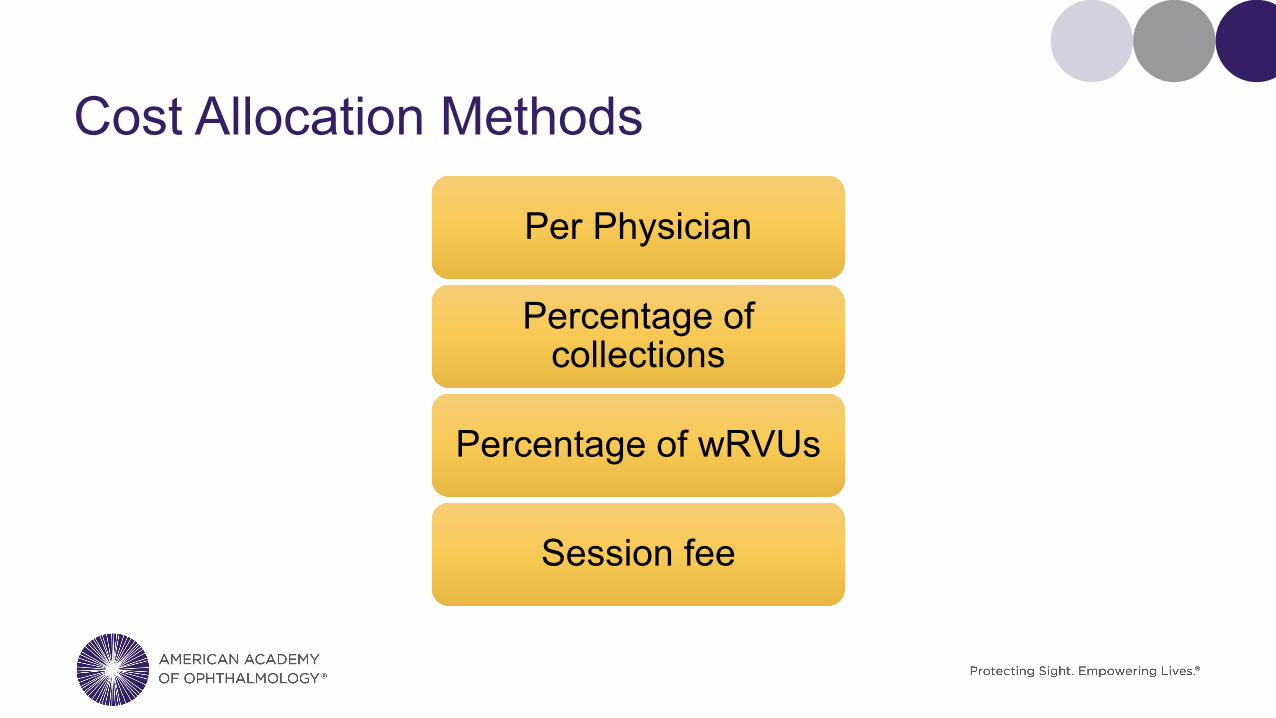
Cost Allocation Methods
Per Physician
Percentage of collections
Percentage of wRVUs
Session fee
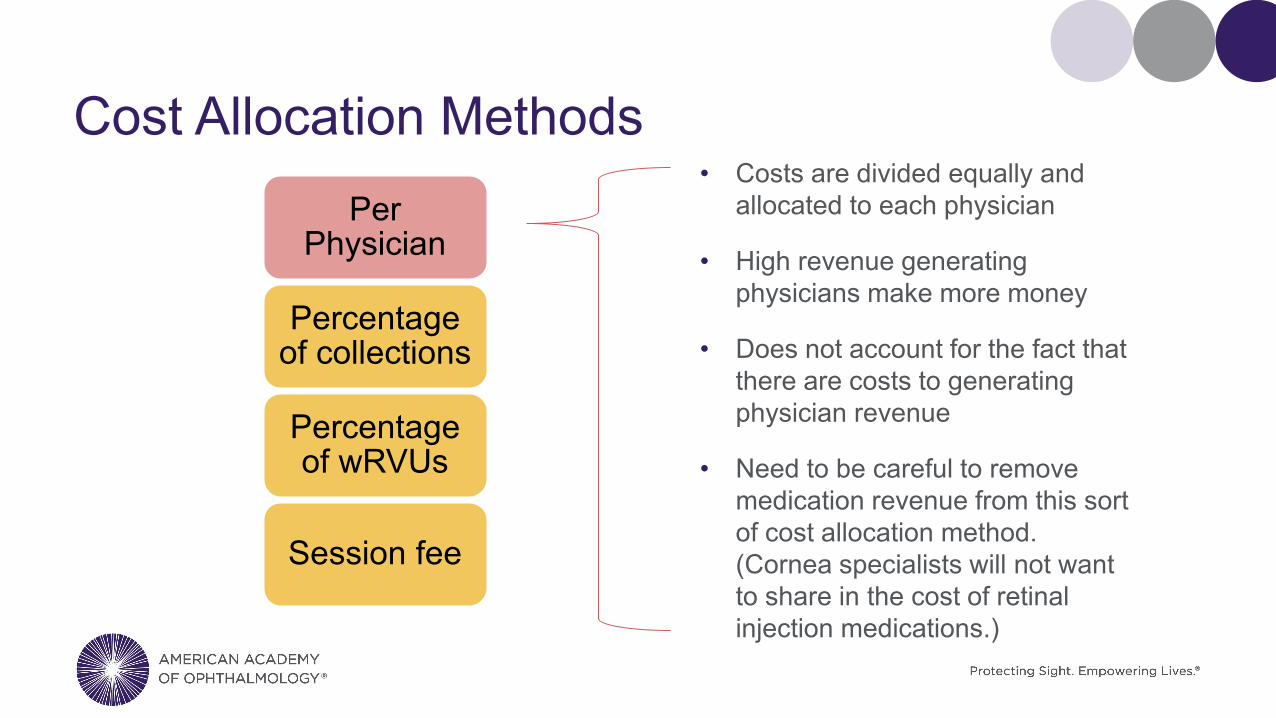
Cost Allocation MethodsPer
Physician
Percentage of collections
Percentage of wRVUs
Session fee
• Costs are divided equally and allocated to each physician
• High revenue generating physicians make more money
• Does not account for the fact that there are costs to generating physician revenue
• Need to be careful to remove medication revenue from this sort of cost allocation method. (Cornea specialists will not want to share in the cost of retinal injection medications.)

Cost Allocation MethodsPer
Physician
Percentage of collections
Percentage of wRVUs
Session fee
• Calculate the percentage of revenues generated by each physician
• Use that same percentage to allocate costs
• Does not contemplate varying uses of space, equipment, supplies, among specialties, etc.
• Does not contemplate varying costs for varying types of services
• Need to be careful to remove medication from this sort of cost allocation method
• Effectiveness of collections impacts how each MD bears costs

Cost Allocation MethodsPer
Physician
Percentage of collections
Percentage of wRVUs
Session fee
• Calculate the percentage of work relative value units produced by each physician
• Use that same percentage to allocate costs
• Eliminates potential payer mix issues. A Blue shield visit and a Medicaid visit consume the same amount of resources.
• Effectiveness of collections does not impact supply usage.
• Some procedures do not have RVUs assigned – may need to impute them.

Cost Allocation MethodsPer
Physician
Percentage of collections
Percentage of wRVUs
Session fee
10 exam lanes divided into 2 PODs, half day session, 20 working days
= 80 sessions available, 60 Session scheduled, Rent =$18,000
Option 1
$18,000/80 = $225 per session allocated by usage and remainder assigned to overhead
Option 2
$18,000/60 = $300 per session allocated by usage

Use Cost Drivers to Allocate Expenses Expense Cost Driver Allocation MethodologyRent and equipment Space utilization Session rateAdmin payroll and benefits Semi-fixed Per physician vs % of patient
service revenueTechnician payroll and benefits Utilization/Space utilization Hourly based on use vs % of
patient service revenueMedication – billable (retinal injections, Botox, Photrexa)
Utilization Allocate based upon usage
Medication Non Billable Space utilization Session rateBilling services Patient service/type of service % of revenueSupport services (IT, legal, accounting, payroll)
Semi-fixed Per physicians vs % of patient service revenue

Uses for Cost Allocation• If I am trying to ascertain if it is cost effective to maintain a satellite office, I
would allocate the revenue and costs by location, and effectively create a income statement for each location.
• If I were trying to redesign my compensation agreement, I would allocate the revenue and costs by MD and demonstrate the net revenue per MD and compare that to the current income division.
• If I am using it effectively, these cost center income statements provide internal benchmarking tools.
• I can calculate all my KPIs by location or specialty or MD or type of service and find the best comparisons in the Academetrics database. .

Operationalizing Your Cost Centers
You may want to create an excel spreadsheet for
analysis
You may be able to use
Quickbooks (or other financial software) to
perform much of the analysis
Suggest you use the cost centers which
drive your compensation
agreement in your financial accounting
software and use excel spreadsheets for other
cost center analysis

Costs and Strategic Decision Making • Strategic decisions which demand an understanding of cost structure.
o If we are hiring a new physician and trying to see the impact on the practice revenue, we are only looking to see additional revenue less additional expenses.
o If we are adding a diagnostic testing service and we have capacity in building and staffing to absorb the additional work, we may be calculating a breakeven point based primarily on the cost of the equipment, whereas if we are adding a large and labor intensive diagnostic test, we may need to add those costs to the analysis.
• Understanding your cost drivers is a valuable tool to smart decision making.

Fixed vs. Variable Costs – Adding New MD• If you have high fixed costs and unused capacity, the breakeven on adding a
new physician is low.
• Fixed assets get distributed over more doctors, so each doctor becomes more profitable.
• There are many other considerations, such aso Are there enough patients to support the new physiciano Is there enough administrative and tech staff to support the new physician, and if not, how
much will this cost.

QuickBooks Tip for Record Revenue


Journal Entry for Reclassing Revenue
Assign a class to all revenue items

QuickBooks Tips – Recording Expenses• As you pay vendor bills, assign the categories and cost centers (Classes) according to what you want
to tracko Rent and equipment leases – record with unassigned class and distribute at month end. o Intravitreal injections – by inventory item, and unassigned class to be distributed to the MDs at
month end. o CME – By MD class as you pay invoices.o Travel and entertainment – by Md class as you pay invoiceso Credit cards – detail the categories of the bills paid. (Do not just put credit card payment) and add
class to travel and entertainment or dues and fees as appropriate. o Supplies – by location and then distribute to classes at month end. o In summary, use as much detail as possible when you pay the bills. This will reduce the month end
closing adjustment journal entries that will need to be made.

Journal Entry for Cost Allocation

Journal Entry for Recording Payroll As you record payroll, add full detail on the clinical departments which you need to track within the accounting system.


SetSet smart achievable goals informed by revenue and costs.

Achievable Goals• Re-examine your financial accounting chart of accounts to ascertain if you
can make cost accounting integral to your financial accounting books through some simple changes.
• Identify all the drivers of your practice revenue through analysis of trends
• Compare your trends with national benchmarks and highlight opportunities.
• Determine which cost allocation method should be used to distribute costs to your identified cost center.
• Create various scenarios and discuss with key staff members before changing your accounting system.

Cost Accounting Can Help• Should you open a new location?
• Should you hire a new physician?
• Should you purchase a new piece of equipment?
• Should you revise your compensation package?
• Should you outsource or insource RCM services?
• Should you get a new Pm system with all this revenue data and KPIs baked in?

“When you’re finished changing, you’re finished.”- Ben Franklin

Questions?

References • AAO Academetrics Data from 2019 – Benchmarks are available for free to
practices who report their own data
• Keegan, Deborah Walker and Woodcock, Elizabeth W., The Physicians Billing Process, 3rd Edition, 2016, MGMA.
• Feltenberger, Gregory S., and Gnashing, David N., Benchmarking Success: The Essential Guide for Medical Practice Managers, 2nd edition, 2017 MGMA.
