fixed income investor presentation may 2011 - ingenico · investors presentation - may 2011• 9....
TRANSCRIPT
Investors PresentationMay 2011
Investors presentation - May 2011• 2
Disclaimer
All forward-looking statements are Ingenico management’s present expectations of future events and are subject to a number of factors and uncertainties that could cause actual results to differ materially from those described in the forward-looking statements.
Investors presentation - May 2011• 3
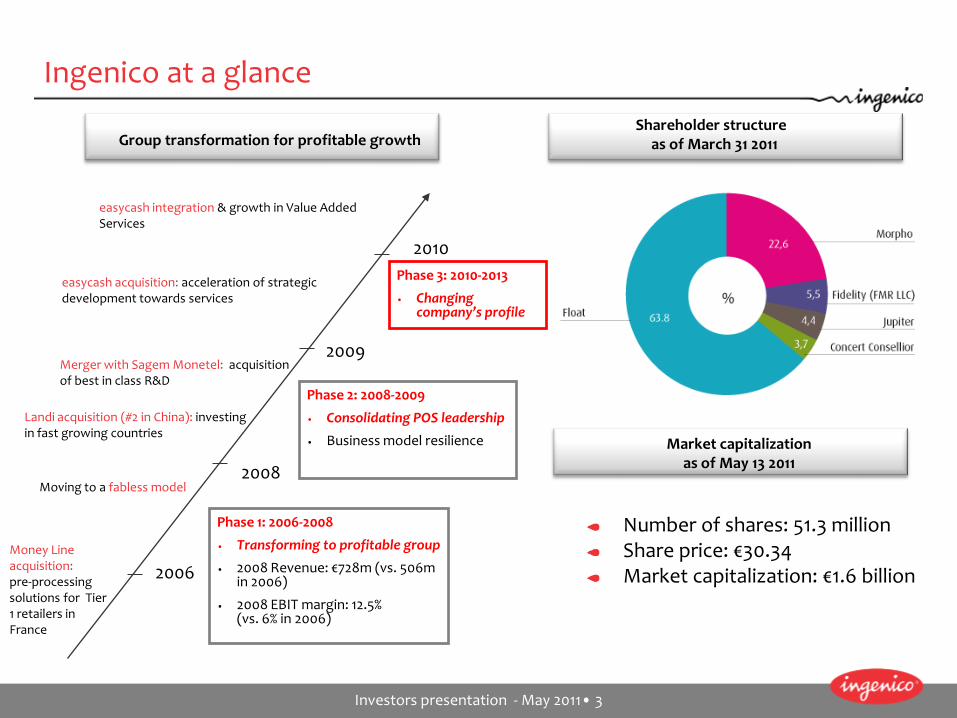
Ingenico at a glance
Number of shares: 51.3 millionShare price: €30.34Market capitalization: €1.6 billion
easycash acquisition: acceleration of strategic development towards services
Landi acquisition (#2 in China): investing in fast growing countries
Merger with Sagem Monetel: acquisition of best in class R&D
Money Line acquisition: pre-processing solutions for Tier 1 retailers in France
2009
2008
2006
Moving to a fabless model
2010
easycash integration & growth in Value Added Services
Phase 2: 2008-2009
• Consolidating POS leadership
• Business model resilience
Phase 1: 2006-2008
• Transforming to profitable group
• 2008 Revenue: €728m (vs. 506m in 2006)
• 2008 EBIT margin: 12.5% (vs. 6% in 2006)
Phase 3: 2010-2013
• Changing company’s profile
Group transformation for profitable growth Shareholder structure
as of March 31 2011
Market capitalization as of September 15 2010Market capitalization
as of May 13 2011
Investors presentation - May 2011• 4
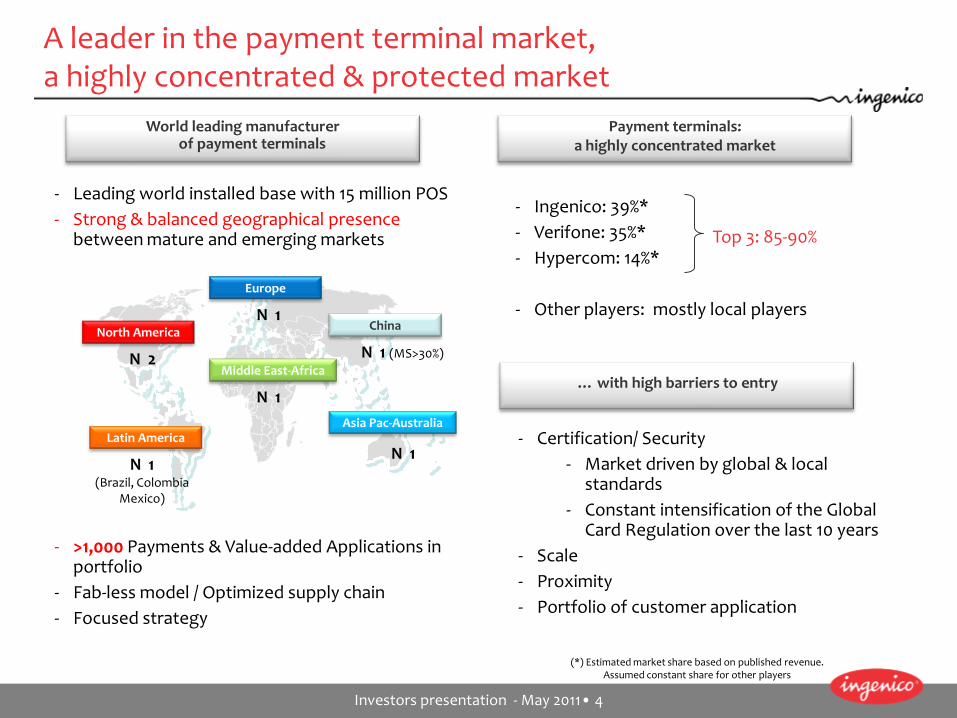
A leader in the payment terminal market, a highly concentrated & protected market
North America
Latin America
Europe
Middle East-Africa
China
Asia Pac-Australia
N 1(Brazil, Colombia
Mexico)
N 2
N 1
N 1
N 1
N 1 (MS>30%)
World leading manufacturer of payment terminals
Payment terminals: a highly concentrated market
… with high barriers to entry
- Certification/ Security- Market driven by global & local
standards- Constant intensification of the Global
Card Regulation over the last 10 years - Scale- Proximity- Portfolio of customer application
- Ingenico: 39%* - Verifone: 35%*- Hypercom: 14%*
- Other players: mostly local players
Top 3: 85-90%
(*) Estimated market share based on published revenue. Assumed constant share for other players
- Leading world installed base with 15 million POS- Strong & balanced geographical presence
between mature and emerging markets
- >1,000 Payments & Value-added Applications in portfolio
- Fab-less model / Optimized supply chain- Focused strategy
Investors presentation - May 2011• 5
Serving a worldwide blue-chip customer base
Major financial institutions and merchants are using our products and solutions all over the world (in more than 100 countries). Dual vendor policy
Our blue chip customer base includes banks, processors & acquirers, merchants, integrators, and services providers
More than 100,000 small merchants directly managed in France and Germany
Investors presentation - May 2011• 6
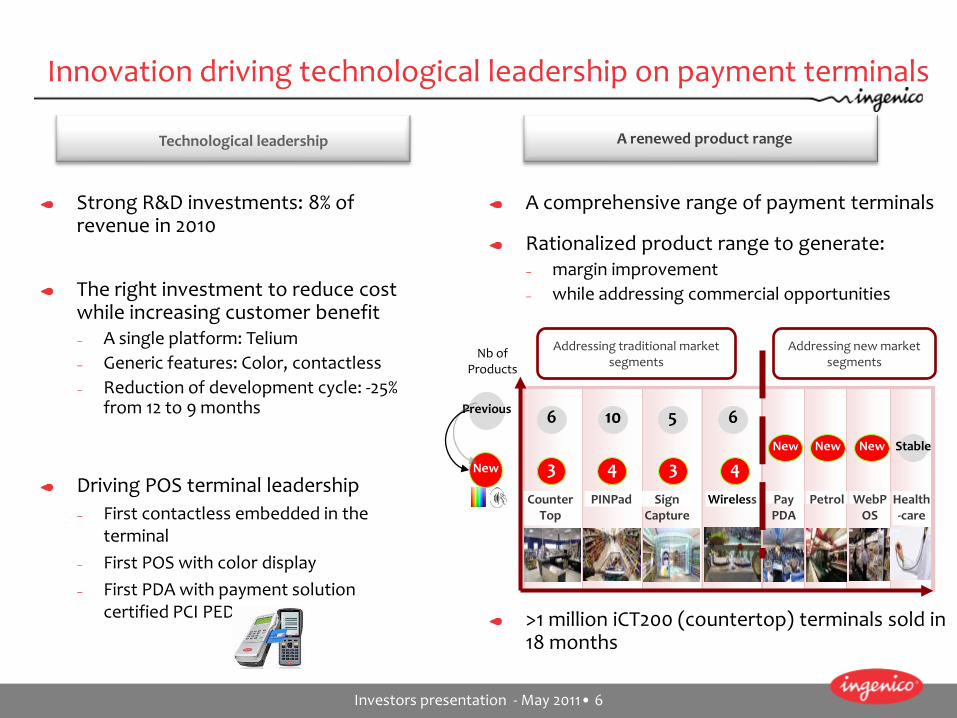
Innovation driving technological leadership on payment terminals
Strong R&D investments: 8% of revenue in 2010
The right investment to reduce cost while increasing customer benefit– A single platform: Telium– Generic features: Color, contactless– Reduction of development cycle: -25%
from 12 to 9 months
Driving POS terminal leadership– First contactless embedded in the
terminal– First POS with color display– First PDA with payment solution
certified PCI PED
A comprehensive range of payment terminals
Rationalized product range to generate:– margin improvement– while addressing commercial opportunities
>1 million iCT200 (countertop) terminals sold in 18 months
Counter Top
WirelessSign Capture
Pay PDA
WebPOS
Health-care
Petrol
Addressing traditional market segments
Addressing new market segments
PINPad
6
3
10
4
5
3
6
4New NewNew Stable
Previous
Nb ofProducts
New
Technological leadership A renewed product range
Investors presentation - May 2011• 7
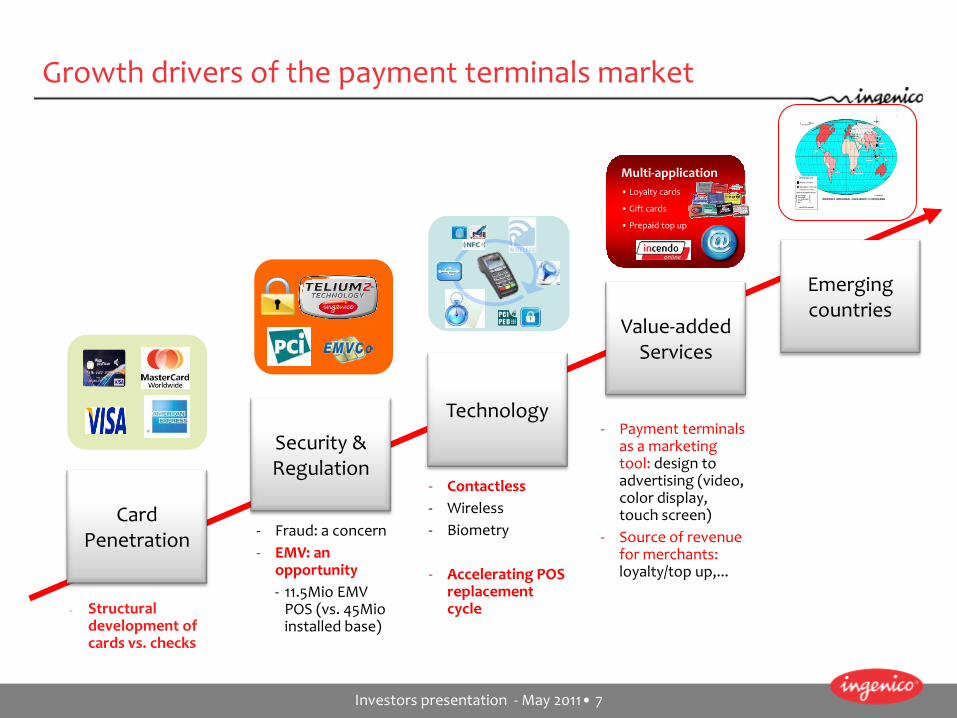
Emerging countries
Technology
Card Penetration
Multi-application• Loyalty cards
• Gift cards
• Prepaid top up
Value-addedServices
Security &Regulation
Growth drivers of the payment terminals market
- Fraud: a concern- EMV: an
opportunity- 11.5Mio EMV
POS (vs. 45Mio installed base)
- Contactless- Wireless- Biometry
- Accelerating POS replacement cycle
- Payment terminals as a marketing tool: design to advertising (video, color display, touch screen)
- Source of revenue for merchants: loyalty/top up,...
- Structural development of cards vs. checks

Investors presentation - May 2011• 8
Emerging markets & urbanization drive growth
Increased middle class with access to financial services
Governments pushing for tax collection
avg. 2 terminals p. 1,000 inh.
avg. 24 terminals p.1,000 inh.
Source: Euromonitor / IMF
Mature Payment Countries
Emerging Countries
Num
ber o
f PO
S te
rmin
als p
er ‘0
00 p
eopl
e
Emerging countries as key sources of growth
Investors presentation - May 2011• 9
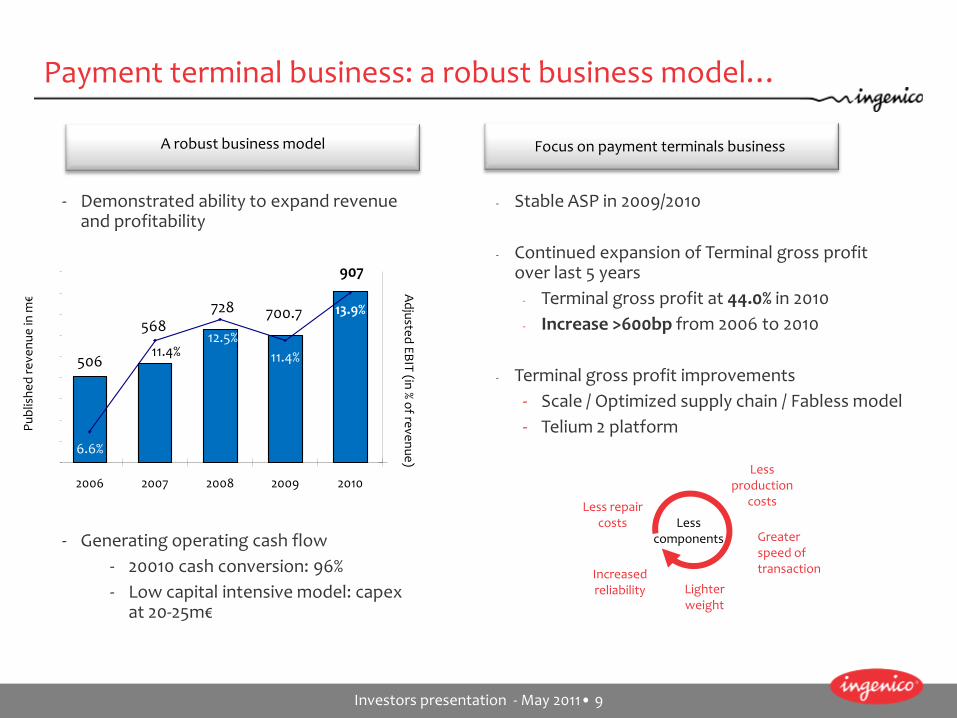
Payment terminal business: a robust business model…
- Stable ASP in 2009/2010
- Continued expansion of Terminal gross profit over last 5 years
- Terminal gross profit at 44.0% in 2010- Increase >600bp from 2006 to 2010
- Terminal gross profit improvements- Scale / Optimized supply chain / Fabless model- Telium 2 platform
A robust business model Focus on payment terminals business
Less components Greater
speed of transaction
Lighter weight
Increased reliability
Less production
costsLess repair costs
- Demonstrated ability to expand revenue and profitability
- Generating operating cash flow- 20010 cash conversion: 96%- Low capital intensive model: capex
at 20-25m€
506
568728 700.7
907
6.6%
11.4%12.5%
11.4%
13.9%
5%100
200
300
400
500
600
700
800
900
1000
2006 2007 2008 2009 2010
Publ
ishe
d re
venu
e in
m€ A
djusted EBIT (in % of revenue)
Investors presentation - May 2011• 10
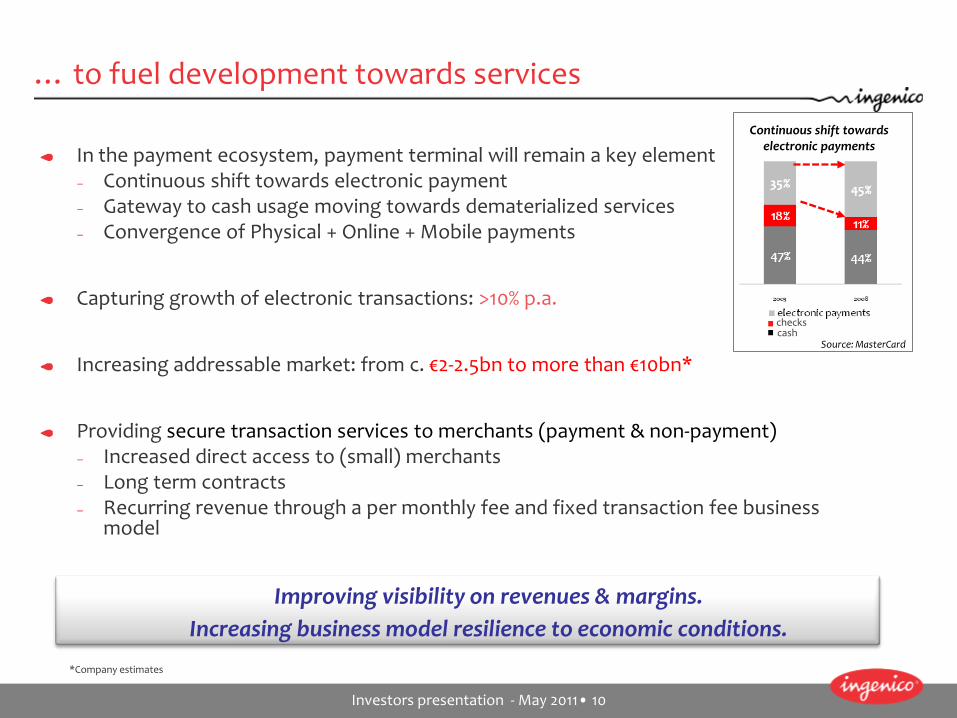
… to fuel development towards services
In the payment ecosystem, payment terminal will remain a key element– Continuous shift towards electronic payment– Gateway to cash usage moving towards dematerialized services– Convergence of Physical + Online + Mobile payments
Capturing growth of electronic transactions: >10% p.a.
Increasing addressable market: from c. €2-2.5bn to more than €10bn*
Providing secure transaction services to merchants (payment & non-payment)– Increased direct access to (small) merchants– Long term contracts – Recurring revenue through a per monthly fee and fixed transaction fee business
model
Improving visibility on revenues & margins.Increasing business model resilience to economic conditions.
Continuous shift towards electronic payments
checkscash
Source: MasterCard
*Company estimates

Investors presentation - May 2011• 11
Ingenico in the electronic payment value chain
POS terminal marketMarket Transaction services VAS Financial institutions
mostly
Value chain Hardware Terminal
servicesConnectivity Pre-
processing ProcessingValue-added
ServicesSettlement
Ingenico entities
Revenue type
Monthly fee
Monthly feeOne off Monthly
fee
% of transaction
in value
Monthly fee+ Fixed charge /
transaction
Fixed fee per
transaction
Merchant Services AcquirerProcessor VAS provider
Ingenico mostly provides POS terminals to either directly (large retailers) or indirectly (banks, distributors)
Revenue business model mostly relies on one off fees
Easycash operates payment & VAS services for merchants
Revenue business model relies on recurring revenue through a per transaction payment type of business
Investors presentation - May 2011• 12
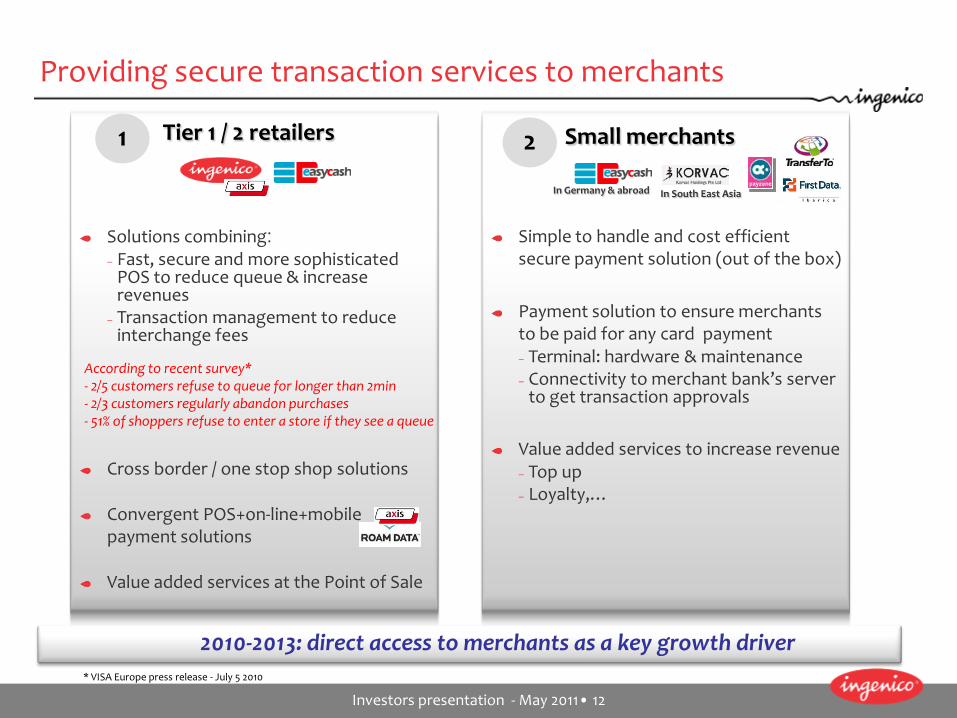
Providing secure transaction services to merchants
Tier 1 / 2 retailers
Solutions combining:– Fast, secure and more sophisticated
POS to reduce queue & increase revenues
– Transaction management to reduce interchange fees
Cross border / one stop shop solutions
Convergent POS+on-line+mobilepayment solutions
Value added services at the Point of Sale
1
According to recent survey*- 2/5 customers refuse to queue for longer than 2min- 2/3 customers regularly abandon purchases- 51% of shoppers refuse to enter a store if they see a queue
* VISA Europe press release - July 5 2010
Simple to handle and cost efficient secure payment solution (out of the box)
Payment solution to ensure merchants to be paid for any card payment– Terminal: hardware & maintenance– Connectivity to merchant bank’s server
to get transaction approvals
Value added services to increase revenue – Top up– Loyalty,…
Small merchants2
2010-2013: direct access to merchants as a key growth driver
In Germany & abroad In South East Asia
Investors presentation - May 2011• 13
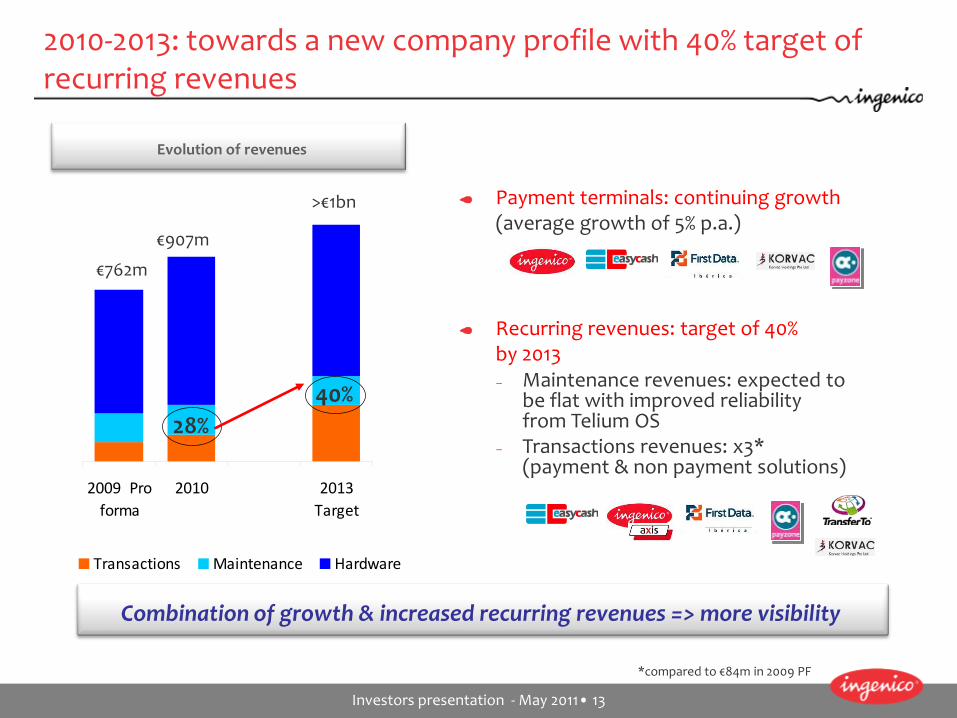
Payment terminals: continuing growth (average growth of 5% p.a.)
Recurring revenues: target of 40% by 2013– Maintenance revenues: expected to
be flat with improved reliability from Telium OS
– Transactions revenues: x3* (payment & non payment solutions)
Combination of growth & increased recurring revenues => more visibility
2010-2013: towards a new company profile with 40% target of recurring revenues
2009 Proforma
2010 2013Target
Transactions Maintenance Hardware
*compared to €84m in 2009 PF
>€1bn
€762m
40%28%
Evolution of revenues
€907m
Investors presentation - May 2011• 14
2010: an outstanding year
Strong top line growth– 2010 revenue: €907.0m– Year-on year: +29%– Like-for-like: +10%
… while significantly fueling profitability & demonstrated operating leverage– Adjusted current operating income*: 13.9% (+250 basis points)– EBITDA margin at 18.3%– Doubled net operating cash flow to €158.9m– Strong cash conversion driven by operating leverage and tight
management of working capital
Paving ground to accelerate 2013 strategic plan– Deployment of Telium2 platform – Successful integration of easycash– Targeted acquisitions in value-added services
*Adjusted current operating income is defined as adjusted profit from ordinary activities

Investors presentation - May 2011• 15
Management priorities for 2011: delivering our 2013 strategic plan
Terminals: maintain product leadership– iPA 280 (PayPDA) is taking off– Mobile POS (iWL) is clearly ahead of competition– Unattended range to capture market potential of vending machines
Transactions: enlarged offering and enhanced footprint– Front-end processing for Tier 1 retailers– Rolling out easycash internationally
– Obtained “institution payment” license in Q1’11– Opening at least 2 countries in 2011
– Capturing mobile payment emergence opportunities
VAS: developing and deploying integrated portfolio of services– Transfer To: capturing air time growth through new routes
Investors presentation - May 2011• 16
Q1 2011: a very good start of the year (1/2)
Sustained growth– Q1’11 revenue of: €204.9m (+18% year-on-year)– Like-for-like: +9%
Strong performance of both terminals (+6.4%*) and Transactions (+25%*)– Terminals: Specific market dynamics / More contactless, more mobile
terminals– Transactions: growth on all segments: development of AXIS solutions,
acquiring services in Germany and Value-Added-Services
Continuation of trends observed at the end of 2010– Very strong quarter in Latin America (Brazil) and Asia Pacific (China)– Asia Pacific: 2nd largest region for the second quarter in a row– Still a strong momentum in Europe SEPA (Spain, UK, France)– Activity down in EMEA & North America where low anticipated performance
was accentuated by an unfavorable basis of comparaison
* Before Price Purchase Allocation
Investors presentation - May 2011• 17
Q1 2011: a very good start of the year (2/2)
2011 revenue target revised upwards– Like-for-like revenue (at constant group perimeter & FX) ≥ 985m€ (as against
965-985m€)– Like-for-like growth: ≥ 6.3%
Continuous profitability improvement confirmed– Adjusted profit from ordinary activities* ≥ 13.9% – EBITDA: ≥ 18.3%
Enhanced financial flexibility– €250m raised through convertible bonds (OCEANE) due 1 January 2017
* Before Price Purchase Allocation

Investors presentation - May 2011• 18
Ingenico investment case
Investors presentation - May 2011• 19
Appendix
Investors presentation - May 2011• 20
Glossary
POS: Point of Sale / e-payment terminal
VAS: Value-added Services
SEPA: Single Euro Payment Area. 27 European Union members, Island, Liechtenstein, Norwayand Switzerland
Acquirer: financial institution responsible for the underlying transactions (authorization, clearing & settlement) with its merchant-customers
Issuer: Cardholder’s bank
Processor: a technical operator providing infrastructure to support acquirer functions, such as authorization, clearing and settlement services. In practice, acquirers outsourced merchant acquiring services to processor
PSP: A Payment Service Provider is a company performing all or part of electronic payment services and potentially including settlement as per Payment Service Directive in Europe. In the US, settlement is always performed by financial institutions
Scheme: provides a payments mechanism through the existing (debit or credit) card payment infrastructure
ISO: Independent Sales Offices
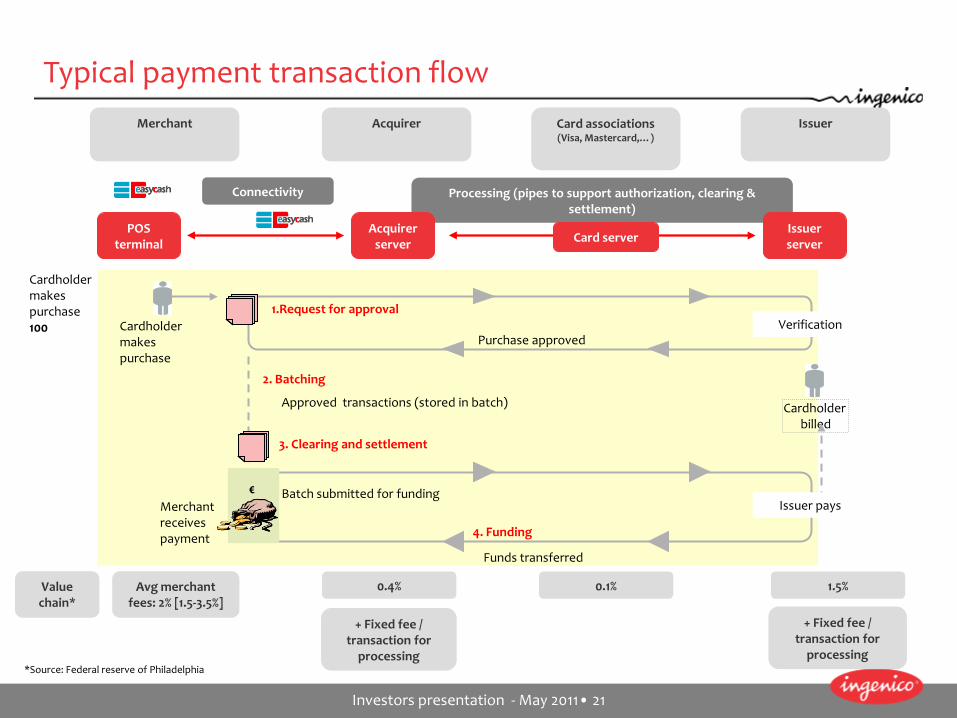
Investors presentation - May 2011• 21
Processing (pipes to support authorization, clearing & settlement)
Merchant
Connectivity
Acquirer server
Acquirer Card associations (Visa, Mastercard,…)
Issuer
Issuer server
POS terminal
Value chain*
Avg merchant fees: 2% [1.5-3.5%]
0.4% 0.1% 1.5%
+ Fixed fee / transaction for
processing
+ Fixed fee / transaction for
processing
Card server
Cardholder makes purchase100
2. Batching
3. Clearing and settlement
4. Funding
1.Request for approval
Purchase approvedCardholder makes purchase
Cardholder billed
Approved transactions (stored in batch)
Batch submitted for fundingMerchant receives payment
Funds transferred
Verification
€Issuer pays
Typical payment transaction flow
*Source: Federal reserve of Philadelphia

Investors presentation - May 2011• 22
Large customers
+ Fixed fee / transaction
easycash business model at a glance
Hardware Terminal services
Connectivity ProcessingValue-added
Services
Settlement
Merchant Services AcquirerProcessor
Small customers
OLV Visa ZKA
% of transaction in value (1.5-3.5%)*
One-off + monthly charge + fee
(based on volume)
One-off
Monthly rental fee
and and and and and
and/or
VAS provider
Monthly charge
Revenue type
and and and/orand/or or
or
N/A
N/A
Monthly (variable)
charge
Revenue type
*Source: Federal reserve of Philadelphia
One-off + monthly charge + fee
(based on volume)
% of transaction in value (1.5-3.5%)*
+ Fixed fee / transaction

Investors presentation - May 2011• 23
easycash integration accelerating the evolution towards services
2009 revenue at 2010
perimeter*
2009 revenue**
2009 combined revenue
One off & fee per month
Revenue business
model
One off & fee per transaction
15%
16%
22%
2009 EBITDA* margin
652 m€
* Excluding Sagem Danemark, Manison and Moneyline Business Systems starting January 1 2009** IFRS based revenue
20%
28%
84%
2009 Revenue * profile % of revenue
from services
17 m€
€762m
€93m
€669m
2009 Adj. EBIT margin
11%
17%
12%
TransactionServices
Hardware & Maintenance Services
€17m€652m
€67m€26m
€84m€678m