flash terb 140318-feedbackanalystmeeting
TRANSCRIPT

Ter Beke Belgium/ Food & Beverage Flash note
Produced by: Bank Degroof All ESN research is available on Bloomberg (“ESNR”),
Thomson-Reuters, Capital IQ, FactSet
Distributed by the Members of ESN (see last page of this report)
Investment Research
18 March 2014
Feedback from analyst meeting
Ter Beke (TERB) management hosted an analyst meeting in connection to the recent FY13 release. Below we summarise the topics that have been discussed.
We have fine-tuned our FY14e scenario and have reviewed our valuation upwards, which results in a new target price of EUR 65, upped from EUR 54 previously (see DCF valuation on page 6 in this report and cross-check based on peer group multiples on page 7). Given the 7% upside potential to our new TP, we are reviewing our recommendation from Reduce to Hold.
OK-ish FY13,… Ter Beke reported a FY13 top line of EUR 407.2m (-3.3%), in line with our expectations. REBITDA (EUR 30.8m) and REBIT (EUR 12.8m) have decreased 7.1% and 8.5% respectively, due a sharp decrease in ready meals sales (-15.2%, in decline as expected but still disappointing), while in processed meats turnover was marginally up (+0.4% or +EUR 1.3m) thanks to growth in the slicing and packaging activities. After net financing costs and taxes, the company posted a 24.5% decline of the bottom line to EUR 6.2m, 4.9% below what we had anticipated, but still OK.
… given the circumstances: TERB has been facing a perfect storm due to the combination of (i) a hesitating consumer that was increasingly buying cheaper products (in FY12, but also last year), (ii) increasing production costs in 2H12 and 1H13 (chiefly raw materials, energy and wages), (iii) the departure of the former CEO in early 1H13 and (iv) a sudden drop in demand for one of its main products (fresh lasagne) due to the horse meat crisis that started in 1Q13, which had consequences throughout the remainder of the year.
Vision of the new CEO Mr Goeminne, the company’s new CEO, has shared his view on the company and how he sees the company evolve. He elaborated about the strategic value drivers (customer intimacy, operational excellence, cost leadership, innovation), what are the relevant market and consumer trends (“living better for less”, “more older consumers and smaller households”, “health & wellness”, “fun & convenience”, “CSR & transparency”, “digitalisation”…) that are the inspiration for new innovation at the company.
Reasonably priced No wonder that after a period of challenging markets and consecutive crises, the TERB stock is rather cheaply valued at 10.3x FY15e earnings and an EV/EBITDA FY15e multiple of 4.8x. For FY14e comparables have become easier and investors should judge TERB first and foremost as a relatively resilient stock in a defensive sector with relatively stable sales of both of its divisions. We derive our new EUR 65 TP from a DCF valuation model, which is based on reasonable, but not overly bullish growth and profitability assumptions, cross-checked with peer group multiples.
Analyst(s):
Hans D’Haese +32 (0) 2 287 9223
Hold
61.00closing price as of 17/03/2014
65.0054.00from Target Price: EUR
from Reduce
Target price: EUR
Share price: EUR
Reuters/Bloomberg TERB.BR/TERB BB
Daily avg. no. trad. sh. 12 mth 304Daily avg. trad. vol. 12 mth (m) 18.49
Price high 12 mth (EUR) 61.01Price low 12 mth (EUR) 49.00Abs. perf. 1 mth 6.7%
Abs. perf. 3 mth 8.0%Abs. perf. 12 mth 22.9%
Market capitalisation (EURm) 106
Current N° of shares (m) 2Free float 25%
Key financials (EUR) 12/13 12/14e 12/15eSales (m) 407 429 440
EBITDA (m) 29 32 33
EBITDA margin 7.0% 7.4% 7.5%EBIT (m) 11 15 16
EBIT margin 2.6% 3.6% 3.6%Net Profit (adj.)(m) 6 9 10
ROCE 4.6% 5.9% 5.9%
Net debt/(cash) (m) 51 51 50
Net Debt Equity 0.5 0.5 0.5Net Debt/EBITDA 1.8 1.6 1.5
Int. cover(EBITDA/Fin.int) 18.5 29.5 30.3
EV/Sales 0.4 0.4 0.4
EV/EBITDA 5.3 5.0 4.8
EV/EBITDA (adj.) 5.4 5.1 4.9
EV/EBIT 14.2 10.3 9.9
P/E (adj.) 16.0 11.9 10.3
P/BV 1.0 1.0 1.0OpFCF yield 13.8% 3.8% 5.9%
Dividend yield 4.1% 4.2% 4.5%
EPS (adj.) 3.58 5.13 5.91
BVPS 57.42 60.02 63.18
DPS 2.50 2.53 2.74
44
46
48
50
52
54
56
58
60
62
Feb 13 Mar 13 Apr 13 May 13 Jun 13 Jul 13 Aug 13 Sep 13 Oct 13 Nov 13 Dec 13 Jan 14 Feb 14 Mar 14
vvdsvdvsdy
TER BEKE Stoxx Food & Beverage (Rebased)Source: Factset
Shareholders: COOVAN 65%; SRIW 5%; Seneca/LDB 3%; M6 2%;
For company description please see summary table footnote

Ter Beke
Page 2
Investment case
Main point of attraction : predictable business
We think that investors should judge TERB first and foremost as a relatively resilient stock in a defensive sector with relatively stable sales of both of its divisions: The chilled ready meals segment is the fastest growing. By 2018 market growth in volume should attain +18% and +13% in value. The European processed meats category, which accounts for 3m tonnes and over EUR 30bn is expected to grow by only 4% in volume by 2018. The value is even under pressure and should come out 1% lower by 2018. TERB’s combination of the two segments has its merits. It combines stable REBIT from the processed meats division by slightly higher REBIT growth in fresh ready meals. The latter is more volatile than the former, though.
EBIT - Processed meats EBIT – Fresh ready meals
Source: Company data, ESN – Bank Degroof Research Source: Company data, ESN – Bank Degroof Research
Growth in Fresh ready meals
TERB agreed with the French Stefano Tosseli for the creation of a JV, which will commercialise lasagne and pasta meals throughout CEE. A production plant is being constructed in Opole-Poland. By Sep-14 the production is expected to ramp-up and we anticipate a first positive contribution to net result as of FY16 (equity consolidated). TERB has a call option on the part of the JV it does not own and on the French company Stefano Tosseli. Although it still is preliminary, we modelled the possible impact of the execution of this call option in 2018. TERB’s ready meals divisions accounts for c EUR 120m in sales. A rough estimate of the possible output of the JV and the Stefano Tosseli operations in France could add c. EUR 130m to this figure (x2). After exercise of the call option, on the EBIT level the ready meals division could even account for EUR 20m (vs. EUR 10m in FY12 and in EUR 5m in FY13). Of course, this is NOT yet included in our present scenario, but it is clear that the execution of the call option could boost the ready meals BU’s size dramatically.
Revival in FY14 after a perfect storm
TERB has been facing a perfect storm lately due to: (i) a hesitating consumer that was increasingly buying cheaper products (in FY12, but also last year), (ii) increasing production costs in 2H12 (raw materials, energy, wages…), (iii) the departure of the former CEO, and (iv) a sudden drop in demand for one of its main products due to the horse meat crisis in 1H13, with consequences until 2H13.
Attractively priced
No wonder that after a period of challenging markets and consecutive crises, the TERB stock is rather cheaply valued at 10.4x FY15e earnings and an EV/EBITDA FY15e multiple of 4.7x. The combination of attractive multiples and much easier comparables makes us more positive about the share price performance to be expected for the next few months.
We derive our new EUR 65 TP from a valuation that is blended from a valuation based on peer group multiples and a DCF valuation model, which is based on reasonable, but not overly bullish growth and profitability assumptions. At our EUR 65 TP in 12 months, the stock would be traded at 11.0x FY15e EPS and a FY15e EV/EBITDA multiple of 4.9x.
6.8 8.2 8.3 9.7 8.1 7.8 10.1 7.2 6.4 9.0
7.1%6.3%
4.1%
8.4%
3.0% 2.9%3.6%
2.6%2.2%
3.1%
0%
2%
4%
6%
8%
10%
12%
0
2
4
6
8
10
12
FY04 FY05 FY06 FY07 FY08 FY09 FY10 FY11 FY12 FY13
EBIT EBIT margin
7.7 5.0 3.7 5.3 7.9 10.8 10.4 10.5 10.1 4.6
7.4%
4.7%
3.1%
4.2%
6.4%
9.0%8.3% 8.1%
7.7%
3.9%
0%
2%
4%
6%
8%
10%
12%
0
2
4
6
8
10
12
FY04 FY05 FY06 FY07 FY08 FY09 FY10 FY11 FY12 FY13
EBIT REBIT margin
Ter Beke
Page 3
Comments on FY13 reporting
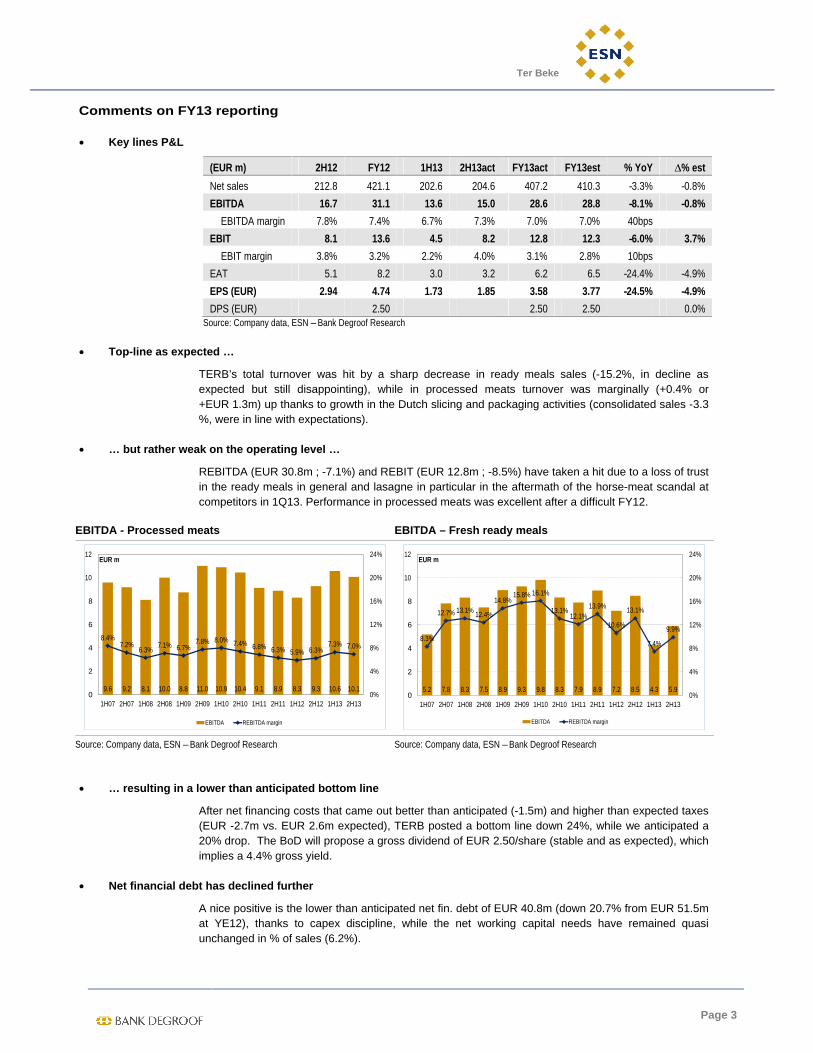
Key lines P&L
(EUR m) 2H12 FY12 1H13 2H13act FY13act FY13est % YoY % est
Net sales 212.8 421.1 202.6 204.6 407.2 410.3 -3.3% -0.8%
EBITDA 16.7 31.1 13.6 15.0 28.6 28.8 -8.1% -0.8%
EBITDA margin 7.8% 7.4% 6.7% 7.3% 7.0% 7.0% 40bps
EBIT 8.1 13.6 4.5 8.2 12.8 12.3 -6.0% 3.7%
EBIT margin 3.8% 3.2% 2.2% 4.0% 3.1% 2.8% 10bps
EAT 5.1 8.2 3.0 3.2 6.2 6.5 -24.4% -4.9%
EPS (EUR) 2.94 4.74 1.73 1.85 3.58 3.77 -24.5% -4.9%
DPS (EUR)
2.50
2.50 2.50
0.0% Source: Company data, ESN – Bank Degroof Research
Top-line as expected …
TERB’s total turnover was hit by a sharp decrease in ready meals sales (-15.2%, in decline as expected but still disappointing), while in processed meats turnover was marginally (+0.4% or +EUR 1.3m) up thanks to growth in the Dutch slicing and packaging activities (consolidated sales -3.3 %, were in line with expectations).
… but rather weak on the operating level …
REBITDA (EUR 30.8m ; -7.1%) and REBIT (EUR 12.8m ; -8.5%) have taken a hit due to a loss of trust in the ready meals in general and lasagne in particular in the aftermath of the horse-meat scandal at competitors in 1Q13. Performance in processed meats was excellent after a difficult FY12.
EBITDA - Processed meats EBITDA – Fresh ready meals
Source: Company data, ESN – Bank Degroof Research Source: Company data, ESN – Bank Degroof Research
… resulting in a lower than anticipated bottom line
After net financing costs that came out better than anticipated (-1.5m) and higher than expected taxes (EUR -2.7m vs. EUR 2.6m expected), TERB posted a bottom line down 24%, while we anticipated a 20% drop. The BoD will propose a gross dividend of EUR 2.50/share (stable and as expected), which implies a 4.4% gross yield.
Net financial debt has declined further
A nice positive is the lower than anticipated net fin. debt of EUR 40.8m (down 20.7% from EUR 51.5m at YE12), thanks to capex discipline, while the net working capital needs have remained quasi unchanged in % of sales (6.2%).
9.6 9.2 8.1 10.0 8.8 11.0 10.9 10.4 9.1 8.9 8.3 9.3 10.6 10.1
8.4%7.2%
6.3%7.1% 6.7%
7.8% 8.0% 7.4% 6.8% 6.3% 5.9% 6.3%7.3% 7.0%
0%
4%
8%
12%
16%
20%
24%
0
2
4
6
8
10
12
1H07 2H07 1H08 2H08 1H09 2H09 1H10 2H10 1H11 2H11 1H12 2H12 1H13 2H13
EUR m
EBITDA REBITDA margin
5.2 7.8 8.3 7.5 8.9 9.3 9.8 8.3 7.9 8.9 7.2 8.5 4.3 5.9
8.3%
12.7% 13.1% 12.4%
14.8%15.8% 16.1%
13.1%12.1%
13.9%
10.6%
13.1%
7.4%
9.9%
0%
4%
8%
12%
16%
20%
24%
0
2
4
6
8
10
12
1H07 2H07 1H08 2H08 1H09 2H09 1H10 2H10 1H11 2H11 1H12 2H12 1H13 2H13
EUR m
EBITDA REBITDA margin

Ter Beke
Page 4
Company description
In a nutshell:
Ter Beke is an innovating Belgian fresh food group that commercialises its range of products in 10 European countries. The group has 2 core activities: processed meats and fresh ready meals. It has 8 industrial plants in Belgium and the Netherlands, and employs approximately 1,750 staff.
Production plants
Belgium Netherlands Poland
Processed meats production
in Wommelgem and in Waarschoot
Service slicing & packaging of processed meats
in Wijchen and in Ridderkerk
Production plant for fresh lasagne
in Opole (50/50 JV, operational as of 2H14)
Service slicing & packaging of processed meats
in Veurne and in Wommelgem
Fresh pasta based ready meals
in Wanze and in Marche-en-Famenne
Source: Company data, ESN – Bank Degroof Research
Product & markets
Processed Meats Division (c. 70% of total sales)
Ter Beke’s processed meats division is active as a producer and slicer of processed meats for the Benelux, the UK and Germany.
This division operates 2 production sites in Belgium (Wommelgem and Waarschoot) and 4 centres for slicing and packaging of processed meats, of which 2 in Belgium (Wommelgem and Veurne) and 2 in the Netherlands (Wijchen and Ridderkerk), together employing about. 1,100 employees.
The main strength and growth driver of this division is that it is particularly innovating in the pre-packed processed meats segment.
Products are marketed by the use of both distribution brands and by its own brand names L’Ardennaise®, Pluma® and Daniël Coopman®.
Ready Meals Division (c. 30% of total sales)
This division produces fresh pasta-based ready meals for the European market.
It is market leader in chilled lasagne in Europe.
The division operates 2 production sites in Belgium (Wanze and Marche-en-Famenne), together employing approx. 650 employees.
Products are marketed by the brand names Come a casa® and Vamos®, in addition to distribution brands.
Ter Beke, together with its French competitor Stefano Tosseli, has established a JV in Poland in 2011, named The Pasta Food Company. The newly build plant in Opole-Poland will be operational by Sep-14 (delayed) and will serve to tackle the central and eastern European market with fresh lasagne.

Ter Beke
Page 5
Valuation
DCF valuation
Source: Company data, ESN / Bank Degroof Research
Our terminal value factor assumes an EBITDA margin of 7.3% and depreciation/sales & capex/sales of 3.9%. A target gearing (NFD/EV) of 35% might seem aggressive, but compares to a long term historical ratio of 40%. Other key parameters in our scenario are:
- A sales CAGR of 2.7% for the period 2013-2022, starting from a rather low comparison base given that FY13 sales in the Ready meals division have been hit due to the horsemeat crisis.
- A normalised EBITDA margin of 7.3% as of 2022. This compares to an average EBITDA margin obtained over the last three years (FY11 till FY13) of 7.5%. The average historical EBITDA margin over 2006-2013 (an 8 years period, chosen because of the addition of important service slicing activities in the Netherlands) amounts to 8.0%. As slicing and packaging are ever becoming more important in Ter Beke-Pluma’s product mix, we assume the lower margins should be applied in the future.
- An average capex to sales ratio of 4.5% from 2013 until 2022 (was 4.3% on average since 2006 and 4.8% when excluding 2013, a year of very limited capex because of the difficulties the company was struggling with). In this capex figure we also include the small acquisitions TERB has done over recent years (and we reckon it will do going forward).
- A normative tax rate of 29%.
- Value estimation of the associates:
- Given the ESN methodology, NOPLAT should be based on the operating result only and does not include the earnings contribution of the associates (The Pasta Food Company). Hence, the value of TERB’s stake in this JV, consolidated under the equity method, should be estimated separately. We applied the present P/BV TERB is trading at (0.9x) on the investment value.
CASH FLOW (EUR m) 2011 2012 2013 2014 2015 2016 2017 2018 2019 2020 2021 2022Net Sales 403.7 421.1 407.2 429.0 439.6 450.5 462.4 474.7 487.4 500.4 513.0 518.1
% change 0.4% 4.3% -3.3% 5.3% 2.5% 2.5% 2.6% 2.7% 2.7% 2.7% 2.5% 1.0%
EBITDA 33.2 31.1 28.6 31.8 32.9 33.3 33.9 35.6 36.3 36.9 37.4 37.7
% margin 8.2% 7.4% 7.0% 7.4% 7.5% 7.4% 7.3% 7.5% 7.4% 7.4% 7.3% 7.3%
% change -11.4% -6.3% -8.1% 11.3% 3.4% 1.2% 1.7% 5.2% 1.8% 1.8% 1.2% 1.0%
Depreciation & oth. prov. 17.9 17.6 18.0 16.5 17.1 17.7 18.2 18.7 19.3 19.7 20.2 18.2
% sales 4.4% 4.2% 4.4% 3.8% 3.9% 3.9% 3.9% 3.9% 4.0% 3.9% 3.9% 3.5%
EBITA 15.3 13.6 10.6 15.3 15.8 15.6 15.6 16.9 17.0 17.2 17.1 19.5
% margin 3.8% 3.2% 2.6% 3.6% 3.6% 3.5% 3.4% 3.6% 3.5% 3.4% 3.3% 3.8%
% change -13.9% -11.5% -21.9% 44.8% 3.0% -1.2% 0.2% 8.0% 0.8% 0.9% -0.2% 13.9%
Taxes -4.1 -3.8 -3.2 -4.5 -4.6 -4.5 -4.5 -4.9 -4.9 -5.0 -5.1 -5.7
Normative tax rate 29.0% 29.0% 29.0% 29.0% 29.0% 29.0% 29.0% 29.0% 29.0% 29.0% 29.0% 29.0%
Actual tax rate 27.1% 28.0% 30.3% 29.0% 29.0% 29.0% 29.0% 29.0% 29.0% 29.0% 29.5% 29.0%
NOPLAT 11.2 9.8 7.4 10.9 11.2 11.1 11.1 12.0 12.1 12.2 12.1 13.9
Depreciation & other provisions 17.9 17.6 18.0 16.5 17.1 17.7 18.2 18.7 19.3 19.7 20.2 18.2
% sales 4.4% 4.2% 4.4% 3.8% 3.9% 3.9% 3.9% 3.9% 4.0% 3.9% 3.9% 3.5%
Gross Operating Cash Flow 29.1 27.3 25.4 27.4 28.3 28.8 29.3 30.7 31.3 31.9 32.3 32.1
Capex -20.9 -12.1 -10.8 -20.0 -20.4 -20.8 -21.2 -21.6 -22.1 -22.5 -23.0 -18.2
% sales 5.2% 2.9% 2.7% 4.7% 4.6% 4.6% 4.6% 4.6% 4.5% 4.5% 4.5% 3.5%
Change in NWC (-=incr.;+=decr.) -13.5 -5.3 0.3 -1.4 -0.7 -0.7 -0.7 -0.8 -0.8 -0.8 -0.8 -0.8
Cash Flow to be discounted -5.3 10.0 14.9 6.0 7.3 7.3 7.4 8.3 8.5 8.6 8.6 13.1
DCF EVALUATIONWACC 6.49% 6.49% 6.49% 6.49% 6.49% 6.49% 6.49% 6.49% 6.49%
Discount Rate factor 0.95 0.89 0.84 0.79 0.74 0.69 0.65 0.61 0.58
Discounted Cash Flow 5.7 6.5 6.1 5.8 6.2 5.9 5.6 5.2 7.5
Cumulated DCF 5.7 12.2 18.3 24.1 30.3 36.2 41.8 47.0 54.6

Ter Beke
Page 6
Source: Company data, ESN / Bank Degroof Research
Sensitivity analysis of the DCF valuation to the normalised EBITDA margin and the WACC level
Source: ESN / Bank Degroof Research
Multiples valuation
Source: ESN / Bank Degroof Research
Applying average peer group P/E, EV/EBITDA and EV/EBIT multiples for FY14e and FY15e (Fleury Michon, HKScan, Marfrig Global Foods, Campofrio, Atria) on our estimates for TERB, we come to a fair value of EUR 64/share.
WACC & DCF ANALYSISCost of Equity (Ke or COE) 8.5% Cumulated DCF 53.9 - Net Financial Debt -50.8
Perpetual Growth Rate (g) 0.0% - Minorities (estimated value) 0.0
Cost of Debt (gross) 5.0% Normalised Annual CF 13.9 + Associates 4.2
Debt tax rate 29% Terminal Value @ 31-Dec-22 204.7 - Pension underfunding & provisions -9.5
Cost of Debt net (Kd or COD) 3.54% Disc. Rate of Terminal Value 0.56 - Off-balance sheet commitments 0.0
Discounted Terminal Value 115.0 Equity Market Value (EUR m) 112.9
Target gearing (D/D+E) or % Kd 35.0% Number of shares (m) 1.7
% Ke 65.0% Financial assets 0.1 Fair Value per share (EUR) 65.2
Normative Tax Rate 29.0% Enterprise Value (EUR m) 169.0 Price dd. 17-Mar-14 (EUR) 61.00
WACC 6.77% DCF reliability rate 32% Potential upside (downside) 6.8%
Avg Tick
Normalised EBITDA Margin 7.3% 0.20%
WACC 6.8% 0.20%
WACC Normalised EBITDA Margin
65.16 6.7% 6.9% 7.1% 7.3% 7.5% 7.7% 7.9%
7.37% 46.1 49.4 52.7 56.0 59.3 62.6 65.9
7.17% 48.5 52.0 55.4 58.9 62.3 65.8 69.2
6.97% 51.1 54.7 58.3 61.9 65.5 69.1 72.7
6.77% 53.9 57.6 61.4 65.2 68.9 72.7 76.4
6.57% 56.8 60.7 64.7 68.6 72.5 76.5 80.4
6.37% 59.9 64.0 68.1 72.3 76.4 80.5 84.6
6.17% 63.2 67.5 71.9 76.2 80.5 84.8 89.1
Ter Beke FY14e FY15e FY14e FY15e FY14e FY15e
EBITDA (EUR m) 31.8 32.9
Avg EV/EBITDA multiple peer group 5.9x 5.5x
EBIT (EUR m) 15.3 15.8
Avg EV/EBIT multiple peer group 11.2x 9.3x
Net result (EUR m) 8.8 10.1
Avg P/E multiple peer group 13.2x 10.2x
Implied Enterprise Value (EUR m) 187.8 181.0 171.9 147.0
Net debt (EUR m) 51.3 49.5 51.3 49.5
Periph. ass. - off bal. - minor. - pens. 9.5 9.5 9.5 9.5
Implied equity (EUR m) 127.1 122.0 111.2 88.0 115.7 102.7
Value per share (EUR) 73.35 70.42 64.16 50.79 66.77 59.27
Liquidity discount applied 0%
Average value 64.1
Upside potential 6.4%

Ter Beke
Page 7
SWOT analysis
Strengths Weaknesses
Strong brand names and performing logistics (traceability, quality standards) constitute major entry barriers
European market leader in fresh lasagne
Management is committed and financially involved
Very limited currency exchange exposure
Low liquidity and free float
Limited scale versus European peers in processed meats
Mature market industry
Still limited sensitivity to pork price evolution, notwithstanding the increasing importance of service slicing in total processed meats revenue
Opportunities Threats
Continued international sales expansion towards the UK, Germany and Central & Eastern Europe
Product innovation in reaction to evolving consumer preferences
In response of the needs of major food retail chains: offering advanced services for slicing & packaging of processed meats or other foods, logistics and supply chain management services
A major food crisis (hog fever, avian flu, BSE, horsemeat scandal…)
Price pressure and margin squeeze from major retailers (increasing price competition at Belgian food retailers)
Private label competition
Declining meat consumption and changing consumer preferences
Increasing raw materials prices
Financial calendar
Upcoming event Date
Publication FY13 annual report At the latest on 27-Apr-14
1Q14 Interim statement 9-May-14 – 7:30am CET
AGM 28-May-14 – 11:00am CET
1H14 Results 26-Aug-14 – 7:30am CET Source: Company data
Ter Beke
Page 8
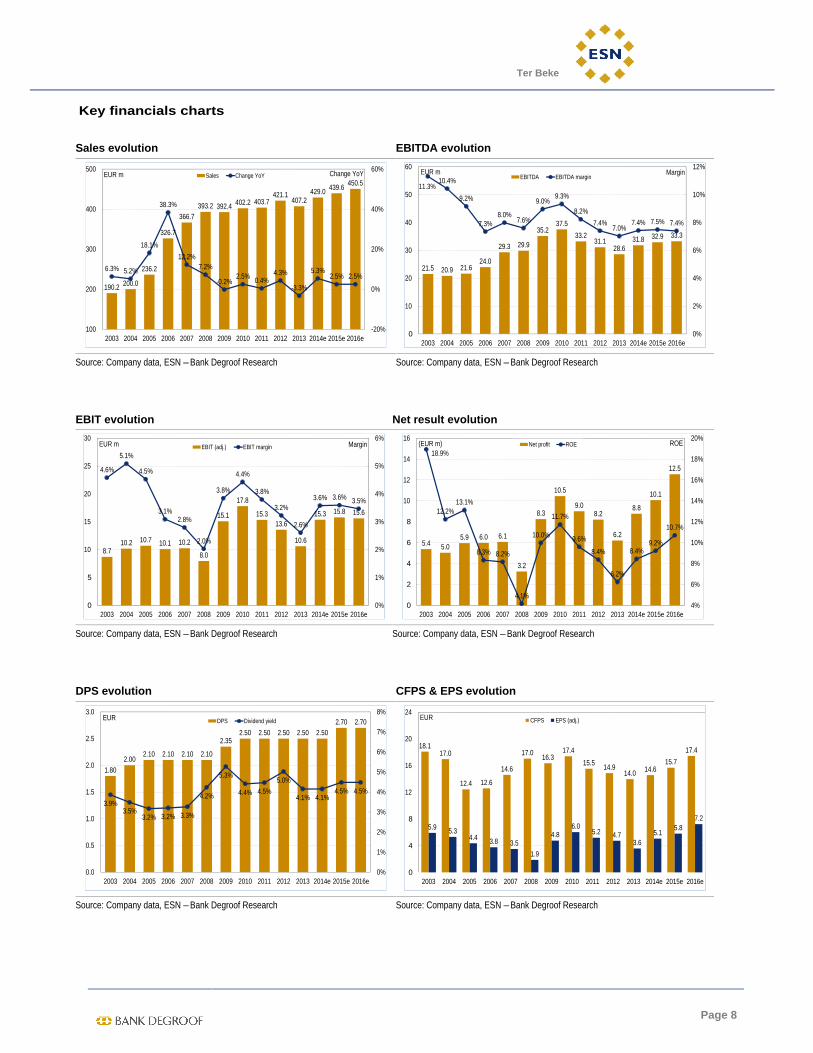
Key financials charts
Sales evolution EBITDA evolution
Source: Company data, ESN – Bank Degroof Research Source: Company data, ESN – Bank Degroof Research
EBIT evolution Net result evolution
Source: Company data, ESN – Bank Degroof Research Source: Company data, ESN – Bank Degroof Research
DPS evolution CFPS & EPS evolution
Source: Company data, ESN – Bank Degroof Research Source: Company data, ESN – Bank Degroof Research
190.2 200.0
236.2
326.7
366.7393.2 392.4 402.2 403.7
421.1407.2
429.0 439.6450.5
6.3% 5.2%
18.1%
38.3%
12.2%7.2%
-0.2%2.5% 0.4%
4.3%
-3.3%
5.3%2.5% 2.5%
-20%
0%
20%
40%
60%
100
200
300
400
500
2003 2004 2005 2006 2007 2008 2009 2010 2011 2012 2013 2014e 2015e 2016e
Change YoYEUR m Sales Change YoY
21.5 20.9 21.624.0
29.3 29.9
35.237.5
33.231.1
28.631.8 32.9 33.3
11.3%10.4%
9.2%
7.3%8.0%
7.6%
9.0%9.3%
8.2%
7.4%7.0%
7.4% 7.5% 7.4%
0%
2%
4%
6%
8%
10%
12%
0
10
20
30
40
50
60
2003 2004 2005 2006 2007 2008 2009 2010 2011 2012 2013 2014e 2015e 2016e
MarginEUR mEBITDA EBITDA margin
8.710.2 10.7 10.1 10.2
8.0
15.1
17.8
15.313.6
10.6
15.3 15.8 15.6
4.6%
5.1%
4.5%
3.1%2.8%
2.0%
3.8%
4.4%
3.8%
3.2%
2.6%
3.6% 3.6% 3.5%
0%
1%
2%
3%
4%
5%
6%
0
5
10
15
20
25
30
2003 2004 2005 2006 2007 2008 2009 2010 2011 2012 2013 2014e 2015e 2016e
MarginEUR m EBIT (adj.) EBIT margin
5.4 5.05.9 6.0 6.1
3.2
8.3
10.5
9.08.2
6.2
8.8
10.1
12.5
18.9%
12.2%13.1%
8.3% 8.2%
4.1%
10.0%
11.7%
9.6%
8.4%
6.2%
8.4%9.2%
10.7%
4%
6%
8%
10%
12%
14%
16%
18%
20%
0
2
4
6
8
10
12
14
16
2003 2004 2005 2006 2007 2008 2009 2010 2011 2012 2013 2014e 2015e 2016e
ROE(EUR m) Net profit ROE
1.802.00
2.10 2.10 2.10 2.10
2.352.50 2.50 2.50 2.50 2.50
2.70 2.70
3.9%3.5%
3.2% 3.2% 3.3%
4.2%
5.3%
4.4% 4.5%
5.0%
4.1% 4.1%4.5% 4.5%
0%
1%
2%
3%
4%
5%
6%
7%
8%
0.0
0.5
1.0
1.5
2.0
2.5
3.0
2003 2004 2005 2006 2007 2008 2009 2010 2011 2012 2013 2014e 2015e 2016e
EUR DPS Dividend yield
18.117.0
12.4 12.6
14.6
17.016.3
17.4
15.514.9
14.0 14.615.7
17.4
5.9 5.34.4 3.8 3.5
1.9
4.86.0
5.2 4.73.6
5.15.8
7.2
0
4
8
12
16
20
24
2003 2004 2005 2006 2007 2008 2009 2010 2011 2012 2013 2014e 2015e 2016e
EUR CFPS EPS (adj.)

Ter Beke
Page 9
Historical valuation charts
Price to Book value Price to Sales
Source: Bloomberg, ESN – Bank Degroof Research Source: Bloomberg, ESN – Bank Degroof Research
Enterprise Value to EBITDA Price to Earnings
Source: Bloomberg, ESN – Bank Degroof Research Source: Bloomberg, ESN – Bank Degroof Research
Dividend Yield Price to Cash flow
Source: Bloomberg, ESN – Bank Degroof Research Source: Bloomberg, ESN – Bank Degroof Research
Note: Level, average since 1-Jan-08 +/- 1 * StDev
0.60
0.70
0.80
0.90
1.00
1.10
1.20
1.30
Jan-08 May-08 Sep-08 Jan-09 May-09 Sep-09 Jan-10 May-10 Sep-10 Jan-11 May-11 Sep-11 Jan-12 May-12 Sep-12 Jan-13 May-13 Sep-13 Jan-14
TERB BB EQUITY - Price to Book - 12M Forward -
0.14
0.16
0.18
0.20
0.22
0.24
0.26
0.28
Jan-08 May-08 Sep-08 Jan-09 May-09 Sep-09 Jan-10 May-10 Sep-10 Jan-11 May-11 Sep-11 Jan-12 May-12 Sep-12 Jan-13 May-13 Sep-13 Jan-14
TERB BB EQUITY - Price to Sales - 12M Forward -
3.00
3.50
4.00
4.50
5.00
5.50
Jan-08 May-08 Sep-08 Jan-09 May-09 Sep-09 Jan-10 May-10 Sep-10 Jan-11 May-11 Sep-11 Jan-12 May-12 Sep-12 Jan-13 May-13 Sep-13 Jan-14
TERB BB EQUITY - EV/EBITDA - 12M Forward -
6.00
7.00
8.00
9.00
10.00
11.00
12.00
13.00
14.00
Jan-08 May-08 Sep-08 Jan-09 May-09 Sep-09 Jan-10 May-10 Sep-10 Jan-11 May-11 Sep-11 Jan-12 May-12 Sep-12 Jan-13 May-13 Sep-13 Jan-14
TERB BB EQUITY - PE Ratio - 12M Forward -
3.00
3.50
4.00
4.50
5.00
5.50
6.00
6.50
Jan-08 May-08 Sep-08 Jan-09 May-09 Sep-09 Jan-10 May-10 Sep-10 Jan-11 May-11 Sep-11 Jan-12 May-12 Sep-12 Jan-13 May-13 Sep-13 Jan-14
TERB BB EQUITY - Dividend Yield - 12M Forward -
2.00
2.50
3.00
3.50
4.00
4.50
Jan-08 May-08 Sep-08 Jan-09 May-09 Sep-09 Jan-10 May-10 Sep-10 Jan-11 May-11 Sep-11 Jan-12 May-12 Sep-12 Jan-13 May-13 Sep-13 Jan-14
TERB BB EQUITY - Price to Cash Flow - 12M Forward -

Ter Beke
Page 10
Summary tables (1) PROFIT & LOSS (EURm) 12/2011 12/2012 12/2013 12/2014e 12/2015e 12/2016eSales 404 421 407 429 440 451Cost of Sales & Operating Costs -370 -390 -379 -397 -407 -417Non Recurrent Expenses/Income 0.6 0.9 0.4 0.9 0.9 0.9EBITDA 33.2 31.1 28.6 31.8 32.9 33.3EBITDA (adj.)* 32.6 30.2 28.2 31.0 32.0 32.4Depreciation -18.0 -17.3 -18.1 -16.5 -17.1 -17.7EBITA 15.2 13.8 10.5 15.3 15.8 15.6EBITA (adj)* 14.6 12.9 10.1 14.5 14.9 14.7Amortisations and Write Downs 0.0 0.0 0.0 0.0 0.0 0.0EBIT 15.3 13.6 10.6 15.3 15.8 15.6EBIT (adj.)* 14.7 12.7 10.2 14.5 14.9 14.7Net Financial Interest -2.3 -1.8 -1.5 -1.1 -1.1 -1.0Other Financials -0.5 -0.6 0.0 -0.3 -0.3 -0.2Associates -0.2 0.2 -0.1 -1.0 0.0 2.6Other Non Recurrent Items 0.0 0.0 0.0 0.0 0.0 0.0Earnings Before Tax (EBT) 12.4 11.3 8.9 12.9 14.4 16.9Tax -3.4 -3.1 -2.7 -4.0 -4.2 -4.2Tax rate 27.5% 27.5% 30.7% 31.2% 29.0% 24.6%Discontinued Operations 0.0 0.0 0.0 0.0 0.0 0.0Minorities 0.0 0.0 0.0 0.0 0.0 0.0Net Profit (reported) 9.2 8.0 6.3 9.9 10.2 10.2Net Profit (adj.) 9.0 8.2 6.2 8.9 10.2 12.8
CASH FLOW (EURm) 12/2011 12/2012 12/2013 12/2014e 12/2015e 12/2016eCash Flow from Operations before change in NWC 26.9 25.8 24.2 25.4 27.3 30.4Change in Net Working Capital -13.5 -5.3 0.3 -1.4 -0.7 -0.7Cash Flow from Operations 13.4 20.5 24.5 24.0 26.7 29.8Capex -20.9 -12.1 -10.8 -20.0 -20.4 -20.8Net Financial Investments -4.5 0.5 1.3 0.0 0.0 0.0Free Cash Flow -12.0 8.8 15.0 4.0 6.3 9.0Dividends -4.3 -4.3 -4.3 -4.3 -4.4 -4.8Other (incl. Capital Increase & share buy backs) 8.9 -1.4 0.0 0.0 0.0 0.0Change in Net Debt -7.5 3.1 10.7 -0.3 1.9 4.2NOPLAT 10.5 9.0 7.2 10.3 10.6 10.4
BALANCE SHEET & OTHER ITEMS (EURm) 12/2011 12/2012 12/2013 12/2014e 12/2015e 12/2016eNet Tangible Assets 106 102 92.3 95.9 99.2 102Net Intangible Assets (incl.Goodwill) 37.3 37.5 37.3 37.3 37.3 37.3Net Financial Assets & Other 9.5 15.0 14.8 4.8 4.8 4.8Total Fixed Assets 153 154 144 138 141 144Inventories 24.4 25.3 24.3 25.6 26.2 26.9Trade receivables 69.6 65.5 65.0 79.0 80.9 82.9Other current assets 0.0 0.0 0.0 0.0 0.0 0.0Cash (-) -5.7 -4.3 -6.9 1.6 6.8 8.7Total Current Assets 99.7 95.2 96.2 103 100 101Total Assets 253 250 241 241 242 246Shareholders Equity 93.9 98.0 99.5 104 109 117Minority 0.0 0.0 0.0 0.0 0.0 0.0Total Equity 93.9 98.0 99.5 104 109 117Long term interest bearing debt 40.0 39.6 39.4 33.8 29.4 25.3Provisions 10.0 10.5 9.5 9.5 9.5 9.5Other long term liabilities 0.0 0.0 0.0 0.0 0.0 0.0Total Long Term Liabilities 50.0 50.1 48.9 43.3 38.9 34.7Short term interest bearing debt 30.4 26.2 18.3 15.7 13.5 11.6Trade payables 62.9 62.9 60.5 63.8 65.4 67.0Other current liabilities 15.8 12.4 13.4 14.1 14.5 14.8Total Current Liabilities 109 101 92.3 93.6 93.3 93.4Total Liabilities and Shareholders' Equity 253 250 241 241 242 246Net Capital Employed 169 170 160 165 169 172Net Working Capital 31.1 28.0 28.7 40.8 41.8 42.9
GROWTH & MARGINS 12/2011 12/2012 12/2013 12/2014e 12/2015e 12/2016eSales growth 0.4% 4.3% -3.3% 5.3% 2.5% 2.5%EBITDA (adj.)* growth -11.9% -7.4% -6.8% 10.0% 3.4% 1.1%EBITA (adj.)* growth -15.7% -11.5% -21.8% 43.6% 3.0% -1.4%EBIT (adj)*growth -15.1% -14.1% -19.7% 42.7% 3.0% -1.4%

Ter Beke
Page 11
Summary tables (2) GROWTH & MARGINS 12/2011 12/2012 12/2013 12/2014e 12/2015e 12/2016eNet Profit growth -13.9% -8.9% -24.4% 43.3% 15.1% 24.8%EPS adj. growth -13.9% -8.9% -24.4% 43.3% 15.1% 24.8%DPS adj. growth 0.0% 0.0% 0.0% 1.4% 8.3% 0.6%EBITDA (adj)* margin 8.1% 7.2% 6.9% 7.2% 7.3% 7.2%EBITA (adj)* margin 3.6% 3.1% 2.5% 3.4% 3.4% 3.3%EBIT (adj)* margin 3.6% 3.0% 2.5% 3.4% 3.4% 3.3%
RATIOS 12/2011 12/2012 12/2013 12/2014e 12/2015e 12/2016eNet Debt/Equity 0.7 0.6 0.5 0.5 0.5 0.4Net Debt/EBITDA 1.9 2.0 1.8 1.6 1.5 1.4Interest cover (EBITDA/Fin.interest) 14.7 16.9 18.5 29.5 30.3 32.4Capex/D&A 116.6% 68.9% 60.0% 121.3% 119.3% 117.7%Capex/Sales 5.2% 2.9% 2.7% 4.7% 4.6% 4.6%NWC/Sales 7.7% 6.6% 7.1% 9.5% 9.5% 9.5%ROE (average) 9.8% 8.6% 6.3% 8.7% 9.6% 11.3%ROCE (adj.) 6.0% 5.4% 4.6% 5.9% 5.9% 5.7%WACC 6.8% 6.8% 6.8% 6.8% 6.8%ROCE (adj.)/WACC 0.9 0.8 0.7 0.9 0.9
PER SHARE DATA (EUR)*** 12/2011 12/2012 12/2013 12/2014e 12/2015e 12/2016eAverage diluted number of shares 1.7 1.7 1.7 1.7 1.7 1.7EPS (reported) 5.31 4.63 3.64 5.71 5.91 5.89EPS (adj.) 5.20 4.74 3.58 5.13 5.91 7.37BVPS 54.18 56.58 57.42 60.02 63.18 67.78DPS 2.50 2.50 2.50 2.53 2.74 2.76
VALUATION 12/2011 12/2012 12/2013 12/2014e 12/2015e 12/2016eEV/Sales 0.4 0.3 0.4 0.4 0.4 0.3EV/EBITDA 4.6 4.7 5.3 5.0 4.8 4.6EV/EBITDA (adj.)* 4.7 4.8 5.4 5.1 4.9 4.7EV/EBITA 10.1 10.5 14.3 10.3 9.9 9.7EV/EBITA (adj.)* 10.6 11.3 14.9 10.9 10.5 10.3EV/EBIT 10.0 10.7 14.2 10.3 9.9 9.7EV/EBIT (adj.)* 10.5 11.5 14.9 10.9 10.5 10.3P/E (adj.) 9.8 10.1 16.0 11.9 10.3 8.3P/BV 0.9 0.8 1.0 1.0 1.0 0.9Total Yield Ratio 4.9% 5.2% 4.1% 4.2% 4.5%EV/CE 0.9 0.9 1.0 0.9 0.9 0.8OpFCF yield -8.4% 10.1% 13.8% 3.8% 5.9% 8.5%OpFCF/EV -4.8% 5.8% 9.1% 2.5% 4.0% 5.9%Payout ratio 47.1% 54.0% 68.6% 44.4% 46.5% 46.9%Dividend yield (gross) 4.9% 5.2% 4.1% 4.2% 4.5% 4.5%
EV AND MKT CAP (EURm) 12/2011 12/2012 12/2013 12/2014e 12/2015e 12/2016ePrice** (EUR) 51.00 48.00 57.19 61.00 61.00 61.00Outstanding number of shares for main stock 1.7 1.7 1.7 1.7 1.7 1.7Total Market Cap 88 83 99 106 106 106Net Debt 65 61 51 51 50 46o/w Cash & Marketable Securities (-) -6 -4 -7 2 7 9o/w Gross Debt (+) 70 66 58 50 43 37Other EV components 1 1 1 1 1 1Enterprise Value (EV adj.) 154 146 151 158 156 152Source: Company, Bank Degroof estimates.
Notes* Where EBITDA (adj.) or EBITA (adj)= EBITDA (or EBITA) -/+ Non Recurrent Expenses/Income and where EBIT (adj)= EBIT-/+ Non Recurrent Expenses/Income - PPA amortisation **Price (in local currency): Fiscal year end price for Historical Years and Current Price for current and forecasted yearsSector: Food & Beverage/Food small caps
Company Description: Ter Beke is a Belgian fresh food group which markets its range of products in 10 European countries. The grouphas 2 core activities: processed meats and fresh ready meals. It has 7 industrial sites in Belgium and the Netherlands and employsabout 1,700 people. The Processed Meats division produces processed meats for the Benelux, Germany and the UK, and it isinnovative in the segment of sliced and pre-packaged processed meats. It markets its products under distribution brands and own brandnames. The Ready Meals division produces fresh ready meals for the European market. It is European market leader in chilled lasagne.Its flagship brand name is Come a Casa.

ESN Recommendation SThe ESN Recommendation System is a total returnover a
The ESN spectrum of recommendations (or ratings) for each stock comprises 5 categories: Accumulate (or Add), Hold, Reduce and Sell (in short: B, A, H, R, S)
Furthermore, in specific cases and for a limited period of time, the analysts are allowed tostocks as
Meaning of each recommendation or rating:
Bank Degroof Ratings Breakdown
History of ESN RSince 18 October 2004(before was a Relative Rec. System) to rate any single stock under coverageSince 4 August 2008
Time h
Recommendations Total Retu
BEFORE
SELL
TODAY
BEFORE
SELL
BEFORE
SELL
TODAYTODAY
ESN Recommendation SThe ESN Recommendation System is
total return, measured by the upside potential (including dividends and capital reimbursement) over a 12 month time horizon
The ESN spectrum of recommendations (or ratings) for each stock comprises 5 categories: Accumulate (or Add), Hold, Reduce and Sell (in short: B, A, H, R, S)
Furthermore, in specific cases and for a limited period of time, the analysts are allowed tostocks as Rating Suspended (RS)
Meaning of each recommendation or rating:
Buy: the stock is expected to generate total return of 12 months time horizon
Accumulate:during the next 12 months time horizon
Hold: the stock is expected to generate total return ofnext 12 months time horizon.
Reduce: the stock is expected to generate totalnext 12 months time horizon
Sell: the stock is expected to generate total return 12 months time horizon
Rating Suspendedover bid, SPO, related party of the issuer is or could be involved or to a change of analyst covering the stock
Not Ratedthe document
Bank Degroof Ratings Breakdown
History of ESN Recommendation SystemSince 18 October 2004(before was a Relative Rec. System) to rate any single stock under coverageSince 4 August 2008
Time horizon changed to 12 months (it was 6 months)Recommendations Total Retu
BEFORE
-15%
SELL REDUCE
TODAY
-10%
SELL
BEFORE
-15%
SELL REDUCE
BEFORE
-15%
SELL REDUCE
TODAY
-10%
SELL
TODAY
-10%
SELL
ESN Recommendation SThe ESN Recommendation System is
, measured by the upside potential (including dividends and capital reimbursement) 12 month time horizon
The ESN spectrum of recommendations (or ratings) for each stock comprises 5 categories: Accumulate (or Add), Hold, Reduce and Sell (in short: B, A, H, R, S)
Furthermore, in specific cases and for a limited period of time, the analysts are allowed toRating Suspended (RS)
Meaning of each recommendation or rating:
: the stock is expected to generate total return of 12 months time horizon
Accumulate:
the stock is expected to generate total return of during the next 12 months time horizon
: the stock is expected to generate total return ofnext 12 months time horizon.
: the stock is expected to generate totalnext 12 months time horizon
: the stock is expected to generate total return 12 months time horizon
Rating Suspended: the rating is suspended due to a capital operation (takeover bid, SPO, …) where the issuerrelated party of the issuer is or could be involved or to a change of analyst covering the stock
Not Rated: there is no rating for a company being floated (IPO) by the issuerthe document
(a partner of ESN) or a related party of the issuer
Bank Degroof Ratings Breakdown
ecommendation SystemSince 18 October 2004, the Members of ESN are using an (before was a Relative Rec. System) to rate any single stock under coverageSince 4 August 2008, the ESN Rec. System has been amended as follow
orizon changed to 12 months (it was 6 months)Recommendations Total Retu
REDUCE
10%
REDUCE
REDUCEREDUCE
10%
REDUCE
10%
REDUCE
ESN Recommendation SystemThe ESN Recommendation System is Absolute
, measured by the upside potential (including dividends and capital reimbursement) 12 month time horizon.
The ESN spectrum of recommendations (or ratings) for each stock comprises 5 categories: Accumulate (or Add), Hold, Reduce and Sell (in short: B, A, H, R, S)
Furthermore, in specific cases and for a limited period of time, the analysts are allowed toRating Suspended (RS)
or Not Rated (NR)
Meaning of each recommendation or rating:
: the stock is expected to generate total return of
the stock is expected to generate total return of during the next 12 months time horizon
: the stock is expected to generate total return ofnext 12 months time horizon.
: the stock is expected to generate totalnext 12 months time horizon
: the stock is expected to generate total return
: the rating is suspended due to a capital operation (take…) where the issuer
of the documentrelated party of the issuer is or could be involved or to a change of analyst
: there is no rating for a company being floated (IPO) by the issuerartner of ESN) or a related party of the issuer
Bank Degroof Ratings Breakdown for companies with conflicts of interest
ecommendation System
he Members of ESN are using an (before was a Relative Rec. System) to rate any single stock under coverage
, the ESN Rec. System has been amended as followorizon changed to 12 months (it was 6 months)
Recommendations Total Return Range changed as below:
0% 5%
HOLD
0%
HOLD
0% 5%
HOLD
0% 5%
HOLD
0%
HOLD
0%
HOLD
ystem
Absolute. It means that each stock is rated on the basis of
, measured by the upside potential (including dividends and capital reimbursement)
The ESN spectrum of recommendations (or ratings) for each stock comprises 5 categories: Accumulate (or Add), Hold, Reduce and Sell (in short: B, A, H, R, S)
Furthermore, in specific cases and for a limited period of time, the analysts are allowed toNot Rated (NR), as explained below.
Meaning of each recommendation or rating:
: the stock is expected to generate total return of over 20%
the stock is expected to generate total return of during the next 12 months time horizon
: the stock is expected to generate total return of
: the stock is expected to generate total
return of
: the stock is expected to generate total return under
: the rating is suspended due to a capital operation (takeof the document
related party of the issuer is or could be involved or to a change of analyst
: there is no rating for a company being floated (IPO) by the issuerartner of ESN) or a related party of the issuer
Bank Degroof Ratings Breakdown for companies with conflicts of interest
he Members of ESN are using an (before was a Relative Rec. System) to rate any single stock under coverage
, the ESN Rec. System has been amended as followorizon changed to 12 months (it was 6 months)
rn Range changed as below:
5%
ACCUMULATE
10%
HOLD ACCUMULATE
5%
ACCUMULATE
5%
ACCUMULATE
10%
HOLD ACCUMULATE
10%
HOLD ACCUMULATE
Ter Beke
. It means that each stock is rated on the basis of
, measured by the upside potential (including dividends and capital reimbursement)
The ESN spectrum of recommendations (or ratings) for each stock comprises 5 categories: Accumulate (or Add), Hold, Reduce and Sell (in short: B, A, H, R, S)
Furthermore, in specific cases and for a limited period of time, the analysts are allowed to, as explained below.
over 20%
during the next
the stock is expected to generate total return of 10% to 20%
: the stock is expected to generate total return of
0% to 10%
return of 0% to -10%
under -10% during the next
: the rating is suspended due to a capital operation (takeof the document
(a partner of ESN) or a related party of the issuer is or could be involved or to a change of analyst
: there is no rating for a company being floated (IPO) by the issuerartner of ESN) or a related party of the issuer
Bank Degroof Ratings Breakdown for companies with conflicts of interest
he Members of ESN are using an Absolute Recommendation System (before was a Relative Rec. System) to rate any single stock under coverage
, the ESN Rec. System has been amended as follow
rn Range changed as below:
15%
ACCUMULATE
20%
ACCUMULATE
15%
ACCUMULATE
15%
ACCUMULATE
20%
ACCUMULATE
20%
ACCUMULATE
. It means that each stock is rated on the basis of , measured by the upside potential (including dividends and capital reimbursement)
The ESN spectrum of recommendations (or ratings) for each stock comprises 5 categories: Accumulate (or Add), Hold, Reduce and Sell (in short: B, A, H, R, S).
Furthermore, in specific cases and for a limited period of time, the analysts are allowed to, as explained below.
during the next
10% to 20%
during the
during the
during the next
: the rating is suspended due to a capital operation (take-(a partner of ESN) or a
related party of the issuer is or could be involved or to a change of analyst
: there is no rating for a company being floated (IPO) by the issuer
of
Bank Degroof Ratings Breakdown for companies with
Absolute Recommendation System (before was a Relative Rec. System) to rate any single stock under coverage.
, the ESN Rec. System has been amended as follows.
BUY
20%
BUY
BUYBUY
20%
BUY
20%
BUY
Page
. It means that each stock is rated on the basis of , measured by the upside potential (including dividends and capital reimbursement)
The ESN spectrum of recommendations (or ratings) for each stock comprises 5 categories: Buy,
Furthermore, in specific cases and for a limited period of time, the analysts are allowed to
rate the
Bank Degroof Ratings Breakdown for companies with
Absolute Recommendation System
Page 12
. It means that each stock is rated on the basis of , measured by the upside potential (including dividends and capital reimbursement)
Buy,
rate the
Absolute Recommendation System

Ter Beke
Page 13
Institutional & corporate equity desk Real estate Damien Crispiels +32 2 287 96 97 Jean-Baptiste Van Ex +32 2 287 91 27 Bart Beullens +32 2 287 91 80 Preben Bruggeman, CFA +32 2 287 95 71 Laurent Goethals +32 2 287 91 85 Antoni Slawecki +32 2 287 93 35 Pascal Magis +32 2 287 97 81 Fabian De Smet +32 2 287 99 16 Equity brokerage
John Paladino +32 2 287 96 40 Tanguy del Marmol +32 2 287 96 13
Institutional & corporate bond desk Frederic Lebrun +32 2 287 96 84 Peter Deknopper +32 2 287 91 22 Robin Podevyn +32 2 287 91 82 Gauthier de Ghellinck +32 2 287 68 74 Christian Saint-Jean +32 2 287 97 80 Fabrice Faccenda +32 2 287 91 81
Equity derivatives sales trading Structured products Mohamed Abalhossain +32 2 287 95 10 Edouard Nouvellon +32 2 287 93 23 Olivier-Pierre Morrot +32 2 287 96 18 Quentin De Decker +32 2 287 92 87 Tim Vercammen +32 2 287 91 83 Treasury desk Jerome Verhaegen +32 2 287 92 56 Alain Strapart +32 2 287 95 16 Stéphane Everaerts +32 2 287 97 75 Jeroen De Keer +32 2 287 97 71
Fund services Equity research Thomas Palmblad +32 2 287 93 27 Jean-Marie Caucheteux +32 2 287 99 20 Oliver Gigounon +32 2 287 91 84 Hans D’Haese +32 2 287 92 23 Fabio Ghezzi Morgalanti +32 2 287 92 72 Bernard Hanssens +32 2 287 96 89 Frederic Collett +32 2 287 93 06 Bart Jooris, CFA +32 2 287 92 79
Dirk Peeters +32 2 287 97 16
Mail: [email protected]

Ter Beke
Page 14
Source: Factset & ESN, price data adjusted for stock splits.
This chart shows Bank Degroof continuing coverage of this stock; the current analyst may or may not have covered it over the entire period. Current analyst: Hans D'Haese (since 28/01/2005)
Bank Degroof acts as liquidity provider for: Aedifica, Atenor, Banimmo, Bois Sauvage, BSB International, Connect Group, D’Ieteren, Eckert-Ziegler, Elia, Floridienne, Gimv, Greenyard Foods, Home Invest Belgium, Kinepolis, Leasinvest Real Estate, Luxempart, Montea, Realco, Resilux, Roularta, Sapec, Ter Beke, Van de Velde and Vastned Retail Belgium.
Bank Degroof holds a significant stake in: Fountain.
Bank Degroof board members and employees hold mandates in the following listed companies: Aedifica, Atenor Group, Barco, Brederode, Cofinimmo, D'Ieteren, Elia, Floridienne, Sapec, Sipef, Ter Beke, Tessenderlo and Zetes.
All opinions and projections expressed in this document constitute the judgement of Bank Degroof as of the date of their publication and are subject to change without notice. Bank Degroof and/or any of its subsidiaries may hold long/short positions in the securities referred to herein including derivative instruments related to the latter or may have business relations with the companies discussed herein. This material is intended for the information of the recipient only and does not constitute an offer to subscribe or purchase any securities. Although they are based on data which is presumed to be reliable and all while reasonable care has been taken to ensure they are derived from sources which are reliable, Bank Degroof has not independently verified such data and takes no responsibility as to their accuracy or completeness and accepts no liability for loss arising from the use of the opinions expressed in this document. Local laws and regulations may restrict the distribution of this document in other jurisdictions. Persons who enter in possession of this document should inform themselves about and observe any such restrictions. All information presented in this document is, unless otherwise specified, under copyright of Bank Degroof. No part of this publication may be copied or redistributed to other persons or firms without the written consent of Bank Degroof.
Recommendation history for TER BEKE
Date Recommendation Target price Price at change date18-Mar-14 Hold 65.00 61.0008-Nov-13 Reduce 54.00 56.0018-Sep-13 Hold 59.00 55.4028-Mar-13 Accumulate 58.00 50.8027-Feb-13 Hold 53.00 49.2007-Sep-12 Accumulate 58.00 49.1015-Mar-12 Buy 61.00 50.9926-Aug-11 Accumulate 61.00 51.0022-Aug-11 Accumulate 67.00 51.50
46
48
50
52
54
56
58
60
62
Mar13
Apr13
May13
Jun13
Jul13
Aug13
Sep13
Oct13
Nov13
Dec13
Jan14
Feb14
Mar14
Apr14
Buy Accumulat Hold Reduce Sell Not rated
Price history Target price history
DisclaimerThese reports have been prepared and Securities Network LLP (‘ESN’). ESN, its Members and their affiliates (and any director, officer or employee thereof), are neither liable for the proper and complete transmission of these reports nor for any delay in theirunauthorised use, disclosure, copying, distribution, or taking of any action in reliance on these reports is strictly prohibited. The views and expressions in the reports are expressions of opinion and are given in good faith, but are subjectchange without notice. These reports may not be reproduced in whole or in part or passed to third parties without permission. The information herein was obtained from various sources. ESN, its Members and their affiliates (and any director, officer or completeness, and neither ESN, nor its Members, nor its Members’ affiliates (nor any director, officer or employee thereof) shall be liable in respect of any errors or omissions or for any losses or consomissions. Neither the information contained in these reports nor any opinion expressed constitutes an offer, or an invitation to make an offer, to buy or sell any securities or any options, futures or other der(‘related investments’). These reports are prepared for the clients of the Members of ESN only. They do not have regard to the specific investment objectives, financial situation and the particular needs of any specific receive any of these reports. Investors should seek financial advice regarding the appropriateness of investing in any securities or investment strategies discussed or recommended in these reports and should understand that statements regarding future prospects may not be realised. Investors should note that income from such securities, if any, may fluctuate and that each security’s price or value may rise or fall. Accordingly, investors may receive back less than originally invested. Past peForeign currency rates of exchange may adversely affect the value, price or income of any security or related investment mentioned in these reports. In addition, investors in securities such as ADcurrency of the underlying security, effectively assume currency risk.ESN, its Members and their affiliates may submit a prementioning neither the recommendation nor the target price/fair vreports for review to the Investor Relations Department of the issuer forming the subject of the report, solely for the purpose of correcting any inadvertent material inaccuracies. Like all members employees, analysts receive compensation thatimpacted by overall firm profitability For further details about the specific risks of the company and about the valuation methods used to determine the price targets included in this report/note, please refer to the latest relevant published research report/noteprovide periodic updates on companies or sectors based on companydevelopments or announcements, marketavailable information. Unless agreed in writing with an ESN Member, this research is intended solely for internal use by the recipient. Neither this document nor any copy of it may be taken or transmitted into Australia, Cdistributed, directly or indirectly, in Australia, Canada or Japan or to any resident thereof. This document is for distribution in the U.K. Only to persons who have professional experience in matters relating to investments and fall with19(5) of the financial services and markets act 2000 (financial promotion) order 2005 (the “order”) or (ii) are persons falling within article 49(2)(a) to (d) of the order, namely high net worth companies, unincorporated associations etc (all such persons together being referred to as “relevant persons”). This document must not be acted on or relied upon by persons who are not relevant persons. Any investment or investment activity to which this document relates is available only to relevant persThe distribution of this document in other jurisdictions or to residents of other jurisdictions may also be restricted by law, and persons into whose possession this document comes should inform themserestrictions. By accepting this report you agree to be bound by the foregoing instructions. You shall indemnify ESN, its Members and their affiliates (and any director, officer or employee thereof) against any damages, cladetriments resulting from or in connection with the unauthorized use of this document.For disclosure upon “conflicts of interest” on the companies under coverage by all the ESN Members and on each “company recommendation history”, please the ESN website (individual disclaimer please refer to ESN Member websites:
www.bancaakros.it
www.bekafinance.com
www.caixabi.pt
www.cgdsecurities.com.br
www.cmcics.com
www.degroof.be
www.equinet
www.ibg.gr regulated by the HCMC
www.pohjola.com
www.snssecurities.nl
Ter BekeBelgiumFood & Beverage
Disclaimer: These reports have been prepared and Securities Network LLP (‘ESN’). ESN, its Members and their affiliates (and any director, officer or employee thereof), are neither liable for the proper and complete transmission of these reports nor for any delay in theirunauthorised use, disclosure, copying, distribution, or taking of any action in reliance on these reports is strictly prohibited. The views and expressions in the reports are expressions of opinion and are given in good faith, but are subjectchange without notice. These reports may not be reproduced in whole or in part or passed to third parties without permission. The information herein was obtained from various sources. ESN, its Members and their affiliates (and any director, officer or employee thereof) do not guarantee their accuracy or completeness, and neither ESN, nor its Members, nor its Members’ affiliates (nor any director, officer or employee thereof) shall be liable in respect of any errors or omissions or for any losses or consomissions. Neither the information contained in these reports nor any opinion expressed constitutes an offer, or an invitation to make an offer, to buy or sell any securities or any options, futures or other der(‘related investments’). These reports are prepared for the clients of the Members of ESN only. They do not have regard to the specific investment objectives, financial situation and the particular needs of any specific receive any of these reports. Investors should seek financial advice regarding the appropriateness of investing in any securities or investment strategies discussed or recommended in these reports and should understand that statements
ing future prospects may not be realised. Investors should note that income from such securities, if any, may fluctuate and that each security’s price or value may rise or fall. Accordingly, investors may receive back less than originally invested. Past performance is not necessarily a guide to future performance. Foreign currency rates of exchange may adversely affect the value, price or income of any security or related investment mentioned in these reports. In addition, investors in securities such as ADcurrency of the underlying security, effectively assume currency risk.ESN, its Members and their affiliates may submit a prementioning neither the recommendation nor the target price/fair vreports for review to the Investor Relations Department of the issuer forming the subject of the report, solely for the purpose of correcting any inadvertent material inaccuracies. Like all members employees, analysts receive compensation thatimpacted by overall firm profitability For further details about the specific risks of the company and about the valuation methods used to determine the price targets included in this report/note, please refer to the latest relevant published research on single stock or contact the analyst named on the front of the report/note. Research is available through your sales representative. ESN will provide periodic updates on companies or sectors based on companydevelopments or announcements, marketavailable information. Unless agreed in writing with an ESN Member, this research is intended solely for internal use by the recipient. Neither this document nor any copy of it may be taken or transmitted into Australia, Cdistributed, directly or indirectly, in Australia, Canada or Japan or to any resident thereof. This document is for distribution in the U.K. Only to persons who have professional experience in matters relating to investments and fall with19(5) of the financial services and markets act 2000 (financial promotion) order 2005 (the “order”) or (ii) are persons falling within article 49(2)(a) to (d) of the order, namely high net worth companies, unincorporated associations etc (all
ch persons together being referred to as “relevant persons”). This document must not be acted on or relied upon by persons who are not relevant persons. Any investment or investment activity to which this document relates is available only to relevant persons and will be engaged in only with relevant persons.The distribution of this document in other jurisdictions or to residents of other jurisdictions may also be restricted by law, and persons into whose possession this document comes should inform themserestrictions. By accepting this report you agree to be bound by the foregoing instructions. You shall indemnify ESN, its Members and their affiliates (and any director, officer or employee thereof) against any damages, cladetriments resulting from or in connection with the unauthorized use of this document.
For disclosure upon “conflicts of interest” on the companies under coverage by all the ESN Members and on each “company recommendation history”, please the ESN website (www.esnpartnership.euindividual disclaimer please refer to ESN Member websites:
www.bancaakros.it
regulated by the CONSOB
www.bekafinance.com
regulated by CNMV
www.caixabi.pt
regulated by the CMVM
www.cgdsecurities.com.br
regulated by the CVM
www.cmcics.com
regulated by the AMF
www.degroof.be regulated by the FSMA
www.equinet-ag.de regulated by the BaFin
regulated by the HCMC -
www.pohjola.com
regulated by the Financial Supervision Authori
www.snssecurities.nl
regulated by the AFM
Ter Beke Belgium
Food & Beverage
These reports have been prepared and issued by the Members of European Securities Network LLP (‘ESN’). ESN, its Members and their affiliates (and any director, officer or employee thereof), are neither liable for the proper and complete transmission of these reports nor for any delay in theirunauthorised use, disclosure, copying, distribution, or taking of any action in reliance on these reports is strictly prohibited. The views and expressions in the reports are expressions of opinion and are given in good faith, but are subjectchange without notice. These reports may not be reproduced in whole or in part or passed to third parties without permission. The information herein was obtained from various sources. ESN, its Members and their affiliates (and any
employee thereof) do not guarantee their accuracy or completeness, and neither ESN, nor its Members, nor its Members’ affiliates (nor any director, officer or employee thereof) shall be liable in respect of any errors or omissions or for any losses or consequential losses arising from such errors or omissions. Neither the information contained in these reports nor any opinion expressed constitutes an offer, or an invitation to make an offer, to buy or sell any securities or any options, futures or other derivatives related to such securities (‘related investments’). These reports are prepared for the clients of the Members of ESN only. They do not have regard to the specific investment objectives, financial situation and the particular needs of any specific receive any of these reports. Investors should seek financial advice regarding the appropriateness of investing in any securities or investment strategies discussed or recommended in these reports and should understand that statements
ing future prospects may not be realised. Investors should note that income from such securities, if any, may fluctuate and that each security’s price or value may rise or fall. Accordingly, investors may receive back less than originally
rformance is not necessarily a guide to future performance. Foreign currency rates of exchange may adversely affect the value, price or income of any security or related investment mentioned in these reports. In addition, investors in securities such as ADRs, whose value are influenced by the currency of the underlying security, effectively assume currency risk.ESN, its Members and their affiliates may submit a prementioning neither the recommendation nor the target price/fair vreports for review to the Investor Relations Department of the issuer forming the subject of the report, solely for the purpose of correcting any inadvertent material inaccuracies. Like all members employees, analysts receive compensation thatimpacted by overall firm profitability For further details about the specific risks of the company and about the valuation methods used to determine the price targets included in this report/note, please refer to the latest relevant published
or contact the analyst named on the front of the . Research is available through your sales representative. ESN will
provide periodic updates on companies or sectors based on companydevelopments or announcements, market
conditions or any other publicly available information. Unless agreed in writing with an ESN Member, this research is intended solely for internal use by the recipient. Neither this document nor any copy of it may be taken or transmitted into Australia, Cdistributed, directly or indirectly, in Australia, Canada or Japan or to any resident thereof. This document is for distribution in the U.K. Only to persons who have professional experience in matters relating to investments and fall with19(5) of the financial services and markets act 2000 (financial promotion) order 2005 (the “order”) or (ii) are persons falling within article 49(2)(a) to (d) of the order, namely high net worth companies, unincorporated associations etc (all
ch persons together being referred to as “relevant persons”). This document must not be acted on or relied upon by persons who are not relevant persons. Any investment or investment activity to which this document relates is available
ons and will be engaged in only with relevant persons.The distribution of this document in other jurisdictions or to residents of other jurisdictions may also be restricted by law, and persons into whose possession this document comes should inform themselves about, and observe, any such restrictions. By accepting this report you agree to be bound by the foregoing instructions. You shall indemnify ESN, its Members and their affiliates (and any director, officer or employee thereof) against any damages, cladetriments resulting from or in connection with the unauthorized use of this
For disclosure upon “conflicts of interest” on the companies under coverage by all the ESN Members and on each “company recommendation history”, please
www.esnpartnership.eu) For additional information and individual disclaimer please refer to www.esnpartnership.eu
regulated by the CONSOB - Commissione Nazionale per le Società e la Borsa
regulated by CNMV - Comisión Nacional del Mercado de Valores
CMVM - Comissão do Mercado de Valores Mobiliários
regulated by the CVM – Comissão de Valores Mobiliários
regulated by the AMF - Autorité des marchés financiers
regulated by the FSMA - Financial Services and Markets Authority
regulated by the BaFin
- Bundesanstalt für Finanzdienstleistungsaufsicht
-
Hellenic Capital Market Commission
regulated by the Financial Supervision Authori
regulated by the AFM - Autoriteit Financiële Markten
issued by the Members of European
Securities Network LLP (‘ESN’). ESN, its Members and their affiliates (and any director, officer or employee thereof), are neither liable for the proper and complete transmission of these reports nor for any delay in their
receipt. Any
unauthorised use, disclosure, copying, distribution, or taking of any action in reliance on these reports is strictly prohibited. The views and expressions in the reports are expressions of opinion and are given in good faith, but are subjectchange without notice. These reports may not be reproduced in whole or in part or passed to third parties without permission. The information herein was obtained from various sources. ESN, its Members and their affiliates (and any
employee thereof) do not guarantee their accuracy or completeness, and neither ESN, nor its Members, nor its Members’ affiliates (nor any director, officer or employee thereof) shall be liable in respect of any errors or
equential losses arising from such errors or omissions. Neither the information contained in these reports nor any opinion expressed constitutes an offer, or an invitation to make an offer, to buy or sell any
ivatives related to such securities (‘related investments’). These reports are prepared for the clients of the Members of ESN only. They do not have regard to the specific investment objectives, financial situation and the particular needs of any specific person who may receive any of these reports. Investors should seek financial advice regarding the appropriateness of investing in any securities or investment strategies discussed or recommended in these reports and should understand that statements
ing future prospects may not be realised. Investors should note that income from such securities, if any, may fluctuate and that each security’s price or value may rise or fall. Accordingly, investors may receive back less than originally
rformance is not necessarily a guide to future performance. Foreign currency rates of exchange may adversely affect the value, price or income of any security or related investment mentioned in these reports. In
Rs, whose value are influenced by the currency of the underlying security, effectively assume currency risk.
ESN, its Members and their affiliates may submit a pre-publication draft (without mentioning neither the recommendation nor the target price/fair value) of its reports for review to the Investor Relations Department of the issuer forming the subject of the report, solely for the purpose of correcting any inadvertent material inaccuracies. Like all members employees, analysts receive compensation thatimpacted by overall firm profitability For further details about the specific risks of the company and about the valuation methods used to determine the price targets included in this report/note, please refer to the latest relevant published
or contact the analyst named on the front of the . Research is available through your sales representative. ESN will
provide periodic updates on companies or sectors based on companyconditions or any other publicly
available information. Unless agreed in writing with an ESN Member, this research is intended solely for internal use by the recipient. Neither this document nor any copy of it may be taken or transmitted into Australia, Canada or Japan or distributed, directly or indirectly, in Australia, Canada or Japan or to any resident thereof. This document is for distribution in the U.K. Only to persons who have professional experience in matters relating to investments and fall with19(5) of the financial services and markets act 2000 (financial promotion) order 2005 (the “order”) or (ii) are persons falling within article 49(2)(a) to (d) of the order, namely high net worth companies, unincorporated associations etc (all
ch persons together being referred to as “relevant persons”). This document must not be acted on or relied upon by persons who are not relevant persons. Any investment or investment activity to which this document relates is available
ons and will be engaged in only with relevant persons.The distribution of this document in other jurisdictions or to residents of other jurisdictions may also be restricted by law, and persons into whose possession
lves about, and observe, any such restrictions. By accepting this report you agree to be bound by the foregoing instructions. You shall indemnify ESN, its Members and their affiliates (and any director, officer or employee thereof) against any damages, claims, losses, and detriments resulting from or in connection with the unauthorized use of this
For disclosure upon “conflicts of interest” on the companies under coverage by all the ESN Members and on each “company recommendation history”, please
For additional information and www.esnpartnership.eu
and to each
Commissione Nazionale per le Società e la Borsa
Comisión Nacional del Mercado de Valores
Comissão do Mercado de Valores Mobiliários
Comissão de Valores Mobiliários
Autorité des marchés financiers
Financial Services and Markets Authority
Bundesanstalt für Finanzdienstleistungsaufsicht
Hellenic Capital Market Commission
regulated by the Financial Supervision Authority
Autoriteit Financiële Markten
issued by the Members of European
Securities Network LLP (‘ESN’). ESN, its Members and their affiliates (and any director, officer or employee thereof), are neither liable for the proper and
receipt. Any unauthorised use, disclosure, copying, distribution, or taking of any action in reliance on these reports is strictly prohibited. The views and expressions in the reports are expressions of opinion and are given in good faith, but are subject
to
change without notice. These reports may not be reproduced in whole or in part or passed to third parties without permission. The information herein was obtained from various sources. ESN, its Members and their affiliates (and any
employee thereof) do not guarantee their accuracy or completeness, and neither ESN, nor its Members, nor its Members’ affiliates (nor any director, officer or employee thereof) shall be liable in respect of any errors or
equential losses arising from such errors or omissions. Neither the information contained in these reports nor any opinion expressed constitutes an offer, or an invitation to make an offer, to buy or sell any
ivatives related to such securities (‘related investments’). These reports are prepared for the clients of the Members of ESN only. They do not have regard to the specific investment objectives,
person who may receive any of these reports. Investors should seek financial advice regarding the appropriateness of investing in any securities or investment strategies discussed or recommended in these reports and should understand that statements
ing future prospects may not be realised. Investors should note that income from such securities, if any, may fluctuate and that each security’s price or value may rise or fall. Accordingly, investors may receive back less than originally
rformance is not necessarily a guide to future performance. Foreign currency rates of exchange may adversely affect the value, price or income of any security or related investment mentioned in these reports. In
Rs, whose value are influenced by the
publication draft (without alue) of its
reports for review to the Investor Relations Department of the issuer forming the subject of the report, solely for the purpose of correcting any inadvertent material inaccuracies. Like all members employees, analysts receive compensation that
is impacted by overall firm profitability For further details about the specific risks of the company and about the valuation methods used to determine the price targets included in this report/note, please refer to the latest relevant published
or contact the analyst named on the front of the . Research is available through your sales representative. ESN will
provide periodic updates on companies or sectors based on company-specific conditions or any other publicly
available information. Unless agreed in writing with an ESN Member, this research is intended solely for internal use by the recipient. Neither this document
anada or Japan or distributed, directly or indirectly, in Australia, Canada or Japan or to any resident thereof. This document is for distribution in the U.K. Only to persons who have professional experience in matters relating to investments and fall within article 19(5) of the financial services and markets act 2000 (financial promotion) order 2005 (the “order”) or (ii) are persons falling within article 49(2)(a) to (d) of the order, namely high net worth companies, unincorporated associations etc (all
ch persons together being referred to as “relevant persons”). This document must not be acted on or relied upon by persons who are not relevant persons. Any investment or investment activity to which this document relates is available
ons and will be engaged in only with relevant persons.
The distribution of this document in other jurisdictions or to residents of other jurisdictions may also be restricted by law, and persons into whose possession
lves about, and observe, any such restrictions. By accepting this report you agree to be bound by the foregoing instructions. You shall indemnify ESN, its Members and their affiliates (and any
ims, losses, and detriments resulting from or in connection with the unauthorized use of this
For disclosure upon “conflicts of interest” on the companies under coverage by all the ESN Members and on each “company recommendation history”, please visit
For additional information and and to each
Commissione Nazionale per le Società e la Borsa
Comisión Nacional del Mercado de Valores
Comissão do Mercado de Valores Mobiliários
Bundesanstalt für Finanzdienstleistungsaufsicht
Members of ESN (European Securities Network LLP)
Banca Akros S.p.A.Viale Eginardo, 2920149 MILANO
Italy Phone: +39 02 43 Fax: +39 02 43 444 302
Caixa-Banco de InvestimentoRua Barata Salgueiro, nº 331269-057 LisboaPortugal
Phone: +351 21 313 73 00Fax: +351 21 389 68 98
CM -
CIC Securities6, avenue de Provence75441 Paris
Cedex 09
France
Phone: +33 1 4596 7940Fax: +33 1 4596 7748
Bank DegroofRue de I’Industrie 441040 BrusselsBelgium
Phone: +32 2 287 91 16Fax: +32 2 231 09 04
BEKA FinanceSerrano, 39 28001 Madrid
Spain Phone: +34 91 436 7813Fax: +34 91 577 3770
Members of ESN (European Securities Network LLP)
Banca Akros S.p.A.
Viale Eginardo, 29
Phone: +39 02 43 444 389 Fax: +39 02 43 444 302
Banco de Investimento
Rua Barata Salgueiro, nº 33
057 Lisboa
Phone: +351 21 313 73 00
+351 21 389 68 98
CIC Securities
6, avenue de Provence
Phone: +33 1 4596 7940
Fax: +33 1 4596 7748
Bank Degroof
Rue de I’Industrie 44
1040 Brussels
Phone: +32 2 287 91 16
Fax: +32 2 231 09 04
BEKA Finance
Phone: +34 91 436 7813
Fax: +34 91 577 3770
Members of ESN (European Securities Network LLP)Members of ESN (European Securities Network LLP)
Equinet Bank AG Gräfstraße 97 60487 Frankfurt am MainGermany Phone:+49 69 –
Fax:+49 69 – 58997
SNS Securities N.V.Nieuwezijds Voorburgwal 162 P.O.Box 235 1000 AE AmsterdamThe Netherlands Phone: +31 20 550 8500Fax: +31 20 626 8064
Pohjola Bank plcP.O.Box 308 FI- 00013 Pohjola Finland Phone: +358 10 252 011 Fax: +358 10 252 2703
Investment Bank of Greece32 Aigialeias Str & Paradissou, 151 25 Maroussi, Greece Tel: +30 210 81 73 383
Members of ESN (European Securities Network LLP)
Equinet Bank AG
60487 Frankfurt am Main
58997 – 410
58997 – 299
SNS Securities N.V.
Nieuwezijds Voorburgwal 162
1000 AE Amsterdam
20 550 8500
Fax: +31 20 626 8064
Pohjola Bank plc
00013 Pohjola
Phone: +358 10 252 011
Fax: +358 10 252 2703
Investment Bank of Greece
32 Aigialeias Str & Paradissou,
151 25 Maroussi,
Tel: +30 210 81 73 383