flexibility of in
TRANSCRIPT

and
offlexibility in DenmarkKey messages
13 September
Developmentrole
by

AgendaIntroduction to the report Development of the Danish power system and role of flexibility
Period 1 (2000-2004) - Market opening, CHP as base load
Period 2 (2005-2009) - CHP plants changing roles
Period 3 (2010-2015) - Increased flexibility from CHP
Period 4 (2016-2020) - Consumer participation and improved forecasting

In IEA’s terminology, Denmark is now in the 4th category
Denmark leadingin VREintegration
Phase 1. VRE has no noticeable impact on the system
Phase 2. VRE has a minor to moderate impact on system operation
Phase 3. VRE generation determines the oepration pattern of the system
Phase 4. The system experiences periods where VRE makes up almost all generation
Phase 5. Growing amounts of VRE surplus (days to weeks)
Phase 6. Monthly or seasonal surplus or deficit of VRE supply
1
2
3
4
5
6
Minor changes to operating patterns
Greater variability of net load and new power flow patterns
Power supply robustnessunder high VRE generation
Longer periods of energysurplus or deficit
Need for seasonal storageKey transition challenges

Expaining the term
FlexibilityNoun [U]
Definition: The ability of a power system to cope with variability and uncertainty in both generation and demand, while maintaining a satisfactory level of reliability at a reasonable cost, over different time horizons” (Ma, 2013).
0
1000
2000
3000
4000
5000
6000
7000
15-0
5-20
2015
-05-
2020
05:
0015
-05-
2020
10:
0015
-05-
2020
15:
0015
-05-
2020
20:
0016
-05-
2020
01:
0016
-05-
2020
06:
0016
-05-
2020
11:
0016
-05-
2020
16:
0016
-05-
2020
21:
0017
-05-
2020
02:
0017
-05-
2020
07:
0017
-05-
2020
12:
0017
-05-
2020
17:
0017
-05-
2020
22:
00
MW Solar
Offshore Wind
Onshore Wind
Central power plants
Local power plants
Power consumption
Figure 4
Variability and uncertainty in generation

Four periods From 2000-2020
17.09.2021 5
2000-2004
Period 1
2005-2009
Period 2
2010-2015
Period 3
2016-2020
Period 4
The historical development of the flexibility measures and the variable renewable energy share of the power mix in Denmark

5 main categories of flexibility and role of the marketReport structure: Chronologically reviewing flexibility solutions
17 September 2021 Page 6
12% 18% 22%
44% 50%
0%10%20%30%40%50%60%
2000 2005 2010 2015 2020
Shar
e of
VR
E
Year
2000-2004 2005-2009 2010-2015 2016-2020 After 2020
Flexible thermal power plants
Utilisation of interconnectors
Forecasting and scheduling systems
Sector coupling
Demand-side flexibility

2000-2004 2005-2009 2010-2015 2016-2020
Period 1 Period 2 Period 3 Period 4March 23, 2021 Page 7
1
Period2000-2004Market opening in the power sector provided first incentives for flexible operation and interconnector capacity was fully made available to the market
12-19% of VRE
In this chapter
Dynamic electricity pricing
CHP flexibility
Utilising interconnectors

2000-2004 2005-2009 2010-2015 2016-2020
Period 1 Period 2 Period 3 Period 4March 23, 2021 Page 8
Market design – From fixed tariffs to hourly electricity prices.
• Competition between all producers on a daily auction
• hourly electricity price reflect the short-run marginal costs of generating electricity in each bidding zone of that hour
• Fits better the dynamics of fluctuating energy sources
• Denmark joins Nord PoolFigure 6: Difference between three-part trariff pricing and spot market price formation
Dynamic pricing

2000-2004 2005-2009 2010-2015 2016-2020
Period 1 Period 2 Period 3 Period 417 September 2021 Page 9
Flexible thermal power plantsCommissioned as base load with low flexibility - incentivised to be flexible
• The last coal-fired CHP were constructed in 1998
• Low need for system flexibility
01,0002,0003,0004,0005,0006,0007,0008,0009,000
10,000
2005 2010 2015 2019
MW
Thermal Variable renewable Interconnection Peak consumption
Figure 1: Development in capacities for thermal power plants, VRE and interconnectors (DEA, 2019) in relation to peak consumption (Energinet).
2000-2004 2005-2009 2010-2015 2016-2020
Period 1 Period 2 Period 3 Period 4March 23, 2021 Page 10
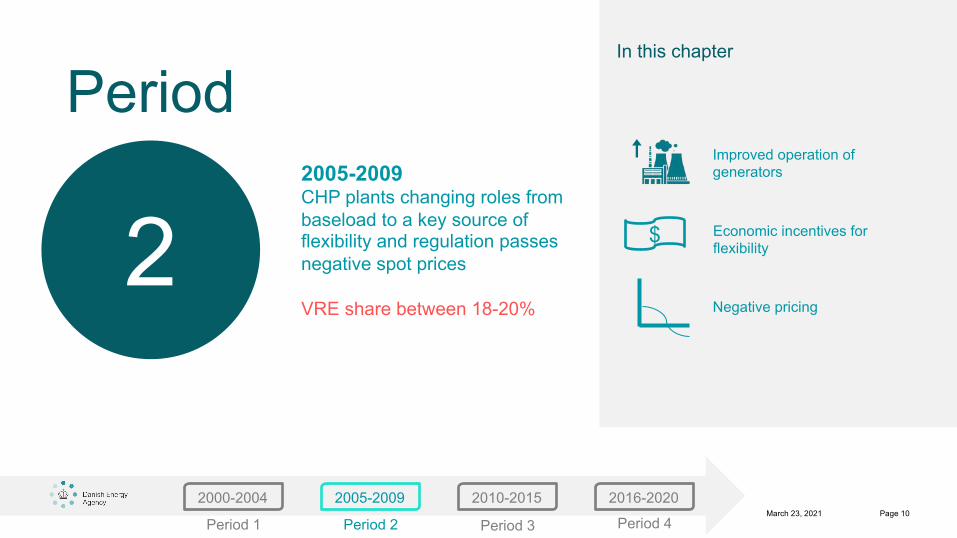
2
Period2005-2009CHP plants changing roles from baseload to a key source of flexibility and regulation passes negative spot prices
VRE share between 18-20%
In this chapter
Economic incentives for flexibility
Negative pricing
$
Improved operation of generators

2000-2004 2005-2009 2010-2015 2016-2020
Period 1 Period 2 Period 3 Period 417 September 2021 Page 11
Figure 11: Shift from centralised CHP plants to decentralised CHP
New market structure incentivising flexible operation of CHP
Improved operation of generatorsOverload / lower minimum loadFaster ramp rate
$
CHP plants changed from baseload to key source of flexibility

2000-2004 2005-2009 2010-2015 2016-2020
Period 1 Period 2 Period 3 Period 417 September 2021 Page 12
Negative prices led to more dynamic operation of traditional generation through the use of electric boilers
-50
0
50
100
150
200
250
300
350
400
450
-1.000
0
1.000
2.000
3.000
4.000
5.000Wind turbines
Local plants
Primary plants
Import
1 2 3 4 5 6 7
MWh/h
€/MWhThe spot price even went negative for 5 hours
The market design manage to secure merit order dispatch hour by hour, also taken imports/export into account
Negative prices allowed
Figure 13: Example of how negative spot prices incentivise power plants to consume electricity

2000-2004
Period 1
2005-2009
Period 2
2016-20202010-2015
Period 3 Period 417 September 2021 Page 13
3
Period2010-2015Increased use of CHP plants as a flexibility source and large investments in interconnectors accompanied by an integrated day-ahead market across Europe
first power system to reach 22-44% VRE share
In this chapter
Utilisation and flexibility of interconnectors
Thermal plants delivering flexibility – decoupling electricity and heat

2000-2004
Period 1
2005-2009
Period 2
2016-20202010-2015
Period 3 Period 417 September 2021 Page 14
VRE shares created need for thermal power plants to further implement flexibility
General operational
improvements
CHP unit solutions
Enhance the operational limit
values
Lower minimum loadOverload abilityTurbine bypassDecoupling of heat and
electricity or heat: variable heat-to-power ratio
Electric boilers and heat pumps
Decoupling of heat and
electricity: Temporal displacement of thermal load
Heat storage
Short reaction time to market
signals
Faster ramp rates and output
regulationFaster start up and shut down
Figure 15: Implemented flexibility improvements in thermal power plants by owners.

2000-2004
Period 1
2005-2009
Period 2
2016-20202010-2015
Period 3 Period 417 September 2021 Page 15
-50
-25
0
25
50
75
100
125
150
-200 0 200 400 600
Shor
t run
mar
gina
l hea
t pro
duct
ion
cost
(D
KK/G
J)
Electricity price (DKK/MWh)
Electric boiler
Heat pump
Coal CHP backpressure
Coal CHP extraction plant -bypass
Coal CHP extraction plant -backpressure mode
Coal CHP extraction plant -opportunity cost
Providing fast down-regulation
Ideal choice for negative electricity pricesà electric boilers (lower investment costs but also lower efficiency)
Ideal choice for slightly higher electricity pricesà heat pumps (high efficiency and COP of up to 4)
Figure 16: Illustrative example of short run marginal heat production for different plants depending on electricity prices.
System required decoupling of heat and power to meet its flexibility needs

2000-2004
Period 1
2005-2009
Period 2
2016-20202010-2015
Period 3 Period 417 September 2021 Page 16
System required decoupling of heat and power to meet its flexibility needs
Figure 19 Operational boundaries for a CHP plant with various flexible measures
050
100150200250300350400450
0 100 200 300 400 500 600 700
New
pow
er o
uput
(MW
)
District heating output (MJ)Normal load Turbine bypass Increased + bypass
Increased load Low load Low + bypass

2000-2004
Period 1
2005-2009
Period 2
2016-20202010-2015
Period 3 Period 417 September 2021 Page 17
4
Period2016-2020New flexibility measures focus on consumer participation in electricity markets, improved forecasting that allows for proactive balancing, and that wind turbines may provide balancing services
50% of VRE reached
In this chapter
Datahub
Demand-side management
New concepts in the European power market$

2000-2004
Period 1
2005-2009
Period 2
2016-20202010-2015
Period 3 Period 417 September 2021 Page 18
• Independence from conventional power plants
• New tools/concepts necessary
• Demand-side
management/flexibility/digitalisation
• Passive à Active consumers
• Datahub
• Smart metering
• Aggregators
• Improved proactive balancing /
forecasting
The Danish climate target is
70% carbon emission reductions
By 2030(compared to 1990)
Reaching carbonneutrality by 2050

The second half
reaching 100% RE 17 September 2021 Page 19
• 100% RE in electricitysupply by 2030
• Carbon neutral society by 2050
• Energy islands / PtX• And much more…
Beyond 2020

2000-2004
Period 1
2005-2009
Period 2
2016-20202010-2015
Period 3 Period 417 September 2021 Page 20
0
1000
2000
3000
4000
5000
6000
7000
0.0
10.0
20.0
30.0
40.0
50.0
60.0
2020 2021 2022 2023 2024 2025 2026 2027 2028 2029 2030
Ther
mal
pow
er p
lant
Cap
acity
(M
W)
Gro
ss p
ower
con
sum
ptio
n (T
Wh)
Classical consumption Individual heatpumps Big heatpumpsElectric boilers Transport Data centersPower-to-X Power plant capacity
Future of the Danish grid
Figure 27: Expected trend in electricity demand and power plant capacities from 2020 to 2040 (DEA, 2020).

Summing up
17 September 2021Page 21

5 main categories of flexibility and role of the marketReport structure: Chronologically reviewing flexibility solutions
17 September 2021 Page 22
12% 18% 22%
44% 50%
0%10%20%30%40%50%60%
2000 2005 2010 2015 2020
Shar
e of
VR
E
Year
2000-2004 2005-2009 2010-2015 2016-2020 After 2020
Flexible thermal power plants
Utilisation of interconnectors
Forecasting and scheduling systems
Sector coupling
Demand-side flexibility

01,0002,0003,0004,0005,0006,0007,0008,0009,000
10,000
2005 2010 2015 2019
MW
Thermal Variable renewable
Interconnection Peak consumption
Figure 1: Development in capacities for thermal power plants, VRE and interconnectors (DEA, 2019) in relation to peak consumption (Energinet). Decommissions are not included.
VRE is becoming the backbone of the grid
The changing role of CHP in the Danish power system
• CHP’s: from baseload to flexibility providerer
• Flexibility is a tool, not a goal
• Incentivise flexibility through adequate pricing scheme
• District heating – old and new flexibility provider
• The mentality shift

Thank you for the attention

2000-2004
Period 1
2005-2009
Period 2
2016-20202010-2015
Period 3 Period 417 September 2021 Page 25
Share of VRE
50%
2020Time
In the next phase towards
independence from fossil fuels, a
vertical market perspective will
have a key role
Vertical integration:
• Coupling of sectors
• Activation of consumers
• New market players
• Data-based business
models
Temporal integration
Horisontal integration:
Wide-spread electricity markets
Strong interconnectors
Flexible thermal power plants
Specialised forecasting tools
Well-known roles and business models
Figure 28: Illustration of a shift in flexibility needs as we go beyond 50 % VRE. Source: Energinet.

01,0002,0003,0004,0005,0006,0007,0008,0009,000
10,000
2005 2010 2015 2019
MW
Thermal Variable renewable
Interconnection Peak consumption
Figure 1: Development in capacities for thermal power plants, VRE and interconnectors (DEA, 2019) in relation to peak consumption (Energinet). Decommissions are not included.
VRE is becoming the backbone of the grid
The changing role of CHP in the Danish power system
1. CHP as baseload
2. CHP shifting to be a key source of flexibility – little investment
3. CHP’s role shifted to fill in gaps of VRE generation – higher investment
4. The power system can run without thermal plants

• Flexibility is a tool, not a goal
• Incentivise flexibility through adequate pricing scheme
• District heating – old and new flexibility provider
• The mentality shift
Suggestions based on the Danish experiences
17 September 2021 Page 27

• 20 years of experience
• Vital flexibility solutions and market drivers
• In relation to the share of VRE
• Flexibility is not a goal in itself
by

A central, enabling institution was the Danish Transmission System Operator (TSO) Energinet,
which went from thinking:
“we know best what our system can do because we are engineers” to “because we are engineers
we have to develop innovative solutions for what society wants”
(Ackermann, 2006; Wittrup, 2018).
17 September 2021Page 29

2000-2004 2005-2009 2010-2015 2016-2020
Period 1 Period 2 Period 3 Period 417 September 2021 Page 30
Flexible thermal power plantsCommissioned as base load with low flexibility - incentivised to be flexible
• The last coal-fired CHP were constructed in 1998
• Limited flexibility options across the energy system

2000-2004 2005-2009 2010-2015 2016-2020
Period 1 Period 2 Period 3 Period 4March 23, 2021 Page 31
Utilisation of interconnectorsWhen joining the Nordpool exchange, the entire interconnector capacity is made available for market dispatch
Figure 8: Map of interconnectors as of 2004
Figure 7: Flow over the interconnector between Western Denmark and Sweden in January of 1995 and 2000. Positive numbers illustrate import and negative numbers illustrate export, and the shaded area marks the rated capacity of the interconnector

2000-2004 2005-2009 2010-2015 2016-2020
Period 1 Period 2 Period 3 Period 4March 23, 2021 Page 32
Interconnectors allowing export / import of electricity
Figure 7: Flow over the interconnector between Western Denmark and Sweden in Janaury of 1995 and 2000. Positive numbers illustrate import and negative numbers illustrate export, and the shaded area marks the rated capacity of the interconnector
Figure 9: Main phases of the power market

2000-2004 2005-2009 2010-2015 2016-2020
Period 1 Period 2 Period 3 Period 417 September 2021 Page 33
0
100
200
300
400
500
600
0
2
4
6
8
10
12
14
16
18
2002
2003
2004
2005
2006
2007
2008
2009
2010
2011
2012
2013
2014
2015
2016 Ac
cum
ulat
ed in
stal
led
heat
ing
capa
city
MW
Num
ber o
f ele
ctric
boi
lers
Number of electric boilers Accumulated installed heating capacity MW
Finding the right price point
• Regulation from 2009-2012 favored electric boilers
• Missing balance
• Changes in the incentivessignificantly reduced the amount of new capacity from electric boilers
Figure 14: New electric boilers and accumulated installed capacity

2000-2004
Period 1
2005-2009
Period 2
2016-20202010-2015
Period 3 Period 417 September 2021 Page 34
VRE shares created need for thermal power plants to further implement flexibility
General operational
improvements
CHP unit solutions
Enhance the operational limit
values
Lower minimum loadOverload abilityTurbine bypassDecoupling of heat and
electricity or heat: variable heat-to-power ratio
Electric boilers and heat pumps
Decoupling of heat and
electricity: Temporal displacement of thermal load
Heat storage
Short reaction time to market
signals
Faster ramp rates and output
regulationFaster start up and shut down
→ VRE-share continually increasing – demanding innovations and retrofitting
→ Various CHP unit solutions contribute to higher flexibility
→ Higher VRE shares brought longer periods with electricity prices lower than the marginal cost of running CHP Figure 15: Implemented flexibility improvements in thermal power
plants by owners.

2000-2004
Period 1
2005-2009
Period 2
2016-20202010-2015
Period 3 Period 417 September 2021 Page 35
0%
20%
40%
60%
80%
100%
120%
05
101520253035404550
0 1 2 3 4 5 6 7 8 9 10 11 12 13 14 15 16 17 18 19 20 21 22 23 24
Prod
uctio
n re
lativ
e to
cap
acity
Elec
trici
ty p
rice
EUR
/MW
h
hour
Daily operations with retrofitted and standard flexibility
DAM price (EUR/MWh) Marg inal price (EUR/MWh)
DAM production schedule standard (%) DAM production schedule retrofitted (%)
Figure 14 Example of daily operations in day-ahead market (CEM, 2018)
VRE shares created need for thermal power plants to further implement flexibility

2000-2004
Period 1
2005-2009
Period 2
2016-20202010-2015
Period 3 Period 417 September 2021 Page 36
0%
20%
40%
60%
80%
100%
0% 20% 40% 60% 80% 100%
Single Danishwind site
Entire DanishFleet
OptimisedEurope
Europe
Figure 18
Utilisation of interconnectors
Increasingly used to balance wind power production
-2500-2000-1500-1000
-5000
500100015002000
0 500 1000 1500 2000 2500 3000 3500N
et e
xpor
t MW
h/h
VRE production (MWh/h)
Figure 19

2000-2004
Period 1
2005-2009
Period 2
2016-20202010-2015
Period 3 Period 417 September 2021 Page 37
0500
1,0001,5002,0002,5003,0003,5004,000
6/16
/201
4
6/17
/201
4
6/18
/201
4
6/19
/201
4
6/20
/201
4
6/21
/201
4
6/22
/201
4
MW
Onshore wind Offshore wind Local CHP
Central CHP Gross consumption
Flexible operation of interconnectors provided flexibility in addition to CHPs
Figure 20: Power generation in Western Denmark divided by types and demand.
Import of power in hours where total generation is lower than consumption
Export of power occurs when the total power generation is above the power demand

2000-2004
Period 1
2005-2009
Period 2
2016-20202010-2015
Period 3 Period 417 September 2021 Page 38
Implicit auctions of interconnector capacity in the day ahead market
Illustration of market coupling between bidding areas with low and high marginal cost (MC), respectively. Source: Energinet.

2000-2004
Period 1
2005-2009
Period 2
2016-20202010-2015
Period 3 Period 417 September 2021 Page 39
Implicit auctions of interconnector capacity replaced explicit auctions in the day ahead market
Figure 26 Illustration of combinations of day-ahead electricity prices in Denmarkand Germany and directions of flows between the two countries under explicit auctions.

Becomes more complicated, yet simpler.Operating the power system
• Without thermal power plants
• Wind delivers ancillary services
• Proactive balancing is key
17 September 2021 Page 40

2000-2004
Period 1
2005-2009
Period 2
2016-20202010-2015
Period 3 Period 417 September 2021 Page 41
Future of the European power market
• XBID (Cross border intraday market)
• PICASSO (Platform for
the International Coordination
of Automated Frequency
Restoration
and Stable System Operation)
• MARI (Manually activated reserves
Initiative)