flexible packaggging association sustainability advantages ... · flexible packaggging association...
TRANSCRIPT

Flexible Packaging Associationg g
Sustainability Advantages of Flexible Packaging Webinar
The goal of the webinar is to describe the research FPA has done on sustainable packaging and to introduce you to the FPA Sustainability Toolkitsustainable packaging and to introduce you to the FPA Sustainability Toolkit.
1
FPA Board of Directors Commitment bl kto Sustainable Packaging
• InI iititiatitive bbegan iin earlly 19901990s withith LLess WasW tte in the First Place
• In 2006 FPA began an expanded focus on sustainability
–Customer research
–RReeprpresenesenttaationtion withwith WaWallmmaarrtt
–Research on energy consumption, grgreenhouseeenhouse gagass emissionsemissions andand endend ofof liflifee
2

FPA Sustainable Packaging Steering Committee• George Thibeault Chairman Constantia Hueck Foils LLC• George Thibeault, Chairman, Constantia Hueck Foils LLC
• Dale Brockman, P&O Packaging, LLC
• Ron Cotterman, PhD, Sealed Air CorporationRon Cotterman, PhD, Sealed Air Corporation
• Glenn Emory, Printpack Inc.
• Paul Kearns, Exopack
• Mark Montsinger, Bryce Corporation
• Shanna Moore, DuPont Company
• Sal Pellingra, Ampac Packaging LLC
• Jim Rooney, Alcan Packaging
bd lh di S h h bil Ch i l C• Abdelhadi Sahnoune, PhD, ExxonMobil Chemical Company
• Jeff Wooster, The Dow Chemical Company 3

FPA/Battelle Research Task Group
• Dr. Ron Cotterman, Sealed Air Corporation
• Dr. Abdelhadi Sahnoune, ExxonMobil Ch i l CChemical Company
• Jeffrey Wooster, The Dow ChemicalJeffrey Wooster, The Dow Chemical Company
4
Flexible Packaging AssociationSustainability Advantages of Flexible Packaging Webinar Overview
I t d ti J h B A P k i LLC• Introduction‐ John Baumann, Ampac Packaging LLC
• Flexible Packaging Energy Consumption and G h G E i i B fit J ff W tGreenhouse Gas Emissions Benefits‐ Jeffrey Wooster, The Dow Chemical Company
O i f M i Fl ibl P k i E d f Lif• Option for Managing Flexible Packaging End‐of‐Life‐Dr. Ron Cotterman, Sealed Air Corporation
l ibl k i i bili d lki• Flexible Packaging Sustainability Advantages Toolkit‐Shanna Moore, DuPont Company
• Questions5

Energy ConsumptionEnergy Consumption,Greenhouse Gas Emissions
6

Facts and Assumptions Considered in l h llDeveloping the FPA Battelle Project
b l• Sustainability is a Business Fact
• Packaging is a target because it is so Visible
• Plastic is a target because oil and natural gas are finite resourcesare finite resources
• Flexible Packaging has End‐of‐Life Challenges
• Flexible Packaging is source reduced and creates Less Waste in the First Place
7

FPA Sustainability Task Group Identified d f f bla Need for Quantifiable Data
• FPA commissioned Battelle Memorial Institute to conduct research focused on
Energy Consumption
Greenhouse Gas Emissions
E d f Lif O ti End‐of‐Life Options
8

Battelle Research: Energy Consumption d C b F t i t A tand Carbon Footprint Assessment
• Selection of Representative Product/Packaging Alternatives• Selection of Representative Product/Packaging Alternatives Snack food, dried fruits – raisinsBeverages – water, wine, non‐carbonatedParcel Mailer‐ shipping containerMuscle Meat Cuts Salty Snacksy
• Technical Approach Streamlined LCA Streamlined LCAPublically Available Data System Boundaries LCI M d l LCI Models
9
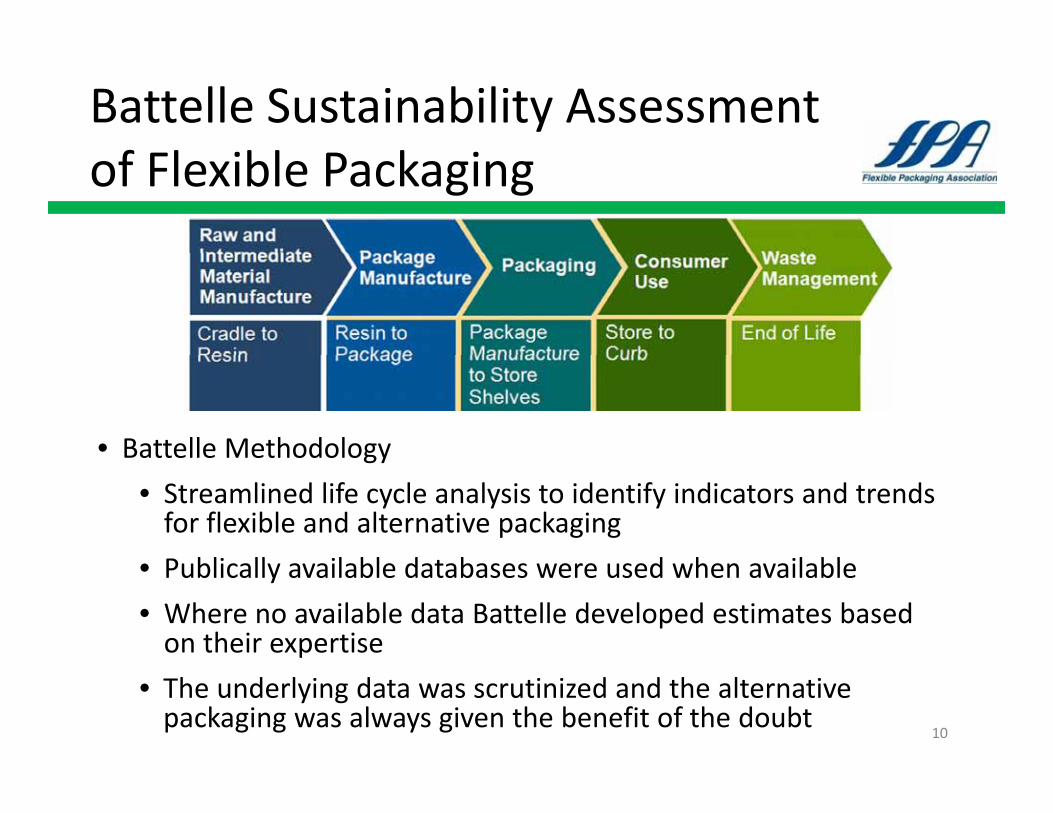
Battelle Sustainability Assessment f l bl kof Flexible Packaging
• Battelle Methodologygy
• Streamlined life cycle analysis to identify indicators and trends for flexible and alternative packaging
P bli ll il bl d t b d h il bl• Publically available databases were used when available
• Where no available data Battelle developed estimates based on their expertise
10
• The underlying data was scrutinized and the alternative packaging was always given the benefit of the doubt

Battelle Report Key Results Flexible & Alternative Packaging SystemsPackaging Systems
• Please note productPlease note product weight
• This representative data is illustrative ofdata is illustrative of the advantages of flexible packaging
11Source: Battelle Sustainability Assessment of Flexible Packaging Report, page iii

Beverage Package lTotal Energy Consumption
/Lite
r
Flexible packaging commonly used for beverages uses less energy across its life cycle than some alternative packaging.
12Sources: Source: Battelle Sustainability Assessment of Flexible Packaging Report and Flexible Packaging Sustainability Advantages Resource Guide

Beverage Package Carbon FootprintBeverage Package Carbon Footprint/L
iter
13
The carbon footprint of commonly used beverage pouch is lower than alternative packaging.
Sources: Source: Battelle Sustainability Assessment of Flexible Packaging Report and Flexible Packaging Sustainability Advantages Resource Guide

FPA Case StudyB P k iBeverage PackagingPlease note product weight.
Beverage Packaging
Product Weight
Packaging Weight
Product‐to‐Packaging Ratio
Packaging Weight per 100g
MSW Landfill per 100 g
Energy Consumption
MJ/8 oz
Emissions Kg CO2 e/8 oz
Product assumed to be water.
RatioProduct Product*
MJ/8 oz /8 oz
Glass Bottle & Metal Cap
8 ounces(236 g)
198.4 g 1:1 83.9 g 54.5 g 3.36 0.29
Plastic PET Bottle 8 ounces22 7 10 1 9 6 6 0 3 00 0 18
& Cap (236 g)22.7 g 10:1 9.6 g 6.0 g 3.00 0.18
Aluminum Can
8 ounces(236 g)
11.3 g 21:1 4.7 g 2.4 g 0.99 0.08
Stand‐up Flexible 6 75 ouncesStand up Flexible Pouch
6.75 ounces(199 g)
5.7 g 35:1 2.8 g 2.8g 0.45 0.02
Sources: FPA Fast Facts: Less Resources. Less Footprint. More Value., FPA's Flexible Packaging: Less Resources. Less Footprint. More Value. Case Story Brochure, and FPA Flexible Packaging: A Sustainable Solution PowerPoint Presentation
Cradle‐to‐grave life cycle energy consumption and CO2 emissions data developed for FPA by Battelle Memorial Institute.
Packaging weight, product weight, and product‐to‐packaging ratio calculated by Packaging & Technology Integrated Solutions, LLC (PTIS)
*Recycling rates factored: U.S. EPA 2007 MSW Report.14

Flexible Packaging Uses Less ResourcesIn addition to energy saved in manufacturing, flexible packaging IsIn addition to energy saved in manufacturing, flexible packaging Is significantly source reduced
60 pounds of beverage 50 pounds of glass
6 pounds of Rigid PET
3 pounds of aluminum
1.5 pounds of Flexible plastic
= = = p
Contributing less weight for transportation, saving significant energy and therefore reducing emissions
Sources: Dow Presentation and FPA Flexible Packaging: A Sustainable Solution PowerPoint Presentation 15
therefore reducing emissions

Flexible Packaging Improves ffTransportation Efficiency
T t ti i f i fl ibl k i f t l j
• Reduces Fossil Fuel Consumption and CO2emission
Transportation savings of using flexible packaging for pasta sauce versus glass jars.
• Lessens Highway Wear/Tear and Congestion
Less Fuel consumed &26 Truckloads of Unfilled
Glass JarsOne Truckload of Unfilled
Plastics Pouches
Less Fuel consumed & Less emissions= =
Sources: DuPont Awards for Packaging Innovation, FPA Fast Facts: Less Resources. Less Footprint. More Value. and FPA Flexible Packaging: A Sustainable Solution PowerPoint Presentation 16
End of Life OptionsEnd of Life Optionsfor Flexible Packagingg g
17

End of Life l ibl k iFlexible Packaging
• The end of life of flexible packaging is often a focus of• The end of life of flexible packaging is often a focus of consumer concern
• Other than landfill, the infrastructure for disposal of post‐, p pconsumer flexible packaging are limited
• However flexible packaging is significantly source reduced
– Resulting in less waste to the landfill
– Additionally, pre‐consumer (post industrial) recycling and reclamation significantly reduces waste to the landfillreclamation significantly reduces waste to the landfill
• With Battelle, FPA has developed factual, base‐line information around end of life options
18

End‐Of‐Life Optionsll hBattelle Research
• Background on Municipal Solid Waste• Background on Municipal Solid Waste
EPA Hierarchy
• Overview of Recycling and Infrastructure Challenges Technologies
Plastic Recycling
Current and New Technologies
International Insights
Opportunities For Flexible Packaging
• Overview of Waste to Energy (Energy Recovery)
Infrastructure
• Overview of Waste to Energy (Energy Recovery)
U.S. and Global Perspectives
Emissions
Energy Savings19
Economics

Options for Managing l dSolid Waste
Flexible PackagingFlexible Packaging
• Source reduction avoids waste in the first place
li i id l
Most Preferred
• Pre‐consumer recycling is widely practiced but flexible packaging recycling is not compatible with post consumer collection systems
Source Reduction and Reuse
Recyclingconsumer collection systems
• Typically designed to be durable and will not degrade during composting
Recycling
Composting
• Offers significant potential for energy recovery from waste.
Waste to Energy
Landfill or incineration with no energy recovery
Least PreferredLeast PreferredU.S. EPA Solid Waste Management Hierarchy
20Source: FPA Flexible Packaging: A Sustainable Solution PowerPoint Presentation

Flexible Packaging Sends LESS h df llto the LandfillEven after recycling rates are considered, flexible packaging
Beverage Packaging Example:
To MSW
in most cases contributes less to the landfill.
Product Package Package Recycle Rate MSW Landfill
54 5
LandfillWeight(g)
Weight(g)
Wt per 100 g Product
(g)
Glass Bottle &
per 100 g Product (g)
6.0
54.565%
63%
Glass Bottle & Metal Cap 236 198.4 83.9 35%
Plastic PET bottle & Cap 236 22.7 9.6 37%
2.451%Aluminum Can 236 11.3 4.7 49%
2.8
Sources: FPA Case Studies, 2009; EPA 2007 MSW Report
100%
21
Flexible Stand Up Pouch 199 5.7 2.8 0%

Recycling Optionsf l bl kfor Flexible Packaging
l f l l l d• Recycling of internal scrap materials in closed loop systems
• Recycling of pre‐consumer films and bags in closed loop systems
• Recycling of post‐consumer flexible packaging via municipal waste collectionvia municipal waste collection
22

Waste to Energy (Energy Recovery)A Renewable Source of EnergyA Renewable Source of Energy
• The EPA recognizes waste to energy as a clean reliable• The EPA recognizes waste to energy as a clean, reliable, renewable source of energy.*
• In 2007 87 WTE plants operated in 25 U S states and processed• In 2007, 87 WTE plants operated in 25 U.S. states and processed 28.7 million tons of trash
• The U S annual WTE capacity is equivalent to a savings of 29• The U.S. annual WTE capacity is equivalent to a savings of 29 million barrels of oil or 10 million tons of coal annually.
1 ton combusted MSW:MSW = Municipal Solid Waste
1/3 ton coal
1 barrel oil==
*Letter from U.S. EPA to Integrated Waste Services Association, February 14, 2009
Source: FPA/Battelle Study, 2009 23

Waste to Energy (Energy Recovery) fiBenefits
• Energy benefitsEnergy benefits
– waste‐to‐energy facilities generate approximately 17 billion kilowatt‐hours annually‐ roughly 20 percent of the nation’s non‐hydroelectric renewable energy
• GHG benefits
avoided methane emissions from landfills– avoided methane emissions from landfills.
– avoided CO2 emissions from fossil fuel combustion.
– avoided CO2 emissions from metals production – WTEavoided CO2 emissions from metals production WTE plants recover more than 700,000 tons of ferrous metals for recycling annually.
2007 IWSA http://www wte org/2007 IWSA http://www.wte.org/
Source: EPA presentation, 2008 Fall SPC Meeting
24

Potential Energy Recovery for Flexible P k d Al i E d f LifPackages and Alternatives at End‐of‐Life
Case Studies Packaging Alternatives ComparedPotential Energy
RecoveryPotential Energy
RecoveryCase Studies Packaging Alternatives Compared Recovery(MJ)
Recovery(%)
Flexible Pouch, per 24 oz. raisins (Dried fruits, Nuts, Cereals, Snack foods
Paperboard Canister with Plastic Lid (3)(4) 0.96 44.2
Paperboard Box with Inner Poly Bag (3)(4) 0.40 20.5
Stand up Flexible Pouch (4) 0 51 48 1,
Stand‐up Flexible Pouch (4) 0.51 48.1
Flexible Beverage Pouch, per liter (Juices, Wine, Water, Non‐carbonated beverages
Glass Bottle and Closure (1)(3)(4) 0 0
Plastic PET Bottle and Cap (1)(3)(4) 5.5 42.8
Aluminum Can (4) 0 0
Stand‐up Flexible Pouch (4) 0.52 27.3
Parcel Mailer, per mailer (Shipping Containers)
Recycled Paperboard Mailer (2)(3) 1.13 23.5
HDPE Flexible Pouch Mailer (2) 1.35 40
Whole Muscle Meat CutsWhole Muscle Meat Cuts, per pound (Ribs, Roasts, Whole Poultry, Hams)
Shrinkwrap PE Film (4) 0.10 38.7
Salty Snack Bag, per square meter (Chips, Pretzels, Tortilla Chips)
Flexible Bag 2.11 35.4
25
Tortilla Chips)
Source: Battelle Sustainability Assessment of Flexible Packaging Report

End of Life Optionsd dToday and Tomorrow
Enhanced Options for Flexible Packaging
Option Today Tomorrow
Enhanced Options for Flexible Packaging
Source Reduction Significant reductions in packaging weight
Continued enhancement of material efficiency
Recycling Predominately pre‐consumer material flows
New technology for mixed plastics recycling
Energy Recovery Dominated by municipal WTE facilities
New technology for local and municipal waste‐to‐fuel/feedstockfuel/feedstock
26
Flexible PackagingFlexible Packaging Sustainability Advantages Toolkit
27
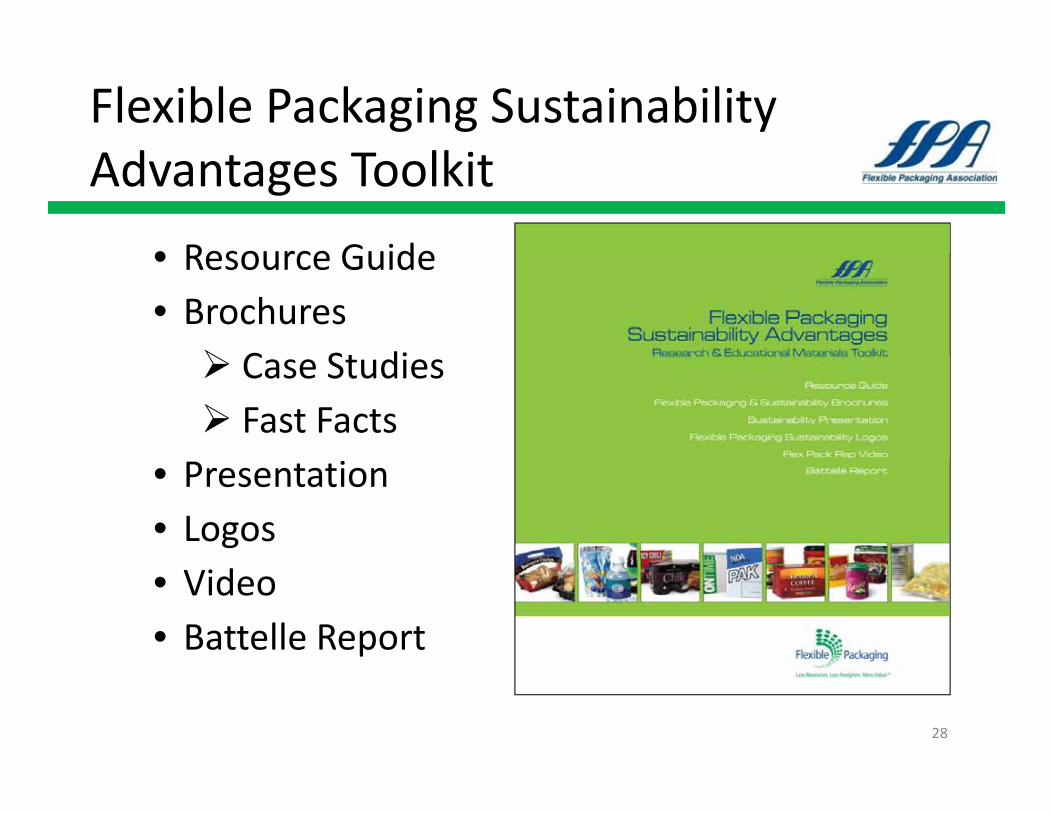
Flexible Packaging Sustainability d lkAdvantages Toolkit
• Resource Guide• Resource Guide• Brochures C St di Case Studies Fast Facts
• Presentation• Logos• Video• Battelle Report
28

Flexible Packaging Sustainability d dAdvantages Resource Guide
• Sustainability Overview• Summary of the Battelle Sustainability Assessment of Flexible Packaging• Summary of the Battelle Sustainability Assessment of Flexible Packaging
research energy consumption and greenhouse gas emissions end of life options end‐of‐life options
• Frequently Asked Questions• Includes details on FPA Case Studies 29

FPA's Flexible Packaging: Less Resources. Less F i M V l C S B hFootprint. More Value. Case Story Brochure
• Describes product and package weight, product to package ratio, energy and emissions of Flexible Packaging and alternative packaging systems
30

FPA Fast Facts: Less Resources. Less lFootprint. More Value.
A business‐card size brochure describing the Sustainability Advantages of Flexible Packaging
31

Flexible Packaging: A Sustainable lSolution: A PowerPoint Presentation
32

Flexible Packaging LogosFlexible Packaging Logos
• Flexible Packaging Association has created four logos for the exclusive useFlexible Packaging Association has created four logos for the exclusive use and download by FPA members. The logos promote Less Resources, Less Footprint, More Value, sustainability advantages of flexible packaging
33

Battelle Sustainability Assessment of l bl kFlexible Packaging
Battelle developed this sustainability study for FPA with focus on two primary areas:
• Understand the life cycle energy consumption and carbon footprint of flexible packages compared toof flexible packages compared to alternatives, and
• Explore the options for t f fl ibl kmanagement of flexible packages
at the end of their useful lives
34

FPA Flex Pack Rap VideoFPA Flex Pack Rap Video
A 2 5 i t t t i i id th S t i bilit• A 2.5 minute entertaining video on the Sustainability Advantages of Flexible Packaging
http://www.flexpack.org/MEMONL/mo_sustainable_packaging/sustainable_packaging_toolkit/public_sustainable_packaging_FlexPackRap.asp?ContactID=
http://www.youtube.com/watch?v=GN5xtc_6piop y _ p
35Source: FPA website, www.flexpack.org, YouTube

FPA Member Go Tell the Flexible kPackaging Story
Flexible Packaging as compared to alternative packaging formats
• Uses Less Resources
• Consumes Less Energy Through Out Its Lifecycle
M f t i Manufacturing
Transportation
• Generates Less Greenhouse Gas Emissions
• Contributes Less to the Landfill
Even after recycling rates are considered
C l h l i Can lower mass than some alternatives
• Provides Opportunities for Energy Recovery
In Waste to Energy Facilities and gy
Waste to Fuel/Feedstock Technology36

Questions?Questions?
Please contact FPA for additionalPlease contact FPA for additional copies of Toolkit Materials
410 694 0800410‐694‐0800
37