flexural behavior of large glued-laminated beams · flexural behavior of large . glued-laminated...
TRANSCRIPT

U. S. FOREST SERVICE RESEARCH PAPER
FPL 72 DECEMBER 1966
FOREST PRODUCTS LABORATORY| FOREST SERVICE | U. S. DEPARTMENT OF AGRICULTURE | MADISON, WIS
FLEXURAL BEHAVIOR OF LARGE
GLUED-LAMINATED BEAMS
ABSTRACT
With the fabrication of glued-laminated beam to almost any size, it becomes increasingly important to insure that design procedures used axe correct. This study shows that the average modulus of rupture for the large clear beams tested was within 2 percent of that predicted by the size-strength relationship recently published in “Effect of Size on Bending Strength of Wood Members” (U.S. FS res. paper FPL 56). For structural beams, however, the average modulus of rupture as given by the IK/IG relationship (published in U.S.D.A. Tech
Bull. 1069) was approximately 50 percent more than that determined experimentally. The IK/IG concept defines the
effect of knots on the strength of glued-laminated beams. Six Douglas-fir beam were evaluated--three fabricated
from clear straight-grained lumber and three from structural lumber. The beams were 9 inches wide by 31-1/2 inches deep by feet long, and contained 21 laminations. The average modulus of rupture for the clear beams was 8,400 p.s.i. (pounds per square inch), and for the structural beams was 4,450 p.s.i. The average modulus of elasticity values were 2,090,000 p.s.i. for clear beams and 1,930,000 p.s.i. for structural beams.
Results of this research should lead to new design procedures for size effect. The need for further research is also indicated to obtain a better understanding of the effect of knots on the strength of laminated beams.
FLEXURAL BEHAVIOR OF LARGE1
GLUED-LAMINATED BEAMS by BILLY BOHANNAN, Engineer
Forest Products Laboratory2
Forest Service U. S. Department of Agriculture
INTRODUCTION
Wood members having large sizes are now possible, using the techniques of glued-laminated construction. During the last 30 years, these techniques have been developed so that members of almost any size and shape can be fabricated. Straight members exceeding 100 feet in length and 5 feet in depth are not uncommon Curved arch-type members have been used to provide a 300-foot clear span building.
Most design procedures were developed from data on members having relatively small sizes, with only a limited number of large-size members being tested. Since the size of glued-laminated
seemingly will continue to increase, research is needed to insure that the design criteria used are correct.
One specific factor of design that is not fully understood is that of effect of depth or size on bending strength. As the size of a wood member increases, there is a decrease bending strength. The Forest Products Laboratory has recently
completed research So more clearly define this size-strength phenomenon (1).3
Another design factor is that of effect of hots on strength of glued-laminated beam, A relation-ship was developed in 1947 which relates bending strength to knot distribution in a beam (3).
Data on beams of moderately large size were needed to check the relationships of effect of size and of knots on bending strength The beams described in this paper were designed to furnish limited data to check both relationships.
This study evaluates the flexural behavior of six laminated beam, each having twenty-one 1-1/2-inch-thick Douglas-fir laminations. The finished size of the beams was 9 inches wide by 31-1/2 inches deep by 50 feet long. Three were designed as clear straight-grained wood beams, and three were designed as structural grade beams containing strength- reducing characteristics as could be found in commercially produced lam-inated beams.
1This research was done in cooperation with the Forest Products Association. Acknowledgment is gratefully extended to: the Rosboro Lumber Company, Springfield, Oreg., who assisted in the selection of lumber; Unit Structures, a Division of Koppers Company, Inc., Peshtigo, Wis., who provided the laminating services needed; and the Association of American Railroads Research Labora-tory, Chicago, Ill., who conducted the tests of the full-sire beams.
2Maintained at Madison, Wis., in cooperation with the of Wisconsin. 3Underlined numbers in parentheses refer to Literature Cited at the end of this Paper.
MATERIAL, DESIGN, AND FABRICATlON
Material
The beams were fabricated from coast-region Douglas-fir. Three were fabricated from a com-bination of clear straight-grained material and of “L1” grade material, and three from a com-bination of “L2 Dense,” “L2,” and “L3” grades of Douglas-fir. The “L” grades are laminating grades (7).
The requirements for the clear material were that it meet the B and Better or C grade of lum-ber as given by paragraphs 101, 101-b, and 101-c of the Standard Grading and Dressing Rules of the West Coast Lumber Inspection Bureau (7). Additional requirements were 1 in 20 or flatter slope of grain, only an occasional pin knot, no wane, and that the material be a mixture of both flat and vertical grain. In essence, this material was to be average Douglas-fir having no visible strength-reducing characteristics.
Material of this very select grade was picked and stockpiled from the daily production of a commercial lumber producer in Oregon far a period of about 2 months. The final selection of the clear material was made from the stock-piled supply by Forest Products Laboratory personnel.
The requirements of the “L” grades were as given in paragraphs 154, 154-a, 154-b, and 154-bb of the previously indicated grading rules (7). An additional requirement of 1 in 10 slope of grain was placed on the “L2 Dense” grade. The “L” grades were purchased as graded by commercial lumber graders.
All material was specified to be kiln-dried to an average moisture content of 10 to 12 percent with no one board having a moisture content greater than 15 percent. As checked with a resistance-type moisture meter, the material when delivered and also when laminated was
at desired moisture content.
Design
The finished beams were 9 inches wide by 31-1/2 inches deep by 50 feet long. This size was arbitrarily chosen to represent beams of moderately large size that could be conveniently
tested. The beams contained twenty-one 1-1/2-inch-thick laminations. The end joints in the laminations were plain scarf joints having a 1 in 10 slope.
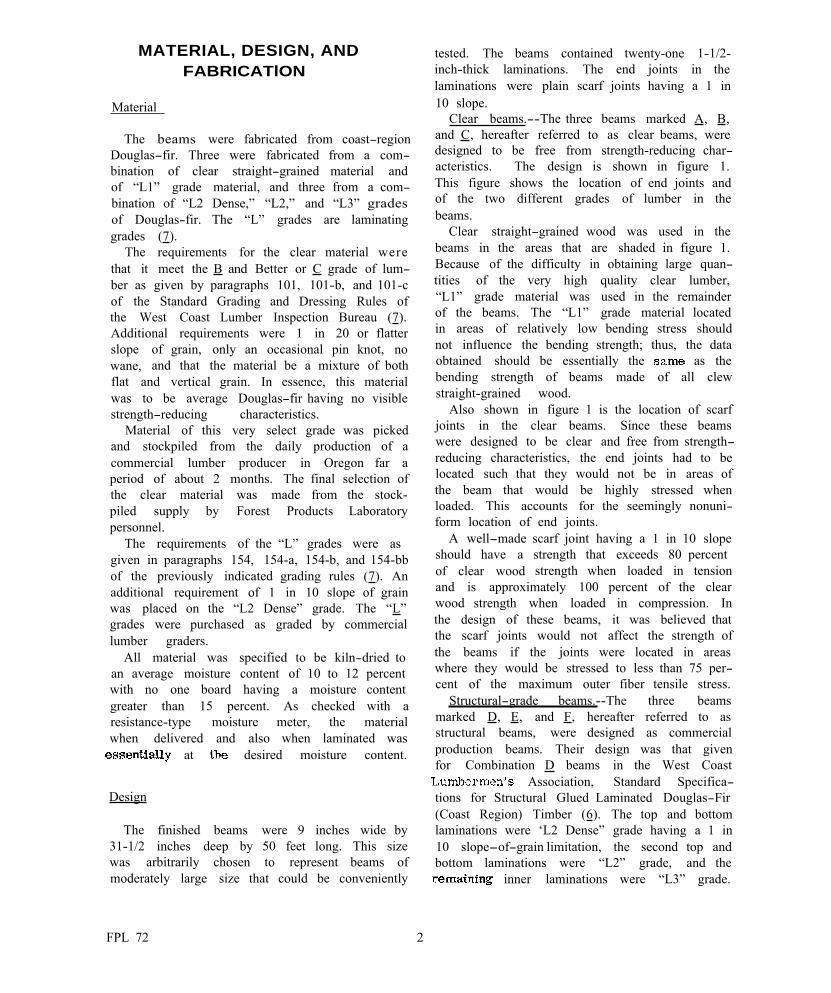
Clear beams.--The three beams marked A, B, and C, hereafter referred to as clear beams, were designed to be free from strength-reducing char-acteristics. The design is shown in figure 1. This figure shows the location of end joints and of the two different grades of lumber in the beams.
Clear straight-grained wood was used in the beams in the areas that are shaded in figure 1. Because of the difficulty in obtaining large quan-tities of the very high quality clear lumber, “L1” grade material was used in the remainder of the beams. The “L1” grade material located in areas of relatively low bending stress should not influence the bending strength; thus, the data obtained should be essentially the as the bending strength of beams made of all clew straight-grained wood.
Also shown in figure 1 is the location of scarf joints in the clear beams. Since these beams were designed to be clear and free from strength-reducing characteristics, the end joints had to be located such that they would not be in areas of the beam that would be highly stressed when loaded. This accounts for the seemingly nonuni-form location of end joints.
A well-made scarf joint having a 1 in 10 slope should have a strength that exceeds 80 percent of clear wood strength when loaded in tension and is approximately 100 percent of the clear wood strength when loaded in compression. In the design of these beams, it was believed that the scarf joints would not affect the strength of the beams if the joints were located in areas where they would be stressed to less than 75 per-cent of the maximum outer fiber tensile stress.
Structural-grade beams.--The three beams marked D, E, and F, hereafter referred to as structural beams, were designed as commercial production beams. Their design was that given for Combination D beams in the West Coast
Association, Standard Specifica-tions for Structural Glued Laminated Douglas-Fir (Coast Region) Timber (6). The top and bottom laminations were ‘L2 Dense” grade having a 1 in 10 slope-of-grain limitation, the second top and bottom laminations were “L2” grade, and the
inner laminations were “L3” grade.
FPL 72 2
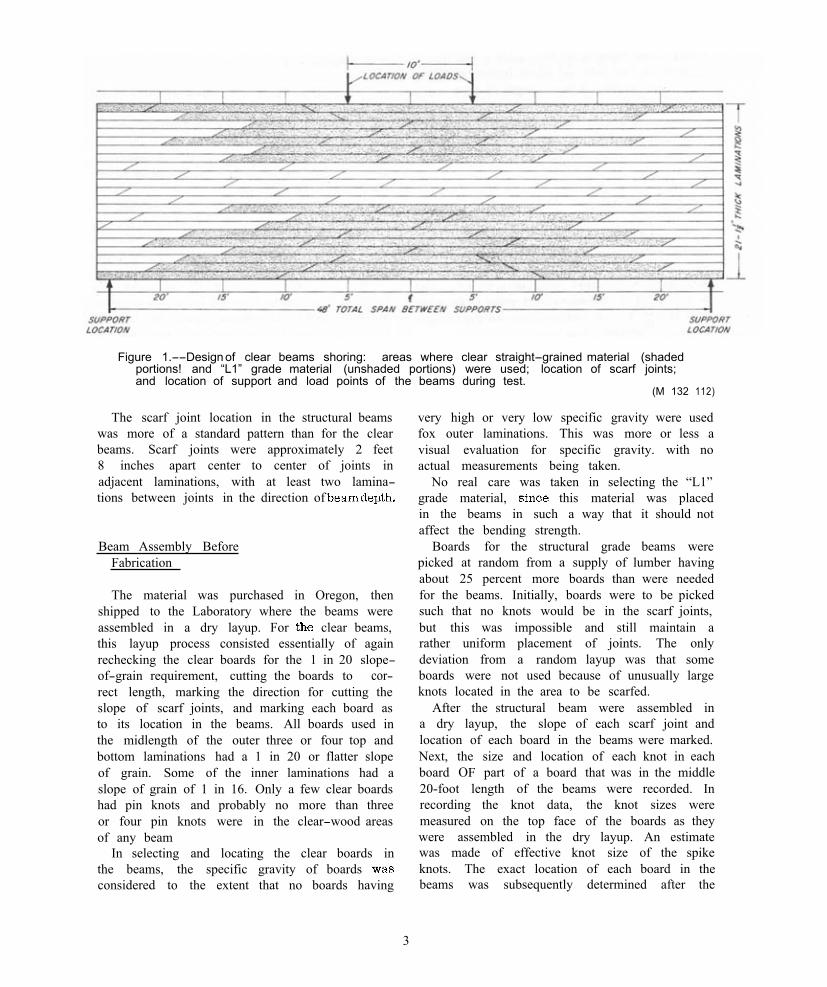
Figure 1.--Design of clear beams shoring: areas where clear straight-grained material (shadedportions! and “L1” grade material (unshaded portions) were used; location of scarf joints; and location of support and load points of the beams during test.
(M 132 112)
The scarf joint location in the structural beams was more of a standard pattern than for the clear beams. Scarf joints were approximately 2 feet
inches apart center to center of joints in adjacent laminations, with at least two lamina-tions between joints in the direction of
Beam Assembly Before Fabrication
The material was purchased in Oregon, then shipped to the Laboratory where the beams were assembled in a dry layup. For clear beams, this layup process consisted essentially of again rechecking the clear boards for the 1 in 20 slope-of-grain requirement, cutting the boards to cor-rect length, marking the direction for cutting the slope of scarf joints, and marking each board as to its location in the beams. All boards used in the midlength of the outer three or four top and bottom laminations had a 1 in 20 or flatter slope of grain. Some of the inner laminations had a slope of grain of 1 in 16. Only a few clear boards had pin knots and probably no more than three or four pin knots were in the clear-wood areas of any beam
In selecting and locating the clear boards in the beams, the specific gravity of boards considered to the extent that no boards having
very high or very low specific gravity were used fox outer laminations. This was more or less a visual evaluation for specific gravity. with no actual measurements being taken.
No real care was taken in selecting the “L1” grade material, this material was placed in the beams in such a way that it should not affect the bending strength.
Boards for the structural grade beams were picked at random from a supply of lumber having about 25 percent more boards than were needed for the beams. Initially, boards were to be picked such that no knots would be in the scarf joints, but this was impossible and still maintain a rather uniform placement of joints. The only deviation from a random layup was that some boards were not used because of unusually large knots located in the area to be scarfed.
After the structural beam were assembled in a dry layup, the slope of each scarf joint and location of each board in the beams were marked. Next, the size and location of each knot in each board OF part of a board that was in the middle 20-foot length of the beams were recorded. In recording the knot data, the knot sizes were measured on the top face of the boards as they were assembled in the dry layup. An estimate was made of effective knot size of the spike knots. The exact location of each board in the beams was subsequently determined after the
3
8

beams were fabricated. This made it possible to analyze the data and obtain the knot distribu-tion in the middle 20-foot length of each beam.
After all six beams were assembled in a dry layup and all boards marked so that beams could
reassembled as designed, the lumber was shipped to a commercial laminator for fabrication.
Fabrication of Beams
The beams were fabricated using commercial plant procedures and equipment. Scarf joints were cut preglued prior to fabrication. Then the full-length laminations were surfaced both sides to a 1-1/2-inch thickness just prior to face-to-face gluing. A room temperature-setting phenol-resorcinol adhesive was used,
The completed beams were surfaced both sides to a 9-inch width. A very light planer cut was made on the top and bottom faces of the beams to clean and square these faces. The ends of the beams were squared to a 50-foot length.
The finished beams were double-wrapped with heavy water-resistant paper to protect them during shipment and while stared before testing.
TEST PROCEDURES AND EQUIPMENT
The beams were tested at the American Asso-c i at i on of Railroads Engineering Research Laboratory in Chicago, Ill. A sketch of the loading setup is shown in figure 2, the loading equipment is shown in figure 3, and a general view of a beam in the loading frame is shown in figure 4.
Loading Equipment
The loading equipment consisted of two sets of hydraulic jacks, one set having a 50-ton-per-jack capacity and the other set having a 25-ton-per-jack capacity. The ram stroke of the jacks
about 4-1/2 inches, making it necessary to transfer loading from one set of jacks to other set during testing.
The jacks have lapped-ram pistons that are precision-machined to seduce friction so that oil pressure to jacks is an accurate indication of load. Spherical seats at each end of the jacks insure concentric loading.
The oil pressure to the 25-ton jacks was supplied with a minimum-load of a pulsator and measured with a pressure gage. The pulsator is usually used for repeated-load tests but can be used for static tests by keeping the maximum and minimum cyclic load settings equal.
The oil pressure for the 50-ton jacks was supplied and measured by a pendulum dynamo-meter. The load applied to the jacks is measured from pressure applied to a measuring piston which actuates a pendulum. A higher pressure on the piston is balanced by a higher swing of the pendulum. The rate of loading is controlled auto-matically with the pendulum dynamometer.
This loading method was more nearly a dead-load type of loading than most testing methods. Most testing machines are actually deflection machines on which load is measured by a function of the deflection of the beam. When failure starts, the load is reduced because the section modulus of a beam decreases and less load is required for the same deflection. The response of the hydraulic system used in these tests was such that load did not decrease with initial failure;
Figure 2.--Loading setup for testing large beams. Numbers shown on loading jacks indicate capacity of jacks in tons. (M 132 116)
FPL 72 4

thus, the leading method used dead loading.
This loading method was more nearly a dead-load type of loading then most testing methods. Most testing machines are actually deflection machines on which load is measured by a function of the deflection of the beam When failure starts, the load is reduced because the section modulus of a beam decreases and less load is required for the same deflection. The response of the hydraulic system used in these tests was such that load did not decrease with initial failure; thus, the loading method used simulated dead loading,
Test Procedures
A sketch of the loading setup is shown in figure 2 and a general view of beam in loading frame is shown in figure 4. The beams were supported on a knife-edge support at one end and on a roller support at the other. The ends of the
Figure 3.--Arrangement of jacks used in loading beams. (M 130 602)
Figure 4.--General view of beam in loading frame after completion of test. Bean ends were held in vertical aIinement by steel straps anchored to Searing supports, and lateral buckling was prevented by wood members anchored to columns of the loading (M 130 603)
beams were held in vertical alinement by steel strapping, as shown in figure 4. The beams were held laterally at the approximate third point of span by wood braces anchored to columns of the loading frame (fig. 4). Several layers of plastic film were placed between lateral braces and test beam to reduce friction as the beam deflected during loading.
Load was applied at points 5 feet each aide of midlength of beams as shown in figure 2. During testing, a steel beam was used to distribute load from the hydraulic jacks. Since ram stroke of the jacks was only 4-1/2 inches, it was neces-sary to transfer loading from one set of jacks to the other set during a test. In general, the loading was done with the 50-ton jacks; when ram extension was reached the load was held with
25-ton jacks until the 50-ton jacks could be reset. On the structural beams that were tested first, some initial loading was done with the 25-ton jacks, but a more uniform speed of testing and a more accurate control of loading was possible using the 50-ton jacks. For the remainder of the tests, therefore, loading was done with the 50-ton jacks ,
The transfer of loading between sets of jacks took about 2 to 3 minutes. Two such transfers were necessary when testing the clear beams.
Loading of each beam was stopped after each 4,000-pound increment of load to allow time to observe and record data until the load reached 40,000 pounds. The loading was then continuous to failure, Rate of loading was such to produce about 0.6-inch centerline deflection per minute.
Data Obtained
Data taken during tests included centerline deflections of beam over a 7-foot length between load points, deflections between supports, and strains on top and bottom faces of beams at midlength. On the clear beams.. strains were recorded with rosette gages at mid-length, at a location one-half the distance between support and load point, and at a location near one support.
Deflections between load points were measured to the nearest 0.001 inch with a dial, gage attached to a light yoke and to a nail located at
and midlength of beam. The yoke
supported on nails at and 3-1/2 feet each side of midlength of beam Centerline deflec-tions between supports were measured to the nearest 0.01 inch with a taut wire and scale. Wire was stretched between nails located at middepth of the beam above supports, and the scale was located midlength of beam. Deflec-tion was determined as movement of the scale relative to the taut wire. A telescope was used to read the deflections on the scale.
Longitudinal strain was measured on the top and bottom of the beams at midlength with 6-inch SR-4 wire strain gages. Two gages were used on each face of the beams. Strains were measured on one side of the clear beams with I-inch rosette gages. Three rosette gages were used at the midlength of the beams. These gages were located at approximately one-fourth the depth from top and bottom of beam at mid-depth of beam. Strains were measured with five rosette gages located at one-half the distance between support and load point. On beam A, strains were recorded with five rosette gages 18 inches from centerline of support: on beam B, gages were 30 inches from centerline of support; and on beam C, 54 inches from support. At each location where five rosette gages were used, the
were located on the second lamination from top and bottom of beams at about one-fourth depth from and bottom, and at middepth.
Minor Tests
After failure of each beam, a section about 1 foot long was cut from the approximate mid-length of the beams. From this section, specimens were cut from each lamination to determine specific gravity and moisture content.
Two other sections about 3 feet long were from each side of midlength of the clear beams. A 1- by 1- by 16-inch and a 1- by 1- by 23-inch bending specimen were prepared from each of the top and bottom five laminations in these 3-foot-long sections. The 16-inch-long specimens were evaluated in bending under center loading on 14-inch span, and the 23-inch-long specimens were tested under third-point loading on 21-inch span.
All minor tests were made at the Forest Products Laboratory.
72 6
PRESENTATION OF DATA AND DISCUSSION OF RESULTS
Flexural Strength Data
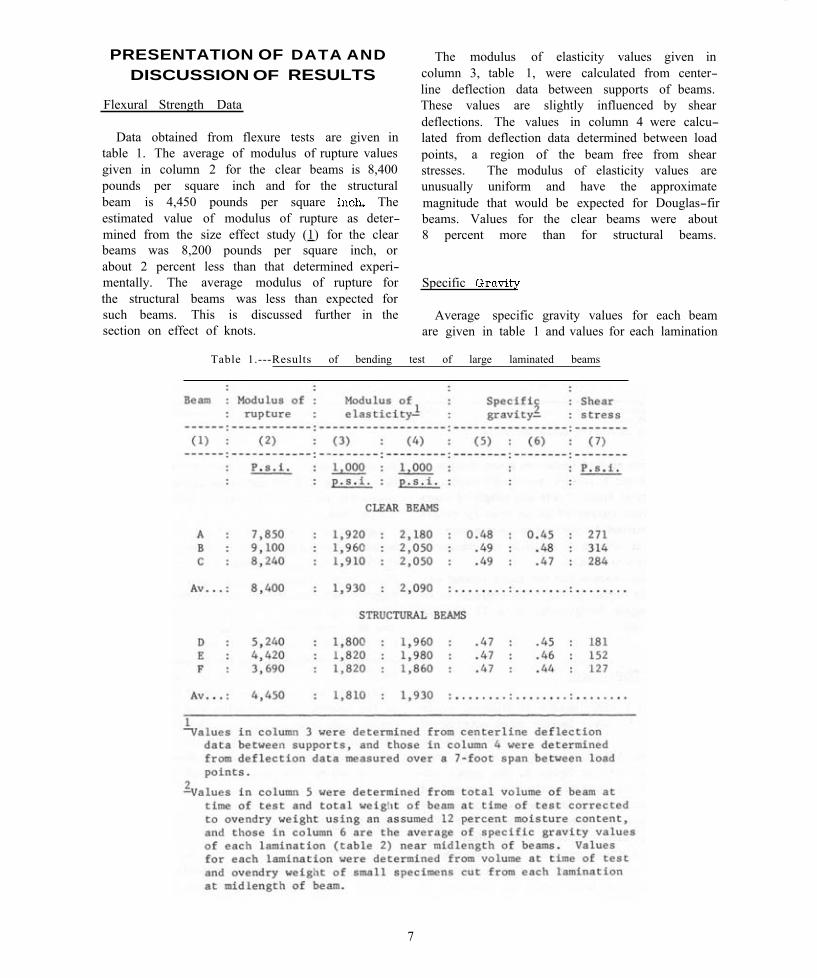
Data obtained from flexure tests are given in table 1. The average of modulus of rupture values given in column 2 for the clear beams is 8,400 pounds per square inch and for the structural beam is 4,450 pounds per square The estimated value of modulus of rupture as deter-mined from the size effect study (1) for the clear beams was 8,200 pounds per square inch, or about 2 percent less than that determined experi-mentally. The average modulus of rupture for the structural beams was less than expected for such beams. This is discussed further in the section on effect of knots.
Table 1.---Results of bending
The modulus of elasticity values given in column 3, table 1, were calculated from center-line deflection data between supports of beams. These values are slightly influenced by shear deflections. The values in column 4 were calcu-lated from deflection data determined between load points, a region of the beam free from shear stresses. The modulus of elasticity values are unusually uniform and have the approximate magnitude that would be expected for Douglas-fir beams. Values for the clear beams were about 8 percent more than for structural beams.
Specific
Average specific gravity values for each beam are given in table 1 and values for each lamination
test of large laminated beams
7
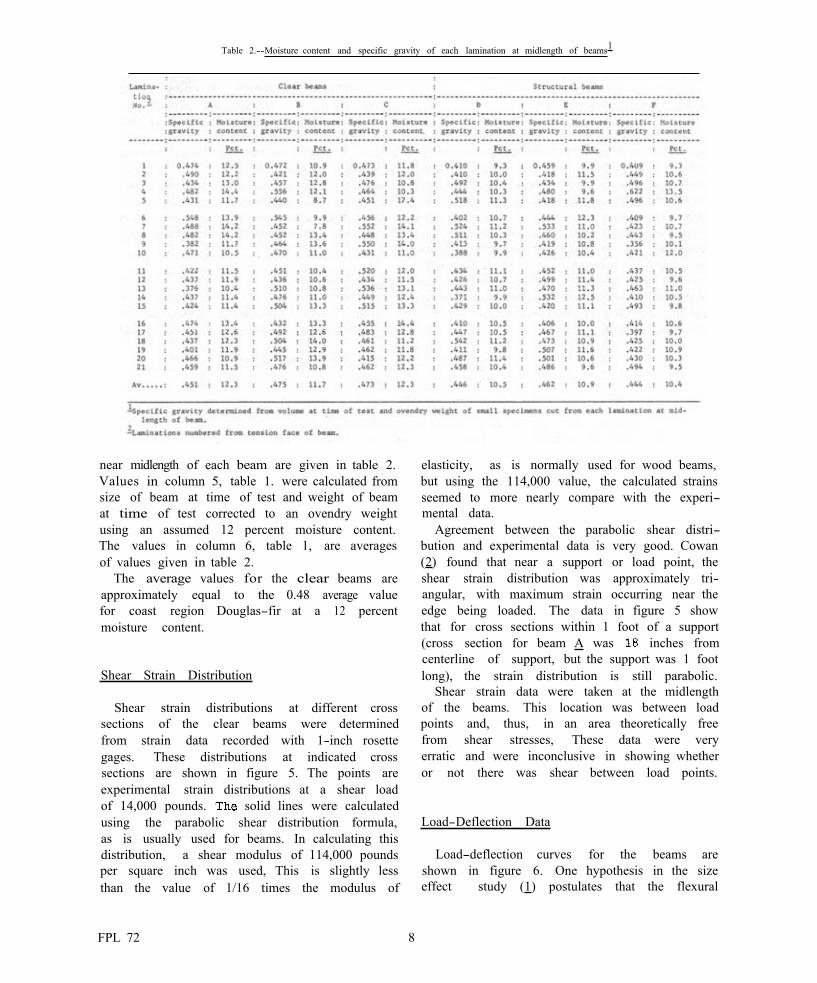
Table 2.--Moisture content and specific gravity of each lamination at midlength of beams1
near midlength of each beam are given in table 2. Values in column 5, table 1. were calculated from size of beam at time of test and weight of beam at time of test corrected to an ovendry weight using an assumed 12 percent moisture content. The values in column 6, table 1, are averages of values given in table 2.
The average values for the clear beams are approximately equal to the 0.48 average value for coast region Douglas-fir at a 12 percent moisture content.
Shear Strain Distribution
Shear strain distributions at different cross sections of the clear beams were determined from strain data recorded with 1-inch rosette gages. These distributions at indicated cross sections are shown in figure 5. The points are experimental strain distributions at a shear load of 14,000 pounds. solid lines were calculated using the parabolic shear distribution formula, as is usually used for beams. In calculating this distribution, a shear modulus of 114,000 pounds per square inch was used, This is slightly less than the value of 1/16 times the modulus of
elasticity, as is normally used for wood beams, but using the 114,000 value, the calculated strains seemed to more nearly compare with the experi-mental data.
Agreement between the parabolic shear distri-bution and experimental data is very good. Cowan (2) found that near a support or load point, the shear strain distribution was approximately tri-angular, with maximum strain occurring near the edge being loaded. The data in figure 5 show that for cross sections within 1 foot of a support (cross section for beam A was inches from centerline of support, but the support was 1 foot long), the strain distribution is still parabolic.
Shear strain data were taken at the midlength of the beams. This location was between load points and, thus, in an area theoretically free from shear stresses, These data were very erratic and were inconclusive in showing whether or not there was shear between load points.
Load-Deflection Data
Load-deflection curves for the beams are shown in figure 6. One hypothesis in the size effect study (1) postulates that the flexural
FPL 72 8

Figure 5.--Observed and calculated shear strains at different cross sections of c lear beams. Solid lines are calculated strain distributions assuming a shear modulus of 114,000 pounds per square inch, and points are values determined experimentally. (M 132 114)
Figure 6.--Load-deflection curves for large beams. (M 132 113)
9
behavior of large beams was elastic to failure. The data in figure 6 show that the load deflection relationship for the beams was nearly linear to failure, thus this hypothesis.
Effect of Knots on Structural Beams
The effect of knots on bending strength of laminated beams is based on an IK/IG concept
where I is the moment of inertia about theK centrodial axis of a cross section, of area3 of knots within 6 inches to either side of the section. IG is the moment of inertia of the full cross
section. A relationship between strength ratio (strength of beams with knots to strength of clear wood beams) and IK/IG ratio has been developed
(3). This relationship is used in determining allowable stresses for laminated beams.
As a check an the IK/IG relationship, the
IK/IG ratio for each of the three structural
beams was determined. The size and location of
knots all boards making up the middle 20-foot length of all laminations were recorded prior to
the beams. After the beams were fabricated, the location of the boards in the beams was determined. Thus it was possible to closely approximate the location of all knots in the middle 20-foot length of the beams.
By use of a computer, the IK/IG ratios for
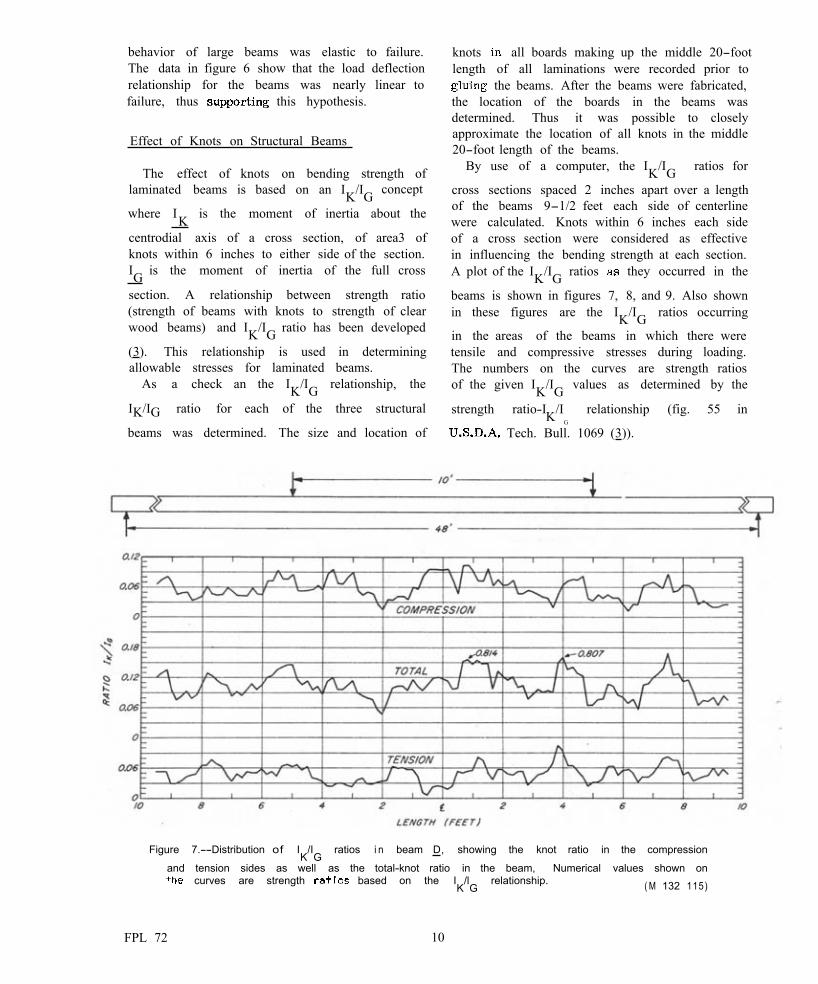
cross sections spaced 2 inches apart over a length of the beams 9-1/2 feet each side of centerline were calculated. Knots within 6 inches each side of a cross section were considered as effective in influencing the bending strength at each section. A plot of the IK/IG ratios they occurred in the
beams is shown in figures 7, 8, and 9. Also shown in these figures are the IK/IG ratios occurring
in the areas of the beams in which there were tensile and compressive stresses during loading. The numbers on the curves are strength ratios of the given IK/IG values as determined by the
strength ratio-IK/I relationship (fig. 55 in G
Tech. Bull. 1069 (3)).
Figure 7.--Distribution of IK
/IG
ratios i n beam D, showing the knot ratio in the compression
and tension sides as well as the total-knot ratio in the beam, Numerical values shown on curves are strength based on the I
K/lG
relationship. ( M 132 115)
FPL 72 10
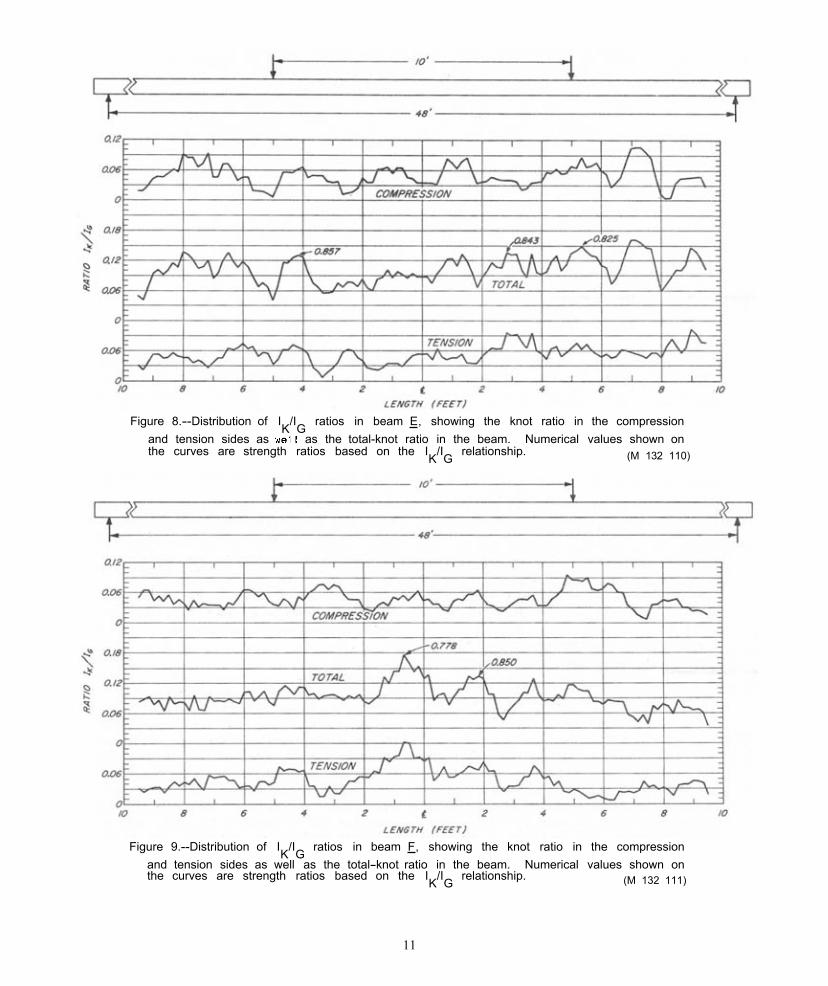
Figure 8.--Distribution of IK/IG ratios in beam E, showing the knot ratio in the compression and tension sides as as the total-knot ratio in the beam. Numerical values shown on the curves are strength ratios based on the IK/IG relationship. (M 132 110)
Figure 9.--Distribution of IK/IG ratios in beam F, showing the knot ratio in the compression and tension sides as well as the total-knot ratio in the beam. Numerical values shown on the curves are strength ratios based on the IK/IG relationship. (M 132 111)
11

Table 3.--Comparison of bending strength as determined by IK/IG concept and as determined expermentally
In actual practice it is impractical to deter-mine the IK/IG for each beam A statistical knot
distribution study is made for each grade of or each combination grades making up
laminated beam (3). This statistical method is designed to predict the worst combination of knots that might occur in a random layup of a given beam. This survey is made by industry associa-tions and used set allowable stresses for beams made of various combinations of grades of lumber. For a coast region Douglas-fir beam having 21 laminations, with the two top and bottom laminations of “L2” grade and the remain-der of “L3” grade, the strength ratio from a statistical survey is 0.698 (5). The lowest strength ratio determined for the three structural beams was 0.778.
A comparison of bending strength as estimated from IK/IG concept and that determined
experimentally is given in table 3. This shows that these beams the bending strength as predicted
by the IK/IG relationship greatly exceeded that
deter mined experiment ally. In predicting the strength of laminated beams,
both knots and cross grain must be considered. The cross grain in the outer laminations was not measured; thus, an accurate analysis of the effect of cross grain cannot be made. If the cross grain in the laminations was the maximum permitted in the grades of lumber used, then the strength ratio of the beams based on cross grain would be approximately 0.60 (3). However, it is very
FPL 72 12
unlikely that the cross grain in the laminations was the maximum permitted in the grades of lumber used; thus, this 0.60 strength ratio is probably misleading. When the beams were tested there was no indication that general cross grain, as defined in grading rules, was the direct cause of initial failure. It is believed that all failures of the structural beams initiated at knots, as will be discussed later.
From observations of tests, it is believed that knots in the outer tensile laminations of beams of the size evaluated in this study had a larger influence on strength than predicted by the IK/IG concept. When an outer lamination
failed, there was enough energy released to cause the failure to propagate into the beam; thus failure was sudden and complete.
Types of Failure
In the structural beams there was some slight warning before failure, but in the clear beams failure occurred very suddenly. In all beams the failure was complete, with cracks propagating throughout the middle 15- to 20-foot length and some extending to the full length. The catastrophic-type failures were probably due to the simulated dead-load type of loading. The failure of beam is shown in figure 10, which is typical of the shattering type failure of each of the six beams. A view of the bottom lamination of each of the structural beams is shown in figure 11, This

Figure 10.--Failure of beam D showing how cracks propagated throughout most of the midlength of the beam. This type of shattering failure was typical of failures in each of the six beams.
shows the knots with associated cross grain that influenced the failures of these beams.
The failures of the clear beams were so sudden that it was impossible to observe the first point of failure. The failure pattern was very similar for each. The tension lamination did not fail between the load points. It failed from 5 to 10 feet from midlength of beams, load points being 5 feet each side of midlength. Cracks ran from failure of tension lamination up to second. third, or fourth lamination, then longitudinally across midlength, and then propagated throughout much of the midsection of the beams, with some cracks running the complete length. Two independ-ent observations of failure of beam B were that initial failure started about 2 feet from midlength in about the second or third lamination, but failure occurred so rapidly that the actual point of initial failure was difficult to detect. Failure of beam C is shown in figure The missing section of the tension lamination extends from about 5 to 9 feet from midlength. There
(M 132 109)
was a slight amount of compression failure near the load points on the clear beams before final failing.
None of the failures of the clear beams could he traced to scarf joints or to general localized areas of cross grain. Thus, the procedures used in attempting to make clear wood beams free from visible strength-reducing characteristics were apparently successful. The strength data obtained are considered to be representative of clear straight-grained material,
Minor Test Data
Small minor bending specimens 1 by 1 inch in cross section were cut from the five top and bottom laminations of the clear beams. Four specimens were taken from each lamination. These were cut from near the midlength of the beams, which was an area that had been highly stressed during loading.
13
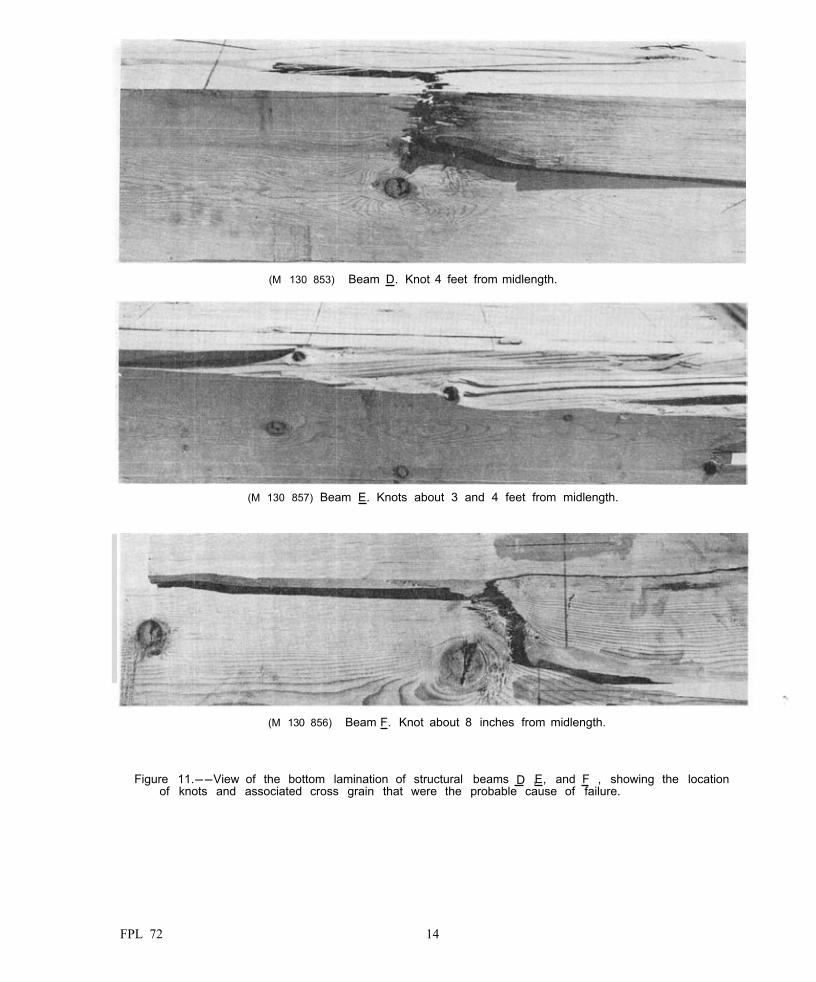
(M 130 853) Beam D. Knot 4 feet from midlength.
(M 130 857) Beam E. Knots about 3 and 4 feet from midlength.
(M 130 856) Beam F. Knot about 8 inches from midlength.
Figure 11.--View of the bottom lamination of structural beams D , E, and F , showing the location of knots and associated cross grain that were the probable cause of failure.
FPL 72 14

Figure 12.--failure of beam C. The missing section of the tension lamination extends from about 5 9 feet from midlength.to
The data for the minor specimens were some-what erratic. probably because of the specimens having been previously highly stressed in the large beam. The average modulus of rupture of
specimens was 12,000 pounds per square inch, and the average effective modulus of elasticity (not corrected for shear deflections) was 1,840,000 pounds per square inch. This indicates that the material in the clear beams was fairly repre-sentative as average Douglas-fir (table 12, Wood Handbook (4)).
SUMMARY
Six glued-laminated beams, 9 inches wide by 31-1/2 inches deep by 50 feet long, containing 21 Douglas-fir Laminations, were evaluated. Three beams, designated as clear, were designed as clear straight-grained wood beams and three were
(M 130 854)
designed as structural beams containing strength-reducing characteristics as could be found in commercially produced laminated beams.
The average modulus of rupture and modulus of elasticity for clear beam were 8,400 2,090,000 pounds per square inch, respectively, and for structural beams were 4,450 and 1,930,000 pounds per square inch. The average strength of the clear beams was within 2 of that estimated by a size-effect relationship recently published (1). The average strength of structural beams was about one-third less than that given by IK/IG concept. The modulus of elasticity
for all beams was within the expected of Douglas-fir beam.
These results should lead to new design proce-dures to account for the effect of size on the bending strength of wood beams. The study also indicates the need for further research to obtain a better understanding of the effect of knots on the strength of laminated beams.
15

LITERATURE CITED
(1) Bohannan, Billy. Effect of size on bending strength of
wood members. U.S. Forest Serv. Res. Pap. FPL 56. Forest Prod. Lab.
(2) Cowan, W.C. 1962. Shear stress two wood beams over
wood block supports. U.S. Forest Serv., Forest Prod. Lab. Rep. 2249.
Freas, A.D., and Selbo, M.L. Fabrication and design of glued lami-nated wood structural members. U.S. Dep. Agr. Tech. Bull.
(4) U.S. Forest Products Laboratory. Wood handbook U.S. Dep. Agr., Agr.
Handb. 72.
(5) West Coast Lumbermen’s Association. 1962. of working stresses
for structural glued laminated Douglas-fir (coast region) lumber. Portland, Oreg.
(6) . 1962. Standard specifications for structural
laminated Douglas-fir (coast region) timber. Portland, Oreg.
(7) West Coast Lumber Inspection Bureau. 1962. Standard grading and dressing rules
(No. 15) for Douglas-fir, west coast hemlock, Sitka spruce, and western red cedar. (Rev.). Portland, Oreg.
72 16 2.-16

U.S. DEPARTMENT OF AGRICULTURE • FOREST SERVICE
FOREST PRODUCTS LABORATORY • MADISON, WIS,
In cooperation with the University of Wisconsin