flexural evaluation of timber scaffold boards … · flexural evaluation of timber scaffold boards...
TRANSCRIPT
© Forest Research Institute Malaysia 548
Mohd Jamil AW & Roszalli MJournal of Tropical Forest Science 27(4): 548–562 (2015)
FLEXURAL EVALUATION OF TIMBER SCAFFOLD BOARDS USING TWO LOADING METHODS
MOHD JAMIL AW & ROSZALLI M. 2015. Flexural evaluation of timber scaffold boards using two loading methods. The national standard method for mechanical test of timber scaffold boards is lacking. In the local construction, engineers and contractors rely on existing data for mechanical properties of timber. These data were derived from tests of small clear specimens described as timber with no noticeable defect. Studies have demonstrated that the dimensions of specimens and presence of natural defects influence mechanical test results of timber. This article reports on methods and results of the mechanical testing of local timber scaffold boards. Flexural tests of two different systems were conducted on kempas scaffold boards. Static bending test using universal testing machine was conducted on one sample group and dead weight loading test on another batch. In general, modulus of rupture and modulus of elasticity of static bending test showed higher values than dead weight loading test. Thus, adjustment factors were recommended. Horizontal split failures were observed from dead weight loading test but none from static bending test. The duration to complete the test using dead weight was considerably longer.
Keywords: Construction safety, flatwise bending, timber strength, modulus of rupture
AW Mohd Jamil* & M Roszalli
Forest Research Institute Malaysia, 52109 Kepong, Selangor Darul Ehsan, Malaysia
Received June 2014
INTRODUCTION
The Department of Occupational Safety and Health of Malaysia has recorded an alarming rate of fatal accidents in the construction sector. Despite having smaller number of occurrences than other industries, nearly half of the total cases in Malaysia ended up in human losses. Major cases of fatal accidents occurring in the country from 2005 till 2008 were recorded and falls from height were highest (Dayang Nailul Munna & Gloria 2011). However, they only described incidents and did not mention the causes that led to falls. Similarly, Petroliam Nasional Berhad has reported a substantial amount of fatalities in petrochemical constructional works. Based on the 2012 statistics, six deaths were recorded in construction accidents (Anonymous 2012).
Focusing more on constructional disaster, falls from height have been identified as a leading cause of fatalities in construction operations in the United Kingdom (Haslam et al. 2005). Surprisingly, the statistics is in a region by which safety performances are considered reasonable by the international standard. In a different
study, Chia et al. (2005) reported on the analyses of fatal occupational falls in Taiwan’s building industry between 1994 and 1997. From a total of 621 fatal incidents at construction sites, more than 40% of the cases were caused by falls of workers from platforms.
Recently, timber companies have requested the Forest Research Institute Malaysia to evaluate the mechanical properties of scaffold boards fabricated from Malaysian timber species. The boards were proposed for offshore construction works. Nevertheless, the collaboration has created awareness among practitioners that the national standard method for mechanical test of timber scaffold boards is lacking. Further investigation found that technical specifications, allowable grades, inspection procedures and other regulatory documents concerning the use of timber scaffold boards were inadequate (Anonymous 1986). Despite stringent requirements stipulated in the occupational safety and health regulations, particularly those related to oil and gas operations, these deficiencies were never officially argued.

© Forest Research Institute Malaysia 549
Mohd Jamil AW & Roszalli MJournal of Tropical Forest Science 27(4): 548–562 (2015)
Even though stress on scaffold board may be applied for a relatively short period, the magnitude is normally huge compared with its self weight. Construction activities such as concrete pouring and placing of equipment create increasing loads together with dynamic and impact matrices. Thus, quality assessment of scaffold boards requires extra concern compared with permanent structures (Mohd Hanim et al. 1998). Unlike static structural components such as beams and trusses, the magnitude, duration and point of forces on scaffold board are practically arbitrary. Thus, the quality of each plank should be evaluated over the entire length in detail.
Modulus of rupture (MOR) and modulus of elasticity (MOE) of Malaysian timbers are derived from standard mechanical tests of small clear specimens. Small clear specimen is described as timber with no noticeable defect over the length of the specimen. The test is conducted on 50 mm × 50 mm × 760 mm specimens. The methods described by Engku (1971) are comparable with BS 373 (BS 1957) and ASTM D143 (ASTM 2009). The method of testing small clear specimen may be more convenient to estimate mechanical properties of timber. However, due to the natural characteristics of timber, results of small clear specimen test are unable to provide accurate values for structural calculation. As a biological material, timber shows inconsistency in physical and mechanical properties. Their heterogeneous and anisotropic features cause extremely difficult stress and strain assessment. For example, the strength of timber is markedly reduced by grain deviation and knots. Besides, wood pieces containing natural defects are usually light in weight and liable to sudden fracture. The inconsistency of test results is so great that it is present in almost every study on mechanical properties of timber.
On the other hand, the nominal size for timber scaffold board is 40 mm × 225 mm × 3000 mm. The distinction in dimensions between small clear specimens and scaffold boards is significant. Thus, it is improbable to surmise test results equally. In a recent study, results of halved cross-section specimens showed that they were distinctively different. The results showed that bending strength of large specimens was lower compared with small specimens. For MOE, large specimens were found to have higher
values compared with small specimens (Mohd Jamil et al. 2013). Technically, the risk increases when small-sized material demonstrates higher strength than larger-sized material. Therefore, actual size test results will always be more reliable in the formulation of design stresses for timber components (Madsen 1992).
Timber scaffold boards possess unique advantages compared with other materials. In solid form, timber demonstrates outstanding specific strength compared with metal. Timber scaffold boards are comparatively light weight, easier to handle, and low in transport and storage costs. On the contrary, metal is heavier. Metal scaffold boards are normally used in box-shaped form rather than in solid form. More importantly, in terms of procurement and maintenance cost, timber board is still an economical choice compared with metal and fibre composite boards. For offshore applications, timber scaffold boards exhibit exclusive quality of non-rusting. The deterioration on metal is severe when exposed to corrosive oceanic atmosphere. This is particularly crucial when several sections of the platforms are fully immersed during high tide. For this reason, most offshore and coastline constructional works utilise timber as scaffold boards.
Currently in the Malaysian construction scenario, emphasis on safety regulations for timber scaffold board application is not proper. This is depicted by the lack of national documented specifications, standard methods for mechanical property evaluation, ambiguous grading and inspection procedures, and most importantly the adherence and enforcement of laws are rather doubtful (Anonymous 1986). This study aimed to provide tangible data for the development of national standard test method to determine mechanical properties of timber scaffold boards.
MATERIALS AND METHODS
Two batches of 25 scaffold boards each from kempas (Koompassia malaccensis) wood were selected. The grading was conducted visually by personnel from the sawmill to reproduce the genuine practice in timber scaffold board procurement. The thickness and width of each board were measured using vernier callipers prior to the destructive test. Different methods
© Forest Research Institute Malaysia 550
Mohd Jamil AW & Roszalli MJournal of Tropical Forest Science 27(4): 548–562 (2015)
of bending tests were conducted on each sample batch, namely, static bending and dead weight loading tests. Each board was tested until failure. MOE and MOR of each board were calculated. The moisture content and density of each specimen were measured after the test.
Static bending test
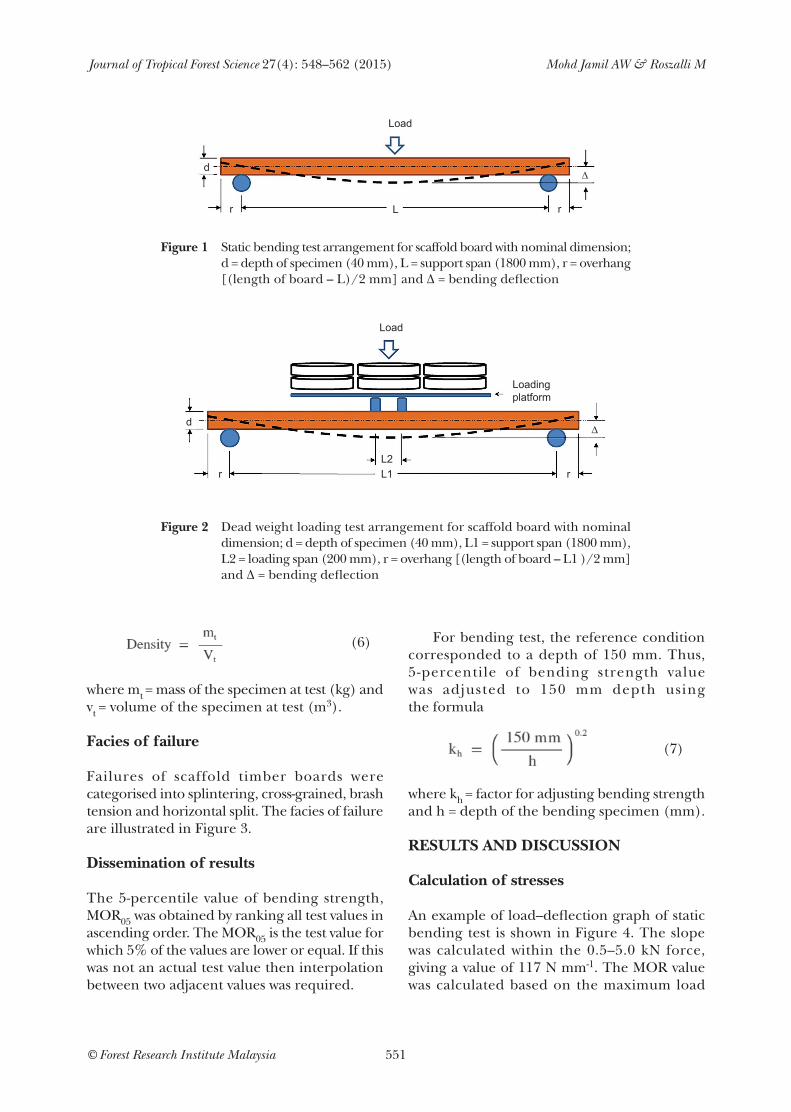
The test was conducted in three-point flatwise bending set up using universal testing machine. Force was applied through the loading-head movement. The magnitude of load was measured via load-cell and recorded by the software of the universal testing machine. The magnitude of deflection was measured based on the scale of cross-head movement. The test arrangement is illustrated in Figure 1. A constant loading speed of 6.6 mm min-1 was applied throughout the test until failure. Load versus deformation graph of each board was automatically generated by the software of the universal testing machine. The slope of the graph of each test, S, was measured within 0.5–5.0 kN, approximately within 0.1 Fmax and 0.4 Fmax section.
Modulus of rupture (N mm-2) was calculated using the equation
where Pmax = maximum load (N), L = support span (mm), w = width of the specimen (mm) and d = depth of the specimen (mm).
Modulus of elasticity (N mm-2) was measured using the equation
where S = slope of the graph within 0.5–5.0 kN force (N mm-1), L = support span (mm), w = width of the specimen (mm) and d = depth of the specimen (mm).
Dead weight loading test
The test was conducted in flatwise four-point loading arrangement as illustrated in Figure 2. Three-point bending set up was not practical due to the stability issue of dead weights. The
(1)
(2)
loading span, L2, was designed to the narrowest possible to match the three-point static bending test arrangement. Force was applied through the weight of metal discs. Metal weights of 10 kg each were placed gradually until the board fails. The magnitude of deflection was measured using linear variable differential transformer (LVDT) positioned at bottom, centre of the boards. Using data obtained from load and deflection measurements, load versus deformation graph of each board was plotted. The slope of the graph of each test, S, was measured within 0.5–5.0 kN, approximately within 0.1 Fmax and 0.4 Fmax section.
Modulus of rupture (N mm-2) was calculated using the equation
where Pmax = maximum load (N), L1 = support span (mm), L2 = loading span (mm), w = width of the specimen (mm) and d = depth of the specimen (mm).
Modulus of elasticity (N mm-2) was measured using the equation
where S = slope of the graph within 0.5–5.0 kN load (N mm-1), L1 = support span (mm), L2 = loading span (mm), w = width of the specimen (mm) and d = depth of the specimen (mm).
Moisture content and density tests
Moisture content and density of each board were determined from 25 mm cross-cut sections. Oven-dry method was performed to calculate dry mass. Moisture content and density of each board were determined using the equations
where mt = mass of the specimen at test (g) and mod= oven-dried mass of the specimen (g).
(3)
(4)
(5)
© Forest Research Institute Malaysia 551
Mohd Jamil AW & Roszalli MJournal of Tropical Forest Science 27(4): 548–562 (2015)
Figure 1 Static bending test arrangement for scaffold board with nominal dimension; d = depth of specimen (40 mm), L = support span (1800 mm), r = overhang [(length of board – L)/2 mm] and ∆ = bending deflection
Load
L r
∆
r
d
Figure 2 Dead weight loading test arrangement for scaffold board with nominal dimension; d = depth of specimen (40 mm), L1 = support span (1800 mm), L2 = loading span (200 mm), r = overhang [(length of board – L1 )/2 mm] and ∆ = bending deflection
L2L1 rr
∆d
Load
Loadingplatform
where mt = mass of the specimen at test (kg) and vt = volume of the specimen at test (m3).
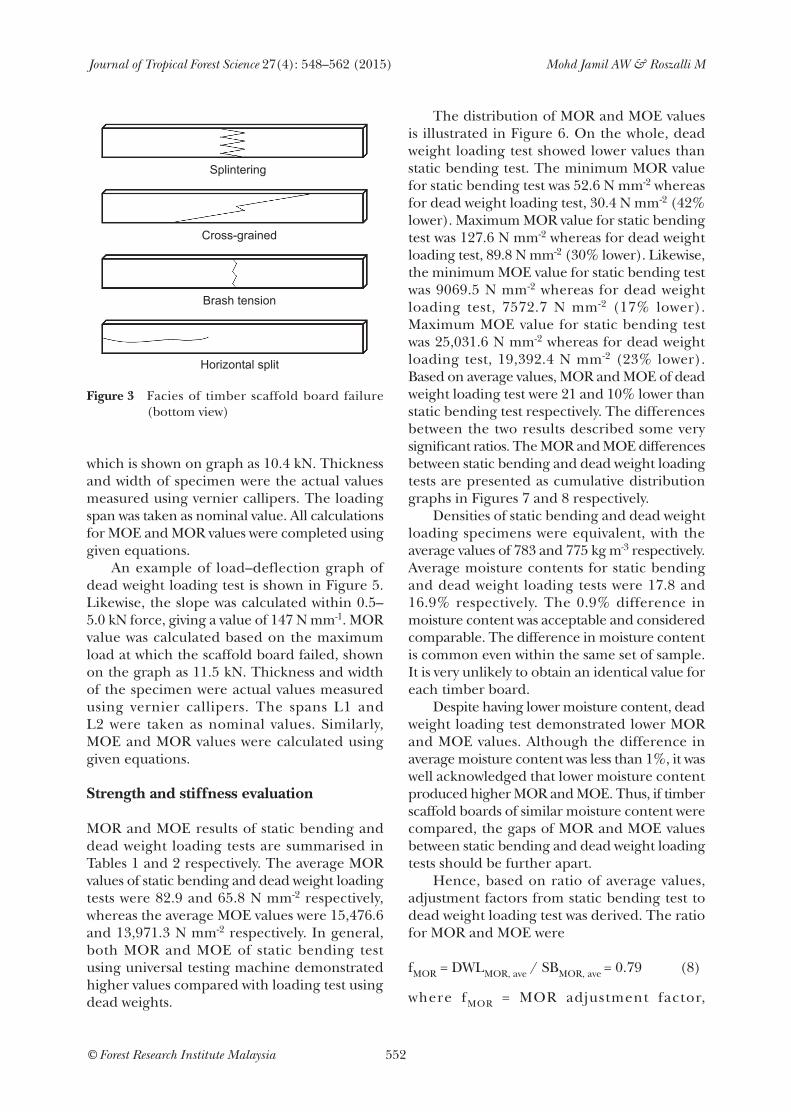
Facies of failure
Failures of scaffold timber boards were categorised into splintering, cross-grained, brash tension and horizontal split. The facies of failure are illustrated in Figure 3.
Dissemination of results
The 5-percentile value of bending strength, MOR05 was obtained by ranking all test values in ascending order. The MOR05 is the test value for which 5% of the values are lower or equal. If this was not an actual test value then interpolation between two adjacent values was required.
(6) For bending test, the reference condition corresponded to a depth of 150 mm. Thus, 5-percentile of bending strength value was adjusted to 150 mm depth using the formula
where kh = factor for adjusting bending strength and h = depth of the bending specimen (mm).
RESULTS AND DISCUSSION
Calculation of stresses
An example of load–deflection graph of static bending test is shown in Figure 4. The slope was calculated within the 0.5–5.0 kN force, giving a value of 117 N mm-1. The MOR value was calculated based on the maximum load
(7)
© Forest Research Institute Malaysia 552
Mohd Jamil AW & Roszalli MJournal of Tropical Forest Science 27(4): 548–562 (2015)
which is shown on graph as 10.4 kN. Thickness and width of specimen were the actual values measured using vernier callipers. The loading span was taken as nominal value. All calculations for MOE and MOR values were completed using given equations.
An example of load–deflection graph of dead weight loading test is shown in Figure 5. Likewise, the slope was calculated within 0.5–5.0 kN force, giving a value of 147 N mm-1. MOR value was calculated based on the maximum load at which the scaffold board failed, shown on the graph as 11.5 kN. Thickness and width of the specimen were actual values measured using vernier callipers. The spans L1 and L2 were taken as nominal values. Similarly, MOE and MOR values were calculated using given equations.
Strength and stiffness evaluation
MOR and MOE results of static bending and dead weight loading tests are summarised in Tables 1 and 2 respectively. The average MOR values of static bending and dead weight loading tests were 82.9 and 65.8 N mm-2 respectively, whereas the average MOE values were 15,476.6 and 13,971.3 N mm-2 respectively. In general, both MOR and MOE of static bending test using universal testing machine demonstrated higher values compared with loading test using dead weights.
The distribution of MOR and MOE values is illustrated in Figure 6. On the whole, dead weight loading test showed lower values than static bending test. The minimum MOR value for static bending test was 52.6 N mm-2 whereas for dead weight loading test, 30.4 N mm-2 (42% lower). Maximum MOR value for static bending test was 127.6 N mm-2 whereas for dead weight loading test, 89.8 N mm-2 (30% lower). Likewise, the minimum MOE value for static bending test was 9069.5 N mm-2 whereas for dead weight loading test, 7572.7 N mm-2 (17% lower). Maximum MOE value for static bending test was 25,031.6 N mm-2 whereas for dead weight loading test, 19,392.4 N mm-2 (23% lower). Based on average values, MOR and MOE of dead weight loading test were 21 and 10% lower than static bending test respectively. The differences between the two results described some very significant ratios. The MOR and MOE differences between static bending and dead weight loading tests are presented as cumulative distribution graphs in Figures 7 and 8 respectively.
Densities of static bending and dead weight loading specimens were equivalent, with the average values of 783 and 775 kg m-3 respectively. Average moisture contents for static bending and dead weight loading tests were 17.8 and 16.9% respectively. The 0.9% difference in moisture content was acceptable and considered comparable. The difference in moisture content is common even within the same set of sample. It is very unlikely to obtain an identical value for each timber board.
Despite having lower moisture content, dead weight loading test demonstrated lower MOR and MOE values. Although the difference in average moisture content was less than 1%, it was well acknowledged that lower moisture content produced higher MOR and MOE. Thus, if timber scaffold boards of similar moisture content were compared, the gaps of MOR and MOE values between static bending and dead weight loading tests should be further apart.
Hence, based on ratio of average values, adjustment factors from static bending test to dead weight loading test was derived. The ratio for MOR and MOE were
fMOR = DWLMOR, ave / SBMOR, ave = 0.79
where fMOR = MOR adjustment factor,
(8)
Figure 3 Facies of timber scaffold board failure (bottom view)
Splintering
Cross-grained
Brash tension
Horizontal split

© Forest Research Institute Malaysia 553
Mohd Jamil AW & Roszalli MJournal of Tropical Forest Science 27(4): 548–562 (2015)
Figure 4 Force–stroke graph of static bending test
Maximum load
Stroke (mm)
12
10
8
6
4
2
00 20 40 60 80 100 120 140 160 180 200
Forc
e (k
N) Slop
e
Figure 5 Load–deflection graph of dead weight loading test
Maximum load
Deflection (mm)
14
12
10
8
6
4
2
00 10 20 30 40 50 60 70 80 90 100
Load
(kN
)
Slope

© Forest Research Institute Malaysia 554
Mohd Jamil AW & Roszalli MJournal of Tropical Forest Science 27(4): 548–562 (2015)
Specimen number
Modulus of elasticity(N mm-2)
Maximum load(kN)
Modulus of rupture
(N mm-2)
Density(kg m-3)
Moisture content
(%)
Facies of failure
SB01 18,044.5 10.5 82.3 779 16.1 Splintering
SB02 18,148.5 11.0 95.0 793 16.0 Splintering
SB03 17,610.1 12.3 100.8 763 16.4 Cross-grained
SB04 16,595.9 10.4 91.8 789 16.8 Splintering
SB05 16,451.2 11.5 96.1 825 16.5 Splintering
SB06 12,127.9 6.1 52.6 796 18.0 Cross-grained
SB07 17,170.3 12.9 90.3 785 18.1 Splintering
SB08 17,984.2 9.7 79.4 749 16.2 Splintering
SB09 25,031.6 13.2 127.6 769 17.5 Splintering
SB10 14,831.8 9.3 68.8 816 17.8 Splintering
SB11 11,879.2 7.9 61.6 756 18.2 Brash tension
SB12 11,412.0 8.5 59.5 835 18.1 Splintering
SB13 12,061.6 8.0 60.7 764 18.5 Cross-grained
SB14 17,119.0 10.9 105.7 766 16.7 Splintering
SB15 18,115.0 13.1 105.2 783 17.1 Splintering
SB16 18,447.0 14.5 114.4 750 17.0 Splintering
SB17 11,707.5 6.9 62.9 796 18.5 Cross-grained
SB18 13,150.5 10.0 75.2 771 19.3 Splintering
SB19 13,499.9 8.0 80.8 799 20.4 Cross-grained
SB20 13,960.6 8.7 69.9 808 18.6 Cross-grained
SB21 13,715.1 9.7 82.4 755 18.8 Splintering
SB22 13,050.7 9.2 80.0 746 18.8 Splintering
SB23 9069.5 7.9 61.3 740 18.8 Cross-grained
SB24 15,126.3 7.2 56.7 820 18.1 Cross-grained
SB25 20,604.6 10.4 112.7 832 17.8 Splintering
Average 15,476.6 9.9 82.9 783 17.8
Standard deviation
3502.7 2.2 20.5 28 1.1
Table 1 Results of static bending test
DWLMOR, ave = average MOR of dead weight loading test (N mm-2) and SBMOR, ave = average MOR of static bending test (N mm-2).
fMOE = DWLMOE, ave / SBMOE, ave = 0.90
where fMOE = MOE adjustment factor, DWLMOE, ave = average MOE of dead weight loading test (N mm-2) and SBMOE, ave = average MOE of static bending test (N mm-2).
Care had to be taken in the application of these factors since values were derived from kempas scaffold boards. Thus, they should be applicable only to timbers of equivalent density.
(9)
Furthermore, the interpretation of results was based on density and moisture content of samples. There is possibility that the ratios will not be the same for specimens at green/higher moisture content. However, based on practicality, these factors are adequate since the equilibrium moisture content in Malaysia is considered as 19% (Hilmi et al. 1996). The normal practice for structural timber products is to kiln dry the timber to approximate equilibrium moisture content and subsequently it will self dry to reach equilibrium moisture content of its surrounding during service.
Attention should be given to the present results in terms of comparison with existing

© Forest Research Institute Malaysia 555
Mohd Jamil AW & Roszalli MJournal of Tropical Forest Science 27(4): 548–562 (2015)
Table 2 Results of dead weight loading test
*Approximated values based on linear regression equation; n/a = not available
Specimen number
Modulus of elasticity(N mm-2)
Maximum load(kN)
Modulus of rupture
(N mm-2)
Density(kg m-3)
Moisture content
(%)
Facies of failure
DWL01 13,314.1 8.8 61.9 817 14.6 Cross-grained
DWL02 10,603.8 8.1* 54.7* 905 16.6 n/a
DWL03 12,174.1 7.6 55.0 793 15.6 Cross-grained
DWL04 17,115.2 12.4* 80.7* 770 16.3 n/a
DWL05 19,392.4 11.0* 89.8* 785 16.7 n/a
DWL06 13,317.2 9.2 67.1 762 16.7 Splintering
DWL07 13,471.4 11.4 76.3 752 16.0 Splintering
DWL08 10,228.5 7.3 51.7 781 16.9 Horizontal split
DWL09 7572.7 7.1 46.3 698 17.5 Cross-grained
DWL10 13,996.6 11.9 78.0 585 18.5 Horizontal split
DWL11 11,427.7 10.0 71.6 795 17.9 Horizontal split
DWL12 13,179.2 10.0 65.3 814 17.2 Splintering
DWL13 18,853.2 11.7 85.6 776 17.1 Splintering
DWL14 12,748.5 7.4 42.0 798 16.1 Cross-grained
DWL15 18,841.5 12.6* 87.6* 779 16.2 n/a
DWL16 7978.8 4.3 30.4 791 15.1 Cross-grained
DWL17 15,531.6 10.0 70.1 792 15.6 Cross-grained
DWL18 14,223.9 11.5* 69.1* 801 16.9 n/a
DWL19 13,756.8 7.6 54.3 775 16.9 Cross-grained
DWL20 13,263.0 7.6 59.2 711 16.7 Cross-grained
DWL21 9249.7 5.1 46.9 731 18.0 Cross-grained
DWL22 10,942.0 9.0 70.0 727 17.7 Splintering
DWL23 13,155.2 8.4 71.4 772 17.8 Splintering
DWL24 13,869.7 12.5* 67.7* 807 17.6 n/a
DWL25 13,427.1 11.1 77.7 769 17.8 Splintering
DWL26 15,083.5 11.7 82.8 774 17.6 Cross-grained
DWL27 10,578.0 8.4 63.4 751 18.0 Splintering
DWL28 14,073.1 5.4 39.1 851 17.5 Cross-grained
DWL29 13,987.2 10.9 74.7 786 17.4 Splintering
DWL30 16,499.9 11.5 83.2 789 16.7 Splintering
Average 13,971.3 9.4 65.8 775 16.9
Standard deviation
3677.1 2.3 15.3 53 0.9
data, which are regularly being referred to for mechanical properties of Malaysian timbers (Lee et al. 1993). Normally, in avoiding tedious process of sample testing, engineers and contractors tend to rely on existing records. Not only that past tests were conducted on significantly smaller specimens, the quality of timber might also be different. Records
of kempas timber showed that the average MOR and MOE were 100 and 16,600 N mm-2 respectively in green condition. At 15% moisture content, the average MOR and MOE were 122 and 18,600 N mm-2 respectively. Thus, existing records of mechanical properties of kempas are highly overestimated with regard to scaffold board application.

© Forest Research Institute Malaysia 556
Mohd Jamil AW & Roszalli MJournal of Tropical Forest Science 27(4): 548–562 (2015)
Figure 6 Modulus of rupture and modulus of elasticity values of static bending and dead weight loading tests
Mod
ulus
of r
uptu
re (N
mm
-2)
Modulus of elasticity (N mm-2)
Static bending testDead weight loading test
140
120
100
80
60
40
20
00 5000 10,000 15,000 20,000 25,000 30,000
y = 0.004x + 12.238r2 = 0.4604
y = 0.0051x + 4.2496r2 = 0.7536
Although tests were conducted by applying load to the boards, force reactions between static bending and dead weight loading tests were basically different. Force in static bending test was applied via loading-head of universal testing machine in a constant movement. The measurement of force was theoretically the magnitude of reaction of the timber board to the physical displacement by loading-head. It did not involve any weight of mass. In contrast, dead weight loading force was the product of metal masses with gravitational acceleration. The magnitude of force was the weight of the metal itself.
Within the limit of proportionality, departure from classical linearity occurs when loading is held at one point. Taking static bending test as an example, if the applied load through universal testing machine head movement is stopped at some elastic point, the increment in deformation is simultaneously stopped but the load is slightly declined after several minutes (Figure 9a). When the applied load is removed entirely, the sample will not return to zero deformation but follows a
line parallel to the initial linear increment and ends at some finite deformation.
On the other hand, with a similar loading pattern applied to dead weight loading test, if the loading via metal weights is stopped at some load within the elastic region for several minutes, the increment in deformation continues (depending on the magnitude of the weighing and its duration) but the load is constant at the same weight (Figure 9b). Likewise, when the applied load is removed entirely, the sample will not return to zero deformation but follows a line parallel to the initial linear increment and ends at some finite deformation.
For both tests, the line will eventually return to zero deformation after some time. Note that there is a difference in the area of hysteresis loop between static bending and dead weight loading tests. This loading and unloading elastic hysteresis can be explained as an index of dissipated energy which contributes to creep deformation and fatigue. Unfortunately, these observations were not quantified comprehensively here.

© Forest Research Institute Malaysia 557
Mohd Jamil AW & Roszalli MJournal of Tropical Forest Science 27(4): 548–562 (2015)
Figure 7 Cumulative distribution of modulus of rupture between static bending and dead weight loading tests
Figure 8 Cumulative distribution of modulus of elasticity between static bending and dead weight loading tests
1.0
Modulus of rupture (N mm-2)
Cum
ulat
ive
dist
ribut
ion 0.7
0.4
0.9
0.6
0.3
0.8
0.5
0.2
0.1
00 60 12020 80 14040 100
Static bending test
Dead weight loading test
Static bending testDead weight loading test
Cum
ulat
ive
dist
ribut
ion
1.0
0.7
0.4
0.9
0.6
0.3
0.8
0.5
0.2
0.1
00 15,0005000 20,00010,000 25,000 30,000
Modulus of elasticity (N mm-2)

© Forest Research Institute Malaysia 558
Mohd Jamil AW & Roszalli MJournal of Tropical Forest Science 27(4): 548–562 (2015)
Figure 9 Force–deflection graphs when loading is held at one point
(a) Static bending15
7
13
5
11
3
9
1
-1-1 1 3 5 7 9 11 13 15
Forc
e (k
N)
Deflection (mm)
Constantdeflection
Loading
Unloading
(b) Dead weight loading15
7
13
5
11
3
9
1
-1-1 1 3 5 7 9 11 13 15
Forc
e (k
N)
Deflection (mm)
Constantforce
Loading
Unloading
© Forest Research Institute Malaysia 559
Mohd Jamil AW & Roszalli MJournal of Tropical Forest Science 27(4): 548–562 (2015)
Failure mode evaluation
Figures 10 and 11 show the MOR and MOE distribution of failure modes for static bending and dead weight loading tests respectively. Referring to static bending test, 32% of the boards failed with cross-grained mode, while 64% failed with splintering and one board with brash tension (Figure 10). Brash tension failure of timber is normally associated with rot. For dead weight loading test, 46% failed with cross-grained mode, 42% failed with splintering and three boards with horizontal split (Figure 11). From both tests, most scaffold boards with higher MOR and MOE demonstrated failures with splintering mode, while boards with lower values demonstrated failure with cross-grained mode.
Three boards showed horizontal split failure from dead weight loading test (Figure 12) but none from static bending test. From our observation on bending test of rectangular timber using universal testing machine, we never encountered such failure, regardless of specimen size. Unlike static bending test, force in dead weight loading test could be coerced on a slanted axis. In dead weight loading test, we found that for timber board having inconsistent stiffness over the width, deflection occurred in an angled position (Figure 13). This circumstance created twisting-like force and ended up with fracture parallel to the length. This type of failure is very unlikely to occur in static bending test since the force is applied through fixed-flat loading head. Hence difference of stiffness over the width of the board had no effect on the deflection axis.
5-percentile value
Based on values in Tables 1 and 2, the 5% lower value was calculated as MOR05 = value for which 5% of the tabulated values were lower or equal; MOR05, static bending = 56 N mm-2; MOR05, dead weight loading = 35 N mm-2.
For specimen dimension adjustment, the reference condition corresponded to depth of 150 mm. Therefore, based on equation 7, MOR05 was adjusted to 150 mm depth by dividing
the value with = 1.3. Thus,
MOR05, static bending, adjusted = 43 N mm-2 and MOR05, dead weight loading, adjusted = 27 N mm-2.
Hands-on evaluation
The procedure for static bending test demonstrated some advantages with regard to practicality. It was sufficient for one person to operate the entire mechanical testing since measurement was done automatically using universal testing machine software. On the other hand, at least two persons were involved in dead weight loading test—one was required to set the loads and the other, record the force and deflection measurements. A third person was needed when photography was required.
In dead weight loading test, deflection measurement using LVDT was limited to ½ of the maximum load. At approximately 5000 N, the LVDT had to be removed due to possibility of damaging the equipment. Thus, deflection behaviour of timber scaffold boards through dead weight loading test was not examined thoroughly.
Assembling metal discs on top of the boards was intricate. There was an issue with stability of the arrangement related to over-stacking of metal weights. Thus, testing scaffold boards of higher strength would be more complicated. Placing of weights in a haste caused the scaffold board to bounce, thus, exposing the operator to danger. In addition, measurement of the deflection was interrupted.
In terms of operational safety, both tests had risks. Safety during static bending test was dependent on the experience of the operator of the universal testing machine. Carelessness will not only inflict harm to the personnel but could also spoil the machine. Nevertheless, operational risks during dead weight loading test were greater. Lack of concentration could cause the personnel to end up with severe injury due to dropping of metal weights during rupture. It was also observed that the crashing of metal weights caused damages to the testing jigs. Personnel were exposed to ergonomics issue due to repeated muscle stress. The test was time consuming, involving set up, placing and reassembling of weights and these caused fatigue to the personnel. Thus, the duration to complete the test was significantly longer.

© Forest Research Institute Malaysia 560
Mohd Jamil AW & Roszalli MJournal of Tropical Forest Science 27(4): 548–562 (2015)
Figure 10 Failure modes of static bending test
r2 = 0.7266
r2 = 0.4504
Mod
ulus
of r
uptu
re (N
mm
-2)
Modulus of elasticity (N mm-2)
140
120
100
80
60
40
20
00 5000 10,000 15,000 20,000 25,000 30,000
Brash tensionCross-grainedSplintering
Figure 11 Failure modes of dead weight loading test
Horizontal splitCross-grainedSplintering
r2 = 0.7732
r2 = 0.7237
r2 = 0.4452
120
100
80
60
40
20
00 2000 4000 6000 8000 10,000 12,000 14,000 16,000 18,000 20,000
Mod
ulus
of r
uptu
re (N
mm
-2)
Modulus of elasticity (N mm-2)

© Forest Research Institute Malaysia 561
Mohd Jamil AW & Roszalli MJournal of Tropical Forest Science 27(4): 548–562 (2015)
Figure 12 Horizontal split failure of a scaffold board
Figure 13 Cross-sectional view of slanted board
Degree of slanted force
Width
Dep
th
Dead weight
Higher stiffnessLower stiffness
CONCLUSIONS
Flexural test of timber scaffold board using universal testing machine was simpler and required only one person to conduct the mechanical testing work. In general, MOR and MOE values of static bending test were higher than those of dead weight loading test. Thus, adjustment factors for static bending test were recommended as fMOR = 0.79 and fMOE = 0.90. The 5-percentile value of MOR for static
bending and dead weight loading tests were calculated as MOR05, static bending, adjusted = 43 N mm-2 and MOR05, dead weight loading, adjusted = 27 N mm-2. During static bending test, the difference of stiffness over the width of the board had no effect on the deflection axis since force was applied through fixed-flat loading head. For timber scaffold board with inconsistent stiffness over the width, the deflection during dead weight loading test occurred in an angled position. For dead weight loading test, the deflection measurement
© Forest Research Institute Malaysia 562
Mohd Jamil AW & Roszalli MJournal of Tropical Forest Science 27(4): 548–562 (2015)
was limited to ½ of the maximum load due to possibility of damaging the equipment. Stacking metal discs on top of the boards during dead weight loading test was intricate. Placing of weights in a haste caused the timber scaffold board to bounce, thus, exposing the operator to danger and measurement of deflection was interrupted. The duration to complete dead weight loading test was considerably longer since it involved setting up, placing and reassembling of weights and caused fatigue to the personnel.
ACKNOWLEDGEMENTS
The research was funded by the Forest Research Institute Malaysia. We are indebted to A Syarmiza and F Che Muhammad for assisting in the mechanical testing.
Small Clear Specimens of Timber. British Standards Institution, London.
Chia FC, Tin CC & Hsin IT. 2005. Accident patterns and prevention measures for fatal occupational falls in the construction industry. Applied Ergonomics 36: 391–400.
Dayang Nailul Munna AA & Gloria CMW. 2011. An analysis of accident statistics in Malaysian construction sector. International Proceedings of Economics Development and Research. 28–30 December 2010, Hong Kong.
Engku ARC. 1971. Basic and grade stresses for some Malaysian timbers. Malayan Forester 34: 131–134.
Haslam RA, Hide SA, Gibb AGF et al. 2005. Contributing factors in construction accidents. Applied Ergonomics 36: 401–415.
Hilmi MT, Mohd Shukari M, Chu YP, Nor Azian MK & Roszalli M. 1996. Handbook of Structural Timber Design: Simple Solid Members. FRIM Technical Information Handbook No. 6. Forest Research Institute Malaysia, Kepong.
Lee YH, Engku ARC & Chu YP. 1993. The Strength Properties of Some Malaysian Timbers. Timber Trade Leaflet No.34. Malaysian Timber Industry Board, Kuala Lumpur.
Madsen B. 1992. Structural Behaviour of Timber. Timber Engineering Ltd, British Columbia.
Mohd Hanim O, Aziz AS & Mahmood MT. 1998. Design and performance of tubular steel scaffolding. Journal of Civil Engineering 11: 64–79.
Mohd Jamil AW, Mohd Zamin J & Mohamad Omar MK. 2013. Relationship between mechanical properties of structural size and small clear specimens of timber. Journal of Tropical Forest Science 25: 12–21.
REFERENCES
Anonymous. 1986. Factories and Machinery Act 1967 (Act 139). Government of Malaysia, Kuala Lumpur.
Anonymous. 2012. Reimagining energy. Pp 251 in Annual Report Petrolium Nasional Berhad. PETRONAS, Kuala Lumpur.
ASTM (American Society for Testing and Materials). 2009. Standard D 143. Standard methods of testing small clear specimens of timber. Annual Book of ASTM Standards. ASTM, Philadelphia.
BS (British Standards). 1957. BS 373 Methods of Testing