flight-testing of the faa onboard inert gas generation ... office of aviation research washington,...
TRANSCRIPT

DOT/FAA/AR-03/58 Office of Aviation Research Washington, D.C. 20591
Flight-Testing of the FAA Onboard Inert Gas Generation System on an Airbus A320 Michael Burns William M. Cavage Richard Hill Robert Morrison June 2004 Final Report This document is available to the U.S. public Through the National Technical Information Service (NTIS), Springfield, Virginia 22161.
U.S. Department of Transportation Federal Aviation Administration

NOTICE
This document is disseminated under the sponsorship of the U.S. Department of Transportation in the interest of information exchange. The United States Government assumes no liability for the contents or use thereof. The United States Government does not endorse products or manufacturers. Trade or manufacturer's names appear herein solely because they are considered essential to the objective of this report. This document does not constitute FAA certification policy. Consult your local FAA aircraft certification office as to its use. This report is available at the Federal Aviation Administration William J. Hughes Technical Center's Full-Text Technical Reports page: actlibrary.tc.faa.gov in Adobe Acrobat portable document format (PDF).

Technical Report Documentation Page 1. Report No. DOT/FAA/AR-03/58
2. Government Accession No. 3. Recipient's Catalog No.
4. Title and Subtitle FLIGHT-TESTING OF THE FAA ONBOARD INERT GAS GENERATION
5. Report Date June 2004
SYSTEM ON AN AIRBUS A320 6. Performing Organization Code ATO-P
7. Author(s) Michael Burns, William M. Cavage, Richard Hill, and Robert Morrison
8. Performing Organization Report No. DOT/FAA/AR-03/58 10. Work Unit No. (TRAIS)
9. Performing Organization Name and Address Federal Aviation Administration William J. Hughes Technical Center Airport and Aircraft Safety Research and Development Division Fire Safety Branch Atlantic City International Airport, NJ 08405
11. Contract or Grant No.
12. Sponsoring Agency Name and Address U.S. Department of Transportation Federal Aviation Administration
13. Type of Report and Period Covered Final Report
Office of Aviation Research Washington, DC 20591
14. Sponsoring Agency Code ANM-112
15. Supplementary Notes 16. Abstract Extensive development and analysis has illustrated that fuel tank inerting could potentially be cost-effective if air separation modules (ASM), based on hollow-fiber membrane technology, could be used in an efficient way. To illustrate this, the Federal Aviation Administration has developed an onboard inert gas generation system that uses aircraft bleed air to generate nitrogen-enriched air (NEA) at varying flow and purity (oxygen concentration) during a commercial airplane flight cycle. A series of ground and flight tests were performed, in conjunction with Airbus, designed to prove the simplified inerting concept. The system was mounted in the cargo bay of an A320 operated by Airbus for the purposes of research and development and used to inert the aircraft center wing fuel tank during testing. The system and center wing fuel tank were instrumented to allow for the analysis of the system performance and inerting capability. The results of the tests indicated that the concept of the simplified inerting system is valid and that the air separation module dynamic characteristics were as expected. ASM pressure had the expected effect on flow rate and purity; however, bleed air consumption was greater than expected during cruise. The fuel tank inerting results illustrated that no stratification or heterogeneous oxygen concentrations occurred in the tank. The measured average tank ullage oxygen concentration data agreed well with a simple analytical model applied to the flight test data. The measured effect of the high-flow mode was significant, allowing the single-membrane configuration to maintain an inert ullage during the entire flight cycle, even with the very high rate of descent employed for the flight tests. Fuel had virtually no effect on the resulting oxygen concentrations observed in all the tests. 17. Key Words Nitrogen-enriched air, OBIGGS, Hollow-fiber membrane, Fuel tank inerting, Oxygen concentration, Air separation module
18. Distribution Statement This Document is available to the public through the National Technical Information Service (NTIS), Springfield, Virginia 22161
19. Security Classif. (of this report)
Unclassified
20. Security Classif. (of this page)
Unclassified
21. No. of Pages
39
22. Price
Form DOT F 1700.7 (8-72) Reproduction of completed page authorized

ACKNOWLEDGEMENT
The Federal Aviation Administration (FAA) and AAR-440, Fire Safety Research, would like to acknowledge the contributions of the Airbus Company in accomplishing the very difficult task of flight testing the FAA inerting system. Airbus provided all the aircraft modification and instrumentation as well as system airframe integration. The FAA was also supported by Airbus UK with additional instrumentation and systems safety and analysis. Further acknowledgement is extended to the many Airbus employees in Toulouse, France, that supported the joint FAA/Airbus flight test. The day-to-day dedication and commitment required to successfully complete the ground and flight test regiment was significant and their technical know-how and professionalism are the primary reasons for the success of the test program.
iii/iv

TABLE OF CONTENTS
Page
EXECUTIVE SUMMARY ix 1. INTRODUCTION 1
1.1 Background 1
1.1.1 Air Separation Modules 1 1.1.2 Previous Research 1 1.1.3 Commercial Transport Fuel Tanks 2
1.2 Scope 2
2. TEST ARTICLE AND PROCEDURES 3
2.1 Test Article 3
2.1.1 A320 Test Article 3 2.1.2 Instrumentation 3
2.1.2.1 Center Wing Tank 4 2.1.2.2 The FAA OBIGGS Instrumentation 4 2.1.2.3 Additional Parameters Collected 5 2.1.2.4 Aircraft Data Acquisition System 5
2.2 Test Procedures 6
3. THE FAA OBIGGS 7
3.1 System Flow 7 3.2 System Interfaces 8 3.3 System Operation 9
4. ANALYSIS 10
4.1 Calculation of Bleed Air Consumption 10 4.2 Tank Inerting Model 11
5. DISCUSSION OF RESULTS 12
5.1 System Peformance 12
5.1.1 Air Separation Module Performance Characteristics 12 5.1.2 Effect of Varying Number of Air Separation Modules 13
v
5.1.3 Bleed Air Consumption 15 5.1.4 Membrane Performance Degradation 17
5.2 Fuel Tank Inerting 18
5.2.1 Typical Mission Profile 18 5.2.2 Effect of High-Flow Mode 20 5.2.3 Effect of Fuel on Inerting 21
6. SUMMARY OF FINDINGS 23
7. REFERENCES 23
APPENDICES A—The FAA OBIGGS Engineering Drawing B—Four-Bolt Flange Engineering Specification C—The FAA OBIGGS Wiring Diagram D—Calculation of Bleed Air Consumption
LIST OF FIGURES Figure Page 1 Airbus A320 Aircraft 3
2 Side View of A320 Center Wing Tank With Sample Port Locations 4
3 Engineering Drawing of Flow Meter 5
4 System Block Diagram 7
5 The FAA OBIGGS Installed in the Test Aircraft Cargo Bay 9
6 Front Panel of the FAA OBIGGS Control Box 9
7 System Performance Data for a Single-Membrane Test 12
8 System Flow and Purity With ASM Pressure for Both Membrane Configurations During Ascent and Cruise 13
9 System Flow and Purity With ASM Pressure for Both Membrane Configurations During Descent 14
vi

10 Correlation of ASM Pressure With NEA Flow for Both System Membrane Configurations 15
11 Measured Membrane Characteristics for the Single-Membrane Configuration System 15
12 Calculated Bleed Airflow Into the Single-Membrane Configuration System 16
13 Correlation of Bleed Airflow and Atmospheric Pressure for a Single-Membrane Test 17
14 Oxygen Concentration Variation in the CWT During a Typical Flight Test 18
15 Comparison of the Single-Membrane Inerting Flight Test Tank Ullage Oxygen Concentration With the Two-Membrane Configuration 19
16 Comparison of the Single-Membrane Inerting Flight Test Average Tank Ullage Oxygen Concentration With the Model Data 20
17 Comparison of the Single-Membrane Inerting Flight Test Average Tank Oxygen Concentration for Both High-Flow Descent and Low-Flow Descent 21
18 Comparison of the Single-Membrane Inerting Flight Test Average Tank Oxygen Concentration for Both Empty Tank and a Constant Fuel Load 22
19 Comparison of the Single-Membrane Inerting Flight Test Average Tank Oxygen Concentration for Both Empty Tank Tests and Consumed Fuel Load 22
LIST OF TABLES Table Page 1 Inerting Flight Tests on the Airbus A320 6
2 Air Separation Module Performance Data Before and After 100 Hours of Aircraft Operation 17
vii

LIST OF ACRONYMS
ASM Air separation module CWT Center wing tank FAA Federal Aviation Administration HFM Hollow-fiber membrane NEA Nitrogen-enriched air OBIGGS Onboard inert gas generation system OBOAS Onboard oxygen analysis system OEA Oxygen-enriched air SCFM Standard cubic feet per minute SOV Shutoff valve t Metric ton
viii

EXECUTIVE SUMMARY
Significant emphasis has been placed on fuel tank safety since the TWA flight 800 accident in July 1996. Extensive development and analysis has illustrated that fuel tank inerting could potentially be cost-effective if air separation modules (ASM), based on hollow-fiber membrane technology, could be used in an efficient way. To illustrate this, the Federal Aviation Administration (FAA), with the assistance of several aviation-oriented companies, developed an onboard inert gas generation system with ASMs that uses aircraft bleed air to generate nitrogen-enriched air at varying flow and purity (oxygen concentration) during a commercial airplane flight cycle. The FAA performed a series of ground and flight tests designed to prove the simplified inerting concept that is being proposed by the FAA. The FAA-developed system was mounted in the cargo bay of an A320 operated by Airbus for the purposes of research and development and used to inert the aircraft center wing fuel tank during testing. The system and center wing fuel tank were instrumented to allow for the analysis of the system performance as well as inerting capability. The FAA onboard oxygen analysis system was used to measure the oxygen concentration in the center wing tank continuously during operation of the inerting system. The results of the tests indicated that the concept of the simplified inerting system is valid and that the air separation module dynamic characteristics were as expected for the limited test plan performed. Both one- and two-ASM configuration tests gave the expected performance with ASM pressure having the expected effect on flow rate and the duel-flow performance being predictable. Bleed air consumption was greater than expected during the cruise phase of flight. Additional research is needed to determine what changes in system design or operational methodology would best reduce the bleed airflow and the associated cost. The fuel tank inerting results illustrated that, as expected, no stratification or heterogeneous oxygen concentrations occurred in the tank for the inerting tests performed, in part due to the essentially rectangular box configuration of the tank, allowing easy distribution of the inert gas. A simple analytical model of the inerting process illustrated good agreement with the measured data. The measured effect of the high-flow mode was significant, allowing the single-membrane configuration to maintain an inert ullage (less then 12%) during the entire flight cycle, even with the very high rate of descent employed for the flight-tests. When the high-flow mode was not used, the ullage reached a peak of 15% oxygen by volume. Fuel had virtually no effect on the resulting oxygen concentrations observed in all the tests.
ix/x

1. INTRODUCTION.
1.1 BACKGROUND.
Significant emphasis has been placed on fuel tank safety since the TWA flight 800 accident in July 1996. Since the accident, the Federal Aviation Administration (FAA) has issued numerous Airworthiness Directives, enacted a comprehensive regulation to correct potential ignition sources in fuel tanks, and conducted research into methods that could eliminate or significantly reduce the exposure of transport airplanes to flammable vapors. Extensive development and analysis has illustrated that fuel tank inerting during aircraft operation could potentially be cost-effective if air separation modules (ASM), based on hollow-fiber membrane (HFM) technology, could be integrated into a system in an efficient manner. To illustrate this, the FAA, with the assistance of several aviation-oriented companies, developed an onboard inert gas generation system (OBIGGS) with ASMs that used aircraft bleed air to generate nitrogen-enriched air (NEA) at varying flows and purities (NEA oxygen concentration) during a commercial airplane flight cycle. This system takes advantage of the operational properties of the specified ASM as well as a two-flow methodology to keep the oxygen concentration of a fuel tank below 12% oxygen by volume. This oxygen concentration has been identified as the point at which a potential ignition source could create a reaction in a flammable tank with a measurable pressure rise [1]. 1.1.1 Air Separation Modules.
Hollow-fiber membranes are fabricated into a vessel called an air separation module. When supplied with pressurized air, these modules will ventilate a waste stream of gas from a permeate vent that is rich in oxygen, carbon dioxide, and water vapor [2]. This allows the product gas passing through the ASM to be rich in nitrogen. As flow is limited through the ASM product port (orifice), more pure (lower oxygen concentration) NEA is generated at lower mass flows. This operational property allows for a single-ASM system to generate different flows and purities of NEA to optimize the system’s ability to inert a center wing tank (CWT) throughout a given aircraft mission. In general, when an ASM is exposed to a specified feed pressure at a given pressure altitude, it will produce a mass flow of NEA at some purity, given a specific orifice setting (backpressure). This statement assumes a constant operation temperature at which the ASM performs optimally. It is these performance characteristics that will drive the capabilities of a given ASM inerting system to inert a given ullage space. 1.1.2 Previous Research.
Previous FAA research into using ASMs to inert fuel tanks has focused on the amount and purity of NEA required to reduce the oxygen concentration of a given ullage [2]. Other FAA research focused on the ability of a ground-based source of NEA to maintain an inert ullage of a Boeing 737 during ground and initial flight operations [3]. The research validated the FAA’s in-flight oxygen measurement system and also documented the small, but measurable, effects the refueling process had on an inert aircraft CWT.
1

Other previous studies include an extensive analysis of the performance of an aircraft-based OBIGGS based on permeable membranes (ASMs) versus one that uses a molecular sieve (pressure-swing absorption) [4]. This report represents the first time the OBIGGS research attempted to quantify the ability of ASMs to inert an aircraft fuel tank. The study, which ended in 1984, concluded that the performance and reliability of the state-of-the-art membrane materials was not adequate to incorporate into an aircraft environment. Follow-on research in the late 1980s illustrated that the introduction of so-called HFMs drastically decreased the size and weight of ASMs. This allowed for a relative performance increase of a factor of ten [5]. This study highlighted the favorable life cycle costs of a demand (inert gas generation) system over a stored inerting agent system and explosive suppressant foam. Improved manufacturing methods, fiber postprocessing, and permeate flow management has made HFM ASMs even more productive and efficient in the past 10 years. This makes it possible to purchase ASMs off the shelf, already designed and optimized for use in aerospace applications. 1.1.3 Commercial Transport Fuel Tanks.
Fuel tanks in commercial transport airplanes are generally sealed geometric structures in the wing or tail of the aircraft. This is usually the volume between the front and rear spar within the upper and lower wing surface. These tanks are vented to the aircraft exterior to ensure that ambient pressure is maintained within the tank. Venting is accomplished by a system of tubing and venting channels that terminate at a small overflow compartment at the end of the wing called the surge/vent tank. This tank vents to the outside through an aerodynamic opening in the underside of the wing. Many commercial transport aircraft have an extra wing fuel tank contained partially or fully within the aircraft fuselage. These tanks are generally referred to as center wing tanks. Most commercial transport aircraft have air cycle machines below these CWTs that condition hot, ducted air from the engines and reject heat during operation [6]. These tanks have been identified in the 1998 Aviation Rulemaking Advisory Committee report as potentially more flammable and statistically more susceptible to explosions [7]. 1.2 SCOPE.
The FAA and Airbus performed a series of ground and flight tests designed to prove the simplified inerting concept that is being proposed by the FAA. The FAA developed an inerting system, based on ASM technology, designed to maintain an inert ullage in a commercial transport CWT during normal ground and flight operations. The system was mounted on a cargo pallet and installed in the cargo bay of an A320 operated by Airbus for the purposes of research and development. The system was interfaced with the aircraft systems, and instrumentation was installed to study the system performance during flight-tests. The CWT of the aircraft was instrumented with gas sample tubing to allow for continuous monitoring of the tank oxygen concentration during each test flight cycle with the system performance. The purpose of the tests was to validate the simplified inerting concept as well as the expected system performance. The tests will also give insight into the effect of aircraft operations on the
2

system performance and operational considerations. The performance degradation of one membrane during the test will also be examined to allow for a better understanding of the effects of aircraft bleed air on ASM performance. 2. TEST ARTICLE AND PROCEDURES.
2.1 TEST ARTICLE.
The test article consisted of an Airbus A320 (figure 1) with associated instrumentation and data acquisition system. The FAA OBIGGS with associated instrumentation was installed in the cargo bay. The CWT was instrumented with eight gas sample tubes that were routed to the onboard oxygen analysis system (OBOAS). The OBOAS was developed by the FAA to continuously measure the oxygen concentration in a fuel tank environment during a typical commercial transport airplane flight cycle using conventional oxygen analyzers. 2.1.1 A320 Test Article.
Airbus provided an A320 airplane for the series of tests. The aircraft has a basic operating weight of 93,079 lb with a gross takeoff weight of 162,040 lb. It has a 112-foot wing span and is 123 feet long with a wing area of 1320 square feet. The maximum cruise speed of the aircraft is 487 knots at an altitude of 28,000 feet.
FIGURE 1. AIRBUS A320 AIRCRAFT The CWT has a capacity of 8200 liters of fuel (2165 gal) and is located below the floor and in between the wings, within the fuselage of the aircraft. The empty CWT ullage volume is 289 normal cubic feet for the purpose of inerting the tank with NEA. 2.1.2 Instrumentation.
The primary instrumentation employed in the test centered around the gas sample tubing in the CWT that allowed for continuous oxygen concentration measurements in the tank during each flight test using the OBOAS. Additionally, the FAA OBIGGS was instrumented with extensive pressure and temperature sensors as well as oxygen concentration measurements and flow to allow analysis of system performance and health monitoring for each test. Additional test parameters were also collected to allow for analysis of the inerting process during the flight tests.
3

2.1.2.1 Center Wing Tank.
The CWT of the A320 is a nearly rectangular box with associated structural reinforcement in the interior. The approximate inside dimensions are 9 ft long by 11 ft wide with the maximum height of approximately 3 feet at the highest point. The internal volume is estimated at 289 cubic feet. Eight sample ports are located in the tank at the eight locations identified in figure 2. Locations 1, 4, 5, and 6 are near the centerline of the aircraft (laterally), while locations 2, 3, 7, and 8 are located away from the aircraft centerline.
Vent Location NEA Deposit
(units in millimeters)
FIGURE 2. SIDE VIEW OF A320 CENTER WING TANK WITH SAMPLE PORT LOCATIONS
The OBOAS was used to measure the oxygen concentrations at the eight specified locations within the center wing fuel tank. This system consists of a regulated sample train with flow-through, in-line oxygen sensors and ancillary equipment. Two identical four-channel systems were developed. Each four-channel system was self-contained in a flight test 19-inch rack. Each system has four independent sample trains that can draw an ullage sample at four different locations in the fuel tank, regulate the sample pressure, expose the sample to the oxygen sensor, and redeposit the sample back into the fuel tank. Each oxygen sensor has a companion analyzer mounted on the same 19-inch rack. Also mounted on each rack is a four-channel inlet pressure controller and a single-outlet pressure controller electronic unit. These electronic units support the five pressure regulators and controllers in each four-channel system. Additional information on the construction and operation of the OBOAS is contained in reference 8. 2.1.2.2 The FAA OBIGGS Instrumentation.
The FAA OBIGGS was mounted in the cargo bay of the aircraft and was equipped with instrumentation to monitor and set system parameters. The system had six thermocouples and four pressure transducers (Airbus part no. GG691) installed to monitor system health and performance. The specific location and names of the pressure and temperature sensors are given in the engineering drawing in appendix A. The system was also equipped with gas sample ports to measure both NEA and oxygen-enriched air (OEA) permeate oxygen concentration. A laboratory-based altitude oxygen analyzer developed by the FAA was used to measure the oxygen concentration of both the NEA and OEA
4

during the test. This analyzer employed the same oxygen analyzer/sensor combination as the OBOAS and also used the same sample train pressure control methodology. The two-channel analyzer did not employ the same liquid traps and flash arrestors necessary when sampling from the tank nor was the sample train contained in a ventilated box. Additionally, a totalizing mass flow meter was installed at the NEA output to measure the NEA flow rate. The flow meter employs two thermopiles within the flow stream, allowing one to shed vortices about the other. The difference in power required to maintain the thermopiles at a constant temperature is directly related to flow. The meter measures static pressure and total temperature and has a digital controller to acquire the meter signals and give a linear voltage output calibrated against flow (figure 3).
FIGURE 3. ENGINEERING DRAWING OF FLOW METER 2.1.2.3 Additional Parameters Collected.
Additional instrumentation was employed to determine the validity of certain data and to better understand the fuel tank inerting process in general as it relates to the FAA concept. Flight altitude and total air temperature were measured to examine the effect flight conditions have on the inerting process. The cargo bay temperature and the backpressure on the OEA line were also acquired. Additional NEA and OEA line temperatures were also taken. 2.1.2.4 Aircraft Data Acquisition System.
All signals were recorded by the aircraft data acquisition system, which accepted all analog and digital signals required for the test in a multiplexed method and stored the data on the flight test data computer. Some data were presented on a master display, in a block diagram format, for real-time monitoring of many signals, making it easy to examine significant parameters during the test.
5

2.2 TEST PROCEDURES.
All tests were performed at the Airbus test facility in Toulouse, France. Nine flight tests were performed after a requisite 40 hours of ground tests were accomplished, though only six flight tests were used by the FAA to evaluate the inerting system capabilities. The primary purpose of the ground tests was to familiarize personnel with the inerting system operation and to adjust the system flow valves to ensure the system operated as designed during the two flow modes. Additionally, the aircraft systems’ compatibility was also validated to ensure the inerting system had no adverse effect on the existing aircraft systems or instrumentation. The six relevant tests performed were used to validate the system’s capability to inert the tank under conditions deemed challenging (short flights with high descent rates) for an OBIGGS in addition to allowing study of the dynamics of center tank inerting and fuel/air evolution. System performance was also studied from the specified test plan. Some tests used two membranes to inert the tank, while most used only one. This allowed for a gauging of system size and validation of correct system operation. Table 1 shows a list of relevant tests with the test descriptions.
TABLE 1. INERTING FLIGHT TESTS ON THE AIRBUS A320
No. Airbus
Designator Date Description 1 1969 8/18/03 Started with CWT not inerted (20% O2) and empty. Two ASMs,
OBIGGS started 10 mins before takeoff. Low-flow climb and cruise (39,000 ft), high flow in descent (normal descent).
2 1970 8/19/03 Started with CWT inerted (9% O2) and empty. Two ASMs, OBIGGS started 10 mins before takeoff. Low-flow climb and cruise (39,000 ft), high flow in descent (rapid descent).
3 1972 8/20/03 Started with CWT not inerted (20% O2) and empty. One ASM, OBIGGS started 10 mins before takeoff. Low-flow climb and cruise (39,000 ft), high flow in descent (rapid descent at beginning).
4 1973 8/21/03 Started with CWT not inerted (19% O2) and with 1.5t (23%) fuel all flight. One ASM, OBIGGS started 10 mins before takeoff. Low-flow climb and cruise (39,000 ft), high flow in descent (normal descent).
5 1974 8/22/03 Started with CWT not inerted (20% O2) and with 3t fuel (46%) normal usage. One ASM, OBIGGS started 10 mins before takeoff. Low-flow climb and cruise (39,000 ft), high flow in descent (normal descent).
6 1976 8/27/03 Started with CWT inerted (10% O2) and with 3t fuel (46%) normal usage. One ASM, OBIGGS started 10 mins before takeoff. Low-flow for entire flight (rapid descent).
6

3. THE FAA OBIGGS.
The system consists of a single unregulated flow path that is plumbed to a manifold of three ASMs. The nitrogen-rich gas that passes through the modules is then plumbed to the fuel tank to reduce the oxygen concentration, a process known as ullage washing. The flow path has a heat exchanger that controls the ASM inlet temperature and a filter. The flow passes through the ASMs and the flow control valves, which allows the system to flow in both high- and low-flow modes. For the Airbus tests, one or two of the ASMs were blocked to allow the system to better fit the needs of the A320 CWT. Figure 4 shows a block diagram illustrating the primary components of the FAA OBIGG system as well as points for instrumentation.
FIGURE 4. SYSTEM BLOCK DIAGRAM 3.1 SYSTEM FLOW.
The system accepts bleed air from the aircraft through a 2-inch-diameter fitting, which contained the system shutoff valve (SOV). When energized, the SOV valve opens, allowing flow into the system through the heat exchanger bypass Y into the heat exchanger. The heat exchanger accepts the hot bleed air and uses a 4-inch-diameter cooling bypass loop to cool the system flow to a temperature of 180° ±10°F. The cooling bypass uses a fan to flow conditioned cabin air through the heat exchanger cooling loop and uses a 4-inch-diameter, motor-operated modulating valve to throttle the airflow. The modulating valve has six positions and is operated by the system temperature controller by using the manual-modulating valve position controller, often referred to as the Parker box. The heat exchanger bypass Y allows a 1-inch-diameter line to bypass a portion of the system flow into the heat exchanger to decrease the effectiveness of the cooling loop, giving better control of the air temperature into the ASMs.
7

After passing through the temperature control portion of the system, the cooled bleed air passes through a desiccating filter, past a temperature sensor used by the operator in the temperature control loop, and through a section of pipe with a 187-watt clamp heater before entering the ASMs via a manifold. This clamp heater is designed to increase the temperature of the ASM inlet air significantly if the temperature should drop well below the target control temperature (due to system heat rejection). However, it provided very little additional temperature where the air was maintained close to the temperature obtained in the temperature control portion of the system. After the air passes into the ASMs through the manifold pipe, the air is separated in the ASMs with the NEA portion passing through and the oxygen-enriched portion passing out of the permeate vent. The ASM waste flow is eliminated from the system through the OEA manifold with a port in the side of the aircraft. It is important that this manifold be exposed directly to ambient pressure with little or no obstructions. This will prevent large pressure differentials between the OEA vent port and the ambient air pressure, which can compromise system performance. After the air is separated, the NEA passes through the flow control portion of the system, which allows the system to flow at either low- or high-flow conditions. The conditions are set by two changeable orifices (needle valves). With the high-flow valve closed, the system delivers NEA in low-flow mode, and when opened, it delivers NEA in high-flow mode. The high-flow mode allows the system to produce higher volumes of NEA at higher oxygen concentrations. This system feature allows greater flow into the tank during aircraft descent to minimize air entry into the ullage due to increasing static air pressure. This should allow for a resulting ullage oxygen concentration less than if the low-flow mode was simply employed the entire flight cycle. The flow control needle valves are set, given the system configuration, prior to the system flight test. Note that changing the system ASM configuration (1 or 2 ASMs) requires the FAA OBIGGS flow control needle valves to be adjusted. 3.2 SYSTEM INTERFACES.
To allow a relatively simple interface with the aircraft, the system was installed in the aft cargo bay of the test aircraft on an LD3 pallet. The primary mechanical interfaces for the system, as installed in the A320, was the bleed air inlet interface, the NEA deposit interface, the OEA discharge, the heat exchanger cooling air inlet, and the heat exchanger cooling air exit. In this test program, the heat exchanger cooling air interfaces were not integrated with the aircraft exterior. The cooling air was simply drafted out of the cargo bay and deposited in the rear of the bay near the outflow valve by using a piece of 4-inch-diameter flexible ducting. A 2-inch stainless steel pipe was mated to the SOV four-bolt flange (appendix B) that connected to the system bleed air. The system NEA outflow was connected by a 1-inch flange with seal assembly and clamp fitting (AS1650 compatible). The OEA was vented to a 1.6-inch-diameter drain mast that exited the aft part of the aircraft. It was attached to the system aluminum vent pipe with a 2-inch flexible coupling. All system interfaces and their locations are specified on the mechanical drawing shown in appendix A. Figure 5 shows the FAA OBIGGS installation in the cargo bay of the A320 test aircraft.
8

FIGURE 5. THE FAA OBIGGS INSTALLED IN THE TEST AIRCRAFT CARGO BAY Each system part has a specified electrical connector to communicate power and signals to the individual component. They are wired with aviation-grade wire to a system connector, allowing the system to easily interface to the FAA OBIGGS control box. This box allows the system and its components to be turned on or off and to switch the system from one flow mode to the other (see figure 6). It also provides the system operator with an ASM inlet temperature and manual temperature control box. A complete wiring diagram of the system and control box is shown in appendix C.
FIGURE 6. FRONT PANEL OF THE FAA OBIGGS CONTROL BOX 3.3 SYSTEM OPERATION.
The system is designed to operate during normal aircraft flight and ground operations, provided bleed air is available. Since the system temperature controller did not work to the specifications set by the ASM manufacturer (180° ±10°F), the ASM inlet temperature was controlled manually by a system operator. The operator used a system thermocouple attached to a reader in the FAA OBIGGS control box to adjust several potentiometers that controlled the position of the heat exchanger cooling air-modulating valve. The heat exchanger bypass valve can be opened to decrease the effectivity of the heat exchanger. This was accomplished by bypassing a small
9
amount of flow (10%-20%) around the heat exchanger, which makes controlling the air temperature to the ASMs easier with the heat exchanger cooling air-modulating valve. The system did not have a flow mode controller. This required the operator to change from low- to high-flow mode manually. The low-flow mode was used for ground taxi, takeoff, climb, and cruise phases of flight, while the high-flow mode was used for the descent phase of flight. For this test, if descent was halted for an extended period of time, the system was switched back to low-flow mode. One test used low-flow mode during the complete flight cycle. To set the flow control needle valves to the proper setting, prior to flight test, the bleed air system was charged by the aircraft auxiliary power unit (APU). This bleed air pressure was used to run the system at sea level with the low-flow needle valve set to generate 5% oxygen NEA, while the high-flow needle valve was set to generate 11% oxygen NEA. 4. ANALYSIS.
Calculations performed on the test data determined the quantity of the bleed air consumed by the system. Additionally, a simple inerting model was developed to calculate the oxygen concentration in a tank volume, given a flight profile and performance schedule of the system. 4.1 CALCULATION OF BLEED AIR CONSUMPTION.
To determine the amount of bleed air the system was consuming, the dynamics of an ASM were examined. Intuitively, the bleed airflow into the system is equal to the sum of the NEA flow and the permeate flow. (1) PermNEABleed QQQ &&& += Also, a balance of oxygen in and out of the ASM yields the following equation. (2) PermPermNEANEABleed QQQ &&& ⋅+⋅= ]O[]O[)21.0( 22 With: = NEA Oxygen Concentration NEA]O[ 2
= OEA Oxygen Concentration Perm]O[ 2
Combining equations 1 and 2 gives the following equation for bleed airflow.
)]O[21.0(
)]O[]O([
2
22
Perm
PermNEANEABleed QQ
−−
⋅= && (3)
A more complete derivation of the equation is given in appendix D.
10

4.2 TANK INERTING MODEL.
To allow for better understanding of the inerting process in a wider range of flight scenarios and system methodologies, an analytical model was developed to calculate the average tank ullage oxygen concentration, given a specific tank volume and system performance schedule. This schedule gives a mission time and altitude with the system volume flow and purity. The tank ullage temperature is also included, and the model makes the assumption that the pressure inside the tank is equal to ambient (altitude) pressure outside the aircraft. The model calculates the mass of oxygen in the tank at the start of the mission, given a starting tank oxygen concentration. The model then converts the volume flow and purity at each time step to a mass of oxygen deposited in the tank, given the altitude and temperature. The model also tracks the change in mass of oxygen in the tank due to changing pressure and temperature. The model tracks the mass of oxygen in and out of the tank, given the changing system performance and flight conditions, including the appropriate net oxygen entering the tank as a result of descent. The mass of oxygen calculated in the tank at each time step is divided by the tank gas mass to obtain oxygen concentration at that time. The following equation governs the model process. m 21.0*)*()1()*()1()1()(
22 OO TankTank VtUGOFVtUGOFmIGOFmtmt ρρ ∆+−∗∆−−∗−∗+−= && (4)
In this equation, UGOF(t-1) is the fraction of oxygen in the ullage gas. It is calculated by dividing the mass of oxygen in the tank at t-1 by the mass of gas in the tank ullage or: (5) )1(/)1()1(
2O −−=− tmtmtUGOF Tank
Where: = Mass of oxygen in tank at time t )(
2O tm m = Mass flow rate of inerting gas (in terms of t) & IGOF = Fraction of oxygen in inerting gas ∆ρ = Change in ullage density due to altitude change VTank = Volume of tank ullage mTank = Mass of gas in tank mair = Mass of air entering tank Equation 4 can be simplified by term as the mass of oxygen in the tank at time t is equal to the mass of oxygen in the tank at time (t-1), plus the mass of oxygen being deposited by the inert gas, minus the mass of oxygen being vented due to depositing inert gas, minus the mass of oxygen being vented due to changing altitude (ascent), plus the mass of oxygen being deposited due to changing altitude (descent). To compare the model with the data acquired, the average oxygen concentration in the fuel tank was calculated by taking the normal average of the eight sample ports in the tank. When one or more sample ports were not available, the average was simply calculated without that sample location.
11

5. DISCUSSION OF RESULTS.
The results of the flight tests are presented for two areas of analysis: system performance and fuel tank inerting. 5.1 SYSTEM PEFORMANCE.
The system performance data presented here focuses on the volume and purity (oxygen concentration) of inert gas generated by the system, given the aircraft flight profile and bleed air pressure (ASM feed pressure). ASM pressure was correlated with NEA flow for tests using both the one- and two-membrane configurations in the inerting system. Membrane performance characteristics were also examined, illustrating bleed air used that was also correlated with pressure altitude. Additionally, membrane performance degradation was calculated for one ASM before and after the flight tests. 5.1.1 Air Separation Module Performance Characteristics.
The primary factors influencing the performance of an ASM is feed pressure, permeate pressure (pressure altitude), and membrane backpressure (orifice setting). Given the fixed orifice settings used for the flight test for each system configuration, ASM inlet pressure and pressure altitude are the parameters most affecting system performance. Figure 7 shows the system flow and purity with ASM pressure and flight altitude for a flight test using a single membrane to inert the aircraft CWT over a given flight profile. This illustrates the effect of ASM inlet pressure on flow for the given flight cycle.
0
2
4
6
8
10
12
14
16
18
20
0 20 40 60 80 100 120
Time (min)
[O2]
(% v
ol)
0
10
20
30
40
50
60
Alt (
kft)
/ Pre
ssur
e (p
si) /
Flo
w (s
cfm
)
NEA Line O2 (%)ASM Inlet Pressure (Psig)NEA Flow (SCFM)Alt (kft)
Single Membrane Test
FIGURE 7. SYSTEM PERFORMANCE DATA FOR A SINGLE-MEMBRANE TEST
12

In general, increasing ASM inlet pressure will increase NEA flow and purity (decreasing oxygen concentration) simultaneously, given a fixed outflow orifice setting. Decreasing atmospheric pressure during ascent will increase the separating efficiency of the membrane module, having the effect of decreasing the flow and increasing the purity. During the descent, a high-flow mode is selected, giving an instantaneous increase in flow and decrease in purity. As the atmospheric pressure rises, flow increases and purity decreases. 5.1.2 Effect of Varying Number of Air Separation Modules.
Similar tests were performed with the system using both one- and two-ASM configurations. These results were compared for consistency. The high- and low-flow orifices were fixed differently for the two-system configuration to give essentially the same system purity, given the flight profile. This should allow the two-ASM system to give twice the flow as the one-ASM configuration. Figure 8 compares the ASM flow and purity for the two different system configurations for the ascent to cruise portion of the tests. The ASM inlet pressure is also shown.
0
2
4
6
8
10
12
14
16
18
20
0 5 10 15 20 25 30 35 40 45 50
Time (min)
Flow
(scf
m) /
[O2]
(% v
ol)
0
10
20
30
40
50
60
Pres
sure
(psi
g)
NEA Flow (SCFM) NEA Flow (SCFM)NEA Line O2 (%) NEA Line O2 (%)ASM Inlet Pressure (Psig) ASM Inlet Pressure (Psig)
2 Membranes1 Membrane
FIGURE 8. SYSTEM FLOW AND PURITY WITH ASM PRESSURE FOR BOTH MEMBRANE CONFIGURATIONS DURING ASCENT AND CRUISE
Figure 9 gives the same comparison for the descent portion of the tests, where the system is switched to high-flow mode. This segment required time to be adjusted for the two-membrane test to allow for a side-by-side comparison of the data. Both graphs illustrate that the ASM inlet pressure and resulting purity were very similar for the relevant segments of the flight, while the NEA flow was approximately double for the two-membrane configuration, as expected. It is unclear why the two-membrane system flow at times is considerably less than double (approximately 50%) the single-membrane configuration. This could be due to the inefficiencies
13

of the permeate venting, because high OEA venting backpressure was measured on the two-membrane test. The result from this backpressure would be to reduce the ASMs ability to flow permeate, decreasing the overall efficiency and total flow out of the ASM. As the system is switched to high-flow mode in descent for both configurations, the NEA flow tends to be more representative of the expected relationship. This is consistent with the analysis of the problem in that the effect of decreasing the ASM inlet pressure would be less permeate flow and, thus, less permeate backpressure. The problem is observed at cruise and higher altitudes, which is also the point at which permeate backpressure was the greatest. This conclusion is also supported by the measured permeate backpressure of the two-membrane configuration, which was about three times the backpressure of the single-membrane configuration.
0
2
4
6
8
10
12
14
16
18
20
70 72 74 76 78 80 82 84 86 88 90Time (min)
Oxy
gen
Con
cent
ratio
n (%
vol)
0
5
10
15
20
25
30
35
40
45
50
Flow
(scf
m) /
Pre
ssur
e (P
sig)
NEA Line O2 (%) NEA Line O2 (%)ASM Inlet Pressure (Psig) ASM Inlet Pressure (Psig)NEA Flow (SCFM) NEA Flow (SCFM)
2 Membranes1 Membrane
FIGURE 9. SYSTEM FLOW AND PURITY WITH ASM PRESSURE FOR BOTH MEMBRANE CONFIGURATIONS DURING DESCENT
The relationship between ASM pressure and NEA flow shown in figures 8 and 9 are correlated in figure 10. Again, this correlation is only valid for a similar flight profile with bleed air schedule, as NEA flow is a strong function of pressure altitude. This is why the cruise curves indicate a much lesser slope than the ascent and descent curves. The changing altitude causes vast changes in membrane permeability and a wider range in NEA flows, while the cruise portion of the flight exhibits no altitude change effects and, thus, gives a true correlation between pressure and flow with the given low-flow fixed orifice at 39,000 feet. The ascent and descent portions of the graph illustrates the large increase in normalized NEA flow from the system, given a relatively small change in ASM pressure, exhibiting a benefit of using HFM technology to generate inert gas at altitude. Only selected data for each flight phase were plotted because widely varying throttle settings produce rapid changes in the system causing uncorrelated data for brief periods due to delays in some instrumentation.
14

0
5
10
15
20
25
30
0 5 10 15 20 25 30 35 40 45 50
ASM Pressure (psig)
NEA
Flo
w (S
CFM
)
Accent - Two Membranes Cruise - Two Membranes Descent - Two Membranes Ascent - One Membrane Cruise - One Membrane Descent - One Membrane
Correlation of ASM Pressure and Flow
FIGURE 10. CORRELATION OF ASM PRESSURE WITH NEA FLOW FOR BOTH SYSTEM MEMBRANE CONFIGURATIONS
5.1.3 Bleed Air Consumption.
To help determine the feasibility and practicality of an ASM inerting system for a commercial transport airplane, the bleed air consumed by the system during the flight profile was calculated for a test with the system configured with a single membrane. Figure 11 shows the measured NEA flow, NEA oxygen concentration, and OEA oxygen concentration used to calculate system bleed airflow. Figure 11 illustrates that as NEA oxygen concentration decreases, OEA oxygen concentration decreases. This nonintuitive relationship is the result of the characteristics of the ASM that generates more pure NEA by essentially venting greater quantities of OEA, more of which is nitrogen as compared to the ASM operating at lower NEA concentrations.
0
2
4
6
8
10
12
14
16
18
20
0 20 40 60 80 100 120Time (min)
Flow
Rat
e (S
CFM
)
0
5
10
15
20
25
30
35
40
Oxy
gen
Con
cent
ratio
n (%
vol
)
NEA Flow (SCFM)NEA Line O2 (%)OEA Line O2 (%)
Single Membrane Test Data
FIGURE 11. MEASURED MEMBRANE CHARACTERISTICS FOR THE SINGLE-MEMBRANE CONFIGURATION SYSTEM
15

Figure 12 gives the calculated bleed airflow and permeate flow of the system for the same single-membrane inerting flight test. The graph illustrates the effect of increased recovery of the ASM with altitude and the effect of venting more nitrogen, as stated in the previous paragraph. In the beginning of the test, at sea level, the ASM generated 5 standard cubic feet per minute (SCFM) of NEA at 5% oxygen concentration and was consuming 14 SCFM of bleed air. At cruise, the system is generating 4 SCFM of less than 1% NEA but was consuming almost 50 SCFM of bleed air. The increased performance of the ASM at altitude allowed excellent production of NEA, especially when considering the effect of NEA on inerting the tank is five-fold greater at 39,000 ft than at sea level. However, the system discarded more than three times the amount of bleed air.
0
10
20
30
40
50
60
0 20 40 60 80 100
Time (min)
Flow
Rat
e (S
CFM
)
120
NEA Flow (SCFM)Bleedair Flow (SCFM)Permeate Flow (SCFM)
Single Membrane Data
FIGURE 12. CALCULATED BLEED AIRFLOW INTO THE SINGLE-MEMBRANE CONFIGURATION SYSTEM
The effect of altitude on bleed air was examined by correlating bleed airflow with atmospheric pressure during the accent portion of the test. Figure 13 illustrates that the bleed airflow more than doubles as altitude increases, although the grouping of data points in a lateral manner illustrates dependence on another parameter. This is most likely due to changing throttle settings (ASM pressure) during the aircraft climb to cruise.
16

0
5
10
15
20
25
30
35
40
45
50
0 100 200 300 400 500 600 700 800 900 1000
Atmo Pressure (mBar)
Ble
edai
r Flo
w (S
CFM
)
Ascent
FIGURE 13. CORRELATION OF BLEED AIRFLOW AND ATMOSPHERIC PRESSURE FOR A SINGLE-MEMBRANE TEST
5.1.4 Membrane Performance Degradation.
An ASM can be sensitive to contaminents in the air source. These contaminents can decrease the effectiveness or even damage the fibers in the ASM, degrading the ASM performance over time exposure to these contaminents. As previously stated, the FAA OBIGGS has a filter to remove particulate, but how effective this type of filter is at protecting the ASM is unknown. Most hollow fiber is intollerant of hydrocarbon vapor in general and the amount of hydrocarbon vapor in the bleed air and the filter’s ability to remove it is in question. To determine the effect of aircraft bleed air systems on an ASM, a single-ASM used during ground and flight tests was subjected to a single test point before and after the tests. The NEA and ASM inlet (bleed) flow were measured for a given NEA purity at a specific inlet pressure and temperature at sea level. Table 2 shows the difference in ASM performance before and after the test. The 14 percent drop in NEA produced is more than the expected decrease in productivity due to normal break-in of the ASM over the first hours of service. TABLE 2. AIR SEPARATION MODULE PERFORMANCE DATA BEFORE AND AFTER
100 HOURS OF AIRCRAFT OPERATION
Membrane State
ASM Inlet Temperature
ASM Inlet Pressure Altitude
NEA Purity NEA Flow
ASM Inlet Flow
Before 172°F 25 psig Sea Level 5% 0.36 lbs/min 1.48 lbs/minAfter 169°F 25 psig Sea Level 5% 0.31 lbs/min 1.25 lbs/minDifference 0.05 lbs/min 0.23 lbs/min
17

5.2 FUEL TANK INERTING.
The fuel tank inerting results illustrates the effect that system performance has on the fuel tank in terms of oxygen concentration achieved during the flight test profile. This data will be compared to a model that calculates the fuel tank oxygen concentration, given the system performance and flight cycle. The effect of high-flow mode and fuel tank fuel load on the ability of the system to inert the tank was also examined. 5.2.1 Typical Mission Profile.
To determine the variation of oxygen concentration within the tank during a typical flight, the results of the eight gas sample ports in the CWT were plotted with the flight profile for the total test (figure 14). This test (see table 1—Airbus 1972) employed the inerting system with the dual-mode operation and the single ASM configuration. The results show a small variation in the oxygen concentration in the tank for most of the mission with some noticeable, but small, variation among the measurements during the ascent and descent phase of the flight. As previously stated, the Airbus A320 tank design is a simple rectangular box, with no web structures to compartmentalize the tank, as is the case with most large commercial transport aircraft manufactured in the United States. The only appreciable difference any oxygen concentration measurement has from the collective average is sample port 1 during the descent. This sample port is very close to the vent port, which is depositing air into the tank during descent. This sample port gives an excellent visual indication of what altitude the tank stops “breathing” air in as a result of the inerting system flow into the tank. Virtually every flight test exhibits this same characteristic appearance, illustrating no observed conditions that would give localized heterogeneous oxygen concentrations.
0
5
10
15
20
25
0 20 40 60 80 100 120
Time (min)
[O2]
(% v
ol)
0
5
10
15
20
25
30
35
40
45
Alti
tude
(kft)
O2 Sample 1 (%)O2 Sample 2 (%)O2 Sample 3 (%)O2 Sample 4 (%)O2 Sample 5 (%)O2 Sample 6 (%)O2 Sample 7 (%)O2 Sample 8 (%)Alt (kft)
Single Membrane Test
FIGURE 14. OXYGEN CONCENTRATION VARIATION IN THE CWT DURING A TYPICAL FLIGHT TEST
18
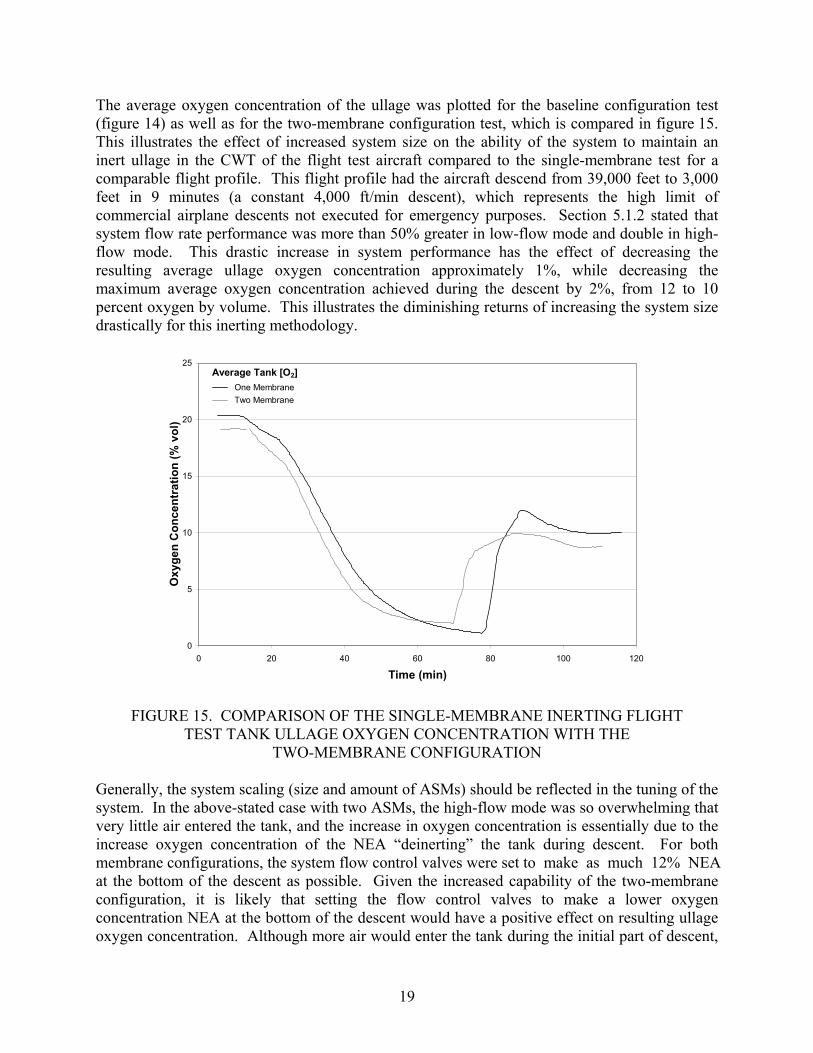
The average oxygen concentration of the ullage was plotted for the baseline configuration test (figure 14) as well as for the two-membrane configuration test, which is compared in figure 15. This illustrates the effect of increased system size on the ability of the system to maintain an inert ullage in the CWT of the flight test aircraft compared to the single-membrane test for a comparable flight profile. This flight profile had the aircraft descend from 39,000 feet to 3,000 feet in 9 minutes (a constant 4,000 ft/min descent), which represents the high limit of commercial airplane descents not executed for emergency purposes. Section 5.1.2 stated that system flow rate performance was more than 50% greater in low-flow mode and double in high-flow mode. This drastic increase in system performance has the effect of decreasing the resulting average ullage oxygen concentration approximately 1%, while decreasing the maximum average oxygen concentration achieved during the descent by 2%, from 12 to 10 percent oxygen by volume. This illustrates the diminishing returns of increasing the system size drastically for this inerting methodology.
0
5
10
15
20
25
0 20 40 60 80 100
Time (min)
Oxy
gen
Con
cent
ratio
n (%
vol
)
120
One Membrane Two Membrane
Average Tank [O2]
FIGURE 15. COMPARISON OF THE SINGLE-MEMBRANE INERTING FLIGHT TEST TANK ULLAGE OXYGEN CONCENTRATION WITH THE
TWO-MEMBRANE CONFIGURATION Generally, the system scaling (size and amount of ASMs) should be reflected in the tuning of the system. In the above-stated case with two ASMs, the high-flow mode was so overwhelming that very little air entered the tank, and the increase in oxygen concentration is essentially due to the increase oxygen concentration of the NEA “deinerting” the tank during descent. For both membrane configurations, the system flow control valves were set to make as much 12% NEA at the bottom of the descent as possible. Given the increased capability of the two-membrane configuration, it is likely that setting the flow control valves to make a lower oxygen concentration NEA at the bottom of the descent would have a positive effect on resulting ullage oxygen concentration. Although more air would enter the tank during the initial part of descent,
19
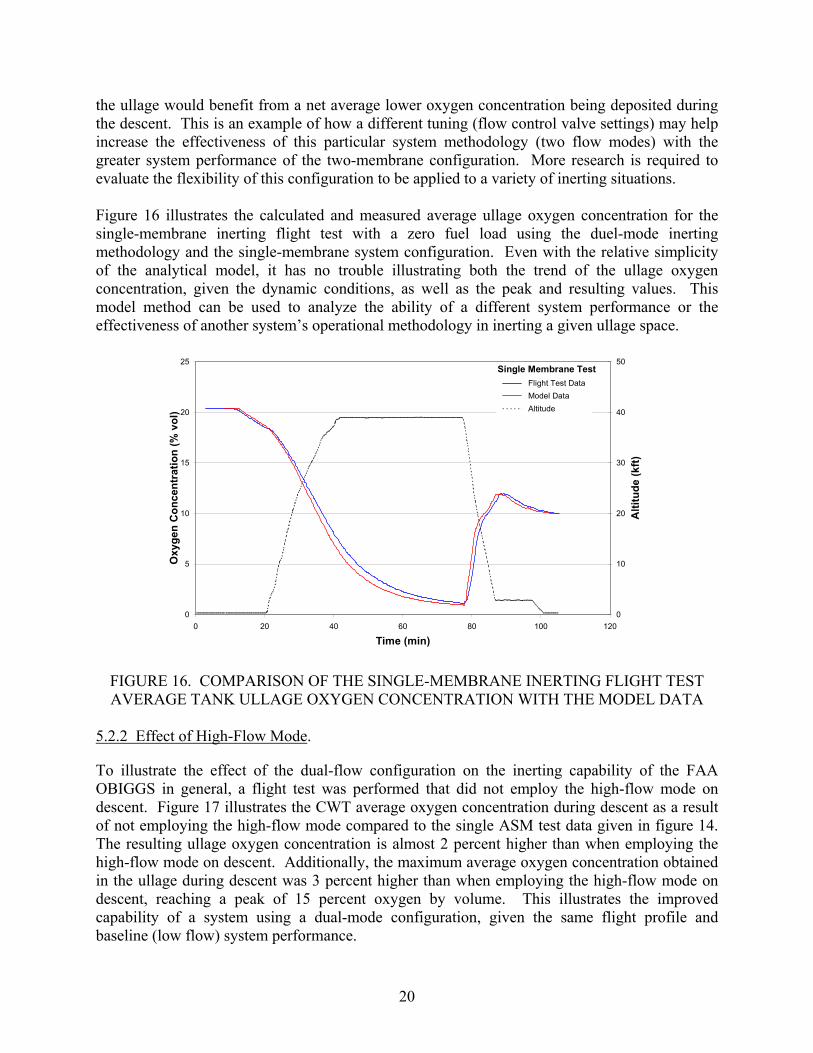
the ullage would benefit from a net average lower oxygen concentration being deposited during the descent. This is an example of how a different tuning (flow control valve settings) may help increase the effectiveness of this particular system methodology (two flow modes) with the greater system performance of the two-membrane configuration. More research is required to evaluate the flexibility of this configuration to be applied to a variety of inerting situations. Figure 16 illustrates the calculated and measured average ullage oxygen concentration for the single-membrane inerting flight test with a zero fuel load using the duel-mode inerting methodology and the single-membrane system configuration. Even with the relative simplicity of the analytical model, it has no trouble illustrating both the trend of the ullage oxygen concentration, given the dynamic conditions, as well as the peak and resulting values. This model method can be used to analyze the ability of a different system performance or the effectiveness of another system’s operational methodology in inerting a given ullage space.
0
5
10
15
20
25
0 20 40 60 80 100 120
Time (min)
Oxy
gen
Con
cent
ratio
n (%
vol
)
0
10
20
30
40
50
Alti
tude
(kft)
Flight Test Data Model Data Altitude
Single Membrane Test
FIGURE 16. COMPARISON OF THE SINGLE-MEMBRANE INERTING FLIGHT TEST AVERAGE TANK ULLAGE OXYGEN CONCENTRATION WITH THE MODEL DATA
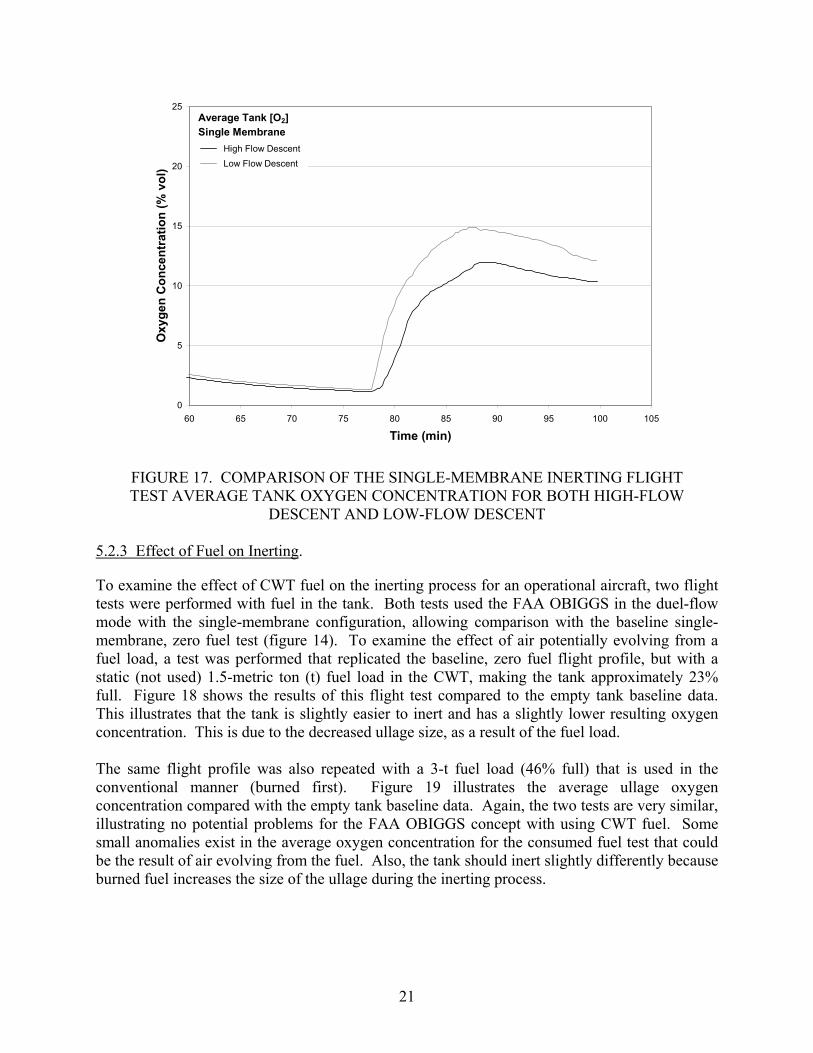
5.2.2 Effect of High-Flow Mode.
To illustrate the effect of the dual-flow configuration on the inerting capability of the FAA OBIGGS in general, a flight test was performed that did not employ the high-flow mode on descent. Figure 17 illustrates the CWT average oxygen concentration during descent as a result of not employing the high-flow mode compared to the single ASM test data given in figure 14. The resulting ullage oxygen concentration is almost 2 percent higher than when employing the high-flow mode on descent. Additionally, the maximum average oxygen concentration obtained in the ullage during descent was 3 percent higher than when employing the high-flow mode on descent, reaching a peak of 15 percent oxygen by volume. This illustrates the improved capability of a system using a dual-mode configuration, given the same flight profile and baseline (low flow) system performance.
20
0
5
10
15
20
25
60 65 70 75 80 85 90 95 100 105
Time (min)
Oxy
gen
Con
cent
ratio
n (%
vol
) High Flow Descent Low Flow Descent
Average Tank [O2]Single Membrane
FIGURE 17. COMPARISON OF THE SINGLE-MEMBRANE INERTING FLIGHT TEST AVERAGE TANK OXYGEN CONCENTRATION FOR BOTH HIGH-FLOW
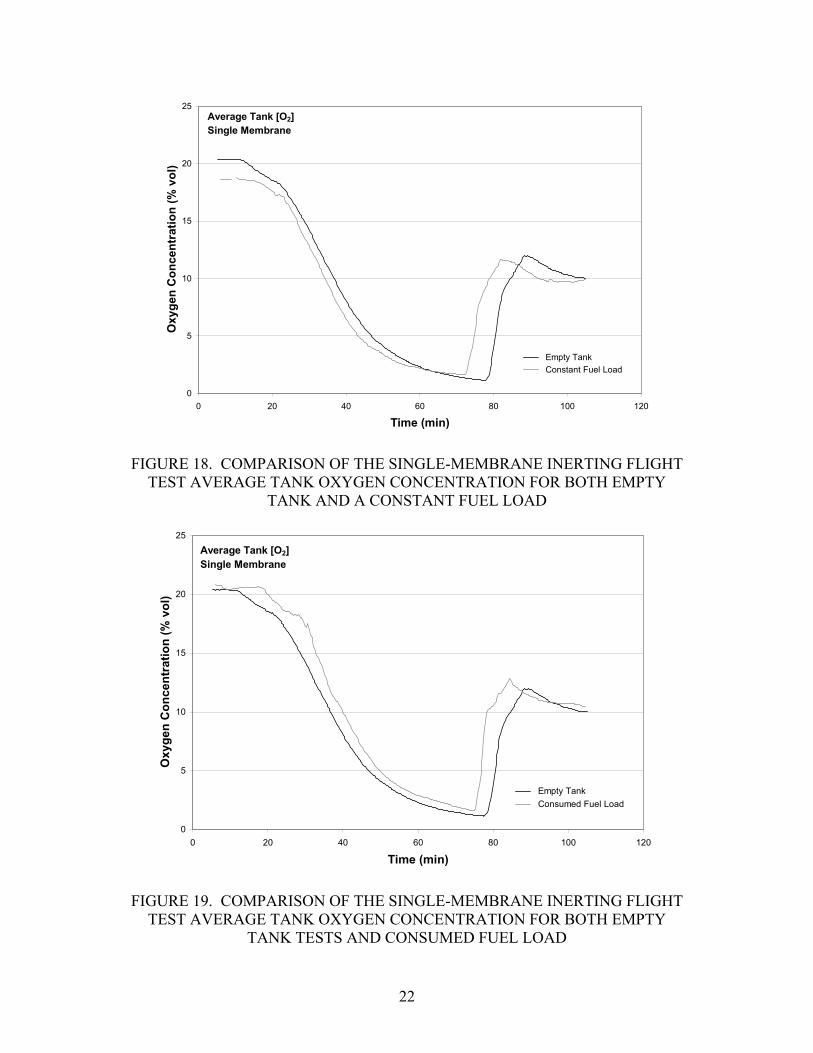
DESCENT AND LOW-FLOW DESCENT 5.2.3 Effect of Fuel on Inerting.
To examine the effect of CWT fuel on the inerting process for an operational aircraft, two flight tests were performed with fuel in the tank. Both tests used the FAA OBIGGS in the duel-flow mode with the single-membrane configuration, allowing comparison with the baseline single-membrane, zero fuel test (figure 14). To examine the effect of air potentially evolving from a fuel load, a test was performed that replicated the baseline, zero fuel flight profile, but with a static (not used) 1.5-metric ton (t) fuel load in the CWT, making the tank approximately 23% full. Figure 18 shows the results of this flight test compared to the empty tank baseline data. This illustrates that the tank is slightly easier to inert and has a slightly lower resulting oxygen concentration. This is due to the decreased ullage size, as a result of the fuel load. The same flight profile was also repeated with a 3-t fuel load (46% full) that is used in the conventional manner (burned first). Figure 19 illustrates the average ullage oxygen concentration compared with the empty tank baseline data. Again, the two tests are very similar, illustrating no potential problems for the FAA OBIGGS concept with using CWT fuel. Some small anomalies exist in the average oxygen concentration for the consumed fuel test that could be the result of air evolving from the fuel. Also, the tank should inert slightly differently because burned fuel increases the size of the ullage during the inerting process.
21
0
5
10
15
20
25
0 20 40 60 80 100 120
Time (min)
Oxy
gen
Con
cent
ratio
n (%
vol
)
Empty Tank Constant Fuel Load
Average Tank [O2]Single Membrane
FIGURE 18. COMPARISON OF THE SINGLE-MEMBRANE INERTING FLIGHT TEST AVERAGE TANK OXYGEN CONCENTRATION FOR BOTH EMPTY
TANK AND A CONSTANT FUEL LOAD
0
5
10
15
20
25
0 20 40 60 80 100 120
Time (min)
Oxy
gen
Con
cent
ratio
n (%
vol
)
Empty Tank Consumed Fuel Load
Average Tank [O2]Single Membrane
FIGURE 19. COMPARISON OF THE SINGLE-MEMBRANE INERTING FLIGHT TEST AVERAGE TANK OXYGEN CONCENTRATION FOR BOTH EMPTY
TANK TESTS AND CONSUMED FUEL LOAD
22

6. SUMMARY OF FINDINGS.
The results of the tests indicated that the concept of the simplified inerting system is valid and that the air separation module (ASM) dynamic characteristics were as expected for the limited discussed test plan. Both one- and two-ASM configuration tests gave the expected performance with ASM pressure having the expected affect on flow rate, and the duel-flow performance having the predicted effect on the ullage oxygen concentration. Bleed air consumption was greater than expected. Additional research is needed to determine what changes in system design or operational methodology would best reduce the bleed airflow and the associated cost. The effect of aircraft bleed air on the performance degradation of an ASM needs to be studied further. The fuel tank inerting results illustrated that no stratification or heterogeneous oxygen concentrations occurred in the tank for the inerting tests performed. The essentially rectangular box configuration of the tank allowed easy distribution of the inert gas. The measured effect of the high-flow mode was significant, allowing the single-membrane configuration to maintain an inert ullage during the entire flight cycle, even with the abnormally high rate of descent employed for the flight test. When the high-flow mode was not used, the ullage reached a peak of 15% oxygen by volume. The fuel quantity in the fuel tank had virtually no effect on the resulting oxygen concentrations observed during the tests. 7. REFERENCES.
1. Summer, Steven M., “Limiting Oxygen Concentration Required to Inert Jet Fuel Vapors Existing at Reduced Fuel Tank Pressures,” FAA Report DOT/FAA/AR-TN02/79, August 2003.
2. Burns, Michael and Cavage, William M., “Inerting of a Vented Aircraft Fuel Tank Test Article With Nitrogen-Enriched Air,” FAA Report DOT/FAA/AR-01/6, April 2001.
3. Burns, Michael and Cavage, William M., “Ground and Flight Testing of a Boeing 737 Center Wing Fuel Tank Inerted With Nitrogen-Enriched Air,” DOT/FAA/AR-01/63, August 2001.
4. Anderson, C. L., “Volume III—On-Board Inert Gas Generation System (OBIGGS) Studies, Part 1—OBIGGS Ground Performance Tests,” Aero Propulsion Laboratory Report AFWAL-TR-85-2060, January 1986.
5. Clodfelter, R. G., Anderson, C. L., and Vannice, W. L., “OBIGGS for Fighter Aircraft,” SAE Technical Paper 871903, Aerospace Technology Conference and Exposition, Long Beach, California, October 5-8, 1987.
23

6. “A Review of the Flammability Hazard of Jet A Fuel Vapor in Civil Transport Aircraft Fuel Tanks,” Fuel Flammability Task Group, FAA Report DOT/FAA/AR-98/26, June 1998.
7. “Fuel Tank Harmonization Working Group Final Report,” Aviation Rulemaking Advisory Committee, July 1998.
8. Burns, Michael and Cavage, William M., “A Description and Analysis of the FAA Onboard Oxygen Analysis System,” FAA Report DOT/FAA/AR-TN03/52, June 2003.
24

APPENDIX A—THE FAA OBIGGS ENGINEERING DRAWING
A-1/A-2

Static Pressure (282)
Note:
Instrumentation Identified with Parenthetic Numbers Cited in Airbus Z-Mod XB 071 B Heat Exchanger Exhaust Deposited in Rear of Cargo Bay via 4” Flexible Duct Connected with Flexible Copuling
Temperature (FAA Reader) Temperature (28-7)Static Pressure (28-6)
NEA [O2] (28-73) Temperature (28-15)
Static Pressure (28-14)
Spare Port
Temperature (28-9)Static Pressure (28-8)
Interface Description: Interface 1: 2” Flexible Coupling Interface 2: 2” Dia SS Pipe with 4-Bolt flange with Face Mating Seal Interface 3: 1” Dia Al tube with Hydra-flow 14T02 Sleeve, Coupling, Seal, and Clamp Assy
Interface 3: System NEA Output
Heat Exchanger Cooling Air Exhaust (No Interface)
Interface 2: System Bleed Air Connection
Temperature (28-4)
Interface 1: OEA Exhaust
OEA [O2] (28-74)
Temperature (28-5)
Temperature (28-1)
Heat Exchanger Cooling Air Inlet(No Interface)
A-3/A-4
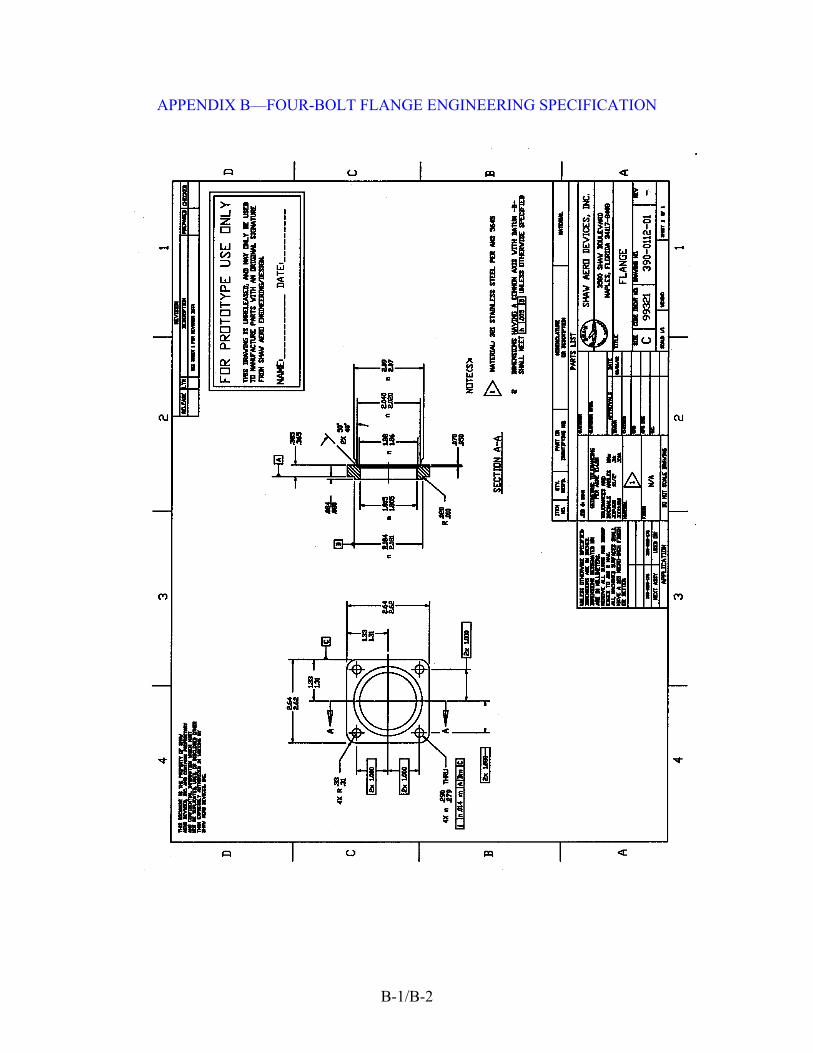
APPENDIX B—FOUR-BOLT FLANGE ENGINEERING SPECIFICATION
B-1/B-2

APPENDIX C—THE FAA OBIGGS WIRING DIAGRAM
C-1/C-2

C-3/C-4

APPENDIX D—CALCULATION OF BLEED AIR CONSUMPTION
Given bleed airflow BleedQ , NEA flow , and Permeate (OEA) flow Q for a given ASM, intuitively the following equation applies:
&NEAQ& Perm
&
PermNEABleed QQQ &&& +=or, (D-1) NEABleedPerm QQQ &&& −= Also, a mole balance of oxygen for the same ASM yields the following equation. Moles of O2 in Air = Moles of O2 in NEA + Moles of O2 in Permeate (D-2) PermPermNEANEABleed QQQ. &&& ⋅+⋅= ]O[]O[)210( 22 Where: = NEA Oxygen Concentration NEA]O[ 2
= OEA Oxygen Concentration Perm]O[ 2
Combining equations 1 and 2 and solving for gives: BleedQ& )(]O[]O[)21.0( 22 NEABleedPermNEANEABleed QQQQ &&&& −⋅+⋅= NEAPermBleedPermNEANEABleed QQQQ &&&& ⋅−⋅+⋅= ]O[]O[]O[)21.0( 222
NEAPermNEANEABleedPermBleed QQQQ &&&& ⋅−⋅=⋅− ]O[]O[]O[)21.0( 222
)]O[]O([)]O[21.0( 222 PermNEANEAPermBleed QQ −⋅=−⋅ &&
)]O[21.0(
)]O[]O([
2
22
Perm
PermNEANEABleed QQ
−−⋅= && (D-3)
This equation allows for the calculation of the bleed air consumed by an ASM based inerting system given the NEA flow and purity as well as the oxygen concentration of the permeate.
D-1/D-2