flightstats on-time report - august 2013
DESCRIPTION
The FlightStats monthly On-time Performance Report compares the on-time performance of scheduled passenger flights operated by the top airlines throughout various regions globally as well as top performing airports based on their reported departure performance. This report is a summary of airline arrivals and airport departures for the period August 1, 2013 through August 31, 2013.TRANSCRIPT

August 2013
Copyright © 2013 FlightStats, Inc.
Airline and Airport On-time Performance Report
Summary of Airline Arrivals and Airport Departures for the period August 1, 2013 through August 31, 2013
Published September 9, 2013
1

August 2013
Copyright © 2013 FlightStats, Inc. 2
Abstract This FlightStats monthly On-‐Hme Performance Report compares the on-‐Hme performance of scheduled passenger flights operated by the top airlines throughout various regions globally as well as top performing airports based on their reported departure performance. The report summarizes the data by carrier and includes a breakdown of on-‐Hme, late, very late and excessively late arrivals and departures. Also included is the average delay for flights arriving more than 15 minutes late, the percentage of flights cancelled and diverted. Refer to each category secHon for the flight status coverage of the airlines scheduled flights, and the airports scheduled departures.
Refer to the Appendix for definiHon of delay classificaHon, cancellaHon calculaHons, and the airline, flight and airport selecHon criteria.
Usage and ARribuHon You are free to re-‐publish the informaHon in this report on your website, blog, or in printed material as long as you provide aRribuHon to FlightStats and a link to www.flightstats.com.
Disclaimer Customer acknowledges that all data provided or available through FlightStats is owned either by FlightStats, Inc. or by third-‐party data providers (the “Owners”), and that Customer shall not acquire any ownership or interest whatsoever in such data. FlightStats data is solely for the benefit and purposes of Customer.
The informaHon contained in FlightStats reports has been compiled from various sources, and the Owners disclaim all responsibility for checking and verifying that the underlying data is 100% accurate. Consequently, the data is provided “as is” and FlightStats, Inc. provides no warranHes of any type to Customer. FlightStats, Inc. and its data providers are not liable for any consequenHal damages or financial loss caused by any person's reliance on the data.
Company InformaHon FlightStats, Inc. 522 SW 5th Ave Suite 200 Portland, Oregon 97204 USA
Tel. +1 (503) 274-‐0938 Fax: +1 (503) 274-‐0939
Visit the FlightStats website at www.flightstats.com.

August 2013
Copyright © 2013 FlightStats, Inc.
Table of Contents
3
1. Major InternaHonal Airlines and Airports 4
Airline Arrival Performance and CancellaHons 5
Airport Departure Performance and CancellaHons 9
2. North American Region 13
Airline Arrival Performance and CancellaHons 14
Airport Departure Performance and CancellaHons 18
3. European Region 22
Airline Arrival Performance and CancellaHons 23
Airport Departure Performance and CancellaHons 27
4. Asian Region 31
Airline Arrival Performance and CancellaHons 32
Airport Departure Performance and CancellaHons 36
5. Top 10 Lists – Airlines and Airports 40
6. Appendix 42

August 2013
Copyright © 2013 FlightStats, Inc.
Major International Airlines and Airports
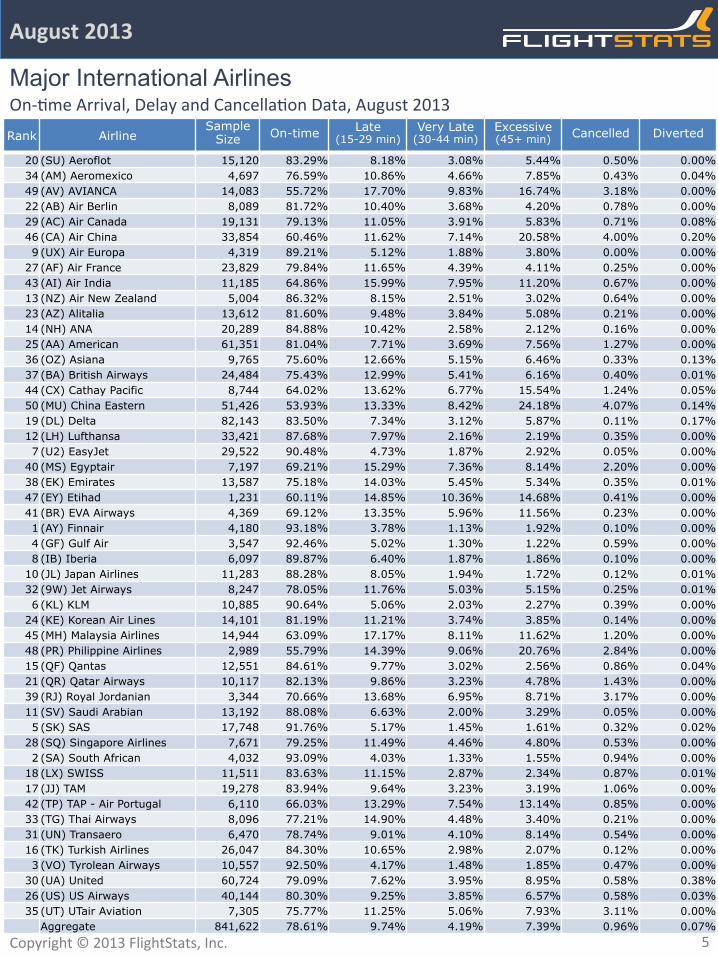
Summary of Monthly Results Major InternaHonal airlines on average delivered 73.57% of their flights to the arrival gate within 15 minutes of schedule in August, up from July’s 75.21%. CancellaHons for the group decreased to 1.12%, compared with 1.33% last month. Seven major internaHonal carriers: (AY) Finnair, (SA) South African Airways, (VO) Tyrolean Airways, (GF) Gulf Air,(SK) SAS, (KL) KLM, and (U2) EasyJet delivered over 90% of their flights on Hme.
(HND) Tokyo's Haneda held its top spot among the world’s busiest airports with an on-‐Hme performance of 88.69%. In August, four European Airports, three North American airports, two Asian airports, and one Australian Airport were in the top ten. The average on-‐Hme departure performance among the top 35 internaHonal airports was 73.57% up from July’s rate of 69.66% and cancellaHons for the group were 1.12% down from 1.82% the previous month.
Review in-‐depth charts of on-‐Hme performance within the following secHon or see Top 10 lists for at-‐a-‐glance rank.
Note: The flight status coverage threshold for the Major InternaHonal Airlines group was set at 80%. For the Major InternaHonal Airport group the departure status threshold was set to 75% although in most cases it was well above 90%.
4
August 2013
Copyright © 2013 FlightStats, Inc.
Major International Airlines
5
On-‐Hme Arrival, Delay and CancellaHon Data, August 2013
Rank Airline
Sample Size On-time Late
(15-29 min) Very Late
(30-44 min) Excessive (45+ min) Cancelled Diverted
20 (SU) Aeroflot 15,120 83.29% 8.18% 3.08% 5.44% 0.50% 0.00% 34 (AM) Aeromexico 4,697 76.59% 10.86% 4.66% 7.85% 0.43% 0.04% 49 (AV) AVIANCA 14,083 55.72% 17.70% 9.83% 16.74% 3.18% 0.00% 22 (AB) Air Berlin 8,089 81.72% 10.40% 3.68% 4.20% 0.78% 0.00% 29 (AC) Air Canada 19,131 79.13% 11.05% 3.91% 5.83% 0.71% 0.08% 46 (CA) Air China 33,854 60.46% 11.62% 7.14% 20.58% 4.00% 0.20% 9 (UX) Air Europa 4,319 89.21% 5.12% 1.88% 3.80% 0.00% 0.00%
27 (AF) Air France 23,829 79.84% 11.65% 4.39% 4.11% 0.25% 0.00% 43 (AI) Air India 11,185 64.86% 15.99% 7.95% 11.20% 0.67% 0.00% 13 (NZ) Air New Zealand 5,004 86.32% 8.15% 2.51% 3.02% 0.64% 0.00% 23 (AZ) Alitalia 13,612 81.60% 9.48% 3.84% 5.08% 0.21% 0.00% 14 (NH) ANA 20,289 84.88% 10.42% 2.58% 2.12% 0.16% 0.00% 25 (AA) American 61,351 81.04% 7.71% 3.69% 7.56% 1.27% 0.00% 36 (OZ) Asiana 9,765 75.60% 12.66% 5.15% 6.46% 0.33% 0.13% 37 (BA) British Airways 24,484 75.43% 12.99% 5.41% 6.16% 0.40% 0.01% 44 (CX) Cathay Pacific 8,744 64.02% 13.62% 6.77% 15.54% 1.24% 0.05% 50 (MU) China Eastern 51,426 53.93% 13.33% 8.42% 24.18% 4.07% 0.14% 19 (DL) Delta 82,143 83.50% 7.34% 3.12% 5.87% 0.11% 0.17% 12 (LH) Lufthansa 33,421 87.68% 7.97% 2.16% 2.19% 0.35% 0.00% 7 (U2) EasyJet 29,522 90.48% 4.73% 1.87% 2.92% 0.05% 0.00%
40 (MS) Egyptair 7,197 69.21% 15.29% 7.36% 8.14% 2.20% 0.00% 38 (EK) Emirates 13,587 75.18% 14.03% 5.45% 5.34% 0.35% 0.01% 47 (EY) Etihad 1,231 60.11% 14.85% 10.36% 14.68% 0.41% 0.00% 41 (BR) EVA Airways 4,369 69.12% 13.35% 5.96% 11.56% 0.23% 0.00% 1 (AY) Finnair 4,180 93.18% 3.78% 1.13% 1.92% 0.10% 0.00% 4 (GF) Gulf Air 3,547 92.46% 5.02% 1.30% 1.22% 0.59% 0.00% 8 (IB) Iberia 6,097 89.87% 6.40% 1.87% 1.86% 0.10% 0.00%
10 (JL) Japan Airlines 11,283 88.28% 8.05% 1.94% 1.72% 0.12% 0.01% 32 (9W) Jet Airways 8,247 78.05% 11.76% 5.03% 5.15% 0.25% 0.01% 6 (KL) KLM 10,885 90.64% 5.06% 2.03% 2.27% 0.39% 0.00%
24 (KE) Korean Air Lines 14,101 81.19% 11.21% 3.74% 3.85% 0.14% 0.00% 45 (MH) Malaysia Airlines 14,944 63.09% 17.17% 8.11% 11.62% 1.20% 0.00% 48 (PR) Philippine Airlines 2,989 55.79% 14.39% 9.06% 20.76% 2.84% 0.00% 15 (QF) Qantas 12,551 84.61% 9.77% 3.02% 2.56% 0.86% 0.04% 21 (QR) Qatar Airways 10,117 82.13% 9.86% 3.23% 4.78% 1.43% 0.00% 39 (RJ) Royal Jordanian 3,344 70.66% 13.68% 6.95% 8.71% 3.17% 0.00% 11 (SV) Saudi Arabian 13,192 88.08% 6.63% 2.00% 3.29% 0.05% 0.00% 5 (SK) SAS 17,748 91.76% 5.17% 1.45% 1.61% 0.32% 0.02%
28 (SQ) Singapore Airlines 7,671 79.25% 11.49% 4.46% 4.80% 0.53% 0.00% 2 (SA) South African 4,032 93.09% 4.03% 1.33% 1.55% 0.94% 0.00%
18 (LX) SWISS 11,511 83.63% 11.15% 2.87% 2.34% 0.87% 0.01% 17 (JJ) TAM 19,278 83.94% 9.64% 3.23% 3.19% 1.06% 0.00% 42 (TP) TAP - Air Portugal 6,110 66.03% 13.29% 7.54% 13.14% 0.85% 0.00% 33 (TG) Thai Airways 8,096 77.21% 14.90% 4.48% 3.40% 0.21% 0.00% 31 (UN) Transaero 6,470 78.74% 9.01% 4.10% 8.14% 0.54% 0.00% 16 (TK) Turkish Airlines 26,047 84.30% 10.65% 2.98% 2.07% 0.12% 0.00% 3 (VO) Tyrolean Airways 10,557 92.50% 4.17% 1.48% 1.85% 0.47% 0.00%
30 (UA) United 60,724 79.09% 7.62% 3.95% 8.95% 0.58% 0.38% 26 (US) US Airways 40,144 80.30% 9.25% 3.85% 6.57% 0.58% 0.03% 35 (UT) UTair Aviation 7,305 75.77% 11.25% 5.06% 7.93% 3.11% 0.00%
Aggregate 841,622 78.61% 9.74% 4.19% 7.39% 0.96% 0.07%

August 2013
Copyright © 2013 FlightStats, Inc.
Full Page Chart Master
6
83.29% 76.59%
55.72% 81.72%
79.13% 60.46%
89.21% 79.84%
64.86% 86.32%
81.60% 84.88%
81.04% 75.60% 75.43%
64.02% 53.93%
83.50% 87.68%
90.48% 69.21%
75.18% 60.11%
69.12% 93.18% 92.46%
89.87% 88.28%
78.05% 90.64%
81.19% 63.09%
55.79% 84.61%
82.13% 70.66%
88.08% 91.76%
79.25% 93.09%
83.63% 83.94%
66.03% 77.21% 78.74%
84.30% 92.50%
79.09% 80.30%
75.77%
0.00% 10.00% 20.00% 30.00% 40.00% 50.00% 60.00% 70.00% 80.00% 90.00% 100.00%
(SU) Aeroflot (AM) Aeromexico
(AV) AVIANCA (AB) Air Berlin
(AC) Air Canada (CA) Air China
(UX) Air Europa (AF) Air France (AI) Air India
(NZ) Air New Zealand (AZ) Alitalia (NH) ANA
(AA) American (OZ) Asiana
(BA) BriHsh Airways (CX) Cathay Pacific (MU) China Eastern
(DL) Delta (LH) Luqhansa (U2) EasyJet
(MS) Egyptair (EK) Emirates
(EY) EHhad (BR) EVA Airways
(AY) Finnair (GF) Gulf Air
(IB) Iberia (JL) Japan Airlines (9W) Jet Airways
(KL) KLM (KE) Korean Air Lines
(MH) Malaysia Airlines (PR) Philippine Airlines
(QF) Qantas (QR) Qatar Airways (RJ) Royal Jordanian (SV) Saudi Arabian
(SK) SAS (SQ) Singapore Airlines
(SA) South African (LX) SWISS (JJ) TAM
(TP) TAP -‐ Air Portugal (TG) Thai Airways (UN) Transaero
(TK) Turkish Airlines (VO) Tyrolean Airways
(UA) United (US) US Airways
(UT) UTair AviaHon
Major InternaHonal Airlines On-‐Hme Arrivals, August 2013

August 2013
Copyright © 2013 FlightStats, Inc.
Full Page Chart Master
7
0.50% 0.43%
3.18% 0.78%
0.71% 4.00%
0.00% 0.25%
0.67% 0.64%
0.21% 0.16%
1.27% 0.33% 0.40%
1.24% 4.07%
0.11% 0.35%
0.05% 2.20%
0.35% 0.41%
0.23% 0.10%
0.59% 0.10% 0.12%
0.25% 0.39%
0.14% 1.20%
2.84% 0.86%
1.43% 3.17%
0.05% 0.32%
0.53% 0.94%
0.87% 1.06%
0.85% 0.21%
0.54% 0.12%
0.47% 0.58% 0.58%
3.11%
0.00% 0.50% 1.00% 1.50% 2.00% 2.50% 3.00% 3.50% 4.00% 4.50%
(SU) Aeroflot (AM) Aeromexico
(AV) AVIANCA (AB) Air Berlin
(AC) Air Canada (CA) Air China
(UX) Air Europa (AF) Air France (AI) Air India
(NZ) Air New Zealand (AZ) Alitalia (NH) ANA
(AA) American (OZ) Asiana
(BA) BriHsh Airways (CX) Cathay Pacific (MU) China Eastern
(DL) Delta (LH) Luqhansa (U2) EasyJet
(MS) Egyptair (EK) Emirates
(EY) EHhad (BR) EVA Airways
(AY) Finnair (GF) Gulf Air
(IB) Iberia (JL) Japan Airlines (9W) Jet Airways
(KL) KLM (KE) Korean Air Lines
(MH) Malaysia Airlines (PR) Philippine Airlines
(QF) Qantas (QR) Qatar Airways (RJ) Royal Jordanian (SV) Saudi Arabian
(SK) SAS (SQ) Singapore Airlines
(SA) South African (LX) SWISS (JJ) TAM
(TP) TAP -‐ Air Portugal (TG) Thai Airways (UN) Transaero
(TK) Turkish Airlines (VO) Tyrolean Airways
(UA) United (US) US Airways
(UT) UTair AviaHon
Major InternaHonal Airlines Flight CancellaHons, August 2013

August 2013
Copyright © 2013 FlightStats, Inc.
Full Page Chart Master
8
0% 10% 20% 30% 40% 50% 60% 70% 80% 90% 100%
(SU) Aeroflot (AM) Aeromexico
(AV) AVIANCA (AB) Air Berlin
(AC) Air Canada (CA) Air China
(UX) Air Europa (AF) Air France (AI) Air India
(NZ) Air New Zealand (AZ) Alitalia (NH) ANA
(AA) American (OZ) Asiana
(BA) BriHsh Airways (CX) Cathay Pacific (MU) China Eastern
(DL) Delta (LH) Luqhansa (U2) EasyJet
(MS) Egyptair (EK) Emirates
(EY) EHhad (BR) EVA Airways
(AY) Finnair (GF) Gulf Air
(IB) Iberia (JL) Japan Airlines (9W) Jet Airways
(KL) KLM (KE) Korean Air Lines
(MH) Malaysia Airlines (PR) Philippine Airlines
(QF) Qantas (QR) Qatar Airways (RJ) Royal Jordanian (SV) Saudi Arabian
(SK) SAS (SQ) Singapore Airlines
(SA) South African (LX) SWISS (JJ) TAM
(TP) TAP -‐ Air Portugal (TG) Thai Airways (UN) Transaero
(TK) Turkish Airlines (VO) Tyrolean Airways
(UA) United (US) US Airways
(UT) UTair AviaHon
Major InternaHonal Airlines On-‐Hme and Delayed Departures, August 2013
On-‐Time Late (15-‐29 min) Very Late (30-‐44 min) Excessive (45+ min) Diverted

August 2013
Copyright © 2013 FlightStats, Inc.
Major International Airports
9
On-‐Hme Departure, Delay and CancellaHon Data, August 2013
Rank Airport Sample Size On-time Late
(15-29 min) Very Late
(30-44 min) Excessive (45+ min) Cancelled Diverted
6 Amsterdam (AMS) 16,496 84.21% 9.73% 2.55% 3.50% 0.42% 0.01%
19 Atlanta (ATL) 39,541 77.58% 9.72% 4.34% 8.22% 0.42% 0.14%
34 Beijing (PEK) 23,449 28.88% 31.32% 14.96% 24.64% 4.47% 0.20%
20 Boston (BOS) 18,171 76.83% 10.13% 4.14% 8.82% 1.58% 0.08%
11 Charlotte (CLT) 23,794 80.58% 8.37% 3.72% 7.24% 0.85% 0.10%
24 Chicago (ORD) 39,893 74.13% 8.90% 4.95% 11.91% 1.58% 0.11%
23 Dallas (DFW) 29,447 76.40% 9.38% 4.87% 9.31% 1.57% 0.03%
25 Denver (DEN) 25,106 72.18% 11.20% 5.46% 10.99% 0.67% 0.17%
9 Detroit (DTW) 19,298 82.76% 6.40% 3.03% 7.65% 0.77% 0.16%
10 Frankfurt (FRA) 17,037 82.25% 11.81% 2.86% 3.05% 0.37% 0.03%
32 Hong Kong (HKG) 13,905 54.58% 16.82% 8.45% 20.12% 1.71% 0.02%
14 Houston (IAH) 20,987 79.42% 8.56% 3.96% 7.88% 0.78% 0.18%
33 Istanbul (IST) 16,130 38.47% 41.50% 14.40% 5.63% 0.20% 0.00%
27 Las Vegas (LAS) 14,279 71.44% 11.74% 5.46% 11.26% 0.39% 0.11%
22 London (LHR) 18,517 76.75% 13.50% 4.79% 4.90% 0.41% 0.07%
18 Los Angeles (LAX) 25,928 77.64% 9.30% 4.52% 8.36% 0.73% 0.19%
7 Madrid (MAD) 11,633 83.98% 9.16% 3.09% 3.75% 0.10% 0.02%
12 Miami (MIA) 13,446 80.51% 8.36% 3.80% 7.24% 0.22% 0.10%
3 Minneapolis (MSP) 18,919 86.01% 5.49% 2.51% 5.79% 0.39% 0.20%
2 Munich (MUC) 11,828 86.72% 9.26% 1.80% 2.19% 0.57% 0.03%
17 New York (LGA) 16,596 78.57% 6.83% 3.85% 10.66% 3.21% 0.09%
28 New York (JFK) 18,573 71.15% 10.65% 5.66% 12.50% 0.80% 0.04%
26 Newark (EWR) 17,932 72.11% 9.21% 5.38% 13.04% 2.18% 0.26%
31 Paris (CDG) 17,575 65.25% 21.94% 7.02% 5.78% 0.24% 0.02%
21 Philadelphia (PHL) 18,260 76.80% 7.92% 4.64% 10.57% 1.65% 0.06%
13 Phoenix (PHX) 16,014 79.75% 9.29% 4.07% 6.81% 0.53% 0.07%
30 Rome (FCO) 12,834 65.38% 20.51% 6.69% 7.41% 0.25% 0.01%
29 San Francisco (SFO) 18,284 69.07% 9.52% 5.62% 15.63% 1.57% 0.16%
5 Seattle (SEA) 14,821 84.72% 7.06% 3.11% 4.95% 0.56% 0.16%
35 Shanghai (PVG) 13,884 27.20% 27.18% 15.38% 29.95% 2.76% 0.29%
15 Singapore (SIN) 7,742 79.25% 11.33% 3.96% 5.46% 5.05% 0.00%
8 Sydney (SYD) 11,436 83.54% 9.74% 3.16% 3.56% 1.39% 0.00%
1 Tokyo (HND) 18,772 88.69% 8.52% 1.55% 1.24% 0.12% 0.00%
4 Tokyo (NRT) 8,854 84.97% 8.21% 2.71% 4.10% 0.30% 0.01%
16 Toronto (YYZ) 18,778 79.24% 10.03% 4.12% 6.39% 0.92% 0.21%
Aggregate 648,159 73.57% 11.97% 5.18% 9.18% 1.12% 0.10%

August 2013
Copyright © 2013 FlightStats, Inc.
Full Page Chart Master
10
84.21%
77.58%
28.88%
76.83%
80.58%
74.13%
76.40%
72.18%
82.76%
82.25%
54.58%
79.42%
38.47%
71.44%
76.75%
77.64%
83.98%
80.51%
86.01%
86.72%
78.57%
71.15%
72.11%
65.25%
76.80%
79.75%
65.38%
69.07%
84.72%
27.20%
79.25%
83.54%
88.69%
84.97%
79.24%
0.00% 10.00% 20.00% 30.00% 40.00% 50.00% 60.00% 70.00% 80.00% 90.00% 100.00%
Amsterdam (AMS)
Atlanta (ATL)
Beijing (PEK)
Boston (BOS)
CharloRe (CLT)
Chicago (ORD)
Dallas (DFW)
Denver (DEN)
Detroit (DTW)
Frankfurt (FRA)
Hong Kong (HKG)
Houston (IAH)
Istanbul (IST)
Las Vegas (LAS)
London (LHR)
Los Angeles (LAX)
Madrid (MAD)
Miami (MIA)
Minneapolis (MSP)
Munich (MUC)
New York (LGA)
New York (JFK)
Newark (EWR)
Paris (CDG)
Philadelphia (PHL)
Phoenix (PHX)
Rome (FCO)
San Francisco (SFO)
SeaRle (SEA)
Shanghai (PVG)
Singapore (SIN)
Sydney (SYD)
Tokyo (HND)
Tokyo (NRT)
Toronto (YYZ)
Major InternaHonal Airports On-‐Hme Departures, August 2013

August 2013
Copyright © 2013 FlightStats, Inc.
Full Page Chart Master
11
0.42%
0.42%
4.47%
1.58%
0.85%
1.58%
1.57%
0.67%
0.77%
0.37%
1.71%
0.78%
0.20%
0.39%
0.41%
0.73%
0.10%
0.22%
0.39%
0.57%
3.21%
0.80%
2.18%
0.24%
1.65%
0.53%
0.25%
1.57%
0.56%
2.76%
5.05%
1.39%
0.12%
0.30%
0.92%
0.00% 1.00% 2.00% 3.00% 4.00% 5.00% 6.00%
Amsterdam (AMS)
Atlanta (ATL)
Beijing (PEK)
Boston (BOS)
CharloRe (CLT)
Chicago (ORD)
Dallas (DFW)
Denver (DEN)
Detroit (DTW)
Frankfurt (FRA)
Hong Kong (HKG)
Houston (IAH)
Istanbul (IST)
Las Vegas (LAS)
London (LHR)
Los Angeles (LAX)
Madrid (MAD)
Miami (MIA)
Minneapolis (MSP)
Munich (MUC)
New York (LGA)
New York (JFK)
Newark (EWR)
Paris (CDG)
Philadelphia (PHL)
Phoenix (PHX)
Rome (FCO)
San Francisco (SFO)
SeaRle (SEA)
Shanghai (PVG)
Singapore (SIN)
Sydney (SYD)
Tokyo (HND)
Tokyo (NRT)
Toronto (YYZ)
Major InternaHonal Airports DeparHng Flight CancellaHons, August 2013

August 2013
Copyright © 2013 FlightStats, Inc.
Full Page Chart Master
12
0% 10% 20% 30% 40% 50% 60% 70% 80% 90% 100%
Amsterdam (AMS) Atlanta (ATL) Beijing (PEK) Boston (BOS)
CharloRe (CLT) Chicago (ORD) Dallas (DFW) Denver (DEN) Detroit (DTW) Frankfurt (FRA)
Hong Kong (HKG) Houston (IAH) Istanbul (IST)
Las Vegas (LAS) London (LHR)
Los Angeles (LAX) Madrid (MAD) Miami (MIA)
Minneapolis (MSP) Munich (MUC) New York (LGA) New York (JFK) Newark (EWR)
Paris (CDG) Philadelphia (PHL)
Phoenix (PHX) Rome (FCO)
San Francisco (SFO) SeaRle (SEA)
Shanghai (PVG) Singapore (SIN) Sydney (SYD) Tokyo (HND) Tokyo (NRT)
Toronto (YYZ)
Major InternaHonal Airports On-‐Hme and Delayed Departures, August 2013
On-‐Time Late (15-‐29 min) Very Late (30-‐44 min) Excessive (45+ min) Diverted

August 2013
Copyright © 2013 FlightStats, Inc.
North American Region
Summary of Monthly Results
North American airlines, rebounded in August. On average they delivered 78.39% of their flights to the arrival gate within 15 minutes of schedule in August compared with 73.44% in July. The group’s cancellaHons decreased to 1.14% from 1.92% . (HA) Hawaiian maintained the top spot in North America with 93.72%, and (AS) Alaska led the majors again with 84.45% on-‐Hme performance.
(SLC) Salt Lake City took the top spot with 87.31% on-‐Hme departure performance in August. The average on-‐Hme departure performance for the group was 77.81% up from July’s 73.91%. CancellaHons for the group decreased to .99% compared with 1.79% in July.
Review in-‐depth charts of on-‐Hme performance within the following secHon or see Top 10 lists for at-‐a-‐glance rank.
Note: The arrival status coverage threshold for the North American Airlines group was set at 90%. For the North American Airport group the departure status threshold was also set to 90%. In both categories, coverage is typically greater than 98%.
13

August 2013
Copyright © 2013 FlightStats, Inc.
North American Airlines
14
On-‐Hme Arrival, Delay and CancellaHon Data, August 2013
Rank Airline Sample Size On-time Late
(15-29 min) Very Late
(30-44 min) Excessive (45+ min) Cancelled Diverted
5 (5D) Aeroméxico Connect 11,259 85.35% 5.70% 3.05% 5.88% 0.84% 0.02%
16 (AC) Air Canada 19,131 79.13% 11.05% 3.91% 5.83% 0.71% 0.08%
29 (ZW) Air Wisconsin 15,389 73.06% 9.43% 5.35% 12.14% 2.17% 0.03%
13 (FL) Airtran 16,339 80.06% 9.37% 3.87% 6.66% 0.40% 0.04%
6 (AS) Alaska 15,963 84.45% 8.19% 2.68% 4.45% 0.48% 0.24%
34 (G4) Allegiant 3,789 70.36% 14.15% 5.30% 9.90% 0.00% 0.29%
11 (AA) American 61,351 81.04% 7.71% 3.69% 7.56% 1.27% 0.00%
24 (MQ) American Eagle 43,480 75.82% 8.92% 4.74% 10.52% 2.58% 0.00%
23 (C5) CommutAir 5,853 76.11% 7.37% 4.00% 12.47% 2.60% 0.05%
22 (RP) Chautauqua 13,054 76.73% 9.03% 4.04% 10.11% 2.14% 0.09%
2 (CP) Compass 5,926 90.47% 3.65% 1.79% 4.07% 1.01% 0.02%
9 (DL) Delta 82,143 83.50% 7.34% 3.12% 5.87% 0.11% 0.17%
8 (9E) Pinnacle 29,024 83.52% 6.33% 3.08% 6.99% 1.33% 0.08%
21 (EV) ExpressJet 74,122 76.91% 7.45% 4.16% 11.25% 1.87% 0.23%
25 (F9) Frontier 7,341 75.75% 11.38% 4.58% 8.21% 0.07% 0.08%
27 (G7) GoJet 7,784 73.67% 8.25% 4.59% 13.39% 2.65% 0.09%
1 (HA) Hawaiian 6,948 93.72% 3.85% 1.04% 1.34% 0.06% 0.06%
3 (QX) Horizon 10,865 87.80% 5.65% 2.67% 3.79% 1.80% 0.09%
32 (9K) Cape Air 21,411 71.10% 15.82% 5.42% 7.57% 4.21% 0.09%
4 (QK) Jazz 24,021 85.51% 7.36% 2.80% 4.19% 0.53% 0.14%
33 (B6) Jetblue 26,376 70.97% 9.49% 5.42% 14.10% 0.13% 0.02%
20 (YV) Mesa 13,220 77.15% 8.95% 4.11% 9.69% 1.23% 0.10%
26 (PDT) Piedmont 10,305 74.76% 10.36% 4.93% 9.83% 2.85% 0.12%
14 (PD) Porter 5,195 79.59% 9.63% 4.10% 6.62% 1.42% 0.06%
19 (JIA) PSA 12,697 77.90% 10.41% 4.83% 6.77% 1.31% 0.09%
31 (YX) Republic 16,949 72.24% 8.97% 4.78% 13.96% 2.26% 0.05%
10 (S5) Shuttle America 10,843 81.09% 7.73% 3.17% 7.93% 2.60% 0.08%
7 (3M) Silver 4,794 84.22% 5.26% 2.20% 8.21% 0.46% 0.10%
15 (OO) SkyWest 59,164 79.18% 7.30% 3.41% 9.95% 1.55% 0.15%
28 (WN) Southwest 97,246 73.46% 12.60% 5.61% 8.17% 0.42% 0.17%
35 (NK) Spirit 8,205 62.46% 10.02% 6.11% 21.27% 0.43% 0.13%
17 (UA) United 60,724 79.09% 7.62% 3.95% 8.95% 0.58% 0.38%
12 (US) US Airways 40,144 80.30% 9.25% 3.85% 6.57% 0.58% 0.03%
18 (VX) Virgin America 5,343 78.75% 7.50% 3.88% 9.75% 0.13% 0.13%
30 (WS) Westjet 15,429 72.47% 15.49% 5.50% 6.38% 0.47% 0.16%
Aggregate 861,827 78.39% 8.89% 4.10% 8.49% 1.14% 0.13%

August 2013
Copyright © 2013 FlightStats, Inc.
Full Page Chart Master
15
85.35%
79.13%
73.06%
80.06%
84.45%
70.36%
81.04%
75.82%
76.11%
76.73%
90.47%
83.50%
83.52%
76.91%
75.75%
73.67%
93.72%
87.80%
71.10%
85.51%
70.97%
77.15%
74.76%
79.59%
77.90%
72.24%
81.09%
84.22%
79.18%
73.46%
62.46%
79.09%
80.30%
78.75%
72.47%
0.00% 10.00% 20.00% 30.00% 40.00% 50.00% 60.00% 70.00% 80.00% 90.00% 100.00%
(5D) Aeroméxico Connect
(AC) Air Canada
(ZW) Air Wisconsin
(FL) Airtran
(AS) Alaska
(G4) Allegiant
(AA) American
(MQ) American Eagle
(C5) CommutAir
(RP) Chautauqua
(CP) Compass
(DL) Delta
(9E) Pinnacle
(EV) ExpressJet
(F9) FronHer
(G7) GoJet
(HA) Hawaiian
(QX) Horizon
(9K) Cape Air
(QK) Jazz
(B6) Jetblue
(YV) Mesa
(PDT) Piedmont
(PD) Porter
(JIA) PSA
(YX) Republic
(S5) ShuRle America
(3M) Silver
(OO) SkyWest
(WN) Southwest
(NK) Spirit
(UA) United
(US) US Airways
(VX) Virgin America
(WS) Westjet
North American Airlines On-‐Hme Arrivals, August 2013

August 2013
Copyright © 2013 FlightStats, Inc.
Full Page Chart Master
16
0.84%
0.71%
2.17%
0.40%
0.48%
0.00%
1.27%
2.58%
2.60%
2.14%
1.01%
0.11%
1.33%
1.87%
0.07%
2.65%
0.06%
1.80%
4.21%
0.53%
0.13%
1.23%
2.85%
1.42%
1.31%
2.26%
2.60%
0.46%
1.55%
0.42%
0.43%
0.58%
0.58%
0.13%
0.47%
0.00% 0.50% 1.00% 1.50% 2.00% 2.50% 3.00% 3.50% 4.00% 4.50%
(5D) Aeroméxico Connect
(AC) Air Canada
(ZW) Air Wisconsin
(FL) Airtran
(AS) Alaska
(G4) Allegiant
(AA) American
(MQ) American Eagle
(C5) CommutAir
(RP) Chautauqua
(CP) Compass
(DL) Delta
(9E) Pinnacle
(EV) ExpressJet
(F9) FronHer
(G7) GoJet
(HA) Hawaiian
(QX) Horizon
(9K) Cape Air
(QK) Jazz
(B6) Jetblue
(YV) Mesa
(PDT) Piedmont
(PD) Porter
(JIA) PSA
(YX) Republic
(S5) ShuRle America
(3M) Silver
(OO) SkyWest
(WN) Southwest
(NK) Spirit
(UA) United
(US) US Airways
(VX) Virgin America
(WS) Westjet
North American Airlines Flight CancellaHons, August 2013

August 2013
Copyright © 2013 FlightStats, Inc.
Full Page Chart Master
17
0% 10% 20% 30% 40% 50% 60% 70% 80% 90% 100%
(5D) Aeroméxico Connect (AC) Air Canada
(ZW) Air Wisconsin (FL) Airtran (AS) Alaska
(G4) Allegiant (AA) American
(MQ) American Eagle (C5) CommutAir (RP) Chautauqua
(CP) Compass (DL) Delta
(9E) Pinnacle (EV) ExpressJet
(F9) FronHer (G7) GoJet
(HA) Hawaiian (QX) Horizon (9K) Cape Air
(QK) Jazz (B6) Jetblue (YV) Mesa
(PDT) Piedmont (PD) Porter (JIA) PSA
(YX) Republic (S5) ShuRle America
(3M) Silver (OO) SkyWest
(WN) Southwest (NK) Spirit
(UA) United (US) US Airways
(VX) Virgin America (WS) Westjet
North American Airlines On-‐Hme and Delayed Flights, August 2013
On-‐Time Late (15-‐29 min) Very Late (30-‐44 min) Excessive (45+ min) Diverted

August 2013
Copyright © 2013 FlightStats, Inc.
North American Airports
18
On-‐Hme Departure, Delay and CancellaHon Data, August 2013
Rank Airport Sample Size On-time Late
(15-29 min) Very Late
(30-44 min) Excessive (45+ min) Cancelled Diverted
22 Atlanta (ATL) 39,541 77.58% 9.72% 4.34% 8.22% 0.42% 0.14%
29 Baltimore (BWI) 10,087 73.69% 12.28% 5.39% 8.57% 0.44% 0.07%
23 Boston (BOS) 18,171 76.83% 10.13% 4.14% 8.82% 1.58% 0.08%
10 Calgary (YYC) 8,501 81.40% 9.72% 3.46% 4.98% 0.36% 0.44%
12 Charlotte (CLT) 23,794 80.58% 8.37% 3.72% 7.24% 0.85% 0.10%
28 Chicago (ORD) 39,893 74.13% 8.90% 4.95% 11.91% 1.58% 0.11%
35 Chicago (MDW) 8,751 63.77% 17.55% 8.43% 10.11% 0.24% 0.14%
11 Cleveland (CLE) 7,935 80.99% 5.97% 3.27% 9.61% 1.22% 0.17%
27 Dallas (DFW) 29,447 76.40% 9.38% 4.87% 9.31% 1.57% 0.03%
30 Denver (DEN) 25,106 72.18% 11.20% 5.46% 10.99% 0.67% 0.17%
7 Detroit (DTW) 19,298 82.76% 6.40% 3.03% 7.65% 0.77% 0.16%
26 Fort Lauderdale (FLL) 8,091 76.71% 8.50% 4.44% 10.26% 0.23% 0.10%
2 Honolulu (HNL) 6,339 87.15% 5.31% 1.90% 5.58% 0.16% 0.06%
16 Houston (IAH) 20,987 79.42% 8.56% 3.96% 7.88% 0.78% 0.18%
32 Las Vegas (LAS) 14,279 71.44% 11.74% 5.46% 11.26% 0.39% 0.11%
21 Los Angeles (LAX) 25,928 77.64% 9.30% 4.52% 8.36% 0.73% 0.19%
13 Miami (MIA) 13,446 80.51% 8.36% 3.80% 7.24% 0.22% 0.10%
3 Minneapolis (MSP) 18,919 86.01% 5.49% 2.51% 5.79% 0.39% 0.20%
8 Montreal (YUL) 8,689 82.70% 7.70% 3.26% 6.03% 1.20% 0.30%
19 New York (LGA) 16,596 78.57% 6.83% 3.85% 10.66% 3.21% 0.09%
33 New York (JFK) 18,573 71.15% 10.65% 5.66% 12.50% 0.80% 0.04%
31 Newark (EWR) 17,932 72.11% 9.21% 5.38% 13.04% 2.18% 0.26%
18 Orlando (MCO) 11,157 78.85% 8.83% 3.69% 8.50% 0.30% 0.13%
24 Philadelphia (PHL) 18,260 76.80% 7.92% 4.64% 10.57% 1.65% 0.06%
15 Phoenix (PHX) 16,014 79.75% 9.29% 4.07% 6.81% 0.53% 0.07%
5 Portland (PDX) 7,557 84.72% 6.38% 3.09% 5.71% 0.73% 0.09%
14 Saint Louis (STL) 7,191 79.96% 8.55% 3.87% 7.46% 0.76% 0.17%
1 Salt Lake City (SLC) 10,738 87.31% 5.45% 2.40% 4.72% 0.52% 0.13%
20 San Diego (SAN) 7,456 78.28% 9.21% 4.41% 7.97% 0.84% 0.14%
34 San Francisco (SFO) 18,284 69.07% 9.52% 5.62% 15.63% 1.57% 0.16%
4 Seattle (SEA) 14,821 84.72% 7.06% 3.11% 4.95% 0.56% 0.16%
17 Toronto (YYZ) 18,778 79.24% 10.03% 4.12% 6.39% 0.92% 0.21%
9 Vancouver (YVR) 10,453 82.58% 8.91% 3.21% 5.02% 0.33% 0.29%
6 Washington (DCA) 13,147 84.48% 5.58% 3.15% 6.73% 1.58% 0.05%
25 Washington (IAD) 12,393 76.79% 8.74% 4.06% 10.28% 1.49% 0.13%
Aggregate 566,552 77.81% 8.89% 4.28% 8.89% 0.99% 0.14%

August 2013
Copyright © 2013 FlightStats, Inc.
Full Page Chart Master
19
77.58%
73.69%
76.83%
81.40%
80.58%
74.13%
63.77%
80.99%
76.40%
72.18%
82.76%
76.71%
87.15%
79.42%
71.44%
77.64%
80.51%
86.01%
82.70%
78.57%
71.15%
72.11%
78.85%
76.80%
79.75%
84.72%
79.96%
87.31%
78.28%
69.07%
84.72%
79.24%
82.58%
84.48%
76.79%
0.00% 10.00% 20.00% 30.00% 40.00% 50.00% 60.00% 70.00% 80.00% 90.00% 100.00%
Atlanta (ATL)
BalHmore (BWI)
Boston (BOS)
Calgary (YYC)
CharloRe (CLT)
Chicago (ORD)
Chicago (MDW)
Cleveland (CLE)
Dallas (DFW)
Denver (DEN)
Detroit (DTW)
Fort Lauderdale (FLL)
Honolulu (HNL)
Houston (IAH)
Las Vegas (LAS)
Los Angeles (LAX)
Miami (MIA)
Minneapolis (MSP)
Montreal (YUL)
New York (LGA)
New York (JFK)
Newark (EWR)
Orlando (MCO)
Philadelphia (PHL)
Phoenix (PHX)
Portland (PDX)
Saint Louis (STL)
Salt Lake City (SLC)
San Diego (SAN)
San Francisco (SFO)
SeaRle (SEA)
Toronto (YYZ)
Vancouver (YVR)
Washington (DCA)
Washington (IAD)
North American Airports On-‐Hme Departures, August 2013

August 2013
Copyright © 2013 FlightStats, Inc.
Full Page Chart Master
20
0.42%
0.44%
1.58%
0.36%
0.85%
1.58%
0.24%
1.22%
1.57%
0.67%
0.77%
0.23%
0.16%
0.78%
0.39%
0.73%
0.22%
0.39%
1.20%
3.21%
0.80%
2.18%
0.30%
1.65%
0.53%
0.73%
0.76%
0.52%
0.84%
1.57%
0.56%
0.92%
0.33%
1.58%
1.49%
0.00% 0.50% 1.00% 1.50% 2.00% 2.50% 3.00% 3.50%
Atlanta (ATL)
BalHmore (BWI)
Boston (BOS)
Calgary (YYC)
CharloRe (CLT)
Chicago (ORD)
Chicago (MDW)
Cleveland (CLE)
Dallas (DFW)
Denver (DEN)
Detroit (DTW)
Fort Lauderdale (FLL)
Honolulu (HNL)
Houston (IAH)
Las Vegas (LAS)
Los Angeles (LAX)
Miami (MIA)
Minneapolis (MSP)
Montreal (YUL)
New York (LGA)
New York (JFK)
Newark (EWR)
Orlando (MCO)
Philadelphia (PHL)
Phoenix (PHX)
Portland (PDX)
Saint Louis (STL)
Salt Lake City (SLC)
San Diego (SAN)
San Francisco (SFO)
SeaRle (SEA)
Toronto (YYZ)
Vancouver (YVR)
Washington (DCA)
Washington (IAD)
North American Airports DeparHng Flight CancellaHons, August 2013

August 2013
Copyright © 2013 FlightStats, Inc.
Full Page Chart Master
21
0% 10% 20% 30% 40% 50% 60% 70% 80% 90% 100%
Atlanta (ATL) BalHmore (BWI)
Boston (BOS) Calgary (YYC)
CharloRe (CLT) Chicago (ORD)
Chicago (MDW) Cleveland (CLE)
Dallas (DFW) Denver (DEN) Detroit (DTW)
Fort Lauderdale (FLL) Honolulu (HNL) Houston (IAH) Las Vegas (LAS)
Los Angeles (LAX) Miami (MIA)
Minneapolis (MSP) Montreal (YUL) New York (LGA) New York (JFK) Newark (EWR) Orlando (MCO)
Philadelphia (PHL) Phoenix (PHX) Portland (PDX)
Saint Louis (STL) Salt Lake City (SLC)
San Diego (SAN) San Francisco (SFO)
SeaRle (SEA) Toronto (YYZ)
Vancouver (YVR) Washington (DCA) Washington (IAD)
North American Airports On-‐Hme and Delayed Departures, August 2013
On-‐Time Late (15-‐29 min) Very Late (30-‐44 min) Excessive (45+ min) Diverted

August 2013
Copyright © 2013 FlightStats, Inc.
European Region
Summary of Monthly Results Regional European airlines turned in the best performances in August. (TF) Malmo AviaHon took the top spot delivering 96.94% of its flights on Hme. (NT) Binter Canarias dropped to second delivering 96.07% of its flights on Hme aqer 3 consecuHve months on top. This month, 18 of the 50 airlines we evaluated had over 90% of their flights to the gate on Hme. The on-‐Hme performance for the group was 85.64% up from from July’s 83.37%. CancellaHons for the group were down slightly to .42% from .57% the previous month.
(OSL) Oslo took Europe’s top spot with a 89.91% on-‐Hme departure performance in August. The average on-‐Hme departure performance for the group was 71.86%, up slightly from July’s 69.32%. CancellaHons for the group were .52% down from the previous month’s .75% .
Review in-‐depth charts of on-‐Hme performance within the following secHon or see Top 10 lists for at a glance metrics.
Note: The arrival status coverage threshold for the European Airlines group was set at 80%. For the European Airport group the departure status threshold was also set to 70%. For both groups the coverage was typically well above 90%.
22

August 2013
Copyright © 2013 FlightStats, Inc.
European Airlines
23
On-‐Hme Arrival, Delay and CancellaHon Data, August 2013 Rank Airline Sample
Size On-time Late (15-29 min)
Very Late (30-44 min)
Excessive (45+ min) Cancelled Diverted
32 (A3) Aegean Airlines 4,783 87.10% 8.36% 2.68% 1.84% 0.17% 0.02% 34 (RE) Aer Arann Express 2,269 85.81% 7.74% 2.22% 4.23% 0.93% 0.00% 31 (EI) Aer Lingus 6,779 87.13% 7.87% 2.37% 2.63% 0.25% 0.00% 38 (SU) Aeroflot 15,120 83.29% 8.18% 3.08% 5.44% 0.50% 0.00% 8 (BT) airBaltic 3,516 92.81% 4.95% 1.17% 1.06% 0.65% 0.00%
39 (AB) Air Berlin 8,089 81.72% 10.40% 3.68% 4.20% 0.78% 0.00% 22 (UX) Air Europa 4,319 89.21% 5.12% 1.88% 3.80% 0.00% 0.00% 41 (AF) Air France 23,829 79.84% 11.65% 4.39% 4.11% 0.25% 0.00% 49 (YW) Air Nostrum 5,995 73.20% 13.61% 6.17% 7.02% 0.48% 0.00% 23 (CT) Air One CityLiner 2,725 88.83% 6.06% 2.31% 2.79% 0.11% 0.00% 40 (AZ) Alitalia 13,612 81.60% 9.48% 3.84% 5.08% 0.21% 0.00% 12 (IQ) Augsburg Airways 1,986 91.64% 5.47% 1.72% 1.17% 0.65% 0.00% 16 (CJ) BA CityFlyer 1,747 90.76% 3.64% 1.79% 3.58% 0.86% 0.23% 2 (NT) Binter Canarias 231 96.07% 0.87% 1.31% 1.75% 0.87% 0.00%
10 (KF) Blue1 1,798 91.87% 4.48% 1.35% 2.30% 0.78% 0.00% 26 (DB) Brit Air 2,974 88.50% 7.83% 2.09% 1.59% 0.34% 0.00% 46 (BA) British Airways 24,484 75.43% 12.99% 5.41% 6.16% 0.40% 0.01% 48 (SN) Brussels Airlines 4,607 73.42% 15.49% 5.65% 5.43% 0.52% 0.00% 25 (WX) Cityjet 1,945 88.56% 6.75% 2.27% 2.37% 0.21% 0.05% 44 (OU) Croatia Airlines 2,420 76.90% 11.67% 3.93% 7.49% 0.17% 0.00% 28 (LH) Lufthansa 33,421 87.68% 7.97% 2.16% 2.19% 0.35% 0.00% 18 (U2) EasyJet 29,522 90.48% 4.73% 1.87% 2.92% 0.05% 0.00% 27 (K2) EuroLot 1,815 88.39% 6.17% 2.72% 2.72% 0.83% 0.00% 13 (EW) Eurowings 3,725 91.56% 5.94% 1.29% 1.21% 0.13% 0.00% 6 (AY) Finnair 4,180 93.18% 3.78% 1.13% 1.92% 0.10% 0.00%
19 (4U) Germanwings 7,145 89.91% 4.70% 1.56% 3.84% 0.17% 0.00% 20 (IB) Iberia 6,097 89.87% 6.40% 1.87% 1.86% 0.10% 0.00% 47 (FI) Icelandair 1,417 75.16% 15.88% 4.16% 4.80% 0.00% 0.00% 3 (WA) KLM Cityhopper 7,924 94.62% 3.36% 0.83% 1.19% 0.10% 0.00%
17 (KL) KLM 10,885 90.64% 5.06% 2.03% 2.27% 0.39% 0.00% 30 (LOG) Loganair Ltd. 2,524 87.24% 5.07% 2.09% 5.60% 3.13% 0.00% 24 (LO) LOT - Polish Airlines 5,183 88.64% 5.56% 2.41% 3.38% 0.79% 0.00% 15 (CL) Lufthansa Cityline 9,962 91.37% 5.89% 1.41% 1.33% 0.56% 0.00% 1 (TF) Malmo Aviation 1,244 96.94% 2.82% 0.24% 0.00% 0.16% 0.00% 4 (ZN) NAYSA 2,415 94.56% 2.87% 0.87% 1.70% 0.29% 0.00% 5 (DY) Norwegian Air Shuttle 11,591 93.32% 4.47% 1.04% 1.17% 0.12% 0.00%
35 (OA) Olympic Air 4,101 85.04% 9.60% 2.57% 2.79% 0.22% 0.00% 14 (YS) Régional 3,782 91.44% 5.75% 1.24% 1.57% 2.06% 0.00% 33 (FV) Rossiya 4,522 86.90% 5.71% 2.70% 4.69% 0.07% 0.00% 29 (S7) S7 Airlines 5,630 87.35% 5.16% 2.38% 5.11% 0.16% 0.00% 11 (SK) SAS 17,748 91.76% 5.17% 1.45% 1.61% 0.32% 0.02% 37 (LX) SWISS 11,511 83.63% 11.15% 2.87% 2.34% 0.87% 0.01% 50 (TP) TAP - Air Portugal 6,110 66.03% 13.29% 7.54% 13.14% 0.85% 0.00% 42 (UN) Transaero 6,470 78.74% 9.01% 4.10% 8.14% 0.54% 0.00% 21 (HV) Transavia 2,990 89.30% 5.25% 1.74% 3.71% 0.00% 0.00% 36 (TK) Turkish Airlines 26,047 84.30% 10.65% 2.98% 2.07% 0.12% 0.00% 9 (VO) Tyrolean Airways 10,557 92.50% 4.17% 1.48% 1.85% 0.47% 0.00%
45 (UT) UTair Aviation 7,305 75.77% 11.25% 5.06% 7.93% 3.11% 0.00% 43 (VY) Vueling Airlines 14,678 78.19% 11.01% 4.24% 6.46% 0.03% 0.10% 7 (WF) Widerøe's 11,263 93.14% 3.93% 1.48% 1.45% 0.95% 0.00%
Aggregate 404,992 85.64% 7.99% 2.82% 3.54% 0.42% 0.01%

August 2013
Copyright © 2013 FlightStats, Inc.
Full Page Chart Master
24
87.10% 85.81% 87.13%
83.29% 92.81%
81.72% 89.21%
79.84% 73.20%
88.83% 81.60%
91.64% 90.76%
96.07% 91.87%
88.50% 75.43%
73.42% 88.56%
76.90% 87.68%
90.48% 88.39%
91.56% 93.18%
89.91% 89.87%
75.16% 94.62%
90.64% 87.24% 88.64%
91.37% 96.94%
94.56% 93.32%
85.04% 91.44%
86.90% 87.35%
91.76% 83.63%
66.03% 78.74%
89.30% 84.30%
92.50% 75.77%
78.19% 93.14%
0.00% 10.00% 20.00% 30.00% 40.00% 50.00% 60.00% 70.00% 80.00% 90.00% 100.00%
(A3) Aegean Airlines (RE) Aer Arann Express
(EI) Aer Lingus (SU) Aeroflot (BT) airBalHc
(AB) Air Berlin (UX) Air Europa (AF) Air France
(YW) Air Nostrum (CT) Air One CityLiner
(AZ) Alitalia (IQ) Augsburg Airways
(CJ) BA CityFlyer (NT) Binter Canarias
(KF) Blue1 (DB) Brit Air
(BA) BriHsh Airways (SN) Brussels Airlines
(WX) Cityjet (OU) CroaHa Airlines
(LH) Luqhansa (U2) EasyJet (K2) EuroLot
(EW) Eurowings (AY) Finnair
(4U) Germanwings (IB) Iberia
(FI) Icelandair (WA) KLM Cityhopper
(KL) KLM (LOG) Loganair Ltd.
(LO) LOT -‐ Polish Airlines (CL) Luqhansa Cityline (TF) Malmo AviaHon
(ZN) NAYSA (DY) Norwegian Air ShuRle
(OA) Olympic Air (YS) Régional (FV) Rossiya
(S7) S7 Airlines (SK) SAS
(LX) SWISS (TP) TAP -‐ Air Portugal
(UN) Transaero (HV) Transavia
(TK) Turkish Airlines (VO) Tyrolean Airways
(UT) UTair AviaHon (VY) Vueling Airlines
(WF) Widerøe's
European Airlines On-‐Hme Arrivals, August 2013

August 2013
Copyright © 2013 FlightStats, Inc.
Full Page Chart Master
25
0.17% 0.93%
0.25% 0.50%
0.65% 0.78%
0.00% 0.25%
0.48% 0.11%
0.21% 0.65%
0.86% 0.87%
0.78% 0.34% 0.40%
0.52% 0.21%
0.17% 0.35%
0.05% 0.83%
0.13% 0.10% 0.17%
0.10% 0.00%
0.10% 0.39%
3.13% 0.79%
0.56% 0.16%
0.29% 0.12%
0.22% 2.06%
0.07% 0.16%
0.32% 0.87% 0.85%
0.54% 0.00%
0.12% 0.47%
3.11% 0.03%
0.95%
0.00% 0.50% 1.00% 1.50% 2.00% 2.50% 3.00% 3.50%
(A3) Aegean Airlines (RE) Aer Arann Express
(EI) Aer Lingus (SU) Aeroflot (BT) airBalHc
(AB) Air Berlin (UX) Air Europa (AF) Air France
(YW) Air Nostrum (CT) Air One CityLiner
(AZ) Alitalia (IQ) Augsburg Airways
(CJ) BA CityFlyer (NT) Binter Canarias
(KF) Blue1 (DB) Brit Air
(BA) BriHsh Airways (SN) Brussels Airlines
(WX) Cityjet (OU) CroaHa Airlines
(LH) Luqhansa (U2) EasyJet (K2) EuroLot
(EW) Eurowings (AY) Finnair
(4U) Germanwings (IB) Iberia
(FI) Icelandair (WA) KLM Cityhopper
(KL) KLM (LOG) Loganair Ltd.
(LO) LOT -‐ Polish Airlines (CL) Luqhansa Cityline (TF) Malmo AviaHon
(ZN) NAYSA (DY) Norwegian Air ShuRle
(OA) Olympic Air (YS) Régional (FV) Rossiya
(S7) S7 Airlines (SK) SAS
(LX) SWISS (TP) TAP -‐ Air Portugal
(UN) Transaero (HV) Transavia
(TK) Turkish Airlines (VO) Tyrolean Airways
(UT) UTair AviaHon (VY) Vueling Airlines
(WF) Widerøe's
European Airlines Flight CancellaHons, August 2013

August 2013
Copyright © 2013 FlightStats, Inc.
Full Page Chart Master
26
0% 10% 20% 30% 40% 50% 60% 70% 80% 90% 100%
(A3) Aegean Airlines (RE) Aer Arann Express
(EI) Aer Lingus (SU) Aeroflot (BT) airBalHc
(AB) Air Berlin (UX) Air Europa (AF) Air France
(YW) Air Nostrum (CT) Air One CityLiner
(AZ) Alitalia (IQ) Augsburg Airways
(CJ) BA CityFlyer (NT) Binter Canarias
(KF) Blue1 (DB) Brit Air
(BA) BriHsh Airways (SN) Brussels Airlines
(WX) Cityjet (OU) CroaHa Airlines
(LH) Luqhansa (U2) EasyJet (K2) EuroLot
(EW) Eurowings (AY) Finnair
(4U) Germanwings (IB) Iberia
(FI) Icelandair (WA) KLM Cityhopper
(KL) KLM (LOG) Loganair Ltd.
(LO) LOT -‐ Polish Airlines (CL) Luqhansa Cityline (TF) Malmo AviaHon
(ZN) NAYSA (DY) Norwegian Air ShuRle
(OA) Olympic Air (YS) Régional (FV) Rossiya
(S7) S7 Airlines (SK) SAS
(LX) SWISS (TP) TAP -‐ Air Portugal
(UN) Transaero (HV) Transavia
(TK) Turkish Airlines (VO) Tyrolean Airways
(UT) UTair AviaHon (VY) Vueling Airlines
(WF) Widerøe's
European Airlines On-‐Hme and Delayed Flights, August 2013
On-‐Time Late (15-‐29 min) Very Late (30-‐44 min) Excessive (45+ min) Diverted

August 2013
Copyright © 2013 FlightStats, Inc.
European Airports
27
On-‐Hme Departure, Delay and CancellaHon Data, August 2013
Rank Airport Sample Size On-time Late
(15-29 min) Very Late
(30-44 min) Excessive (45+ min) Cancelled Diverted
8 Amsterdam (AMS) 16,496 84.21% 9.73% 2.55% 3.50% 0.42% 0.01%
13 Athens (ATH) 6,076 82.77% 10.81% 3.08% 3.31% 0.16% 0.02%
20 Barcelona (BCN) 11,580 78.45% 11.45% 4.02% 6.01% 0.16% 0.06%
7 Berlin (TXL) 3,246 85.14% 9.96% 2.23% 2.54% 0.71% 0.12%
18 Birmingham (BHX) 3,432 79.56% 12.02% 3.39% 5.03% 0.35% 0.00%
23 Brussels (BRU) 7,032 76.39% 14.58% 4.62% 4.38% 0.33% 0.03%
2 Copenhagen (CPH) 6,231 86.75% 8.53% 2.13% 2.58% 0.34% 0.02%
6 Dusseldorf (DUS) 4,891 85.26% 9.48% 2.98% 2.28% 0.41% 0.00%
14 Frankfurt (FRA) 17,037 82.25% 11.81% 2.86% 3.05% 0.37% 0.03%
10 Geneva (GVA) 5,599 83.37% 8.95% 3.07% 4.61% 0.45% 0.00%
5 Hamburg (HAM) 3,412 86.22% 9.25% 1.74% 2.80% 0.50% 0.00%
16 Helsinki (HEL) 6,220 81.44% 12.64% 2.72% 3.19% 0.27% 0.00%
15 Istanbul (SAW) 5,304 81.55% 10.94% 3.85% 3.66% 0.08% 0.00%
34 Istanbul (IST) 16,130 38.47% 41.50% 14.40% 5.63% 0.20% 0.00%
35 Lisbon (LIS) 6,456 36.83% 28.84% 14.43% 19.86% 0.42% 0.03%
22 London (LHR) 18,517 76.75% 13.50% 4.79% 4.90% 0.41% 0.07%
26 London (LGW) 9,795 69.02% 17.13% 6.17% 7.68% 0.09% 0.00%
25 Lyon (LYS) 3,732 72.72% 19.62% 5.11% 2.55% 0.29% 0.00%
9 Madrid (MAD) 11,633 83.98% 9.16% 3.09% 3.75% 0.10% 0.02%
31 Manchester (MAN) 6,626 52.27% 30.17% 9.09% 8.45% 0.39% 0.02%
30 Moscow (DME) 12,044 52.99% 24.82% 7.91% 14.28% 2.97% 0.00%
32 Moscow (VKO) 5,217 43.16% 32.76% 11.73% 12.35% 4.73% 0.00%
33 Moscow (SVO) 10,395 40.02% 41.29% 9.94% 8.75% 0.84% 0.00%
3 Munich (MUC) 11,828 86.72% 9.26% 1.80% 2.19% 0.57% 0.03%
1 Oslo (OSL) 9,213 89.91% 6.54% 1.81% 1.72% 0.45% 0.01%
24 Palma Mallorca (PMI) 8,011 76.20% 13.41% 4.66% 5.73% 0.14% 0.00%
28 Paris (CDG) 17,575 65.25% 21.94% 7.02% 5.78% 0.24% 0.02%
29 Paris (ORY) 8,808 57.78% 22.54% 9.57% 10.11% 0.22% 0.00%
11 Prague (PRG) 3,503 83.37% 12.18% 2.50% 1.92% 0.60% 0.03%
27 Rome (FCO) 12,834 65.38% 20.51% 6.69% 7.41% 0.25% 0.01%
21 Stockholm (ARN) 7,612 77.63% 18.76% 2.25% 1.36% 0.29% 0.00%
12 Toulouse (TLS) 2,358 83.18% 10.11% 3.57% 3.14% 0.17% 0.00%
4 Vienna (VIE) 7,229 86.51% 9.01% 2.01% 2.46% 0.30% 0.01%
19 Warsaw (WAW) 4,053 78.65% 11.96% 4.54% 4.84% 0.59% 0.00%
17 Zurich (ZRH) 8,615 80.87% 13.47% 3.07% 2.59% 0.45% 0.01%
Aggregate 298,740 71.86% 17.28% 5.38% 5.46% 0.52% 0.02%

August 2013
Copyright © 2013 FlightStats, Inc.
Full Page Chart Master
28
84.21%
82.77%
78.45%
85.14%
79.56%
76.39%
86.75%
85.26%
82.25%
83.37%
86.22%
81.44%
81.55%
38.47%
36.83%
76.75%
69.02%
72.72%
83.98%
52.27%
52.99%
43.16%
40.02%
86.72%
89.91%
76.20%
65.25%
57.78%
83.37%
65.38%
77.63%
83.18%
86.51%
78.65%
80.87%
0.00% 10.00% 20.00% 30.00% 40.00% 50.00% 60.00% 70.00% 80.00% 90.00% 100.00%
Amsterdam (AMS)
Athens (ATH)
Barcelona (BCN)
Berlin (TXL)
Birmingham (BHX)
Brussels (BRU)
Copenhagen (CPH)
Dusseldorf (DUS)
Frankfurt (FRA)
Geneva (GVA)
Hamburg (HAM)
Helsinki (HEL)
Istanbul (SAW)
Istanbul (IST)
Lisbon (LIS)
London (LHR)
London (LGW)
Lyon (LYS)
Madrid (MAD)
Manchester (MAN)
Moscow (DME)
Moscow (VKO)
Moscow (SVO)
Munich (MUC)
Oslo (OSL)
Palma Mallorca (PMI)
Paris (CDG)
Paris (ORY)
Prague (PRG)
Rome (FCO)
Stockholm (ARN)
Toulouse (TLS)
Vienna (VIE)
Warsaw (WAW)
Zurich (ZRH)
European Airports On-‐Hme Departures, August 2013

August 2013
Copyright © 2013 FlightStats, Inc.
Full Page Chart Master
29
0.42%
0.16%
0.16%
0.71%
0.35%
0.33%
0.34%
0.41%
0.37%
0.45%
0.50%
0.27%
0.08%
0.20%
0.42%
0.41%
0.09%
0.29%
0.10%
0.39%
2.97%
4.73%
0.84%
0.57%
0.45%
0.14%
0.24%
0.22%
0.60%
0.25%
0.29%
0.17%
0.30%
0.59%
0.45%
0.00% 0.50% 1.00% 1.50% 2.00% 2.50% 3.00% 3.50% 4.00% 4.50% 5.00%
Amsterdam (AMS)
Athens (ATH)
Barcelona (BCN)
Berlin (TXL)
Birmingham (BHX)
Brussels (BRU)
Copenhagen (CPH)
Dusseldorf (DUS)
Frankfurt (FRA)
Geneva (GVA)
Hamburg (HAM)
Helsinki (HEL)
Istanbul (SAW)
Istanbul (IST)
Lisbon (LIS)
London (LHR)
London (LGW)
Lyon (LYS)
Madrid (MAD)
Manchester (MAN)
Moscow (DME)
Moscow (VKO)
Moscow (SVO)
Munich (MUC)
Oslo (OSL)
Palma Mallorca (PMI)
Paris (CDG)
Paris (ORY)
Prague (PRG)
Rome (FCO)
Stockholm (ARN)
Toulouse (TLS)
Vienna (VIE)
Warsaw (WAW)
Zurich (ZRH)
European Airports DeparHng Flight CancellaHons, August 2013

August 2013
Copyright © 2013 FlightStats, Inc.
Full Page Chart Master
30
0% 10% 20% 30% 40% 50% 60% 70% 80% 90% 100%
Amsterdam (AMS) Athens (ATH)
Barcelona (BCN) Berlin (TXL)
Birmingham (BHX) Brussels (BRU)
Copenhagen (CPH) Dusseldorf (DUS) Frankfurt (FRA) Geneva (GVA)
Hamburg (HAM) Helsinki (HEL) Istanbul (SAW) Istanbul (IST) Lisbon (LIS)
London (LHR) London (LGW)
Lyon (LYS) Madrid (MAD)
Manchester (MAN) Moscow (DME) Moscow (VKO) Moscow (SVO) Munich (MUC)
Oslo (OSL) Palma Mallorca (PMI)
Paris (CDG) Paris (ORY)
Prague (PRG) Rome (FCO)
Stockholm (ARN) Toulouse (TLS) Vienna (VIE)
Warsaw (WAW) Zurich (ZRH)
European Airports On-‐Hme and Delayed Departures, August 2013
On-‐Time Late (15-‐29 min) Very Late (30-‐44 min) Excessive (45+ min) Diverted

August 2013
Copyright © 2013 FlightStats, Inc.
Asian Region
Summary of Monthly Results (FD) Thai Air Asia claimed the top spot by delivering 93.46% of their flights on Hme. Only three of the top ten Asian airlines delivered greater than 90% of their flights to the gate on Hme in August. The average on-‐Hme performance raHng among the 41 Asian airlines we analyzed was 65.61% up from July’s rate of 63.14%. CancellaHons for the group decreased to 1.88% from 2.38% the previous month.
(ITM) Osaka InternaHonal Airport kept the lead among Asian airports with 93.33% on-‐Hme departure performance in August. Only two of the top ten airports had on-‐Hme departure performance rates that exceeded 90%. The average on-‐Hme departure performance for the group rose to 51.05% up from 48.62% in July. CancellaHons for the group were at 2.07% down slightly from at 2.60% the previous month.
China’s airports on-‐Hme performance sHll languishes as they claim boRom 20 spots in Asia. The “unrestricted take-‐off” policy at eight of the naHon’s airports has done liRle to ameliorate the situaHon. For reference the cumulaHve on-‐Hme performance rate at PEK, SHA, PVG, CAN, SZX, CTU, XIY and KMG was 28.06% in August as compared with 22.38% in July, and 28.57% in June.
Review in-‐depth charts of on-‐Hme performance within the following secHon or see Top 10 lists for at a glance metrics.
Note: The arrival status coverage threshold for the Asian Airlines group was set at 80%. For the Asian Airport group the departure status threshold was also set to 65%. For both groups the coverage was typically well above 80%.
31

August 2013
Copyright © 2013 FlightStats, Inc.
Asian Airlines
32
On-‐Hme Arrival, Delay and CancellaHon Data, August 2013
Rank Airline Sample Size On-time Late
(15-29 min) Very Late
(30-44 min) Excessive (45+ min) Cancelled Diverted
2 (BX) Air Busan 2,189 91.89% 4.50% 1.67% 1.95% 1.46% 0.00%
27 (CA) Air China 33,854 60.46% 11.62% 7.14% 20.58% 4.00% 0.20%
24 (AI) Air India 11,185 64.86% 15.99% 7.95% 11.20% 0.67% 0.00%
23 (AK) Airasia 13,125 66.47% 15.75% 7.78% 9.99% 0.65% 0.00%
5 (HD) Hokkaido 3,567 89.10% 6.50% 1.92% 2.49% 0.73% 0.00%
11 (NH) ANA 20,289 84.88% 10.42% 2.58% 2.12% 0.16% 0.00%
10 (EH) ANA Wings 7,333 86.25% 8.67% 2.51% 2.57% 0.15% 0.00%
19 (OZ) Asiana 9,765 75.60% 12.66% 5.15% 6.46% 0.33% 0.13%
16 (PG) Bangkok Airways 4,470 78.11% 12.79% 4.61% 4.48% 0.13% 0.00%
31 (JD) Beijing Capital 6,767 56.61% 11.46% 8.07% 23.57% 1.24% 0.30%
25 (CX) Cathay Pacific 8,744 64.02% 13.62% 6.77% 15.54% 1.24% 0.05%
29 (CI) China Airlines 5,516 60.24% 19.42% 8.56% 11.68% 0.47% 0.11%
34 (MU) China Eastern 51,426 53.93% 13.33% 8.42% 24.18% 4.07% 0.14%
30 (CZ) China Southern 52,143 58.43% 12.51% 7.55% 21.16% 1.94% 0.36%
41 (KN) China United 4,454 32.23% 14.59% 11.62% 41.03% 5.34% 0.52%
40 (PN) China West Air 2,238 36.01% 16.04% 11.54% 36.23% 0.85% 0.18%
21 (BR) EVA Airways 4,369 69.12% 13.35% 5.96% 11.56% 0.23% 0.00%
22 (G8) GoAir 3,324 67.57% 19.13% 8.15% 5.15% 1.87% 0.00%
36 (HU) Hainan Airlines 17,448 50.25% 13.63% 8.70% 27.24% 2.07% 0.19%
35 (KA) Hong Kong Dragon 4,662 51.60% 16.48% 9.08% 22.83% 1.74% 0.00%
6 (6E) IndiGo 5,902 88.39% 7.11% 2.63% 1.86% 0.91% 0.00%
3 (XM1) J-Air 5,082 90.77% 5.56% 1.98% 1.62% 0.63% 0.06%
4 (JC) JAL Express 6,830 89.14% 8.73% 1.56% 0.54% 0.22% 0.03%
7 (3X) Japan Air Commuter 5,060 88.30% 7.60% 2.26% 1.82% 0.99% 0.02%
8 (JL) Japan Airlines 11,283 88.28% 8.05% 1.94% 1.72% 0.12% 0.01%
9 (NU) Japan Transocean 2,435 87.29% 9.46% 1.88% 1.33% 1.48% 0.04%
17 (9W) Jet Airways 8,247 78.05% 11.76% 5.03% 5.15% 0.25% 0.01%
12 (S2) JetKonnect 9,142 84.61% 8.75% 3.02% 3.61% 0.54% 0.00%
14 (KE) Korean Air Lines 14,101 81.19% 11.21% 3.74% 3.85% 0.14% 0.00%
28 (8L) Lucky Air Co 4,257 60.25% 13.85% 6.88% 18.73% 3.66% 0.29%
26 (MH) Malaysia Airlines 14,944 63.09% 17.17% 8.11% 11.62% 1.20% 0.00%
32 (PR) Philippine Airlines 2,989 55.79% 14.39% 9.06% 20.76% 2.84% 0.00%
33 (QZ) Indonesia AirAsia 4,531 54.94% 15.14% 10.65% 19.28% 0.29% 0.00%
38 (FM) Shanghai Airlines 8,743 48.06% 14.28% 9.72% 27.47% 5.38% 0.47%
15 (SQ) Singapore Airlines 7,671 79.25% 11.49% 4.46% 4.80% 0.53% 0.00%
20 (BC) Skymark Airlines 4,323 73.49% 18.63% 4.43% 3.45% 0.16% 0.00%
13 (SG) SpiceJet 3,384 81.97% 7.83% 3.00% 7.21% 9.37% 0.00%
1 (FD) Thai AirAsia 5,721 93.46% 4.24% 1.17% 1.13% 1.08% 0.00%
18 (TG) Thai Airways 8,096 77.21% 14.90% 4.48% 3.40% 0.21% 0.00%
37 (GS) Tianjin Airlines 12,112 49.37% 15.20% 8.90% 26.32% 3.11% 0.20%
39 (MF) Xiamen 15,227 37.68% 15.28% 10.83% 36.11% 1.85% 0.09%
Aggregate 426,948 65.61% 12.58% 6.50% 15.20% 1.88% 0.12%

August 2013
Copyright © 2013 FlightStats, Inc.
Full Page Chart Master
33
91.89% 60.46%
64.86% 66.47%
89.10% 84.88% 86.25%
75.60% 78.11%
56.61% 64.02%
60.24% 53.93%
58.43% 32.23%
36.01% 69.12%
67.57% 50.25% 51.60%
88.39% 90.77%
89.14% 88.30% 88.28% 87.29%
78.05% 84.61%
81.19% 60.25%
63.09% 55.79% 54.94%
48.06% 79.25%
73.49% 81.97%
93.46% 77.21%
49.37% 37.68%
0.00% 10.00% 20.00% 30.00% 40.00% 50.00% 60.00% 70.00% 80.00% 90.00% 100.00%
(BX) Air Busan (CA) Air China (AI) Air India (AK) Airasia
(HD) Hokkaido (NH) ANA
(EH) ANA Wings (OZ) Asiana
(PG) Bangkok Airways (JD) Beijing Capital (CX) Cathay Pacific (CI) China Airlines
(MU) China Eastern (CZ) China Southern (KN) China United
(PN) China West Air (BR) EVA Airways
(G8) GoAir (HU) Hainan Airlines
(KA) Hong Kong Dragon (6E) IndiGo (XM1) J-‐Air
(JC) JAL Express (3X) Japan Air Commuter
(JL) Japan Airlines (NU) Japan Transocean
(9W) Jet Airways (S2) JetKonnect
(KE) Korean Air Lines (8L) Lucky Air Co
(MH) Malaysia Airlines (PR) Philippine Airlines (QZ) Indonesia AirAsia (FM) Shanghai Airlines (SQ) Singapore Airlines (BC) Skymark Airlines
(SG) SpiceJet (FD) Thai AirAsia (TG) Thai Airways
(GS) Tianjin Airlines (MF) Xiamen
Asian Airlines On-‐Hme Arrivals, August 2013

August 2013
Copyright © 2013 FlightStats, Inc.
Full Page Chart Master
34
1.46% 4.00%
0.67% 0.65% 0.73%
0.16% 0.15% 0.33%
0.13% 1.24% 1.24%
0.47% 4.07%
1.94% 5.34%
0.85% 0.23%
1.87% 2.07%
1.74% 0.91%
0.63% 0.22%
0.99% 0.12%
1.48% 0.25%
0.54% 0.14%
3.66% 1.20%
2.84% 0.29%
5.38% 0.53%
0.16% 9.37%
1.08% 0.21%
3.11% 1.85%
0.00% 1.00% 2.00% 3.00% 4.00% 5.00% 6.00% 7.00% 8.00% 9.00% 10.00%
(BX) Air Busan (CA) Air China (AI) Air India (AK) Airasia
(HD) Hokkaido (NH) ANA
(EH) ANA Wings (OZ) Asiana
(PG) Bangkok Airways (JD) Beijing Capital (CX) Cathay Pacific (CI) China Airlines
(MU) China Eastern (CZ) China Southern (KN) China United
(PN) China West Air (BR) EVA Airways
(G8) GoAir (HU) Hainan Airlines
(KA) Hong Kong Dragon (6E) IndiGo (XM1) J-‐Air
(JC) JAL Express (3X) Japan Air Commuter
(JL) Japan Airlines (NU) Japan Transocean
(9W) Jet Airways (S2) JetKonnect
(KE) Korean Air Lines (8L) Lucky Air Co
(MH) Malaysia Airlines (PR) Philippine Airlines (QZ) Indonesia AirAsia (FM) Shanghai Airlines (SQ) Singapore Airlines (BC) Skymark Airlines
(SG) SpiceJet (FD) Thai AirAsia (TG) Thai Airways
(GS) Tianjin Airlines (MF) Xiamen
Asian Airlines Flight CancellaHons, August 2013

August 2013
Copyright © 2013 FlightStats, Inc.
Full Page Chart Master
35
0% 10% 20% 30% 40% 50% 60% 70% 80% 90% 100%
(BX) Air Busan (CA) Air China (AI) Air India (AK) Airasia
(HD) Hokkaido (NH) ANA
(EH) ANA Wings (OZ) Asiana
(PG) Bangkok Airways (JD) Beijing Capital (CX) Cathay Pacific (CI) China Airlines
(MU) China Eastern (CZ) China Southern (KN) China United
(PN) China West Air (BR) EVA Airways
(G8) GoAir (HU) Hainan Airlines
(KA) Hong Kong Dragon (6E) IndiGo (XM1) J-‐Air
(JC) JAL Express (3X) Japan Air Commuter
(JL) Japan Airlines (NU) Japan Transocean
(9W) Jet Airways (S2) JetKonnect
(KE) Korean Air Lines (8L) Lucky Air Co
(MH) Malaysia Airlines (PR) Philippine Airlines (QZ) Indonesia AirAsia (FM) Shanghai Airlines (SQ) Singapore Airlines (BC) Skymark Airlines
(SG) SpiceJet (FD) Thai AirAsia (TG) Thai Airways
(GS) Tianjin Airlines (MF) Xiamen
Asian Airlines On-‐Hme and Delayed Flights, August 2013
On-‐Time Late (15-‐29 min) Very Late (30-‐44 min) Excessive (45+ min) Diverted

August 2013
Copyright © 2013 FlightStats, Inc.
Asian Airports
36
On-‐Hme Departure, Delay and CancellaHon Data, August 2013
Rank Airport Sample Size On-time Late
(15-29 min) Very Late
(30-44 min) Excessive (45+ min) Cancelled Diverted
28 Beijing (PEK) 23,449 28.88% 31.32% 14.96% 24.64% 4.47% 0.20%
17 Changsha (CSX) 5,846 42.87% 18.53% 11.11% 27.30% 2.24% 0.19%
31 Chengdu (CTU) 10,117 24.13% 20.72% 13.46% 41.33% 2.28% 0.36%
24 Chongqing (CKG) 8,425 34.06% 25.17% 12.92% 27.49% 1.54% 0.36%
21 Dalian (DLC) 4,803 38.94% 17.17% 11.05% 32.58% 3.37% 0.26%
4 Delhi (DEL) 11,580 88.60% 4.84% 2.18% 4.36% 1.58% 0.01%
6 Fukuoka (FUK) 6,042 86.46% 8.64% 2.26% 2.61% 0.35% 0.03%
35 Guangzhou (CAN) 14,672 18.37% 27.48% 14.99% 38.78% 2.29% 0.38%
20 Haikou (HAK) 3,310 40.23% 19.57% 10.99% 29.05% 3.81% 0.16%
33 Hangzhou (HGH) 7,905 23.03% 18.45% 13.05% 45.11% 2.66% 0.36%
15 Hong Kong (HKG) 13,905 54.58% 16.82% 8.45% 20.12% 1.71% 0.02%
9 Jeju (CJU) 5,209 83.96% 8.94% 3.31% 3.79% 0.17% 0.00%
22 Kunming (KMG) 11,361 37.50% 28.73% 10.61% 22.91% 2.54% 0.24%
2 Nagoya (NGO) 3,772 90.49% 4.97% 1.83% 2.71% 0.21% 0.00%
32 Nanking (NKG) 5,549 23.53% 15.56% 11.75% 48.97% 1.57% 0.18%
10 Okinawa (OKA) 4,338 79.89% 13.37% 3.64% 3.08% 0.48% 0.02%
1 Osaka (ITM) 6,386 93.33% 4.30% 1.11% 1.26% 0.28% 0.00%
5 Osaka (KIX) 5,059 86.97% 7.23% 2.73% 3.07% 0.20% 0.00%
18 Qingdao (TAO) 6,175 42.49% 18.86% 10.49% 27.77% 1.33% 0.39%
26 Sanya (SYX) 3,049 30.34% 22.54% 13.40% 33.40% 4.56% 0.31%
8 Sapporo (CTS) 6,618 84.51% 9.95% 2.55% 2.99% 0.51% 0.00%
12 Seoul (GMP) 5,737 77.02% 17.31% 2.66% 3.01% 0.40% 0.00%
14 Seoul (ICN) 10,828 62.07% 20.63% 7.22% 10.08% 0.22% 0.00%
29 Shanghai (PVG) 13,884 27.20% 27.18% 15.38% 29.95% 2.76% 0.29%
30 Shanghai (SHA) 10,775 25.23% 24.05% 13.22% 37.31% 5.88% 0.18%
34 Shenzhen (SZX) 10,100 22.82% 23.58% 11.96% 41.26% 3.28% 0.38%
11 Singapore (SIN) 7,742 79.25% 11.33% 3.96% 5.46% 5.05% 0.00%
13 Taipei (TPE) 7,518 74.61% 11.30% 5.01% 9.08% 1.57% 0.00%
3 Tokyo (HND) 18,772 88.69% 8.52% 1.55% 1.24% 0.12% 0.00%
7 Tokyo (NRT) 8,854 84.97% 8.21% 2.71% 4.10% 0.30% 0.01%
23 Urumqi (URC) 6,497 35.39% 26.12% 11.78% 26.41% 2.14% 0.30%
16 Wuhan (WUH) 5,975 47.57% 17.72% 9.26% 25.30% 2.61% 0.15%
25 Xiamen (XMN) 6,970 32.06% 16.10% 11.99% 39.72% 2.04% 0.13%
19 Xian (XIY) 10,609 42.08% 23.57% 9.83% 24.35% 1.62% 0.17%
27 Zhengzhou (CGO) 5,470 29.84% 19.23% 12.77% 37.95% 1.50% 0.20%
Aggregate 297,301 51.06% 18.42% 8.96% 21.40% 2.07% 0.16%

August 2013
Copyright © 2013 FlightStats, Inc.
Full Page Chart Master
37
28.88%
42.87%
24.13%
34.06%
38.94%
88.60%
86.46%
18.37%
40.23%
23.03%
54.58%
83.96%
37.50%
90.49%
23.53%
79.89%
93.33%
86.97%
42.49%
30.34%
84.51%
77.02%
62.07%
27.20%
25.23%
22.82%
79.25%
74.61%
88.69%
84.97%
35.39%
47.57%
32.06%
42.08%
29.84%
0.00% 10.00% 20.00% 30.00% 40.00% 50.00% 60.00% 70.00% 80.00% 90.00% 100.00%
Beijing (PEK)
Changsha (CSX)
Chengdu (CTU)
Chongqing (CKG)
Dalian (DLC)
Delhi (DEL)
Fukuoka (FUK)
Guangzhou (CAN)
Haikou (HAK)
Hangzhou (HGH)
Hong Kong (HKG)
Jeju (CJU)
Kunming (KMG)
Nagoya (NGO)
Nanking (NKG)
Okinawa (OKA)
Osaka (ITM)
Osaka (KIX)
Qingdao (TAO)
Sanya (SYX)
Sapporo (CTS)
Seoul (GMP)
Seoul (ICN)
Shanghai (PVG)
Shanghai (SHA)
Shenzhen (SZX)
Singapore (SIN)
Taipei (TPE)
Tokyo (HND)
Tokyo (NRT)
Urumqi (URC)
Wuhan (WUH)
Xiamen (XMN)
Xian (XIY)
Zhengzhou (CGO)
Asian Airports On-‐Hme Departures, August 2013

August 2013
Copyright © 2013 FlightStats, Inc.
Full Page Chart Master
38
4.47%
2.24%
2.28%
1.54%
3.37%
1.58%
0.35%
2.29%
3.81%
2.66%
1.71%
0.17%
2.54%
0.21%
1.57%
0.48%
0.28%
0.20%
1.33%
4.56%
0.51%
0.40%
0.22%
2.76%
5.88%
3.28%
5.05%
1.57%
0.12%
0.30%
2.14%
2.61%
2.04%
1.62%
1.50%
0.00% 1.00% 2.00% 3.00% 4.00% 5.00% 6.00% 7.00%
Beijing (PEK)
Changsha (CSX)
Chengdu (CTU)
Chongqing (CKG)
Dalian (DLC)
Delhi (DEL)
Fukuoka (FUK)
Guangzhou (CAN)
Haikou (HAK)
Hangzhou (HGH)
Hong Kong (HKG)
Jeju (CJU)
Kunming (KMG)
Nagoya (NGO)
Nanking (NKG)
Okinawa (OKA)
Osaka (ITM)
Osaka (KIX)
Qingdao (TAO)
Sanya (SYX)
Sapporo (CTS)
Seoul (GMP)
Seoul (ICN)
Shanghai (PVG)
Shanghai (SHA)
Shenzhen (SZX)
Singapore (SIN)
Taipei (TPE)
Tokyo (HND)
Tokyo (NRT)
Urumqi (URC)
Wuhan (WUH)
Xiamen (XMN)
Xian (XIY)
Zhengzhou (CGO)
Asian Airports DeparHng Flight CancellaHons, August 2013

August 2013
Copyright © 2013 FlightStats, Inc.
Full Page Chart Master
39
0% 10% 20% 30% 40% 50% 60% 70% 80% 90% 100%
Beijing (PEK) Changsha (CSX) Chengdu (CTU)
Chongqing (CKG) Dalian (DLC) Delhi (DEL)
Fukuoka (FUK) Guangzhou (CAN)
Haikou (HAK) Hangzhou (HGH) Hong Kong (HKG)
Jeju (CJU) Kunming (KMG) Nagoya (NGO) Nanking (NKG) Okinawa (OKA)
Osaka (ITM) Osaka (KIX)
Qingdao (TAO) Sanya (SYX)
Sapporo (CTS) Seoul (GMP) Seoul (ICN)
Shanghai (PVG) Shanghai (SHA) Shenzhen (SZX) Singapore (SIN)
Taipei (TPE) Tokyo (HND) Tokyo (NRT)
Urumqi (URC) Wuhan (WUH) Xiamen (XMN)
Xian (XIY) Zhengzhou (CGO)
Asian Airports On-‐Hme and Delayed Departures, August 2013
On-‐Time Late (15-‐29 min) Very Late (30-‐44 min) Excessive (45+ min) Diverted

August 2013
Copyright © 2013 FlightStats, Inc.
Top 10 Lists
Rank Airline On-‐Time
1 (AY) Finnair 93.18%
2 (SA) South African 93.09%
3 (VO) Tyrolean Airways 92.50%
4 (GF) Gulf Air 92.46%
5 (SK) SAS 91.76%
6 (KL) KLM 90.64%
7 (U2) EasyJet 90.48%
8 (IB) Iberia 89.87%
9 (UX) Air Europa 89.21%
10 (JL) Japan Airlines 88.28%
40
Rank North American Airlines On-‐Time
1 (HA) Hawaiian 93.72%
2 (CP) Compass 90.47%
3 (QX) Horizon 87.80%
4 (QK) Jazz 85.51%
5 (5D) Aeroméxico Connect 85.35%
6 (AS) Alaska 84.45%
7 (3M) Silver 84.22%
8 (9E) Pinnacle 83.52%
9 (DL) Delta 83.50%
10 (S5) Shuttle America 81.09%
Rank European Airlines On-‐Time
1 (TF) Malmo Aviation 96.94%
2 (NT) Binter Canarias 96.07%
3 (WA) KLM Cityhopper 94.62%
4 (ZN) NAYSA 94.56%
5 (DY) Norwegian Air Shuttle 93.32%
6 (AY) Finnair 93.18%
7 (WF) Widerøe's 93.14%
8 (BT) airBaltic 92.81%
9 (VO) Tyrolean Airways 92.50%
10 (KF) Blue1 91.87%
Rank Asian Airlines On-‐Time
1 (FD) Thai AirAsia 93.46%
2 (BX) Air Busan 91.89%
3 (XM1) J-Air 90.77%
4 (JC) JAL Express 89.14%
5 (HD) Hokkaido 89.10%
6 (6E) IndiGo 88.39%
7 (3X) Japan Air Commuter 88.30%
8 (JL) Japan Airlines 88.28%
9 (NU) Japan Transocean 87.29%
10 (EH) ANA Wings 86.25%
Airline On-‐Hme Arrival Performance by Region
Major InternaHonal Airlines North American Airlines
European Airlines Asian Airlines

August 2013
Copyright © 2013 FlightStats, Inc.
Top 10 Lists
Rank Airport On-‐Time
1 Tokyo (HND) 88.69%
2 Munich (MUC) 86.72%
3 Minneapolis (MSP) 86.01%
4 Tokyo (NRT) 84.97%
5 Seattle (SEA) 84.72%
6 Amsterdam (AMS) 84.21%
7 Madrid (MAD) 83.98%
8 Sydney (SYD) 83.54%
9 Detroit (DTW) 82.76%
10 Frankfurt (FRA) 82.25%
41
Rank Airport On-‐Time
1 Salt Lake City (SLC) 87.31%
2 Honolulu (HNL) 87.15%
3 Minneapolis (MSP) 86.01%
4 Seattle (SEA) 84.72%
5 Portland (PDX) 84.72%
6 Washington (DCA) 84.48%
7 Detroit (DTW) 82.76%
8 Montreal (YUL) 82.70%
9 Vancouver (YVR) 82.58%
10 Calgary (YYC) 81.40%
Rank Airport On-‐Time
1 Oslo (OSL) 89.91%
2 Copenhagen (CPH) 86.75%
3 Munich (MUC) 86.72%
4 Vienna (VIE) 86.51%
5 Hamburg (HAM) 86.22%
6 Dusseldorf (DUS) 85.26%
7 Berlin (TXL) 85.14%
8 Amsterdam (AMS) 84.21%
9 Madrid (MAD) 83.98%
10 Geneva (GVA) 83.37%
Rank Airport On-‐Time
1 Osaka (ITM) 93.33%
2 Nagoya (NGO) 90.49%
3 Tokyo (HND) 88.69%
4 Delhi (DEL) 88.60%
5 Osaka (KIX) 86.97%
6 Fukuoka (FUK) 86.46%
7 Tokyo (NRT) 84.97%
8 Sapporo (CTS) 84.51%
9 Jeju (CJU) 83.96%
10 Okinawa (OKA) 79.89%
Major InternaHonal Airports North American Airports
European Airports Asian Airports
Airport On-‐Hme Departure Performance by Regions

August 2013
Copyright © 2013 FlightStats, Inc.
Appendix DefiniHons of Delays The following terms are used to describe and categorize the magnitude of flight delays:
§ On-‐=me – A flight is considered on-‐Hme if it arrives or departs at the gate less than 15 minutes aqer the scheduled gate Hme.
§ Late – A flight is classified as late if it arrives or departs at the gate delayed from 15 to 29 minutes aqer scheduled gate Hme.
§ Very Late – Very late includes flights that arrive or depart at the gate from 30 to 44 minutes aqer the scheduled gate Hme.
§ Excessive – Excessive includes flights that arrive or depart at the gate 45 minutes or more aqer the scheduled gate Hme.
Sample Size, CancellaHons, and Flight CompleHons § Sample Size – Sample size data is a count of the number of flights for which FlightStats was
able to capture gate departure, arrival or cancellaHon data. § On-‐=me & Delay Calcula=ons – The calculaHon of on-‐Hme and delayed flight percentages
include only those flights that were completed and for which FlightStats was able to collect final status (represented by Sample Size). Cancelled flights are not included in the delay calculaHons by subtracHng the number of cancellaHons from Sample Size before calculaHng on-‐Hme percentage.
§ Cancella=on – For the purposes of calculaHng cancelaHon percentages the number of cancelled flights is divided by the Sample Size.
Carrier SelecHon Criteria Carrier flight performance is assessed only for airlines where FlightStats can accurately determine the flight status gate data on a significant percentage of the scheduled passenger flights (no charter or unscheduled passenger flights, or cargo flights are considered). Typically 80% coverage is needed to for a carrier to be included in the analysis with coverage oqen in the upper 90% range.
Airport SelecHon Criteria Performance is assessed only for airports where FlightStats can accurately determine the outcome of a significant porHon of an airport's departures of scheduled passenger flights (no charter or unscheduled passenger flights, or cargo flights are considered). Typically 80-‐90% coverage is needed for an airport to be included in the analysis with coverage oqen in the upper 90% range. However, in Europe and Asia the coverage threshold was set lower to include a couple of key airports in the analysis.
42