flood damage assessment (case study: sirajganj...
TRANSCRIPT
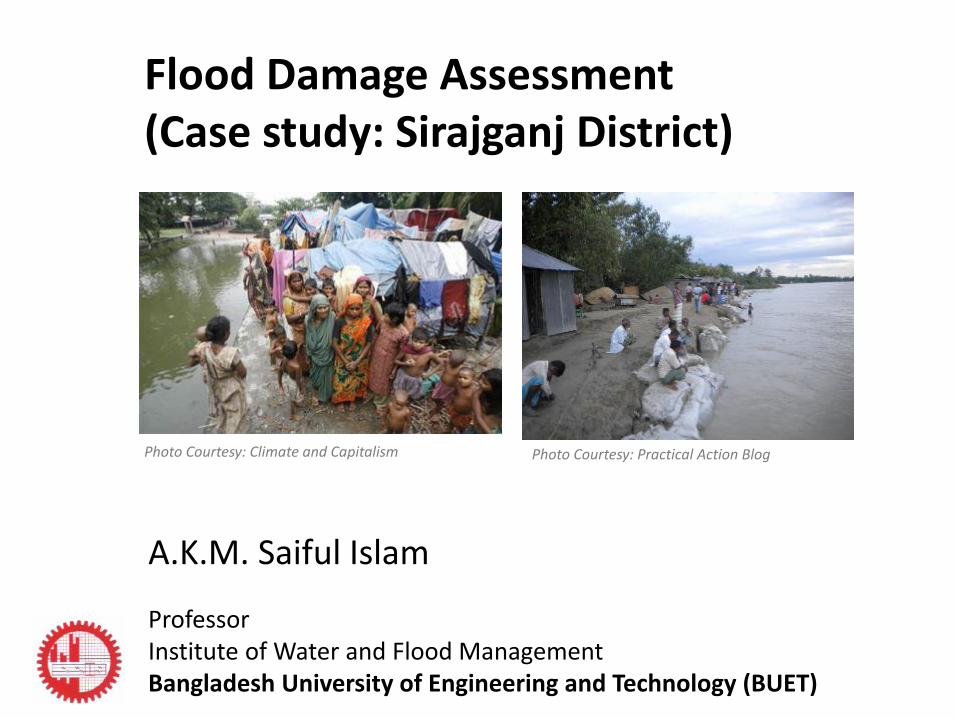
Flood Damage Assessment (Case study: Sirajganj District)
A.K.M. Saiful Islam
ProfessorInstitute of Water and Flood Management Bangladesh University of Engineering and Technology (BUET)
Photo Courtesy: Practical Action BlogPhoto Courtesy: Climate and Capitalism
Flood Hazard
• Flood hazard is defined as “the exceedanceprobability of potentially damaging floodsituations in a given area and within aspecified period of time” (Mertz et al., 2007;ITC, 2004).
Factors Influencing Flood Damage Assessment
• The area of inundation in combination withland use data, reveals which elements at riskwould be affected in case of a certain floodevent.
• Inundation depth the water depth has beenidentified by different studies as the floodcharacteristics which has the biggest influenceon flood damage.
Factors Influencing Flood Damage Assessment
• The duration of inundation is often ofimportance since the degree of damage is oftenrelated to it. This applies to structural safety, theeffect of interruption in communications,industrial activity and public services, andagriculture. In many cases, failure of riverembankments is also influenced by the durationof the flood water level.
Factors Influencing Flood Damage Assessment
• Another important criterion for flood intensityis the flow velocity. It becomes importantparticularly in mountainous areas or flashflood areas where flow velocities are high,which can lead to dramatic damages tobuildings, infrastructures, standing crops.
Factors Influencing Flood Damage Assessment
• The rate of rise of flood may also have aninfluence on flood damages. A high rise ratewill reduce the time for warning andevacuation and therefore could increasedamages or movable assets. It may thereforeinfluence planning permission for floodplainoccupation and its zoning. The considerationof rate of water rise necessitates, similar toflow velocity, a larger effort.
Factors Influencing Flood Damage Assessment
• The time of occurrence of flooding is usuallyimportant when calculating damages toagriculture. Damages would be quite high ifflooding occurs just before the harvest of therespective crops, while they could be relativelylow in the case of flooding in early stages suchthat damages can be recovered by re-plantation of crops.
Flood Vulnerability
• ISDR (2004), which defines vulnerability as‘the set of conditions and processes resultingfrom physical, social, economic andenvironmental factors, which increase thesusceptibility of a community to the impactof hazards’.
• ITC (2004) defined vulnerability as ‘the degreeof loss resulting from the occurrence of aphenomenon’.
Flood Vulnerability
• Jones and Boer (2003) defined vulnerability as‘the amount of potential damage caused to asystem by a particular-related event orhazard’.
• Mertz et al. (2007) conceptualized floodvulnerability as being composed of twoelements, exposure (or damage potential) andloss (susceptibility).
Exposure and Susceptibility
• Exposure analysis answers the question “Who or whatwill be affected by floods?” Exposure can be quantifiedby the number or the value of elements which are atrisk. In a flood prone area, the exposure may bequantified by the total assets (buildings, transportationfacilities, agriculture) within the design 100-yearinundation area.
• The analysis of susceptibility will then answer thequestion “How will the affected elements will bedamaged?” Susceptibility is usually described byrelative damage functions (e.g. depth-damage curves).
Flood Risks
• Mertz et al. (2007) defines risk as “theprobability that floods of a given intensityand a given loss will occur in a certain areawithin a specified time period’, implyingthat risk results from the interaction ofhazard and vulnerability.
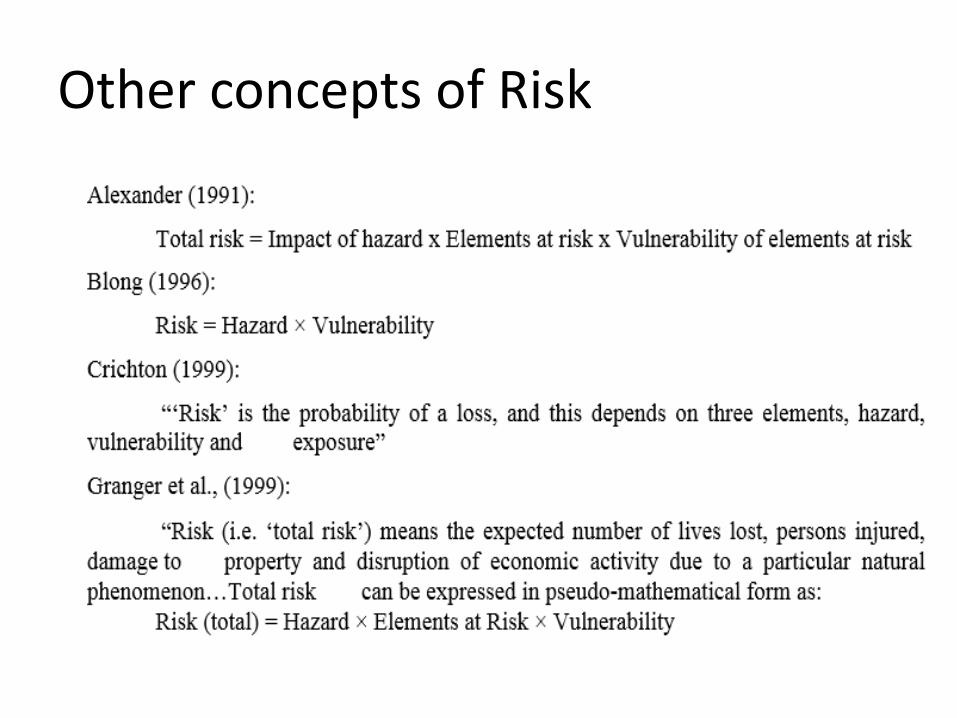
Other concepts of Risk
Case Study
Damage Assessment for flooding in Sirajganj District
References Mozammel et al. (2011) Development of Flood Hazard and Risk Maps with Effect of Climate Change Scenario (http://www.buet.ac.bd/iwfm/ climate/report/Component_1.pdf)
Sirajganj Sadar Upazila
• Sirajganj Sadar Upazila with an area of 325.77sq km is bounded by Kazipur Upazila on thenorth, Kamarkhanda and Belkuchi Upazilas onthe south, Kalihati and Bhuapur Upazilas onthe east, Kamarkhanda, Raiganj and DhunatUpazilas on the west.
Sirajganj Sadar Upazila
• The area falls in a major Agro Ecological Zones(AEZ), which is the Active Brahmaputra-Jamuna Floodplain (AEZ-8). Siraganj is locatedin north-western zone of Bangladesh whichhas less rainfall. The annual rainfall is 1610mm.
Sirajganj Sadar Upazila
• In the north, June has a mean rainfallexceeding 500 mm whereas in the south nomonth has a mean rainfall exceeding 300 mm.However, the main river, the Brahmaputrabrings the largest transboundary inflow fromupstream catchment area.
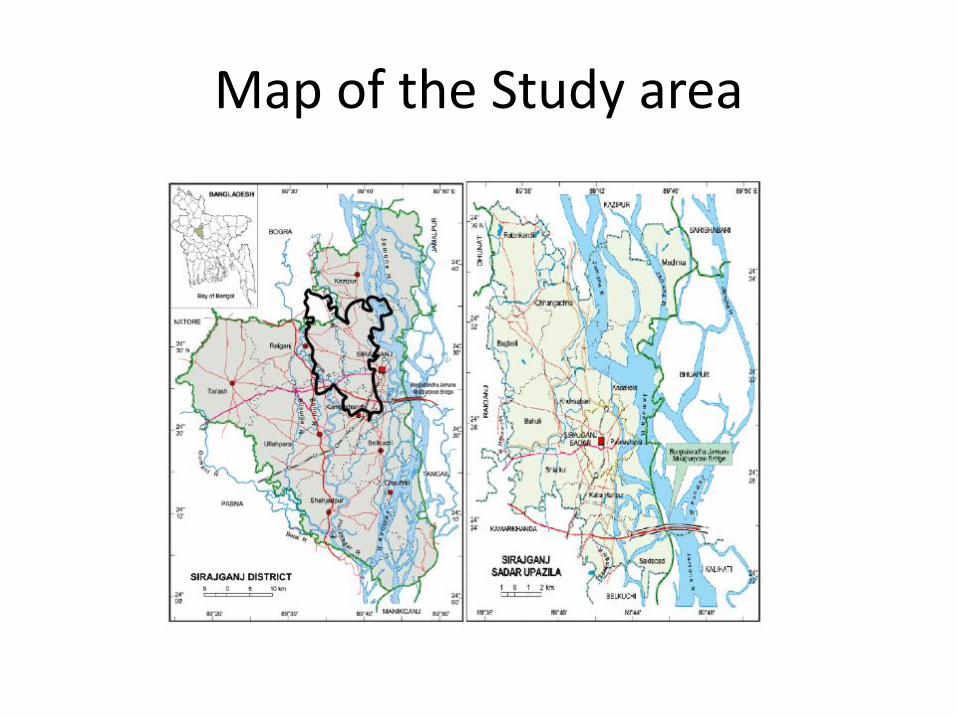
Map of the Study area
Sirajganj Sadar Upazila
• Major important rivers in and around Sirajganjare Brahmaputra-Jamuna, Bangali,Jamuneswari, Karatoa, and Hurasagar.Sirajganj is considered as the most disasterprone area to river flood and bank erosion.
• Widespread flooding, shifting river channels,constantly eroding cultivated land andsettlement and displacement of people arethe main problems in this area.
Sirajganj Sadar Upazila
• Total population of the Sirajganj Sadar Upazila is389160, with male 51.54%, female 48.46%;Muslim 95.16%, Hindu 4.80% and others 0.04%(Banglapedia, 2006). About 25.2% of peopleinvolved in agricultural activities.
• Other occupations include agricultural labourer15.76%, wage labourer 4.37%, commerce16.09%, service 12.55%, weaving 4.10%,transport 3.53%, industrial labourer 4.12%,others 14.31%.
Sirajganj Sadar Upazila
• Land use status of Sirajganj Sadar Upazila showsthat the total cultivable land is 23872.93 hectaresand fallow land is 772.16 hectares.
• About 21.44% of the land is single cropped,47.54% double cropped and 31.02% triplecropped. Main crops include paddy, jute, wheat,mustard seed, sugarcane, onion, garlic, potato,sweet potato, chilli and ground nut.
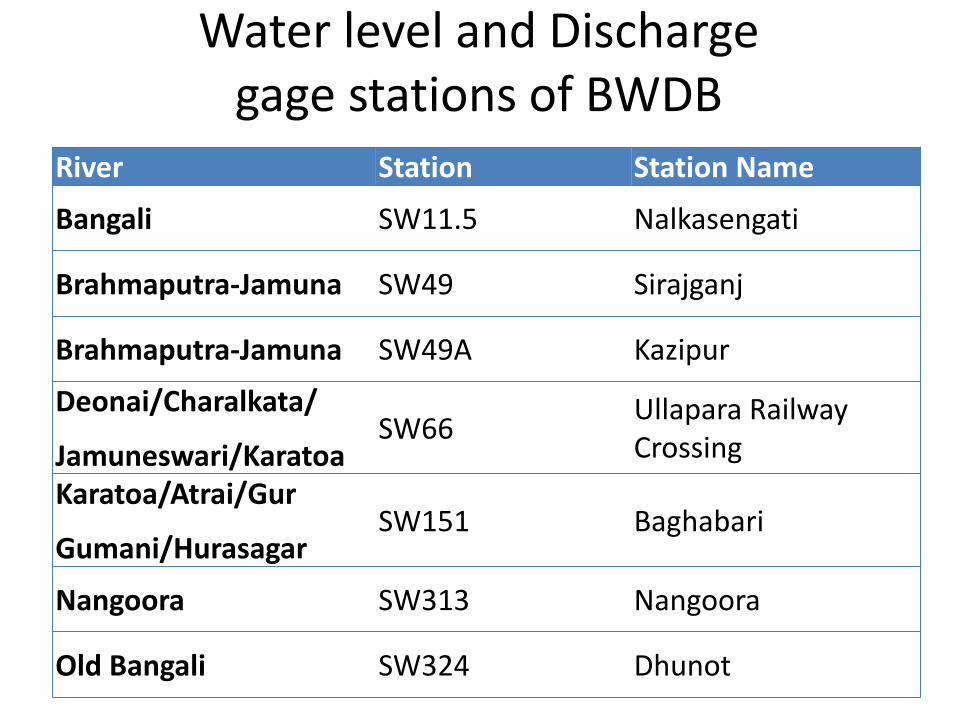
Water level and Discharge gage stations of BWDB
River Station Station Name
Bangali SW11.5 Nalkasengati
Brahmaputra-Jamuna SW49 Sirajganj
Brahmaputra-Jamuna SW49A Kazipur
Deonai/Charalkata/
Jamuneswari/KaratoaSW66
Ullapara Railway Crossing
Karatoa/Atrai/Gur
Gumani/HurasagarSW151 Baghabari
Nangoora SW313 Nangoora
Old Bangali SW324 Dhunot
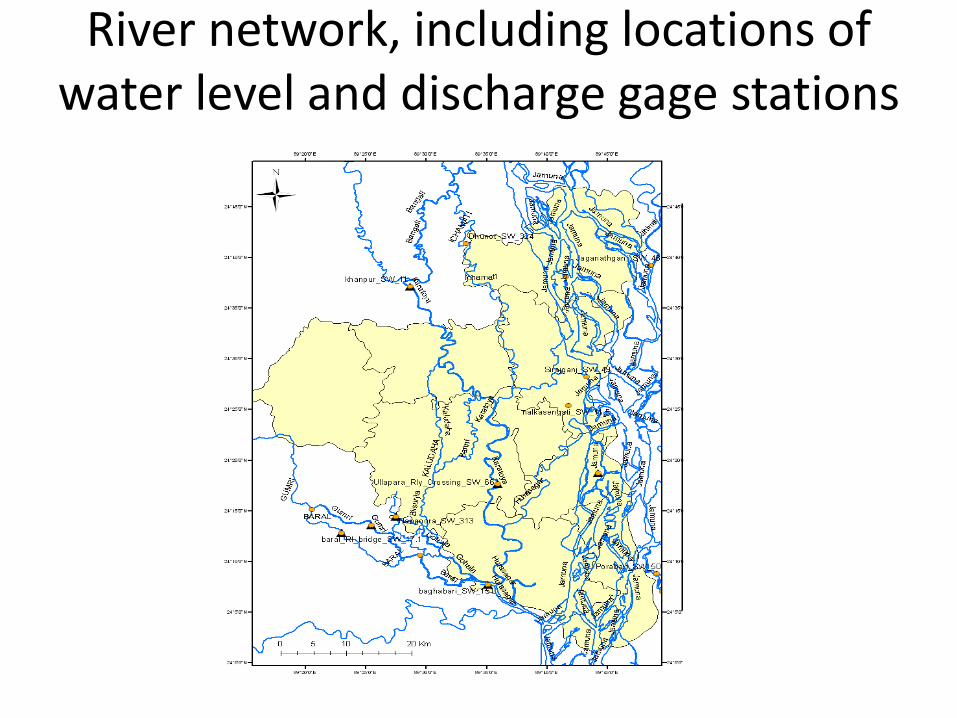
River network, including locations of water level and discharge gage stations
(a) Sirajganj
(b) Hobiganj
(c) Barguna
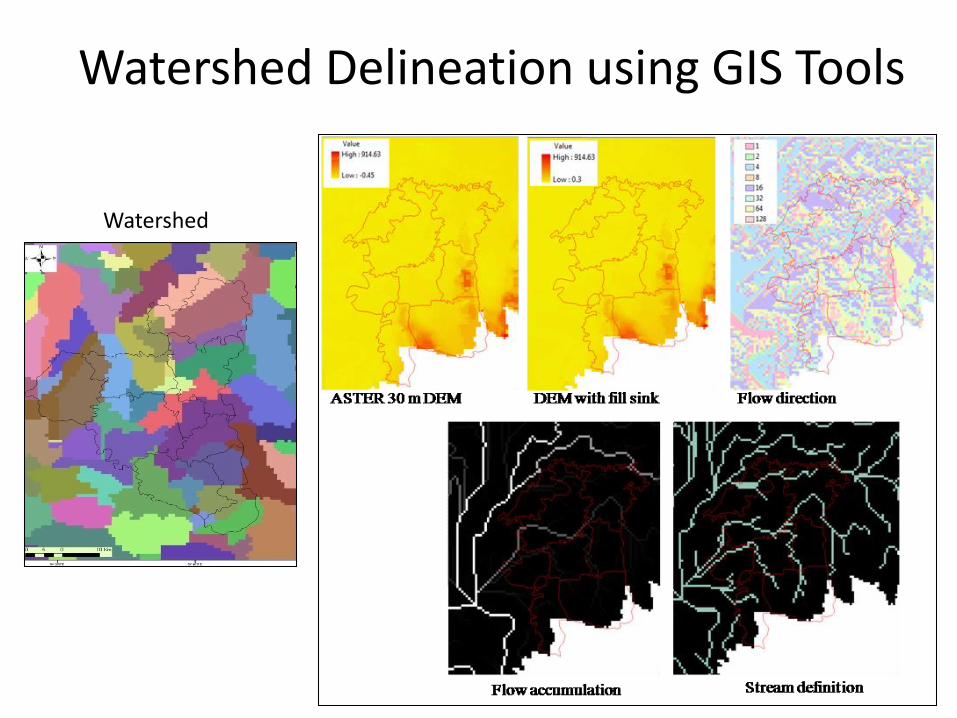
Watershed Delineation using GIS Tools
Watershed
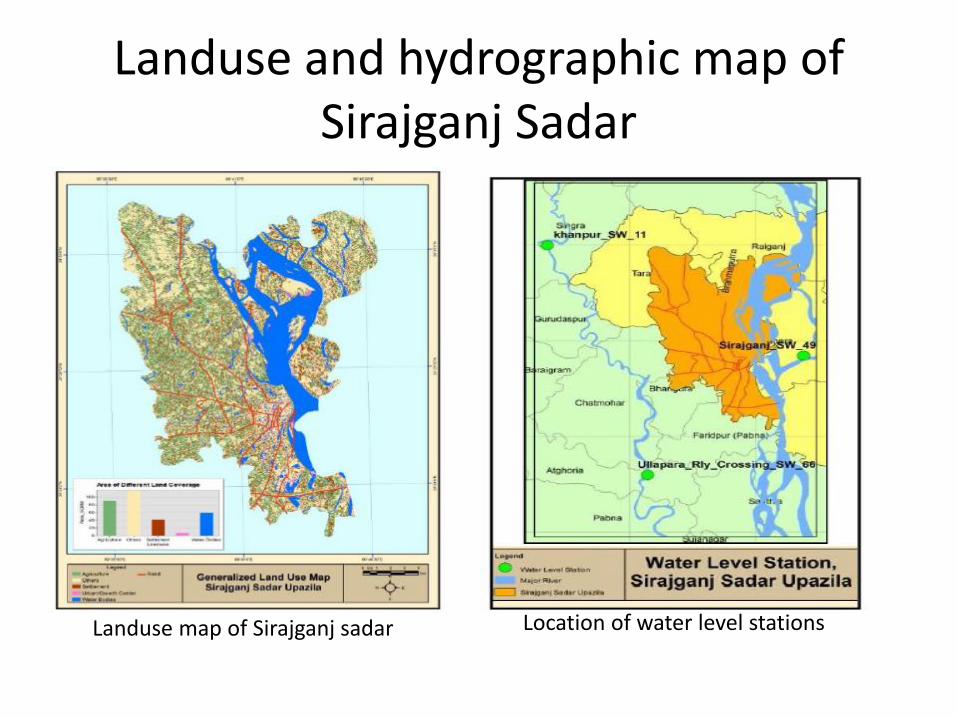
Landuse and hydrographic map of Sirajganj Sadar
Location of water level stations Landuse map of Sirajganj sadar
Flood Frequency Analysis
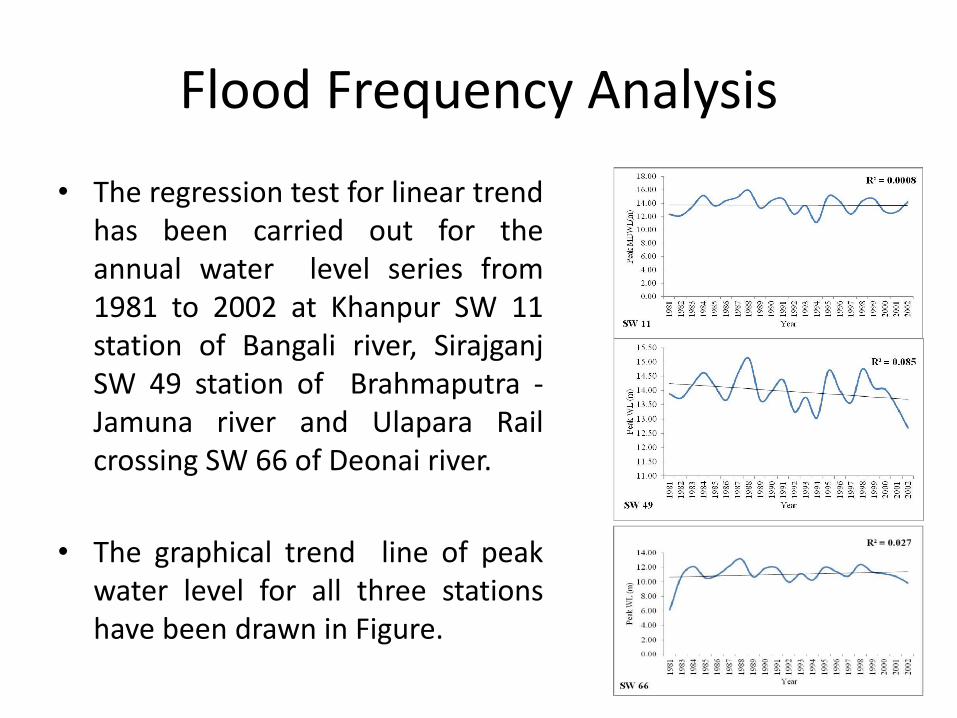
• The regression test for linear trendhas been carried out for theannual water level series from1981 to 2002 at Khanpur SW 11station of Bangali river, SirajganjSW 49 station of Brahmaputra -Jamuna river and Ulapara Railcrossing SW 66 of Deonai river.
• The graphical trend line of peakwater level for all three stationshave been drawn in Figure.
Frequency analysis on Brahmaputra River
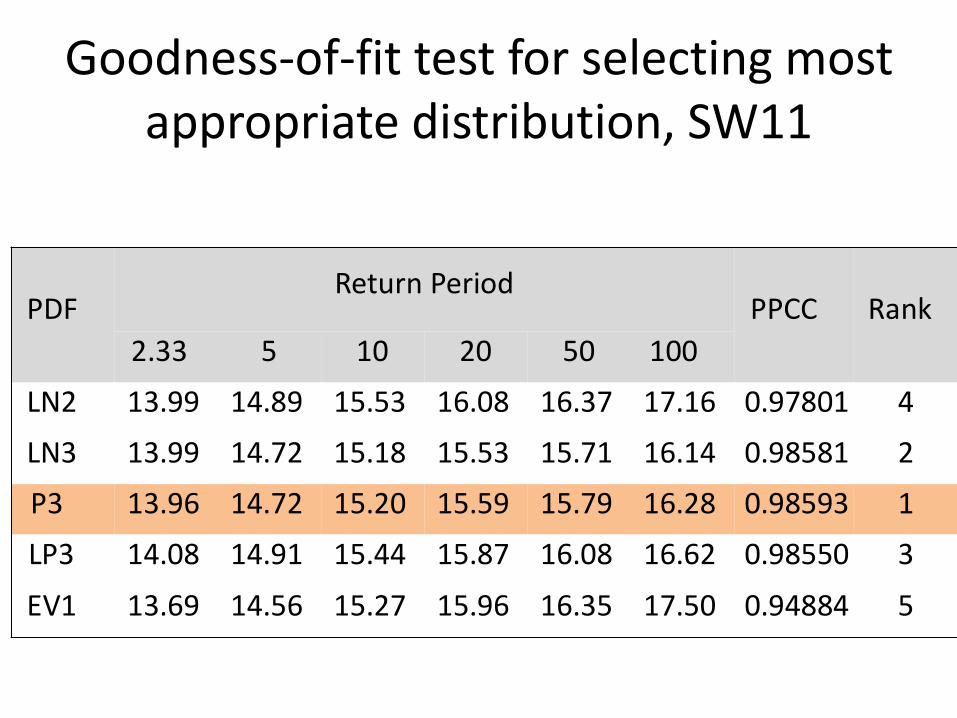
• Then trend free hydrologic data have beenused to determine designed flood levels forseveral return periods (2.33yr, 05yr, 10yr,20yr, 50yr and 100yr floods) throughflood frequency analysis.
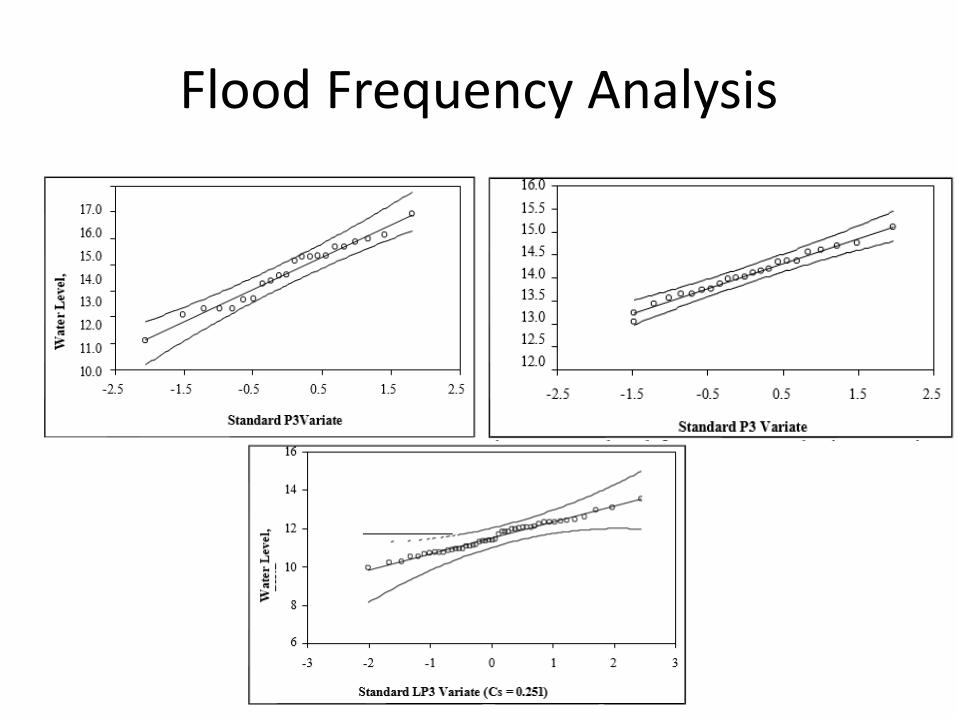
• For selecting best fitted distribution,goodness-of-fit test has been conducted.In the goodness-of-fit test, Probability PlotCorrelation Coefficient (PPCC) had beenapplied.
Goodness-of-fit test for selecting most appropriate distribution, SW11
PDFReturn Period
PPCC Rank
2.33 5 10 20 50 100
LN2 13.99 14.89 15.53 16.08 16.37 17.16 0.97801 4
LN3 13.99 14.72 15.18 15.53 15.71 16.14 0.98581 2
P3 13.96 14.72 15.20 15.59 15.79 16.28 0.98593 1
LP3 14.08 14.91 15.44 15.87 16.08 16.62 0.98550 3
EV1 13.69 14.56 15.27 15.96 16.35 17.50 0.94884 5
Flood Frequency Analysis
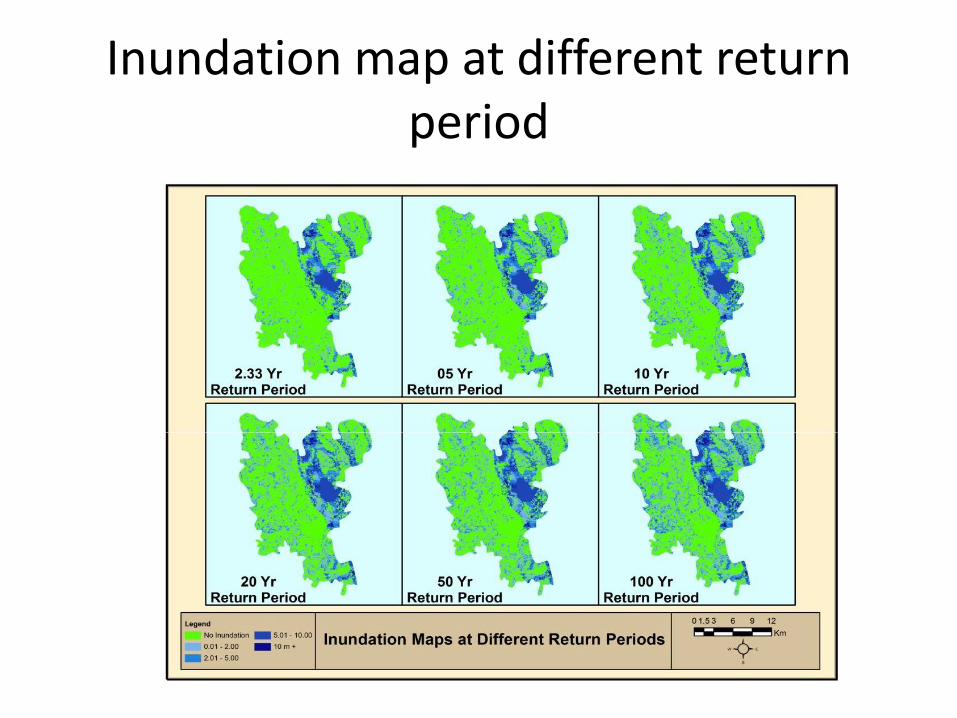
Inundation map at different return period
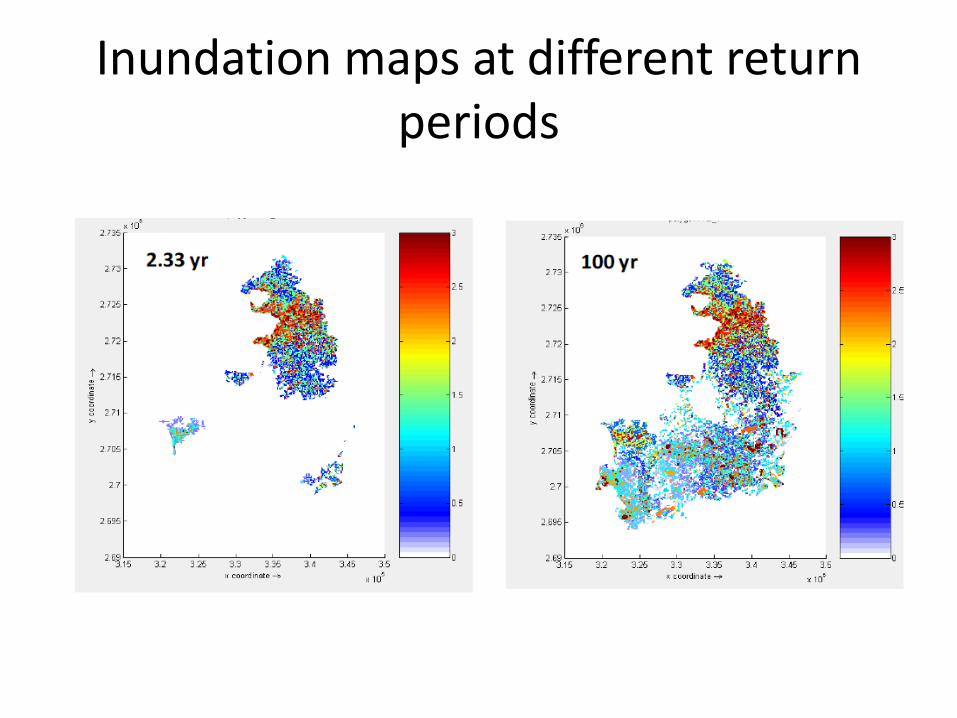
Inundation maps at different return periods
Loss/Vulnerability Function
• A stage-damage curve normally relates to aspecific class of buildings or crops and presentsinformation on the relationship of flood damageto depth of flooding (or stage).
• For example, crop stage-damage curve has beendeveloped through several field survey areconducted to gathering of crop damage data fromactual flood event such as 1988, 1998, 2004 and2007 the major flood in Sirajganj with respect toflood depth in agriculture land.
Settlement Vulnerability
• Valuation surveys are conducted for the settlement vulnerabilityassessment. Settlement has been classified in four type such as (BB)brick floor-Brick Wall, (BC) Brick floor-CI Sheet wall, (MC) Mud floorCI Sheet wall, (MM) Mud floor Mud(wall).
• For the selected properties the surveyor quantifies the damage ofall items due to flood and their current value based on type, qualityand degree of wear. The survey included information on the heightabove the floor of each item or the heights can be taken asstandard from house to house. The information for all samples ofeach element class is then averaged and stage-damage curvesconstructed. In the crop stage-damage curve and settlement stage-damage curve vulnerability has been scale 0 to 1.
• Zero (0) indicates there is no damage, 0.5 vulnerability indicates 50percent damage and 1.0 vulnerability indicate 100 percent damageof crops and settlements
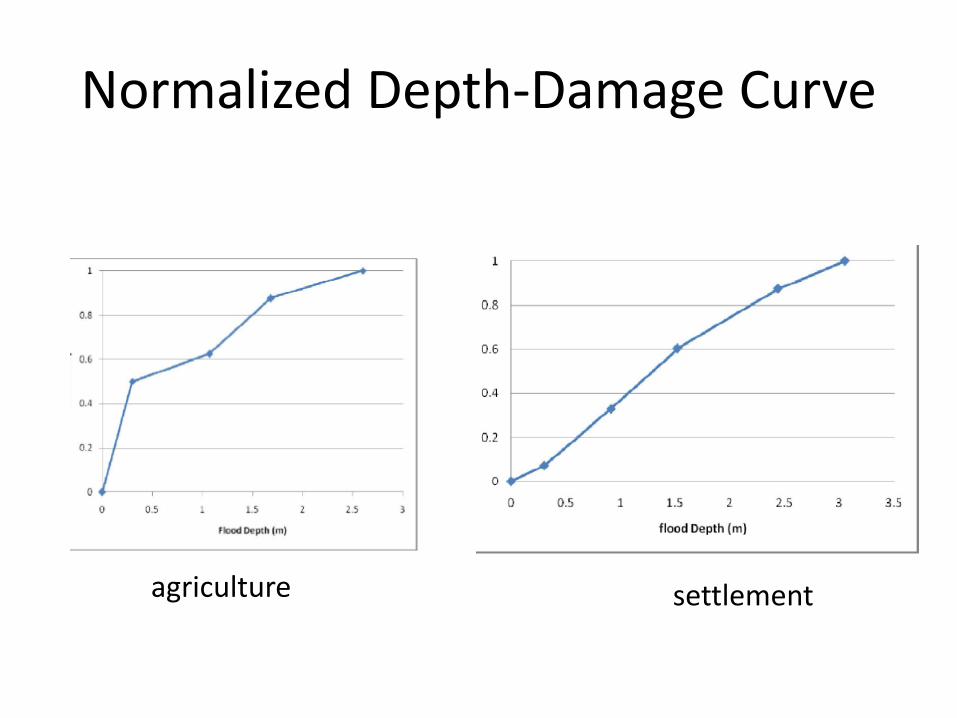
Normalized Depth-Damage Curve
agriculture settlement
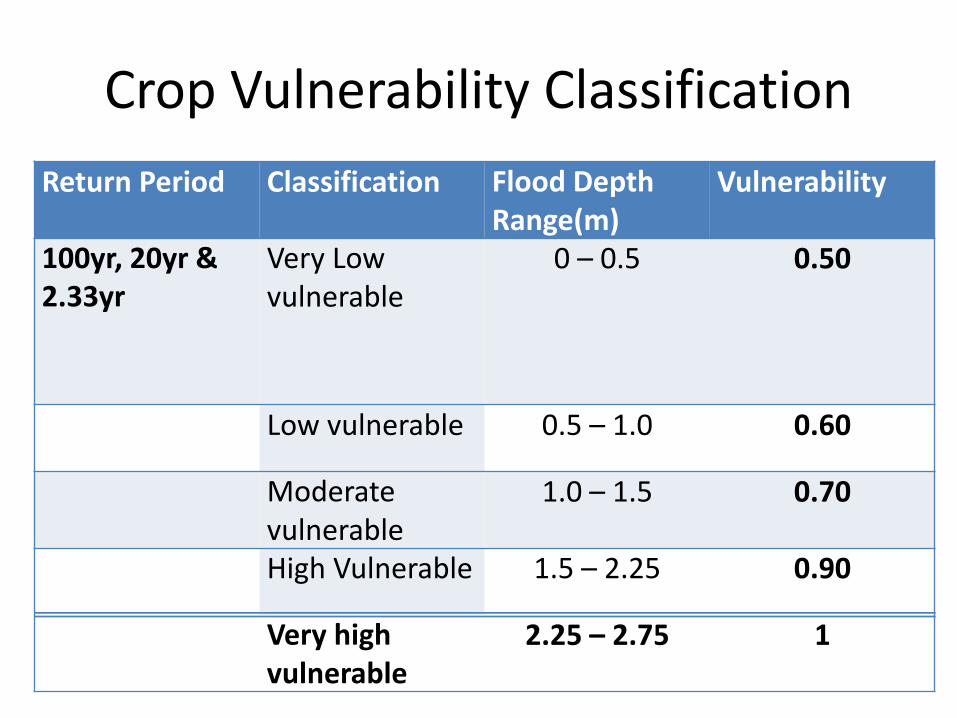
Crop Vulnerability Classification
Return Period Classification Flood Depth Range(m)
Vulnerability
100yr, 20yr & 2.33yr
Very Low vulnerable
0 – 0.5 0.50
Low vulnerable 0.5 – 1.0 0.60
Moderate vulnerable
1.0 – 1.5 0.70
High Vulnerable 1.5 – 2.25 0.90
Very high vulnerable
2.25 – 2.75 1
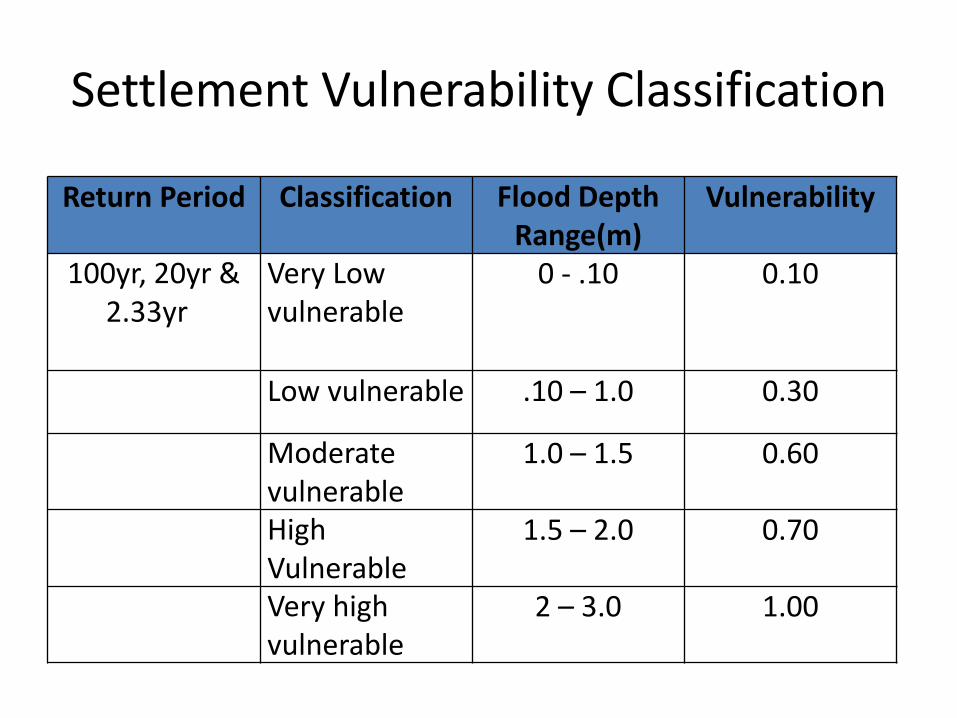
Settlement Vulnerability Classification
Return Period Classification Flood Depth Range(m)
Vulnerability
100yr, 20yr & 2.33yr
Very Low vulnerable
0 - .10 0.10
Low vulnerable .10 – 1.0 0.30
Moderate vulnerable
1.0 – 1.5 0.60
High Vulnerable
1.5 – 2.0 0.70
Very high vulnerable
2 – 3.0 1.00
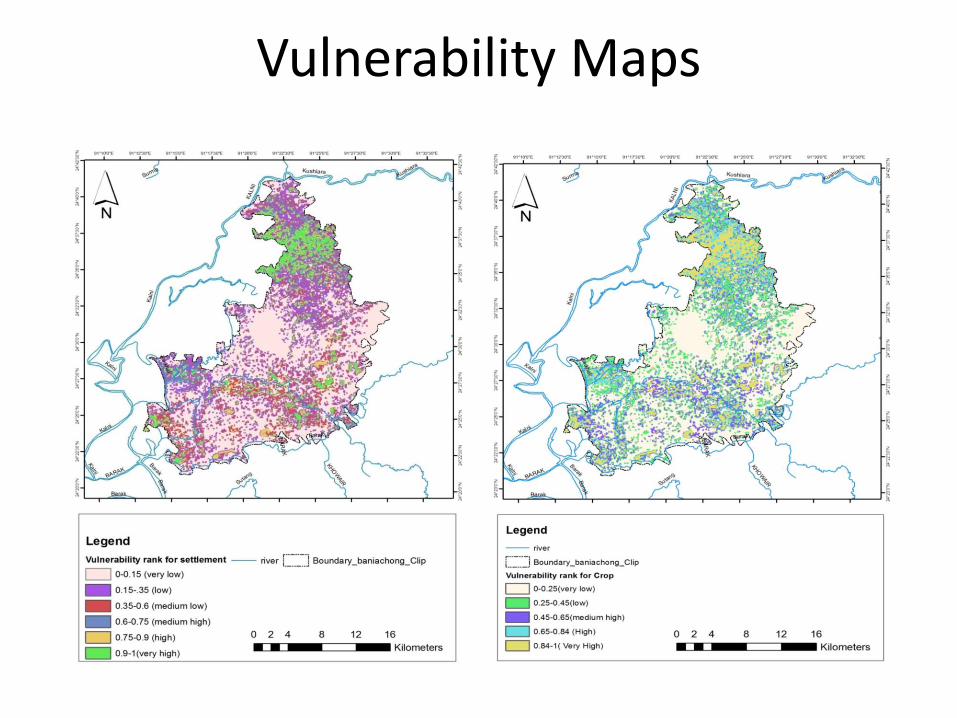
Vulnerability Maps

Thank you
Questions ?