flow boiling of ammonia and propane in mini channels496232/...flow boiling of r134a in a horizontal...
TRANSCRIPT
F low boi l ing of ammonia and propane in mini channels
Doctoral Thesis
By
Muhammad Hamayun Maqbool
Division of Applied Thermodynamics and Refrigeration Department of Energy Technology
Royal Institute of Technology
Stockholm, Sweden 2012
Trita REFR Report No. 12/01 ISSN 1102-0245 ISRN KTH/REFR/12/01-SE ISBN 978-91-7501-264-3 © Muhammad Hamayun Maqbool 2012


D o c t o r a l T h e s i s / M . H . M a qb o o l
i
Abstract The environmental concerns in recent times have grown especially after signing Montreal protocol. In the last ten years, researchers have focus-sed mainly on understanding the boiling and condensation phenomena of HFC refrigerants in minichannels. As global warming concerns are growing day by day, due to high global warming potential, HFCs are not the ultimate option. In the near future, HFCs will probably be replaced by environmentally friendly refrigerants. Therefore, to find the potential replacements of HFCs and also to get a deeper understanding of the boiling phenomena in minichannels, more and more fluids having low GWP (Global Warming Potential) and ODP (Ozone Depletion Poten-tial) should be tested. Recent efforts to protect the environment have led to a growing interest for natural refrigerants. However in the literature, flow boiling data of natural refrigerants in minichannels are scarce.
To meet the environmental concerns and to understand the behaviour of natural refrigerants in minichannels and the performance compared to HFCs, flow boiling experiments in single circular vertical minichannels of internal diameters of 1.70 and 1.224 mm were performed using am-monia and propane as working fluids.
Flow boiling heat transfer results of ammonia and propane with 1.70 mm channel showed that the heat transfer coefficient was a function of heat flux and the effect of mass flux was insignificant. The heat transfer coefficient of ammonia in 1.224 mm was dependent on heat flux at low vapour qualities then a clear dependence of the heat transfer coefficient on the mass flux was observed at higher vapour qualities. The heat trans-fer results of ammonia and propane were compared with well known correlations and among them Cooper (1989) correlation in case of am-monia and Liu and Winterton (1991) and Cooper (1984) pool boiling correlations in case of propane best predicted the experimental heat transfer data.
Results of the two phase pressure drop studies of ammonia and propane showed that the two phase pressure drop increased with the increase of mass flux, with the increase of heat flux and with the decrease of satura-tion temperature. The comparison of the two phase pressure drop ex-perimental data with well known predicting models showed that none of the correlations predicted the ammonia data well and that Müller Stein-hagen and Heck (1986) was well in agreement with the propane data.

D o c t o r a l T h e s i s / M . H . M a qb o o l
ii
Dryout of propane in 1.70 mm and 1.224 mm internal diameter channels was also investigated. Dryout heat flux was observed to increase with the increase of mass flux, with the decrease of vapour quality and with the increase of internal diameter. The effect of saturation temperature on the dryout heat flux was insignificant. The experimental dryout data were compared with macro and micro scale correlations and among them Bowring (1972) and Callizo et al. (2010a) gave best predictions.
The heat transfer and pressure drop results of ammonia and propane and dryout results of propane were compared with R134a data taken on the same test rig by Owhaib (2007) and Ali (2010). The comparison of heat transfer showed that the heat transfer coefficient was a function of heat flux and the effect of mass flux was insignificant in all tested condi-tions except ammonia in 1.224 mm tube where the heat transfer coeffi-cient was dependent on heat flux at lower vapour qualities and a clear dependence of mass flux was observed at higher vapour qualities. The heat transfer data of ammonia, propane and R134a were compared with correlations and among them Cooper (1989) correlation gave best pre-dictions. The comparison of pressure drop results showed that the two phase pressure drop of all fluids was increased with the increase of mass flux, with the increase of heat flux and with the decrease of saturation temperature. At equal heat flux and mass flux, the two phase pressure drop of ammonia was increased with the decrease of internal diameter but the diametric effects of R134a were unclear. Müller Steinhagen and Heck (1986) and Zhang and Webb (2001) best predicted the experimen-tal data of two phase pressure drop of ammonia, propane and R134a among the correlations considered for comparison. The dryout data of propane were also compared with dryout data of R134a and it was ob-served that the dryout heat flux of propane and R134a increased with the increase of mass flux, with the decrease of vapour quality and with the increase of internal diameter. The effect of saturation temperature on the dryout heat flux of propane and R134a was insignificant. The correlation of Bowring (1972) for conventional channels and the microscale correla-tion of Callizo et al. (2010a) were among the correlations which gave best predictions of experimental data of dryout.
Keywords: Flow Boiling, Mini channels, Global Warming Potential, Ammonia, Propane, R134a, HFC, Two-phase, Heat Transfer, Pressure Drop, Dry out.

D o c t o r a l T h e s i s / M . H . M a qb o o l
iii
Acknowledgements
First of all, I offer my sincere gratitude to my supervisor Professor Björn Palm for accepting me as a Ph.D. student and helping me with his pa-tience and knowledge to complete my doctoral thesis. I am impressed by your hard work and commitment towards research. One simply could not wish for such a kind supervisor. Tack så mycket.
I would also like to thank my co-supervisor Rahmatullah Khodabadeh for the discussions and for encouraging me always. Thanks also to Rashid Ali for helping me to understand the experimental set-up and for technical discussions.
I will never forget Benny Andersson (Late) for his kindness and readi-ness to help me whenever I wanted (May God rest him in peace). I wish to thank Peter Hill and Benny Sjöberg for technical support and Inga Du Rietz and Emma for administrative support.
I am grateful to the Higher Education Commission (HEC) of Pakistan for providing me living expenses during my studies and Swedish Institute (SI) for managing the administrative matters in Sweden.
Thanks to all colleagues in Energy Department for the time and discus-sions during coffee time. It has been a memorable stay in Sweden be-cause of you. Special thanks to Samer, Hatef, Nabil, Waseem, Rizwan and Zahid for your friendship.
Thanks to my mother, Tahira, and father, Maqbool, for their help and prayers to reach this far. Special thanks to my younger brother, Adnan, for helping me in many ways during my stay in Sweden.
Finally, my great gratitude to my better half, Arshi Nizam, for her sup-port and understanding during our stay in Sweden. My love to Hadi and Hashir for making me a proud father.
I dedicate this thesis to my parents and my family.
Muhammad Hamayun Maqbool
Stockholm, February 2012
D o c t o r a l T h e s i s / M . H . M a qb o o l
iv
Publications Journal Papers
Ali R., Palm B., Maqbool M.H., 2011, Experimental Investigation of Two-phase Pressure Drop in a Microchannel, Heat Transfer Engineering, volume 32(13-14), 1126-1138.
Ali R., Palm B., Maqbool M.H., 2011, Flow Boiling Heat Transfer Characteristics of a Minichannel up to Dryout Condition, ASME Journal of Heat Transfer, volume 133, issue 8, 081501-10.
Maqbool M.H., Palm B., Khodabandeh R., 2011, Boiling Heat Transfer of Ammonia in Vertical Smooth Minichannels: Experimental Results and Predictions, International Journal of Thermal Sciences. Published Online (http://dx.doi.org/10.1016/j.ijthermalsci.2011.09.012) .
Maqbool M.H., Palm B., Khodabandeh R., 2012, Flow Boiling of Am-monia in Vertical Small Diameter Tubes: TwoPhase Frictional Pressure Drop Results and Assessment of Prediction Methods, International Journal of Thermal Sciences. Published Online (http://dx.doi.org/10.1016/j.ijthermalsci.2011.11.018).
Maqbool M.H., Palm B., Khodabandeh R., 2012, Investigation of Two Phase Heat Transfer and Pressure Drop of Propane in a Vertical Circular Mini channel, Submitted to Experimental Thermal and Fluid Science.
Maqbool M.H., Palm B., Khodabandeh R., 2012, Experimental Investi-gation of Dryout of Propane in Uniformly Heated Single Vertical Mini-Channels, Experimental Thermal and Fluid Science, volume 37, 121-129.
Reviewed Conference Papers Ali R., Palm B., Maqbool M.H., 2009, Experimental Investigation of Two Phase Pressure Drop in a Micro channel, In Proceedings of 2nd Micro & Nano Flow Conference, September 1-2, Brunel University, West London, UK.
Ali R., Palm B., Maqbool M. H., 2009, Flow Boiling Heat Transfer Characteristics of a Mini channel up to Dryout Condition, In Proceedings of MNHMT09, ASME 2nd Micro/Nano scale Heat & Mass Transfer Interna-tional Conference, December 18-22, Shanghai, China.
Maqbool M.H., Palm B., Khodabandeh R., Ali R., 2010, Two Phase Pressure Drop of Ammonia in a Mini/Micro Channel, In the proceedings of,

D o c t o r a l T h e s i s / M . H . M a qb o o l
v
ASME 2010 3rd Joint US-European Fluids Engineering Summer Meeting and 8th International Conference on Nano channels, Micro channels, and Minichannels, FEDSM2010-ICNMM2010, August 2-4, Montreal, Canada.
Maqbool M.H., Palm B., Khodabandeh R., Ali R., 2010, Two Phase Heat Transfer of Ammonia in a Mini/Micro Channel, In the proceedings of, ASME 2010 3rd Joint US-European Fluids Engineering Summer Meeting and 8th International Conference on Nano channels, Micro channels, and Minichannels, FEDSM2010-ICNMM2010, August 2-4, Montreal, Canada.
Ali R., Palm B., Maqbool M.H., 2010, A Visualization Study During Flow Boiling of R134a In A Horizontal Micro channel, In the proceedings of, ASME 2010 3rd Joint US-European Fluids Engineering Summer Meeting and 8th International Conference on Nano channels, Micro channels, and Minichannels, FEDSM2010-ICNMM2010, August 2-4, Montreal, Canada.
Maqbool M.H., Palm B., Khodabandeh R., Ali R., 2010, Experimental Investigation of Two Phase Pressure Drop in a vertical mini-channel at three saturation pressures, In the Proceedings of 2nd European Conference on Mi-cro fluidics, December 8-10, Toulouse, France.
Ali R., Palm B., Maqbool M.H., 2010, Flow Boiling Heat Transfer of Refrigerants R134a and R245fa in a Horizontal Micro channel, In the Pro-ceedings of 2nd European Conference on Micro fluidics, December 8-10, Toulouse, France.
Ali R., Palm B., Martin-Callizo C., Maqbool M.H., 2010, Flow Patterns and Flow Pattern Maps for Micro channels, In the Proceedings of 3rd Interna-tional Conference on Thermal Issues in Emerging Technologies, December 19-22, Cairo, Egypt.
Maqbool M.H., Palm B., Khodabandeh R., 2011, Parametric Effects on Dryout of Propane in a Vertical Circular Mini-Channel. In the proceedings of 3rd Micro and Nano Flow Conference, August 22-24, Thessaloniki, Greece.
Maqbool M.H., Palm B., Khodabandeh R., Ali R., 2011, Saturated Flow boiling Heat Transfer Characteristics of Propane in a Smooth Vertical Mini channel up to Dryout Incipience. In the proceedings of 23rd IIR Congress of Refrigeration, August 21-26, Prague, Czech Republic.

D o c t o r a l T h e s i s / M . H . M a qb o o l
vi
Table of Contents
1 Introduction .................................................................................. 1 1.1 Background ............................................................................ 1 1.2 Main Objectives .................................................................... 2 1.3 Thesis Organization ............................................................. 2
2 Literature Review .......................................................................... 4 2.1 Flow Boiling Heat Transfer ................................................ 4 2.2 Critical Heat Flux.................................................................. 9 2.3 Two Phase Pressure Drop ................................................ 12
3 Experimental and Analytical Approach ...................................... 16 3.1 Experimental Set-Up.......................................................... 16 3.2 Details of the Test Sections .............................................. 18 3.3 Data Reduction ................................................................... 20 3.4 Instrumentation and its Systematic Uncertainties ......... 23 3.5 Uncertainty Analysis .......................................................... 25 3.6 Single Phase Results ........................................................... 27
4 Flow Boiling Heat Transfer ........................................................ 31 4.1 Flow Boiling Heat Transfer of Ammonia ...................... 31 4.2 Flow Boiling Heat Transfer of Propane ......................... 41
5 Two phase Pressure Drop ........................................................... 47 5.1 Two Phase Pressure Drop of Ammonia ........................ 47 5.2 Two Phase Pressure Drop of Propane ........................... 58
6 Dryout of Propane ....................................................................... 62 6.1 Experimental Results of Dryout of Propane ................. 62
7 Comparison of Ammonia and Propane with R134a .................... 73 7.1 Comparison of Heat Transfer of Ammonia, Propane and R134a .............................................................................................. 73 7.2 Comparison of Pressure Drop of Ammonia, Propane and R134a .............................................................................................. 82 7.3 Comparison of Dryout of Propane and R134a ............. 86
8 Conclusions ................................................................................. 91 8.1 Flow Boiling Heat Transfer Results ................................ 91 8.2 Flow Boiling Pressure Drop Results ............................... 93 8.3 Dryout Results .................................................................... 94 8.4 Remarks and Suggestions for Further Work .................. 94

D o c t o r a l T h e s i s / M . H . M a qb o o l
vii
Nomenclature ................................................................................. 96
Bibliography ................................................................................. 100

D o c t o r a l T h e s i s / M . H . M a qb o o l
viii
List of Appended Papers
Paper 1 Maqbool M.H., Palm B., Khodabandeh R., 2011, Boil-ing Heat Transfer of Ammonia in Vertical Smooth Minichannels: Experimental Results and Predictions, In-ternational Journal of Thermal Sciences. Published Online (http://dx.doi.org/10.1016/j.ijthermalsci.2011.09.012).
Paper 2 Maqbool M.H., Palm B., Khodabandeh R., 2012, Flow Boiling of Ammonia in Vertical Small Diameter Tubes: Two Phase Frictional Pressure Drop Results and As-sessment of Prediction Methods, International Journal of Thermal Sciences. Published Online (http://dx.doi.org/10.1016/j.ijthermalsci.2011.11.018).
Paper 3 Maqbool M.H., Palm B., Khodabandeh R., 2012, In-
vestigation of Two Phase Heat Transfer and Pressure Drop of Propane in a Vertical Circular Mini channel, Submitted to Experimental Thermal and Fluid Science.
Paper 4 Maqbool M.H., Palm B., Khodabandeh R., 2012, Ex-
perimental Investigation of Dryout of Propane in Uni-formly Heated Single Vertical Mini-Channels, Experi-mental Thermal and Fluid Science, volume 37, 121-129.
Contribution of the authors is as follows;
In all appended papers, first author performed experiments, ana-lysed data and wrote entire manuscripts. The second and third authors reviewed and gave valuable comments to improve manuscripts.

D o c t o r a l T h e s i s / M . H . M a qb o o l
1
1 Introduction
1 . 1 B a c k g r o u n d Minichannels have been used in recent years in many applications like compact heat exchangers, electronic cooling, biomedical instrumentation and in mobile air conditioning etc. because they offer several advantages like compactness, low cost (less material requirement), high thermal effi-ciency, low fluid inventory. As the requirement of compactness and heat dissipation increase with time, the more is the need to understand the flow boiling mechanisms in minichannels. As in electronics, the minia-turization of chips requires high performance cooling which can control the surface temperatures under limits to ensure efficient and safe opera-tion of the component. In future, further progress in miniaturization of electronic components will depend on the advancement of thermal man-agement technologies.
To design the optimal mini channel heat exchanger, the predictions of heat transfer and pressure drop at desired experimental conditions are the main requirements. Also to have a safe operation, the predictions of dryout heat flux is an important aspect determining the thermal limits under given experimental conditions. Although a lot of investigations in recent years have been done about two phase heat transfer, pressure drop and dryout in minichannels, there is still a lack of consensus on the effect of different parameters on flow boiling characteristics in minichannels. Contrary to the two phase, the majority of the research community now agrees to the applicability of classical correlations to cal-culate single phase heat transfer coefficients and friction factors in minichannels. The flow boiling mechanisms in minichannels still need to be clarified. It is quite evident by seeing the available literature that there are differences among researchers, based on their findings, on the effect of different parameters like mass flux, heat flux, saturation temperature, geometry and fluid type etc. on heat transfer, pressure drop and dryout.
Apart from the thermal performance of minichannels, another important aspect is to use environmentally friendly refrigerants due to application of strict regulation to reduce ozone depletion and global warming from past decade onwards. To meet the future requirements, it is very impor-tant to understand the behaviour of potential environmentally friendly refrigerants which can replace HFCs. Therefore, experimental data of

D o c t o r a l T h e s i s / M . H . M a qb o o l
2
environmentally friendly refrigerants are needed to understand the flow boiling characteristics in minichannels and to develop new reliable pre-dicting methods. Some factors like low fluid inventory in minichannels than macro channels, environmental friendly refrigerants and also the charge minimization efforts in recent years help not only to develop compact and high performance thermal applications but also to address environmental concerns.
1 . 2 M a i n O b j e c t i v e s The main objective of this experimental study is to contribute to the un-derstanding of flow boiling heat transfer and pressure drop characteris-tics of ammonia and propane in minichannels. Single phase heat transfer and pressure drop experiments is not in focus in this thesis but such tests are done to validate instrumentation after modifications as single phase results on this test rig are already published by Owhaib (2007) using R134a as a working fluid.
Dryout data available in literature are mostly about water under sub-cooled conditions. To determine saturated dryout data of propane and also to determine the thermal limits of propane in minichannels is also an objective of this thesis.
Another objective is to compare flow boiling results of natural refriger-ants (ammonia and propane) with flow boiling results of HFC R-134a taken on the same test rig by Owhaib (2007) and Ali (2010) to see simi-larities and differences in flow boiling characteristics of potential alterna-tives of HFC refrigerants (ammonia and propane) and R134a.
To find reliable predicting methods among well-known mini and micro scale correlations for heat transfer, pressure drop and dryout, which can predict all experimental data of ammonia, propane and R134a, is also an objective.
The results are not aimed to any particular application and can be applied in compact heat exchangers within the refrigeration, heat pumps and electronics industries.
1 . 3 T h e s i s O r g a n i z a t i o n This thesis is organized in two parts: The first part is an extended sum-mary of the work done, supported by the second part containing the most important research articles that have been published or submitted to well-known research journals. The first chapter includes a general in-troduction, objectives and thesis structure. The literature survey of heat

D o c t o r a l T h e s i s / M . H . M a qb o o l
3
transfer, pressure drop and critical heat flux is presented in Chapter 2. Experimental set-up, instrumentation, data reduction, single phase fric-tion factor and heat transfer results of ammonia and propane and uncer-tainty analysis are discussed in detail in chapter 3. Chapter 4 shows the flow boiling heat transfer results of ammonia and propane. The effect of different parameters on the heat transfer coefficients of ammonia and propane is discussed in detail. The experimental heat transfer coefficients of ammonia and propane are also compared with well-known correla-tions. Two phase pressure drop results of ammonia and propane are re-ported in chapter 5. The effects of different parameters on two phase pressure drop of ammonia and propane and a comparison with general-ized correlations are also shown. Chapter 6 reports the dryout results of propane. The effect of mass flux, saturation temperature, internal diame-ter and vapour quality on dryout and a comparison of experimental data with well-known macro and micro scale correlations are presented. The experimental heat transfer, pressure drop and dryout results of ammonia, propane and R134a are compared in chapter 7. The flow boiling results of ammonia, propane and R134a are also compared with macro and mi-cro scale correlations of heat transfer, pressure drop and dryout. Finally, conclusions of the present work and future recommendations are pre-sented in chapter 8. Nomenclature and bibliography are reported after chapter 8.

D o c t o r a l T h e s i s / M . H . M a qb o o l
4
2 Literature Review
This chapter presents a state-of-the-art literature survey which was con-ducted to find information on the two phase heat transfer, pressure drop and critical heat flux in small diameter channels. Brief reviews of selected articles are presented below.
2 . 1 F l o w B o i l i n g H e a t T r a n s f e r When a liquid is exposed to a surface heated above the liquid saturation temperature then the liquid will boil. Boiling can be distinguished into two categories i.e. pool boiling and flow boiling. When a stationary liquid in contact with a heated surface boils, then it is called pool boiling and if the boiling liquid has velocity relative to the heated surface then it is called flow boiling. Flow boiling is in focus in this thesis and therefore it will be discussed in detail. Flow boiling can be categorised in two types as subcooled flow boiling and saturated flow boiling. Subcooled flow boiling occurs when the bulk liquid is subcooled and the heated surface is above saturation temperature and the bubbles formed on the heated surface cannot grow due to subcooling and collapse in the subcooled liquid. In case of saturated flow boiling, the bulk liquid is at saturation temperature and the bubbles form and grow depending on heat input to the heating surface.
Saturated flow boiling can be further categorised in two different mechanisms i.e. nucleate boiling and convective boiling. In nucleate boil-ing, heat is transferred through bubbles formed at the nucleation sites on the inner wall of the heated surface. In convective boiling, heat is trans-ferred through a thin liquid film between vapour and heated wall, and evaporation takes place without bubble nucleation at the liquid vapour interface. In nucleate boiling dominant flow boiling, the heat transfer co-efficient is expected to increase with increasing heat flux and saturation temperature but the effects of mass flux and vapour fraction are insig-nificant. On the other hand in convective boiling, the heat transfer coef-ficient is expected to increase with increasing mass flux and vapour frac-tion but to be almost independent of heat flux. The expected depend-ence of nucleate boiling and convective boiling on heat flux and mass flux respectively is reported by most authors in literature to determine what type of boiling is dominating, even though very few tests are done

D o c t o r a l T h e s i s / M . H . M a qb o o l
5
with glass tubes so that the actual nucleation of bubbles is visible and the "correct" type of boiling can be determined. Therefore, in the following chapters in thesis, nucleate and convective boiling are referred to the boiling types which are dependent on heat flux and mass flux respec-tively.
Lazarek and Black (1982) performed flow boiling experiments using R-113 in a round tube of 3.1 mm internal diameter. They concluded that the dominant mechanism was nucleate boiling while convective boiling mechanism was not observed. They developed a new correlation on the basis of 728 data points measured in the study.
Fukano and Kariyasaki (1993) performed experiments using air water mixture in 1, 2.4, 4.9 and 9 mm diameter tubes in different orientations to observe the isothermal adiabatic two phase flow. They concluded that the diameter range at which surface tension force becomes dominant over gravitational forces is from 5 mm to 9 mm. The film thickness was observed to decrease with the decrease of internal diameter.
Wambsganss et al. (1993) performed flow boiling experiments using R-113 in a 2.92 mm internal diameter horizontal test section. Heat flux was varied from 8.8 to 90.75 kW/m2 and mass flux from 50 to 300 kg/m2s. They concluded that the heat transfer coefficient was dependent on heat flux and independent of mass flux. The experimental data was compared with ten heat transfer correlations. The pool boiling correlation of Stephan and Abdelsalam (1980) and the flow boiling correlation of Laza-rek and Black (1982) were in good agreement with their experimental data.
Tran et al. (1996) investigated heat transfer in circular and rectangular channels of hydraulic diameters of 2.46, 2.40 and 2.92 mm using R-12 and R-113 as working fluids. Mass flux was varied from 44 to 832 kg/m2s and heat flux from 3.6 to 129 kW/m2. They concluded that the heat transfer coefficient was a function of mass flux and vapour quality for wall superheats lower than 2.75 K and for higher wall superheats, the heat transfer coefficient was dependent on heat flux. The results showed that the heat transfer coefficient increased with increase in saturation temperature. The heat transfer coefficients of circular and rectangular channels were found to be alike. They found dominance of the nucleate boiling regime over the convective boiling regime for all ranges of va-pour qualities. A new correlation was also proposed based on the nucle-ate dominant regime for small diameter channels.
Kew and Cornwell (1997) performed flow boiling experiments using R141b in small diameter channels ranging from 1.39 to 3.69 mm and of

D o c t o r a l T h e s i s / M . H . M a qb o o l
6
500 mm heated length. They concluded that the heat transfer coefficient was independent of heat flux and was a function of vapour quality as in conventional channels in the 3.69 mm and 2.87 mm test sections and for smaller diameters, the heat transfer coefficient was nucleate boiling dominant. They also modified the correlation of Lazarek and Black (1982) with the inclusion of the effect of vapour quality. Kew and Cornwell (1997) also introduced the Confinement number as a criterion to categorise the channel as macro or micro scale. The reported thresh-old value of Confinement number was 0.5. The channels having Con-finement number above 0.5 were considered as micro scale and the channels having Confinement number below 0.5 were considered as macro scale.
Bao et al. (2000) performed experiments using R11 and R123 as working fluids to measure the local heat transfer coefficients in a horizontal cop-per test section having a diameter of 1.95 mm. The heat flux was varied from 5 to 200 kW/m2 and the mass flux from 50 to 1800 kg/m2s. The heat transfer coefficient increased with increasing heat flux and the effect of mass flux on the heat transfer coefficient was insignificant.
Zhao et al. (2000) presented results of flow boiling of CO2 and R134a in a micro channel up to a vapour quality of 0.3. From the results, they ob-served very small effect of mass flux on heat transfer coefficient for both CO2 and R134a. The heat transfer coefficient of CO2 was found to be 200% higher than that of R134a.
Lin et al. (2001) performed two phase heat transfer experiments of R141b in a vertical channel of 1.1 mm internal diameter. Heat flux was varied from 18 to 72 kW/m2 and mass flux was 510 kg/m2s. They found dominance of nucleate boiling for low vapour quality values and for higher quality values, the heat transfer coefficient was found to be de-pendent on mass flux and vapour quality.
Sumith et al. (2003) studied flow boiling heat transfer of water in a 1.45 mm internal diameter (which is less than the Laplace constant) vertical test section. The local heat transfer coefficients were measured for mass fluxes ranging from 23.4 to 152.7 kg/m2s, heat flux ranging from 10 to 715 kW/m2 and for vapour qualities up to 0.8. Large heat transfer en-hancement, compared to the test sections having internal diameter more than the Laplace constant, was observed at low heat fluxes and the exist-ing heat transfer correlations under predicted the experimental data at least at low heat flux conditions. They concluded that liquid film evapo-ration was the dominant heat transfer mechanism.

D o c t o r a l T h e s i s / M . H . M a qb o o l
7
Huo et al. (2004) performed flow boiling experiments in vertical stainless steel tubes having internal diameters of 4.26 and 2.01 mm. For vapour qualities up to 0.5 in case of 4.26 mm tube and for vapour qualities up to 0.3 in case of 2.01 mm tube, the heat transfer coefficients increased with the increase of heat flux. For vapour qualities higher than these thresh-olds, a decrease in heat transfer coefficients was observed due to partial dryout.
Cortina-Diaz et al. (2005) conducted flow boiling experiments using wa-ter and hydrocarbons in mini and micro channels of hydraulic diameters ranging from 0.58 to 1.5 mm. Mass flux was varied from 25 kg/m2s to 350 kg/m2s and heat flux from 20 kW/m2 to 350 kW/m2 at saturation pressure of 0.3 MPa. The heat transfer coefficients of hydrocarbons were found to be dominated by nucleate boiling mechanism at low vapour qualities. The heat transfer coefficients of hydrocarbons were observed to decrease at higher vapour qualities due to partial dryout and an in-crease in the heat transfer coefficients of water, at higher vapour quali-ties, was observed due to the convective boiling mechanism.
Wen and Ho (2005) reported evaporation heat transfer and pressure drop characteristics of propane, butane and a mixture of R-290/R-600. The test section consisted of an inner smooth copper tube, 2.46 mm in inner diameter, 3.18 mm in outer diameter, and 3850 mm in length (each line). The test channel (460 mm × 350 mm ×120 mm) consisted of a three pass serpentine flow channel. Heat transfer coefficients and pres-sure drop characteristics are measured for a range of heat flux (5-21 kW/m2), mass flux (250-500 kg/m2 s) and quality (0-0.86). The results showed that the heat transfer coefficients for R-290 are 1.66-1.96 times greater as compared with those for R-134a under equal heat and mass fluxes.
Sobierska et al. (2006) performed flow boiling experiments of water in a vertical rectangular channel of 1.20 mm hydraulic diameter. Heat flux was varied from 22 to 101 kW/m2 and mass flux from 50 to 1000 kg/m2s. The results showed that the heat transfer coefficients increased with the increase of heat flux and a decreasing trend of the heat transfer coefficient was observed with the increase of vapour quality. From the flow visualisation results, three flow patterns were distinguished as bub-bly, slug and annular.
Owhaib et al. (2004) studied two phase heat transfer of R134a in vertical channels of diameters of 1.70, 1.224 and 0.826 mm. The experiments were conducted for mass fluxes ranging from 50 to 400 kg/m2s, heat flux ranging from 3 to 34 kW/m2 and at two saturation temperatures, 24 and 34 °C. They observed strong dependence of the heat transfer coeffi-

D o c t o r a l T h e s i s / M . H . M a qb o o l
8
cient on heat flux up to the occurrence of partial dryout after which de-terioration of heat transfer was observed.
Madrid et al. (2007) studied heat transfer of HFE-7100 in a rectangular vertical mini channel of 0.840 mm hydraulic diameter. The heat flux was varied from 1 to 6.2 kW/m2 and mass flux from 69 to 194 kg/m2s at saturation temperature of 61°C. They observed no effect of heat flux on the heat transfer coefficient and therefore convective boiling was stated as the dominant heat transfer mechanism. The deterioration in heat transfer coefficient at higher vapour qualities was observed due to the occurrence of dryout.
Choi et al. (2009) performed experiments to investigate the flow boiling of propane in horizontal minichannels of 1.5 and 3.0 mm internal diame-ters. At medium and high quality, influence of mass flux on heat transfer coefficient was significant while at low vapour quality, it was insignifi-cant. Contrary to the influence of the mass flux on the heat transfer co-efficient, higher heat flux at low vapour quality resulted in higher heat transfer while heat flux had insignificant effect at medium and high qual-ity on the heat transfer. A new heat transfer correlation based on the su-perposition model was presented which predicted their experimental data with 10 % MAD (Mean Absolute Deviation).
Ong and Thome (2011b) reported experimental heat transfer data for R134a, R236fa and R245fa in single, horizontal channels of 1.03, 2.20 and 3.04 mm diameters over a range of experimental conditions. They reported convective boiling as the dominant heat transfer mechanism at higher vapour qualities because of the monotonically increase of the heat transfer coefficient with vapour quality. At low vapour qualities in the slug flow (coalescing bubble dominated regime) for channels of high confinement (1.03 mm) , a decrease in the heat transfer coefficient was reported, explained as an indication of thin film evaporation with dry patch formation and rewetting. By setting the dryout thickness to the measured surface roughness, the three zone model by Thome et al. (2004) was observed to yield accurate predictions.
Pamitran et al. (2011) performed heat transfer experiments using pro-pane, ammonia and CO2 in single circular horizontal small tubes of 1.5 and 3 mm internal diameter. The tests were conducted for a quality range from 0 to 1, mass flux from 50 to 600 kg/m2s, heat flux from 5 to 70 kW/m2, and saturation temperatures from 0 to 10 °C. They concluded that mass flux and vapour quality had an insignificant effect on the heat transfer coefficient in the low quality region. In the moderate quality re-gion, the heat transfer coefficient increased with mass flux and vapour quality. In the high quality region, a decrease in the heat transfer coeffi-

D o c t o r a l T h e s i s / M . H . M a qb o o l
9
cient was observed and with the increase of mass flux, this decrease in the heat transfer coefficient starts earlier at a lower vapour quality. A strong dependence of the heat transfer coefficient on heat flux was ob-served in the low quality region. Among the correlations tested, Shah correlation (1982) gave best predictions. A new correlation based on the superposition model was proposed which predicted the experimental data of ammonia, propane and CO2 with MAD of 19.81 %.
From the literature review, it is clear that flow boiling studies of ammo-nia and propane in small diameter channels are scarce. The reported flow boiling studies in the past decade presented different results and there-fore still it is not clear about the governing phenomena in mini and mi-cro channels. The flow boiling experiments with wide variety of fluids especially environmental friendly refrigerants should be conducted in minichannels to understand the governing phenomena.
2 . 2 C r i t i c a l H e a t F l u x The generic term Critical Heat Flux (CHF) is normally used in literature for the upper limit of steady state operation. In heat flux controlled situations, critical heat flux can occur either due to departure from nucle-ate boiling (DNB) or due to dryout. In nucleate boiling dominant heat transfer mechanism at high heat fluxes, critical heat flux can occur due to departure from nucleate boiling (DNB) in highly subcooeld inlet condi-tions or at low vapour quality in saturated conditions because of the formation of hot spots or temperature excursions. Whereas, critical heat flux due to dryout appears at high vapour fractions, independently of heat flux, when there is not sufficient liquid left to fully wet the walls of the channel. At dryout, the wall temperature starts increasing due to the fact that heat transfer is deteriorated. In this thesis the term dryout will be used which is more appropriate for this study. In designing a two phase compact applications, it is necessary to know the dryout limit for a secure and efficient operation of the system.
Bergles (1963) performed experiments to observe the effects of pressure, length, diameter and mass flux on burnout in small diameter tubes using distilled water as working fluid. It was observed that the maximum heat flux increases with the increase of pressure, with the decrease of diame-ter and with the decrease of heating length.
Lazarek and Black (1982) presented CHF results using R113 as a work-ing fluid in a vertical circular mini channel of 3.15 mm internal diameter and heated lengths of 123 and 246 mm. It was observed that CHF oc-curred due to dryout of liquid film at the exit of the test section. A new

D o c t o r a l T h e s i s / M . H . M a qb o o l
10
CHF correlation was presented which predicted their experimental re-sults with 5% MAD.
Bowers and Mudawar (1994) presented CHF of R113 in an array of cir-cular mini and micro tubes of 2.54 mm and 0.51 mm internal diameters respectively. They reported that the frequency of droplet impact with the small diameter channel wall was higher than with the large diameter channel wall, and that the increased frequency could delay the critical heat flux. They also reported that the critical heat flux could also be de-layed due to the heat conduction away from the dryout initiation point. No effect of inlet subcooling on CHF was found which was contrary to previous studies found in the literature.
Celata et al. (1997) performed subcooled flow boiling critical heat flux experiments using water as a working fluid in stainless steel tubes of di-ameters ranging from 0.25 to 4 mm. They reported increase of critical heat flux with the decrease of internal diameter until a certain value, and then no effect of channel diameter was observed. They also reported no influence of channel wall thickness on CHF.
Qu and Mudawar (2004) performed critical heat flux experiments using de-ionized water as a working fluid in 21 parallel 215×821 μm channels. They reported insignificant effect of inlet temperature on the critical heat flux and an increase in critical heat flux with the increase of mass flux was observed. A new correlation was proposed based on Katto and Ohno (1984) correlation.
Wojtan et al. (2006) presented critical heat flux data for 0.5 and 0.8 mm internal diameter mini channels using R134a and R245fa as working flu-ids. The critical heat flux (CHF) was found to increase with the increase of mass flux and no effect of inlet subcooling was observed on CHF. The comparison of experimental data with well-known correlations showed that Katto and Ohno (1984) correlation predicted the data best, with MAD of 32.8 %. Based on Katto and Ohno (1984) correlation, a new correlation was suggested which predicted their experimental data with a MAD of 7.6 %.
Zhang et al. (2006) analysed the predicting capability of the existing CHF correlations on the basis of a large data bank of subcooled and saturated flow boiling data of water in small diameter tubes. Shah correlation (1987) for saturated flow boiling data and Hall and Mudawar (1999) for subcooled flow boiling data were found to be the best predicting models among the tested correlations. Also on the basis of their analysis, a new CHF correlation was proposed.

D o c t o r a l T h e s i s / M . H . M a qb o o l
11
Qi et al. (2007) performed flow boiling experiments using liquid nitrogen as a working fluid in four mini and micro channels of 0.531, 0.834, 1.042 and 1.931 mm internal diameter. They observed a gradual decrease in CHF with the decrease in internal diameter and the decrease of mass flux.
Kosar and Peles (2007) investigated CHF in a silicon based micro chan-nel heat sink. They observed an increase of CHF with increase in mass flux and with decrease in exit quality. CHF was also reported to increase with an increase in reduced pressure up to 0.086, then to decrease for higher reduced pressures. A new correlation was developed which cap-tured the CHF trends of this experimental study with a MAD of 3.8 %. Callizo et al. (2010a) performed experiments to study dryout behaviour, using R134a, R245fa and R22 as working fluids in a vertical circular mi-cro channel of 0.64 mm internal diameter. It was found that the satura-tion temperature had small effect on the dryout heat flux for all working fluids while dryout heat flux was observed to increase with the increase in mass flux. Among tested CHF correlations, Katto and Ohno (1984) correlation predicted their experimental results well, with a MAD of 6.7 %.
Revellin and Thome (2009) investigated the effect of different parame-ters like mass flux, heated length, inlet subcooling, internal diameter and saturation temperature on CHF using R134a, R245fa, R236fa, FC-72 and water as working fluids. They concluded that CHF can be increased by increasing inlet subcooling, increasing mass flux, increasing internal di-ameter and decreasing saturation temperature.
Ali and Palm (2011b) performed experiments to determine dryout heat flux in vertical circular minichannels with internal diameters of 1.22 mm and 1.70 mm with uniformly heated length of 220 mm using R134a as working fluids. The dryout heat flux was observed to increase with mass flux and to decrease with the decrease in tube diameter. The saturation temperature had small influence on the dryout heat flux. The experimen-tal results were compared with CHF correlations available in literature where Bowring correlation (1972) gave the best prediction with a MAD of 13 %.
Ong and Thome (2011b) reported CHF data acquired for R134a, R236fa and R245fa in single, horizontal channels of 1.03, 2.20 and 3.04 mm in-ternal diameter. The experimental CHF increased with the increase of mass velocity, slightly decreased with the increase of saturation tempera-ture and increased with the increase of channel confinement. No influ-ence of inlet subcooling was observed for the experimental conditions
D o c t o r a l T h e s i s / M . H . M a qb o o l
12
tested. A new CHF correlation was proposed involving the confinement number, Co that was able to predict current CHF data and CHF data of other five authors generally within MAD of 15%. The reported literature clearly shows that mostly CHF studies have been performed with water and R134a. CHF results reported in the literature show that there are differences among researchers about the effect of different parameters like pressure, inlet subcooling, diameter etc. How-ever, according to the reported literature, most of the authors agree that CHF increases with the increase of mass velocity and with the decrease of heated length. There is a dire need to perform experiments in mini channels using a wide range of fluids to understand CHF characteristics and make a generic conclusion about the effect of different parameters on CHF.
2 . 3 T w o P h a s e P r e s s u r e D r o p Two phase pressure drop estimation is a key parameter in the design of mini and micro channel evaporators. Despite many advantages of using mini channels, the disadvantage may be higher pressure drop if the sys-tem is not designed properly. To get higher heat transfer without increas-ing pressure drop is a major research task for micro geometries. Minichannels provide an opportunity to get higher heat transfer without much of an increase in pressure drop if the system is designed properly. The total two phase pressure drop comprises of three components, gravitational, acceleration and frictional pressure drop. The gravitational and acceleration pressure drop can be determined by formulas available in the literature and there is no disagreement between sources. The fric-tional pressure drop in small diameter channels has been investigated in recent years and also in this study and to estimate the frictional pressure drop; many predicting models have been developed.
Two widely used models to estimate two phase pressure drop are homo-geneous model and separated flow model. In the homogeneous model, the two phases are assumed to move with the same velocity as a single phase with average properties while in the separated flow model, the two phases are assumed to move with different velocities. Moreover, for the separated flow model there are different forms of equations while for the homogeneous model, the equations are same with different definitions of viscosity. The equations of both flow models (homogeneous and separated) can be seen in paper 2 appended at the end of this thesis.
Ungar and Cornwell (1992) performed flow boiling experiments to in-vestigate two phase pressure drop of ammonia in mini and micro chan-nels. A range of horizontal test sections of diameters 1.46, 1.78, 2.58 and
D o c t o r a l T h e s i s / M . H . M a qb o o l
13
3.15 mm were used. The two phase frictional pressure drop data were compared with several macro scale correlations. Apart from the homo-geneous model with the viscosity definition of McAdams et al. (1942), none of the macro scale correlations predicted the data well.
Mishima and Hibiki (1996) measured the two phase pressure drop for air water flow in capillary tubes with diameters ranging from 1 to 4 mm and lengths ranging from 210 to 1000 mm. They observed that the Chis-holm’s constant depends on tube inner diameter where it decreases when the diameter decreases. They proposed a new micro scale correlation by modifying the Lockhart and Martinelli correlation (1949) by introducing a new model for the Chisholm parameter. The new proposed correlation is applicable for vertical and horizontal channels of circular and rectan-gular geometry.
Chang and Ro (1996) measured pressure drop in two copper tubes hav-ing internal diameters of 1.2 and 1.6 mm. In their experiments, pure re-frigerants R32, R125, R134a and their mixtures were used as test fluids. The influence of relative roughness on the frictional factor in small di-ameters was investigated. Haaland (1983) equation was used to include relative roughness for the determination of friction factor. Because of the roughness, the friction factor was observed to increase by 12% at the maximum. For the same vapour quality, the two phase frictional multi-plier of R134a was observed to be larger than other fluids. They com-pared their experimental data with existing predicting models and found that among them, the homogeneous model with the viscosity definition of Cicchitti (1960) well predicted their experimental results.
Triplett et al. (1999) investigated void fraction and pressure drop in hori-zontal circular and semi-triangular (triangular with one corner smoothed) micro channels ranging from 1 to 1.5 mm. The experimental data were compared with widely used correlations of void fraction and pressure drop and among them; the homogeneous model predicted the pressure drop data well for bubbly and slug flow. The two phase pressure drop in annular flow was over predicted by the tested correlations.
Tran et al. (2000) performed two phase pressure drop experiments using R134a, R12 and R-113 as working fluids. The experiments were per-formed in two circular channels of 2.46 and 2.92 mm and one rectangu-lar channel (4.06×1.7 mm). The experiments were performed at six satu-ration pressures with mass fluxes ranging from 33 to 832 kg/m2s and heat fluxes ranging from 2.2 to 129 kW /m2. The experimental results were compared with five macro scale correlations. Some of the correla-tions satisfactorily predicted the experimental data at low mass fluxes but none of the correlations predicted the experimental data well at all ex-

D o c t o r a l T h e s i s / M . H . M a qb o o l
14
perimental conditions. They also proposed a correlation which predicted the experimental data with MAD of 12.8 %.
Kabelac and Buhr (2001) performed flow boiling experiments with am-monia in smooth and low finned horizontal test sections of 10 mm in-ternal diameter and a heated length of 450 mm. The test conditions were; mass flux range 50 to 150 kg/m2s, vapour quality range 0 to 0.9, satura-tion temperatures range -40 to 4 °C and a heat flux range of 17 to 75 kW/m2. It was observed that at the same test conditions, the pressure drop of the finned test section was about 50 % higher than for the smooth tubes. They compared their experimental data of smooth and finned tubes with many correlations. Among all the prediction methods used, Chisholm (1973) correlation was found to be in best agreement with their experimental data.
Zhang and Webb (2001) measured two phase pressure drop in two cop-per tubes with hydraulic diameters ranging from 2.16 to 6.20 mm and heating lengths ranging from 560 to 914 mm. Mass flux was varied from 200 to 1000 kg/m2s. The two phase pressure drop was observed to in-crease with the increase of mass flux and vapour quality and with the de-crease of saturation pressure. A new micro scale correlation based on different property groups was also proposed.
Yu et al. (2002) studied two phase pressure drop of water in a 2.98 mm horizontal circular test section. The experiments were conducted for a saturation pressure of 200 kPa and for mass fluxes ranging from 50 to 200 kg/m2s. An increase in the two phase multiplier with an increase in mass flux and vapour quality was observed. The experimental data were over predicted by Chisholm correlation (1973) and therefore a modified form of this correlation was proposed which predicted their experimen-tal data well.
Qu and Mudawar (2003) investigated two phase pressure drop of water in a multi-channel heat sink with a hydraulic diameter of 0.35 mm. Mass flux was varied from 135 to 400 kg/m2s at a saturation pressure of 1.17 bar. The experimental data were over predicted when compared with six widely used correlations. They proposed a new correlation by incorporat-ing the effects of mass flux and internal diameter. Wen and Kenning (2004) measured two phase pressure drop of water in a vertical rectangular channel 2×1 mm. Mass flux was varied from 57 to 211 kg/m2s and heat flux from 25 to 105 kW/m2. Among the correla-tions tested, Lockhart and Martinelli correlation (1949) well predicted their data while the predictability of other correlations was poor.

D o c t o r a l T h e s i s / M . H . M a qb o o l
15
Revellin and Thome (2007) measured two phase adiabatic pressure drop of R134a and R245fa in two horizontal circular test sections of 0.509 and 0.790 mm internal diameter. The experiments were conducted at mass fluxes ranging from 210 to 2094 kg/m2s and at three saturation tempera-tures, 26, 30 and 35 °C. The two phase pressure drop was observed to increase with the increase of mass flux, with the increase of vapour qual-ity, with the decrease of saturation temperature and with the decrease of internal diameter. The pressure drop in turbulent region is well predicted by Müller Steinhagen correlation (1986).A new prediction method have been proposed which predicted 96 % of the experimental data within ±30% range. They also validated this new prediction method with data from literature.
Dutkowski (2009) measured two phase pressure drop of air-water in eight circular channels with diameters ranging from 1.05 to 2.3 mm. Mass flux was varied from 139 to 8582 kg/m2s. The experimental data were compared with conventional correlations and it was concluded that corrections and modifications were required in order to use them for minichannels.
Megahed and Hassan (2009) measured two phase pressure drop in a sili-con micro channel using FC-72 as working fluid. Experiments were con-ducted for mass flux ranging from 341 to 531 kg/m2 s and heat flux ranging from 60.4 to 130.6 kW/m2. The frictional two phase pressure drop was found to increase with exit quality for constant mass flux. They developed a new correlation which predicted their experimental data with MAD of 10.4 %. As can be seen from the literature review, two phase pressure drop data of ammonia and propane in minichannels are scarce. The data available in the literature are largely related to air and water. Most of the research-ers agree that the two phase pressure drop increases with the increase of mass flux, with the decrease of saturation pressure and with the decrease of hydraulic diameter. Generally Lockhart and Martinelli (1949) and Müller Steinhagen and Heck (1986) are reported as reliable prediction models. Most of the predicting models developed for mini and micro channels are the modified forms of Lockhart and Martinelli (1949) corre-lation with different definitions of Chisholm parameter. Still there is lack of consensus in research community about the reliable predicting models and also about the influence of different parameters on the two phase pressure drop. To design compact heat exchangers, there is a need to es-timate the two phase pressure drop in compact evaporators. Therefore, two phase pressure drop experiments need to be performed with a wide variety of fluids to develop reliable predicting models to estimate two phase pressure drops precisely.

D o c t o r a l T h e s i s / M . H . M a qb o o l
16
3 Experimental and Analytical Approach
The test facility, initially, was constructed by Owhaib (2007) to perform the flow boiling experiments of R134a in single vertical mini and micro channels. At the start of the current project, firstly the test facility was modified. All brass or copper parts in the test rig, the condenser and the subcooler were replaced to make the test rig compatible for flow boiling experiments of ammonia. The details of the test facility, instrumentation, uncertainty analysis, data reduction and single phase results are presented in this chapter.
3 . 1 E x p e r i m e n t a l S e t - U p The schematics of the experimental test rig and a photo of experimental setup are shown in Figure 3.1 and 3.2 respectively. The experimental set-up consists of a closed loop: the subcooler, the magnetic gear pump, the coriolis mass flow meter, the pre heater, the test section and the con-denser. The subcooler subcools the refrigerant by about 10 °C to reduce the risk of cavitation at the suction of the magnetic gear pump. The sub-cooled refrigerant flows to the inlet of the magnetic gear pump (IS-MATEC, type MCP-Z standard). The mass flow rate is controlled by ad-justing the speed of the pump and is measured by one of the two mass flow meters. The refrigerant from the mass flow meter enters the pre heater where it is heated up to maintain the desired inlet temperature at the inlet of the test section. The pre heater consists of a heating coil which is wound around the stainless steel tube in which refrigerant flows. The power is applied to the heating coil which heats up the wall of the stainless tube and the refrigerant inside. Before the entry of the test sec-tion, a filter of 7 micrometers is installed to restrict any particles to enter the test section. The refrigerant absorbs heat when it passes through the test section. After passing through the test section, the refrigerant enters the condenser where it condenses and enters the subcooler to complete the loop. The system pressure is maintained by a tank connected to the main loop placed in a water bath whose temperature is maintained by a thermostat.

D o c t o r a l T h e s i s / M . H . M a qb o o l
17
The system pressure is measured by an absolute pressure transducer (Druck PDCR 4060, 20 bar). Two differential pressure transducers (Druck PDCR 2160, 350 and 700 mbar) are used to measure pressure drop across the test section. The refrigerant temperature at the inlet and the outlet of the test section is measured by T-type thermocouples. The stainless steel test section is heated by passing an electric current through it from a DC power supply (Joule effect). ). The test rig is insulated by 20 mm closed cell foam insulation to prevent heat loss to the surroundings. The outer wall temperatures at several locations along the test sections are measured by T-type thermocouples attached to the outer wall of the test sections using a special epoxy which is thermally conductive and electrically insulating.
Figure 3.1. Schematic representation of experimental set up

D o c t o r a l T h e s i s / M . H . M a qb o o l
18
3 . 2 D e t a i l s o f t h e T e s t S e c t i o n s Two stainless steel (AISI 316) circular test sections have been used with inner diameters of 1.70 mm and 1.224 mm and 245 mm in heated length. A glass tube of the same diameter as the test section is inserted before and after the test section to visualize the flow regime and to insulate the test section electrically from the rest of the test rig.
Figure 3.2. Picture of test facility The inner diameters of the test sections are determined by using an ana-lytical balance (Mettler Toledo AX205) of high accuracy. First the weight of the empty test section is determined and then this procedure is re-peated after filling it with distilled water. The mass difference of empty

D o c t o r a l T h e s i s / M . H . M a qb o o l
19
and filled test section is divided by the density of distilled water to find the inner volume of the test section. The diameter of the test section is calculated by assuming cylindrical shape of the test section. The average value obtained after several measurements is used as tube diameter. The roughnesses of the test sections are determined by scanning the inner surface using a method called conical stylus profilometry. Five profiles of the inner surface of each test section are obtained. The scanned struc-tures of the inner surface of each of the test sections are shown in Fig-ures 3.3 and 3.4. It is observed that the inner surface of the 1.70 mm tube is smoother than that of the 1.224 mm diameter tube.
Figure 3.3. Inner surface roughness of D=1.70 mm
Figure 3.4. Inner surface roughness of D=1.224 mm

D o c t o r a l T h e s i s / M . H . M a qb o o l
20
1.700 mm 1.224 mm
Figure 3.5. SEM images of the two test tubes of D=1.700 mm and D=1.224 mm.
The details of the roughness test results are shown in table 3.1 where Ra represents the arithmetic mean roughness, Rv the maximum valley depth and Rp is the maximum peak height. The scanning electron microscope (SEM) analysis of two test sections can also be viewed in Figure 3.5. Table 3.1. Roughness details of test sections
Tube Inner Dimension Ra (μm) Rv (μm) Rp (μm)
1.70 mm 0.21 -0.73 0.80
1.224 mm 2.55 -5.08 9.58
3 . 3 D a t a R e d u c t i o n The heat flux added to the test section q´´ is calculated as;
´´ (3.1)
Where I and V represents current and voltage and A π Di L is the heat transfer area.
3.3.1 D a t a R e d u c t i o n i n S i n g l e P h a s e The single phase heat transfer coefficient is calculated as;
´´
, , (3.2)
Twi,z is the inner wall temperature and Tf,z is the fluid temperature at any axial location z. The inner wall temperature at any location z can be cal-

D o c t o r a l T h e s i s / M . H . M a qb o o l
21
culated from the measured outer wall temperature by the one dimen-sional heat conduction equation and mathematically it can be written as;
, , (3.3) Where
The fluid temperature was calculated from the heat added to the fluid as:
, (3.4)
The difference between the individual local single phase heat transfer co-efficient values was always less than 12%. The average heat transfer coef-ficient is determined by averaging local heat transfer coefficients arith-metically. The dimensionless Nusselt number is calculated from the single phase heat transfer coefficient using equation;
(3.5)
The measured single phase pressure drop includes the frictional pressure drop and minor pressure drops (pressure losses. at inlet and exit of the test section and due to developing flow). The procedure to calculate mi-nor pressure losses can be seen in text book by Kandlikar et al. (2006). The pressure line is cooled by tap water to ensure liquid in the pressure line. The single phase gravitational pressure drop is compensated by the liquid column in the pressure line.
The experimental single phase friction factor is calculated from the pres-sure drop obtained after subtracting the minor pressure drops from the measured pressure drop using Darcy Weisbach equation as;
∆ · ··
(3.6)
The friction factor obtained is compared with the friction factor for conventional channels, calculated using Hagen-Poiseuille equation for the laminar region and with Blasius (1913) equation for the turbulent flow,
(3.7)

D o c t o r a l T h e s i s / M . H . M a qb o o l
22
.. (3.8)
3.3.2 D a t a R e d u c t i o n i n T w o P h a s e The local boiling heat transfer coefficient is calculated according to New-ton’s law of cooling given below;
, , (3.9)
Twi,z is the inner wall temperature at location z and is calculated from the outer wall temperature as mentioned in equation 3.3. Tsat,z is the local saturation temperature obtained from the corresponding pressure, calcu-lated from the measured inlet pressure and pressure drop along the tube, assuming a linear profile of pressure drop along the whole test section. The assumption of linear profile of pressure drop along the test section is justified and will not affect the results appreciably as the ratio of the drop in saturation temperature (because of pressure drop) and the tem-perature difference between wall and saturation is very small (varies from 1% to 6% in most of the cases and up to 10% for some cases at the highest pressure drops). The average heat transfer coefficient is determined by averaging local heat transfer coefficients arithmetically. The vapour quality at any vertical location z is determined from the inlet condition and the heat transferred to the fluid as;
· · · °
· · (3.10)
Where ° is the location where saturation conditions along the test section are reached, determined as; ° ·
· · (3.11)
The measured pressure drop is the sum of inlet contraction, outlet ex-pansion, two-phase flow and inlet single phase flow pressure drops. ∆ ∆ ∆ ∆ ∆ (3.12)
Where ∆ represents the pressure drop due to two phase flow and it includes frictional, gravitation and acceleration part;

D o c t o r a l T h e s i s / M . H . M a qb o o l
23
∆ ∆ ∆ ∆ (3.13)
All components in equations 3.12 and 3.13 except ∆ can be de-termined from the expressions available in the literature. Also the reader is referred to Paper 2 appended in the thesis for further details.
3 . 4 I n s t r u m e n t a t i o n a n d i t s S y s t e m a t i c U n c e r t a i n t i e s
The measuring instruments and their uncertainties are described in this section. Mostly the instrumentation is the same as described in Owhaib (2007), Martin-Callizo (2010b) and Ali (2010). The reader is referred to the references mentioned for details if missing.
3.4.1 D a t a a c q u i s i t i o n Data acquisition is done by using an Agilent data logger (34970A) with multiplexers (34901A). The data is recorded after reaching steady state condition (except near dryout). The signal from the data logger is sent to a computer in which a HP-VEE programme is used as interface soft-ware. The data is saved in Excel for further calculations. For each data point, the data is recorded with a frequency of 0.3 Hz for almost 5 min-utes. The average values of the recorded data and their corresponding standard deviations are used as nominal values of each data point in the calculations. All the fluid thermodynamic and transport properties are calculated using Refprop 7 developed by NIST(2002). The uncertainty in thermo physical properties is assumed to be 2 %.
3.4.2 P r e s s u r e m e a s u r e m e n t s The system pressure is measured by an absolute high performance pres-sure transducer (PDCR 4060, Druck) with an output voltage range of 0 -100 mV and an absolute pressure range of 0-20 bar. The accuracy as per manufacturer´s data sheet is 0.04% of full scale (included combined ef-fects of non-linearity, hysteresis and repeatability). The pressure drop across the test section is measured by two differential pressure transduc-ers (PDCR 2160, Druck). One differential pressure transducer is of 0-350 mbar range, output voltage range 0-50 mV and of 0.06% of full scale accuracy and the other differential pressure transducer is of 0-700 mbar range, output voltage range 0-100 mV and of 0.05% of full scale accu-racy. All the pressure transducers are calibrated by using pressure calibra-tor (DPI 603, Druck). The error associated with the data logger is 0.004% in case of PDCR 4060 and 0.008% in case of PDCR 2160. Both high and low pressure sides of the differential pressure transducer are

D o c t o r a l T h e s i s / M . H . M a qb o o l
24
connected by a 2 mm internal diameter stainless steel tube (pressure line). To ensure liquid in case of single phase tests and vapour in case of flow boiling tests in the pressure line, a large diameter plastic pipe con-centric to the pressure line containing tap water (cold in case of single phase and hot in case of two phase) is provided. The systematic uncer-tainties are conservatively taken as ±10 mbar in case of absolute pressure reading and ±1 mbar in case of differential pressure readings.
3.4.3 M a s s f l o w r a t e m e a s u r e m e n t s The flow rate through the test loop is measured by two coriolis flow me-ters. To improve the accuracy in flow rate, flow rates lower than 0.25 g/s is measured by Cori flow M52 (by Bronkhorst Cori-Tech BV) and flow rates higher than 0.25 g/s is measured by a Micro Motion, DS006 flow meter from Emerson. As can be seen from Figure 3.6, the stated accu-racy of Cori flow is 0.5 % of the flow rate for all flow rates in the range and the accuracy of the Micro-Motion flow meter is 0.15% of the flow rate at the highest flow rates used, but increases to about 1% of the flow at the lowest flow rates for which it was used. The combined systematic uncertainty in the measured range of experiments includes also the measurement uncertainty associated with data logger (±1 % of the read-ing in the worst case), accuracy of the flow meters (maximum ±1 % of the reading in the operating range) and the uncertainty in conversion from current to flow rate (±0.04 %). The combined uncertainty in mass flow rate is conservatively taken as ±3 %.
3.4.4 P o w e r i n p u t m e a s u r e m e n t s The heat input to the stainless steel test sections is given by Joule effect. The power is applied by a high current low voltage power supply (Man-son SPS-9600) and is controlled by the Agilent data logger. The accuracy of the power supply as per manufacturer´s data is ± (1%+1count) of the reading. The voltage is measured separately with a more accurate digital meter (Gw-Instek GDM 8246) to improve accuracy. The accuracy of the digital meter for voltage is ±0.02 % of the reading.
3.4.5 T e m p e r a t u r e m e a s u r e m e n t s The wall temperatures are measured by T-type thermocouples. The fluid temperatures at different points in the test rig are measured by stainless steel sheathed thermocouples. Before installation, these thermocouples are calibrated in an ice bath for at least 12 hours and are found to be fluctuating within ±0.1°C. A Pt-100 (Platinum resistance sensor) is

D o c t o r a l T h e s i s / M . H . M a qb o o l
25
Figure 3.6. Mass flow meter accuracy in percentage.
used to measure the reference temperature. The cold junctions for all thermocouples are placed in an isothermal metal block as suggested by Palm (1991). The errors due to conversion from voltage to temperature are ±0.001°C and the error due to the resolution of the data logger is ac-cording to the manufacturer (Agilent Technologies) ±0.024°C. The sys-tematic uncertainty for temperature measurement including error due to calibration is taken conservatively as ±0.1°C.
3 . 5 U n c e r t a i n t y A n a l y s i s The uncertainty represents the quality of the measured value. The meas-ured value along with its uncertainty shows the range where the true measured value can exist. The uncertainty analysis is done with the help of EES (Engineering Equation Solver) software. EES uses the uncer-tainty propagation method suggested by Taylor and Kuyatt (1994). A brief description of the uncertainty calculation according to this method is given in the following paragraph.
The uncertainty of the result of a measurement may be grouped into two categories (Type A and Type B uncertainty). Type A uncertainty also called random error is not repeatable and is usually evaluated by statisti-cal methods and Type B uncertainty also called systematic error is evalu-
D o c t o r a l T h e s i s / M . H . M a qb o o l
26
ated by other means (previous measurement data, manufacturer’s speci-fications, calibration data etc.).
As by BIPM/ISO (International Bureau of Weights and Meas-ures/International Organisation for Standardization), Type A and Type B uncertainities may be considered to be independent and the combined uncertainty can be calculated as;
(3.14)
In many cases a measurand y is not measured directly but is measured from N other quantities through a functional relation ƒ as;
y ƒ x , x , …………… . . , xN (3.15)
The combined standard uncertainty of the measurement result y, desig-nated by uy is the positive square root of the estimated variance obtained from;
u ∑ ƒN u x 2∑ ∑ ƒ ƒ u x , xNN (3.16)
Equation 3.16 is based on a first order Taylor series approximation and is conveniently referred to as the law of propagation of uncertainty.
To be confident of the interval within which the measurand is believed to lie, a term expanded uncertainty is usually used and can be obtained by multiplying the combined uncertainty with the coverage factor k as;
U k u (3.17)
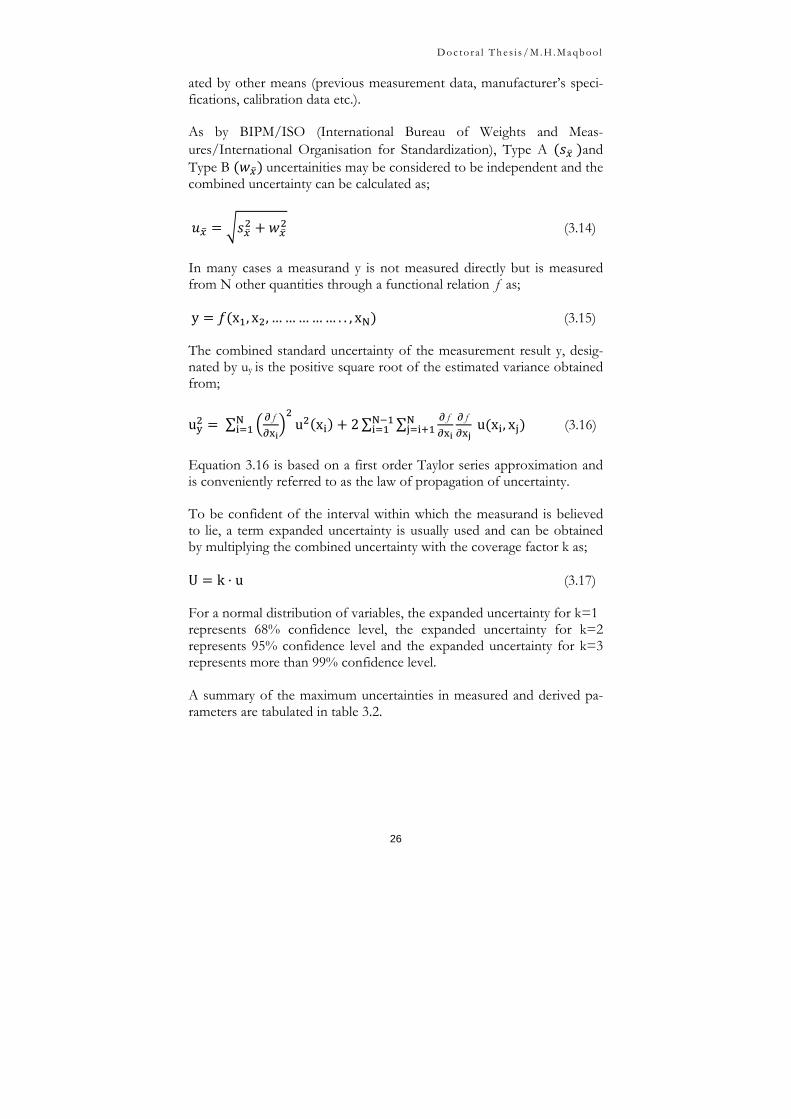
For a normal distribution of variables, the expanded uncertainty for k=1 represents 68% confidence level, the expanded uncertainty for k=2 represents 95% confidence level and the expanded uncertainty for k=3 represents more than 99% confidence level. A summary of the maximum uncertainties in measured and derived pa-rameters are tabulated in table 3.2.
D o c t o r a l T h e s i s / M . H . M a qb o o l
27
Table 3.2. Summary of uncertainties in experimental parameters
Parameter Uncertainty
Diameter 1.224±0.0095 mm, 1.700±0.0070 mm
Absolute pressure ±10 mbar
Differential pressure ±1 mbar
Wall temperature ± 0.1 °C
Saturation Temperature ± 0.2 °C
Mass flux ± 3.5 %
Heat flux ± 3 %
Vapour quality ± 6 %
Heat transfer coefficient ± 12 %
3 . 6 S i n g l e P h a s e R e s u l t s To validate the test section and instrumentation, single phase tests were performed by Owhaib (2007) using R134a as working fluid and good agreement of single phase heat transfer and pressure drop results with classical theory was observed. The reader is referred to the reference given for more details. Since the test section was modified to run tests with ammonia and propane, the single phase tests were performed just to confirm the validity of classical correlations after modifications prior to two phase tests with ammonia and propane.
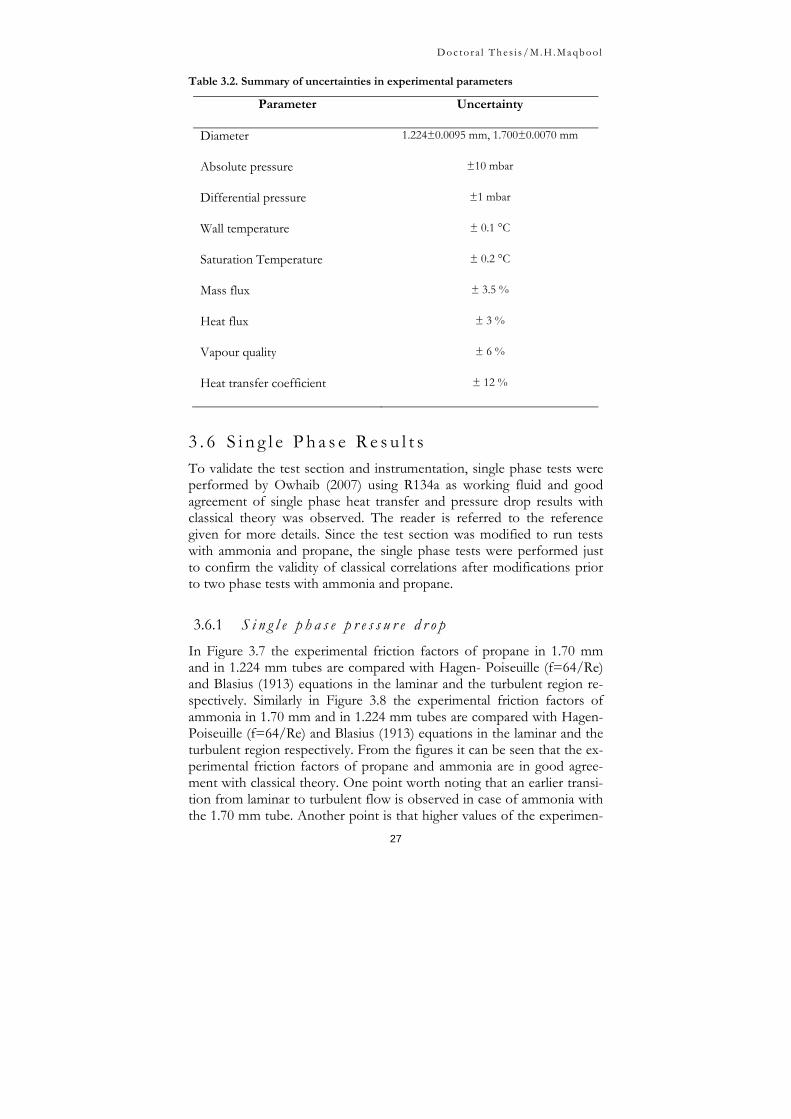
3.6.1 S i n g l e p h a s e p r e s s u r e d r o p In Figure 3.7 the experimental friction factors of propane in 1.70 mm and in 1.224 mm tubes are compared with Hagen- Poiseuille (f=64/Re) and Blasius (1913) equations in the laminar and the turbulent region re-spectively. Similarly in Figure 3.8 the experimental friction factors of ammonia in 1.70 mm and in 1.224 mm tubes are compared with Hagen- Poiseuille (f=64/Re) and Blasius (1913) equations in the laminar and the turbulent region respectively. From the figures it can be seen that the ex-perimental friction factors of propane and ammonia are in good agree-ment with classical theory. One point worth noting that an earlier transi-tion from laminar to turbulent flow is observed in case of ammonia with the 1.70 mm tube. Another point is that higher values of the experimen-
D o c t o r a l T h e s i s / M . H . M a qb o o l
28
tal friction factors than expected are observed in the laminar region near transition for both fluids and this effect is more pronounced with the 1.70 mm tube than with the 1.224 mm tube. These discrepancies can be explained by the influence of the hydrodynamic entry length which is larger for larger diameter channels. Celata (2004) also reported that ex-perimental friction factors at Reynolds number above 800 departed from Hagen Poiseuille law in the direction of higher friction factor values.
Figure 3.7. Friction factor versus Reynolds number of propane
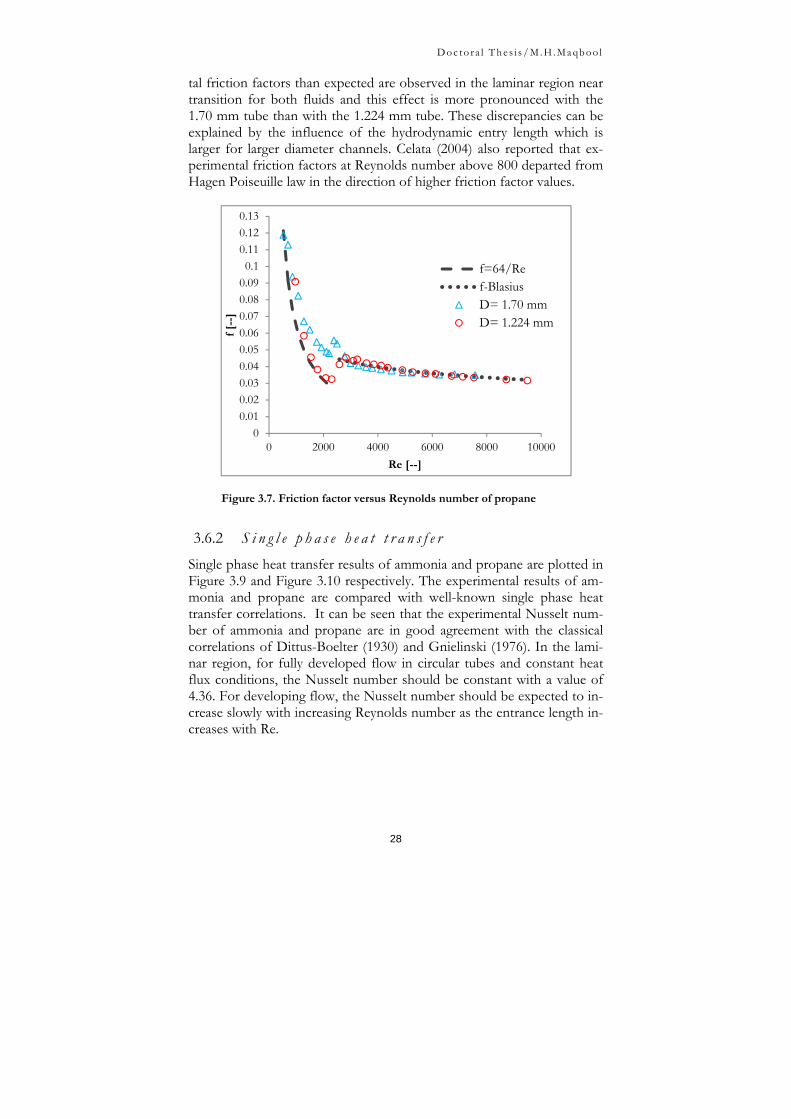
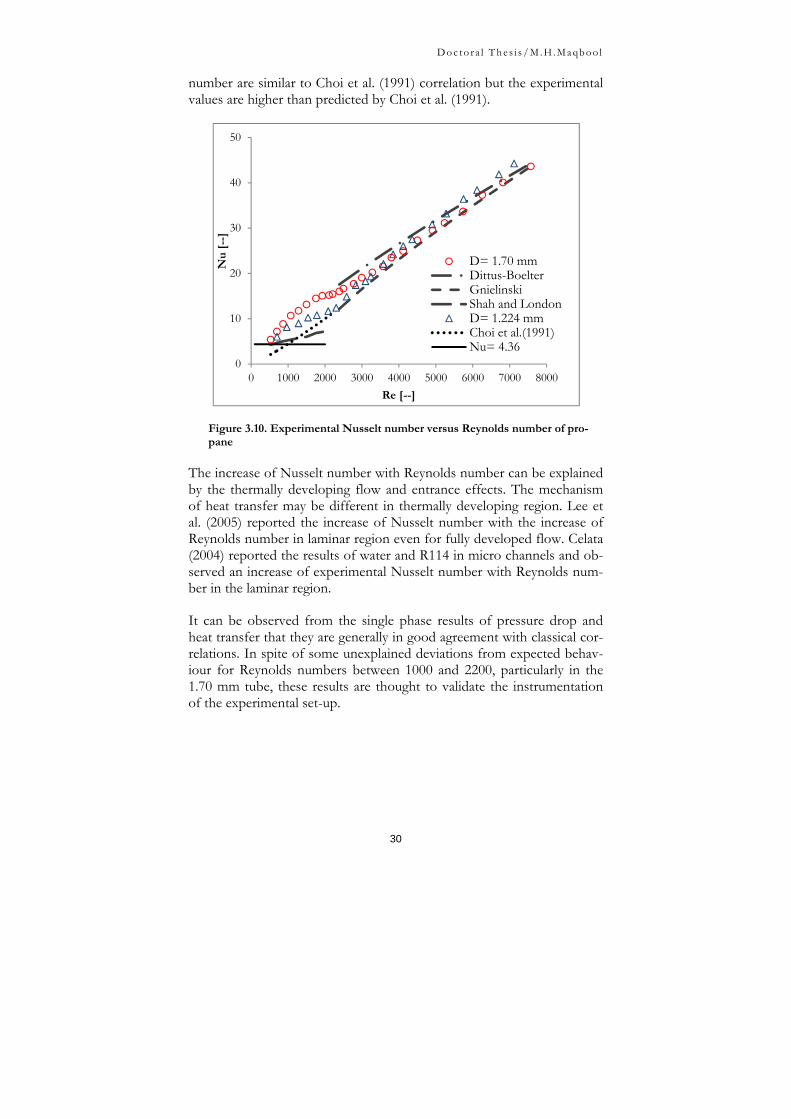
3.6.2 S i n g l e p h a s e h e a t t r a n s f e r Single phase heat transfer results of ammonia and propane are plotted in Figure 3.9 and Figure 3.10 respectively. The experimental results of am-monia and propane are compared with well-known single phase heat transfer correlations. It can be seen that the experimental Nusselt num-ber of ammonia and propane are in good agreement with the classical correlations of Dittus-Boelter (1930) and Gnielinski (1976). In the lami-nar region, for fully developed flow in circular tubes and constant heat flux conditions, the Nusselt number should be constant with a value of 4.36. For developing flow, the Nusselt number should be expected to in-crease slowly with increasing Reynolds number as the entrance length in-creases with Re.
00.010.020.030.040.050.060.070.080.090.1
0.110.120.13
0 2000 4000 6000 8000 10000
f [-
-]
Re [--]
f=64/Ref-BlasiusD= 1.70 mmD= 1.224 mm

D o c t o r a l T h e s i s / M . H . M a qb o o l
29
Figure 3.8. Friction factor versus Reynolds number of ammonia.
Figure 3.9. Experimental Nusselt number versus Reynolds number of am-monia
In all cases with ammonia and propane, the experimental Nusselt num-ber increases with Reynolds number in the laminar region. In case of ammonia with 1.224 mm tube, the experimental Nusselt number is in agreement with Choi et al. (1991) correlation which was developed for fully developed laminar flow. Generally the trends of the increase of ex-perimental Nusselt number of ammonia and propane with Reynolds
0
0.01
0.02
0.03
0.04
0.05
0.06
0.07
0.08
0.09
0.1
0.11
0 2000 4000 6000 8000
f [-
-]
Re [--]
f=64/Ref-BlasiusD=1.224 mmD= 1.70 mm
0
5
10
15
20
25
30
35
40
0 1000 2000 3000 4000 5000 6000 7000 8000
Nu
[--
]
Re [‐‐]
Dittus BoelterGnielinskiNu= 4.36D= 1.224 mmD= 1.70 mmChoi et al.(1991)Shah and London
D o c t o r a l T h e s i s / M . H . M a qb o o l
30
number are similar to Choi et al. (1991) correlation but the experimental values are higher than predicted by Choi et al. (1991).
Figure 3.10. Experimental Nusselt number versus Reynolds number of pro-pane
The increase of Nusselt number with Reynolds number can be explained by the thermally developing flow and entrance effects. The mechanism of heat transfer may be different in thermally developing region. Lee et al. (2005) reported the increase of Nusselt number with the increase of Reynolds number in laminar region even for fully developed flow. Celata (2004) reported the results of water and R114 in micro channels and ob-served an increase of experimental Nusselt number with Reynolds num-ber in the laminar region.
It can be observed from the single phase results of pressure drop and heat transfer that they are generally in good agreement with classical cor-relations. In spite of some unexplained deviations from expected behav-iour for Reynolds numbers between 1000 and 2200, particularly in the 1.70 mm tube, these results are thought to validate the instrumentation of the experimental set-up.
0
10
20
30
40
50
0 1000 2000 3000 4000 5000 6000 7000 8000
Nu
[--
]
Re [--]
D= 1.70 mmDittus-BoelterGnielinskiShah and LondonD= 1.224 mmChoi et al.(1991) Nu= 4.36

D o c t o r a l T h e s i s / M . H . M a qb o o l
31
4 Flow Boil ing Heat Transfer
Flow boiling in mini channels has been attracting a lot of attention dur-ing the last decade due to its possible applications in fuel cells, refrigera-tion systems, cooling systems for high performance microelectronics etc. The objective of this study is to understand the flow boiling characteris-tics of ammonia and propane in mini channels. The saturated flow boil-ing results of ammonia and propane in minichannels are presented in this chapter. The effect of different parameters such as mass flux, heat flux, internal diameter, saturation temperature, vapour quality is dis-cussed in detail. A comparison of experimental data with well-known generalized macro and micro scale correlations are also presented.
4 . 1 F l o w B o i l i n g H e a t T r a n s f e r o f A m m o n i a
Experiments were performed to investigate heat transfer in circular ver-tical mini channels made of stainless steel (AISI 316) with internal di-ameters of 1.70 mm and 1.224 mm and a uniformly heated length of 245 mm. The experimental conditions are tabulated in table 4.1.
Table 4.1. Experimental conditions of two phase heat transfer tests with ammonia
Parameter Operating range
Ammonia
Di (mm) 1.70, 1.224 Lh (mm) 245 Tsat (°C) 23, 33, 43 G (kg/m2s) 100-500 q´´ (kW/m2) 10-355 Tsub,in (°C) 1

D o c t o r a l T h e s i s / M . H . M a qb o o l
32
4.1.1 E f f e c t o f m a s s f l u x The effect of mass flux of ammonia on the heat transfer coefficient is shown in Figure 4.1. Figure 4.1a shows the local heat transfer coeffi-cients in the 1.70 mm tube versus local vapour fractions for a heat flux of 180 kW/m2 and at a saturation temperature of 33 °C. It can be seen that the effect of mass flux on the local heat transfer coefficients is in-significant because at a given heat flux, the local values at all mass fluxes cluster to each other for all range of vapour qualities.
Figure 4.1.The effect of mass flux on the local heat transfer coeffi-cients of ammonia in (a) the 1.70 mm tube and (b) the 1.224 mm tube.
0
5
10
15
20
25
30
35
40
0 0.1 0.2 0.3 0.4 0.5
Loc
al h
(kW
/m
2 K)
Local vapor Fraction (--)
G=200 kg/m^2s,q''=180 kW/m^2,Di=1.70 mmG=300 kg/m^2s,q''=180 kW/m^2,Di=1.70 mmG=400 kg/m^2s,q''=180 kW/m^2,Di=1.70 mmG=500 kg/m^2s,q''=180 kW/m^2,Di=1.70 mm
a
0
5
10
15
20
25
30
35
40
0 0.1 0.2 0.3 0.4 0.5 0.6
Loc
al h
(kW
/m
2 K)
Local vapor fraction (--)
G=200 kg/m^2s, q''=180 kW/m^2,Di=1.224mmG=300 kg/m^2s, q''=180 kW/m^2,Di=1.224mmG=400 kg/m^2s, q''=180 kW/m^2,Di=1.224mmG=500 kg/m^2s, q''=180 kW/m^2,Di=1.224mm
b

D o c t o r a l T h e s i s / M . H . M a qb o o l
33
Due to the insignificant effect of mass flux and vapour quality on the heat transfer coefficient, the flow boiling in the 1.70 mm tube seems to be controlled by a mechanism similar to nucleate boiling. The author hesitates to call clearly nucleate boiling dominant heat transfer because according to the visualization tests by Owhaib (2007) and Ali (2010) on the same test rig as used in this study, it has been observed that nuclea-tion only occurs at the entrance of the test section. Arima et al. (2010) also observed similar trends when they investigated heat transfer of am-monia in a vertical plate evaporator. In Figure 4.1b, the local heat transfer coefficients in the 1.224 mm tube are plotted versus local vapour qualities for a heat flux of 180 kW/m2 and a saturation temperature of 33 °C. It can be seen that the effect of mass flux on the local heat transfer coefficients is insignificant up to a vapour quality of ~0.1 and the local heat transfer coefficients are de-pendent on mass fluxes at vapour qualities greater than 0.1. It is also ob-served that the dependence of the heat transfer coefficient on mass flux comes earlier, i.e. at lower quality, for higher mass flux at the otherwise same experimental conditions. Choi et al. (2007) suggested that in the convective boiling region, the suppression of nucleate boiling appears earlier under high mass flux conditions which means that the convective effects appear earlier in high mass flux condition. This can be an expla-nation for the trends observed in Figure 4.1b for the 1.224 mm tube. This type of results is also reported by Da Silva Lima et al. (2009).
4.1.2 E f f e c t o f h e a t f l u x a n d v a p o u r q u a l i t y The local heat transfer coefficients are plotted against local vapour quali-ties at a mass flux of 200 kg/m2s and at a saturation temperature of 33 °C in Figure 4.2a for 1.70 mm tube. From Figure 4.2a, it can be seen that the local heat transfer coefficient is higher for higher heat flux and the effect of vapour fraction on the local heat transfer coefficient seems to be insignificant for a given heat flux. This type of trends of the heat transfer coefficient with heat flux and vapour quality shows that the flow boiling in 1.70 mm tube is less influenced by convective effects and more influenced by mechanism similar to nucleate boiling. Thome et al. (2004) suggested that nucleate boiling is one of the factors to enhance the heat transfer coefficient with increase in heat flux and the evapora-tion of thin liquid film can be another factor to enhance heat transfer co-efficient with increase of heat flux. This type of trends was also reported by Vlasie et al. (2004), Owhaib et al (2004) and Ali et al. (2011c). To investigate the effect of heat flux and vapour qualities on the local heat transfer coefficient in the 1.224 mm tube, the local heat transfer co-efficients versus the local vapour qualities at a mass flux of 200 kg/m2s

D o c t o r a l T h e s i s / M . H . M a qb o o l
34
Figure 4.2. The effect of heat flux and vapour quality on the local heat transfer coefficients of ammonia in (a) the 1.70 mm tube and (b) the 1.224 mm tube. and a saturation temperature of 33 °C are plotted in Figure 4.2b. It can be seen that for the 1.224 mm tube, the effect of vapour quality on the local heat transfer coefficients is insignificant up to a vapour quality of ~0.15 for all heat fluxes and for vapour qualities higher than ~0.15, the heat transfer coefficient is observed to be dependent on vapour quality. These types of behaviours are also reported by Vlasie et al. (2004), Kew and Cornwell (1997) and Choi et al. (2007). It is also observed from Fig-
0
5
10
15
20
25
30
35
40
45
50
0 0.1 0.2 0.3 0.4 0.5 0.6
Loc
al h
(kW
/m
2 K)
Local vapor fraction (--)
q''=100 kW/m^2, G=200 kg/m^2s Di=1.70 mmq''=180 kW/m^2, G=200 kg/m^2s Di=1.70 mmq''=240 kW/m^2, G=200 kg/m^2s Di=1.70 mm
a
0
5
10
15
20
25
30
35
40
45
50
0 0.1 0.2 0.3 0.4 0.5 0.6 0.7 0.8
Loc
al h
(kW
/m
2 K)
Local vapor fraction (--)
q''=100 kW/m^2, G=200 kg/m^2s, Di=1.224mmq''=180 kW/m^2, G=200 kg/m^2s, Di=1.224mmq''=240 kW/m^2, G=200 kg/m^2s, Di=1.224mm
b

D o c t o r a l T h e s i s / M . H . M a qb o o l
35
ure 4.2b that under the same mass flux condition, the insignificant effect of vapour quality on the local heat transfer coefficient sustains up to higher vapour quality for higher heat flux. This can be explained by the fact that at higher heat flux nucleate boiling is more vigorous and thereby more difficult to suppress. It has been observed in this study that a heat flux dependent mechanism is dominating in the 1.70 mm tube and at lower qualities in the 1.224 mm tube and also that a mass flux dependent mechanism is dominating at higher qualities in the 1.224 mm tube. Different studies reported differ-ent results like Owhaib et al (2004) and Ali et al. (2011c) suggested no ef-fect of mass flux and vapour quality and strong effect of heat flux on the heat transfer coefficient. Saitoh et al. (2006) also reported the same trends for R134a in horizontal small tubes.
4.1.3 E f f e c t o f s a t u r a t i o n t e m p e r a t u r e Variation of the heat transfer coefficient with saturation temperature is shown in Figures 4.3a and 4.3b for the 1.70 and the 1.224 mm tubes re-spectively. For both tubes, the figures are plotted for a mass flux of 400 kg/m2s and for a heat flux of 200 kW/m2. It can be seen in both figures that the heat transfer coefficient is higher for higher saturation tempera-tures up to a vapour fraction of ~0.1 in case of 1.70 mm tube and up to a vapour fraction of ~0.17 in case of 1.224 mm tube. As the vapour frac-tion increases above the values mentioned, the influence of saturation temperature on the heat transfer coefficient diminishes. The increase of heat transfer coefficient with saturation temperature at low vapour frac-tions can be explained by the decrease in surface tension with the in-crease in saturation temperature which may result in the reduction of bubble departure diameter and hence may enhance the nucleation. The diminishing effect of saturation temperature on the heat transfer coeffi-cient above certain vapour fractions was also reported by Da Silva Lima et al. (2009) using R134a and Mastrullo et al. (2009) when they per-formed experiments with CO2.
4.1.4 E f f e c t o f t u b e d i a m e t e r The effect of tube diameter on the heat transfer coefficient is shown in Figure 4.4. The average heat transfer coefficients are plotted versus the imposed wall heat fluxes at a mass flux of 300 kg/m2s and a saturation temperature of 33 °C for both test sections. It can be seen that the aver-age heat transfer coefficient is higher for the smaller diameter tube. Also, as can be seen from Figures 4.1 to 4.3 that the local heat transfer coeffi-cients are higher at higher vapour fractions for the smaller diameter tubes. The higher average heat transfer coefficient in the smaller diame-
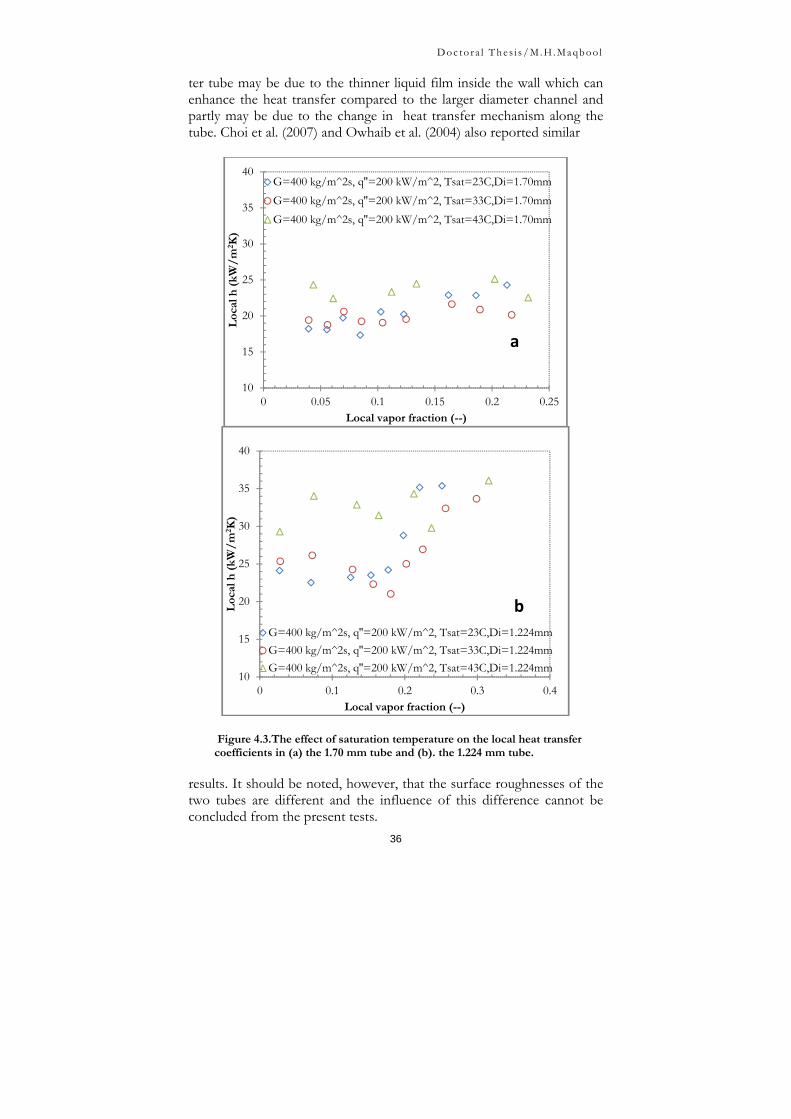
D o c t o r a l T h e s i s / M . H . M a qb o o l
36
ter tube may be due to the thinner liquid film inside the wall which can enhance the heat transfer compared to the larger diameter channel and partly may be due to the change in heat transfer mechanism along the tube. Choi et al. (2007) and Owhaib et al. (2004) also reported similar
Figure 4.3.The effect of saturation temperature on the local heat transfer coefficients in (a) the 1.70 mm tube and (b). the 1.224 mm tube.
results. It should be noted, however, that the surface roughnesses of the two tubes are different and the influence of this difference cannot be concluded from the present tests.
10
15
20
25
30
35
40
0 0.05 0.1 0.15 0.2 0.25
Loc
al h
(kW
/m
2 K)
Local vapor fraction (--)
G=400 kg/m^2s, q''=200 kW/m^2, Tsat=23C,Di=1.70mmG=400 kg/m^2s, q''=200 kW/m^2, Tsat=33C,Di=1.70mmG=400 kg/m^2s, q''=200 kW/m^2, Tsat=43C,Di=1.70mm
a
10
15
20
25
30
35
40
0 0.1 0.2 0.3 0.4
Loc
al h
(kW
/m
2 K)
Local vapor fraction (--)
G=400 kg/m^2s, q''=200 kW/m^2, Tsat=23C,Di=1.224mmG=400 kg/m^2s, q''=200 kW/m^2, Tsat=33C,Di=1.224mmG=400 kg/m^2s, q''=200 kW/m^2, Tsat=43C,Di=1.224mm
b

D o c t o r a l T h e s i s / M . H . M a qb o o l
37
Figure 4.4. Diametric effects on the heat transfer coefficients.
4.1.5 C o m p a r i s o n w i t h c o r r e l a t i o n s The experimental data of the two vertical tubes at three saturation tem-peratures are compared with well known correlations. Figure 4.5 shows the local experimental heat transfer coefficients versus the local heat transfer coefficients predicted by Cooper’s correlation (1989). This correlation predicted the data for the 1.70 mm tube better than for the 1.224 mm tube. It should be noted that the prediction of the 1.70 mm data is also more coherent than the 1.224 mm tube data. Over-all this correlation predicts all our experimental data at three saturation temperatures for both tubes with a MAD of 20 %. The predictions of the Shah Correlation (1982) plotted versus our ex-perimental data are shown in Figure 4.6. Shah’s correlation was devel-oped originally on the basis of data of ten fluids in macro channels. In this correlation, the contribution of both the nucleate boiling and the convective boiling mechanisms are considered through separate correla-tions, and the maximum of these two is taken as the correct one. The notable weakness of this method is that the effect of nucleate boiling contribution is included only by the latent heat of vaporisation in the boiling number and generally the latent heat of vaporisation decreases with increase in saturation pressure while the nucleate boiling contribu-tion increases with saturation pressure. Some authors such as Owhaib et. al. (2004) and Ali et. al. (2011c) suggested nucleate boiling like mecha-nism to be dominant in mini channels while others, like Madrid et al.
0
5
10
15
20
25
30
35
40
45
0 50 100 150 200 250 300
Ave
rage
h (
kW/
m2 K
)
q'' (kW/m2)
G=300 kg/m^2s,Tsat=33ºC,Di=1.70mm
G=300 kg/m^2s,Tsat=33ºC,Di=1.224mm

D o c t o r a l T h e s i s / M . H . M a qb o o l
38
(2007) suggested convective boiling to be dominant. Tran et al. (1996) suggested convective boiling mechanism in mini channels for wall su-perheats less
Figure 4.5. Comparison of experimental local heat transfer coefficients with Cooper’s correlation (1989).
Figure 4.6. Comparison of experimental local heat transfer coefficients with Shah correlation (1982).
0
10
20
30
40
50
60
0 10 20 30 40 50 60
Loc
al h
pre
d(k
W/
m2 K
)
Local hexp (kW/m2K)
Di= 1.70 mmDi= 1.224 mm
+30%
-30%
0
10
20
30
40
50
60
0 10 20 30 40 50 60
Loc
al h
pre
d(k
W/
m2 K
)
Local hexp (kW/m2K)
Di= 1.70 mm
Di= 1.224 mm
+30%
-30%

D o c t o r a l T h e s i s / M . H . M a qb o o l
39
than 2.75 K and nucleate boiling for wall superheats greater than 2.75 K. Shah’s (1982) correlation predicts the data for the 1.224 mm tube with lower MAD than for the 1.70 mm tube but overall it predicts the data for the two test tubes with a MAD of 29 %. The deviation of the ex-perimental data from the predicted may be due to the presence of both mechanism of heat transfer at the same time but in the correlation the maximum of the two is selected. Choi et al. (2007) superposition model correlation is developed for flow boiling in mini channels on the basis of data for three refrigerants R-22, R134a and CO2 in horizontal tubes. This correlation includes both the nucleate boiling and the convective boiling contribution at given condi-tions. The predictions of Choi et al. (2007) correlation are shown in Fig-ure 4.7. This correlation under-predicted the experimental results with MAD of 51 %.
Figure 4.7. Comparison of experimental local heat transfer coefficients with Choi et al. (2007) correlation.
The predictions of Gungor and Winterton correlation (1986) and Liu and Winterton correlation (1991) against the experimental data are pre-sented in Figures 4.8 and 4.9 respectively. Both correlations include the Cooper pool boiling correlation (1984) for the nucleate boiling contribu-tion with suppression factor. According to generally agreed criteria, the
0
10
20
30
40
50
60
0 10 20 30 40 50 60
Loc
al h
pre
d (k
W/
m2 K
)
Local hexp (kW/m2K)
Di= 1.70 mmDi= 1.224 mm
+30%
-30%

D o c t o r a l T h e s i s / M . H . M a qb o o l
40
heat flux dependent heat transfer mechanism is considered as nucleate boiling dominant and the mass flux dependent heat transfer mechanism is considered as convective boiling dominant. Nucleate boiling like
Figure 4.8. Comparison of experimental local heat transfer coefficients with Gungor and Winterton (1986) correlation.
Figure 4.9. Comparison of experimental local heat transfer coefficients with Liu and Winterton (1991) correlation.
0
10
20
30
40
50
60
0 10 20 30 40 50 60
Loc
al h
pre
d (k
W/
m2 K
)
Local hexp (kW/m2K)
Di= 1.70 mm
Di= 1.224 mm
‐30%
+30%
0
10
20
30
40
50
60
0 10 20 30 40 50 60
Loc
al h
pred
(kW
/m2 K
)
Local hexp (kW/m2K)
Di= 1.70 mm
Di= 1.224 mm
+30%
‐30%

D o c t o r a l T h e s i s / M . H . M a qb o o l
41
mechanism is dominating in 1.70 mm tube which may be a reason for coherently predicting the data of the 1.70 mm tube. Both of these corre-lations over predicted the data of the 1.70 mm tube and for 1.224 mm the MAD was low but the data was scattered especially at high heat fluxes. Both correlations predicted the data with MAD of 36 %.
4 . 2 F l o w B o i l i n g H e a t T r a n s f e r o f P r o p a n e
This section reports the flow boiling heat transfer results of propane in a vertical circular stainless steel mini channel having an internal diameter of 1.70 mm and a heated length of 245 mm. The experimental condi-tions are tabulated in table 4.2.
Table 4.2. Experimental conditions of two phase heat transfer tests with propane
Parameter Operating range
Propane
Di (mm) 1.70 Lh (mm) 245 Tsat (°C) 23, 33, 43 G (kg/m2s) 100-500 q´´ (kW/m2) 5-280 Tsub,in (°C) 1
4.2.1 E f f e c t o f h e a t f l u x a n d v a p o u r q u a l i t y The experimental local heat transfer coefficients for a mass flux of 300 kg/m2s and 23 °C saturation temperature are plotted in Figure 4.10 ver-sus local vapour qualities for different range of heat fluxes. It can be seen that for given conditions, the effect of local vapour quality on the local heat transfer coefficient is insignificant, except at the downstream end of the test section for heat fluxes of 180 kW/m2 and 190 kW/m2 near dry-out where the thin liquid film breaks up and deterioration of heat trans-fer is observed. It can also be seen from Figure 4.10 that for a given mass flux, the local heat transfer coefficient is higher for higher heat fluxes. This effect of heat flux remains up to very near to dryout at least for the operating conditions considered in this study. This dependence of heat transfer coefficient on heat flux and independence of vapour qualities may indicate a limited contribution of convective boiling.

D o c t o r a l T h e s i s / M . H . M a qb o o l
42
4.2.2 E f f e c t o f m a s s f l u x The effect of mass flux on the local heat transfer coefficient is depicted in Figure 4.11. The local heat transfer coefficients are plotted as a func-tion of local vapour qualities for a saturation temperature of 33 °C. Three sets of data points for three heat fluxes and range of mass fluxes are plotted in the same figure. It can be seen from Figure 4.11 that for a
Figure 4.10. The effect of heat flux and vapour quality on the local heat transfer coefficients with propane. Mass flux 300 kg/m2 s.
Figure 4.11. The effect of mass flux and vapour quality on the local heat transfer coefficients of propane.
0
5
10
15
20
25
30
0 0.1 0.2 0.3 0.4 0.5 0.6 0.7 0.8 0.9 1
Loc
al h
(kW
/m
2 K)
Local x (--)
q''=40 kW/m^2 q''=60 kW/m^2q''=80 kW/m^2 q''=100 kW/m^2q''=120 kW/m^2 q''=140 kW/m^2q''=180 kW/m^2 q''=190 kW/m^2
0
5
10
15
20
25
30
0 0.1 0.2 0.3 0.4 0.5 0.6 0.7 0.8
Loc
al h
(kW
/m
2 K)
Local x (--)
G=200 kg/m^s, q''=60 kW/m^2G=300 kg/m^s, q''=60 kW/m^2G=400 kg/m^s, q''=60 kW/m^2G=300 kg/m^s, q''=100 kW/m^2G=400 kg/m^s, q''=100 kW/m^2G=500 kg/m^s, q''=100 kW/m^2G=300 kg/m^s, q''=140 kW/m^2G=400 kg/m^s, q''=140 kW/m^2G=500 kg/m^s, q''=140 kW/m^2

D o c t o r a l T h e s i s / M . H . M a qb o o l
43
given heat flux, the effect of mass flux is insignificant. Again the inde-pendence of local heat transfer coefficients of mass flux indicates that a nucleate boiling like mechanism plays a major role and convective boil-ing is of minor importance. Ali et al. (2011c) also observed similar be-haviour in his experimental study.
Figure 4.12. The effect of saturation temperature on the local and average heat transfer coefficients.
4.2.3 E f f e c t o f s a t u r a t i o n t e m p e r a t u r e The effect of saturation temperature on local heat transfer coefficients are plotted in Figure 4.12a. Two sets of data are plotted at three satura-
0
5
10
15
20
25
30
35
40
0 0.1 0.2 0.3 0.4 0.5 0.6 0.7 0.8 0.9 1
Loc
al h
(kW
/m
2 K)
Local x(--)
G=200 kg/m^s, q''=100 kW/m^2,Tsat=23CG=200 kg/m^s,q''=100 kW/m^2, Tsat=33CG=200 kg/m^s,q''=100 kW/m^2, Tsat=43CG=400 kg/m^s,q''=160 kW/m^2, Tsat=23CG=400 kg/m^s,q''=160 kW/m^2, Tsat=33CG=400 kg/m^s,q''=160 kW/m^2, Tsat=43C
(a)
0
5
10
15
20
25
30
35
40
45
0 25 50 75 100 125 150 175 200
Ave
rage
h (
kW/
m2 K
)
q'' (kW/m2)
G=200 kg/m^2s,Tsat= 23CG=300 kg/m^2s,Tsat= 23CG=200 kg/m^2s,Tsat= 33CG=300 kg/m^2s,Tsat= 33CG=200 kg/m^2s,Tsat= 43CG=300 kg/m^2s,Tsat= 43C
(b)

D o c t o r a l T h e s i s / M . H . M a qb o o l
44
tion temperatures for the same mass and heat fluxes. The local heat transfer coefficients are observed to be higher for higher saturation tem-perature. To get an overview of the effect of saturation temperature on a large range of data, average heat transfer coefficients are plotted as a function of heat flux at all saturation temperatures in Figure 4.12b for mass fluxes of 200 and 300 kg/m2s. It can be seen that average heat transfer coefficients are higher for higher saturation temperatures for a given heat and mass flux. (e.g. as for ammonia, the increase of heat trans-fer coefficient with saturation temperature can be explained by the de-crease in surface tension with the increase in saturation temperature which may result in the reduction of bubble departure diameter and hence may enhance the nucleation). Saisorn et al. (2010), In and Jeong (2009) and Ali et al. (2011c) also observed similar results.
4.2.4 C o m p a r i s o n w i t h c o r r e l a t i o n s In this section the local heat transfer coefficients are compared with seven well known correlations. The data points before dryout incipience are also separated by different legends from the data points after incipi-ence of dryout.
The experimental local heat transfer coefficients are compared with Cooper (1984) pool boiling correlation as shown in Figure 4.13a. Cooper (1984) pool boiling correlation gives best prediction among the correla-tions considered in this study. It predicts the experimental data of pro-pane, including the data points after incipience of dryout with MAD of 18 % where 87% of the data is within ±30 % range. If the data points af-ter dryout incipience are excluded then this correlation predicts the ex-perimental data with MAD of 14 %. Bao et al. (2000) also reported that Cooper (1984) pool boiling correlation predicts the data well in minichannels.
The predictions of Lazarek and Black (1982) correlation of the experi-mental data are presented in Figure 4.13b. In this correlation the expo-nent of boiling number which represents the influence of heat flux is similar to the exponent on the heat flux in Cooper (1984) pool boiling correlation. As the results in this study also show a strong influence of heat flux on the local heat transfer coefficient, as expected when the nu-cleate boiling mechanism is dominating, this can be a reason why this correlation predicts the experimental data with MAD of 23 % where 74% of the data is within ±30 % range. If the data points after dryout in-cipience are excluded then this correlation predicts the experimental data with MAD of 20 %.

D o c t o r a l T h e s i s / M . H . M a qb o o l
45
The experimental data are also compared with Kew and Conwell (1997) correlation which is shown in Figure 4.13c. This is a modified form of Lazarek and Black (1982) correlation adding the influence of vapour quality on the heat transfer coefficient. The predictions of this correla-tion are similar to Lazarek and Black (1982) correlation with the excep-tion of high heat fluxes where the results are over predicted. Overall this correlation predicts the experimental data with MAD of 24 % and 75 % of the data is within the ±30 % range. If the data points after dryout in-cipience are excluded then this correlation predicts the experimental data with MAD of 19 %.
Based on saturated and subcooled boiling data, Liu and Winterton (1991) presented a correlation which considers both nucleate and convective boiling. This correlation, as shown in Figure 4.13d, predicts the data well at low and medium heat fluxes and under predicts the data at high heat fluxes. This correlation predicts the data with MAD of 20 % with all pre-sented data and 80 % of the data is within a range of 30 %. It is interest-ing to note that predictions of this correlation are the most coherent
Figure 4.13 Comparisons of experimental local heat transfer coefficients with (a) Cooper (1984), (b) Lazarek and Black (1982), (c) Kew and Conwell (1997) and (d) Liu and Winterton (1991) correlations.
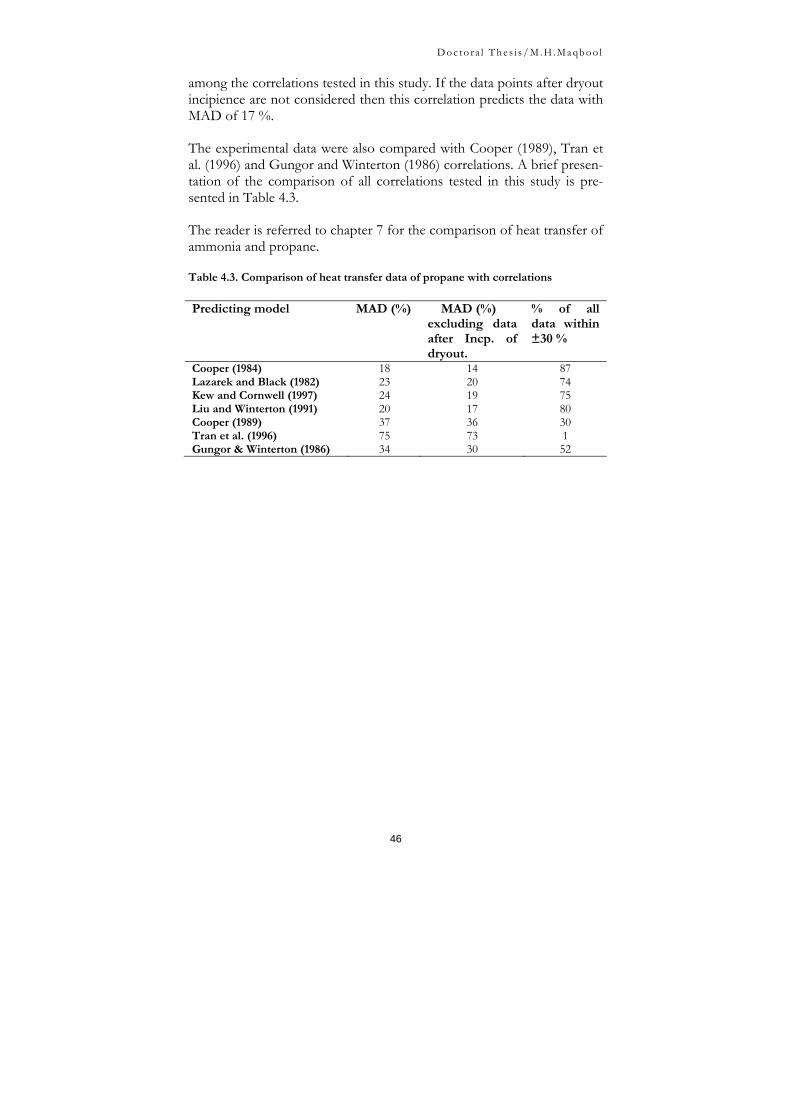
D o c t o r a l T h e s i s / M . H . M a qb o o l
46
among the correlations tested in this study. If the data points after dryout incipience are not considered then this correlation predicts the data with MAD of 17 %.
The experimental data were also compared with Cooper (1989), Tran et al. (1996) and Gungor and Winterton (1986) correlations. A brief presen-tation of the comparison of all correlations tested in this study is pre-sented in Table 4.3.
The reader is referred to chapter 7 for the comparison of heat transfer of ammonia and propane.
Table 4.3. Comparison of heat transfer data of propane with correlations Predicting model MAD (%) MAD (%)
excluding data after Incp. of dryout.
% of all data within ±30 %
Cooper (1984) 18 14 87 Lazarek and Black (1982) 23 20 74 Kew and Cornwell (1997) 24 19 75 Liu and Winterton (1991) 20 17 80 Cooper (1989) 37 36 30 Tran et al. (1996) 75 73 1 Gungor & Winterton (1986) 34 30 52
D o c t o r a l T h e s i s / M . H . M a qb o o l
47
5 Two phase Pressure Drop
Pressure drop is one of the key parameters in the design of any heat ex-changer and its correct estimation is important to be able to design the mini and micro channels heat exchangers properly. Despite many advan-tages of using mini channels like reduced size, low fluid inventory, re-duced cost due to minimum material requirement and compactness, the disadvantage may be higher pressure drop if the system is not designed properly. From the literature review, it is quite evident that the two phase pressure drop studies of ammonia and propane in mini and micro chan-nels are scarce. Therefore in this chapter, two phase pressure drop re-sults of ammonia and propane in mini channels are presented. The ef-fects of different parameters like mass flux, heat flux, saturation tempera-ture etc. on two phase pressure drop of ammonia and propane are inves-tigated. Some generalized two phase pressure drop correlations sug-gested for macro and micro scale channels are also examined by compar-ing them with experimental pressure drop data. The frictional two phase pressure drop cannot be measured directly and the reader is referred to Paper 2 appended in the thesis for the details of the determination of frictional pressure drop from the measured overall pressure drop.
5 . 1 T w o P h a s e P r e s s u r e D r o p o f A m m o n i a
The experimental conditions for the measurements of two phase pres-sure drop of ammonia are tabulated in table 5.1.
Table 5.1. Experimental conditions of two phase pressure drop of am-monia.
Parameter Operating range
Ammonia
Di (mm) 1.70, 1.224 Lh (mm) 245 Tsat (°C) 23, 33, 43 G (kg/m2s) 100-500 q´´(kW/m2) 10-355 Tsub,in (°C) 1

D o c t o r a l T h e s i s / M . H . M a qb o o l
48
5.1.1 E f f e c t o f m a s s f l u x a n d v a p o u r q u a l i t y Two phase frictional pressure drops as a function of the exit vapour quality at different mass fluxes for the 1.70 mm and 1.224 mm tubes, at a saturation temperature of 43 °C is shown in Figures 5.1 and 5.2 respec-tively.
Figure 5.1. Two phase frictional pressure drop of ammonia versus exit va-pour quality of the 1.70 mm tube at Tsat = 43 °C
Figure 5.2. Two phase frictional pressure drop of ammonia versus exit va-pour quality of the 1.224 mm tube at Tsat =43 °C
0
20
40
60
80
100
120
140
160
180
200
0 0.1 0.2 0.3 0.4 0.5 0.6 0.7 0.8 0.9 1 1.1
dp
(exp
)fri
ctio
nal
mb
ar
X(exit)
G=100 kg/m^2s,Tsat=43CG=200 kg/m^2s,Tsat=43CG=300 kg/m^2s,Tsat=43CG=400 kg/m^2s,Tsat=43CG=500 kg/m^2s,Tsat=43CSingle Phase G=100 kg/m^2sSingle Phase G=200 kg/m^2sSingle Phase G=300 kg/m^2sSingle Phase G=400 kg/m^2sSingle Phase G=500 kg/m^2s
020406080
100120140160180200220240260280300320340360
0 0.1 0.2 0.3 0.4 0.5 0.6 0.7 0.8 0.9 1 1.1
dP
(exp
) fr
icti
onal
(m
bar
)
X(exit)
G=100 kg/m^2s,Tsat=43CG=200 kg/m^2s,Tsat=43CG=300 kg/m^2s,Tsat=43CG=400 kg/m^2s,Tsat=43CG=500 kg/m^2s,Tsat=43CSingle Phase G=100 kg/m^2sSingle Phase G=200 kg/m^2sSingle Phase G=300 kg/m^2sSingle Phase G=400 kg/m^2sSingle Phase G=500 kg/m^2s

D o c t o r a l T h e s i s / M . H . M a qb o o l
49
As expected, the pressure drop increases exponentially with mass flux. It can also be seen that the two phase frictional pressure drop is higher for higher exit vapour quality because the average velocity increases due to increase in specific volume at higher vapour fractions. The influence of vapour quality is observed to be more pronounced at higher mass fluxes. Similar trends were also observed by Ali et al. (2011a). Single phase pres-sure drop values corresponding to each mass flux are also shown in Fig-ures 5.1 and 5.2. It can be seen from Figure 5.2 for the 1.224 mm tube that the extrapolation of two phase pressure drop values of each mass flux to vertical axis more or less corresponds to single phase pressure drop values but some deviations in correspondence of two phase pres-sure drop values with single phase values are observed for the 1.70 mm tube (as can be seen in Figure 5.1). This can be explained by the large uncertainty in such low pressure drop readings.
5.1.2 E f f e c t o f s a t u r a t i o n t e m p e r a t u r e Effect of saturation temperature on the two phase frictional pressure drop in the 1.70 mm and 1.224 mm tubes is shown in Figures 5.3 and 5.4 respectively. The two phase frictional pressure drop is plotted against vapour qualities for three saturation temperatures in Figure 5.3 and the two phase pressure drop is plotted versus mass fluxes for three satura-tion temperatures in Figure 5.4. As can be seen, two phase frictional pressure drop is lower for higher saturation temperatures. This can be explained by the fact that the vapour velocity (due to higher vapour den-sity) and also the liquid viscosity decrease with saturation temperature which result in lower pressure drop. These types of trends are also ob-served by Choi et al. (2007) and Revellin and Thome (2007). It can also be observed from Figure 5.4 that the influence of saturation temperature is more obvious at high heat flux, i.e. pressure drop at lower saturation temperature increases more at the same mass flux with in-creasing heat flux due to the increased vapour fraction. It can also be seen from Fig. 5.3 that for a given vapour fraction, the difference be-tween the two phase pressure drop at 23°C and 33°C is higher than the difference between 33°C and 43°C. The difference of liquid to vapour density ratio decreases as we go from lower to higher saturation tempera-tures which can be a reason for this non uniform difference.

D o c t o r a l T h e s i s / M . H . M a qb o o l
50
Figure 5.3. Two phase frictional pressure drop of the 1.70 mm tube as a func-tion of exit vapour quality and mass flux of ammonia at different saturation temperatures.
Figure 5.4. Two phase frictional pressure drop of the 1.224 mm tube as a function of mass flux and heat flux of ammonia at different saturation tem-peratures
5.1.3 E f f e c t o f i n t e r n a l d i a m e t e r The two phase frictional pressure drop is plotted in Figure 5.5 versus exit vapour fraction for the two tube diameters (fluid was always slightly sub-
0
20
40
60
80
100
120
140
160
180
200
0 0.1 0.2 0.3 0.4 0.5 0.6 0.7 0.8 0.9 1
dP
(exp
) fr
icti
onal
(m
bar
)
X(exit)
G=200 kg/m^2s, Tsat=23CG=200 kg/m^2s, Tsat=33CG=200 kg/m^2s, Tsat=43CG=300 kg/m^2s, Tsat=23CG=300 kg/m^2s, Tsat=33CG=300 kg/m^2s, Tsat=43CG=500 kg/m^2s, Tsat=23CG=500 kg/m^2s, Tsat=33CG=500 kg/m^2s, Tsat=43C
0
50
100
150
200
250
300
350
400
450
0 100 200 300 400 500 600
∆P
fric
.(mb
ar)
G(kg/m2s)
q''=240 kW/m^2, Tsat=23 Cq''=240 kW/m^2, Tsat=33 Cq''=240 kW/m^2, Tsat=43 Cq''=140 kW/m^2, Tsat=23 Cq''=140 kW/m^2, Tsat=33 Cq''=140 kW/m^2, Tsat=43 C

D o c t o r a l T h e s i s / M . H . M a qb o o l
51
cooled at the inlet). As can be seen, pressure drop is higher for the lower diameter tube at equal mass fluxes. The higher pressure drop in the smaller diameter tube is caused by the higher wall shear stress, caused by the higher velocity gradient in this tube. Similar results were reported by Pamitran et al. (2008) and were also observed by Revellin and Thome (2007).
Figure 5.5. Two phase frictional pressure drop of ammonia versus exit va pour quality for different diameters.
5.1.4 C o m p a r i s o n w i t h c o r r e l a t i o n s The two phase pressure drop is compared with well-known correlations from the literature. The two phase frictional pressure drop gradients are calculated by dividing the test section in ten segments for each correla-tion and the local pressure drops for all segments are summed up to give the total two phase frictional pressure drop. Figure 5.6a shows the experimental two phase frictional pressure drop plotted versus predicted frictional pressure drop calculated by the homo-geneous model using the two phase viscosity definition of Cicchitti et al. (1960). The homogeneous model assumes equal velocities of vapour and liquid and the fluid is considered as one single phase with average prop-erties. This model under predicts the data with a MAD of 27 %. Similar trends were also reported by Owhaib (2007). It should be noted that the spread in the results is small, and that the deviation is linear, indicating that with a change in the leading constant this correlation would give good predictions for all tests.
0255075
100125150175200225250
0 0.1 0.2 0.3 0.4 0.5 0.6 0.7
dP
(exp
) fr
icti
onal
(m
bar
)
X(exit)
G=300 kg/m^2s,Tsat=33C,Di=1,7mmG=300 kg/m^2s,Tsat=33C,Di=1,224mmG=400 kg/m^2s,Tsat=43C,Di=1,7mmG=400 kg/m^2s,Tsat=43C,Di=1,224mmG=500 kg/m^2s,Tsat=23C,Di=1,7mmG=500 kg/m^2s,Tsat=23C,Di=1,224mm
D o c t o r a l T h e s i s / M . H . M a qb o o l
52
The predictions of the Lockhart and Martinelli correlation (1949) are shown in Fig. 5.6b.This correlation is based on the separated flow model. This is the only correlation used in this study that predicts the data well at higher mass fluxes and high outlet vapour qualities but overall this correlation over predicts the experimental data with a MAD of 39 %, and the spread of the predictions is large. Many micro scale correlations are modified forms of the Lockhart and Martinelli correlation (1949). This correlation uses a two phase multiplier to determine the two phase frictional pressure gradient. The two phase multiplier is a function of the Martinelli parameter X and the Chisholm parameter C. The value of C varies from 5 to 20 depending on the liquid and gas flow regimes. In this study according to the flow regimes in these experiments, mostly the C value of 12 and 20 is used. The two phase multiplier with different values of C and Martinelli parameter for all saturation conditions and diameters are plotted in Figure 5.7. The ex-perimental data points are also shown in the Figure 5.7. From these plots, it can be observed that if a C value of 4 to 6 for 1.70 mm tube and a value of 9 to 12 for 1.224 mm tube are used then the experimental data can be predicted quite precisely by Lockhart and Martinelli Correlation (1949). The C value may be calculated by incorporating the factors which are dominant in micro channels. It has been suggested that if the Lock-hart and Martinelli correlation (1949) is to be used, parameter C should be determined not only from the flow regimes, but also from the channel size. A comparison of the Chisholm correlation (1973) with experimental data is presented in Fig. 5.6c. This correlation was developed for pressure drop in turbulent two-phase flow. The correlation over predicts our ex-perimental data with a MAD of 100 % mainly due to over prediction of the lower pressure drops, for which there are many data points. The spread of the data is slightly less than for the Lockhart Martinelli correla-tion (1949). Fig. 5.6d shows the comparison of experimental two phase frictional pressure drop with the Friedel correlation (1979). As for the Lockhart and Martinelli (1949) correlation, this correlation is also based on the separated flow model. It is developed for macro scale channels where the flow is turbulent even at lower mass fluxes in contrast to micro scale channels, where the flow is laminar except at the highest mass fluxes. This correlation predicts the data with MAD of 25 % and in general, the predictions are similar to that of the homogeneous model.
D o c t o r a l T h e s i s / M . H . M a qb o o l
53
Figure 5.6e shows the comparison of the Müller Steinhagen and Heck (1986) correlation with the experimental frictional pressure drop. Tribbe and Müller Steinhagen (2000) showed by using air-oil, air-water, steam-water and several refrigerants that this correlation is one of the best pre-dicting methods of two phase pressure gradient in macro channels. This correlation is able to predict experimental results for the two tubes with a MAD of 27 % with a small spread of the results, similar to the homoge-neous model. The Grönnerud (1979) correlation was developed for re-frigerants in larger diameter tubes. This correlation under predicts our experimental data with a MAD of 51 % as is shown in Fig. 5.6f. Also, the spread of the results is large. Da Silva Lima et al. (2009) observed similar predictions of Lockhart and Martinelli (1949), Friedel (1979) and Müller Steinhagen and Heck (1986) correlations when they performed experiments with ammonia in a smooth horizontal macro channel of 14 mm internal diameter. The micro scale correlations are also compared with the experimental data of ammonia to check their predicting capability. Predictions of the micro channel correlation suggested by Mishima and Hibiki (1996) are shown in Fig. 5.8a. This correlation is a modified form of the Lockhart and Martinelli (1949) correlation in which a new C value is suggested by incorporating the effect of channel diameter. As shown, the spread is very small, but the MAD is fairly large, 32 %, mainly due to large devia-tions for the case of high pressure drop, i.e. high mass flux and/or high outlet vapour fraction. Owhaib (2007) did flow boiling experiments of R134a in a vertical stainless steel test section in the same test rig as used in this study and Ali et al. (2011a) performed experiments of R134a in a horizontal glass test section. In these studies it was observed that Mishima and Hibiki (1996) predicted the experimental data with a MAD of 22 % and 19 % respectively. Still, the small spread in the results indi-cates that this correlation is able to catch the influence of important pa-rameters. The Zhang and Webb (2001) correlation is a modified form of the Friedel (1979) correlation. They excluded the Weber number and the Froude number because the two phase multiplier in the Friedel (1979) correlation was a weak function of We and Fr and included the effect of reduced pressure. This correlation predicts most of the data within ±30 %. However, the spread is large, as can be seen in Fig. 5.8b. The MAD is 29 %. The correlation of Tran et al. (2000) incorporates the surface ten-sion effects and confinement number. This correlation was found to work well in our previous study for R134a by Ali et al. (2011a) but for the ammonia data in this study, this correlation over predicts the data with a MAD of 205 %. Also, the deviation is much larger for the smaller diameter tube. The data is shown in Fig. 5.8c. Cavallini et al. (2005) ob-

D o c t o r a l T h e s i s / M . H . M a qb o o l
54
served similar predicting trends when they compared their experimental data of three refrigerants (R236ea, R134a, R410A) in multiport minichannels with Tran et al. (2000) correlation.
Figure 5.6. Comparison of two phase frictional pressure drop of ammonia with macro scale correlations.

D o c t o r a l T h e s i s / M . H . M a qb o o l
55
Figure 5.7. Two phase multiplier versus Martinelli parameter for the two test sec-tions at all saturation conditions.

D o c t o r a l T h e s i s / M . H . M a qb o o l
56
Figure 5.8. Comparison of two phase frictional pressure drop of ammonia with micro scale correlations.
5.1.5 N e w p r o p o s e d c o r r e l a t i o n To develop good prediction method for the two phase pressure drop in mini and micro channels, there are certain parameters like surface ten-sion and confinement effects which need to be considered in addition to the parameters normally considered in macro channels. One way to con-sider these parameters is to include the Confinement number (Co) de-fined as;
· · (5.1)
If Co is greater than one, which is the case in this study then the surface tension forces becomes important. Tran et al. (2000) developed a micro channel correlation with the inclusion of surface tension in terms of the Confinement number (Co). The Confinement numbers of different flu-ids vary under the same experimental conditions. For the same hydraulic diameter, the Confinement number of ammonia is more than two times that of R134a, R22 and R113 on the basis of which Tran et el. (2000) correlation was developed. Therefore, in this study Tran et al. (2000) cor-relation has been modified for the prediction of ammonia two phase

D o c t o r a l T h e s i s / M . H . M a qb o o l
57
pressure drop. The new proposed correlation, as can be seen in Figure 5.9, predicts all the experimental data with MAD of 16 % and 86 % of the experimental data is within the range of ± 30%. The functional form of the proposed correlation (modified form of Tran et al. (2000) correla-tion) is;
(5.2)
1 4.3 1 · 0.2 . . 1 . . (5.3)
(5.4)
Figure 5.9. Comparison of two phase frictional pressure drops of ammonia with new proposed correlation.
0
50
100
150
200
250
300
350
400
0 50 100 150 200 250 300 350 400
dp
(p
red
) fr
icti
onal
(m
bar
)
dp (exp) frictional (mbar)
Di= 1.7 mm
Di= 1.224 mm
+30%
-30%
+20%
-20%
D o c t o r a l T h e s i s / M . H . M a qb o o l
58
5 . 2 T w o P h a s e P r e s s u r e D r o p o f P r o p a n e This section reports the two phase pressure drop results of propane in a vertical circular stainless steel mini channel having an internal diameter of 1.70 mm and a heated length of 245 mm. The experimental condi-tions are tabulated in table 5.2.
Table 5.2. Experimental conditions of two phase pressure drop of pro-pane.
Parameter Operating range
Propane
Di (mm) 1.70 Lh (mm) 245 Tsat (°C) 23, 33, 43 G (kg/m2s) 100-500 q´´ (kW/m2) 5-280 Tsub,in (°C) 1
5.2.1 E f f e c t o f m a s s f l u x a n d v a p o u r q u a l i t y The experimental two phase frictional pressure drops as a function of exit vapour quality are plotted in Figure 5.10 for mass fluxes ranging from 300 to 500 kg/m2s and for saturation temperatures of 33 °C and 43 °C. As expected, the experimental results show that the two phase fric-tional pressure drop is a function of mass flux. It can also be seen that for a given mass flux, the two phase frictional pressure drop is higher for higher outlet vapour quality up to dryout incipience. As can also be seen from Figure 5.10, the influence of vapour quality is higher for higher mass fluxes. The trends can be explained by the increase in flow velocity with the increase of mass flux and vapour quality which results in an in-crease in two phase frictional pressure drop. Several authors such as Quiben et al. (2007), Choi et al. (2009), Ali et al. (2011a) and Revellin and Thome (2007) also reported similar findings from their experimental re-sults. A decrease in two phase frictional pressure drop near dryout is observed and this decrease is more pronounced at higher mass fluxes. Similar trends have been reported by Revellin and Thome (2007) who explained this as a result of the transition from wavy-annular to smooth annular flow. The extrapolation of the two phase frictional pressure drop lines to zero vapour quality more or less corresponds to single phase pressure drops and the small variation in this correspondence can be explained by the large uncertainty in such low pressure drop readings.
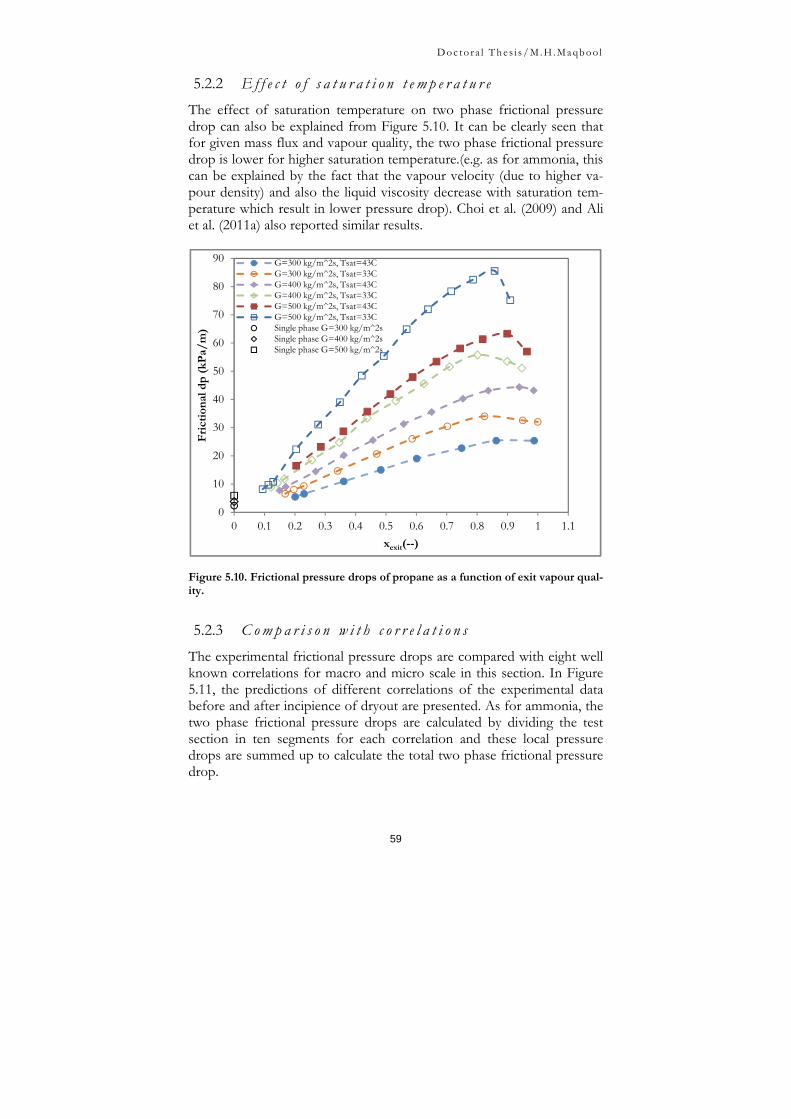
D o c t o r a l T h e s i s / M . H . M a qb o o l
59
5.2.2 E f f e c t o f s a t u r a t i o n t e m p e r a t u r e The effect of saturation temperature on two phase frictional pressure drop can also be explained from Figure 5.10. It can be clearly seen that for given mass flux and vapour quality, the two phase frictional pressure drop is lower for higher saturation temperature.(e.g. as for ammonia, this can be explained by the fact that the vapour velocity (due to higher va-pour density) and also the liquid viscosity decrease with saturation tem-perature which result in lower pressure drop). Choi et al. (2009) and Ali et al. (2011a) also reported similar results.
Figure 5.10. Frictional pressure drops of propane as a function of exit vapour qual-ity.
5.2.3 C o m p a r i s o n w i t h c o r r e l a t i o n s The experimental frictional pressure drops are compared with eight well known correlations for macro and micro scale in this section. In Figure 5.11, the predictions of different correlations of the experimental data before and after incipience of dryout are presented. As for ammonia, the two phase frictional pressure drops are calculated by dividing the test section in ten segments for each correlation and these local pressure drops are summed up to calculate the total two phase frictional pressure drop.
0
10
20
30
40
50
60
70
80
90
0 0.1 0.2 0.3 0.4 0.5 0.6 0.7 0.8 0.9 1 1.1
Fri
ctio
nal
dp
(kP
a/m
)
xexit(--)
G=300 kg/m^2s, Tsat=43CG=300 kg/m^2s, Tsat=33CG=400 kg/m^2s, Tsat=43CG=400 kg/m^2s, Tsat=33CG=500 kg/m^2s, Tsat=43CG=500 kg/m^2s, Tsat=33CSingle phase G=300 kg/m^2sSingle phase G=400 kg/m^2sSingle phase G=500 kg/m^2s

D o c t o r a l T h e s i s / M . H . M a qb o o l
60
The predictions of Müller Steinhagen and Heck (1986) correlation are plotted versus the experimental data in Figure 5.11a. This correlation was developed on the basis of a large data bank of different fluids. The corre-lation over predicted the experimental data at low values of frictional
Figure 5.11. Comparison of experimental frictional pressure drop of propane with (a) Müller Steinhagen and Heck (1986), (b) Friedel (1979), (c) Mishima and Hibiki (1996) and (d) Zhang and Webb (2001) correlations. pressure drops but predicted well at medium and higher frictional pres-sure drops. Overall this correlation predicts the experimental data with MAD of 17 %. The experimental frictional pressure drops are also com-pared with the macro scale correlation of Friedel (1979) and results are shown in Figure 5.11b. This correlation over predicted the experimental data at low frictional pressure drops more than Müller Steinhagen and Heck (1986) correlation. Overall this correlation predicts all the data with MAD of 23 %. The experimental frictional pressure drop gradients are also compared with the micro scale correlation of Mishima and Hibiki (1996) as shown in Figure 5.11c. This correlation is a modified form of Lockhart and Martinelli (1949) correlation with different values of C (Chisholm’s parameter). This correlation predicts the experimental data with MAD of 29 %. Zhang and Webb (2001) also developed a micro scale correlation to predict frictional pressure drop. The predictions of Zhang and Webb (2001) correlation of the experimental data are pre-

D o c t o r a l T h e s i s / M . H . M a qb o o l
61
sented in Figure 5.11d. The two phase multiplier in this correlation is based on reduced pressure and vapour fraction. This correlation predicts the experimental data with MAD of 31 %. The experimental frictional pressure drop gradients are also compared with the homogeneous model, Lockhart and Martinelli (1949) correlation, Chisholm (1973) cor-relation and Tran et al. (2000) correlation. The findings of all the predict-ing models tested in this study are presented in brief in table 5.3. The reader is referred to chapter 7 for the comparison of two phase pressure drop of ammonia and propane. Table 5.3. Comparison of pressure drop with correlation
Predicting model MAD (%) % of data within ±30 %
Müller Steinhagen and Heck (1986) 17 67 Friedel (1979) 23 55 Homogeneous model 46 23 Lockhart and Martinelli (1949) 27 51 Chisholm (1973) 40 46 Mishima and Hibiki (1996) 29 41 Zhang and Webb (2001) 31 40 Tran et al. (2000) 62 29
D o c t o r a l T h e s i s / M . H . M a qb o o l
62
6 Dryout of Propane
In designing a two phase mini-channel heat exchanger, it is necessary to know the dryout limit for a secure and efficient operation of system. The terms critical heat flux (CHF) and dryout are both used to describe a situation when the heated surfaces in an evaporator are no longer wetted by the liquid. Strictly speaking, the way in which this situation is reached determines whether it should be termed critical heat flux or dryout. Criti-cal heat flux could appear at any vapour fraction and represents the up-per limit of the heat flux where liquid is still in contact with the surface. Dryout appears at high vapour fraction, independently of heat flux, when there is not sufficient liquid left to fully wet the walls of the channel. At dryout, the wall temperature starts increasing due to the fact that heat transfer is deteriorated. In this chapter, the terms dryout incipience and dryout completion are used. The dryout incipience indicates the partial dryout at which surface temperatures start fluctuating and as a result, causing the deterioration of heat transfer. A sharp increase of the tem-perature reading of the last thermocouple has been observed at a slightly higher heat flux and this is called dryout completion. At this point the power supply is cut off to save the test section from overheating. The re-sults of dryout of propane and the effects of different parameters on dryout are discussed in this chapter as follows.
6 . 1 E x p e r i m e n t a l R e s u l t s o f D r y o u t o f P r o p a n e
The experimental conditions of dryout experiments of propane are tabu-lated in table 6.1. Table 6.1. Experimental conditions of dryout tests with propane.
Parameter Operating range
Fluid Propane
Di (mm) 1.70 1.224 Lh (mm) 245 Tsat (°C) 23, 33, 43 33,43 G (kg/m2s) 100-500 100-400 q´´ (kW/m2) 5- 280 5-183 Tsub,in (°C) 1

D o c t o r a l T h e s i s / M . H . M a qb o o l
63
6.1.1 D r y o u t h e a t f l u x d e t e c t i o n Figure 6.1 shows the typical boiling curve of the 1.70 mm tube for 100 kg/m2s at saturation temperature of 23 °C. The first change of slope in the boiling curve indicates departure from nucleate boiling and incipi-ence of dryout. The corresponding heat flux is considered as incipient dryout heat flux. The increase in the wall superheat is a clear indication that dry patches are temporarily formed on the boiling surface. These dryout patches are rewetted by the coming waves of liquid and this wet-ting and rewetting continues until complete dryout occurs, if the heat flux is gradually increased. Above the dryout incipience heat flux, heat flux is increased in small steps and long enough time is allowed before recording data. These small steps are repeated until the wall superheat at the last thermocouple position overshoots above 25 K. The power ap-plied to the test section is cut off at this point to save the test section from burnout. The incipience of dryout is clearly visible at a heat flux somewhere between 50 and 58 kW/m2.
Figure 6.1. Boiling curve and identification of Dryout Incipience and-Dryout Completion of propane in 1.70 mm diameter tube at 23 °C.
The occurrence of dryout can also be shown by the stability of the tem-perature profiles determined by the thermocouples. Figure 6.2 shows the temperature profiles of the last six thermocouples of the 1.70 mm tube for a mass flux of 100 kg/m2s at a saturation temperature of 23 °C as a function of recording time. As can be seen, large fluctuations in the last two thermocouples indicate dryout and rewetting of the surfaces. The fluctuations start at the downstream end of the test section, then gradu-ally moves upstream with the increase of heat flux. These large fluctua-tions increase the standard deviation in the temperature readings of the
0
20
40
60
80
100
0 3 6 9 12 15
q''
(kW
/m
2 )
∆T (oC)
G= 100 kg/m^2 s
DryoutIncipience
DryoutCompletion
Power cut off

D o c t o r a l T h e s i s / M . H . M a qb o o l
64
thermocouples. The steady state standard deviation closer to the inlet normally varies from 0.01 to 0.03 °C. The wall temperatures at the last two thermocouples and the corresponding standard deviations as a func-tion of non-dimensional length are plotted in Figure 6.3. Teyssedou et al. (1994), Ali and Palm (2011b) and Callizo et al. (2010a) also reported similar behaviour at the occurrence of dryout in their studies.
Figure 6.2. Temperature profiles of propane near dryout for the last six thermocouples versus time for the 1.70 mm diameter tube at 23 °C.
Figure 6.3. Temperature readings and corresponding standard devia-tions of propane in the 1.70 mm diameter tube at 23 °C near dryout completion.
25
30
35
40
45
50
0 2000 4000 6000 8000 10000
Tw
(o C)
Time (sec)
T_5 T_6
T_7 T_8
T_9 T_10
60.42 kW/m2
64.45 kW/m2
00.511.522.533.544.55
18202224262830323436
0.2 0.3 0.4 0.5 0.6 0.7 0.8 0.9 1
Std
ev (
T_z
)
T (
o C)
z*
T_z, G=100 kg/m^2 s,q''= 60.42 kW/m^2T_z, G=100 kg/m^2 s,q''= 64.45 kW/m^2Stdev(T_z), G=100 kg/m^2 s q''= 60.42 kW/m^2Stdev(T_z), G=100 kg/m^2 s q''= 64.45 kW/m^2
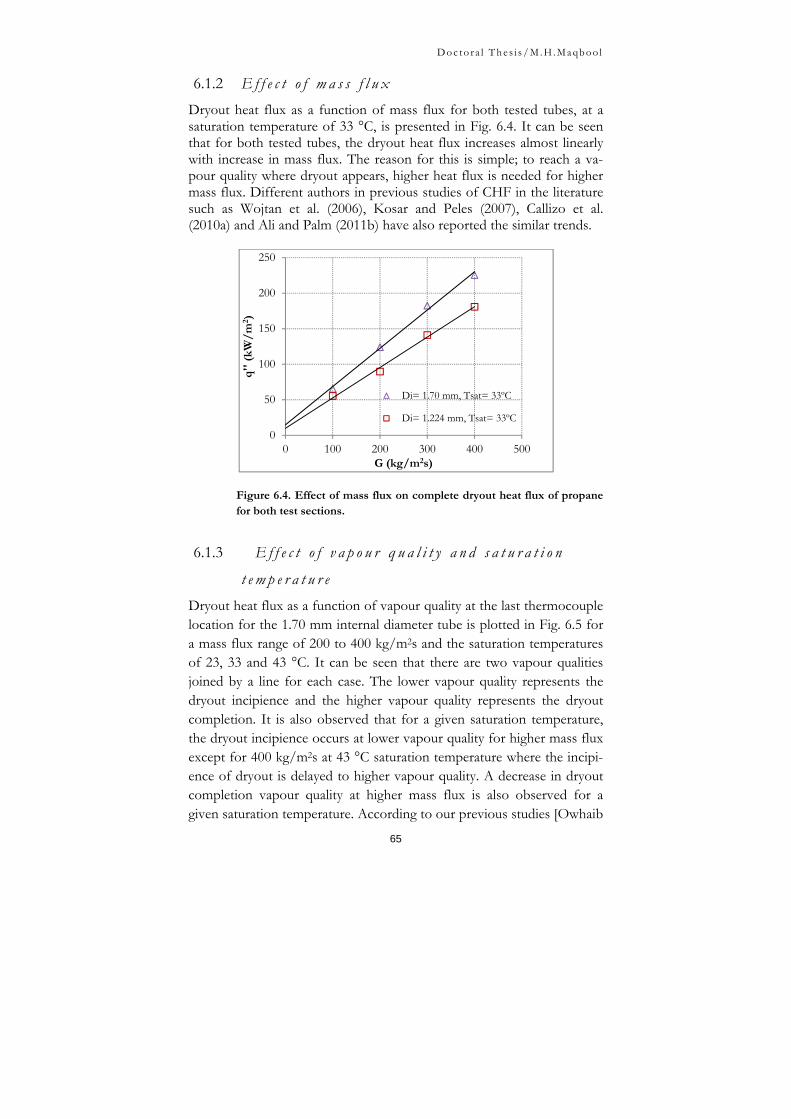
D o c t o r a l T h e s i s / M . H . M a qb o o l
65
6.1.2 E f f e c t o f m a s s f l u x Dryout heat flux as a function of mass flux for both tested tubes, at a saturation temperature of 33 °C, is presented in Fig. 6.4. It can be seen that for both tested tubes, the dryout heat flux increases almost linearly with increase in mass flux. The reason for this is simple; to reach a va-pour quality where dryout appears, higher heat flux is needed for higher mass flux. Different authors in previous studies of CHF in the literature such as Wojtan et al. (2006), Kosar and Peles (2007), Callizo et al. (2010a) and Ali and Palm (2011b) have also reported the similar trends.
Figure 6.4. Effect of mass flux on complete dryout heat flux of propane for both test sections.
6.1.3 E f f e c t o f v a p o u r q u a l i t y a n d s a t u r a t i o n
t e m p e r a t u r e Dryout heat flux as a function of vapour quality at the last thermocouple location for the 1.70 mm internal diameter tube is plotted in Fig. 6.5 for a mass flux range of 200 to 400 kg/m2s and the saturation temperatures of 23, 33 and 43 °C. It can be seen that there are two vapour qualities joined by a line for each case. The lower vapour quality represents the dryout incipience and the higher vapour quality represents the dryout completion. It is also observed that for a given saturation temperature, the dryout incipience occurs at lower vapour quality for higher mass flux except for 400 kg/m2s at 43 °C saturation temperature where the incipi-ence of dryout is delayed to higher vapour quality. A decrease in dryout completion vapour quality at higher mass flux is also observed for a given saturation temperature. According to our previous studies [Owhaib
0
50
100
150
200
250
0 100 200 300 400 500
q''
(kW
/m
2 )
G (kg/m2s)
Di= 1.70 mm, Tsat= 33ºC
Di= 1.224 mm, Tsat= 33ºC

D o c t o r a l T h e s i s / M . H . M a qb o o l
66
(2007), Ali (2010)] in which the flow regimes along a mini channel were studied, initiation of annular flow was found to start at much lower qualities than those at dryout. It has been suggested that, in annular flow, an increase in mass flow increases the droplet entrainment in the vapour core [Carey (1992)], thereby reducing the amount of liquid in the film, and thus also the film thickness. The liquid film may then break due to this droplet entrainment and the channel wall can be exposed to the va-pour. This can be a reason for the decrease in dryout completion vapour quality at higher mass fluxes. From Fig. 6.5, it can also be seen that for a given mass flux, the vapour quality at dryout incipience and dryout com-pletion increases with increase in saturation temperature except for 200 kg/m2s, where the vapour quality at dryout completion at 23 °C is mar-ginally higher than at 33 °C. The occurrence of dryout incipience and dryout completion at higher vapour qualities for higher saturation tem-perature at a given mass flux can be explained by the increase of vapour to liquid density ratio with saturation temperature which can reduce the droplet entrainment rate in the vapour core resulting in a delay of dryout occurrence [Ali and Palm (2011b)].
Figure 6.5. Effect of vapour quality on heat flux at dryout incipience and dryout completion of propane for the 1.70 mm diameter tube.
Figure 6.6 presents heat flux versus vapour quality at the last thermo-couple, for the mass flux range 200 to 400 kg/m2s and the saturation temperatures 33 °C and 43 °C in the 1.224 mm internal diameter tube. It can be seen that for a given mass flux, the vapour quality at dryout in-
0
50
100
150
200
250
0.5 0.6 0.7 0.8 0.9 1 1.1
q''
(kW
/m
2 )
Xth(..)
G=200 kg/m^s, Tsat=23ºC G=200 kg/m^s, Tsat=33ºCG=200 kg/m^s, Tsat=43ºC G=300 kg/m^s, Tsat=23ºCG=300 kg/m^s, Tsat=33ºC G=300 kg/m^s, Tsat=43ºCG=400 kg/m^s, Tsat=23ºC G=400 kg/m^s, Tsat=33ºCG=400 kg/m^s, Tsat=43ºC

D o c t o r a l T h e s i s / M . H . M a qb o o l
67
cipience increases with the increase in saturation temperature. As in the 1.70 mm tube, it is also observed here that, generally dryout vapour qual-ity is lower for higher mass flux which has been explained in the previ-ous paragraph. Wojtan et al. (2006) and Kosar and Peles (2007) have also observed general trends as in this study.
Figure 6.6. Effect of vapour quality on heat flux at dryout incipience and dryout completion of propane for the 1.224 mm diameter tube.
The effect of saturation temperature on the dryout heat flux can also be discussed from Figures 6.5 and 6.6. It can be seen from figures that the vapour fraction for dryout incipience and dryout completion is higher for higher saturation temperature however; the differences in heat flux are small. It can also be seen from Figures 6.5 and 6.6 that complete dry-out occurs almost at the same heat flux for all saturation temperatures. It can be concluded from Figures 6.5 and 6.6 that there is insignificant ef-fect of saturation temperatures on dryout heat flux. The vapour to liquid density ratio is directly proportional to saturation temperature and the la-tent heat of vaporization is inversely proportional to saturation tempera-ture. The increase in vapour to liquid density ratio with saturation tem-perature tends to reduce the velocity and thereby the droplet entrain-ment rate in the vapour core which may increase the dryout heat flux [Ali and Palm (2011b)]. The decrease in latent heat of vaporization with saturation temperature tends to reduce dryout heat flux [Kosar and Peles (2007)]. The mentioned opposing effects may be the reason for the small effect of saturation temperature on dryout heat flux. Also in famous Katto and Ohno (1984) correlation, vapour to liquid density ratio and la-tent heat of vaporization are in linear relationship with critical heat flux
0
50
100
150
200
250
0.5 0.6 0.7 0.8 0.9 1 1.1
q''
(kW
/m
2 )
Xth(..)
G=200 kg/m^s, Tsat=33ºC G=200 kg/m^s, Tsat=43ºCG=300 kg/m^s, Tsat=33ºC G=300 kg/m^s, Tsat=43ºCG=400 kg/m^s, Tsat=33ºC G=400 kg/m^s, Tsat=43ºC

D o c t o r a l T h e s i s / M . H . M a qb o o l
68
which is also an indication of the small effect of saturation temperature on critical heat flux.
6.1.4 E f f e c t o f t u b e d i a m e t e r
The effect of tube diameter on the dryout heat flux is depicted in Figure 6.7 where heat flux is plotted versus vapour quality for a range of differ-ent mass fluxes for the 1.70 mm and 1.224 mm internal diameter tubes. It can be seen that for a given mass flux, complete dryout heat flux is considerably higher for the larger diameter channel. The main reason for this is that the tube lengths are the same, and that a higher heat flux is necessary to reach a certain vapour quality in the large diameter tube. The effect of diameter can also be seen in Figure 6.4 where heat flux is plotted versus mass flux for both test sections at 33 °C saturation tem-perature.
Figure 6.7. Effect of channel diameter on heat flux for dryout incipience and dryout completion of propane at 43 °C saturation temperature.
Another point worth noting in Figures 6.5, 6.6 and 6.7 is that the dryout completion vapour qualities in some cases are above 1. This can be ex-plained by fluctuations in mass flux on the downstream side of the test section as a result of waves of liquid from upstream periodically wetting the test section up to a point where, on the average, the vapour quality is higher than 1 (c.f. Figure 6.2). Furthermore, in the cases where the va-pour fraction is calculated (by a heat balance) to be above one, the fluid temperature downstream of the test section is found to be above the
0
50
100
150
200
250
0.5 0.6 0.7 0.8 0.9 1 1.1
q''
(kW
/m
2 )
Xth(..)
G=200 kg/m^s, Di=1.224 mm G=300 kg/m^s, Di=1.224 mmG=400 kg/m^s, Di=1.224 mm G=200 kg/m^s, Di=1.70 mmG=300 kg/m^s, Di=1.70 mm G=400 kg/m^s, Di=1.70 mm

D o c t o r a l T h e s i s / M . H . M a qb o o l
69
saturation temperature. This confirms the vapour fraction given in the text, based on a heat balance for the test section.
6.1.5 C o m p a r i s o n w i t h c o r r e l a t i o n s To avoid burnout of the installed facility due to dryout, in cases where the heat flux rather than the temperature is given by the application, it is very important to have a good predicting model which can predict the complete dryout heat flux condition to minimize the risk of accidents. In this section, an effort has been made to compare our experimental data of complete dryout with well-known verified predicting methods for macro channels which have been used for decades, like the correlations by Katto and Ohno (1984), Bowring (1972), and Shah (1987), to see their applicability in minichannels. The experimental data is also compared with predicting methods which are developed specifically for mini and micro channels like Callizo et al. (2010a), Bowers and Mudawar (1994), Qi et al. (2007), Zhang et al. (2006) and Wojtan et al. (2006). The reader is referred to the article 4 appended in the thesis for further details of the CHF correlations mentioned in this study.
Figure 6.8 shows the comparison of the experimental data with Katto and Ohno (1984) correlation at all three saturation temperatures for the 1.70 mm and the 1.224 mm internal diameter tubes. This correlation has been developed for macro channels using data of different fluids like wa-ter, nitrogen, helium, R22, R113 and R12 and as can be seen, it predicts the data reasonably well with a MAD of 17 % and about 67 % of the
Figure 6.8. Comparison of experimental data of propane with Katto and Ohno (1984) correlation.
0
50
100
150
200
250
300
0 50 100 150 200 250 300
q''
pre
d(k
W/
m2 )
q''exp (kW/m2)
Di= 1.70 mmDi= 1.224 mm
+20%
-20%
0%
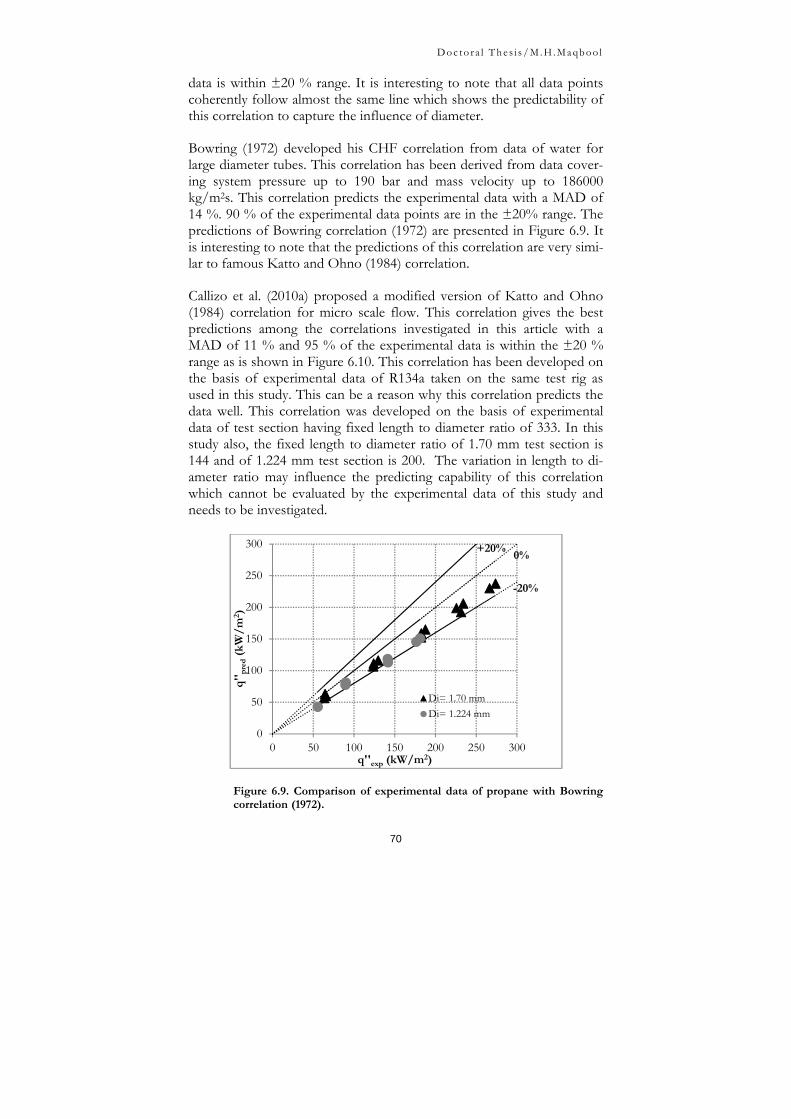
D o c t o r a l T h e s i s / M . H . M a qb o o l
70
data is within ±20 % range. It is interesting to note that all data points coherently follow almost the same line which shows the predictability of this correlation to capture the influence of diameter.
Bowring (1972) developed his CHF correlation from data of water for large diameter tubes. This correlation has been derived from data cover-ing system pressure up to 190 bar and mass velocity up to 186000 kg/m2s. This correlation predicts the experimental data with a MAD of 14 %. 90 % of the experimental data points are in the ±20% range. The predictions of Bowring correlation (1972) are presented in Figure 6.9. It is interesting to note that the predictions of this correlation are very simi-lar to famous Katto and Ohno (1984) correlation.
Callizo et al. (2010a) proposed a modified version of Katto and Ohno (1984) correlation for micro scale flow. This correlation gives the best predictions among the correlations investigated in this article with a MAD of 11 % and 95 % of the experimental data is within the ±20 % range as is shown in Figure 6.10. This correlation has been developed on the basis of experimental data of R134a taken on the same test rig as used in this study. This can be a reason why this correlation predicts the data well. This correlation was developed on the basis of experimental data of test section having fixed length to diameter ratio of 333. In this study also, the fixed length to diameter ratio of 1.70 mm test section is 144 and of 1.224 mm test section is 200. The variation in length to di-ameter ratio may influence the predicting capability of this correlation which cannot be evaluated by the experimental data of this study and needs to be investigated.
Figure 6.9. Comparison of experimental data of propane with Bowring correlation (1972).
0
50
100
150
200
250
300
0 50 100 150 200 250 300
q''
pre
d(k
W/
m2 )
q''exp (kW/m2)
Di= 1.70 mmDi= 1.224 mm
+20%
-20%
0%

D o c t o r a l T h e s i s / M . H . M a qb o o l
71
The correlation proposed by Bowers and Mudawar (1994) predicts all the experimental data with a MAD of 19 % and about 67 % of the ex-perimental data is within ±20 %. It should be noted that the length to diameter ratio used for the 1.70 mm tube in this study is comparable to the length to diameter ratio used by Bowers and Mudawar (1994). The predictions of this correlation are compared to the experimental data in Figure 6.11.
Figure 6.10. Comparison of experimental data of propane with Callizo et al. correlation (2010).
Figure 6.11. Comparison of experimental data of propane with Bowers and Mudawar correlation (1994).
0
50
100
150
200
250
300
0 50 100 150 200 250 300
q''
pre
d(k
W/
m2 )
q'' exp(kW/m2)
Di= 1.70 mmDi= 1.224 mm
+20%
-20%
0%
0
50
100
150
200
250
300
0 50 100 150 200 250 300
q''
pre
d(k
W/
m2 )
q''exp (kW/m2)
Di= 1.70 mmDi= 1.224 mm
+20%
-20%
0%

D o c t o r a l T h e s i s / M . H . M a qb o o l
72
A summary of the comparison with all used correlations in this study, in-cluding Shah (1987), Wojtan et al. (2006), Zhang et al. (2006), and Qi et al. (2007) are tabulated in table 6.2.
It can be noted that Callizo et al. (2010a), Bowring (1972) and Katto and Ohno (1984) are the ones among the correlations considered in this study which predicted the dryout data of propane well. It is also worth noting that all these three correlations under predicted the experimental data of propane. If these correlations are multiplied with a leading con-stant 1.15 then the predicting capability of these correlations is remarka-bly improved at least for the experimental data of propane. After multi-plying the leading constant, Callizo et al. (2010a), Bowring (1972) and Katto and Ohno (1984) predicted the experimental data with MAD of 5, 6 and 4 % respectively.
Table 6.2. Assessment of correlations for dryout data of propane
Correlation MAD (%)
% of data within ±20%
Katto and Ohno (1984) 16 81 Shah (1987) 37 0 Bowring (1972) 13 91 Callizo et al. (2010a) 10 95 Wojtan et al. (2006) 34 19 Zhang et al. (2006) 22 33 Qi et al. (2007) 36 57 Bowers and Mudawar (1994) 19 62

D o c t o r a l T h e s i s / M . H . M a qb o o l
73
7 Comparison of Ammonia and Propane with R134a
Ammonia and propane are the potential candidates to replace HFCs as refrigerants because of environmental concerns. The major concerns about ammonia and propane are their toxicity and flammability respec-tively. Low fluid inventory in mini and micro channels can address these concerns and provide an opportunity to get an advantage of the favour-able properties of ammonia and propane as well as to save the environ-ment. This chapter presents a comparison of ammonia and propane with R134a. The similarities and differences of the effect of different parame-ters on heat transfer, pressure drop and dryout are discussed in this chapter. The results of R134a are taken from the experimental data taken on the same test rig as in this study by Owhaib (2007) and Ali (2010).
7 . 1 C o m p a r i s o n o f H e a t T r a n s f e r o f A m m o n i a , P r o p a n e a n d R 1 3 4 a
A summary of the experimental conditions of flow boiling experiments of ammonia, propane and R134a are tabulated in table 7.1.
Table 7.1. Experimental conditions of ammonia, propane and R134a for heat transfer.
Parameter Operating range
Ammonia Propane R134a
Di (mm) 1.70, 1.224 1.70 1.70, 1.224 Lh (mm) 245 245 220 Tsat (°C) 23, 33, 43 23, 33, 43 24, 27, 32, 34 G (kg/m2s) 100-500 100-500 50-600 q´´ (kW/m2) 10-355 5-280 2- 156 Tsub,in (°C) 1 1 3
The local heat transfer coefficients of ammonia, propane and R134a are plotted in Figures 7.1a, 7.1b and 7.1c against local vapour qualities for a range of mass fluxes. The experimental data is plotted for ammonia

D o c t o r a l T h e s i s / M . H . M a qb o o l
74
Figure 7.1. Effect of mass flux (a). ammonia, (b). propane, (c). R134a.
0
5
10
15
20
25
30
35
40
45
50
0 0.1 0.2 0.3 0.4 0.5
Loc
al h
(kW
/m
2 K)
X(--)
"G=200 kg/m^s, q''=200 kW/m^2",Di=1.70 mm"G=300 kg/m^s, q''=200 kW/m^2",Di=1.70 mm"G=400 kg/m^s, q''=200 kW/m^2",Di=1.70 mm"G=200 kg/m^s, q''=220 kW/m^2",Di=1.224 mm"G=300 kg/m^s, q''=220 kW/m^2",Di=1.224 mm"G=400 kg/m^s, q''=220 kW/m^2",Di=1.224 mm
(a, ammonia)
0
4
8
12
16
20
0 0.1 0.2 0.3 0.4 0.5 0.6 0.7 0.8
Loc
al h
(kW
/m
2 K)
X(--)
G=200 kg/m^s, q''=60 kW/m^2, Di=1.70 mmG=300 kg/m^s, q''=60 kW/m^2, Di=1.70 mmG=400 kg/m^s, q''=60 kW/m^2, Di=1.70 mmG=200 kg/m^s, q''=100 kW/m^2, Di=1.70 mmG=300 kg/m^s, q''=100 kW/m^2, Di=1.70 mmG=400 kg/m^s, q''=100 kW/m^2, Di=1.70 mm
(b, propane)
0
2
4
6
8
10
12
14
-0.1 0 0.1 0.2 0.3 0.4 0.5 0.6
Loc
al h
(kW
/m
2 K)
X(--)
"G=135 kg/m^s, q''=40 kW/m^2",Di=1.70 mm"G=155 kg/m^s, q''=40 kW/m^2",Di=1.70 mm"G=200 kg/m^s, q''=40 kW/m^2",Di=1.70 mm"G=300 kg/m^s, q''=40 kW/m^2",Di=1.70 mm"G=200 kg/m^s, q''=20 kW/m^2",Di=1.224 mm"G=300 kg/m^s, q''=20 kW/m^2",Di=1.224 mm"G=400 kg/m^s, q''=20 kW/m^2",Di=1.224 mm"G=500 kg/m^s, q''=20 kW/m^2",Di=1.224 mm
(c, R134a)

D o c t o r a l T h e s i s / M . H . M a qb o o l
75
and propane at saturation temperature of 23 °C and for R134a, the plot-ted data are taken at saturation temperature of 24 °C in case of 1.224 mm and at 27 °C in case of 1.70 mm. It can be seen from Figure 7.1 that the effect of mass flux on heat transfer coefficient is insignificant for ammonia, propane and R134a in 1.70 mm and 1.224 mm tubes with the one exception of ammonia in 1.224 mm tube where the insignificance of mass flux only last up to a certain range of vapour qualities, then a clear effect of mass flux on the heat transfer coefficient is observed at higher vapour qualities. The insignificant effect of mass flux seen in most cases indicates that a nucleate boiling like mechanism is dominating. The trends of ammonia in the 1.224 mm tube show that heat transfer in this case is controlled by more than one boiling mechanism.
The effect of heat flux on the local heat transfer coefficients of ammo-nia, propane and R134a are presented in Figures 7.2a, 7.2b and 7.2c re-spectively. It can be seen from Figures 7.2 that heat flux has significant effect on the local heat transfer coefficients of ammonia, propane and R134a but with one exception of ammonia in 1.224 mm tube where the effect of heat flux only lasts for a certain range of vapour qualities and for higher vapour qualities, the effect of heat flux on the local heat trans-fer coefficient seems to be diminished. These results show that the heat transfer of ammonia, propane and R134a (except ammonia in 1.224 mm tube) in minichannels is governed by one boiling mechanism whereas heat transfer of ammonia in 1.224 mm tube is governed by more than one boiling mechanism.
The effect of saturation temperature on heat transfer coefficients of ammonia propane and R134a are plotted in Figures 7.3a, 7.3b and 7.3c respectively. It can be seen from Figure 7.3a that the heat transfer coeffi-cient of ammonia is higher for higher saturation temperatures up to a certain vapour fraction. As the vapour fraction increases, the difference in the heat transfer coefficient for the three saturation temperatures de-creases and at high vapour fractions, the influence of saturation tempera-ture on the heat transfer coefficient diminishes. From figures 7.3b and 7.3c, it can be seen that increasing saturation temperature slightly en-hances the heat transfer coefficients of propane and R134a.
The effect of tube diameter on the heat transfer coefficients of ammonia and R134a is shown in Figures in 7.4a and 7.4b respectively. The average heat transfer coefficients of ammonia are plotted in Figure 7.4a versus the imposed wall heat fluxes at a mass flux of 300 kg/m2s and at a satu-ration temperature of 43 °C for both test sections. The average heat transfer coefficients of R134a are plotted in Figure 7.4b versus the im-posed wall heat fluxes at a mass flux of 300 kg/m2s and at a saturation temperature of 32 °C in case of 1.70 mm tube and at saturation

D o c t o r a l T h e s i s / M . H . M a qb o o l
76
Figure 7.2. Effect of heat flux (a). ammonia, (b). propane, (c). R134a.
0
10
20
30
40
50
60
0 0.1 0.2 0.3 0.4 0.5 0.6
Loc
al h
(kW
/m
2 K)
X(--)
"G=300 kg/m^s, q''=140 kW/m^2",Di=1.70 mm"G=300 kg/m^s, q''=200 kW/m^2",Di=1.70 mm"G=300 kg/m^s, q''=260 kW/m^2",Di=1.70 mm"G=300 kg/m^s, q''=220 kW/m^2",Di=1.224 mm"G=300 kg/m^s, q''=240 kW/m^2",Di=1.224 mm"G=300 kg/m^s, q''=260 kW/m^2",Di=1.224 mm
(a, ammonia )
0
5
10
15
20
25
30
0 0.1 0.2 0.3 0.4 0.5 0.6 0.7 0.8
Loc
al h
(kW
/m
2 K)
X(--)
"G=300 kg/m^s, q''=60 kW/m^2",Di=1.70 mm
"G=300 kg/m^s, q''=100 kW/m^2",Di=1.70 mm
"G=300 kg/m^s, q''=140 kW/m^2",Di=1.70 mm
(b, propane)
0
2
4
6
8
10
12
14
0 0.1 0.2 0.3 0.4 0.5 0.6
Loc
al h
(kW
/m
2K
)
X (--)
"G=300 kg/m^s, q''=60 kW/m^2",Di=1.70 mm"G=300 kg/m^s, q''=74 kW/m^2",Di=1.70 mm"G=300 kg/m^s, q''=17 kW/m^2",Di=1.224 mm"G=300 kg/m^s, q''=25 kW/m^2",Di=1.224 mm
(c, R134a)

D o c t o r a l T h e s i s / M . H . M a qb o o l
77
Figure 7.3. Effect of saturation temperature (a). ammonia, (b). propane, (c). R134a.
0
10
20
30
40
50
60
70
0 0.1 0.2 0.3 0.4 0.5 0.6 0.7
Loc
al h
(kW
/m
2K
)
X(--)
G=200 kg/m^s, q''=260 kW/m^2 Di=1.70 mm, Tsat=23CG=200 kg/m^s, q''=260 kW/m^2 Di=1.70 mm, Tsat=33CG=200 kg/m^s, q''=260 kW/m^2 Di=1.70 mm, Tsat=43CG=300 kg/m^s, q''=260 kW/m^2,Di=1.224 mm, Tsat=23CG=300 kg/m^s, q''=260 kW/m^2,Di=1.224 mm, Tsat=33CG=300 kg/m^s, q''=260 kW/m^2,Di=1.224 mm, Tsat=43C
(a, ammonia)
0
5
10
15
20
25
30
35
0 0.1 0.2 0.3 0.4 0.5 0.6 0.7 0.8 0.9 1
Loc
al h
(kW
/m
2 K)
Local x(--)
G=200 kg/m^s, q''=100 kW/m^2,Tsat=23C, Di=1.70 mm
G=200 kg/m^s,q''=100 kW/m^2, Tsat=33C, Di=1.70 mm
G=200 kg/m^s,q''=100 kW/m^2, Tsat=43C, Di=1.70 mm
(b, propane)
0
2
4
6
8
10
12
0 0.1 0.2 0.3 0.4 0.5 0.6
Loc
al h
(kW
/m
2K
)
X(--)
G=200 kg/m^s, q''=50 kW/m^2,Di=1.70 mm, Tsat= 27CG=200 kg/m^s, q''=50 kW/m^2,Di=1.70 mm, Tsat= 32CG=200 kg/m^s, q''=20 kW/m^2,Di=1.224 mm, Tsat= 24CG=200 kg/m^s, q''=20 kW/m^2,Di=1.224 mm, Tsat= 34C
(c, R134a)

D o c t o r a l T h e s i s / M . H . M a qb o o l
78
temperature of 34 °C in case of 1.224 mm tube. It can be seen that the average heat transfer coefficient increases with decrease in tube diameter.
Figure 7.4. Diametric effects (a). ammonia, (b). R134a
The thickness of the liquid film can be reduced due to the surface ten-sion effects in smaller diameter tube. The higher heat transfer coefficient in smaller diameter tube may be due to this thinner liquid film inside the wall which can enhance the heat transfer compared to the larger diame-ter channel. It can also be seen from Figure 7.4a that the average heat transfer coefficients of ammonia and R134a are higher for higher heat flux. It is worth mentioning that the average heat transfer coefficient of ammonia in 1.224 mm tube is still higher even when the influence of heat flux on the local heat transfer coefficient at high vapour fractions is
0
5
10
15
20
25
30
35
40
45
50
0 50 100 150 200 250 300
Ave
rage
h (
kW/
m2 K
)
q'' (kW/m2)
G=300 kg/m^2s,Tsat=43C,Di=1.224mmG=300 kg/m^2s,Tsat=43C,Di=1.70mm
(a)
0
2
4
6
8
10
12
0 10 20 30 40 50 60 70
h (
kW/
m2
K)
q'' (kW/m2)
G=300 kg/m^s, Di=1.70 mm",Tsat=32CG=300 kg/m^s, Di=1.224 mm",Tsat=34C
(b)

D o c t o r a l T h e s i s / M . H . M a qb o o l
79
insignificant as can be seen in Figure 7.2a. This shows that the average heat transfer coefficient in 1.224 mm tube is still influenced by the con-vective effects.
As can be seen from the comparison of heat transfer of propane and R134a, the effect of mass flux on the heat transfer coefficient is insignifi-cant and the heat transfer coefficients are higher for higher heat fluxes. These results show the dominance of nucleate boiling like mechanism with R134a and propane in mini channels. In case of ammonia, the effect of mass flux and heat flux on the heat transfer coefficients with 1.70 mm tube is similar to that of R134a and propane while with 1.224 mm tube; two mechanisms seem to be important. In the lower quality region, the effect of mass flux with 1.224 mm tube is insignificant and the heat transfer coefficient is higher for higher heat flux. In moderately higher vapour qualities, a significant effect of mass flux and insignificant effect of heat flux is observed. This may be explained by the gradual suppres-sion of nucleate boiling and an increasing dominance of convective ef-fects.
Table 7.2. Thermo physical properties of ammonia, propane and R134a
Fluid Tsat (°C) ρl/ ρV μl/ μv σ (mN/m)
Ammonia
23 33 43
82.08 59.77 44.00
13.81 11.10 10.67
25.40 22.40 19.40
Propane
23 33 43
25.25 18.92 14.18
11.51 9.78 8.42
7.23 6.02 4.87
R134a
23 33 43
39.79 28.67 20.57
17.35 14.59 12.37
8.30 7.02 5.75
During experiments with R134a, R236fa and R245fa to see flow pattern transitions, Ong and Thome (2011a) observed that R245fa yields the lowest isolated bubble to coalescing bubble and coalescing bubble to an-nular vapour quality transition which is explained by the higher surface tension of R245fa than that of R134a and R236fa. Also in this study as can be seen from table 7.2, the surface tension of ammonia is much higher than that of propane and R134a which may result in early transi-tion to annular flow and hence to convective boiling than propane and R134a. The vapour density of ammonia is also lower than that of R134a and propane which can increase the degree of expansion of the vapour phase and can be a reason for early transition to annular flow.
Recently Ong and Thome (2011a) proposed new macro-to-micro threshold criteria on the basis of flow visualizations and film thickness uniformity/nonuniformity involving confinement effects. They pro-

D o c t o r a l T h e s i s / M . H . M a qb o o l
80
posed a lower threshold of macro scale flow is about Co= 0.3- 0.4 whilst the upper threshold of micro scale flow is considered to be Co~1, with a transition region in-between i.e. 0.3- 0.4 ≤ Co ≤ 1. The occurrence of more than one boiling mechanism in 1.224 mm tube in case of ammonia and nucleate boiling like mechanism in all other conditions can also be explained by the latest criteria of transition from macro to micro scale. As can be seen from the table 7.3 that according to the criteria men-tioned, 1.224 mm and 1.70 mm behave as micro channels with ammonia and behave as transition region from macro to micro scale (may call minichannels) with R134a and propane. Ong and Thome (2011a) re-ported that as channel confinement increases, the transition from bubbly to annular flow was observed to occur at lower vapour qualities which can be a reason for the appearance of convective effects in 1.224 mm channel with ammonia.
As can be seen from table 7.3, the confinement number of ammonia with 1.70 mm tube is 1.19 which is close to the threshold of Co~1 for micro scale which can be a reason for the lower suppression of nuclea-tion and in result nucleate boiling like mechanism in 1.70 mm tube. The confinement number of ammonia with 1.224 mm tube is 1.65 which is well above threshold of Co~1 which can be a reason for the appearance of convection heat transfer of ammonia in 1.224 mm tube due to ap-preciable suppression of nucleation.
Table7.3: Confinement number at 30 °C.
Fluid 1.70 mm 1.224 mmAmmonia 1.191 1.654 Propane 0.698 0.970
R134a 0.477 0.662
The heat transfer coefficients of propane and R134a are higher for higher saturation temperature. As can be seen from table 7.2, higher saturation temperature leads to lower surface tension. A lower surface tension results in an increase of active nucleation site density and a de-crease in bubble departure diameter which causes increase in the heat transfer coefficient with the increase in saturation temperature (Chen et al. (2011)). The effect of saturation temperature on the heat transfer co-efficient of ammonia is two-fold. The heat transfer coefficient increases with saturation temperature at low vapour qualities and the effect of saturation temperature gradually decreases with the increase in vapour quality. As mentioned in previous paragraph for ammonia, higher con-finement effect may be the reason for the enhancement of convective

D o c t o r a l T h e s i s / M . H . M a qb o o l
81
Figure 7.5. Comparison with heat transfer correlations
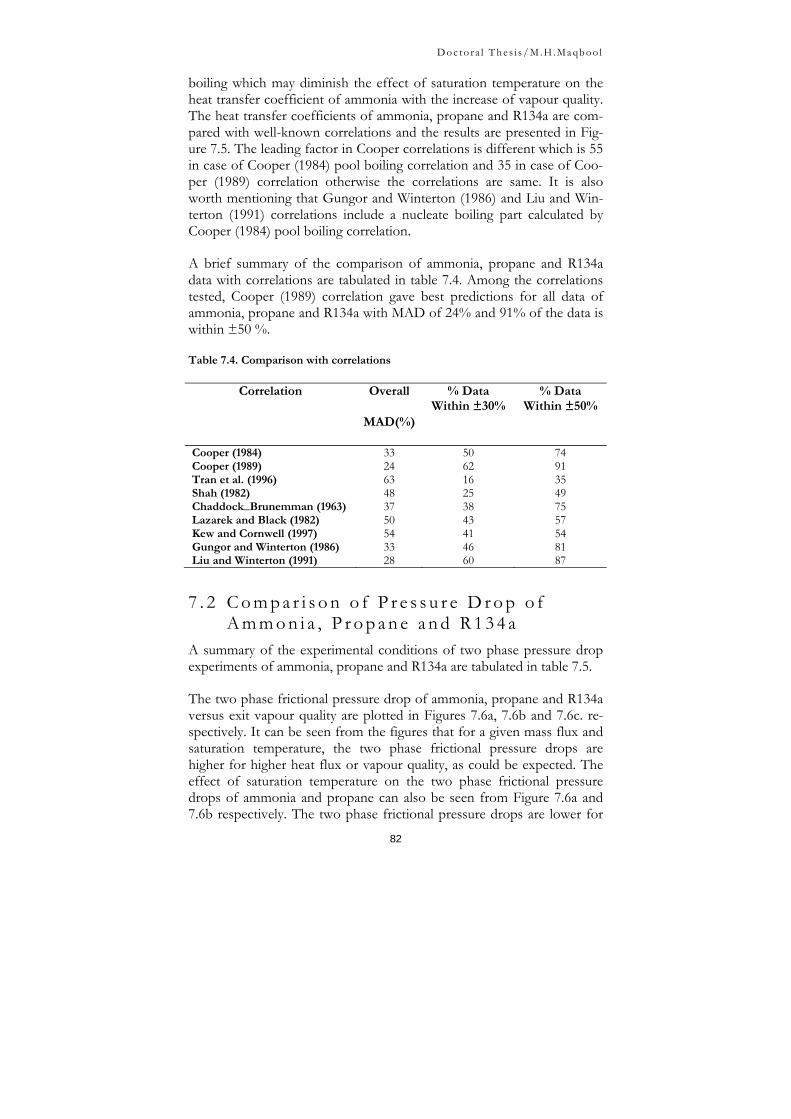
D o c t o r a l T h e s i s / M . H . M a qb o o l
82
boiling which may diminish the effect of saturation temperature on the heat transfer coefficient of ammonia with the increase of vapour quality. The heat transfer coefficients of ammonia, propane and R134a are com-pared with well-known correlations and the results are presented in Fig-ure 7.5. The leading factor in Cooper correlations is different which is 55 in case of Cooper (1984) pool boiling correlation and 35 in case of Coo-per (1989) correlation otherwise the correlations are same. It is also worth mentioning that Gungor and Winterton (1986) and Liu and Win-terton (1991) correlations include a nucleate boiling part calculated by Cooper (1984) pool boiling correlation.
A brief summary of the comparison of ammonia, propane and R134a data with correlations are tabulated in table 7.4. Among the correlations tested, Cooper (1989) correlation gave best predictions for all data of ammonia, propane and R134a with MAD of 24% and 91% of the data is within ±50 %.
Table 7.4. Comparison with correlations
Correlation Overall
MAD(%)
% Data Within ±30%
% Data Within ±50%
Cooper (1984) 33 50 74 Cooper (1989) 24 62 91 Tran et al. (1996) 63 16 35 Shah (1982) 48 25 49 Chaddock_Brunemman (1963) 37 38 75 Lazarek and Black (1982) 50 43 57 Kew and Cornwell (1997) 54 41 54 Gungor and Winterton (1986) 33 46 81 Liu and Winterton (1991) 28 60 87
7 . 2 C o m p a r i s o n o f P r e s s u r e D r o p o f A m m o n i a , P r o p a n e a n d R 1 3 4 a
A summary of the experimental conditions of two phase pressure drop experiments of ammonia, propane and R134a are tabulated in table 7.5.
The two phase frictional pressure drop of ammonia, propane and R134a versus exit vapour quality are plotted in Figures 7.6a, 7.6b and 7.6c. re-spectively. It can be seen from the figures that for a given mass flux and saturation temperature, the two phase frictional pressure drops are higher for higher heat flux or vapour quality, as could be expected. The effect of saturation temperature on the two phase frictional pressure drops of ammonia and propane can also be seen from Figure 7.6a and 7.6b respectively. The two phase frictional pressure drops are lower for

D o c t o r a l T h e s i s / M . H . M a qb o o l
83
higher saturation temperature. The higher the saturation temperature, the higher the vapour density which results in lower velocity and this can be
Table 7.5. Experimental conditions of pressure drop experiments
Parameter Operating range
Ammonia Propane R134a
Di (mm) 1.70, 1.224 1.70 1.70, 1.224 Lh (mm) 245 245 220 Tsat (°C) 23, 33, 43 23, 33, 43 34 G (kg/m2s) 100-500 100-500 100-400 q´´(kW/m2) 10-355 5-276 0- 30 Tsub,in (°C) 1 1 3
a reason of lower pressure drop for higher saturation temperature. A comparison of diametric effects of ammonia and R134a can also be done from the graphs. It can be seen from figure 7.6a that the two phase pres-sure drop of ammonia is higher for lower diameter channel, when com-pared at equal mass flux. This effect is quite clear in case of ammonia and unclear in case of R134a. The diametric effects of R134a data are contrary to the expected trends. This was explained by Owhaib (2007) as the influence of flow pattern transitions.
From the comparison of two phase pressure drop of ammonia, propane and R134a, it has been observed that the effects of mass flux, saturation temperature and heat flux are similar as expected. The two phase pres-sure drop increases with the increase of mass flux, with the increase of heat flux and with the decrease of saturation temperature.
One point worth commenting is the decrease of two phase pressure drop of propane very close to dryout which can be explained by the transition from wavy annular to smooth annular flow.
The experimental two phase frictional pressure drop data are compared with well-known correlations from literature and the comparisons are presented in Figure 7.7. A brief summary of all macro and micro scale correlations tested for ammonia, propane and R134a are tabulated in ta-ble 7.6. Among the correlations tested, the macro scale correlation of Müller Steinhagen & Heck (1986) and micro scale correlation of Zhang and Webb (2001) predicted all experimental data best, with a MAD of 34%. It is interesting to note that the predictions of homogeneous model are most coherent among the correlations considered in this study.

D o c t o r a l T h e s i s / M . H . M a qb o o l
84
Figure 7.6. Pressure drop versus vapour fraction (a). ammonia, (b). propane, (c). R134a.
0255075
100125150175200225250
0 0.1 0.2 0.3 0.4 0.5 0.6 0.7
dP
(exp
) fr
icti
onal
(m
bar
)
X(--)G=300 kg/m^2s,Tsat=33C,Di=1,7mm G=300 kg/m^2s,Tsat=33C,Di=1,224mmG=400 kg/m^2s,Tsat=43C,Di=1,7mm G=400 kg/m^2s,Tsat=43C,Di=1,224mmG=500 kg/m^2s,Tsat=23C,Di=1,7mm G=500 kg/m^2s,Tsat=23C,Di=1,224mm
(a, ammonia)
0255075
100125150175200225250
0 0.2 0.4 0.6 0.8 1
dP
fric
(mb
ar)
x(--)
G=300 kg/m^2s, Tsat=43C, Di=1.70 mmG=300 kg/m^2s, Tsat=33C, Di=1.70 mmG=400 kg/m^2s, Tsat=43C, Di=1.70 mmG=400 kg/m^2s, Tsat=33C, Di=1.70 mmG=500 kg/m^2s, Tsat=43C, Di=1.70 mmG=500 kg/m^2s, Tsat=33C, Di=1.70 mm
(b, propane)
0102030405060708090
100
0 0.2 0.4 0.6 0.8 1
dP
fric
(mb
ar)
X (--)
G=100 kg/m^2s, Di=1.70 mmG=100 kg/m^2s, Di=1.224 mmG=200 kg/m^2s, Di=1.70 mmG=200 kg/m^2s, Di=1.224 mmG=300 kg/m^2s, Di=1.70 mmG=300 kg/m^2s, Di=1.224 mmG=400 kg/m^2s, Di=1.70 mmG=400 kg/m^2s, Di=1.224 mm
(c, R134a)

D o c t o r a l T h e s i s / M . H . M a qb o o l
85
Figure 7.7. Comparison of experimental two phase frictional pressure drops of ammonia, propane and R134a with correlations.

D o c t o r a l T h e s i s / M . H . M a qb o o l
86
Table 7.6. Comparison of data with pressure drop correlations.
Correlation Overall
MAD(%)
% Data Within ±30%
% Data Within ±50%
Homogeneous model 36 48 87 Lockhart & Martinelli (1949) 86 43 58 Friedel (1979) 39 61 84 Müller Steinhagen & Heck (1986) 34 58 89 Mishima & Hibiki (1996) 47 61 74 Tran et al.(2000) 283 0 2 Zhang & Webb (2001) 34 66 84
7 . 3 C o m p a r i s o n o f D r y o u t o f P r o p a n e a n d R 1 3 4 a
The experiments were conducted in two vertical stainless steel test sec-tions of 1.70 and 1.224 mm tube. A summary of the operating condi-tions is presented in table 7.7.
Table 7.7. Operating conditions of dryout experiments
Parameter Operating range
Propane R134a
Di (mm) 1.70 1.224 1.70,1.224 Lh (mm) 245 220 Tsat (°C) 23, 33, 43 33, 43 27, 32 G (kg/m2s) 100-500 100-400 50-600 q´´ (kW/m2) 5- 280 5-183 18-156 Tsub,in (°C) 1 3
The dryout heat fluxes of propane and R134a are plotted against mass fluxes in Figure 7.8 for both test sections (1.70 and 1.224 mm) at satura-tion temperatures of 33 °C and 32 °C respectively. It can be seen that for both R134a and propane, dryout heat flux is higher for higher mass flux as expected. To reach dryout vapour qualities, higher heat flux is needed for higher mass flux which is the reason that dryout heat flux is higher for higher mass flux. It can also be seen from Figure 7.8 that for a given mass flux, dryout heat flux of propane is higher than that of R134a.Ong and Thome (2011b) explained that the fluid with higher latent heat of vaporization has higher CHF which is also the case in this study. An-other observation from Figure 7.8 worth mentioning is that for a given mass flux, the dryout heat flux is higher for the larger diameter channel. This can be explained by the increased shear forces in lower diameter

D o c t o r a l T h e s i s / M . H . M a qb o o l
87
channel which can break the liquid film earlier than higher diameter channel and hence the wall of the lower diameter channel can become dry which can be the reason that the dryout heat flux is higher for higher diameter channel.
Figure 7.8. Mass flux versus complete dryout heat flux of propane and R134a.
The dryout incipience and completion heat fluxes of propane and R134a in 1.70 mm and 1.224 mm are plotted against vapour qualities in Figures 7.9 and 7.10 for a range of mass fluxes and saturation temperatures. As in chapter 6 there are two vapour qualities joined by a line for each case. The lower vapour quality represents the dryout incipience and the higher vapour quality represents the dryout completion. It can be observed in both figures (7.9 and 7.10) that dryout completion vapour quality is lower for higher mass flux. According to previous studies [Owhaib (2007), Ali (2010)] in which the flow regimes along a mini channel were studied, initiation of annular flow was found to start at much lower qualities than those at dryout. It has been suggested that, in annular flow, an increase in mass flow increases the droplet entrainment in the vapour core [Carey (1992)], thereby reducing the amount of liquid in the film, and thus also the film thickness. The liquid film may then break due to this droplet entrainment and the channel wall can be exposed to the va-pour. This can be a reason for the decrease in dryout completion vapour quality at higher mass fluxes. It can also be seen in both figures (7.9 and 7.10) that incipience of dryout occurs at different heat fluxes for propane and R134a at different saturation temperatures with no clear trend. However, the differences in heat flux are small. It can also be seen that
0
50
100
150
200
250
0 100 200 300 400 500 600
Dry
out
hea
t fl
ux
(kW
/m
2 )
G (kg/m2s)
d=1.22mm,Tsat=32 ºC, R134a d=1.70 mm,Tsat=32 ºC, R134ad=1.22 mm, Tsat=33 ºC, propane d=1.70 mm, Tsat=33 ºC, propane

D o c t o r a l T h e s i s / M . H . M a qb o o l
88
Figure 7.9 Vapour quality versus heat flux at dryout incipience and dryout com-pletion of propane and R134a for the 1.70 mm diameter tube.
Figure 7.10. Vapour quality versus heat flux at dryout incipience and dryout com-pletion of propane and R134a for the 1.224 mm diameter tube.
complete dryout occurs almost at the same heat flux for all saturation temperatures. It can be concluded from Figures 7.9 and 7.10 that there is an insignificant effect of saturation temperatures on dryout heat flux of propane and R134a. The vapour to liquid density ratio is directly propor-tional to saturation temperature and the latent heat of vaporization is in-versely proportional to saturation temperature. The increase in vapour to
0
50
100
150
200
250
0.5 0.6 0.7 0.8 0.9 1 1.1 1.2
q"
(kW
/m
2 )
x[-]G=75 kg/m ² s, Tsat=27 ºC, R134a G=75 kg/m ² s, Tsat=32 ºC, R134aG=200 kg/m ² s,Tsat=27 ºC, R134a G=200 kg/m ² s,Tsat=32 ºC, R134aG=300 kg/m ² s,Tsat=27 ºC, R134a G=300 kg/m ² s,Tsat=32 ºC, R134aG=200 kg/m ² s, Tsat=23 ºC, propane G=200 kg/m ² s, Tsat=33 ºC, propaneG=200 kg/m ² s, Tsat=43 ºC, propane G=300 kg/m ² s, Tsat=23 ºC, propaneG=300 kg/m ² s, Tsat=33 ºC, propane G=300 kg/m ² s, Tsat=43 ºC, propaneG=400 kg/m ² s, Tsat=23 ºC, propane G=400 kg/m ² s, Tsat=33 ºC, propaneG=400 kg/m ² s, Tsat=43 ºC, propane
020406080
100120140160180200
0.4 0.5 0.6 0.7 0.8 0.9 1 1.1 1.2
q"
(kW
/m
2 )
x[-]
G=135 kg/m ² s,Tsat=27 ºC, R134a G=135 kg/m ² s,Tsat=32 ºC, R134aG=300 kg/m ² s,Tsat=27 ºC, R134a G=300 kg/m ² s,Tsat=32 ºC, R134aG=200 kg/m ² s,Tsat=33 ºC, propane G=200 kg/m ² s,Tsat=43 ºC, propaneG=300 kg/m ² s,Tsat=33 ºC, propane G=300 kg/m ² s,Tsat=43 ºC, propaneG=400 kg/m ² s,Tsat=33 ºC, propane G=400 kg/m ² s,Tsat=43 ºC, propane

D o c t o r a l T h e s i s / M . H . M a qb o o l
89
liquid density with saturation temperature tends to reduce the droplet en-trainment rate in the vapour core which may increase the dryout heat flux [Ali and Palm (2011b)]. The decrease in latent heat of vaporization with saturation temperature tends to reduce dryout heat flux [Kosar and Peles (2007)]. The mentioned opposing effects may be the reason for the small effect of saturation temperature on dryout heat flux of propane and R134a. Also in famous Katto and Ohno (1984) correlation, vapour to liquid density ratio and latent heat of vaporization are in linear rela-tionship with critical heat flux which is also an indication of the small ef-fect of saturation temperature on critical heat flux.
An interesting point to note in figures 7.9 and 7.10 is that the dryout completion is delayed to higher vapour qualities in 1.224 mm channel for both propane and R134a for higher saturation temperature whereas in 1.70 mm internal diameter channel, this trend is clear in case of propane and unclear or even opposite for 75 kg/m2s in case of R134a. Another point worth noting in Figures 7.9 and 7.10 is that the dryout completion vapour qualities in some cases are above 1 for both fluids (propane and R134a). This can be explained by fluctuations in mass flux on the down-stream end of the test section as a result of waves of liquid from up-stream periodically wetting the test section up to a point where, on the average, the vapour quality is higher than 1.
The experimental dryout heat fluxes of propane and R134a are com-pared with well-known correlations in Figures 7.11 and 7.12. A brief summary of the tested CHF correlations are tabulated in table 7.8.
Table 7.8. Comparison of dryout heat flux with correlations.
Correlation MAD (%) % of data within ±20%
Katto and Ohno (1984) 18 67 Bowring (1972) 14 85 Callizo (2010a) 15 83 Wojtan et al. (2006 32 36 Zhang et al. (2006) 21 53
The comparison of dryout results of propane and R134a shows similar trends. The dryout heat flux of propane and R134a increases with the in-crease of mass flux and with the increase of internal diameter. The effect of saturation temperature on the dryout heat flux of propane and R134a is observed to be negligible. Generally the dryout heat flux occurs at lower vapour quality for higher mass flux and for a given mass flux, the dryout is delayed to higher vapour qualities for higher saturation tem-perature. For given condition, the dryout heat flux of propane is higher than that of R134a. Among the correlations tested, Bowring (1972) and
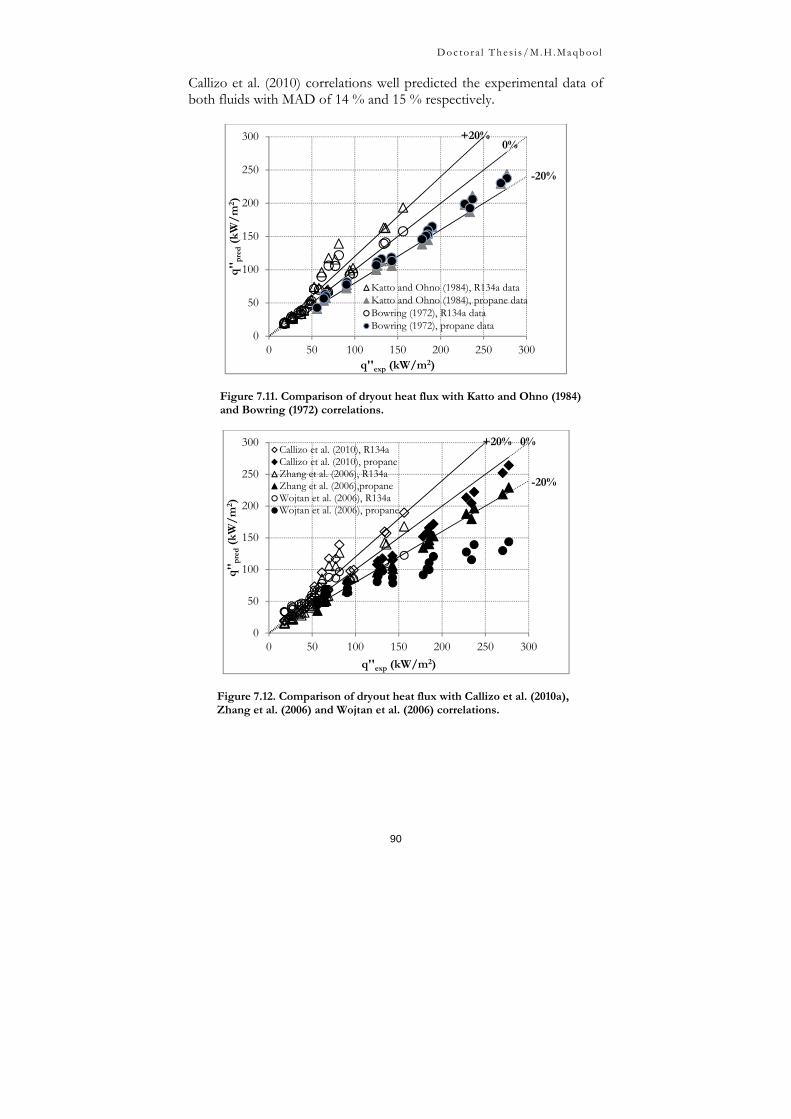
D o c t o r a l T h e s i s / M . H . M a qb o o l
90
Callizo et al. (2010) correlations well predicted the experimental data of both fluids with MAD of 14 % and 15 % respectively.
Figure 7.11. Comparison of dryout heat flux with Katto and Ohno (1984) and Bowring (1972) correlations.
Figure 7.12. Comparison of dryout heat flux with Callizo et al. (2010a), Zhang et al. (2006) and Wojtan et al. (2006) correlations.
0
50
100
150
200
250
300
0 50 100 150 200 250 300
q''
pre
d(k
W/
m2 )
q''exp (kW/m2)
Katto and Ohno (1984), R134a dataKatto and Ohno (1984), propane dataBowring (1972), R134a dataBowring (1972), propane data
+20%
-20%
0%
0
50
100
150
200
250
300
0 50 100 150 200 250 300
q''
pre
d(k
W/
m2 )
q''exp (kW/m2)
Callizo et al. (2010), R134aCallizo et al. (2010), propaneZhang et al. (2006), R134aZhang et al. (2006),propaneWojtan et al. (2006), R134aWojtan et al. (2006), propane
-20%
0%+20%

D o c t o r a l T h e s i s / M . H . M a qb o o l
91
8 Conclusions
Flow boiling data of ammonia and propane in small diameter channels are scarce as can be seen from the literature survey. Flow boiling data of these fluids are needed to develop reliable predicting methods to design efficient heat exchangers. Therefore, flow boiling results of ammonia and propane have been reported in this thesis. The results of ammonia and propane are also compared with R134a data taken by Owhaib (2007) and Ali (2010) on the same test rig to see the similarities and differences of ammonia and propane with R134a. The main conclusions of the comparison of heat transfer, pressure drop and dryout of ammonia and propane with R134a is presented here.
8 . 1 F l o w B o i l i n g H e a t T r a n s f e r R e s u l t s Flow boiling experiments were performed to investigate heat transfer in circular vertical mini channels made of stainless steel (AISI 316) with in-ternal diameters of 1.70 mm and 1.224 mm in case of ammonia and 1.70 mm in case of propane and a uniformly heated length of 245 mm. Heat transfer results of ammonia and propane were also compared with heat transfer results of R134. Flow boiling experiments using R134a were per-formed by Owhaib et al. (2004) and Ali et al. (2011c) in test sections hav-ing internal diameters of 1.70 mm and 1.224 mm and a uniformly heated length of 220 mm on the same test rig as in this study.
The comparison of heat transfer shows that the heat transfer coefficients of ammonia, propane and R134a in 1.70 mm tube are in general a strong function of heat flux and the effect of mass flux and vapour fraction on the heat transfer coefficient is insignificant. The heat transfer coefficient of R134a in 1.224 mm tube shows similar behaviour as in 1.70 mm tube (strong function of heat flux) but a different behaviour of ammonia heat transfer in 1.224 mm tube is observed. For ammonia in the 1.224 mm tube at lower vapour qualities the heat transfer coefficient is in all cases dependent on heat flux and the effect of mass flux and vapour fraction is insignificant. At higher vapour qualities the heat transfer coefficients of ammonia in the 1.224 mm increase with increasing vapour fraction as well as with increasing mass flux, while the influence of heat flux is less. The heat transfer coefficients of propane and R134a increase with the increase of saturation temperature while the heat transfer coefficients of

D o c t o r a l T h e s i s / M . H . M a qb o o l
92
ammonia increase with saturation temperature up to certain range of va-pour qualities then at higher vapour qualities, the effect of saturation temperature on the heat transfer coefficient of ammonia is observed as insignificant. The heat transfer coefficients of ammonia and R134a are observed to increase with the decrease of internal diameter. In general, it seems that flow boiling of ammonia, propane and R134a in 1.70 mm and flow boiling of R134a in 1.224 mm tube is controlled by a mechanism similar to nucleate boiling while flow boiling in 1.224 mm tube with ammonia is controlled by more than one boiling mechanism. Non-dimensional numbers for ammonia and R134a in 1.224 mm tube and for ammonia, propane and R134a in 1.70 mm are tabulated in table 8.1 and 8.2 respectively. Liquid Reynolds number is calculated for a mass flux of 500 kg/m2s and for a vapour quality 0.5. According to Ong and Thome (2011a) criteria, lower threshold of macro scale flow is about Co= 0.3- 0.4 whilst the upper threshold of micro scale flow is considered to be Co~1, with a transition region in-between i.e. 0.3- 0.4 ≤ Co ≤ 1. It can be seen from table 8.1 that as per this criterion 1.224 mm internal di-ameter tube with ammonia is a micro channel and with R134a is a mini channel. Similarly as can be seen from table 8.2 that 1.70 mm tube with propane and R134a is a mini channel and with ammonia is a micro channel but the confinement effects may not be strong because the con-finement number is very close to upper threshold of microregion. Ull-mann and Brauner (2007) proposed that if Eötvös number is less than 0.2 then the channel behaves as a micro channel and if above than 0.2 then as macro channel. They did not propose the criteria for the transi-tion region (minichannels). As can be seen from table 8.1 the 1.224 mm channel with ammonia can be considered as a mico channel and with R134a as a maco channel. It can also be seen in table 8.2 that the 1.70 mm channel with propane and R134a could be considered as a macro channel and with ammonia as a micro channel according to this defini-tion. Li and Wu (2010) introduced a combined non-dimensional number Bo*(Rel)0.5 and proposed that if Bo*(Rel)0.5<200 then the channel can be considered as mini/micro channel. As can be seen from table 8.1 the 1.224 mm channel with both ammonia and R134a can be considered as mini/micro channel as per the criteria of Li and Wu (2010). As can also be seen in table 8.2 the 1.70 mm channel with R134a can be considered as a macro channel and with ammonia and propane as a mini/micro channel. It was also mentioned that as the value of Bo*(Rel)0.5 decreases there is more tendency for the channel to behave as a micro channel. Generally it can be concluded from the above discussion that as per the discussed criteria, 1.224 mm channel with R134a and 1.70 mm channel with R134a and propane can be considered as mini/macro channels. Whereas, 1.224 mm and 1.70 mm channels with ammonia are micro channels. It can also be observed that as per all recent criteria, there is

D o c t o r a l T h e s i s / M . H . M a qb o o l
93
much more tendency for the 1.224 mm channel with ammonia to behave as a micro channel than the 1.70 mm channel because the values of 1.70 mm channel are much closer to the upper threshold of micro scale which may be a reason for the occurrence of more than one boiling mechanism in the 1.224 mm channel with ammonia. Table 8.1: Non-dimensional numbers for mass flux of 500 kg/m2s in 1.224 mm tube.
Fluid Co Bo Rel Bo*(Rel)0.5 Eö Ammonia 1.654 0.3753 2448 18.56 0.0469 R134a 0.662 2.277 1654 83.92 0.2846
Table 8.2: Non-dimensional numbers for mass flux of 500 kg/m2s in 1.70 mm tube.
Fluid Co Bo Rel Bo*(Rel)0.5 Eö Ammonia 1.191 0.7240 3400 42.21 0.0905 R134a 0.477 4.394 2297 210.60 0.5492 Propane 0.698 2.048 4614 139.11 0.2560
The experimental data of ammonia, propane and R134a are compared with well-known correlations and among them Cooper (1989) correla-tion is observed to be the best predicting model of the correlation con-sidered for comparison. The reader is referred to chapter 7 for further details of comparison of ammonia, propane and R134a with correlations.
8 . 2 F l o w B o i l i n g P r e s s u r e D r o p R e s u l t s Flow boiling experiments were performed to investigate two phase pres-sure drop in circular vertical mini channels made of stainless steel (AISI 316) with internal diameters of 1.70 mm and 1.224 mm in case of am-monia and 1.70 mm in case of propane and a uniformly heated length of 245 mm. Two phase pressure drop results of ammonia and propane were also compared with pressure drop results of R134. Two phase pres-sure drop experiments using R134a were performed by Owhaib (2007) in test sections having internal diameters of 1.70 mm and 1.224 mm and a uniformly heated length of 220 mm on the same test rig as in this study. The two phase pressure drop results of ammonia, propane and R134a shows that the two phase frictional pressure drop increases with the in-crease of mass flux, with the increase of vapour quality and with the de-crease of saturation temperature. After incipience of dryout, the decrease in the two phase frictional pressure drop of propane especially at higher mass fluxes is observed. The two phase frictional pressure drop of am-monia increases with the decrease of internal diameter, at equal mass

D o c t o r a l T h e s i s / M . H . M a qb o o l
94
flux, while the diametric effects on the frictional pressure drop of R134a are unclear. The experimental data of ammonia, propane and R134a are compared with well-known pressure drop macro and micro scale predicting models and among them Müller Steinhagen and Heck (1986) and Zhang and Webb (2001) are observed to be the best predicting models. The homo-geneous model seems to capture the governing phenomena because it predicted the data of ammonia, propane and R134a in the same pattern as can be seen in Figure 7.7a and the scatter is also small. The homoge-neous model can be a reliable predicting model if it can be redefined with some leading factor on the basis of large data bank.
8 . 3 D r y o u t R e s u l t s Dryout experiments of propane in single vertical circular mini channels made of stainless steel with internal diameters of 1.70 mm and 1.224 mm and heated length of 245 mm were performed. Dryout data of propane is compared with R134a data taken by Ali and Palm (2011b) on the same test rig as in this study.
Dryout results of propane and R134a shows almost similar trends. The dryout heat flux of propane and R134a increases with the increase of mass flux, and with the increase of internal diameter. Since the heated lengths for the two test sections are the same, therefore for the larger di-ameter channel, higher heat flux is needed to reach a certain vapour frac-tion at the outlet of the test section. The effect of saturation temperature on the dryout heat flux of propane and R134a is observed to be negligi-ble. Generally the dryout heat flux occurs at lower vapour quality for higher mass flux and for a given mass flux, the dryout is delayed to higher vapour qualities for higher saturation temperature. For given con-dition, the dryout heat flux of propane is higher than that of R134a. Among the correlation tested, Bowring (1972) and Callizo et al. (2010a) correlations well predicted the experimental data of both fluids.
8 . 4 R e m a r k s a n d S u g g e s t i o n s f o r F u r t h e r W o r k
Although an effort has been put in this thesis to understand the behav-iour of ammonia and propane in minichannels, there is still need for fur-ther research of flow boiling of natural refrigerants in small diameter channels at wide range of experimental conditions to fully understand the flow boiling mechanisms and also to be able to develop efficient ap-pliances in future with minimal environmental impact.

D o c t o r a l T h e s i s / M . H . M a qb o o l
95
Flow boiling experiments are performed with circular vertical mini-channels of fixed heated length. The effect of different geometrical shapes, different orientation and different heated lengths on flow boiling heat transfer, pressure drop and dryout results need to be investigated. It is recommended to study flow boiling of natural fluids in multiport minichannels.
Flow visualization experiments of ammonia and propane need to be conducted to see the difference in flow patterns of ammonia, propane and R134a to identify the cause behind the rather different behaviour of ammonia in 1.224 mm tube.
Flow boiling data of ammonia is not well predicted by state of the art correlations available in the literature. It is highly recommended to per-form experiments with wide range of test fluids in minichannels to de-velop reliable predicting methods applicable in wide range of experimen-tal conditions to be able to design efficient and environmentally safe heat exchangers.
To compare flow boiling results of different fluids and to have a deep understating about the behaviour of different fluids during flow boiling in small diameter channels, it is highly recommended to perform experi-ment of different fluids at wide range of same experimental conditions to get a large data bank to be more conclusive.

D o c t o r a l T h e s i s / M . H . M a qb o o l
96
Nomenclature
A Area (m2)
Cp Specific heat (J/kgK)
D Diameter (m)
DC Direct Current
f Friction factor (-)
G Mass flux (kg/m2s)
h Heat Transfer Coefficient (W/m2K)
I Current (A)
ilg Latent heat of vaporization (J/kg)
k Thermal conductivity (W/mK)
L Length (m)
MAD Mean Absolute Deviation=[1/N][ Σ|Xpred-Xexp|/Xexp] (%)
m Refrigerant mass flow rate (kg/s)
∆P Pressure drop (Pa)
Q Power (W)
q´´ Heat flux (W/m2)
R Roughness (μm)
T Temperature (°C)
t Time (sec)

D o c t o r a l T h e s i s / M . H . M a qb o o l
97
v Voltage (V)
x Vapour quality (-)
z Axial location (m)
z* Non-dimensional length (z/zhl)
zo Saturation point length (m)
Greek Letters
∆ Difference (-)
ρ Density (kg/m3)
μ Dynamic viscosity (Ns/m2)
σ Surface tension (N/m)
Subscript
a Arithmetic
acc Accelerational
c Cross-sectional
exp Experimental
f Fluid
fric Frictional
g Gas
grav Gravitational
h Heated
hl Heated length
i Inner
ic Inlet compression
D o c t o r a l T h e s i s / M . H . M a qb o o l
98
in Inlet
l Liquid
lam Lam
lo Liquid only
o Outer
oe Outlet expansion
P Peak
sat Saturation
sp Single phase
sub Subcooling
turb Turbulent
tp Two phase
v Valley
w Wall
z Axial location (m)
Non Dimensional Numbers
Bo Bond number
Co Confinement number
/
Eö Eötvös number
Fr Froude number (

D o c t o r a l T h e s i s / M . H . M a qb o o l
99
Nu Nusselt number (
Re Reynolds number
Rel Liquid Reynolds number
We Weber number (

D o c t o r a l T h e s i s / M . H . M a qb o o l
100
Bibliography
Ali, R., (2010). Phase Change Phenomena During Fluid Flow in Micro-channels. Department of Energy Technology. Stockholm, Sweden, Royal Institute of Technology, KTH. Doctoral Thesis. ISBN# 978-91-7415-829-8
Ali, R., Palm, B., Maqbool, M. H., (2011a). Experimental Investigation of Two-Phase Pressure Drop in a Micro Channel. Heat Transfer En-gineering, 32(13-14): 1126-1138.
Ali, R., Palm, B., (2011b). Dryout Characteristics During Flow Boiling of R134a in Vertical Circular Mini Channels. International Journal of Heat and Mass Transfer, 54(11-12): 2434-2445.
Ali, R., Palm, B., Maqbool, M. H., (2011c). Flow Boiling Heat Transfer Characteristics of a Mini Channel up to Dryout Condition, ASME Journal of Heat Transfer, 133 (8): 081501-10.
Arima, H., Kim, J. H., Okamoto, A., Ikegami, Y., (2010). Local Boiling Heat Transfer Characteristics of Ammonia in a Vertical Plate Evaporator. International Journal of Refrigeration, 33: 359-370
Bao, Z. Y., Fletcher, D. F., Haynes, B. S., (2000). Flow Boiling Heat Transfer of Freon R11 and HCFC123 in Narrow Passages. Inter-national Journal of Heat and Mass Transfer, 43(18): 3347-3358.
Bergles, A. E., (1963). Subcooled Burnout in Tubes of Small Diameter ASME, Paper No: 63-WA-182.
Blasius, H., (1913), Das Ähnlichkeitsgesetz bei Reibungsvorgängen in Flüssigkeiten, Forchg. Arb. Ing.-Wes., No: 131, Berlin.
Bowers, M. B., Mudawar, I., (1994). High Flux Boiling in Low Flow Rate, Low Pressure Drop Mini-Channel and Micro-Channel Heat Sinks. International Journal of Heat and Mass Transfer 37(2): 321-332.
Bowring R. W., (1972). A Simple but Accurate Round Tube Uniform Heat Flux Correlation Over the Pressure Range 0.7-17 MN/m2. Report AEEW-R789, Winfrith, UK.
Callizo, C. M., Ali, R., Palm B., (2010a). Saturated Flow Boiling Heat Transfer of Refrigerants in a vertical Micro channel of 640μm of diameter. Submitted to International Journal of Heat and Mass Transfer.
Callizo, C. M., (2010b). Flow boiling Heat Transfer in Single Vertical Channels of Small Diameter. Department of Energy Technology. Stockholm, Sweden, Royal Institute of Technology, KTH. Doctoral The-sis. ISBN # 978-91-7415-780-2.

D o c t o r a l T h e s i s / M . H . M a qb o o l
101
Carey, V. P., (1992). Liquid-vapour phase change phenomena, Hemisph- ere, New York.
Cavallini, A., Del Col, D., Doretti, L., Matkovic, M., Rossetto, L., Zilio, C., (2005). Two-Phase Frictional Pressure Gradient of R236ea, R134a and R410a inside Multi-Port Mini-Channels. Experimental Thermal and Fluid Science, 29(7): 861-870.
Celata, G. P., Cumo M., Mariani, A., (1997). Geometrical Effects on the Subcooled Flow Boiling Critical Heat Flux, Revue Generale de Thermique 36: 807-814.
Celata, G. P., (2004). Single Phase Heat Transfer and Fluid Flow in Micr- opipes, Heat Transfer Engineering, 25(3): 13-22.
Chaddock, J. B., Brunemann, H., (1967). Forced Convection of Refriger-ants in Horizontal Tubes. School of Engineering, Duke University: HL-113.
Chang, S. D., Ro, S. T., (1996). Pressure Drop of Pure HFC Refrigerants and their Mixtures Flowing in Capillary Tubes. International Jour-nal of Multiphase Flow, 22(3): 551-561.
Chen, C. A., Li, Y. M., Lie, Y. M., Lin, T. F., (2011). Saturated Flow Boil- ing Heat Transfer of R-410A and Associated Bubble Character-istics in a Narrow Annular Duct. International Journal of Heat and Mass Transfer, 54: 4988-5000.
Chisholm, D., (1973). Pressure Gradients Due to Friction During the Flo w of Evaporating Two-Phase Mixtures in Smooth Tubes and Channels. International Journal of Heat and Mass Transfer, 16: 347-348.
Choi, K. I., Barron, R. F., Warrington, R. O. (1991). Fluid Flow and Heat Transfer in Micro tubes. Micromechanical Sensors, Actuators and Sys-tems, ASME. DSC-Vol. 32.
Choi, K. I., Pamitran, A. S., Oh, C. Y., Oh, J. T., (2007). Boiling Heat Tr- ansfer of R-22, R-134a and CO2 in Horizontal Smooth Minichannels. International Journal of Refrigeration, 30: 1336-1346.
Choi, K. I., Pamitran A. S., Oh J. K., Saito K., (2009). Pressure Drop and Heat Transfer During Two Phase Flow Vaporization of Pro-pane in Horizontal Smooth Mini channels. International Journal of Refrigeration, 32: 837-845.
Cicchitti, A., Lombardi, C., Silvestri, M., Soldaini, G., Zavattarelli, R., (1960). Two-Phase Cooling Experiments- Pressure Drop, Heat Transfer and Burnout Measurements. Energia. Nucleare 7(6): 407-425.
Cooper, M. G., (1984). Saturation Nucleate Pool Boiling - a Simple Cor-relation. Institution of Chemical Engineers Symposium Series, 86: 785-793.
Cooper, M. G., (1989). Flow boiling –the ‘Apparently Nucleate’ Regime. International Journal of Heat and Mass Transfer, 32(3): 459-464.
Cortina-Diaz, M., Boye, H., Hapke I., Schmidt, J., Staate, Y., Zhekov, Z.,

D o c t o r a l T h e s i s / M . H . M a qb o o l
102
(2005). Investigation of Flow Boiling in Narrow Channels by Thermo graphic Measurement of Local Wall Temperatures. Mi-cro fluid Nan fluid, 2:1-11.
Da Silva Lima, R. J., Quibén, J. M., Thome, J. R., (2009). Flow Boiling in Horizontal Smooth Tubes: New Heat Transfer Results for R-134a at Three Saturation Temperatures. Applied Thermal Engineer-ing, 29(7): 1289-1298.
Dittus, F. W., Boelter, L. M. K., (1930). Heat Transfer in Turbulent Pipe Flow of Gases with Viable Properties. Heat Transfer Soviet Re-search, 5: 109-116.
Dutkowski, K., (2009). Two-Phase Pressure Drop of Air-Water in Mini channels. International Journal of Heat and Mass Transfer, 52(21-22): 5185-5192.
Friedel, L., (1979). Improved Friction Pressure Drop Correlations for Horizontal and Vertical Two-Phase Pipe Flow. The European Two-Phase Flow Group Meeting. Ispra, Italy, Paper E2.
Fukano, T., Kariyasaki, A., (1993). Characteristics of Gas-Liquid Two-Phase Flow in a Capillary Tube. Nuclear Engineering and Design, 141(1-2): 59-68.
Gnielinski, V., (1976). New Equations for Heat Transfer in Turbulent Pi- pe and Channel Flow. International Chemical Engineering, 16: 359-368.
Grönnerud, R., (1979). Investigation of Liquid Hold-Up, Flow- Resistan- nce and Heat Transfer in Circulation Type Evaporators, Part IV: Two-Phase Flow Resistance in Boiling Refrigerants, Annexe 1972-I, Bull. de I’Inst. du froid.
Gungor, K. E., Winterton, R. H. S., (1986). A General Correlation for Flow Boiling in Tubes and Annuli. International Journal of Heat and Mass Transfer, 29(3): 351-358.
Haaland, S. E., (1983). Simple and Explicit Formulas for the Friction Fac tor in Turbulent Pipe Flow. Journal of Fluids Engineering, 105: 89-90.
Hall D. D., Mudawar, I., (1999). Ultra-high Critical Heat Flux (CHF) for Subcooled Water Flow Boiling –II: High–CHF Database and Design Equations. International Journal of Heat and Mass Transfer, 42 (8): 1429-1456.
Huo, X., Chen, L., Tian, Y. S., Karayiannis, T. G., (2004). Flow Boiling and Flow Regimes in Small Diameter Tubes. Applied Thermal En-gineering, 24(8-9): 1225-1239.
In, S., Jeong, S., (2009). Flow Boiling Heat Transfer Characteristics of R123 and R134a in a Micro-Channel. International Journal of Multi-phase Flow, 35: 987–1000.
Kabelac, S., De Buhr, H. J., (2001). Flow Boiling of Ammonia in a Plain and a Low Finned Horizontal Tube. International Journal of Refrige-ration, 24: 41-50.

D o c t o r a l T h e s i s / M . H . M a qb o o l
103
Kandlikar, S. G., Garimella, S., Li, D., Colin, S., King, M. R., (2006). Heat Transfer and Fluid Flow in Minichannels and Micro chan-nels. Elsevier.
Katto, Y., Ohno, H., (1984). An Improved Version of the Generalized Correlation of Critical Heat Flux for the Forced Convective Boiling in Uniformly Heated Vertical Tubes. International Journal of Heat and Mass Transfer, 27(9): 1641-1648.
Kew, P. A., Cornwell, K., (1997). Correlations for the Prediction of Boil-ing Heat Transfer in Small-Diameter Channels. Applied Thermal Engineering, 17(8-10): 705-715.
Kosar, A., Peles, Y., (2007). Critical Heat Flux of R-123 in Silicon-Based Micro channels. Journal of Heat Transfer, 129(7): 844-851.
Lazarek, G. M., Black, S. H., (1982). Evaporative Heat Transfer, Pressure Drop and Critical Heat Flux in a Small Vertical Tube with R-113. International Journal of Heat and Mass Transfer, 25(7): 945-960.
Lee, P. S., Garimella, S.V., Liu, D., (2005). Investigation of Heat Transfer in Rectangular Micro channels. International Journal of Heat and Mass Transfer, 48: 1688- 1704.
Li, W., Wu, Z., (2010). A General Criterion for Evaporative Heat Trans-fer in Micro/Mini-channels. International Journal of Heat and Mass Transfer, 53: 2759-2766.
Lin, S., Kew, P. A., Cornwell, K., (2001). Two-Phase Heat Transfer to a Refrigerant in a 1 mm Diameter Tube. International Journal of Re-frigeration, 24(1): 51-56.
Liu, Z., Winterton, R. H. S., (1991). A General Correlation for Saturated and Subcooled Flow Boiling in Tubes and Annuli, Based on a Nucleate Pool Boiling Equation. International Journal of Heat and Mass Transfer, 34(11): 2759-2766.
Lockhart, R. C., Martinelli, R. W., (1949). Proposed Correlation of Data for Isothermal Two-Phase, Two-Component Flow in Pipes. Chemical Engineering Progress, 45(1): 39-48.
Madrid, F., Caney, N., Marty, P., (2007). Study of a Vertical Boiling Flow in Rectangular Mini-Channels. Heat Transfer Engineering, 28(8): 753-760.
Mastrullo, R., Mauro, A. W., Rosato, A., Vanoli, G. P., (2009). Carbon D ioxide Local Heat Transfer Coefficients During Flow Boiling in a Horizontal Circular Smooth Tube. International Journal of Heat and Mass Transfer, 52: 4184-4194.
McAdams, W. H., Woods, W. K., Bryan, R. L., (1942). Vaporization Insi de Horizontal Tubes-II- Benzene–Oil Mixtures. Transactions ASME: 64, (193).
Megahed, A., Hassan, I. (2009). Two-Phase Pressure Drop and Flow Visualization of Fc-72 in a Silicon Micro channel Heat Sink. In-ternational Journal of Heat and Fluid Flow, 30(6): 1171-1182.

D o c t o r a l T h e s i s / M . H . M a qb o o l
104
Mishima, K. Hibiki, T., (1996). Some Characteristics of Air-Water Two-Phase Flow in Small Diameter Vertical Tubes. International Jour-nal of Multiphase Flow, 22(4): 703-712.
Müller-Steinhagen, H., Heck, K., (1986). A Simple Friction Pressure Drop Correlation for Two-Phase Flow in Pipes. Chemical Engi-neering Progress, 20: 297-308.
NIST, (2002). National Institute of Standard and Technology, REFPROP Ver-sion 7.0, Boulder Colorado.
Ong, C. L., Thome, J. R., (2011a). Macro-to-Micro channel Transition in Two-Phase Flow: Part 1- Two Phase Flow Patterns and Film Thickness Measurements. Experimental Thermal and Fluid Science, 35: 37-47.
Ong, C. L., Thome, J. R., (2011b). Macro-to-Micro channel Transition in Two-Phase Flow: Part 2- Flow boiling Heat Transfer and Critical Heat Flux. Experimental Thermal and Fluid Science, 35: 873-886.
Owhaib, W., Martin-Callizo, C., Palm B., (2004). Evaporative Heat Transfer in Vertical Circular Micro channels. Applied Thermal En-gineering, 24: 1241-1253-
Owhaib, W., (2007). Experimental Heat Transfer, Pressure Drop and Flow Visualization of R134a in Vertical Mini/Micro Tubes. De-partment of Energy Technology. Stockholm, Sweden, Royal Institute of Technology, KTH. Doctoral Thesis. ISBN# 978-91-7178-594-7.
Palm, B., (1991). Enhancement of Boiling Heat Transfer by Aid of Per-formed Metal Foils. Department of Energy Technology. Stockholm, Sweden, Royal Institute of Technology, KTH. Doctoral Thesis.
Pamitran, A. S., Choi, K. I., Oh, J. T., Oh, H. K., (2008). Two-Phase Pre- ssure Drop During CO2 Vaporization in Horizontal Smooth Minichannels. International Journal of Refrigeration, 31: 1375-1383.
Pamitran, A. S., Choi, K. I., Oh, J. T., Nasruddin, (2011). Evaporation Heat Transfer in Single Circular Tubes for Flow Natural Refrig-erants of C3H8, NH3, and CO2. International Journal of Multiphase Flow, 37(7): 794 -801.
Qu, W., Mudawar, I., (2003). Measurement and Prediction of Pressure Drop in Two-Phase Micro-Channel Heat Sinks. International Journal of Heat and Mass Transfer, 46(15): 2737-2753.
Quibén, J. M., Thome, J. R., (2007). Flow Pattern Based Two-Phase Fric tional Pressure Drop Model for Horizontal Tubes. Part2: New Phenomenological Model. International Journal of Heat and Fluid Flow, 28: 1060-1072.
Qu, W., Mudawar, I., (2004). Measurement and correlation of critical hea t flux in two phase micro channel heat sinks. International Journal of Heat and Mass Transfer, 47: 2045-2059.
Qi, S. L., Zhang P., Wang R. Z., Xu L. X., (2007). Flow Boiling of Liquid
D o c t o r a l T h e s i s / M . H . M a qb o o l
105
Nitrogen in Micro Tubes: Part II- Heat transfer Characteristics and Critical Heat Flux, International Journal of Heat and Mass Trans-fer, 50: 5017-5030.
Revellin, R., Thome, J. R., (2007). Adiabatic Two-Phase Frictional Pres-sure Drops in Micro channels. Experimental Thermal and Fluid Sci-ence, 31(7): 673-685.
Revellin R., Mishima K., Thome J. R., (2009). Status of Prediction Meth- ods for Critical Heat Fluxes in Mini and Micro channels. Interna-tional Journal of Heat and Fluid Flow, 30(5): 983-992.
Saisorn, S., Kaew-On, J., Wongwises, S. (2010). Flow Pattern and Heat Transfer Characteristics of R-134a Refrigerant During Flow Boiling in a Horizontal Circular Mini-Channel. International Jour-nal of Heat and Mass Transfer 53: 4023-4038.
Saitoh, S., Daiguji, H., Hihara, E., (2006). Effect of Tube Diameter on Boiling Heat Transfer of R134a in Horizontal Small Diameter Tubes. International Journal of Heat and Mass Transfer, 48: 4973-4984.
Shah, M. M., (1982). Chart Correlation for Saturated Boiling Heat Trans fer: Equations and Further Study, ASHRAE Transactions, 88:185–196.
Shah, M. M., (1987). Improved General Correlation for Critical Heat Flux During Up flow in Uniformly Heated Vertical Tubes. Inter-national Journal of Heat and Fluid Flow, 8(4): 326-335.
Sobierska, E., Kulenovic, R., Mertz, R., Groll, M., (2006). Experimental Results of Flow Boiling of Water in a Vertical Micro channel. Experimental Thermal and Fluid Science, 31(2): 111-119.
Stephan, K., Abdelsalam, M. (1980). Heat-Transfer Correlations for Natural Convection Boiling. International Journal of Heat and Mass Transfer, 23(1): 73-87.
Sumith, B., Kaminaga, F., Matsumura, K., (2003). Saturated Flow Boiling of Water in a Vertical Small Diameter Tube. Experimental Thermal and Fluid Science, 27(7): 789-801.
Taylor, B. N., Kuyatt, C. E., (1994). Guidelines for Evaluating and Ex-pressing the Uncertainty of NIST Measurement Results. NIST Technical Note 1297, 1994 Edition, United States Department of Com-merce, National Institute of Standards and Technology (NIST).
Teyssedeu A., Olekhnowitch A., Tapucu A., Champagne A., Groenveld D., (1994). Critical Heat Flux Data in a Vertical Tube at Low and Medium Pressures, Journal of Nuclear Engineering and Design, 149: 185-194.
Thome, J. R., Dupont, V., Jacobi, A. M., (2004). Heat Transfer Model for Evaporation in Mico channels. Part 1: Presentation of the Model, International Journal of Heat and Mass Transfer, 47: 3375-3385.

D o c t o r a l T h e s i s / M . H . M a qb o o l
106
Tran, T. N., Wambsganss, M. W., France, D. M., (1996). Small Circular- and Rectangular-Channel Boiling with Two Refrigerants. Interna-tional Journal of Multiphase Flow, 22(3): 485-498.
Tran, T. N., Chyu, M. C., Wambsganss, M. W., France, D. M., (2000). Two-Phase Pressure Drop of Refrigerants During Flow Boiling in Small Channels: An Experimental Investigation and Correla-tion Development. International Journal of Multiphase Flow, 26(11): 1739-1754.
Tribbe, C., Müller Steinhagen, H. M., (2000). An Evaluation of the Perfo rmance of Phenomenological Models for Predicting Pressure Gradient During Gas Liquid Flow in Horizontal Pipelines. Inter-national Journal of Multiphase flow, 26: 1019-1036.
Triplett, K. A., Ghiaasiaan, S. M., Abdel-Khalik, S. I., Sadowski, D. L., (1999). Gas-Liquid Two-Phase Flow in Micro channels Part I: Two-Phase Flow Patterns. International Journal of Multiphase Flow, 25(3): 377-394.
Ullmann, A., Brauner, N., (2007). The Predictions of Flow Patterns in Minichannels. Multiphase Science and Technology, 19(1): 49-73.
Ungar, E. K., Cornwell, J. D., (1992). Two Phase Pressure Drop of Ammonia in Small Diameter Horizontal Tubes. AIAA paper: 92-3891.
Vlasie, C., Macchi, H., Guilpart, J., Agostini, B., (2004). Flow Boiling in Small Diameter Channels. International Journal of Refrigeration, 27: 191-201.
Wambsganss, M. W., France, D. M., Jendrzejczyk, J. A., Tran, T. N., (1993). Boiling Heat Transfer in a Horizontal Small-Diameter Tube. Journal of Heat Transfer, 115(4): 963-972.
Wen, D. S., Kenning, D. B. R., (2004). Two-Phase Pressure Drop of Wa-ter During Flow Boiling in a Vertical Narrow Channel. Experi-mental Thermal and Fluid Science, 28(2-3): 131-138.
Wen, Y. M., Ho, C. Y., (2005). Evaporative Heat Transfer and Pressure Drop Characteristics of R-290, R-600, and a Mixture of R-290/R-600 in the Three-Lines Serpentine Small-tube Bank. Ap-plied Thermal Engineering 25: 2921-2936.
Wojtan, L., Revellin, R., Thome, J. R., (2006). Investigation of Saturated Critical Heat Flux in a Single, Uniformly Heated Micro channel. Experimental Thermal and Fluid Science, 30(8): 765-774.
Yu, W., France, D. M., Wambsganss, M. W., Hull, J. R., (2002). Two-Phase Pressure Drop, Boiling Heat Transfer, and Critical Heat Flux of Water in a Small-Diameter Horizontal Tube. International Journal of Multiphase Flow, 28(6): 927-941.
Zhang, M., Webb, R. L., (2001). Correlation of Two-Phase Friction for Refrigerants in Small-Diameter Tubes. Experimental Thermal and Fluid Science, 25: 131–139.

D o c t o r a l T h e s i s / M . H . M a qb o o l
107
Zhang, W., Hibiki, T., Mishima, K. Mi, Y., (2006). Correlation of Critical Heat Flux for Flow Boiling of Water in Mini-Channels. Interna-tional Journal of Heat and Mass Transfer, 49(5-6): 1058-1072.
Zhao,Y., Molki, M., Ohadi, S. V., Dessiatoun, S. V., (2000), Flow Boiling of CO2 in a Micro channel. ASHRAE Transactions 106 (1): 437-445.