flow of funds accounts of the united states - the fed - home · flow of funds accounts of the...
TRANSCRIPT

For use at 12:00 p.m., eastern time Friday
December 7, 2001
FEDERAL RESERVE statistical release
Z.1
Flow of Funds Accounts of the United States
Flows and Outstandings Third Quarter 2001 Board of Governors of the Federal Reserve System, Washington DC 20551

Flow of Funds Summary Statistics Third Quarter 2001
Domestic nonfinancial debt grew at a
seasonally adjusted annual rate of 6-3/4 percent in the third quarter of 2001, faster than in the first half of the year. Increased borrowing by the federal government more than offset a reduction in borrowing by the nonfederal sectors. Federal government debt rose at a 7-3/4 percent annual rate in the third quarter, the first quarter that federal debt has grown since 1997. However, even with the expansion in the third quarter, federal debt was $65 billion less than at the beginning of this year and about $510 billion below the peak in early 1998. Household debt increased at about an 8-1/4 percent annual rate in the third quarter. Growth of
home mortgage debt slowed but still grew at a robust 9-3/4 percent pace. Consumer credit decelerated further to a 1-1/4 percent rate, the slowest rate since 1992. In the nonfinancial business sector, debt growth declined to about a 5-1/4 percent rate. Net borrowing in the bond market decreased markedly and commercial paper outstanding and bank loans to businesses continued to contract. State and local government debt slowed to a 3-1/4 percent rate, as the issuance of advance-refunding bonds and borrowing for new capital projects were reduced. The level of domestic nonfinancial debt outstanding was $19.1 trillion at the end of the third quarter. Debt of nonfederal sectors was $15.8 trillion, and federal debt was $3.4 trillion.
Growth of Domestic Nonfinancial Debt1 Percentage changes; quarterly data are seasonally adjusted annual rates
Nonfederal
Total
Federal
Total
Households
Business
State and
local govts.
1994
4.5
4.7
4.5
7.4
3.7
-4.0
1995
5.4
4.1
5.9
7.4
7.2
-4.6 1996
5.4
4.0
5.8
7.0
6.2
-0.6
1997
5.6
0.6
7.3
6.4
9.0
5.3 1998
6.9
-1.4
9.6
8.4
11.6
7.2
1999
6.8
-1.9
9.3
8.6
11.3
4.4 2000
5.0
-8.0
8.5
8.5
9.9
2.2
2000:Q1 5.5 -5.9 8.5 8.1 10.6 1.0 :Q2 5.5 -11.3 9.9 9.4 12.2 1.5 :Q3 4.4 -6.4 7.1 8.1 7.0 1.9 :Q4 4.3 -9.6 7.5 7.4 8.4 4.2
2001:Q1
5.5
-0.1
6.8
7.8
5.4
8.1 :Q2
5.5
-7.6
8.4
9.3
7.5
8.3
:Q3 6.8 7.7 6.6 8.3 5.3 3.2
1. Changes shown are on an end-of-period basis and may differ from month-average data in the H.6 release.

Table of Contents
Title Table Page Flow of Funds Accounts, Third Quarter 2001 1
Availability of Data for Latest Quarter 3
Debt Growth by Sector D.1 6
Borrowing by Sector D.2 7
Debt Outstanding by Sector D.3 8
Flows Levels Title Table Page Table Page
Summaries
Total Net Borrowing and Lending in Credit Markets F.1 9 L.1 58
Credit Market Borrowing by Nonfinancial Sectors F.2 10 L.2 59
Credit Market Borrowing by Financial Sectors F.3 10 L.3 59
Credit Market Borrowing, All Sectors, by Instrument F.4 11 L.4 60
Total Liabilities and Its Relation to Total Financial Assets F.5 11 L.5 60
Distribution of Gross Domestic Product F.6 12
Distribution of National Income F.7 13
Gross Saving and Investment F.8 14
Net Capital Transfers F.9 14
Derivation of Measures of Personal Saving F.10 15 L.10 61

Flows Levels Title Table Page Table Page
Sectors Households and Nonprofit Organizations F.100 16 L.100 62
Nonfinancial Business F.101 17 L.101 63
Nonfarm Nonfinancial Corporate Business F.102 18 L.102 64
Nonfarm Noncorporate Business F.103 19 L.103 65
Farm Business F.104 19 L.104 65
State and Local Governments F.105 20 L.105 66
Federal Government F.106 21 L.106 66
Rest of the World F.107 22 L.107 67
Monetary Authority F.108 23 L.108 68
Commercial Banking F.109 24 L.109 69
U.S.-Chartered Commercial Banks F.110 25 L.110 70
Foreign Banking Offices in U.S. F.111 26 L.111 71
Bank Holding Companies F.112 27 L.112 72
Banks in U.S.-Affiliated Areas F.113 27 L.113 72
Savings Institutions F.114 28 L.114 73
Credit Unions F.115 29 L.115 74
Bank Personal Trusts and Estates F.116 29 L.116 74
Life Insurance Companies F.117 30 L.117 75
Other Insurance Companies F.118 30 L.118 75
Private Pension Funds F.119 31 L.119 76
State and Local Government Employee Retirement Funds F.120 31 L.120 76
Money Market Mutual Funds F.121 32 L.121 77

Flows Levels Title Table Page Table Page
Mutual Funds F.122 32 L.122 77
Closed-End and Exchange-Traded Funds F.123 32 L.123 77
Government-Sponsored Enterprises F.124 33 L.124 78
Federally Related Mortgage Pools F.125 33 L.125 78
Issuers of Asset-Backed Securities F.126 34 L.126 79
Finance Companies F.127 34 L.127 79
Mortgage Companies F.128 35 L.128 80
Real Estate Investment Trusts F.129 35 L.129 80
Security Brokers and Dealers F.130 36 L.130 81
Funding Corporations F.131 36 L.131 81
Instruments
Gold and Official Foreign Exchange Holdings F.200 37 L.200 82
SDR Certificates and Treasury Currency F.201 37 L.201 82
U.S. Deposits in Foreign Countries F.202 37 L.202 82
Net Interbank Transactions F.203 38 L.203 83
Checkable Deposits and Currency F.204 39 L.204 84
Time and Savings Deposits F.205 40 L.205 85
Money Market Mutual Fund Shares F.206 40 L.206 85
Federal Funds and Security Repurchase Agreements F.207 41 L.207 86
Open Market Paper F.208 41 L.208 86
Treasury Securities F.209 42 L.209 87
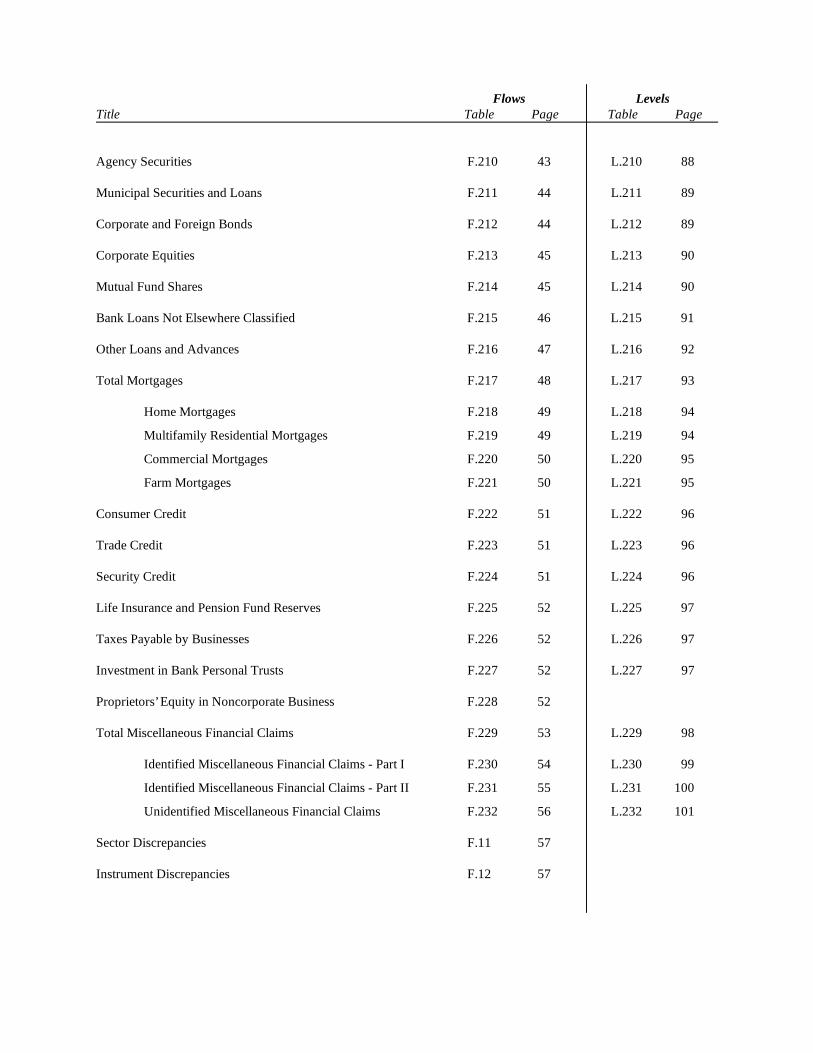
Flows Levels Title Table Page Table Page Agency Securities F.210 43 L.210 88
Municipal Securities and Loans F.211 44 L.211 89
Corporate and Foreign Bonds F.212 44 L.212 89
Corporate Equities F.213 45 L.213 90
Mutual Fund Shares F.214 45 L.214 90
Bank Loans Not Elsewhere Classified F.215 46 L.215 91
Other Loans and Advances F.216 47 L.216 92
Total Mortgages F.217 48 L.217 93
Home Mortgages F.218 49 L.218 94
Multifamily Residential Mortgages F.219 49 L.219 94
Commercial Mortgages F.220 50 L.220 95
Farm Mortgages F.221 50 L.221 95
Consumer Credit F.222 51 L.222 96
Trade Credit F.223 51 L.223 96
Security Credit F.224 51 L.224 96
Life Insurance and Pension Fund Reserves F.225 52 L.225 97
Taxes Payable by Businesses F.226 52 L.226 97
Investment in Bank Personal Trusts F.227 52 L.227 97
Proprietors’ Equity in Noncorporate Business F.228 52
Total Miscellaneous Financial Claims F.229 53 L.229 98
Identified Miscellaneous Financial Claims - Part I F.230 54 L.230 99
Identified Miscellaneous Financial Claims - Part II F.231 55 L.231 100
Unidentified Miscellaneous Financial Claims F.232 56 L.232 101
Sector Discrepancies F.11 57
Instrument Discrepancies F.12 57

Balance Reconciliation Sheet Title Table Page Table Page
Balance Sheet and Reconciliation Tables
Households and Nonprofit Organizations B.100 102 R.100 105
Nonfarm Nonfinancial Corporate Business B.102 103 R.102 106
Nonfarm Noncorporate Business B.103 104 R.103 107
Flows Levels Title Table Page Table Page
Supplementary Tables
Nonprofit Organizations F.100.a 108 L.100.a 109
Consolidated Statement for Federal, State, and Local Governments F.106.c 110 L.106.c 111
Private Pension Funds: Defined Benefit Plans F.119.b 112 L.119.b 113
Private Pension Funds: Defined Contribution Plans F.119.c 112 L.119.c 113
Individual Retirement Accounts (IRAs) F.225.i 112 L.225.i 113
Flow of Funds Matrix for 2000 114 115
Balance Sheet of Households and Nonprofit Organizations with Equity Detail B.100.e 116


1
Flow of Funds Accounts, Third Quarter 2001 This publication presents the flow of funds accounts for 2001:Q3. Data revisions and other changes. The statistics shown in these tables reflect the use of new or revised source data. Most significant revisions appear in recent quarters; however, new source information resulted in changes to data for earlier periods. The revisions include the following: 1. Balance sheet and reconciliation tables for the nonfarm noncorporate business sector (tables B.103 and R.103) have been added. Published data are available beginning in 1945. 2. Exchange-traded funds (ETFs) are now shown on tables F.123 and L.123. An ETF is an investment company registered with the Securities and Exchange Commission whose shares are listed on the stock exchanges. Source data for ETFs are from the Investment Company Institute and are available beginning in January 1993. 3. Data for investment and depreciation flows of all sectors have been revised beginning in 1998 to reflect updated annual estimates of reproducible tangible wealth published by the Bureau of Economic Analysis of the Department of Commerce. 4. Data for the finance company sector (tables F.127 and L.127) have been revised beginning in 1996:Q3 as the result of benchmarking to the 2000 quinquennial finance company survey. The 2000 survey covered asset and liability information as of June 30, 2000. Explanatory notes for tables D.1, D.2, and D.3. Domestic debt comprises credit market funds borrowed by U.S. entities from both domestic and foreign sources, while foreign debt represents amounts borrowed by foreign financial and nonfinancial entities in U.S. markets only. Financial sectors consist of government-sponsored enterprises, federally related mortgage pools, and private financial institutions. Credit market debt consists of debt securities, mortgages, bank loans, commercial paper, consumer credit, U.S. government loans, and other loans and
advances; it excludes trade debt, loans for the purpose of carrying securities, and funds raised from equity sources.
Growth rates in table D.1 are calculated by dividing seasonally adjusted flows from table D.2 by seasonally adjusted levels at the end of the previous period from table D.3. Seasonally adjusted levels in flow of funds statistics are derived by carrying forward year-end levels by seasonally adjusted flows. Growth rates calculated from changes in unadjusted levels printed in table L.2 can differ from those in table D.1. Relation of Flows to Outstandings. Estimates of financial assets and liabilities outstanding are linked to data on flows. However, figures on outstandings contain discontinuities or breaks in series that could affect analysis of particular relationships over time. Specifically, outstandings in the flow of funds accounts are related to the flows in the following way: Outstanding t = Outstanding t-1+ Flow t+ Discontinuity t where “t” is the time period.
Discontinuities result from changes in valuation, breaks in source data, and changes in definitions. For most series, the value of the discontinuity is zero for nearly all time periods. However, in a few instances, the discontinuity is nonzero for almost all time periods, or is quite large in a particular quarter, such as a period when there is a sharp increase or decrease in equity prices or a major break in source data.
The discontinuities in a series can distort
estimated rates of growth in assets and liabilities between periods. In order to minimize these distortions, percentage changes in assets and liabilities in flow of funds releases should be calculated as: Percentage change t = (Flow t / Outstanding t-1) * 100 Preliminary Estimates. Figures shown for the most recent quarter in these tables are based on preliminary and incomplete information. A summary list of the principal sources of information available when the

2
latest quarter’s data were compiled is provided in a table following this introduction. The distinction between “available” data and “missing” data is not between final and preliminary versions of data, but rather between those source estimates that are fully ready when the latest quarterly publication is compiled and those that are not yet completed. However, the items that are shown as available are, in general, also preliminary in the sense that they are subject to revision by source agencies. Margins of Uncertainty. Flow of funds statistics are subject to uncertainties resulting from measurement errors in source data, incompatibilities among data from different sources, potential revisions in both financial and nonfinancial series, and incomplete data in parts of the accounts. The size of these uncertainties cannot be quantified in precise statistical terms, but allowance for them is explicitly made throughout the accounts by the inclusion of “discrepancies” for various sectors and instrument types. A discrepancy for a sector is the difference between its measured sources of funds and its measured uses of funds. For an instrument category, a discrepancy is the difference between measured funds borrowed through the financial instrument and measured funds lent through that instrument. The size of such discrepancies relative to the main asset or liability components is one indication of the quality of source data, especially on an annual basis. For quarterly data, differences in seasonal adjustment procedures for financial and nonfinancial components of the accounts sometimes result in discrepancies that cancel in annual data. Availability of Data. Flow of funds statistics are updated about ten weeks following the end of a quarter. This publication — the Z.1 release — is available from the Board's Publications Services. Flow of funds data
are also available electronically through the Internet at the following location:
http://www.federalreserve.gov/releases/Z1 The Internet site also provides quarterly data beginning in 1952, organized in compressed files that correspond to the tables published in this release. There are files for quarterly data for seasonally adjusted flows, unadjusted flows, outstandings, balance sheets, and debt (tables D.1, D.2, and D.3). There is a separate file for monthly data from January 1955 onward for the debt aggregate published in the Board's H.6 statistical release, “Money Stock and Debt Measures.” A Guide to the Flow of Funds Accounts is available. The 1,200-page Guide, in two volumes, explains in detail how the U.S. financial accounts are prepared and the principles underlying the accounts. The Guide can be purchased for $20.00 from the Board’s Publications Services. Publications Services accepts orders accompanied by checks as well as credit card orders. The Internet site for this release at the location shown above contains a link to an order form for the Guide that can be mailed or faxed to Publications Services. Subscription Information. The Federal Reserve Board charges for subscriptions to all statistical releases. Inquiries for releases should be directed to:
Publications Services, Stop 127 Board of Governors
of the Federal Reserve System 20th Street and Constitution Avenue, N.W.
Washington, DC 20551 (202) 452-3244

3
Availability of Data for Latest Quarter
Available at time of publication
Major items missing
1. National income and product accounts (NIPA)
Preliminary estimates, seasonally adjusted, for 2001:Q3.
Unadjusted flows since 2000.
2. Households and nonprofit organizations sector (tables F.100 and L.100)
Estimates for this sector are largely residuals and are derived from data for other sectors. Availability of data depends on schedules for other sectors. Data for consumer credit, which are estimated directly, are available through 2001:Q3. The source for nonprofit organizations data (tables F.100.a and L.100.a) is the Internal Revenue Service Statistics of Income. Data for nonprofit organizations are available for 1987 through 1998.
3. Nonfarm nonfinancial corporate business (tables F.102 and L.102)
Quarterly Financial Report (QFR) of the Census Bureau through 2001:Q2; Internal Revenue Service Statistics of Income data through 1998; securities offerings, mortgages, bank loans, commercial paper, and other loans through 2001:Q3.
Statistics of Income data since 1998; QFR data for 2001:Q3.
4. Nonfarm noncorporate business (tables F.103 and L.103)
Internal Revenue Service Statistics of Income data through 1998; bank and finance company loans and mortgage borrowing through 2001:Q3.
Statistics of Income data since 1998.
5. Farm business (tables F.104 and L.104)
Mortgages, bank loans, loans from government-sponsored enterprises, U.S. government loans to farms, and equity in government-sponsored enterprises through 2001:Q3; preliminary data for checkable deposits and currency and trade payables through 2000.
Consumption of fixed capital and undistributed profits since 2000.

4
6. State and local governments (tables F.105 and L.105)
Gross offerings and retirements of municipal securities, deposits at banks, and nonmarketable U.S. government security issues through 2001:Q3; selected financial assets through 1999:Q2 from the comprehensive annual financial reports of state and local governments that account for most of the holdings of the sector, and data from Standard & Poor’s on local government investment pools.
Selected financial asset items since 1999:Q2.
7. Federal government (tables F.106 and L.106)
Data from the Monthly Treasury Statement of Receipts and Outlays through 2001:Q3; Treasury data for loan programs through 2001:Q3.
None.
8. Rest of the world (U.S. international transactions) (tables F.107 and L.107)
Balance of payments data through 2001:Q2; NIPA estimates; data from bank Reports of Condition and Treasury International Capital System through 2001:Q3.
Balance of payments data for 2001:Q3.
9. Monetary authority (tables F.108 and L.108)
All data through 2001:Q3.
None.
10. Commercial banking (tables F.109 through F.113 and tables L.109 through L.113)
All data through 2001:Q3 for U.S.-chartered commercial banks, foreign banking offices in the U.S., bank holding companies, and commercial banks in U.S.-affiliated areas.
Data since 2000 for branches of domestic commercial banks located in U.S.-affiliated areas.
11. Savings institutions (tables F.114 and L.114)
All data through 2001:Q3.
None.
12. Credit unions (tables F.115 and L.115)
All data through 2001:Q3.
None.
13. Bank personal trusts and estates (tables F.116 and L.116)
All data through 1999.
Data since 1999.
14. Life insurance companies (tables F.117 and L.117)
All data through 2001:Q2.
Data for 2001:Q3.
15. Other insurance companies (tables F.118 and L.118)
All data through 2001:Q2.
Data for 2001:Q3.

5
16. Private pension funds (including FERS Thrift Savings Plan) (tables F.119 and L.119)
Quarterly data through 2001:Q3; Internal Revenue Service/Department of Labor/Pension Benefit Guaranty Corporation Form 5500 data through 1997.
Form 5500 data since 1997.
17. State and local government employee retirement funds (tables F.120 and L.120)
All data through 2001:Q2.
Data for 2001:Q3.
18. Money market mutual funds (tables F.121 and L.121)
All data through 2001:Q3.
None.
19. Mutual funds (tables F.122 and L.122)
All data through 2001:Q3.
None.
20. Closed-end funds (tables F.123 and L.123)
All data through 2000.
Data since 2000.
21. Exchange-traded funds (tables F.122 and L.122)
All data through 2001:Q3.
None.
22. Government-sponsored enterprises (tables F.124 and L.124)
Data for FHLBs, Fannie Mae, Freddie Mac, FCS, FICO, REFCORP, and Sallie Mae through 2001:Q3.
None.
23. Federally related mortgage pools (tables F.125 and L.125)
All data through 2001:Q3.
None.
24. Issuers of asset-backed securities (ABSs) (tables F.126 and L.126)
All data for private mortgage pools, consumer credit, business loans, student loans, consumer leases, and trade credit securitization through 2001:Q3.
None.
25. Finance companies (tables F.127 and L.127)
All data through 2001:Q3.
None.
26. Mortgage companies (tables F.128 and L.128)
Mortgage data through 1998:Q1.
Data since 1998:Q1.
27. Real estate investment trusts (REITs) (tables F.129 and L.129)
Data from SNL REIT DataSource through 2001:Q3.
None
28. Security brokers and dealers (tables F.130 and L.130)
Data for firms filing FOCUS and FOGS reports through 2001:Q3.
None.
29. Funding corporations (tables F.131 and L.131)
Estimates for this sector are largely residuals and are derived from data for other sectors.

6 Z.1, December 7, 2001
D.1 Debt Growth by Sector 1In percent; quarterly figures are seasonally adjusted annual rates
Domestic nonfinancial sectors Nonfederal
Households Business State and Domestic Federal Total Home Consumer local financial
Total government nonfederal Total mortgage credit Total Corporate governments sectors Foreign
1966 6.7 1.4 8.5 6.6 5.9 6.1 11.4 11.9 6.7 17.7 5.11967 7.3 4.9 8.1 5.7 5.8 5.0 11.1 11.6 6.7 -1.8 9.81968 7.9 4.5 8.9 8.2 7.0 9.9 10.1 10.3 7.5 17.3 6.31969 7.2 -1.1 9.7 7.7 6.9 8.3 11.6 11.4 9.6 32.8 6.91970 6.9 4.2 7.6 4.4 4.5 3.4 10.3 12.9 8.7 14.5 5.7
1971 9.5 8.3 9.8 9.2 8.6 11.7 10.1 7.7 10.9 8.7 9.71972 10.0 4.6 11.4 11.3 11.2 13.1 12.4 9.9 8.4 17.2 7.91973 10.7 2.0 12.9 12.4 11.7 13.3 14.7 17.5 7.8 28.9 10.31974 9.2 3.4 10.5 8.8 9.6 4.6 13.0 11.5 6.9 23.6 20.51975 9.3 23.9 6.3 8.3 9.3 3.8 4.9 3.4 5.4 0.8 17.4
1976 10.8 15.6 9.6 11.4 12.7 10.6 8.4 7.4 8.4 9.0 21.51977 12.8 11.0 13.3 15.5 16.5 15.5 12.5 12.0 8.4 18.9 11.61978 13.8 9.2 15.0 16.8 17.3 17.4 13.2 11.6 15.4 22.1 18.61979 12.2 5.8 13.7 15.2 16.2 13.8 13.6 11.1 9.0 22.1 9.51980 9.5 11.8 9.0 8.6 11.0 0.6 10.0 8.3 6.9 14.5 14.0
1981 10.4 11.6 10.1 7.7 7.3 5.0 12.8 13.5 8.0 18.2 11.91982 10.1 19.7 7.9 5.6 4.8 4.6 9.2 9.0 11.2 13.6 7.21983 12.0 18.9 10.2 11.2 10.3 12.8 9.0 8.0 11.4 13.4 8.21984 14.7 16.9 14.1 12.6 11.3 18.3 16.2 16.6 11.4 17.9 3.61985 15.7 16.5 15.4 15.8 14.1 15.9 11.4 12.6 31.8 19.4 0.5
1986 11.9 13.6 11.4 11.5 13.7 9.0 11.4 13.8 10.9 26.2 4.11987 9.0 8.0 9.3 10.5 13.5 4.6 7.6 8.7 12.0 18.2 2.61988 9.1 8.0 9.4 9.9 11.8 6.3 9.8 10.9 6.4 13.2 3.01989 7.3 7.0 7.4 9.4 11.1 6.0 6.0 7.1 5.6 10.5 4.01990 6.5 11.0 5.2 7.2 9.0 1.5 3.4 5.4 5.0 8.8 9.0
1991 4.3 11.1 2.2 5.1 6.9 -1.3 -2.3 -2.1 8.6 6.5 5.21992 4.6 10.9 2.6 5.3 6.5 0.8 -0.2 1.0 2.2 8.8 7.91993 4.9 8.3 3.7 6.0 5.4 7.3 0.4 1.4 6.0 9.7 21.91994 4.5 4.7 4.5 7.4 5.7 14.5 3.7 4.9 -4.0 14.0 -3.61995 5.4 4.1 5.9 7.4 5.1 14.1 7.2 8.5 -4.6 11.9 20.9
1996 5.4 4.0 5.8 7.0 6.8 8.1 6.2 6.2 -0.6 12.9 19.51997 5.6 0.6 7.3 6.4 6.7 4.7 9.0 9.5 5.3 13.7 13.21998 6.9 -1.4 9.6 8.4 9.2 5.9 11.6 12.0 7.2 19.9 7.11999 6.8 -1.9 9.3 8.6 9.3 7.4 11.3 11.6 4.4 16.6 4.32000 5.0 -8.0 8.5 8.5 8.4 9.6 9.9 10.1 2.2 10.7 9.9
1996 -- Q1 5.9 5.9 5.9 7.5 7.4 10.2 6.0 6.3 -1.8 9.5 13.6 Q2 5.4 3.0 6.3 7.5 6.7 9.8 6.9 7.2 -1.3 16.3 10.6 Q3 5.3 4.4 5.7 6.8 6.4 7.1 6.5 6.2 -3.2 10.3 27.1 Q4 4.3 2.5 5.0 5.6 6.0 4.5 4.5 4.5 3.9 13.0 21.8
1997 -- Q1 5.0 1.8 6.1 6.8 6.7 5.4 6.3 6.1 1.6 8.2 6.2 Q2 4.9 -0.4 6.8 6.0 5.8 5.2 8.2 8.3 4.3 14.0 13.8 Q3 6.1 1.3 7.8 7.2 9.1 4.3 8.8 9.6 7.1 12.8 21.4 Q4 5.8 -0.2 7.9 4.9 4.6 3.8 11.6 12.6 7.7 17.3 9.4
1998 -- Q1 7.2 -0.5 9.7 8.8 10.0 4.7 11.1 12.0 8.4 17.4 17.7 Q2 7.2 -0.5 9.7 7.9 7.4 7.5 12.3 13.4 7.5 18.4 16.2 Q3 5.8 -2.9 8.5 7.9 8.6 6.4 9.8 9.3 6.0 18.5 -1.7 Q4 6.7 -1.6 9.3 8.0 9.6 4.5 11.4 11.4 6.0 20.0 -4.0
1999 -- Q1 7.7 -2.3 10.7 9.1 9.3 9.7 13.3 15.0 7.3 18.5 4.8 Q2 5.6 -2.6 8.0 8.2 9.4 5.3 8.7 8.5 3.5 15.4 -3.6 Q3 7.1 -2.0 9.7 9.0 10.0 5.5 11.7 11.7 4.3 15.6 12.4 Q4 5.9 -0.8 7.7 7.0 7.5 8.3 9.7 9.4 2.2 13.0 3.4
2000 -- Q1 5.5 -5.9 8.5 8.1 7.2 10.4 10.6 11.2 1.0 8.0 17.7 Q2 5.5 -11.3 9.9 9.4 9.6 9.6 12.2 12.5 1.5 11.5 -1.1 Q3 4.4 -6.4 7.1 8.1 8.4 8.4 7.0 6.7 1.9 9.9 12.5 Q4 4.3 -9.6 7.5 7.4 7.4 8.7 8.4 8.5 4.2 11.7 9.2
2001 -- Q1 5.5 -0.1 6.8 7.8 7.8 10.0 5.4 4.8 8.1 10.2 -0.9 Q2 5.5 -7.6 8.4 9.3 11.5 4.5 7.5 7.5 8.3 9.2 -7.7 Q3 6.8 7.7 6.6 8.3 9.7 1.3 5.3 5.1 3.2 12.2 -17.4
1. Data shown are on an end-of-period basis and may differ from month-average statistics in the Board’s H.6 release.

Z.1, December 7, 2001 7
D.2 Borrowing by SectorBillions of dollars; quarterly figures are seasonally adjusted annual rates
Domestic nonfinancial sectors Nonfederal
Households Business State and Domestic Federal Total Home Consumer local financial
Total government nonfederal Total mortgage credit Total Corporate governments sectors Foreign
1966 67.3 3.6 63.7 22.2 13.0 5.9 34.6 24.7 6.9 11.0 1.91967 78.2 12.9 65.2 20.4 13.4 5.1 37.5 27.0 7.3 -1.3 3.91968 90.6 12.5 78.0 31.3 17.2 10.8 37.9 26.8 8.8 12.4 2.71969 88.9 -3.2 92.1 31.8 18.1 9.9 48.1 32.6 12.1 27.6 3.21970 91.3 12.1 79.3 19.7 12.6 4.4 47.5 40.9 12.1 16.2 2.8
1971 135.3 24.9 110.5 42.4 24.7 15.6 51.7 28.0 16.4 11.1 5.11972 156.1 15.0 141.0 57.0 35.1 19.5 70.1 38.4 14.0 23.9 4.41973 183.9 6.9 176.9 69.6 40.7 22.5 93.3 74.8 14.1 47.0 6.31974 175.1 11.9 163.2 55.4 37.2 8.9 94.3 56.5 13.4 49.6 13.81975 193.5 85.6 107.8 56.9 39.7 7.8 39.8 18.6 11.1 2.1 14.1
1976 244.8 69.2 175.6 84.4 58.9 22.0 72.7 42.2 18.5 23.5 20.51977 321.2 56.3 264.8 128.4 86.5 35.4 116.6 72.8 19.9 53.6 13.51978 390.7 52.5 338.2 159.9 105.6 46.0 138.8 79.1 39.4 74.7 24.01979 391.9 35.8 356.1 169.0 115.7 42.7 160.5 84.3 26.6 91.1 15.01980 343.7 77.4 266.3 109.7 91.6 2.3 134.4 69.7 22.2 73.2 24.2
1981 410.0 85.5 324.5 107.5 68.0 17.7 189.4 122.7 27.6 105.1 23.51982 439.9 161.3 278.6 85.1 48.6 17.2 151.8 92.4 41.7 93.0 16.01983 573.6 185.2 388.4 177.6 107.1 50.0 163.4 88.7 47.3 104.4 17.31984 791.2 197.2 594.0 219.6 127.9 80.7 321.8 203.7 52.5 157.8 8.41985 963.0 225.7 737.3 309.4 177.2 82.8 264.3 179.6 163.6 204.0 1.2
1986 845.3 216.0 629.3 262.1 199.8 54.4 293.0 222.5 74.2 328.8 9.71987 719.0 143.9 575.1 266.5 224.3 30.4 218.1 159.4 90.4 290.6 6.31988 787.6 155.1 632.5 273.2 217.0 43.4 305.3 220.1 54.0 250.2 7.41989 687.5 146.4 541.2 287.3 229.0 44.2 203.8 156.5 50.1 225.0 10.21990 657.0 246.9 410.1 240.3 207.3 11.9 122.6 128.8 47.2 211.6 23.9
1991 465.3 278.2 187.1 186.1 175.4 -10.7 -84.4 -53.7 85.4 170.9 15.11992 524.2 304.0 220.2 202.7 175.4 6.1 -6.6 24.6 24.1 244.0 24.11993 579.4 256.1 323.3 240.8 156.5 58.4 16.3 34.4 66.2 294.4 69.81994 561.1 155.9 405.3 314.5 172.9 124.9 137.0 124.6 -46.2 468.3 -13.91995 705.9 144.4 561.5 339.3 165.3 138.9 273.7 224.9 -51.5 454.0 78.5
1996 733.6 145.0 588.6 343.8 228.4 91.3 251.6 179.4 -6.8 550.1 88.41997 805.5 23.1 782.4 332.7 240.4 57.5 393.6 292.7 56.1 662.2 71.81998 1048.8 -52.6 1101.5 467.2 351.4 75.0 554.0 406.3 80.3 1087.2 43.41999 1099.8 -71.2 1171.1 517.1 389.5 99.5 601.6 440.8 52.3 1084.4 27.92000 873.4 -295.9 1169.2 554.9 382.6 139.0 587.2 430.6 27.2 815.6 67.0
1996 -- Q1 807.7 213.7 594.0 369.1 249.7 114.4 244.7 182.5 -19.8 406.8 61.7 Q2 757.9 109.2 648.7 374.8 229.8 112.9 287.6 211.1 -13.7 714.3 49.6 Q3 750.0 162.0 588.0 343.7 222.4 84.1 278.5 187.3 -34.2 469.6 130.4 Q4 619.0 95.2 523.9 287.8 211.5 53.7 195.5 136.7 40.6 609.5 111.8
1997 -- Q1 717.8 67.1 650.7 356.5 241.5 65.1 277.2 190.2 17.0 397.1 33.6 Q2 716.7 -15.0 731.7 320.8 209.6 64.2 364.9 260.4 46.1 690.1 76.1 Q3 909.1 48.4 860.7 387.4 336.8 53.1 397.1 307.1 76.2 655.1 121.7 Q4 878.4 -8.1 886.5 266.3 173.6 47.6 535.2 413.1 84.9 906.7 55.7
1998 -- Q1 1092.3 -19.8 1112.1 488.6 381.2 59.2 528.9 406.4 94.6 952.0 107.9 Q2 1113.2 -20.2 1133.4 446.1 289.8 96.8 602.0 465.4 85.4 1046.0 103.1 Q3 915.4 -109.6 1025.0 459.6 343.4 83.4 495.3 333.8 70.0 1102.7 -11.2 Q4 1074.5 -61.0 1135.4 474.4 391.1 60.4 589.8 419.5 71.3 1248.0 -26.3
1999 -- Q1 1257.7 -85.1 1342.8 547.9 386.6 130.1 707.4 568.0 87.6 1208.5 31.5 Q2 928.7 -95.4 1024.1 505.3 399.0 73.6 476.6 333.4 42.2 1053.5 -23.6 Q3 1202.7 -74.3 1277.0 568.3 437.6 76.9 656.3 471.6 52.4 1112.0 81.1 Q4 1010.3 -30.0 1040.3 446.9 334.6 117.5 566.2 390.0 27.2 963.7 22.8
2000 -- Q1 951.1 -217.2 1168.4 526.9 327.5 149.9 628.5 479.7 12.9 608.0 120.3 Q2 978.2 -408.7 1386.9 624.3 444.6 142.1 744.4 550.2 18.2 897.1 -7.9 Q3 792.0 -226.2 1018.2 554.5 397.9 128.2 440.0 303.7 23.8 794.0 88.6 Q4 772.1 -331.3 1103.5 514.0 360.3 135.6 535.8 388.8 53.7 963.1 66.8
2001 -- Q1 1006.5 -4.3 1010.9 554.4 387.8 159.9 352.6 225.2 103.9 864.2 -6.9 Q2 1018.6 -256.0 1274.6 671.2 581.0 73.6 494.7 354.3 108.7 795.7 -57.2 Q3 1275.5 255.7 1019.8 616.2 502.3 21.3 360.6 248.9 43.0 1086.3 -126.8

8 Z.1, December 7, 2001
D.3 Debt Outstanding by Sector 1Billions of dollars; quarterly figures are seasonally adjusted
Domestic nonfinancial sectors Nonfederal
Households Business State and Domestic Federal Total Home Consumer local financial
Total government nonfederal Total mortgage credit Total Corporate governments sectors Foreign
1966 1074.6 265.1 809.5 360.3 231.8 103.4 339.1 232.1 110.0 72.9 39.51967 1152.6 278.1 874.6 380.6 245.0 108.6 376.6 259.1 117.4 71.6 43.31968 1242.7 290.6 952.1 412.2 262.1 119.3 413.8 285.1 126.1 84.0 46.11969 1332.0 287.4 1044.6 444.4 280.2 129.2 462.0 317.8 138.3 111.5 49.21970 1422.3 299.5 1122.8 460.2 289.0 133.7 512.3 361.1 150.3 127.8 52.1
1971 1557.5 324.4 1233.1 503.1 313.1 149.2 563.3 389.1 166.7 138.9 56.61972 1713.5 339.4 1374.1 560.1 348.2 168.8 633.3 427.5 180.7 162.8 61.11973 1897.9 346.3 1551.6 630.8 388.1 193.0 725.9 492.1 194.8 209.8 67.41974 2072.3 358.2 1714.1 686.1 425.1 201.9 819.8 548.1 208.2 258.3 81.21975 2264.7 443.9 1820.8 740.1 464.7 207.0 861.4 568.5 219.4 260.4 95.6
1976 2508.3 513.1 1995.3 825.9 524.0 229.0 931.5 608.1 237.8 283.9 116.01977 2829.6 569.4 2260.2 954.2 610.5 264.4 1049.8 682.6 256.2 337.8 129.41978 3214.5 621.9 2592.6 1112.8 716.0 310.4 1184.2 757.2 295.6 412.5 157.61979 3606.5 657.7 2948.9 1282.7 833.3 353.1 1344.0 840.7 322.2 504.9 172.91980 3957.9 735.0 3222.9 1404.0 934.5 355.4 1474.5 906.6 344.4 578.1 197.2
1981 4366.4 820.5 3545.9 1516.2 1007.2 373.1 1657.6 1023.0 372.1 682.4 220.71982 4788.3 981.8 3806.5 1586.6 1041.3 390.3 1806.1 1112.1 413.8 778.1 212.61983 5364.8 1167.0 4197.8 1744.2 1128.5 440.3 1992.4 1223.7 461.1 882.7 229.81984 6151.2 1364.2 4787.0 1956.2 1255.7 521.0 2317.2 1430.4 513.6 1052.4 238.01985 7132.3 1589.9 5542.5 2286.4 1458.2 603.8 2578.1 1606.7 677.9 1257.3 239.3
1986 7975.1 1805.9 6169.3 2546.9 1657.9 658.2 2870.2 1828.2 752.1 1593.6 241.01987 8677.6 1949.8 6727.8 2767.4 1840.2 688.6 3119.3 2018.7 841.0 1895.5 247.41988 9461.7 2104.9 7356.8 3057.6 2067.8 732.0 3404.2 2216.2 895.0 2145.8 254.81989 10166.3 2251.2 7915.0 3355.3 2295.1 793.3 3614.6 2379.7 945.2 2399.3 265.01990 10850.6 2498.1 8352.4 3624.7 2531.7 805.1 3735.4 2506.6 992.3 2615.8 288.9
1991 11312.5 2776.4 8536.2 3814.4 2710.6 794.5 3644.1 2450.8 1077.7 2786.7 304.01992 11839.9 3080.3 8759.6 4017.1 2886.0 800.6 3640.7 2477.0 1101.8 3046.3 318.81993 12434.1 3336.5 9097.7 4260.3 3044.9 859.0 3669.4 2523.9 1167.9 3346.1 388.61994 13001.5 3492.3 9509.2 4574.5 3217.8 983.9 3813.0 2655.0 1121.7 3822.1 375.01995 13707.5 3636.7 10070.7 4913.8 3383.0 1122.8 4086.7 2879.9 1070.2 4278.8 453.7
1996 14441.1 3781.8 10659.4 5223.9 3577.7 1214.1 4372.0 3093.0 1063.4 4828.8 542.21997 15245.1 3804.9 11440.2 5556.9 3818.1 1271.6 4763.8 3383.9 1119.5 5458.0 608.01998 16293.9 3752.2 12541.7 6024.1 4169.5 1346.6 5317.8 3790.2 1199.8 6545.2 651.51999 17428.5 3681.0 13747.4 6541.5 4558.9 1446.1 5953.8 4265.3 1252.1 7629.6 679.62000 18320.9 3385.2 14935.7 7115.5 4941.5 1593.1 6540.9 4695.9 1279.3 8457.1 746.7
1996 -- Q1 13909.4 3690.2 10219.2 5006.1 3445.5 1151.4 4147.9 2925.5 1065.3 4380.5 469.1 Q2 14098.9 3717.5 10381.4 5066.1 3469.2 1179.6 4253.5 3012.0 1061.8 4559.0 481.5 Q3 14286.4 3758.0 10528.4 5152.0 3524.8 1200.7 4323.1 3058.8 1053.3 4676.5 514.1 Q4 14441.1 3781.8 10659.4 5223.9 3577.7 1214.1 4372.0 3093.0 1063.4 4828.8 542.2
1997 -- Q1 14620.6 3798.5 10822.0 5313.3 3638.1 1230.4 4441.0 3140.3 1067.7 4928.1 550.6 Q2 14799.7 3794.8 11005.0 5393.5 3690.5 1246.4 4532.3 3205.4 1079.2 5100.6 569.6 Q3 15025.5 3806.9 11218.6 5490.4 3774.7 1259.7 4630.0 3280.6 1098.2 5231.3 593.9 Q4 15245.1 3804.9 11440.2 5556.9 3818.1 1271.6 4763.8 3383.9 1119.5 5458.0 608.0
1998 -- Q1 15518.2 3799.9 11718.2 5679.1 3913.4 1286.4 4896.0 3485.5 1143.1 5696.0 635.0 Q2 15796.5 3794.9 12001.6 5790.6 3985.8 1310.6 5046.5 3601.8 1164.5 5957.5 660.7 Q3 16025.3 3767.5 12257.8 5905.5 4071.7 1331.5 5170.3 3685.3 1182.0 6233.2 657.9 Q4 16293.9 3752.2 12541.7 6024.1 4169.5 1346.6 5317.8 3790.2 1199.8 6545.2 651.5
1999 -- Q1 16610.1 3731.0 12879.1 6161.4 4266.1 1379.1 5496.1 3933.6 1221.7 6847.3 659.4 Q2 16842.3 3707.1 13135.2 6287.7 4365.9 1397.5 5615.2 4017.0 1232.2 7110.7 653.5 Q3 17175.9 3688.5 13487.3 6429.8 4475.3 1416.8 5812.2 4167.8 1245.3 7388.7 673.8 Q4 17428.5 3681.0 13747.4 6541.5 4558.9 1446.1 5953.8 4265.3 1252.1 7629.6 679.6
2000 -- Q1 17666.2 3626.7 14039.5 6673.2 4640.8 1483.6 6110.9 4385.3 1255.4 7781.6 709.7 Q2 17910.8 3524.6 14386.2 6829.3 4751.9 1519.1 6297.0 4522.8 1259.9 8005.9 707.7 Q3 18119.9 3468.0 14651.9 6979.0 4851.4 1551.2 6407.0 4598.7 1265.9 8208.4 729.9 Q4 18320.9 3385.2 14935.7 7115.5 4941.5 1593.1 6540.9 4695.9 1279.3 8457.1 746.7
2001 -- Q1 18572.5 3384.1 15188.4 7254.1 5038.4 1633.0 6629.1 4752.2 1305.3 8670.5 745.0 Q2 18827.7 3320.1 15507.7 7421.9 5183.7 1651.4 6753.4 4841.4 1332.4 8869.4 730.7 Q3 19146.6 3384.0 15762.6 7575.9 5309.2 1656.7 6843.5 4903.6 1343.2 9141.0 699.0
1. Data shown are on an end-of-period basis and may differ from month-average statistics in the Board’s H.6 release.

Z.1, December 7, 2001 9
F.1 Total Net Borrowing and Lending in Credit Markets (1)Billions of dollars; quarterly figures are seasonally adjusted annual rates
1997 1998 1999 2000 2000 2001 Q1 Q2 Q3 Q4 Q1 Q2 Q3
1 Total net borrowing 1539.5 2179.4 2212.2 1755.9 1679.4 1867.4 1674.6 1802.0 1863.8 1757.2 2235.0 1
2 Domestic nonfinancial sectors 805.5 1048.8 1099.8 873.4 951.1 978.2 792.0 772.1 1006.5 1018.6 1275.5 2
3 Federal government 23.1 -52.6 -71.2 -295.9 -217.2 -408.7 -226.2 -331.3 -4.3 -256.0 255.7 3
4 Nonfederal sectors 782.4 1101.5 1171.1 1169.2 1168.4 1386.9 1018.2 1103.5 1010.9 1274.6 1019.8 4
5 Household sector 332.7 467.2 517.1 554.9 526.9 624.3 554.5 514.0 554.4 671.2 616.2 5 6 Nonfinancial corporate business 292.7 406.3 440.8 430.6 479.7 550.2 303.7 388.8 225.2 354.3 248.9 6 7 Nonfarm noncorporate business 94.7 139.7 155.4 145.7 135.0 184.5 129.1 134.2 121.3 130.6 108.6 7 8 Farm business 6.2 8.0 5.5 10.9 13.8 9.7 7.2 12.8 6.0 9.8 3.1 8 9 State and local governments 56.1 80.3 52.3 27.2 12.9 18.2 23.8 53.7 103.9 108.7 43.0 9
10 Rest of the world 71.8 43.4 27.9 67.0 120.3 -7.9 88.6 66.8 -6.9 -57.2 -126.8 10
11 Financial sectors 662.2 1087.2 1084.4 815.6 608.0 897.1 794.0 963.1 864.2 795.7 1086.3 11
12 Commercial banking 46.1 72.9 67.2 60.0 78.3 99.3 43.4 18.8 148.3 -15.8 69.8 1213 U.S.-chartered commercial banks 29.5 52.8 41.8 36.8 70.2 67.9 13.6 -4.5 52.9 -23.3 52.0 1314 Foreign banking offices in U.S. -2.4 -4.8 -0.4 -0.0 -0.2 -0.3 -0.4 0.7 -0.8 -2.4 -1.3 1415 Bank holding companies 19.0 24.9 25.8 23.2 8.3 31.7 30.3 22.7 96.1 9.9 19.1 15
16 Savings institutions 19.7 52.2 48.0 27.3 57.5 69.0 -37.9 20.4 62.5 16.1 12.6 1617 Credit unions 0.1 0.6 2.2 0.0 -2.9 0.9 1.1 1.0 -0.6 0.8 1.5 17
18 Life insurance companies 0.2 0.7 0.7 -0.7 -0.7 -1.1 -0.3 -0.7 -2.4 0.1 3.5 1819 Government-sponsored enterprises 98.4 278.3 318.2 234.1 104.9 248.9 278.1 304.5 262.3 268.3 328.0 1920 Federally related mortgage pools 114.6 192.6 273.8 199.4 119.5 132.2 236.7 309.1 170.3 406.5 492.6 2021 ABS issuers 202.2 321.4 223.4 196.3 175.0 146.0 156.2 307.9 295.8 172.3 303.2 21
22 Finance companies 57.8 57.1 70.3 81.2 61.1 139.4 98.1 26.1 -72.8 64.1 22.1 2223 Mortgage companies -4.6 1.6 0.2 0.1 -3.0 2.7 -0.3 1.0 0.7 0.6 0.8 2324 REITs 39.6 62.7 6.3 2.7 11.5 9.8 -2.4 -8.1 -6.1 10.5 -10.2 2425 Brokers and dealers 8.1 7.2 -17.2 15.6 44.4 -0.7 25.4 -6.6 -23.9 35.7 12.3 2526 Funding corporations 79.9 40.0 91.5 -0.4 -37.5 50.6 -4.2 -10.4 30.1 -163.6 -150.0 26
27 Total net lending 1539.5 2179.4 2212.2 1755.9 1679.4 1867.4 1674.6 1802.0 1863.8 1757.2 2235.0 27
28 Domestic nonfederal nonfinancial sectors -21.3 99.5 196.3 -152.6 -218.5 90.3 -255.1 -227.2 -171.6 -153.8 -178.8 28
29 Household sector -11.8 -37.1 148.6 -170.0 -274.4 -10.4 -183.3 -212.1 -172.5 -140.5 -118.5 2930 Nonfinancial corporate business -12.7 -16.0 -2.8 10.3 56.8 60.4 -51.4 -24.5 4.1 16.6 -23.7 3031 Nonfarm noncorporate business 3.0 18.1 7.1 -2.1 -2.1 0.4 -4.0 -2.7 -4.8 -5.2 -6.2 3132 State and local governments 0.1 134.5 43.4 9.2 1.2 39.9 -16.4 12.1 1.5 -24.8 -30.4 32
33 Federal government 5.1 13.5 5.8 7.3 6.5 7.7 4.5 10.6 4.6 4.0 1.0 3334 Rest of the world 311.3 254.2 208.8 279.3 315.2 197.9 216.2 387.8 411.2 349.6 381.9 34
35 Financial sectors 1244.5 1812.1 1801.3 1621.8 1576.1 1571.4 1709.0 1630.7 1619.7 1557.4 2030.9 35
36 Monetary authority 38.3 21.1 25.7 33.7 102.0 -5.4 39.1 -0.9 53.7 26.4 8.7 36
37 Commercial banking 324.3 305.2 308.2 358.4 415.8 497.4 363.2 157.0 152.8 133.9 234.8 3738 U.S.-chartered commercial banks 274.9 312.0 317.6 339.8 448.2 510.9 324.8 75.3 107.9 179.7 215.4 3839 Foreign banking offices in U.S. 40.2 -11.9 -20.1 24.0 4.5 -22.3 32.8 81.1 41.3 -48.6 16.5 3940 Bank holding companies 5.4 -0.9 6.2 -12.2 -42.2 3.5 -6.7 -3.2 7.3 -2.8 -1.4 4041 Banks in U.S.-affiliated areas 3.7 6.0 4.4 6.7 5.4 5.4 12.3 3.8 -3.6 5.6 4.2 41
42 Savings institutions -4.7 36.1 68.6 56.5 55.6 65.0 62.7 42.5 52.5 57.3 -6.0 4243 Credit unions 16.8 19.0 27.5 30.5 35.7 31.6 21.2 33.6 23.2 7.6 61.7 4344 Bank personal trusts and estates -25.0 -12.8 27.8 17.1 18.9 13.8 17.6 18.1 10.7 13.4 8.8 44
45 Life insurance companies 104.8 76.9 53.5 57.9 65.0 52.9 74.8 38.8 95.3 124.9 162.4 4546 Other insurance companies 25.2 5.8 -3.0 -8.7 -11.2 -18.1 6.2 -11.7 2.1 0.1 9.0 4647 Private pension funds 47.6 56.4 45.0 41.3 46.8 24.7 64.9 28.7 26.1 -7.1 -0.9 4748 State and local govt. retirement funds 67.1 72.1 46.9 54.6 63.3 31.5 37.6 86.1 -70.7 53.4 18.5 48
49 Money market mutual funds 87.5 244.0 182.0 148.9 161.5 -118.2 256.1 296.0 303.4 166.2 379.1 4950 Mutual funds 80.9 124.8 47.2 26.8 -66.9 63.1 50.1 60.8 69.4 165.1 123.9 5051 Closed-end funds -2.6 5.5 7.4 -8.4 -8.4 -8.4 -8.4 -8.4 -8.4 -8.4 -8.4 5152 Government-sponsored enterprises 106.6 314.6 291.7 240.9 205.4 250.9 188.6 318.8 347.8 296.2 267.7 5253 Federally related mortgage pools 114.6 192.6 273.8 199.4 119.5 132.2 236.7 309.1 170.3 406.5 492.6 5354 ABS issuers 163.8 281.7 205.2 166.4 154.2 111.4 120.9 278.9 269.8 150.0 276.4 54
55 Finance companies 23.1 77.3 97.0 108.0 145.4 147.6 102.8 36.2 -0.9 126.7 -42.1 5556 Mortgage companies -9.1 3.2 0.3 0.2 -6.0 5.5 -0.5 2.0 1.4 1.1 1.7 5657 REITs 20.2 -5.1 -2.6 -6.3 -16.3 -2.5 -3.6 -2.8 4.0 1.1 7.7 5758 Brokers and dealers 14.9 6.8 -34.7 68.9 102.9 89.8 152.1 -69.0 289.5 35.4 250.1 5859 Funding corporations 50.4 -12.9 133.8 35.9 -7.2 206.8 -73.0 17.0 -172.5 -192.4 -214.6 59
(1) Excludes corporate equities and mutual fund shares.

10 Z.1, December 7, 2001
F.2 Credit Market Borrowing by Nonfinancial SectorsBillions of dollars; quarterly figures are seasonally adjusted annual rates
1997 1998 1999 2000 2000 2001 Q1 Q2 Q3 Q4 Q1 Q2 Q3
1 Domestic 805.5 1048.8 1099.8 873.4 951.1 978.2 792.0 772.1 1006.5 1018.6 1275.5 1
2 Federal government 23.1 -52.6 -71.2 -295.9 -217.2 -408.7 -226.2 -331.3 -4.3 -256.0 255.7 2 3 Treasury securities 23.2 -54.6 -71.0 -294.9 -215.2 -410.5 -223.8 -330.2 -2.1 -257.1 256.0 3 4 Budget agency securities and mortgages -0.1 2.0 -0.2 -1.0 -2.1 1.8 -2.4 -1.2 -2.2 1.1 -0.4 4
5 Nonfederal, by instrument 782.4 1101.5 1171.1 1169.2 1168.4 1386.9 1018.2 1103.5 1010.9 1274.6 1019.8 5 6 Commercial paper 13.7 24.4 37.4 48.1 29.8 110.4 56.1 -4.0 -207.2 -141.5 -74.1 6 7 Municipal securities and loans 71.4 96.8 68.2 35.3 20.0 30.1 31.0 60.1 110.7 112.4 56.0 7 8 Corporate bonds 150.5 218.7 229.9 171.1 186.2 153.8 168.8 175.6 400.9 428.0 187.7 8 9 Bank loans n.e.c. 106.4 108.1 82.6 103.1 139.5 166.5 47.0 59.3 -5.9 -153.2 -9.9 910 Other loans and advances 59.5 82.1 57.1 101.5 140.1 124.2 16.5 125.2 -12.0 117.7 78.4 10
11 Mortgages 323.3 496.4 596.3 571.2 502.9 659.6 570.7 551.6 564.6 837.7 760.6 1112 Home 258.3 389.9 435.2 422.5 361.9 490.3 441.9 395.9 434.3 622.9 544.7 1213 Multifamily residential 7.5 23.8 40.5 37.0 29.2 48.0 28.8 41.7 39.3 55.5 57.7 1314 Commercial 54.4 76.1 114.8 105.2 104.4 111.2 93.4 112.0 86.8 146.8 151.6 1415 Farm 3.1 6.5 5.8 6.5 7.4 10.1 6.5 2.0 4.2 12.4 6.5 1516 Consumer credit 57.5 75.0 99.5 139.0 149.9 142.1 128.2 135.6 159.9 73.6 21.3 16
17 Nonfederal, by sector 782.4 1101.5 1171.1 1169.2 1168.4 1386.9 1018.2 1103.5 1010.9 1274.6 1019.8 1718 Household sector 332.7 467.2 517.1 554.9 526.9 624.3 554.5 514.0 554.4 671.2 616.2 1819 Nonfinancial business 393.6 554.0 601.6 587.2 628.5 744.4 440.0 535.8 352.6 494.7 360.6 1920 Corporate 292.7 406.3 440.8 430.6 479.7 550.2 303.7 388.8 225.2 354.3 248.9 2021 Nonfarm noncorporate 94.7 139.7 155.4 145.7 135.0 184.5 129.1 134.2 121.3 130.6 108.6 2122 Farm 6.2 8.0 5.5 10.9 13.8 9.7 7.2 12.8 6.0 9.8 3.1 2223 State and local governments 56.1 80.3 52.3 27.2 12.9 18.2 23.8 53.7 103.9 108.7 43.0 23
24 Foreign borrowing in U.S. 71.8 43.4 27.9 67.0 120.3 -7.9 88.6 66.8 -6.9 -57.2 -126.8 24
25 Commercial paper 3.7 7.8 16.3 31.7 57.8 12.0 7.0 50.1 -25.4 -5.6 -26.5 2526 Bonds 61.4 34.9 16.8 25.2 47.6 -27.3 71.4 9.0 17.1 -15.9 -101.4 2627 Bank loans n.e.c. 8.5 6.7 0.5 11.3 15.4 5.7 11.9 12.2 13.0 -31.0 4.4 2728 Other loans and advances -1.8 -6.0 -5.7 -1.3 -0.5 1.7 -1.7 -4.6 -11.6 -4.7 -3.4 28
29 Domestic and foreign 877.3 1092.2 1127.8 940.3 1071.4 970.3 880.6 838.9 999.6 961.5 1148.7 29
F.3 Credit Market Borrowing by Financial SectorsBillions of dollars; quarterly figures are seasonally adjusted annual rates
1 By instrument 662.2 1087.2 1084.4 815.6 608.0 897.1 794.0 963.1 864.2 795.7 1086.3 1
2 Federal government-related 212.9 470.9 592.0 433.5 224.4 381.1 514.8 613.6 432.6 674.8 820.6 2 3 Govt.-sponsored enterprise securities 98.4 278.3 318.2 234.1 104.9 248.9 278.1 304.5 262.3 268.3 328.0 3 4 Mortgage pool securities 114.6 192.6 273.8 199.4 119.5 132.2 236.7 309.1 170.3 406.5 492.6 4 5 U.S. government loans 0.0 0.0 0.0 0.0 0.0 0.0 0.0 0.0 0.0 0.0 0.0 5
6 Private financial sectors 449.3 616.3 492.5 382.1 383.6 516.1 279.2 349.5 431.7 120.9 265.7 6 7 Open market paper 166.7 161.0 176.2 127.7 114.6 136.7 106.5 153.2 -134.6 -85.4 -85.6 7 8 Corporate bonds 218.9 310.1 218.2 205.9 171.8 243.3 205.0 203.7 438.9 186.8 309.6 8 9 Bank loans n.e.c. 13.3 30.1 -14.2 -0.3 3.2 6.9 -6.7 -4.4 27.1 14.3 -8.1 910 Other loans and advances 35.6 90.2 107.1 42.5 87.0 119.2 -31.6 -4.8 107.8 -11.0 58.0 1011 Mortgages 14.9 24.8 5.1 6.2 7.0 10.0 6.0 1.8 -7.5 16.2 -8.2 11
12 By sector 662.2 1087.2 1084.4 815.6 608.0 897.1 794.0 963.1 864.2 795.7 1086.3 12
13 Commercial banking 46.1 72.9 67.2 60.0 78.3 99.3 43.4 18.8 148.3 -15.8 69.8 1314 U.S.-chartered commercial banks 29.5 52.8 41.8 36.8 70.2 67.9 13.6 -4.5 52.9 -23.3 52.0 1415 Foreign banking offices in U.S. -2.4 -4.8 -0.4 -0.0 -0.2 -0.3 -0.4 0.7 -0.8 -2.4 -1.3 1516 Bank holding companies 19.0 24.9 25.8 23.2 8.3 31.7 30.3 22.7 96.1 9.9 19.1 16
17 Savings institutions 19.7 52.2 48.0 27.3 57.5 69.0 -37.9 20.4 62.5 16.1 12.6 1718 Credit unions 0.1 0.6 2.2 0.0 -2.9 0.9 1.1 1.0 -0.6 0.8 1.5 18
19 Life insurance companies 0.2 0.7 0.7 -0.7 -0.7 -1.1 -0.3 -0.7 -2.4 0.1 3.5 1920 Government-sponsored enterprises 98.4 278.3 318.2 234.1 104.9 248.9 278.1 304.5 262.3 268.3 328.0 2021 Federally related mortgage pools 114.6 192.6 273.8 199.4 119.5 132.2 236.7 309.1 170.3 406.5 492.6 2122 ABS issuers 202.2 321.4 223.4 196.3 175.0 146.0 156.2 307.9 295.8 172.3 303.2 22
23 Finance companies 57.8 57.1 70.3 81.2 61.1 139.4 98.1 26.1 -72.8 64.1 22.1 2324 Mortgage companies -4.6 1.6 0.2 0.1 -3.0 2.7 -0.3 1.0 0.7 0.6 0.8 2425 REITs 39.6 62.7 6.3 2.7 11.5 9.8 -2.4 -8.1 -6.1 10.5 -10.2 2526 Brokers and dealers 8.1 7.2 -17.2 15.6 44.4 -0.7 25.4 -6.6 -23.9 35.7 12.3 2627 Funding corporations 79.9 40.0 91.5 -0.4 -37.5 50.6 -4.2 -10.4 30.1 -163.6 -150.0 27

Z.1, December 7, 2001 11
F.4 Credit Market Borrowing, All Sectors, by InstrumentBillions of dollars; quarterly figures are seasonally adjusted annual rates
1997 1998 1999 2000 2000 2001 Q1 Q2 Q3 Q4 Q1 Q2 Q3
1 Total 1539.5 2179.4 2212.2 1755.9 1679.4 1867.4 1674.6 1802.0 1863.8 1757.2 2235.0 1
2 Open market paper 184.1 193.1 229.9 207.6 202.1 259.1 169.7 199.3 -367.2 -232.5 -186.3 2 3 U.S. government securities 236.0 418.3 520.7 137.6 7.2 -27.6 288.6 282.2 428.2 418.8 1076.3 3 4 Municipal securities 71.4 96.8 68.2 35.3 20.0 30.1 31.0 60.1 110.7 112.4 56.0 4 5 Corporate and foreign bonds 430.8 563.7 465.0 402.2 405.6 369.8 445.2 388.3 856.9 598.9 395.9 5
6 Bank loans n.e.c. 128.2 145.0 68.9 114.1 158.0 179.2 52.2 67.1 34.1 -170.0 -13.6 6 7 Other loans and advances 93.2 166.3 158.5 142.7 226.6 245.1 -16.8 115.8 84.2 102.0 133.0 7 8 Mortgages 338.2 521.2 601.4 577.4 509.9 669.6 576.7 553.5 557.1 853.9 752.3 8 9 Consumer credit 57.5 75.0 99.5 139.0 149.9 142.1 128.2 135.6 159.9 73.6 21.3 9
Memo: Funds raised through corporate equities and mutual fund shares
10 Total net issues 185.2 108.8 153.7 207.7 390.1 209.9 245.6 -14.8 233.7 387.5 88.9 10
11 Corporate equities -79.9 -165.8 -34.6 -36.2 82.8 -22.2 -33.8 -171.5 137.3 119.5 -80.9 1112 Nonfinancial -114.4 -267.0 -143.5 -150.6 61.2 -245.2 -67.6 -350.8 -25.6 -72.6 -118.5 12 Foreign shares purchased by13 U.S. residents 57.6 101.3 114.4 99.7 62.6 185.9 61.1 89.4 109.2 208.8 10.9 1314 Financial -23.1 -0.1 -5.6 14.7 -41.0 37.2 -27.3 89.8 53.7 -16.7 26.7 1415 Mutual fund shares 265.1 274.6 188.3 243.9 307.3 232.0 279.4 156.7 96.4 268.0 169.8 15
F.5 Net Increase in Liabilities and Its Relation to Net Acquisition of Financial AssetsBillions of dollars; quarterly figures are seasonally adjusted annual rates
Net flows through credit markets 1 (from table F.4, line 1) 1539.5 2179.4 2212.2 1755.9 1679.4 1867.4 1674.6 1802.0 1863.8 1757.2 2235.0 1
2 Official foreign exchange 0.7 6.6 -8.7 -0.4 1.5 -8.8 0.7 4.9 -1.5 4.7 19.1 2 3 SDR certificates -0.5 0.0 -3.0 -4.0 0.0 -8.0 -4.0 -4.0 0.0 0.0 0.0 3 4 Treasury currency 0.5 0.6 1.0 2.4 2.2 3.2 4.2 -0.0 -1.1 1.1 -0.0 4 5 Foreign deposits 107.7 6.5 61.0 120.8 313.3 3.4 -40.8 207.4 235.5 -146.5 15.4 5
6 Net interbank transactions -19.7 -32.3 17.6 -20.3 -72.9 151.9 -170.6 10.6 -45.7 19.3 19.7 6 7 Checkable deposits and currency 41.2 47.4 151.4 -71.5 -206.8 -33.8 5.0 -50.2 90.3 100.8 245.3 7 8 Small time and savings deposits 97.1 152.4 44.7 190.7 104.6 123.0 224.5 310.8 288.3 194.2 229.2 8 9 Large time deposits 122.5 92.1 130.6 118.4 154.1 101.2 152.9 65.2 130.6 51.9 14.9 910 Money market fund shares 155.9 287.2 249.1 233.3 239.7 71.5 250.9 371.1 621.4 322.5 367.7 10
11 Security RPs 120.9 91.3 169.7 110.7 275.8 155.1 277.1 -265.4 -12.8 177.7 262.2 1112 Corporate equities -79.9 -165.8 -34.6 -36.2 82.8 -22.2 -33.8 -171.5 137.3 119.5 -80.9 1213 Mutual fund shares 265.1 274.6 188.3 243.9 307.3 232.0 279.4 156.7 96.4 268.0 169.8 1314 Trade payables 139.7 109.2 222.3 166.1 193.6 212.9 138.5 119.3 -16.2 -100.0 -81.4 14
15 Security credit 111.0 103.3 104.3 146.1 507.8 -95.3 97.5 74.4 -140.9 -28.5 485.8 1516 Life insurance reserves 59.3 48.0 50.8 50.2 54.9 45.6 53.0 47.3 52.7 53.2 56.5 1617 Pension fund reserves 201.4 202.1 184.4 215.9 206.9 260.7 227.0 168.8 255.5 168.7 192.9 1718 Taxes payable 22.3 21.3 22.3 21.7 31.0 26.5 3.3 26.0 3.3 16.3 114.4 18
19 Investment in bank personal trusts -49.9 -41.8 -6.5 -29.7 -28.4 -33.1 -29.2 -28.0 -26.1 -22.7 -28.2 1920 Noncorporate proprietors’ equity -70.9 -80.6 -64.8 -46.2 -63.4 -45.0 -26.7 -49.7 -48.5 -25.1 -60.2 2021 Miscellaneous 492.8 986.8 749.8 1030.2 904.3 1084.0 1399.2 733.1 500.7 789.8 571.8 21
22 Total financial sources 3256.8 4288.2 4441.8 4197.9 4687.7 4092.3 4482.8 3528.8 3983.1 3722.3 4749.2 22
- Liabilities not identified as assets:23 Treasury currency -0.2 -0.1 -0.7 -1.2 -1.8 -0.7 0.9 -3.3 -3.6 -0.5 -0.7 2324 Foreign deposits 106.2 -8.5 45.8 70.2 263.1 -82.2 -100.2 200.3 181.5 -121.2 24.8 2425 Net interbank liabilities -19.9 3.4 3.5 17.4 25.3 5.4 -12.1 51.1 16.7 13.6 8.3 25
26 Security RPs 63.2 60.6 30.0 111.1 567.2 51.9 126.5 -301.4 -161.7 171.9 36.6 2627 Taxes payable 28.0 19.7 6.5 14.1 9.5 4.8 -2.6 44.6 4.4 -9.7 12.9 2728 Miscellaneous -245.5 -127.4 -418.9 -369.2 -501.0 -353.3 -232.2 -390.1 27.3 -477.6 -87.0 28
- Floats not included in assets:29 Checkable deposits: Federal govt. -2.7 2.6 -7.4 9.0 18.7 16.3 3.0 -2.1 -29.8 10.1 18.5 2930 Other -3.9 -3.1 -0.8 1.7 1.0 1.4 1.9 2.4 3.8 3.9 5.1 3031 Trade credit -29.2 -51.3 42.9 -34.0 -71.8 -36.5 -51.9 24.3 2.0 32.3 -10.7 31
Totals identified to sectors32 as assets 3360.7 4392.3 4740.8 4378.9 4377.5 4485.3 4749.6 3903.1 3942.5 4099.7 4741.5 32

12 Z.1, December 7, 2001
F.6 Distribution of Gross Domestic Product (1)Billions of dollars; quarterly figures are seasonally adjusted annual rates
1997 1998 1999 2000 2000 2001 Q1 Q2 Q3 Q4 Q1 Q2 Q3
1 Gross Domestic Product (GDP) 8318.4 8781.6 9268.6 9872.9 9668.6 9857.6 9937.5 10028.0 10141.6 10202.6 10229.7 1
2 Personal consumption expenditures (2) 5529.3 5856.0 6250.2 6728.4 6581.9 6674.9 6785.5 6871.4 6977.6 7044.6 7059.2 2
3 Durable goods 642.5 693.2 760.9 819.6 820.7 813.8 825.4 818.7 838.1 844.7 840.3 3 4 Nondurable goods 1641.6 1708.5 1831.3 1989.6 1942.5 1978.3 2012.4 2025.1 2047.1 2062.3 2057.3 4 5 Services 3245.2 3454.3 3657.9 3919.2 3818.7 3882.8 3947.7 4027.5 4092.4 4137.6 4161.6 5
6 Gross private domestic investment 1390.5 1538.8 1636.8 1767.5 1708.9 1792.3 1788.4 1780.3 1722.7 1669.9 1623.0 6
7 Fixed investment 1327.7 1465.6 1578.2 1718.1 1678.0 1717.0 1735.9 1741.6 1748.2 1706.4 1679.2 7
8 Nonresidential 999.4 1101.3 1174.6 1293.1 1250.9 1288.3 1314.9 1318.2 1311.2 1260.2 1228.5 8 9 Household sector (nonprofit organizations) 55.6 62.1 64.7 71.4 68.4 70.6 72.8 73.7 74.0 72.1 68.0 910 Nonfinancial corporate business 710.2 774.2 854.4 929.8 906.6 917.4 953.9 941.5 948.4 903.2 884.3 1011 Nonfarm noncorporate business 48.9 56.9 98.7 128.6 114.2 131.8 119.3 148.9 123.1 134.2 135.8 1112 Farm business 27.5 29.4 25.8 28.1 27.1 27.7 29.1 28.6 28.5 28.4 31.2 1213 Financial corporations 157.2 178.7 131.0 135.1 134.6 140.7 139.7 125.4 137.3 122.5 109.1 13
14 Residential 328.3 364.4 403.6 425.1 427.1 428.7 421.0 423.4 437.0 446.2 450.7 1415 Household sector 275.0 310.5 354.9 375.4 376.6 377.5 371.3 376.3 385.4 394.1 399.6 1516 Nonfinancial corporate business 2.7 2.7 3.0 3.2 3.2 3.2 3.2 3.2 3.3 3.8 3.8 1617 Nonfarm noncorporate business 39.3 39.7 44.0 46.4 46.6 46.8 45.9 46.2 47.7 48.6 49.1 1718 REITs 11.3 11.4 1.6 0.1 0.7 1.2 0.6 -2.3 0.6 -0.4 -1.8 18
19 Change in private inventories 62.9 73.1 58.6 49.4 30.9 75.3 52.5 38.7 -25.5 -36.5 -56.2 1920 Nonfinancial corporate business 57.0 68.6 57.1 48.6 35.5 70.3 52.5 35.9 -24.9 -33.5 -51.5 2021 Nonfarm noncorporate business 3.0 3.6 3.0 2.6 1.9 3.7 2.8 1.9 -1.3 -1.8 -2.7 2122 Farm business 2.9 0.9 -1.5 -1.8 -6.5 1.3 -2.8 0.9 0.7 -1.2 -2.0 22
23 Net U.S. exports of goods and services -89.4 -151.7 -250.9 -364.0 -333.9 -350.7 -380.7 -390.6 -363.8 -347.4 -292.2 23
24 Exports 966.4 964.9 989.8 1102.9 1059.7 1099.7 1131.1 1121.0 1117.4 1079.6 1023.7 2425 - Imports 1055.8 1116.7 1240.7 1466.9 1393.6 1450.4 1511.8 1511.6 1481.2 1427.0 1315.9 25
Government consumption expenditures and26 gross investment 1488.0 1538.5 1632.6 1741.0 1711.7 1741.1 1744.3 1766.9 1805.1 1835.5 1839.7 26
27 Consumption expenditures (3) 1223.3 1261.4 1327.9 1422.8 1390.6 1426.1 1430.2 1444.1 1474.2 1491.4 1504.2 2728 Federal 456.9 453.1 469.6 493.7 483.4 503.8 493.6 494.1 507.5 510.1 512.7 2829 State and local 766.5 808.3 858.3 929.0 907.2 922.3 936.6 950.0 966.7 981.3 991.5 29
30 Gross investment (3) 264.7 277.1 304.6 318.3 321.1 315.0 314.1 322.8 330.9 344.1 335.5 3031 Federal 81.4 86.1 94.5 96.5 95.1 97.2 93.5 100.1 97.8 99.9 101.8 3132 State and local 183.3 191.0 210.2 221.8 226.0 217.8 220.6 222.7 233.1 244.2 233.7 32
Memo:
33 Net U.S. income receipts from rest of the world 7.1 -3.5 -6.8 -12.1 -18.0 -16.6 -18.1 4.2 -10.5 -11.7 -7.0 3334 U.S. income receipts 281.3 286.1 313.8 384.2 360.1 387.9 386.6 402.1 378.9 346.9 322.2 3435 - U.S. income payments 274.3 289.6 320.6 396.3 378.1 404.5 404.7 397.9 389.4 358.6 329.2 35
Gross National Product (GNP) =36 GDP + net U.S. income receipts 8325.5 8778.1 9261.9 9860.8 9650.6 9841.0 9919.4 10032.2 10131.1 10190.9 10222.7 36
(1) This table corresponds to NIPA table 1.1 in the Survey of Current Business, Department of Commerce.(2) Component of personal outlays, found on table F.100, line 4.(3) Government inventory investment is included in consumption expenditures.

Z.1, December 7, 2001 13
F.7 Distribution of National Income (1)Billions of dollars; quarterly figures are seasonally adjusted annual rates
1997 1998 1999 2000 2000 2001 Q1 Q2 Q3 Q4 Q1 Q2 Q3
1 National Income 6618.5 7041.5 7462.3 7980.8 7783.8 7959.3 8046.4 8133.9 8169.7 8208.0 8189.3 1
2 Compensation of employees 4651.3 4989.8 5310.8 5715.2 5562.9 5669.8 5759.2 5869.0 5955.7 6010.9 6039.0 2 3 Wages and other labor income 4364.3 4683.5 4981.9 5371.3 5225.6 5328.0 5413.6 5518.1 5598.7 5652.1 5680.0 3 4 Employer social insurance contributions 290.0 307.0 323.7 343.9 337.3 341.8 345.6 350.9 357.0 358.8 359.0 4 5 Wage accruals less disbursements -2.9 -0.7 5.2 0.0 0.0 0.0 0.0 0.0 0.0 0.0 0.0 5
Proprietors’ income with inventory 6 valuation and capital consumption adjustments 581.2 623.8 672.0 715.0 697.5 717.9 719.2 725.2 735.2 745.3 753.0 6 7 Nonfarm 551.5 598.2 645.4 684.4 671.0 685.4 687.6 693.5 705.4 716.6 720.8 7 8 Farm 29.7 25.6 26.6 30.6 26.5 32.5 31.6 31.7 29.8 28.7 32.2 8 Rental income of persons (with capital 9 consumption adjustment) 128.4 138.6 147.7 141.6 144.9 141.4 138.3 141.7 139.6 139.0 143.6 9
Corporate profits with inventory10 valuation and capital consumption adjustments 833.8 777.4 825.3 876.4 857.6 896.0 894.4 857.4 789.8 759.8 696.7 10
Corporate profits with inventory11 valuation adjustment 800.9 739.4 773.6 833.0 808.4 850.5 854.0 819.0 753.8 729.5 683.4 11
12 Profits before tax 792.4 721.1 776.4 845.4 832.2 865.3 857.6 826.3 755.7 738.3 680.1 1213 Domestic nonfinancial 494.5 457.5 467.8 500.9 498.6 532.8 510.3 461.9 410.0 407.4 379.2 1314 Farm 1.6 2.8 3.0 3.3 3.1 3.2 3.3 3.4 3.5 3.6 3.6 1415 Foreign subsidiaries 110.7 102.3 114.6 136.8 120.4 128.9 141.0 156.7 140.0 144.0 142.9 1516 Financial 185.7 158.5 191.0 204.4 210.0 200.4 203.0 204.3 202.2 183.3 154.4 16
Less:17 Profits tax liability 237.2 238.9 253.0 271.5 277.0 280.4 274.9 253.5 236.8 228.0 206.0 1718 Domestic nonfinancial 157.9 154.1 170.4 186.0 190.0 196.6 189.7 167.7 152.0 150.7 139.6 1819 Farm 0.5 0.5 0.5 0.6 0.6 0.6 0.6 0.5 0.5 0.5 0.4 1920 Financial 78.9 84.3 82.1 84.9 86.4 83.2 84.6 85.3 84.3 76.8 66.0 20
Equals:21 Profits after tax 555.2 482.2 523.4 573.9 555.2 584.9 582.7 572.8 518.9 510.3 474.1 2122 Dividends 335.2 348.7 343.5 379.6 361.5 373.7 386.2 397.0 405.2 412.3 420.4 2223 Domestic nonfinancial 216.4 239.7 237.3 266.1 258.4 253.6 273.0 279.1 297.8 291.1 310.5 2324 Farm 1.7 2.5 2.6 2.9 2.8 2.9 3.0 3.1 3.1 3.2 3.2 2425 Foreign subsidiaries 51.4 39.5 39.2 37.7 30.1 47.7 35.1 37.7 22.0 37.6 21.1 2526 Financial 65.8 67.0 64.3 73.0 70.2 69.5 75.1 77.1 82.3 80.4 85.6 26
27 Undistributed profits 220.0 133.5 179.9 194.3 193.7 211.2 196.5 175.8 113.7 98.0 53.7 2728 Domestic nonfinancial 120.2 63.7 60.1 48.8 50.2 82.5 47.5 15.1 -39.8 -34.4 -70.8 2829 Farm -0.6 -0.2 -0.2 -0.2 -0.2 -0.2 -0.2 -0.2 -0.1 -0.1 -0.1 2930 Foreign subsidiaries 59.3 62.8 75.4 99.1 90.3 81.2 105.9 119.0 118.0 106.4 121.8 3031 Financial 41.0 7.3 44.6 46.6 53.4 47.7 43.3 41.9 35.6 26.1 2.8 31
32 Inventory valuation adjustment 8.5 18.4 -2.9 -12.4 -23.8 -14.8 -3.6 -7.3 -1.9 -8.8 3.3 32
33 Capital consumption adjustment 32.9 38.0 51.7 43.4 49.2 45.5 40.4 38.4 36.0 30.3 13.3 3334 Domestic nonfinancial 50.0 50.4 60.8 56.4 60.1 57.8 54.4 53.5 51.3 46.2 28.7 3435 Farm 1.1 1.5 1.7 1.8 1.8 1.8 1.9 1.9 1.9 2.0 2.0 3536 Financial -18.2 -13.9 -10.8 -14.9 -12.7 -14.1 -15.8 -17.0 -17.2 -17.9 -17.4 36
37 Net interest 423.9 511.9 506.5 532.7 520.9 534.1 535.3 540.6 549.4 553.0 557.0 37
Memo:
Calculation of Gross Domestic Product from National Income: (2)
38 National Income, from line 1 above 6618.5 7041.5 7462.3 7980.8 7783.8 7959.3 8046.4 8133.9 8169.7 8208.0 8189.3 38
Plus:39 Business transfer payments to persons 27.9 28.7 31.2 33.1 32.4 32.8 33.3 33.8 34.3 34.8 35.3 3940 Business transfer payments to rest of the world 8.9 9.3 10.2 10.9 10.9 11.2 10.7 10.6 10.0 9.7 9.3 4041 Indirect business tax and nontax accruals 646.2 681.3 713.1 762.7 749.4 758.3 767.6 775.6 785.7 792.4 794.7 4142 Private consumption of fixed capital 832.4 884.3 953.3 1029.9 998.6 1019.0 1041.2 1060.9 1081.3 1120.2 1177.0 4243 Government consumption of fixed capital 181.0 187.7 198.1 211.4 206.5 209.9 213.1 215.9 218.6 221.3 229.4 4344 Statistical discrepancy 29.7 -31.0 -72.9 -130.4 -93.5 -112.6 -155.6 -159.8 -120.7 -143.3 -140.5 44
Less: Subsidies less current surplus of45 government enterprises 19.1 23.6 33.3 37.6 37.5 36.9 37.3 38.7 47.8 52.2 71.8 4546 Net U.S. income receipts from rest of the world 7.1 -3.5 -6.8 -12.1 -18.0 -16.6 -18.1 4.2 -10.5 -11.7 -7.0 46
Equals:47 Gross Domestic Product 8318.4 8781.6 9268.6 9872.9 9668.6 9857.6 9937.5 10028.0 10141.6 10202.6 10229.7 47
(1) This table corresponds to NIPA table 1.14 in the Survey of Current Business, Department of Commerce.(2) The relationship of National Income to Gross Domestic Product is shown on NIPA table 1.9 in the Survey of Current Business, Department of Commerce.

14 Z.1, December 7, 2001
F.8 Gross Saving and Investment (1)Billions of dollars; quarterly figures are seasonally adjusted annual rates
1997 1998 1999 2000 2000 2001 Q1 Q2 Q3 Q4 Q1 Q2 Q3
1 Gross saving 1502.3 1647.2 1707.6 1785.6 1723.7 1802.5 1806.7 1809.5 1754.1 1750.6 1753.2 1
2 Gross private saving 1343.8 1375.0 1348.1 1322.9 1271.1 1349.0 1328.9 1342.5 1307.9 1321.2 1531.7 2
3 Personal saving 252.9 301.5 160.8 67.6 53.4 88.1 54.4 74.7 78.8 81.5 284.4 3
4 Undistributed corporate profits 220.0 133.5 179.9 194.3 193.7 211.2 196.5 175.8 113.7 98.0 53.7 4 5 Nonfinancial corp. inventory valuation adjustment 8.5 18.4 -2.9 -12.4 -23.8 -14.8 -3.6 -7.3 -1.9 -8.8 3.3 5 6 Corporate capital consumption adjustment 32.9 38.0 51.7 43.4 49.2 45.5 40.4 38.4 36.0 30.3 13.3 6 7 Private consumption of fixed capital 832.4 884.3 953.3 1029.9 998.6 1019.0 1041.2 1060.9 1081.3 1120.2 1177.0 7 8 Corporate 581.6 620.2 669.2 727.1 703.6 719.1 736.0 749.7 763.8 785.6 847.0 8 9 Noncorporate 250.9 264.2 284.1 302.9 295.0 299.9 305.2 311.3 317.5 334.6 329.9 910 Wage accruals less disbursements -2.9 -0.7 5.2 0.0 0.0 0.0 0.0 0.0 0.0 0.0 0.0 10
11 Gross government saving 158.6 272.3 359.5 462.7 452.6 453.5 477.8 467.0 446.2 429.4 221.5 11
12 Federal 33.4 132.0 210.9 314.9 307.7 304.8 326.9 320.3 303.7 286.2 89.7 1213 Consumption of fixed capital 86.8 88.2 91.7 96.4 94.9 95.9 97.0 97.9 98.4 99.4 99.9 1314 Current surplus or deficit (-), NIPA -53.4 43.8 119.2 218.5 212.8 208.9 229.9 222.4 205.3 186.8 -10.2 14
15 State and local 125.1 140.2 148.6 147.8 144.9 148.7 150.9 146.7 142.5 143.2 131.8 1516 Consumption of fixed capital 94.2 99.5 106.4 114.9 111.6 114.0 116.1 118.0 120.2 121.9 129.5 1617 Current surplus or deficit (-), NIPA 31.0 40.8 42.2 32.9 33.3 34.7 34.8 28.7 22.3 21.3 2.3 17
18 Gross investment 1532.1 1616.2 1634.7 1655.2 1630.2 1689.9 1651.1 1649.7 1633.4 1607.3 1612.7 18
19 Gross private domestic investment 1390.5 1538.8 1636.8 1767.5 1708.9 1792.3 1788.4 1780.3 1722.7 1669.9 1623.0 19
20 Fixed investment 1327.7 1465.6 1578.2 1718.1 1678.0 1717.0 1735.9 1741.6 1748.2 1706.4 1679.2 20
21 Nonresidential 999.4 1101.3 1174.6 1293.1 1250.9 1288.3 1314.9 1318.2 1311.2 1260.2 1228.5 2122 Residential 328.3 364.4 403.6 425.1 427.1 428.7 421.0 423.4 437.0 446.2 450.7 22
23 Change in private inventories 62.9 73.1 58.6 49.4 30.9 75.3 52.5 38.7 -25.5 -36.5 -56.2 23
24 Gross government investment 264.7 277.1 304.6 318.3 321.1 315.0 314.1 322.8 330.9 344.1 335.5 24
25 Net foreign investment in U.S. -123.1 -199.7 -306.7 -430.5 -399.8 -417.4 -451.4 -453.4 -420.2 -406.7 -345.8 25
26 Statistical discrepancy (line 18 less line 1) 29.7 -31.0 -72.9 -130.4 -93.5 -112.6 -155.6 -159.8 -120.7 -143.3 -140.5 26
(1) This table corresponds to NIPA table 5.1 in the Survey of Current Business, Department of Commerce.
F.9 Net Capital Transfers (1)Billions of dollars; quarterly figures are seasonally adjusted annual rates
1 Capital transfers received by government (net) 26.8 32.4 32.4 36.2 37.0 36.2 35.8 35.8 38.4 37.0 34.9 1
2 Federal -8.4 -3.6 -7.3 -7.9 -6.3 -7.7 -8.1 -9.7 -8.9 -12.7 -14.8 2
3 Estate and gift taxes paid by persons 20.6 25.2 28.8 28.1 29.1 28.2 27.7 27.6 30.1 28.7 26.5 3 4 - Capital transfers paid to the rest of the world (net) 0.2 0.0 4.2 0.0 0.0 0.0 0.1 0.0 0.0 0.0 0.0 4 5 - Federal investment grants to state and local govts. 28.8 28.8 31.9 36.0 35.3 35.9 35.7 37.3 38.9 41.3 41.3 5 6 - Investment grants to business 0.0 0.0 0.0 0.0 0.0 0.0 0.0 0.0 0.0 0.0 0.0 6
7 State and local 35.3 36.0 39.7 44.1 43.2 43.9 43.9 45.5 47.3 49.7 49.7 7
8 Estate and gift taxes paid by persons 6.5 7.2 7.8 8.1 7.9 8.0 8.1 8.2 8.3 8.3 8.4 8 9 + Federal investment grants to state and local govts. 28.8 28.8 31.9 36.0 35.3 35.9 35.7 37.3 38.9 41.3 41.3 9
10 Capital transfers received by the rest of the world (net) -0.4 -0.7 3.5 -0.7 -0.7 -0.7 -0.7 -0.7 -0.7 -0.7 -0.8 10
11 Capital transfers received from U.S. government (net) 0.2 0.0 4.2 0.0 0.0 0.0 0.1 0.0 0.0 0.0 0.0 1112 - Immigrants’ transfers received by persons (net) 0.6 0.7 0.7 0.7 0.7 0.7 0.7 0.7 0.7 0.8 0.8 12
(1) This table corresponds to NIPA table 8.29 in the Survey of Current Business, Department of Commerce.

Z.1, December 7, 2001 15
F.10 Derivation of Measures of Personal Saving (1)Billions of dollars; quarterly figures are seasonally adjusted annual rates
1997 1998 1999 2000 2000 2001 Q1 Q2 Q3 Q4 Q1 Q2 Q3
1 Net acquisition of financial assets 559.3 761.9 675.0 489.1 647.9 596.3 457.8 254.2 575.9 634.9 984.3 1
2 Foreign deposits 6.5 0.1 5.2 7.7 20.0 0.2 -2.6 13.3 -6.0 -16.0 -10.0 2 3 Checkable deposits and currency -11.3 5.5 -17.3 -17.9 71.0 -64.3 -61.1 -17.3 84.0 92.2 116.5 3 4 Time and savings deposits 142.6 202.7 109.5 309.2 336.8 348.4 340.2 211.6 346.8 272.4 206.4 4 5 Money market fund shares 83.5 174.5 134.5 141.3 211.1 80.8 73.5 200.0 281.0 -16.6 250.9 5
6 Securities -41.0 -37.0 23.2 -410.8 -556.0 -179.5 -330.1 -577.7 -439.7 -78.1 -170.3 6
7 Open market paper 1.5 7.5 4.0 5.0 5.0 5.0 5.0 5.0 -22.0 -18.0 -15.0 7 8 U.S. government securities -147.3 -153.9 78.0 -175.3 -294.8 -161.2 -113.3 -132.0 -507.2 10.0 28.9 8 9 Municipal securities 53.0 17.8 40.4 14.8 30.6 -4.4 32.6 0.1 92.7 0.4 -48.8 910 Corporate and foreign bonds 85.6 96.8 23.6 -25.6 -28.7 132.9 -114.9 -91.6 253.4 -147.0 -97.5 1011 Corporate equities (2) -293.4 -248.7 -264.4 -459.5 -554.9 -367.5 -410.6 -504.9 -324.0 -185.4 -199.9 1112 Mutual fund shares 259.6 243.4 141.7 229.8 286.8 215.6 271.1 145.6 67.4 261.9 162.0 12
13 Life insurance reserves 59.3 48.0 50.8 50.2 54.9 45.6 53.0 47.3 52.7 53.2 56.5 1314 Pension fund reserves 201.4 202.1 184.4 215.9 206.9 260.7 227.0 168.8 255.5 168.7 192.9 14
15 Investment in bank personal trusts -49.9 -41.8 -6.5 -29.7 -28.4 -33.1 -29.2 -28.0 -26.1 -22.7 -28.2 1516 Miscellaneous and other assets 168.1 207.9 191.2 223.1 331.6 137.4 187.0 236.3 27.7 181.8 369.4 16
17 Gross investment in tangible assets 1103.6 1212.3 1365.5 1486.3 1465.0 1489.2 1479.9 1511.2 1496.2 1519.2 1519.3 1718 Residential fixed investment 314.2 350.2 398.9 421.8 423.2 424.3 417.2 422.5 433.1 442.8 448.7 1819 Other fixed assets (3) 132.0 148.4 189.3 228.1 209.7 230.2 221.2 251.2 225.6 234.7 235.0 1920 Consumer durables 651.5 709.2 775.8 835.7 836.7 829.7 841.5 834.7 838.1 844.7 840.3 2021 Inventories (3) 5.9 4.5 1.5 0.8 -4.6 5.0 -0.0 2.8 -0.6 -3.0 -4.7 21
22 Consumption of fixed capital 756.9 791.1 856.0 922.6 895.5 913.1 932.3 949.7 967.6 1009.0 1030.9 2223 Residential fixed investment 140.1 146.1 151.5 163.2 158.4 161.5 164.9 167.9 171.1 179.3 188.9 2324 Other fixed assets (3) 129.8 138.6 157.4 168.3 163.9 166.6 169.7 172.8 175.8 182.1 178.6 2425 Consumer durables 487.0 506.4 547.2 591.2 573.2 584.9 597.6 608.9 620.7 647.7 663.5 25
26 Net investment in tangible assets (4) 346.7 421.2 509.4 563.7 569.5 576.1 547.7 561.5 528.6 510.1 488.4 26
27 Residential fixed investment 174.1 204.1 247.4 258.6 264.8 262.8 252.3 254.5 262.1 263.5 259.8 2728 Other fixed assets (3) 2.2 9.8 31.9 59.8 45.8 63.6 51.5 78.4 49.7 52.6 56.5 2829 Consumer durables 164.5 202.8 228.6 244.5 263.5 244.8 243.9 225.8 217.4 197.0 176.8 2930 Inventories (3) 5.9 4.5 1.5 0.8 -4.6 5.0 -0.0 2.8 -0.6 -3.0 -4.7 30
31 Net increase in liabilities 575.8 752.7 845.5 801.6 995.9 853.4 769.6 587.4 571.9 875.0 1001.3 31
32 Mortgage debt on nonfarm homes 258.1 388.5 433.1 420.5 359.9 488.1 439.3 394.7 430.8 620.3 543.2 3233 Other mortgage debt (3) 31.8 86.5 102.3 88.3 76.2 113.3 80.6 83.3 81.5 130.1 111.2 3334 Consumer credit 57.5 75.0 99.5 139.0 149.9 142.1 128.2 135.6 159.9 73.6 21.3 3435 Policy loans 3.2 0.1 -5.1 2.8 -1.3 3.6 5.8 3.2 4.0 0.6 4.3 3536 Security credit 36.8 21.6 75.2 7.2 234.2 -64.9 14.6 -155.0 -166.5 9.7 228.2 3637 Other liabilities (3) 188.4 181.0 140.5 143.7 177.1 171.1 101.2 125.5 62.2 40.6 93.1 37
38 Net capital transfers (5) -26.4 -31.7 -35.9 -35.5 -36.3 -35.4 -35.1 -35.1 -37.6 -36.2 -34.1 38
39 Personal saving, with consumer durables (FOF) 356.6 462.1 374.8 286.6 257.8 354.5 270.9 263.4 570.3 306.3 505.5 39
40 Less net investment in consumer durables 164.5 202.8 228.6 244.5 263.5 244.8 243.9 225.8 217.4 197.0 176.8 40
41 = Personal saving, without consumer durables (FOF) (6) 192.1 259.3 146.2 42.1 -5.8 109.7 27.0 37.6 352.8 109.3 328.7 41
42 Personal saving (NIPA, excludes consumer durables) 252.9 301.5 160.8 67.6 53.4 88.1 54.4 74.7 78.8 81.5 284.4 42
43 Difference -60.8 -42.2 -14.7 -25.5 -59.2 21.6 -27.4 -37.1 274.0 27.8 44.3 43
Memo:44 Disposable personal income 5968.2 6355.6 6618.0 7031.0 6859.1 6993.7 7081.3 7189.8 7295.0 7363.2 7577.0 44
Personal saving as a percentage of disposable personal income:45 With consumer durables (FOF) (line 39) 6.0 7.3 5.7 4.1 3.8 5.1 3.8 3.7 7.8 4.2 6.7 4546 Without consumer durables (FOF) (line 41) 3.2 4.1 2.2 0.6 -0.1 1.6 0.4 0.5 4.8 1.5 4.3 4647 Without consumer durables (NIPA) (line 42) 4.2 4.7 2.4 1.0 0.8 1.3 0.8 1.0 1.1 1.1 3.8 4748 Difference (line 43) -1.0 -0.7 -0.2 -0.4 -0.9 0.3 -0.4 -0.5 3.8 0.4 0.6 48
(1) Consolidated statement for household sector, nonfarm noncorporate business, and farm business.(2) Directly held and those in closed-end and exchange-traded funds. Other equities are included in mutual funds (line 12), life insurance and pension reserves (lines 13 and 14), and bank personal trusts (line 15).(3) Includes corporate farms.(4) Line 17 less line 22.(5) Table F.9, line 12 less lines 3 and 8.(6) Line 41 and 42 are conceptually equivalent but measure saving using different data. Line 41 is net acquisition of financial assets (line 1) plus net investment in tangible assets net of consumer durables (line 26 less line 40) less net increase in liabilities (line 31) less net capital transfers (line 38). Line 42 is disposable personal income (line 44) less personal outlays (table F.100, line 4).

16 Z.1, December 7, 2001
F.100 Households and Nonprofit Organizations (1)Billions of dollars; quarterly figures are seasonally adjusted annual rates
1997 1998 1999 2000 2000 2001 Q1 Q2 Q3 Q4 Q1 Q2 Q3
1 Personal income 6937.0 7426.0 7777.3 8319.1 8104.4 8271.0 8381.5 8519.6 8640.2 8714.6 8772.5 1 2 - Personal taxes and nontax payments 968.8 1070.5 1159.3 1288.2 1245.3 1277.3 1300.2 1329.8 1345.2 1351.4 1195.5 2 3 = Disposable personal income 5968.2 6355.6 6618.0 7031.0 6859.1 6993.7 7081.3 7189.8 7295.0 7363.2 7577.0 3 4 - Personal outlays 5715.3 6054.1 6457.2 6963.3 6805.7 6905.6 7026.9 7115.1 7216.2 7281.7 7292.6 4 5 = Personal saving, NIPA (2) 252.9 301.5 160.8 67.6 53.4 88.1 54.4 74.7 78.8 81.5 284.4 5
6 + Government insurance and pension reserves (3) 3.4 4.4 3.8 1.8 0.3 2.7 0.8 3.3 2.8 6.9 0.1 6 7 + Net investment in consumer durables 164.5 202.8 228.6 244.5 263.5 244.8 243.9 225.8 217.4 197.0 176.8 7 8 + Consumption of fixed capital 615.4 642.8 694.7 750.5 727.7 742.6 758.7 773.1 787.9 822.1 843.2 8 9 + Net capital transfers (4) -26.4 -31.7 -35.9 -35.5 -36.3 -35.4 -35.1 -35.1 -37.6 -36.2 -34.1 9
10 = Gross saving and net capital transfers 1009.8 1119.9 1052.1 1028.9 1008.6 1042.7 1022.7 1041.7 1049.4 1071.2 1270.3 10
11 Gross investment 945.0 1071.9 1032.1 1000.1 947.6 1060.1 992.9 999.7 1318.8 1090.3 1312.6 11
12 Capital expenditures 982.0 1081.7 1195.4 1282.5 1281.7 1277.9 1285.6 1284.7 1297.5 1310.9 1307.9 1213 Residential 275.0 310.5 354.9 375.4 376.6 377.5 371.3 376.3 385.4 394.1 399.6 1314 Consumer durable goods 651.5 709.2 775.8 835.7 836.7 829.7 841.5 834.7 838.1 844.7 840.3 1415 Nonprofit nonresidential 55.6 62.1 64.7 71.4 68.4 70.6 72.8 73.7 74.0 72.1 68.0 15
16 Net financial investment -37.0 -9.8 -163.3 -282.4 -334.1 -217.8 -292.7 -285.0 21.3 -220.6 4.7 16
17 Net acquisition of financial assets 341.7 486.3 437.1 285.7 431.2 349.3 281.3 81.1 412.8 464.0 857.8 17
18 Foreign deposits 6.5 0.1 5.2 7.7 20.0 0.2 -2.6 13.3 -6.0 -16.0 -10.0 1819 Checkable deposits and currency -33.7 -28.6 -41.5 -42.3 46.9 -106.9 -76.5 -32.5 64.5 71.8 98.1 1920 Time and savings deposits 131.9 193.6 99.5 305.2 332.8 340.7 339.1 208.4 341.8 267.0 200.9 2021 Money market fund shares 79.9 164.9 124.5 131.3 209.1 80.1 57.8 178.3 253.0 -44.6 242.2 21
22 Credit market instruments -11.8 -37.1 148.6 -170.0 -274.4 -10.4 -183.3 -212.1 -172.5 -140.5 -118.5 22
23 Open market paper 1.5 7.5 4.0 5.0 5.0 5.0 5.0 5.0 -22.0 -18.0 -15.0 2324 U.S. government securities -151.4 -160.1 81.1 -165.1 -284.6 -146.2 -106.8 -122.9 -496.2 21.0 42.3 2425 Treasury -162.4 -85.2 -1.3 -153.7 -226.8 -221.5 -134.8 -31.5 -73.8 -109.9 81.3 2526 Savings bonds -0.5 0.1 -0.2 -1.7 -3.5 -2.1 -0.9 -0.3 1.4 3.3 3.9 2627 Other -161.9 -85.4 -1.2 -152.0 -223.3 -219.5 -133.9 -31.3 -75.2 -113.2 77.3 2728 Agency 11.0 -74.8 82.4 -11.4 -57.8 75.3 28.1 -91.3 -422.5 131.0 -39.0 2829 Municipal securities 52.5 17.8 40.2 14.6 30.4 -4.6 32.4 -0.1 92.5 0.2 -49.0 2930 Corporate and foreign bonds 85.6 96.8 23.6 -25.6 -28.7 132.9 -114.9 -91.6 253.4 -147.0 -97.5 3031 Mortgages 0.1 0.9 -0.3 1.1 3.5 2.4 1.0 -2.5 -0.1 3.3 0.7 31
32 Corporate equities (5) -293.4 -248.7 -264.4 -459.5 -554.9 -367.5 -410.6 -504.9 -324.0 -185.4 -199.9 3233 Mutual fund shares 259.6 243.4 141.7 229.8 286.8 215.6 271.1 145.6 67.4 261.9 162.0 3334 Security credit 52.6 61.2 47.2 88.6 189.4 -47.1 53.9 158.0 -48.2 49.9 285.6 3435 Life insurance reserves 59.3 48.0 50.8 50.2 54.9 45.6 53.0 47.3 52.7 53.2 56.5 3536 Pension fund reserves 201.4 202.1 184.4 215.9 206.9 260.7 227.0 168.8 255.5 168.7 192.9 3637 Investment in bank personal trusts -49.9 -41.8 -6.5 -29.7 -28.4 -33.1 -29.2 -28.0 -26.1 -22.7 -28.2 3738 Equity in noncorporate business -70.9 -80.6 -64.8 -46.2 -63.4 -45.0 -26.7 -49.7 -48.5 -25.1 -60.2 3839 Miscellaneous assets 10.3 9.7 12.4 4.7 5.5 16.3 8.4 -11.5 3.2 25.8 36.3 39
40 Net increase in liabilities 378.7 496.1 600.4 568.1 765.3 567.1 574.0 366.1 391.5 684.7 853.1 40
41 Credit market instruments 332.7 467.2 517.1 554.9 526.9 624.3 554.5 514.0 554.4 671.2 616.2 41
42 Home mortgages (6) 240.4 351.4 389.5 382.6 327.5 444.6 397.9 360.3 387.8 581.0 502.3 4243 Consumer credit 57.5 75.0 99.5 139.0 149.9 142.1 128.2 135.6 159.9 73.6 21.3 4344 Municipal securities 10.0 12.0 10.4 5.8 3.3 10.2 4.9 4.6 4.9 0.9 12.0 4445 Bank loans n.e.c. 8.0 6.2 -7.3 8.2 34.1 -2.6 4.1 -2.9 -17.3 -28.1 48.3 4546 Other loans and advances 18.1 13.3 14.6 16.4 15.8 18.6 14.3 16.8 19.3 19.1 19.8 4647 Commercial mortgages -1.2 9.4 10.5 3.1 -3.6 11.4 5.1 -0.5 -0.2 24.9 12.5 47
48 Security credit 36.8 21.6 75.2 7.2 234.2 -64.9 14.6 -155.0 -166.5 9.7 228.2 4849 Trade payables 8.9 8.7 6.0 5.9 7.1 7.0 5.6 3.9 6.9 4.7 6.7 49 Deferred and unpaid50 life insurance premiums 0.3 -1.4 2.1 0.1 -2.9 0.8 -0.6 3.2 -3.3 -1.0 2.0 50
51 Discrepancy 64.8 48.0 20.0 28.9 61.0 -17.4 29.8 42.0 -269.4 -19.0 -42.2 51
(1) Sector includes farm households. Supplementary tables (tables F.100.a and L.100.a) show estimates of annual flows and year-end outstandings of nonprofit organizations.(2) See table F.10 for derivation of alternative measures of personal saving.(3) Railroad Retirement Board and federal government life insurance reserves.(4) Table F.9, line 12 less lines 3 and 8.(5) Directly held and those in closed-end and exchange-traded funds. Other equities are included in mutual funds (line 33), life insurance and pension reserves (lines 35 and 36), and bank personal trusts (line 37).(6) Includes loans made under home equity lines of credit and home equity loans secured by junior liens, shown on table F.218, line 24.

Z.1, December 7, 2001 17
F.101 Nonfinancial Business (1)Billions of dollars; quarterly figures are seasonally adjusted annual rates
1997 1998 1999 2000 2000 2001 Q1 Q2 Q3 Q4 Q1 Q2 Q3
1 Income before taxes 1134.1 1140.7 1200.7 1274.2 1255.9 1309.0 1286.5 1245.5 1202.8 1209.0 1193.3 1
2 Gross saving and net capital transfers 869.6 864.0 912.8 968.1 929.8 974.8 988.8 979.0 941.5 950.1 969.9 2
3 Gross investment 909.6 953.2 1010.6 1059.4 1014.7 1069.8 1082.3 1070.9 1018.8 988.4 1017.2 3
4 Capital expenditures 900.2 980.2 1086.3 1186.1 1128.6 1203.4 1204.6 1207.6 1125.7 1082.0 1048.4 4
5 Fixed investment 828.6 903.0 1026.0 1136.1 1097.7 1126.9 1151.5 1168.4 1150.9 1118.2 1104.3 5 6 Residential 42.0 42.5 47.1 49.6 49.8 50.0 49.1 49.4 51.0 52.4 53.0 6 7 Nonresidential 786.6 860.5 979.0 1086.6 1047.9 1076.9 1102.4 1119.0 1099.9 1065.8 1051.3 7
8 Change in inventories 62.9 73.1 58.6 49.4 30.9 75.3 52.5 38.7 -25.5 -36.5 -56.2 8 9 Access rights from federal government 8.8 4.1 1.7 0.6 0.0 1.2 0.7 0.5 0.3 0.3 0.3 9
10 Net financial investment 9.4 -27.1 -75.7 -126.6 -113.9 -133.6 -122.3 -136.7 -106.9 -93.6 -31.2 10
11 Net acquisition of financial assets 404.2 758.3 825.2 751.3 870.0 839.2 791.5 504.5 333.6 124.1 216.0 11
12 Foreign deposits -5.1 7.4 -2.3 -5.4 -24.0 17.2 54.0 -68.7 -27.1 0.9 -0.1 1213 Checkable deposits and currency 30.0 69.2 59.0 49.1 23.4 93.4 106.4 -26.8 -58.3 -79.9 -35.9 1314 Time and savings deposits 30.4 2.3 26.2 9.1 -43.8 -5.2 13.7 71.5 -32.0 -19.0 -0.0 1415 Money market fund shares 23.9 36.1 33.1 50.4 9.9 3.6 79.0 109.1 158.2 140.6 40.1 1516 Security RPs 0.7 -0.4 1.1 -0.5 3.1 -7.7 -0.9 3.3 -6.0 2.4 -5.6 16
17 Credit market instruments -9.7 2.2 4.3 8.2 54.7 60.8 -55.4 -27.2 -0.7 11.4 -29.9 17
18 Commercial paper 4.6 3.3 4.3 0.3 -6.1 0.8 7.6 -1.1 11.5 14.0 -13.5 1819 U.S. government securities -36.6 5.5 -5.2 -8.3 8.1 4.7 -4.0 -41.9 -11.5 -8.7 12.5 1920 Municipal securities -3.1 -1.5 -3.2 10.9 6.5 48.1 -32.9 22.0 -36.5 30.9 13.5 2021 Mortgages 24.3 -1.1 3.0 2.9 2.9 10.2 -2.7 1.2 1.0 0.6 1.9 2122 Consumer credit 1.2 -4.1 5.4 2.4 43.3 -3.1 -23.5 -7.3 34.8 -25.4 -44.3 22
23 Mutual fund shares -8.2 7.3 -1.8 -1.8 -1.8 -1.8 -1.8 -1.8 -1.8 -1.8 -1.8 2324 Trade receivables 128.6 127.0 159.2 150.4 226.7 195.4 133.0 46.4 -74.3 -176.3 -109.7 2425 Miscellaneous assets 213.6 507.1 546.5 491.9 621.8 483.5 463.5 398.7 375.6 245.8 359.1 25
26 Net increase in liabilities 394.8 785.4 901.0 877.9 984.0 972.8 913.8 641.2 440.4 217.7 247.2 26
27 Credit market instruments 393.6 554.0 601.6 587.2 628.5 744.4 440.0 535.8 352.6 494.7 360.6 27
28 Commercial paper 13.7 24.4 37.4 48.1 29.8 110.4 56.1 -4.0 -207.2 -141.5 -74.1 2829 Municipal securities 4.2 5.8 5.1 1.4 2.2 0.1 1.0 2.1 2.3 3.3 1.1 2930 Corporate bonds 150.5 218.7 229.9 171.1 186.2 153.8 168.8 175.6 400.9 428.0 187.7 30
31 Bank loans n.e.c. 98.4 102.0 90.0 94.9 105.4 169.2 42.9 62.2 11.4 -125.1 -58.2 3132 Other loans and advances 42.6 67.6 42.9 86.2 125.9 107.2 3.6 108.0 -31.8 98.2 58.4 3233 Mortgages 84.2 135.6 196.4 185.5 179.0 203.6 167.7 191.9 177.0 231.8 245.8 33
34 Corporate equities -114.4 -267.0 -143.5 -150.6 61.2 -245.2 -67.6 -350.8 -25.6 -72.6 -118.5 3435 Trade payables 97.5 81.5 170.3 124.9 140.7 148.1 132.0 78.6 -28.5 -121.6 -116.8 3536 Taxes payable 16.6 15.6 15.3 14.4 25.0 22.2 -5.6 16.0 -0.1 8.7 105.5 3637 Miscellaneous liabilities 87.3 488.6 335.1 376.8 222.0 364.8 489.1 431.5 189.7 -33.9 55.6 37
38 Proprietors’ net investment -85.8 -87.2 -77.9 -74.7 -93.4 -61.5 -74.0 -69.8 -47.7 -57.6 -39.4 38
39 Discrepancy -40.0 -89.2 -97.8 -91.3 -84.9 -95.0 -93.6 -91.9 -77.3 -38.3 -47.3 39
(1) Combined statement for nonfarm nonfinancial corporate business, nonfarm noncorporate business, and farm business.

18 Z.1, December 7, 2001
F.102 Nonfarm Nonfinancial Corporate BusinessBillions of dollars; quarterly figures are seasonally adjusted annual rates
1997 1998 1999 2000 2000 2001 Q1 Q2 Q3 Q4 Q1 Q2 Q3
1 Profits before tax (book) 494.5 457.5 467.8 500.9 498.6 532.8 510.3 461.9 410.0 407.4 379.2 1 2 - Profit tax accruals 157.9 154.1 170.4 186.0 190.0 196.6 189.7 167.7 152.0 150.7 139.6 2 3 - Dividends 216.4 239.7 237.3 266.1 258.4 253.6 273.0 279.1 297.8 291.1 310.5 3 4 + Consumption of fixed capital 539.7 569.6 617.3 658.8 643.7 653.8 663.8 673.8 683.8 698.0 725.9 4 5 = U.S. internal funds, book 659.9 633.3 677.4 707.6 693.9 736.3 711.3 689.0 644.0 663.6 655.1 5 6 + Foreign earnings retained abroad 59.3 62.8 75.4 99.1 90.3 81.2 105.9 119.0 118.0 106.4 121.8 6 7 + Inventory valuation adjustment (IVA) 8.5 18.4 -2.9 -12.4 -23.8 -14.8 -3.6 -7.3 -1.9 -8.8 3.3 7 8 + Net capital transfers (1) 0.0 0.0 0.0 0.0 0.0 0.0 0.0 0.0 0.0 0.0 0.0 8 9 = Total internal funds + IVA 727.6 714.4 750.0 794.4 760.4 802.7 813.6 800.7 760.1 761.2 780.2 9
10 Gross investment 767.6 803.6 847.8 885.7 845.3 897.7 907.2 892.6 837.4 799.5 827.5 10
11 Capital expenditures 778.6 849.6 916.2 982.2 945.3 992.1 1010.3 981.1 927.1 873.7 837.0 1112 Fixed investment (2) 712.9 776.9 857.5 933.0 909.8 920.6 957.1 944.7 951.7 907.0 888.1 1213 Inventory change + IVA 57.0 68.6 57.1 48.6 35.5 70.3 52.5 35.9 -24.9 -33.5 -51.5 1314 Access rights from federal government 8.8 4.1 1.7 0.6 0.0 1.2 0.7 0.5 0.3 0.3 0.3 14
15 Net financial investment -11.1 -46.1 -68.5 -96.5 -100.0 -94.3 -103.1 -88.5 -89.6 -74.2 -9.5 15
16 Net acquisition of financial assets 272.4 569.9 665.2 622.7 746.7 653.7 689.1 401.2 218.1 10.8 128.8 16
17 Foreign deposits -5.1 7.4 -2.3 -5.4 -24.0 17.2 54.0 -68.7 -27.1 0.9 -0.1 1718 Checkable deposits and currency 7.6 35.2 34.8 24.7 -0.8 50.8 90.9 -42.0 -77.8 -100.2 -54.3 1819 Time and savings deposits 19.7 -6.8 16.2 5.1 -47.8 -12.9 12.6 68.4 -37.0 -24.4 -5.5 1920 Money market fund shares 20.2 26.5 23.1 40.4 7.9 2.9 63.4 87.4 130.2 112.6 31.3 2021 Security RPs 0.7 -0.4 1.1 -0.5 3.1 -7.7 -0.9 3.3 -6.0 2.4 -5.6 21
22 Commercial paper 4.6 3.3 4.3 0.3 -6.1 0.8 7.6 -1.1 11.5 14.0 -13.5 2223 U.S. government securities -40.8 -0.6 -2.1 1.9 18.3 19.7 2.5 -32.9 -0.5 2.3 25.9 2324 Municipal securities -3.6 -1.6 -3.4 10.7 6.3 47.9 -33.1 21.8 -36.7 30.7 13.3 2425 Mortgages 25.9 -13.0 -7.0 -5.0 -5.0 -5.0 -5.0 -5.0 -5.0 -5.0 -5.0 2526 Consumer credit 1.2 -4.1 5.4 2.4 43.3 -3.1 -23.5 -7.3 34.8 -25.4 -44.3 2627 Trade receivables 93.5 86.3 113.4 109.6 185.9 117.1 116.0 19.3 -94.3 -190.3 -122.9 2728 Mutual fund shares -8.2 7.3 -1.8 -1.8 -1.8 -1.8 -1.8 -1.8 -1.8 -1.8 -1.8 28
29 Miscellaneous assets 156.8 430.3 483.6 440.3 567.3 427.7 406.4 359.9 327.9 195.1 311.5 2930 U.S. direct investment abroad (3) 84.3 129.1 136.2 122.0 128.5 95.2 117.9 146.2 138.5 121.9 83.3 3031 Insurance receivables 1.9 1.7 1.0 -0.3 1.5 5.7 2.9 -11.4 3.3 10.6 36.4 3132 Equity in GSEs -1.1 -0.7 -0.6 0.0 -0.1 -1.5 0.3 1.2 -1.3 1.7 -0.4 3233 Investment in finance co. subs. -3.7 -6.4 26.8 7.4 38.7 -24.2 9.8 5.1 -10.8 -7.6 -5.2 3334 Other 75.4 306.7 320.2 311.3 398.6 352.5 275.4 218.8 198.2 68.5 197.4 34
35 Net increase in liabilities 283.5 616.0 733.7 719.2 846.7 748.0 792.3 489.7 307.8 85.0 138.3 35
36 Net funds raised in markets 178.3 139.3 297.3 280.0 540.9 305.0 236.1 38.0 199.6 281.7 130.4 3637 Net new equity issues -114.4 -267.0 -143.5 -150.6 61.2 -245.2 -67.6 -350.8 -25.6 -72.6 -118.5 3738 Credit market instruments 292.7 406.3 440.8 430.6 479.7 550.2 303.7 388.8 225.2 354.3 248.9 3839 Commercial paper 13.7 24.4 37.4 48.1 29.8 110.4 56.1 -4.0 -207.2 -141.5 -74.1 3940 Municipal securities (4) 4.2 5.8 5.1 1.4 2.2 0.1 1.0 2.1 2.3 3.3 1.1 4041 Corporate bonds (3) 150.5 218.7 229.9 171.1 186.2 153.8 168.8 175.6 400.9 428.0 187.7 4142 Bank loans n.e.c. 51.1 81.8 73.0 74.3 84.9 134.5 36.3 41.5 8.5 -102.6 -39.6 42
43 Other loans and advances 39.8 54.3 34.5 73.4 109.8 93.2 -9.2 100.0 -31.5 79.9 67.7 4344 Savings institutions 1.6 2.7 3.2 4.3 5.6 3.9 5.0 2.8 4.1 4.8 -0.3 4445 Finance companies -0.5 33.1 48.8 57.0 88.3 75.6 43.4 20.7 -10.1 89.1 -68.8 4546 U.S. government -0.3 -0.1 -0.3 -0.4 -0.6 -0.4 -0.7 -0.0 0.3 -1.2 1.4 4647 Acceptance liabilities to banks -2.6 -4.3 -2.2 -0.0 2.8 -0.6 -3.2 0.8 9.9 -3.7 -8.3 4748 Rest of the world 17.3 -1.0 -22.7 -2.2 -17.6 16.9 -40.6 32.4 -32.4 16.2 80.1 4849 ABS issuers 24.4 23.8 7.7 14.7 31.3 -2.3 -13.2 43.2 -3.2 -25.3 63.6 4950 Mortgages 33.4 21.4 61.0 62.3 66.9 58.1 50.8 73.6 52.3 87.2 106.2 50
51 Trade payables 65.1 57.6 144.4 101.6 113.7 113.3 118.5 60.8 -42.8 -132.7 -123.8 5152 Taxes payable 9.3 4.8 7.0 6.9 16.3 11.1 -10.4 10.6 -4.1 5.5 103.0 5253 Miscellaneous liabilities 30.8 414.2 285.1 330.7 175.9 318.7 448.0 380.4 155.0 -69.5 28.6 5354 Foreign direct investment in U.S. 100.2 143.6 261.8 178.6 8.8 358.0 239.0 108.4 119.8 115.3 43.9 5455 Pension fund contributions payable 7.1 1.9 1.0 1.0 1.0 1.0 1.0 1.0 1.0 1.0 1.0 5556 Other -76.5 268.7 22.2 151.1 166.0 -40.4 208.0 270.9 34.2 -185.8 -16.3 56
57 Discrepancy -40.0 -89.2 -97.8 -91.3 -84.9 -95.0 -93.6 -91.9 -77.3 -38.3 -47.3 57
Memo:58 Financing gap (5) 110.3 198.0 241.7 286.9 275.2 270.5 302.6 299.5 284.9 218.9 178.6 58
(1) Table F.9, line 6.(2) Nonresidential fixed investment plus residential fixed investment, shown in table F.6, lines 10 and 16 respectively.(3) Through 1992:Q4, corporate bonds include net issues by Netherlands Antillean financial subsidiaries, and U.S. direct investment abroad excludes net inflows from those bond issues.(4) Industrial revenue bonds. Issued by state and local governments to finance private investment and secured in interest and principal by the industrial user of the funds.(5) Capital expenditures (line 11) less the sum of U.S. internal funds (line 5) and inventory valuation adjustment (line 7).

Z.1, December 7, 2001 19
F.103 Nonfarm Noncorporate BusinessBillions of dollars; quarterly figures are seasonally adjusted annual rates
1997 1998 1999 2000 2000 2001 Q1 Q2 Q3 Q4 Q1 Q2 Q3
1 Net income with IVA and CCAdj 609.9 657.6 706.3 742.7 730.7 743.7 744.6 751.9 763.0 772.9 781.9 1 2 Gross saving = capital consumption 118.5 124.4 136.0 144.7 141.2 143.4 145.8 148.4 150.8 157.4 157.7 2
3 Gross investment 118.5 124.4 136.0 144.7 141.2 143.4 145.8 148.4 150.8 157.4 157.7 3
4 Capital expenditures 91.1 100.3 145.8 177.5 162.7 182.3 168.0 197.0 169.5 181.1 182.2 4 5 Fixed investment (1) 88.1 96.7 142.8 174.9 160.8 178.6 165.2 195.1 170.8 182.9 184.9 5 6 Change in inventories 3.0 3.6 3.0 2.6 1.9 3.7 2.8 1.9 -1.3 -1.8 -2.7 6
7 Net financial investment 27.4 24.1 -9.8 -32.8 -21.5 -38.9 -22.2 -48.6 -18.7 -23.7 -24.5 7
8 Net acquisition of financial assets 131.1 186.0 160.6 129.3 124.1 184.8 102.0 106.5 115.3 110.9 84.9 8
9 Checkable deposits and currency 22.2 32.1 25.0 25.0 25.0 43.4 15.9 15.7 20.0 20.8 18.9 910 Time and savings deposits 10.7 9.1 10.0 4.0 4.0 7.7 1.2 3.1 5.0 5.4 5.5 1011 Money market mutual funds 3.7 9.7 10.0 10.0 2.0 0.7 15.7 21.6 28.0 28.0 8.8 1112 Treasury securities 4.1 6.1 -3.1 -10.2 -10.2 -15.0 -6.5 -9.1 -11.0 -11.0 -13.4 1213 Municipal securities 0.5 0.1 0.2 0.2 0.2 0.2 0.2 0.2 0.2 0.2 0.2 1314 Mortgages -1.6 11.9 10.0 7.9 7.9 15.2 2.3 6.2 6.0 5.6 6.9 1415 Consumer credit 0.0 0.0 0.0 0.0 0.0 0.0 0.0 0.0 0.0 0.0 0.0 1516 Trade receivables 35.1 40.7 45.8 40.8 40.8 78.3 17.0 27.1 20.0 14.0 13.2 1617 Miscellaneous assets 56.4 76.3 62.7 51.6 54.4 54.2 56.3 41.6 47.1 47.9 44.8 1718 Insurance receivables 0.5 0.4 0.2 -0.1 0.4 1.4 0.7 -2.7 0.8 2.6 6.8 1819 Equity investment in GSEs (2) 0.0 -0.1 0.0 -0.0 0.4 -0.3 -0.1 0.1 -0.1 -0.3 -0.1 1920 Other 55.9 75.9 62.4 51.7 53.7 53.2 55.7 44.2 46.4 45.7 38.1 20
21 Net increase in liabilities 103.7 161.8 170.4 162.1 145.6 223.7 124.2 155.0 134.0 134.6 109.4 21
22 Credit market instruments 94.7 139.7 155.4 145.7 135.0 184.5 129.1 134.2 121.3 130.6 108.6 2223 Bank loans n.e.c. 43.8 18.9 17.9 17.9 18.3 33.4 7.3 12.5 0.7 -20.2 -14.5 2324 Other loans and advances 3.3 13.0 7.8 11.1 11.9 15.7 11.4 5.5 0.1 18.6 -10.0 2425 Mortgages 47.7 107.7 129.7 116.7 104.8 135.4 110.4 116.2 120.5 132.2 133.1 2526 Trade payables 31.0 23.1 25.5 22.4 26.0 33.2 14.3 16.1 12.8 11.2 9.6 2627 Taxes payable 7.3 10.7 8.3 7.5 8.7 11.1 4.8 5.4 4.0 3.2 2.5 2728 Miscellaneous liabilities 56.5 74.3 50.1 46.1 46.1 46.2 41.1 51.1 34.7 35.6 27.0 2829 Proprietors’ net investment -85.8 -86.0 -68.8 -59.6 -70.2 -51.2 -65.1 -51.8 -38.9 -46.0 -38.3 29
(1) Nonresidential fixed investment plus residential fixed investment, shown in table F.6, lines 11 and 17 respectively.(2) Equity in the Farm Credit System.
F.104 Farm Business (1)Billions of dollars; quarterly figures are seasonally adjusted annual rates
1 Proprietors’ net income with IVA and CCAdj 29.7 25.6 26.6 30.6 26.5 32.5 31.6 31.7 29.8 28.7 32.2 1 2 Net saving (corporate) 0.6 1.3 1.5 1.6 1.5 1.6 1.6 1.7 1.8 1.9 2.0 2 3 Consumption of fixed capital 23.0 23.9 25.4 27.4 26.6 27.1 27.7 28.2 28.8 29.6 30.1 3 4 Corporate 3.3 3.9 4.2 4.5 4.4 4.5 4.6 4.7 4.8 4.9 5.0 4 5 Noncorporate 19.7 19.9 21.2 22.9 22.2 22.6 23.1 23.6 24.0 24.7 25.1 5
6 Gross saving 23.5 25.2 26.9 29.0 28.1 28.7 29.3 29.9 30.6 31.5 32.0 6
7 Gross investment 23.5 25.2 26.9 29.0 28.1 28.7 29.3 29.9 30.6 31.5 32.0 7
8 Capital expenditures 30.4 30.3 24.3 26.4 20.6 29.0 26.3 29.5 29.2 27.2 29.2 8 9 Fixed investment (2) 27.5 29.4 25.8 28.1 27.1 27.7 29.1 28.6 28.5 28.4 31.2 910 Change in inventories 2.9 0.9 -1.5 -1.8 -6.5 1.3 -2.8 0.9 0.7 -1.2 -2.0 10
11 Net financial investment -6.9 -5.1 2.6 2.7 7.5 -0.3 3.0 0.4 1.4 4.3 2.8 11
12 Net acquisition of financial assets 0.7 2.5 -0.6 -0.7 -0.8 0.8 0.4 -3.2 0.1 2.4 2.3 12
13 Checkable deposits and currency 0.2 1.9 -0.8 -0.6 -0.8 -0.8 -0.4 -0.5 -0.5 -0.4 -0.5 1314 Miscellaneous assets 0.4 0.5 0.2 -0.1 0.0 1.6 0.8 -2.7 0.6 2.8 2.7 1415 Insurance receivables 0.4 0.4 0.2 -0.1 0.3 1.3 0.7 -2.6 0.8 2.4 2.5 1516 Equity investment in GSEs (3) 0.0 0.1 -0.0 -0.0 -0.3 0.3 0.2 -0.1 -0.1 0.3 0.2 16
17 Net increase in liabilities 7.6 7.6 -3.2 -3.4 -8.3 1.1 -2.6 -3.6 -1.3 -2.0 -0.6 17
18 Credit market instruments 6.2 8.0 5.5 10.9 13.8 9.7 7.2 12.8 6.0 9.8 3.1 1819 Bank loans n.e.c. 3.5 1.2 -0.9 2.7 2.2 1.2 -0.8 8.2 2.2 -2.3 -4.2 1920 Other loans and advances -0.5 0.3 0.6 1.7 4.2 -1.6 1.5 2.5 -0.4 -0.3 0.8 2021 Mortgages 3.1 6.5 5.8 6.5 7.4 10.1 6.5 2.0 4.2 12.4 6.5 2122 Trade payables 1.4 0.8 0.4 0.9 1.1 1.6 -0.9 1.7 1.5 -0.2 -2.5 2223 Proprietors’ net investment 0.0 -1.2 -9.0 -15.1 -23.3 -10.3 -8.9 -18.1 -8.8 -11.6 -1.1 23
(1) Corporate and noncorporate farms.(2) Nonresidential fixed investment, shown in table F.6, line 12.(3) Equity in the Farm Credit System.

20 Z.1, December 7, 2001
F.105 State and Local Governments, Excluding Employee Retirement Funds (1)Billions of dollars; quarterly figures are seasonally adjusted annual rates
1997 1998 1999 2000 2000 2001 Q1 Q2 Q3 Q4 Q1 Q2 Q3
1 Current receipts, NIPA basis 1011.4 1074.4 1143.8 1222.7 1194.5 1215.4 1234.3 1246.5 1273.4 1294.3 1287.3 1
2 Personal tax and nontax receipts 217.0 235.5 255.9 278.7 268.7 276.2 280.4 289.3 293.8 291.4 298.3 2 3 Corporate profits tax accruals 34.2 34.6 34.8 36.8 37.7 38.2 37.3 34.1 31.8 30.7 27.7 3 4 Indirect business tax and nontax accruals 552.6 583.9 612.5 651.6 640.8 646.8 655.7 662.9 673.5 680.4 684.1 4 5 Contributions for social insurance 10.9 10.2 10.1 10.1 10.1 10.0 10.0 10.1 10.3 10.6 10.8 5 6 Federal grants-in-aid 196.8 210.3 230.5 245.6 237.2 244.2 250.9 250.1 264.0 281.2 266.4 6
7 Current expenditures, NIPA basis 980.4 1033.7 1101.6 1189.8 1161.2 1180.7 1199.5 1217.8 1251.1 1273.0 1285.0 7
8 Consumption expenditures 766.5 808.3 858.3 929.0 907.2 922.3 936.6 950.0 966.7 981.3 991.5 8 9 Transfer payments to persons 227.6 235.3 254.0 270.7 263.9 268.3 272.7 277.8 282.9 288.3 292.8 910 Net interest paid -0.9 0.4 -0.2 -0.3 -0.3 -0.4 -0.2 -0.2 -0.5 -0.8 -0.9 1011 - Dividends received by government 0.3 0.4 0.4 0.4 0.4 0.4 0.4 0.4 0.4 0.4 0.4 1112 Subsidies less current surplus of govt. enterprises -12.4 -9.9 -10.1 -9.2 -9.2 -9.1 -9.2 -9.4 2.4 4.6 2.0 1213 - Wage accruals less disbursements 0.0 0.0 0.0 0.0 0.0 0.0 0.0 0.0 0.0 0.0 0.0 13
14 Current surplus or deficit (-), NIPA basis 31.0 40.8 42.2 32.9 33.3 34.7 34.8 28.7 22.3 21.3 2.3 14
15 + Consumption of fixed capital 94.2 99.5 106.4 114.9 111.6 114.0 116.1 118.0 120.2 121.9 129.5 1516 + Net capital transfers (2) 35.3 36.0 39.7 44.1 43.2 43.9 43.9 45.5 47.3 49.7 49.7 16
17 = Gross saving and net capital transfers 160.4 176.2 188.3 191.9 188.1 192.6 194.8 192.2 189.8 192.9 181.5 17
18 Gross investment 121.3 227.1 216.2 220.5 223.7 239.7 215.3 203.3 170.4 178.6 194.3 18
19 Fixed investment 183.3 191.0 210.2 221.8 226.0 217.8 220.6 222.7 233.1 244.2 233.7 19
20 Net financial investment -62.0 36.1 6.1 -1.3 -2.3 21.9 -5.3 -19.4 -62.7 -65.6 -39.4 20
21 Net acq. of financial assets 25.4 146.9 87.5 53.3 43.9 65.5 43.8 59.8 65.9 68.1 29.2 21
22 Checkable deposits and currency 4.4 -3.9 3.9 1.0 -5.9 -7.2 0.2 17.0 2.3 -6.5 -0.1 2223 Time and savings deposits 5.8 12.8 10.9 9.4 -18.4 20.3 7.0 28.9 -11.5 1.7 -2.9 2324 Security RPs 3.6 7.2 5.0 9.7 51.3 -9.4 12.0 -15.0 19.0 17.2 40.8 24
25 Credit market instruments 0.1 134.5 43.4 9.2 1.2 39.9 -16.4 12.1 1.5 -24.8 -30.4 25
26 Open market paper 14.3 28.0 1.9 7.6 6.9 17.5 -4.0 10.0 4.0 -17.2 20.0 2627 U.S. government securities -18.5 93.5 26.0 -7.1 -14.4 11.7 -21.7 -4.1 -20.7 -18.9 -70.4 2728 Treasury -17.7 30.0 -2.5 -30.6 -37.5 -15.2 -45.7 -24.1 -48.5 -41.5 -98.0 2829 Agency -0.8 63.6 28.5 23.5 23.1 26.9 24.0 20.0 27.8 22.7 27.6 29
30 Municipal securities -0.7 -1.4 -1.5 0.6 -1.7 1.6 3.2 -0.8 2.1 -0.6 0.4 3031 Corporate and foreign bonds 1.3 10.2 12.6 3.7 6.1 4.7 1.6 2.4 11.5 7.2 14.8 3132 Mortgages 3.7 4.1 4.3 4.5 4.4 4.5 4.5 4.6 4.6 4.7 4.8 32
33 Corporate equities 16.8 9.4 3.5 -1.2 -5.6 10.7 -4.1 -5.6 16.9 21.0 20.3 3334 Mutual fund shares -7.4 -12.3 4.3 0.8 -10.7 5.6 4.5 4.0 9.4 7.9 -0.8 34
35 Taxes receivable 3.3 9.1 8.8 11.9 13.3 16.6 9.9 7.7 4.6 3.0 -0.2 3536 Miscellaneous assets -1.2 -9.7 7.7 12.3 18.7 -10.9 30.8 10.7 23.6 48.6 2.5 36
37 Net increase in liabilities 87.5 110.8 81.4 54.5 46.2 43.6 49.2 79.2 128.7 133.6 68.6 37
38 Credit market instruments 56.1 80.3 52.3 27.2 12.9 18.2 23.8 53.7 103.9 108.7 43.0 38
39 Municipal securities 57.3 79.1 52.7 28.2 14.5 19.8 25.1 53.4 103.4 108.3 42.9 3940 Short-term 8.3 -6.3 3.6 3.2 4.4 8.4 -7.2 7.1 21.2 20.5 37.3 4041 Other 49.0 85.4 49.1 25.0 10.1 11.5 32.3 46.3 82.3 87.7 5.6 4142 U.S. government loans -1.2 1.2 -0.4 -1.0 -1.6 -1.6 -1.3 0.4 0.4 0.4 0.1 42
43 Trade payables 31.4 30.5 29.1 27.4 33.2 25.4 25.4 25.5 24.8 25.0 25.6 43
44 Discrepancy 39.1 -50.9 -27.9 -28.6 -35.6 -47.1 -20.5 -11.1 19.4 14.2 -12.8 44
(1) Data for retirement funds are shown in table F.120.(2) Table F.9, line 7.

Z.1, December 7, 2001 21
F.106 Federal GovernmentBillions of dollars; quarterly figures are seasonally adjusted annual rates
1997 1998 1999 2000 2000 2001 Q1 Q2 Q3 Q4 Q1 Q2 Q3
1 Current receipts, NIPA basis 1625.5 1749.7 1872.8 2046.8 2003.0 2042.4 2064.3 2077.5 2087.4 2091.5 1908.6 1
2 Personal tax and nontax receipts 751.8 834.9 903.3 1009.5 976.6 1001.1 1019.8 1040.5 1051.4 1060.0 897.2 2 3 Corporate profits tax accruals 203.0 204.3 218.3 234.6 239.3 242.2 237.6 219.4 205.0 197.3 178.3 3 4 Indirect business tax and nontax accruals 93.7 97.4 100.6 111.2 108.6 111.5 111.9 112.7 112.2 112.0 110.6 4 5 Contributions for social insurance 577.0 613.1 650.7 691.5 678.5 687.6 695.0 704.9 718.8 722.2 722.5 5
6 Current expenditures, NIPA basis 1678.8 1705.9 1753.6 1828.3 1790.2 1833.5 1834.4 1855.1 1882.1 1904.7 1918.8 6
7 Consumption expenditures 456.9 453.1 469.6 493.7 483.4 503.8 493.6 494.1 507.5 510.1 512.7 7 8 Transfers payments (net) 717.5 730.6 746.2 779.3 758.7 775.1 780.5 802.9 811.7 823.3 837.4 8 9 Grants-in-aid to state and local governments 196.8 210.3 230.5 245.6 237.2 244.2 250.9 250.1 264.0 281.2 266.4 910 Net interest paid 276.2 278.5 263.9 262.9 264.2 264.4 262.9 259.9 253.5 242.5 232.5 1011 Subsidies less current surplus of govt. enterprises 31.5 33.5 43.4 46.8 46.7 46.0 46.5 48.1 45.4 47.6 69.8 1112 - Wage accruals less disbursements 0.0 0.0 0.0 0.0 0.0 0.0 0.0 0.0 0.0 0.0 0.0 12
13 Current surplus or deficit (-), NIPA basis -53.4 43.8 119.2 218.5 212.8 208.9 229.9 222.4 205.3 186.8 -10.2 13
14 + Consumption of fixed capital 86.8 88.2 91.7 96.4 94.9 95.9 97.0 97.9 98.4 99.4 99.9 1415 - Insurance and pension reserves (1) 3.4 4.4 3.8 1.8 0.3 2.7 0.8 3.3 2.8 6.9 0.1 1516 + Net capital transfers (2) -8.4 -3.6 -7.3 -7.9 -6.3 -7.7 -8.1 -9.7 -8.9 -12.7 -14.8 16
17 = Gross saving and net capital transfers 21.6 124.0 199.7 305.2 301.2 294.4 318.1 307.4 292.0 266.6 74.8 17
18 Gross investment 6.4 101.4 201.9 309.9 151.5 418.8 288.2 381.0 50.5 338.3 28.7 18
19 Fixed investment 81.4 86.1 94.5 96.5 95.1 97.2 93.5 100.1 97.8 99.9 101.8 1920 Access rights sales -8.8 -4.1 -1.7 -0.6 0.0 -1.2 -0.7 -0.5 -0.3 -0.3 -0.3 20
21 Net financial investment -66.2 19.3 109.1 214.0 56.4 322.8 195.4 281.4 -47.0 238.7 -72.8 21
22 Net acq. of financial assets -9.6 -5.3 76.2 -57.8 -123.8 -45.6 15.8 -77.7 55.4 22.7 179.5 22
23 Gold, SDRs, and official foreign exchange 2.5 6.0 -7.1 -0.6 1.9 -8.3 -1.5 5.3 -1.2 5.0 19.2 2324 Checkable deposits and currency -0.5 -16.7 66.2 -65.1 -140.3 -58.3 10.0 -71.7 40.1 -31.6 36.2 2425 Time and savings deposits 1.0 1.3 0.7 1.0 0.4 1.0 2.1 0.4 8.2 5.9 7.2 25
26 Credit market instruments 5.1 13.5 5.8 7.3 6.5 7.7 4.5 10.6 4.6 4.0 1.0 26
27 Agency securities 0.0 0.0 0.0 0.0 0.0 0.0 0.0 0.0 0.0 0.0 0.0 2728 Mortgages -4.5 -0.8 -0.1 -0.9 -3.8 0.1 -1.3 1.6 -2.4 -0.6 -3.4 2829 Other loans and advances 9.6 14.3 5.9 8.2 10.3 7.6 5.8 9.1 7.0 4.6 4.4 29
30 Trade receivables -3.2 1.5 4.6 5.3 6.0 7.2 4.3 3.7 9.9 10.0 7.4 3031 Taxes receivable -9.0 -7.5 7.0 -4.3 8.2 5.1 -4.0 -26.4 -5.7 23.1 101.6 3132 Miscellaneous assets -5.4 -3.5 -0.9 -1.4 -6.6 0.1 0.5 0.4 -0.5 6.3 6.9 32
33 Net increase in liabilities 56.5 -24.7 -32.9 -271.8 -180.2 -368.4 -179.6 -359.1 102.4 -216.0 252.2 33
34 SDR certificates -0.5 0.0 -3.0 -4.0 0.0 -8.0 -4.0 -4.0 0.0 0.0 0.0 3435 Treasury currency 0.5 0.6 1.0 2.4 2.2 3.2 4.2 -0.0 -1.1 1.1 -0.0 35
36 Credit market instruments 23.1 -52.6 -71.2 -295.9 -217.2 -408.7 -226.2 -331.3 -4.3 -256.0 255.7 36
37 Savings bonds -0.5 0.1 -0.2 -1.7 -3.5 -2.1 -0.9 -0.3 1.4 3.3 3.9 3738 Other Treasury securities 23.7 -54.7 -70.8 -293.2 -211.7 -408.5 -222.9 -329.9 -3.5 -260.5 252.1 3839 Budget agency securities -0.1 2.0 -0.2 -1.0 -2.1 1.8 -2.4 -1.2 -2.2 1.1 -0.4 3940 Multifamily residential mortgages -0.0 0.0 0.0 0.0 0.0 0.0 0.0 0.0 0.0 0.0 0.0 40
41 Trade payables -8.8 -8.0 0.7 1.3 3.2 -2.2 2.2 2.1 -11.0 -12.0 -13.8 4142 Insurance and pension reserves (3) 42.0 42.5 42.5 22.3 39.3 41.9 36.3 -28.1 118.1 46.9 31.8 4243 Miscellaneous liabilities 0.3 -7.1 -2.9 2.0 -7.6 5.4 7.9 2.3 0.6 4.1 -21.4 43
44 Discrepancy 15.2 22.6 -2.2 -4.6 149.7 -124.4 29.8 -73.6 241.5 -71.7 46.1 44
Memo:
45 Change in cash balance (4) -2.2 -12.8 59.4 -55.1 -121.2 -41.1 15.1 -73.4 18.4 -15.6 61.9 45
(1) Railroad Retirement Board and federal government life insurance reserves.(2) Table F.9, line 2.(3) Line 15 plus civil service retirement and disability fund, judicial retirement fund, military retirement fund, and foreign service retirement and disability fund.(4) Time and savings deposits (line 25) plus checkable deposit and currency liabilities of the monetary authority and commercial banking sectors (table F.204, lines 3 and 7).

22 Z.1, December 7, 2001
F.107 Rest of the WorldBillions of dollars; quarterly figures are seasonally adjusted annual rates
1997 1998 1999 2000 2000 2001 Q1 Q2 Q3 Q4 Q1 Q2 Q3
1 Foreign income from U.S. 1370.8 1450.7 1610.2 1917.6 1819.6 1905.0 1969.1 1976.5 1916.5 1833.2 1691.7 1 2 U.S. imports 1055.8 1116.7 1240.7 1466.9 1393.6 1450.4 1511.8 1511.6 1481.2 1427.0 1315.9 2 3 U.S. income payments to rest of world 274.3 289.6 320.6 396.3 378.1 404.5 404.7 397.9 389.4 358.6 329.2 3 4 Net transfers to rest of world 40.8 44.5 49.0 54.4 47.9 50.1 52.6 67.0 45.9 47.6 46.6 4
5 Foreign outlays to U.S. 1247.7 1251.1 1303.6 1487.1 1419.8 1487.6 1517.7 1523.1 1496.3 1426.5 1345.9 5 6 U.S. exports 966.4 964.9 989.8 1102.9 1059.7 1099.7 1131.1 1121.0 1117.4 1079.6 1023.7 6 7 U.S. income receipts from rest of world 281.3 286.1 313.8 384.2 360.1 387.9 386.6 402.1 378.9 346.9 322.2 7
8 Net capital transfers (1) -0.4 -0.7 3.5 -0.7 -0.7 -0.7 -0.7 -0.7 -0.7 -0.7 -0.8 8
9 Gross saving and net capital transfers (2) 122.7 199.0 310.2 429.8 399.1 416.7 450.7 452.7 419.5 406.0 345.0 9
10 Net financial investment 272.0 145.5 373.2 444.0 235.4 626.4 458.2 455.8 323.0 499.4 376.8 10
11 Net acquisition of financial assets 649.8 474.3 783.2 940.5 980.0 940.9 886.2 954.7 837.5 678.6 435.4 11
12 Gold and SDRs (3) -0.4 -0.1 0.0 -0.7 -0.7 -0.7 -0.7 -0.7 -0.8 -0.6 -2.0 1213 Net interbank assets -4.3 -27.1 -6.5 -11.5 5.9 138.4 -143.9 -46.6 -66.3 2.2 -7.4 1314 U.S. checkable deposits and currency 29.9 14.8 39.9 -8.2 -81.9 9.8 8.0 31.3 11.3 7.1 38.5 1415 U.S. time deposits 13.1 13.0 15.0 5.7 -9.5 1.4 -6.4 37.2 -40.3 2.6 -7.7 1516 Security RPs 20.0 -18.8 14.8 5.1 -43.2 48.5 20.6 -5.6 97.1 13.5 -36.2 16
17 Credit market instruments 311.3 254.2 208.8 279.3 315.2 197.9 216.2 387.8 411.2 349.6 381.9 1718 Open market paper 19.9 37.6 -13.0 8.7 -9.4 -7.2 -14.3 65.6 -4.1 12.8 -9.7 1819 U.S. government securities 189.6 95.4 83.8 89.7 163.9 19.1 85.4 90.4 167.5 40.9 161.9 1920 Official -2.2 -3.6 32.5 30.7 97.2 25.3 21.1 -21.0 10.2 -43.4 67.5 2021 Treasury -6.7 -9.9 12.2 -10.2 64.8 -16.0 -36.0 -53.7 -4.1 -83.1 68.2 2122 Agency 4.5 6.3 20.4 40.9 32.4 41.3 57.1 32.8 14.3 39.7 -0.7 2223 Private 191.7 99.0 51.3 59.0 66.6 -6.2 64.3 111.4 157.3 84.3 94.4 2324 Treasury 146.4 48.6 -20.5 -52.8 -37.4 -82.2 -50.0 -41.6 2.6 -33.1 -37.8 2425 Agency 45.3 50.4 71.8 111.8 104.0 76.0 114.4 152.9 154.7 117.4 132.3 2526 U.S. corporate bonds (4) 84.6 122.2 160.8 183.1 178.3 169.1 185.6 199.4 280.2 279.6 149.7 2627 Loans to U.S. corporate business 17.3 -1.0 -22.7 -2.2 -17.6 16.9 -40.6 32.4 -32.4 16.2 80.1 27
28 U.S. corporate equities 67.8 42.0 112.3 193.8 266.2 136.1 214.9 158.2 164.4 137.8 37.2 2829 Trade receivables 4.5 -7.5 -7.5 10.4 -1.6 3.9 9.1 30.2 6.4 -4.6 -6.8 2930 Security credit 0.0 0.0 0.0 0.0 0.0 0.0 0.0 0.0 0.0 0.0 0.0 3031 Miscellaneous assets 208.0 203.8 406.4 466.6 529.5 405.5 568.5 363.0 254.5 171.0 37.8 3132 Foreign direct investment in U.S. (5) 105.6 178.2 301.0 287.7 146.0 361.6 304.2 338.8 209.9 268.7 95.9 3233 Other 102.4 25.6 105.4 179.0 383.5 43.9 264.3 24.2 44.6 -97.7 -58.1 33
34 Net increase in liabilities 377.8 328.8 410.0 496.5 744.6 314.5 428.0 498.9 514.5 179.1 58.6 34 U.S. official foreign exchange35 and net IMF position 0.7 6.6 -8.7 -0.4 1.5 -8.8 0.7 4.9 -1.5 4.7 19.1 3536 U.S. private deposits 107.7 6.5 61.0 120.8 313.3 3.4 -40.8 207.4 235.5 -146.5 15.4 36
37 Credit market instruments 71.8 43.4 27.9 67.0 120.3 -7.9 88.6 66.8 -6.9 -57.2 -126.8 3738 Commercial paper 3.7 7.8 16.3 31.7 57.8 12.0 7.0 50.1 -25.4 -5.6 -26.5 3839 Bonds 61.4 34.9 16.8 25.2 47.6 -27.3 71.4 9.0 17.1 -15.9 -101.4 3940 Bank loans n.e.c. 8.5 6.7 0.5 11.3 15.4 5.7 11.9 12.2 13.0 -31.0 4.4 4041 Official -0.8 0.8 0.2 0.5 -0.8 1.4 1.8 -0.3 0.4 -1.2 3.4 4142 Banks -0.5 -0.7 -3.1 3.2 5.7 2.6 2.2 2.5 12.1 -28.3 1.1 4243 Other 9.8 6.7 3.5 7.5 10.6 1.7 7.9 9.9 0.5 -1.5 -0.1 4344 U.S. government loans -1.6 -1.0 -4.8 -0.6 0.3 0.4 -2.2 -0.8 -1.8 -4.3 -4.2 4445 Acceptance liabilities to banks -0.2 -5.0 -0.9 -0.7 -0.8 1.2 0.5 -3.7 -9.9 -0.3 0.9 45
46 Foreign corporate equities (6) 57.6 101.3 114.4 99.7 62.6 185.9 61.1 89.4 109.2 208.8 10.9 4647 Trade payables 5.1 -2.4 4.3 1.6 -2.4 12.1 -12.7 9.2 -5.8 11.5 6.3 4748 Security debt 0.0 0.0 0.0 0.0 0.0 0.0 0.0 0.0 0.0 0.0 0.0 4849 Miscellaneous liabilities 134.9 173.5 211.1 207.9 249.3 129.8 331.1 121.1 184.0 157.6 133.6 4950 U.S. equity in IBRD, etc. 1.6 1.6 1.5 1.5 1.4 1.6 1.3 1.6 2.1 7.4 7.2 5051 U.S. government deposits -0.0 -0.1 0.6 0.0 -1.2 0.2 0.4 0.6 -0.4 0.0 -0.7 5152 U.S. direct investment abroad (4,5) 104.8 142.5 155.4 152.4 153.6 133.4 166.5 156.3 163.8 142.4 96.3 5253 Other 28.6 29.5 53.6 53.9 95.6 -5.4 162.8 -37.4 18.5 7.8 30.9 53
54 Discrepancy (FOF basis) (7) -149.4 53.5 -63.0 -14.2 163.7 -209.7 -7.5 -3.2 96.5 -93.5 -31.8 54
Memo:55 Net U.S. exports, NIPA basis -89.4 -151.7 -250.9 -364.0 -333.9 -350.7 -380.7 -390.6 -363.8 -347.4 -292.2 5556 + Net U.S. income receipts (8) 7.1 -3.5 -6.8 -12.1 -18.0 -16.6 -18.1 4.2 -10.5 -11.7 -7.0 5657 - Net transfer payments to foreign 40.8 44.5 49.0 54.4 47.9 50.1 52.6 67.0 45.9 47.6 46.6 57 = Net foreign investment in U.S.58 (NIPA basis) -123.1 -199.7 -306.7 -430.5 -399.8 -417.4 -451.4 -453.4 -420.2 -406.7 -345.8 58
(1) Table F.9, line 10.(2) Line 1 minus line 5 plus line 8; also equal to line 58 with the sign reversed plus line 8.(3) U.S. net sales, sign reversed.(4) Through 1992:Q4, corporate bonds include net issues by Netherlands Antillean financial subsidiaries; U.S. direct investment abroad excludes net inflows from those bond issues.(5) Direct investment is valued on a current-cost basis. Excludes capital gains and losses.(6) Includes American Depositary Receipts (ADRs).(7) Balance of payments discrepancy adjusted to NIPA concepts.(8) Consists of net receipts from foreigners of interest, corporate profits, and employee compensation. Equals difference between GNP and GDP.

Z.1, December 7, 2001 23
F.108 Monetary Authority (1)Billions of dollars; quarterly figures are seasonally adjusted annual rates
1997 1998 1999 2000 2000 2001 Q1 Q2 Q3 Q4 Q1 Q2 Q3
1 Gross saving 2.7 -2.1 0.2 4.5 4.4 4.5 4.6 4.7 4.4 4.4 4.2 1
2 Fixed nonresidential investment 0.3 0.3 0.3 0.3 0.3 0.3 0.3 0.3 0.3 0.4 0.4 2
3 Net acquisition of financial assets 38.8 32.8 130.0 -60.9 -299.3 18.5 19.2 17.9 33.3 53.7 120.6 3
4 Gold and foreign exchange -1.5 0.8 -1.6 0.9 0.3 0.2 2.9 0.3 0.4 0.3 2.0 4 5 SDR certificates -0.5 0.0 -3.0 -4.0 0.0 -8.0 -4.0 -4.0 0.0 0.0 0.0 5 6 Treasury currency 0.6 0.7 1.7 3.6 4.0 3.9 3.3 3.3 2.5 1.6 0.7 6
7 Federal Reserve float -3.6 0.9 -1.9 1.1 0.1 0.8 1.5 2.1 -2.9 -2.2 -0.2 7 8 Fed. Res. loans to domestic banks 2.0 -2.0 0.2 -0.1 0.0 1.1 -0.6 -1.0 -0.4 0.5 -0.2 8 9 Security RPs 2.3 6.5 110.3 -97.3 -402.8 26.9 -27.6 14.5 -15.1 24.2 106.7 9
10 Credit market instruments 38.3 21.1 25.7 33.7 102.0 -5.4 39.1 -0.9 53.7 26.4 8.7 10
11 Acceptances 0.0 0.0 0.0 0.0 0.0 0.0 0.0 0.0 0.0 0.0 0.0 1112 U.S. government securities 38.3 21.1 25.7 33.7 102.0 -5.4 39.1 -0.9 53.7 26.4 8.7 1213 Treasury 39.8 21.4 25.8 33.7 102.1 -5.4 39.2 -0.9 54.2 26.4 8.7 1314 Agency -1.5 -0.3 -0.2 -0.1 -0.1 -0.0 -0.0 0.0 -0.5 0.0 0.0 1415 Bank loans n.e.c. 0.0 0.0 0.0 0.0 0.0 0.0 0.0 0.0 0.0 0.0 0.0 15
16 Miscellaneous assets 1.3 4.9 -1.3 1.1 -2.8 -1.0 4.5 3.6 -4.9 2.8 2.9 16
17 Net increase in liabilities 38.1 32.1 129.6 -61.3 -305.6 34.2 20.1 6.2 34.3 50.7 119.2 17
18 Depository institution reserves 6.3 -4.5 -2.3 -5.0 -5.1 0.4 -4.6 -10.7 14.7 1.5 22.5 1819 Vault cash of commercial banks -0.2 -2.9 24.5 -22.2 -99.1 5.7 -10.9 15.7 -7.6 3.7 -3.3 19
20 Checkable deposits and currency 29.9 38.3 108.7 -35.3 -187.8 27.5 23.3 -4.1 48.8 50.2 84.2 2021 Due to federal government -2.3 0.5 22.3 -22.9 -91.0 -19.5 30.4 -11.5 5.9 -17.7 30.1 2122 Due to rest of the world 0.3 -0.3 -0.1 0.1 0.2 -0.1 0.1 0.3 -0.6 0.1 2.0 2223 Currency outside banks 31.9 38.0 86.4 -12.5 -97.0 47.1 -7.2 7.1 43.5 67.8 52.1 23
24 Miscellaneous liabilities 2.1 1.3 -1.3 1.1 -13.5 0.5 12.3 5.3 -21.6 -4.7 15.8 2425 Federal Reserve Bank stock 0.8 0.5 0.5 0.6 1.2 0.5 0.3 0.3 0.1 0.5 0.5 2526 Other 1.3 0.8 -1.8 0.6 -14.8 -0.0 12.0 5.0 -21.8 -5.2 15.3 26
27 Discrepancy 1.7 -3.1 -0.6 3.8 -2.2 19.8 5.1 -7.4 5.0 1.0 2.4 27
(1) Assets and liabilities of Federal Reserve Banks and Treasury monetary accounts that supply or absorb bank reserves. Excludes the accounts of the Federal Reserve Board.

24 Z.1, December 7, 2001
F.109 Commercial Banking (1)Billions of dollars; quarterly figures are seasonally adjusted annual rates
1997 1998 1999 2000 2000 2001 Q1 Q2 Q3 Q4 Q1 Q2 Q3
1 Gross saving 35.5 29.9 47.9 51.2 53.1 51.9 48.5 51.2 49.0 50.6 56.6 1
2 Fixed nonresidential investment 26.2 30.2 32.4 35.7 34.6 35.6 36.3 36.3 36.0 34.6 33.7 2
3 Net acquisition of financial assets 457.3 443.7 352.5 487.8 356.1 707.5 566.3 321.2 115.1 305.0 456.9 3
4 Vault cash -0.2 -2.9 24.5 -22.2 -99.1 5.7 -10.9 15.7 -7.6 3.7 -3.3 4 5 Reserves at Federal Reserve 6.8 -4.6 -2.4 -4.0 -3.3 0.4 -2.8 -10.1 14.7 1.5 21.6 5 6 Checkable deposits and currency -0.1 0.6 0.3 -0.5 -1.3 0.6 -2.6 1.2 0.6 -0.6 3.2 6
7 Total bank credit 350.0 335.8 295.5 412.3 503.9 514.3 396.0 235.0 238.6 47.2 223.7 7
8 U.S. government securities 83.8 35.4 48.4 -21.9 -15.7 -21.3 -7.2 -43.4 -103.5 -36.2 188.3 8 9 Treasury 8.3 -56.1 12.7 -44.5 -86.3 -35.1 22.9 -79.6 -82.8 39.5 22.1 910 Agency 75.5 91.4 35.7 22.6 70.6 13.8 -30.1 36.2 -20.7 -75.6 166.2 10
11 Municipal securities 2.4 8.2 5.8 3.4 7.6 3.1 1.6 1.1 -2.6 15.5 3.8 1112 Corporate and foreign bonds 27.8 38.0 38.8 57.6 -22.9 19.3 138.0 96.0 52.1 141.2 48.3 12
13 Total loans 234.7 253.4 200.1 370.4 529.0 512.4 262.6 177.6 280.5 -70.6 -26.0 1314 Open market paper -0.8 -0.2 0.3 0.1 0.4 -0.4 -0.1 0.7 0.1 0.0 0.0 1415 Bank loans n.e.c. 128.2 145.0 68.9 114.1 158.0 179.2 52.2 67.1 34.1 -170.0 -13.6 1516 Mortgages 99.9 91.7 158.2 164.1 247.0 261.1 127.6 20.7 158.8 133.0 42.8 1617 Consumer credit -14.2 -3.6 -9.2 41.7 39.5 55.7 53.9 17.8 13.7 54.4 -27.3 1718 Security credit 21.7 20.5 -18.1 50.4 84.2 16.8 29.1 71.4 73.8 -88.1 -27.9 18
19 Corporate equities 0.6 1.3 1.2 0.3 0.8 0.9 1.3 -1.8 -1.5 -0.5 5.6 1920 Mutual fund shares 0.8 -0.4 1.2 2.5 5.1 -0.1 -0.3 5.4 13.6 -2.1 3.8 20
21 Customers’ liab. on acceptances (2) -2.8 -9.3 -3.1 -0.7 2.0 0.7 -2.7 -2.9 0.0 -4.0 -7.4 2122 Miscellaneous assets 103.5 124.1 37.8 102.9 -46.1 185.7 189.4 82.5 -131.2 257.1 219.0 22
23 Net increase in liabilities 490.5 469.1 289.7 527.7 461.3 860.8 515.1 273.6 344.8 279.9 678.3 23
24 Net interbank liabilities -25.8 -24.8 -4.6 6.9 31.3 145.7 -155.0 5.6 -52.8 14.1 0.4 2425 To monetary authority -1.6 -1.1 -1.7 1.0 0.1 1.9 1.0 1.1 -3.2 -1.7 -0.5 2526 To domestic banks (3) -19.9 3.4 3.5 17.4 25.3 5.4 -12.1 51.1 16.7 13.6 8.3 2627 To foreign banks -4.3 -27.1 -6.5 -11.5 5.9 138.4 -143.9 -46.6 -66.3 2.2 -7.4 27
28 Checkable deposits -19.8 -33.4 3.2 -85.2 -87.9 -100.7 -60.8 -91.4 -25.5 1.4 109.3 2829 Federal government -0.9 -14.6 36.4 -33.2 -30.5 -22.6 -17.3 -62.3 4.3 -3.8 24.6 2930 Rest of the world 4.8 -1.5 13.4 -9.5 -54.7 5.9 4.8 6.0 2.7 -4.1 3.7 3031 Private domestic -23.7 -17.3 -46.6 -42.6 -2.7 -84.1 -48.3 -35.2 -32.4 9.4 81.0 31
32 Small time and savings deposits 148.3 183.7 71.3 213.3 145.6 159.7 213.0 334.8 222.2 197.7 198.0 3233 Large time deposits 107.9 72.3 119.0 94.9 128.8 86.5 122.6 41.8 87.8 20.9 -40.8 3334 Federal funds and security RPs (net) 89.0 87.0 110.6 63.6 133.1 198.9 59.2 -137.0 74.3 -62.1 23.7 34
35 Credit market instruments 46.1 72.9 67.2 60.0 78.3 99.3 43.4 18.8 148.3 -15.8 69.8 35
36 Open market paper 3.3 -1.5 6.1 0.6 -13.4 7.3 4.5 3.8 29.8 -7.4 -7.6 3637 Corporate bonds 23.7 27.6 20.4 32.6 33.1 38.1 32.7 26.5 79.5 9.0 31.5 3738 Other loans and advances 19.1 46.9 40.6 26.8 58.6 53.9 6.2 -11.4 39.0 -17.4 45.9 38
39 Corporate equity issues -27.7 -11.2 -10.6 -12.5 -26.1 -16.0 -2.8 -5.2 -8.1 -7.9 -20.6 3940 Taxes payable 1.4 1.7 1.9 2.1 2.1 2.1 2.2 2.2 2.3 2.4 2.4 4041 Miscellaneous liabilities 171.2 120.9 -68.3 184.7 56.0 285.3 293.3 104.1 -103.7 129.2 336.0 41
42 Discrepancy 42.4 25.1 -47.4 55.4 123.7 169.6 -39.0 -32.6 242.7 -9.1 244.3 42
Memo:
43 Credit market funds advanced (4) 324.3 305.2 308.2 358.4 415.8 497.4 363.2 157.0 152.8 133.9 234.8 43
(1) U.S.-chartered commercial banks, foreign banking offices in U.S., bank holding companies, and banks in U.S.-affiliated areas. IBFs are excluded from domestic banking and treated the same as branches in foreign countries.(2) Included in other loans and advances (table F.216).(3) Floats and discrepancies in interbank transactions.(4) Total bank credit (line 7) less security credit (line 18) less corporate equities (line 19) less mutual fund shares (line 20) plus customers’ liability on acceptances (line 21).

Z.1, December 7, 2001 25
F.110 U.S.-Chartered Commercial BanksBillions of dollars; quarterly figures are seasonally adjusted annual rates
1997 1998 1999 2000 2000 2001 Q1 Q2 Q3 Q4 Q1 Q2 Q3
1 Gross saving -7.5 -11.1 -9.4 -3.3 -5.7 -3.1 -1.5 -2.7 -17.2 -7.5 3.4 1
2 Fixed nonresidential investment 21.1 23.9 25.7 28.3 27.4 28.2 28.8 28.8 28.5 27.4 26.7 2
3 Net acquisition of financial assets 290.8 328.1 344.1 329.2 355.5 520.1 344.0 97.4 112.7 177.9 390.6 3
4 Vault cash and reserves at Federal Reserve 4.8 -5.7 21.6 -25.2 -98.5 5.5 -13.0 5.3 6.8 5.6 17.7 4
5 Total bank credit 280.7 329.3 313.7 350.5 488.1 486.6 316.1 111.1 149.6 185.8 265.7 5
6 U.S. government securities 54.3 39.6 27.4 -16.7 43.2 1.6 -46.5 -65.2 -135.3 26.3 145.6 6 7 Treasury -6.1 -42.1 -1.9 -35.0 -32.2 -13.7 -6.5 -87.6 -104.4 13.8 4.0 7 8 Agency 60.4 81.6 29.3 18.2 75.3 15.3 -40.0 22.4 -30.9 12.5 141.5 8 9 Mortgage pool securities 31.1 53.7 -17.8 14.2 24.7 0.5 -25.8 57.3 41.5 61.4 89.9 910 Agency-issued CMOs 17.5 8.9 4.9 -9.8 -1.5 -4.6 -41.8 8.6 15.0 6.8 68.6 1011 Other agency securities 11.8 19.1 42.2 13.8 52.2 19.3 27.5 -43.6 -87.4 -55.7 -17.0 11
12 Municipal securities 2.4 8.2 5.8 3.2 7.1 3.2 1.5 1.1 -1.2 15.5 3.9 1213 Corporate and foreign bonds 19.6 32.4 43.3 52.4 -21.4 25.9 132.4 72.8 63.0 49.7 66.4 1314 Private mortgage pool securities -1.2 0.9 0.9 -0.7 -5.3 -4.2 3.9 2.6 15.2 2.9 -2.5 1415 Privately issued CMOs 0.7 20.3 5.7 8.0 -9.5 3.7 16.1 21.8 4.1 26.1 -40.6 1516 Other bonds 20.2 11.1 36.7 45.2 -6.6 26.4 112.4 48.4 43.7 20.8 109.5 16
17 Total loans 203.0 248.2 234.9 308.7 453.2 455.2 227.6 98.8 211.0 96.9 40.5 1718 Open market paper -0.6 -0.1 -0.1 0.2 -0.1 -0.4 0.3 1.2 0.0 0.0 0.0 1819 Bank loans n.e.c. 108.1 144.3 92.2 98.2 135.5 168.8 59.3 29.2 11.1 -93.0 -5.1 1920 Mortgages 105.5 95.8 160.6 161.5 242.6 255.3 125.8 22.2 156.2 129.3 37.6 2021 Consumer credit -14.2 -3.6 -9.2 41.7 39.5 55.7 53.9 17.8 13.7 54.4 -27.3 2122 Security credit 4.2 11.9 -8.7 7.1 35.8 -24.2 -11.6 28.5 30.0 6.2 35.3 22
23 Corporate equities 0.6 1.3 1.2 0.3 0.8 0.9 1.3 -1.8 -1.5 -0.5 5.6 2324 Mutual fund shares 0.8 -0.4 1.2 2.5 5.1 -0.1 -0.3 5.4 13.6 -2.1 3.8 24
25 Customers’ liab. on acceptances (1) -0.2 -4.6 -2.5 -0.7 1.8 0.8 -1.9 -3.7 0.4 -2.5 -5.6 2526 Miscellaneous assets 5.5 9.1 11.3 4.7 -35.9 27.1 42.8 -15.3 -44.1 -10.9 112.8 26
27 Net increase in liabilities 359.0 385.2 327.8 412.6 508.7 717.3 331.7 92.8 397.4 198.7 653.5 27
28 Net interbank liabilities 4.2 20.4 32.6 18.3 31.2 172.5 -32.7 -97.6 185.1 38.0 -50.0 2829 Federal Reserve float -3.6 0.9 -1.9 1.1 0.1 0.8 1.5 2.1 -2.9 -2.2 -0.2 2930 Borrowing from Federal Reserve banks 2.0 -2.0 0.2 -0.1 0.0 1.1 -0.6 -1.0 -0.4 0.5 -0.2 3031 To domestic banking -6.7 -2.6 -12.1 -12.5 -11.6 1.9 18.8 -59.2 208.3 -4.6 42.0 3132 To foreign banks 12.6 24.0 46.3 29.8 42.7 168.6 -52.5 -39.5 -20.0 44.3 -91.6 32
33 Checkable deposits -21.1 -34.4 2.8 -84.8 -83.3 -105.0 -55.5 -95.5 -23.3 -0.8 108.0 3334 Federal government -0.9 -14.6 36.4 -33.2 -30.5 -22.6 -17.3 -62.3 4.3 -3.8 24.6 3435 Rest of the world 4.4 -1.2 12.8 -9.2 -52.8 3.6 8.8 3.6 3.6 6.3 4.1 3536 Private domestic -24.6 -18.6 -46.4 -42.4 -0.0 -86.0 -47.0 -36.8 -31.1 -3.3 79.3 36
37 Small time and savings deposits 143.9 186.3 72.4 210.4 146.6 155.3 215.5 324.3 228.0 169.0 213.1 3738 Large time deposits 63.2 34.8 61.5 87.9 91.7 141.6 73.7 44.6 17.7 25.6 -7.3 3839 Federal funds and security RPs (net) 63.4 66.8 128.7 12.8 124.6 137.8 -33.2 -178.1 45.1 58.1 41.0 39
40 Acceptance liabilities -0.3 -4.6 -2.5 -0.6 1.7 0.9 -1.8 -3.3 0.1 -2.2 -5.3 4041 Corporate bonds 10.7 10.5 3.7 10.6 9.9 13.1 9.2 10.1 13.9 -3.7 11.4 4142 Other loans and advances 19.1 46.9 40.6 26.8 58.6 53.9 6.2 -11.4 39.0 -17.4 45.9 4243 Corporate equity issues 3.2 3.8 3.2 4.0 2.2 2.1 3.9 7.9 3.3 5.4 1.8 4344 Taxes payable 1.4 1.7 1.9 2.1 2.1 2.1 2.2 2.2 2.3 2.4 2.4 44
45 Miscellaneous liabilities 71.2 53.0 -17.1 125.0 123.4 143.0 144.2 89.5 -113.9 -75.7 292.3 4546 Investment by bank holding companies 40.7 55.3 2.9 53.6 80.8 35.9 54.9 42.7 65.5 41.5 102.4 4647 Other 30.5 -2.4 -20.0 71.4 42.6 107.0 89.3 46.8 -179.5 -117.2 189.9 47
48 Discrepancy 39.6 22.0 -51.4 51.8 120.1 165.9 -42.7 -36.1 239.0 -14.1 239.6 48
Memo:
49 Credit market funds advanced (2) 274.9 312.0 317.6 339.8 448.2 510.9 324.8 75.3 107.9 179.7 215.4 49
(1) Included in other loans and advances (table F.216).(2) Total bank credit (line 5) less security credit (line 22) less corporate equities (line 23) less mutual fund shares (line 24) plus customers’ liability on acceptances (line 25).
26 Z.1, December 7, 2001
F.111 Foreign Banking Offices in U.S. (1)Billions of dollars; quarterly figures are seasonally adjusted annual rates
1997 1998 1999 2000 2000 2001 Q1 Q2 Q3 Q4 Q1 Q2 Q3
1 Gross saving 5.7 6.6 7.2 7.7 7.5 7.7 7.8 8.0 8.1 8.5 8.7 1
2 Fixed nonresidential investment 4.6 5.7 6.1 6.8 6.6 6.8 6.9 6.9 6.8 6.6 6.4 2
3 Net acquisition of financial assets 96.5 -4.8 -50.4 29.8 -150.3 109.3 60.2 100.1 -119.4 26.7 -67.6 3
4 Reserves at Federal Reserve 1.8 -1.9 0.4 -1.0 -3.9 0.6 -0.7 0.2 0.3 -0.4 0.7 4
5 Total bank credit 60.2 1.4 -28.9 67.3 52.7 18.9 74.3 123.3 85.4 -141.4 -44.8 5
6 U.S. government securities 26.8 -5.5 11.8 0.0 -24.7 -25.4 32.1 18.2 37.9 -61.0 39.9 6 7 Treasury 14.4 -10.3 7.5 -0.6 -21.5 -21.5 29.9 10.7 24.5 26.0 16.4 7 8 Agency 12.5 4.8 4.3 0.6 -3.1 -4.0 2.2 7.5 13.4 -87.0 23.6 8 9 Municipal securities 0.0 0.0 0.0 0.0 0.0 0.0 0.0 0.0 0.0 0.0 0.0 910 Corporate and foreign bonds 3.1 5.8 -5.2 7.6 4.4 -0.0 2.5 23.6 -14.7 94.2 -17.9 10
11 Total loans 30.3 1.1 -35.5 59.7 73.0 44.3 39.7 81.6 62.2 -174.5 -66.9 1112 Open market paper -0.2 -0.1 0.4 -0.1 0.5 0.1 -0.4 -0.5 0.1 0.0 0.0 1213 Bank loans n.e.c. 19.2 -1.9 -22.3 15.8 21.6 1.0 0.3 40.1 18.2 -78.8 -8.2 1314 Mortgages -6.1 -5.5 -4.2 0.7 2.5 2.2 -0.9 -0.9 0.1 -1.5 4.6 1415 Security credit 17.5 8.6 -9.4 43.2 48.4 41.0 40.7 42.9 43.8 -94.3 -63.2 15
16 Corporate equities -0.0 0.0 0.0 0.0 0.0 0.0 0.0 0.0 0.0 0.0 0.0 16
17 Customers’ liab. on acceptances (2) -2.5 -4.7 -0.6 -0.0 0.2 -0.2 -0.8 0.7 -0.4 -1.5 -1.8 1718 Miscellaneous assets 37.0 0.4 -21.3 -36.5 -199.2 90.0 -12.7 -24.1 -204.8 169.9 -21.6 18
19 Net increase in liabilities 98.9 -2.0 -47.2 33.4 -146.9 112.8 63.8 103.8 -115.6 30.6 -63.5 19
20 Net interbank liabilities -30.4 -55.4 -41.2 -41.6 -125.2 -23.9 -96.3 79.1 -122.5 26.7 22.8 2021 To foreign banks -17.6 -51.7 -48.6 -58.5 -118.8 -22.3 -79.4 -13.7 -90.6 -54.4 48.1 2122 To domestic banks -12.7 -3.7 7.4 17.0 -6.4 -1.6 -16.9 92.8 -31.9 81.0 -25.3 22
23 Checkable deposits 0.8 -0.2 0.4 -0.3 -3.2 4.2 -5.0 2.8 -2.1 0.0 2.1 2324 Small time and savings deposits 4.4 -3.6 -1.9 1.4 -1.3 1.8 -4.7 10.0 -5.2 23.2 -16.6 2425 Large time deposits 44.7 36.5 56.7 5.6 36.7 -57.6 46.6 -3.4 70.6 -10.2 -35.0 25
26 Federal funds and security RPs (net) 25.6 19.7 -18.3 52.4 7.6 59.3 92.8 49.8 22.1 -120.7 -18.1 2627 Acceptance liabilities -2.4 -4.8 -0.4 -0.0 -0.2 -0.3 -0.4 0.7 -0.8 -2.4 -1.3 27
28 Miscellaneous liabilities 56.2 5.7 -42.5 15.9 -61.3 129.2 30.8 -35.3 -77.7 113.8 -17.6 2829 Foreign direct investment in U.S. 7.7 5.5 19.1 9.6 20.4 1.9 3.3 12.7 1.2 15.6 8.7 2930 Due to affiliates 14.3 11.8 2.5 45.6 86.1 -0.1 21.5 75.0 14.6 -20.2 -94.9 3031 Other 34.2 -11.5 -64.1 -39.4 -167.8 127.3 6.0 -123.0 -93.5 118.5 68.7 31
32 Discrepancy 3.5 3.7 4.2 4.5 4.3 4.4 4.6 4.8 5.1 5.8 6.3 32
Memo:
33 Credit market funds advanced (3) 40.2 -11.9 -20.1 24.0 4.5 -22.3 32.8 81.1 41.3 -48.6 16.5 33
(1) Branches and agencies of foreign banks, Edge Act and Agreement corporations, New York investment companies (through 1996:Q2), and American Express Bank.(2) Included in other loans and advances (table F.216).(3) Total bank credit (line 5) less security credit (line 15) less corporate equities (line 16) plus customers’ liability on acceptances (line 17).

Z.1, December 7, 2001 27
F.112 Bank Holding CompaniesBillions of dollars; quarterly figures are seasonally adjusted annual rates
1997 1998 1999 2000 2000 2001 Q1 Q2 Q3 Q4 Q1 Q2 Q3
1 Gross saving 37.2 34.2 49.9 46.5 51.0 47.1 42.0 45.7 57.8 49.5 44.3 1
2 Fixed nonresidential investment 0.3 0.3 0.3 0.3 0.3 0.3 0.3 0.3 0.3 0.3 0.3 2
3 Net acquisition of financial assets 64.5 110.6 55.1 124.6 148.2 70.4 150.8 129.2 123.0 79.2 138.1 3
4 Credit market instruments 5.4 -0.9 6.2 -12.2 -42.2 3.5 -6.7 -3.2 7.3 -2.8 -1.4 4
5 U.S. government securities 0.5 -1.9 6.6 -8.5 -33.8 1.5 0.6 -2.1 2.1 -0.7 -0.6 5 6 Treasury -0.1 -3.1 7.9 -7.9 -31.4 0.6 0.1 -1.1 -0.3 0.7 -0.3 6 7 Agency 0.6 1.1 -1.3 -0.5 -2.4 0.9 0.4 -1.1 2.4 -1.4 -0.3 7 8 Corporate and foreign bonds 5.0 -0.7 1.2 -2.8 -5.5 -6.6 1.7 -0.6 0.8 -1.8 -0.7 8 9 Bank loans n.e.c. -0.0 1.7 -1.6 -0.9 -2.9 8.6 -9.0 -0.5 4.3 -0.2 -0.1 9
10 Miscellaneous assets 59.0 111.6 48.9 136.8 190.4 67.0 157.5 132.4 115.7 82.0 139.5 1011 Investment in bank subsidiaries 40.7 55.3 2.9 53.6 80.8 35.9 54.9 42.7 65.5 41.5 102.4 1112 Investment in nonbank subsidiaries 25.0 44.1 17.2 62.3 132.8 2.2 56.0 58.3 55.3 38.5 14.8 1213 Other -6.7 12.1 28.9 20.9 -23.2 28.8 46.6 31.4 -5.2 2.0 22.3 13
14 Net increase in liabilities 27.4 76.6 5.3 78.3 97.3 23.4 108.9 83.6 65.3 29.9 93.9 14
15 Net interbank liabilities 0.3 10.2 4.0 30.1 125.3 -2.9 -26.0 24.1 -115.4 -50.6 27.6 1516 To domestic banks -0.4 9.6 8.2 12.9 43.3 5.0 -14.1 17.5 -159.7 -62.8 -8.5 1617 To foreign banks 0.8 0.6 -4.3 17.2 82.0 -7.9 -12.0 6.6 44.3 12.3 36.1 17
18 Federal funds and security RPs (net) 0.0 0.5 0.1 -1.6 0.8 1.8 -0.4 -8.7 7.0 0.5 0.7 18
19 Credit market instruments 19.0 24.9 25.8 23.2 8.3 31.7 30.3 22.7 96.1 9.9 19.1 1920 Commercial paper 6.0 7.8 9.1 1.2 -14.9 6.7 6.8 6.3 30.5 -2.8 -0.9 2021 Corporate bonds 13.0 17.1 16.7 22.0 23.2 25.0 23.5 16.3 65.6 12.7 20.1 21
22 Corporate equity issues -30.9 -15.0 -13.8 -16.5 -28.3 -18.1 -6.7 -13.1 -11.4 -13.3 -22.4 2223 Miscellaneous liabilities 39.0 56.0 -10.8 43.1 -8.9 10.9 111.8 58.7 88.9 83.4 68.9 2324 Equity, etc. -13.1 24.7 -38.6 10.3 -0.4 -19.9 27.7 33.7 35.1 -8.5 24.2 2425 Other 52.1 31.2 27.8 32.8 -8.5 30.7 84.1 25.0 53.8 91.9 44.7 25
26 Discrepancy -0.2 -0.2 -0.2 -0.2 -0.2 -0.2 -0.2 -0.2 -0.2 -0.2 -0.2 26
F.113 Banks in U.S.-Affiliated Areas (1)Billions of dollars; quarterly figures are seasonally adjusted annual rates
1 Gross saving 0.2 0.2 0.2 0.2 0.2 0.2 0.2 0.2 0.2 0.2 0.2 1
2 Fixed nonresidential investment 0.2 0.3 0.3 0.3 0.3 0.3 0.3 0.3 0.3 0.3 0.3 2
3 Net acquisition of financial assets 5.5 9.8 3.7 4.0 2.7 7.6 11.4 -5.5 -1.1 21.2 -4.3 3
4 Checkable deposits and currency -0.1 0.6 0.3 -0.5 -1.3 0.6 -2.6 1.2 0.6 -0.6 3.2 4
5 Credit market instruments 3.7 6.0 4.4 6.7 5.4 5.4 12.3 3.8 -3.6 5.6 4.2 5
6 U.S. government securities 2.1 3.2 2.6 3.3 -0.4 1.1 6.7 5.7 -8.3 -0.7 3.4 6 7 Treasury 0.1 -0.7 -0.7 -1.0 -1.2 -0.5 -0.6 -1.7 -2.6 -1.0 2.0 7 8 Agency 2.0 3.9 3.3 4.3 0.8 1.6 7.3 7.4 -5.7 0.3 1.3 8 9 Municipal securities -0.0 -0.1 0.1 0.1 0.5 -0.0 0.0 0.1 -1.4 -0.0 -0.1 910 Corporate and foreign bonds 0.1 0.5 -0.5 0.3 -0.4 0.0 1.3 0.3 3.0 -0.9 0.5 10
11 Bank loans n.e.c. 0.9 0.9 0.5 1.1 3.8 0.8 1.6 -1.7 0.5 2.1 -0.2 1112 Home mortgages 0.1 1.1 0.6 1.0 1.4 2.2 1.5 -1.0 -8.1 2.1 0.2 1213 Commercial mortgages 0.5 0.4 1.2 0.8 0.4 1.3 1.1 0.4 10.6 3.0 0.4 13
14 Miscellaneous assets 1.8 3.1 -1.0 -2.1 -1.4 1.6 1.7 -10.5 1.9 16.2 -11.7 14
15 Net increase in liabilities 5.1 9.4 3.8 3.4 2.2 7.2 10.8 -6.6 -2.3 20.7 -5.6 15
16 Checkable deposits 0.4 1.2 0.0 -0.1 -1.4 0.0 -0.3 1.2 -0.1 2.2 -0.8 1617 Small time and savings deposits -0.0 1.0 0.8 1.4 0.4 2.5 2.3 0.5 -0.6 5.4 1.4 1718 Large time deposits -0.0 1.0 0.8 1.4 0.4 2.5 2.3 0.5 -0.6 5.4 1.4 18
19 Miscellaneous liabilities 4.7 6.3 2.2 0.7 2.8 2.3 6.5 -8.8 -1.0 7.6 -7.7 19
20 Discrepancy -0.4 -0.4 0.1 -0.7 -0.6 -0.5 -0.7 -1.1 -1.2 -0.6 -1.5 20
(1) Commercial banks and branches of U.S.-chartered commercial banks located in Puerto Rico, the U.S. Virgin Islands, American Samoa, Guam, and other U.S.-affiliated insular areas.
28 Z.1, December 7, 2001
F.114 Savings Institutions (1)Billions of dollars; quarterly figures are seasonally adjusted annual rates
1997 1998 1999 2000 2000 2001 Q1 Q2 Q3 Q4 Q1 Q2 Q3
1 Gross saving 2.9 4.2 7.3 9.1 8.8 9.3 9.2 9.3 9.4 9.6 9.9 1
2 Fixed nonresidential investment 3.8 4.1 4.4 4.8 4.7 4.8 4.9 4.9 4.9 4.2 4.1 2
3 Net acquisition of financial assets -8.4 60.8 63.0 67.2 42.9 82.6 82.4 60.9 156.7 72.6 50.5 3
4 Reserves at Federal Reserve -0.5 0.1 0.1 -1.0 -1.8 0.1 -1.9 -0.5 0.0 0.0 0.9 4 5 Checkable deposits and currency 1.0 3.2 1.7 -0.4 -15.3 4.7 -0.1 9.0 -0.2 8.2 0.5 5 6 Time and savings deposits -0.4 0.5 -0.1 0.1 2.4 -2.4 -0.8 1.2 1.2 2.7 -0.7 6 7 Federal funds and security RPs -0.8 5.5 -4.2 4.3 3.7 2.0 10.7 0.7 27.1 1.3 15.2 7
8 Credit market instruments -4.7 36.1 68.6 56.5 55.6 65.0 62.7 42.5 52.5 57.3 -6.0 8
9 Open market paper -0.3 0.0 0.0 0.0 0.0 0.0 0.0 0.0 0.0 0.0 0.0 910 U.S. government securities -3.6 -16.1 3.7 -8.1 -21.0 -12.4 -2.8 3.9 16.5 18.9 -11.0 1011 Treasury -2.8 -4.4 -0.0 -1.4 -0.8 -3.3 -1.4 -0.2 -3.0 -2.1 -3.5 1112 Agency -0.8 -11.7 3.7 -6.7 -20.2 -9.1 -1.5 4.1 19.4 21.0 -7.4 12
13 Municipal securities 0.0 0.4 0.5 0.2 0.3 -0.2 -0.0 0.6 2.9 0.3 0.3 1314 Corporate and foreign bonds -9.9 29.9 23.3 -2.5 15.0 -20.5 -13.2 8.7 -54.0 -11.1 -20.2 1415 Other loans and advances 3.1 5.3 6.5 8.7 11.2 7.8 10.1 5.7 8.2 9.6 -0.6 1516 Mortgages 3.5 12.1 24.7 55.2 60.3 82.4 62.4 15.5 75.2 40.3 10.5 1617 Consumer credit 2.5 4.4 9.9 3.0 -10.2 7.9 6.3 8.1 3.8 -0.7 14.9 17
18 Corporate equities 0.2 1.5 -0.7 0.4 1.5 -1.3 1.5 0.1 4.7 3.0 2.4 1819 Miscellaneous assets -3.2 13.8 -2.5 7.4 -3.1 14.5 10.3 8.0 71.3 -0.0 38.2 19
20 Net increase in liabilities -9.5 57.6 61.8 66.3 41.0 82.4 79.0 62.7 152.7 71.6 48.3 20
21 Deposits -25.7 -2.6 6.8 27.5 25.1 16.8 54.0 14.3 98.7 31.8 60.6 2122 Checkable 27.1 36.1 37.2 43.1 45.2 42.8 40.6 43.9 51.1 53.2 46.3 2223 Small time and savings -64.4 -54.3 -38.9 -35.5 -47.4 -35.1 -19.0 -40.7 6.7 -37.6 -30.6 2324 Large time 11.7 15.7 8.5 19.9 27.3 9.0 32.3 11.0 40.9 16.2 44.9 24
25 Security RPs -1.9 9.5 21.4 -6.1 3.2 6.0 24.6 -58.1 1.8 9.9 -59.8 25
26 Credit market instruments 19.7 52.2 48.0 27.3 57.5 69.0 -37.9 20.4 62.5 16.1 12.6 2627 Corporate bonds 0.1 -0.2 0.2 3.5 -0.0 0.0 2.6 11.5 -14.0 14.5 -1.2 2728 Bank loans n.e.c. 3.5 10.3 -15.7 7.4 25.4 3.5 -1.9 2.7 4.6 -3.8 6.7 2829 Other loans and advances 16.2 42.1 63.5 16.3 32.1 65.5 -38.6 6.3 71.9 5.4 7.2 29
30 Taxes payable 0.4 0.2 0.0 0.4 -1.4 0.3 1.5 1.3 -0.7 -0.9 0.1 3031 Miscellaneous liabilities -2.1 -1.6 -14.4 17.1 -43.5 -9.6 36.8 84.8 -9.5 14.7 34.8 3132 Investment by parent 0.3 0.4 0.5 0.7 0.6 0.6 0.7 0.7 0.7 0.8 0.8 3233 Other -2.4 -2.1 -15.0 16.5 -44.1 -10.2 36.1 84.1 -10.3 14.0 34.0 33
34 Discrepancy -1.9 -3.0 1.7 3.4 2.1 4.2 0.9 6.2 0.6 4.4 3.5 34
(1) Savings and loan associations, mutual savings banks, and federal savings banks.

Z.1, December 7, 2001 29
F.115 Credit UnionsBillions of dollars; quarterly figures are seasonally adjusted annual rates
1997 1998 1999 2000 2000 2001 Q1 Q2 Q3 Q4 Q1 Q2 Q3
1 Gross saving 5.2 5.4 5.9 6.7 6.4 6.6 6.9 7.0 6.4 6.7 6.4 1
2 Fixed nonresidential investment 2.2 2.6 2.8 3.1 3.0 3.1 3.1 3.1 3.1 2.9 2.8 2
3 Net acquisition of financial assets 23.7 37.7 23.0 26.5 28.3 7.5 40.9 29.5 73.8 59.5 79.8 3
4 Checkable deposits and currency 0.6 1.0 17.3 -14.2 1.1 0.9 -28.7 -30.2 12.7 25.5 22.4 4 5 Time and savings deposits 0.6 6.4 -6.8 0.5 2.6 -8.7 -0.7 8.6 8.8 -7.8 5.0 5 6 Federal funds and security RPs 2.0 3.4 2.4 -5.3 -11.4 -18.9 31.8 -22.7 16.0 -1.5 10.4 6
7 Credit market instruments 16.8 19.0 27.5 30.5 35.7 31.6 21.2 33.6 23.2 7.6 61.7 7
8 Open market paper -0.1 0.2 1.5 -0.6 -4.1 -2.0 3.6 -0.0 -0.4 1.8 -1.1 8 9 U.S. government securities -1.4 4.9 -0.6 -1.8 6.7 -3.2 -15.8 5.3 19.1 -16.7 36.2 910 Treasury -1.8 -2.5 -3.5 -1.4 -1.0 -2.1 -1.0 -1.5 -1.0 -5.7 -0.5 1011 Agency 0.4 7.3 2.9 -0.4 7.7 -1.1 -14.8 6.8 20.1 -11.0 36.6 11
12 Home mortgages 10.1 10.9 14.1 16.4 16.2 15.8 17.2 16.3 -0.5 14.4 34.1 1213 Consumer credit 8.2 3.0 12.5 16.5 16.9 20.9 16.2 12.0 5.0 8.0 -7.5 13
14 Mutual fund shares -0.2 1.2 -1.1 -0.3 2.7 -3.8 -0.2 0.0 -0.9 6.4 -1.9 1415 Miscellaneous assets 3.8 6.8 -16.3 15.4 -2.4 6.3 17.5 40.1 14.0 29.4 -17.8 15
16 Net increase in liabilities 20.5 34.7 20.8 22.0 23.6 4.9 35.7 23.8 69.1 56.6 76.1 16
17 Shares/deposits 20.3 33.6 17.7 22.4 28.1 0.7 30.3 30.6 77.1 44.9 78.1 1718 Checkable 4.1 6.4 2.3 5.9 23.7 -3.5 1.9 1.4 15.8 -4.0 5.5 1819 Small time and savings 13.2 23.1 12.3 13.0 6.4 -1.6 30.5 16.7 59.4 34.0 61.8 1920 Large time 2.9 4.1 3.1 3.5 -2.0 5.7 -2.0 12.4 2.0 14.9 10.8 20
21 Other loans and advances 0.1 0.6 2.2 0.0 -2.9 0.9 1.1 1.0 -0.6 0.8 1.5 2122 Miscellaneous liabilities 0.1 0.5 0.9 -0.4 -1.5 3.3 4.3 -7.8 -7.4 10.8 -3.5 22
23 Discrepancy -0.2 -0.2 0.8 -0.9 -1.3 1.0 -1.5 -1.8 -1.4 0.9 -0.2 23
F.116 Bank Personal Trusts and Estates (1)Billions of dollars; quarterly figures are seasonally adjusted annual rates
1 Net acquisition of financial assets -44.7 -41.6 -8.2 -30.6 -29.5 -34.3 -30.0 -28.7 -26.6 -23.0 -28.3 1
2 Deposits -2.9 6.2 8.4 4.3 4.2 5.2 3.2 4.6 3.8 4.2 4.1 2 3 Checkable deposits and currency 0.0 -0.5 -0.1 -0.0 -0.0 -0.0 -0.0 -0.0 -0.0 -0.0 -0.0 3 4 Time and savings deposits 1.0 -2.1 0.9 0.6 1.0 0.8 0.4 0.3 0.5 0.3 0.4 4 5 Money market fund shares -4.0 8.8 7.5 3.7 3.2 4.4 2.8 4.3 3.4 4.0 3.8 5
6 Credit market instruments -25.0 -12.8 27.8 17.1 18.9 13.8 17.6 18.1 10.7 13.4 8.8 6
7 Open market paper -0.2 -4.5 0.6 0.6 0.7 0.4 0.8 0.5 -4.2 -3.7 -3.4 7 8 U.S. government securities -10.1 -4.4 5.7 3.8 3.2 3.4 4.2 4.5 1.9 2.7 0.8 8 9 Treasury -5.4 -3.1 -0.0 -0.8 -0.9 -0.9 -0.7 -0.7 -1.4 -1.2 -1.8 910 Agency -4.7 -1.4 5.7 4.6 4.0 4.3 4.9 5.2 3.3 3.9 2.5 10
11 Municipal securities -13.3 -1.1 10.8 4.7 7.2 3.6 5.2 3.0 3.1 2.0 1.4 1112 Corporate and foreign bonds -0.8 -2.6 11.3 8.1 8.0 6.6 7.6 10.2 10.1 12.4 10.0 1213 Mortgages -0.6 -0.2 -0.6 -0.1 -0.1 -0.2 -0.2 -0.1 -0.1 -0.0 -0.1 13
14 Corporate equities -0.5 -70.4 -40.4 -20.0 -20.0 -20.0 -20.0 -20.0 -20.0 -20.0 -20.0 1415 Mutual fund shares -14.9 27.0 -1.5 -30.5 -30.5 -30.5 -30.5 -30.5 -20.0 -20.0 -20.0 15
16 Miscellaneous assets -1.4 8.4 -2.5 -1.5 -2.1 -2.8 -0.2 -0.9 -1.1 -0.7 -1.2 16
17 Net increase in liabilities (2) -49.9 -41.8 -6.5 -29.7 -28.4 -33.1 -29.2 -28.0 -26.1 -22.7 -28.2 17
18 Discrepancy -5.3 -0.2 1.7 0.9 1.1 1.2 0.8 0.7 0.5 0.3 0.1 18
(1) Includes personal trusts and estates administered by nondeposit noninsured trust companies.(2) Equal to the net acquisition of tangible and financial assets. These liabilities are assets of the household sector.

30 Z.1, December 7, 2001
F.117 Life Insurance CompaniesBillions of dollars; quarterly figures are seasonally adjusted annual rates
1997 1998 1999 2000 2000 2001 Q1 Q2 Q3 Q4 Q1 Q2 Q3
1 Gross saving -5.9 -7.5 0.2 1.3 0.8 1.5 1.4 1.3 1.3 1.2 0.5 1
2 Fixed nonresidential investment 11.4 12.1 13.0 14.3 13.9 14.3 14.5 14.5 14.4 13.2 12.8 2
3 Net acquisition of financial assets 213.7 187.0 169.3 203.5 218.3 210.6 230.3 154.8 259.7 227.0 282.3 3
4 Checkable deposits and currency 3.8 -2.7 0.0 -0.5 -5.6 6.4 -7.9 5.2 51.5 22.5 4.4 4 5 Money market fund shares 32.6 17.6 23.4 8.5 5.3 -5.7 11.8 22.6 89.5 88.2 24.5 5
6 Credit market instruments 104.8 76.9 53.5 57.9 65.0 52.9 74.8 38.8 95.3 124.9 162.4 6
7 Open market paper 17.5 7.5 2.0 -4.5 -15.1 12.2 -3.1 -12.2 -41.1 -0.2 18.6 7 8 U.S. government securities -1.4 -23.7 -2.3 6.3 10.5 2.3 8.7 3.9 15.6 -0.5 16.1 8 9 Treasury 1.6 -14.1 -9.3 -4.6 -4.0 -5.0 -4.1 -5.4 -17.3 -20.2 -18.0 910 Agency -3.0 -9.6 7.0 11.0 14.6 7.3 12.8 9.3 32.9 19.7 34.2 10
11 Municipal securities 0.1 1.7 1.7 -1.0 -0.5 -1.4 -0.9 -1.2 1.6 3.4 1.5 1112 Corporate and foreign bonds 86.8 84.5 41.5 49.0 76.9 23.1 55.8 40.2 118.8 113.1 118.9 1213 Policy loans 3.2 0.1 -5.0 2.9 -1.3 3.6 5.8 3.2 4.0 0.6 4.3 1314 Mortgages -1.3 6.8 15.7 5.2 -5.7 13.0 8.5 4.8 -3.6 8.4 3.1 14
15 Corporate equities 86.3 115.3 111.9 105.9 126.4 127.1 97.7 72.5 93.6 64.0 74.7 1516 Mutual fund shares -7.2 -23.4 15.0 11.0 12.0 12.4 10.1 9.6 2.0 2.0 2.0 16
17 Miscellaneous assets -6.7 3.5 -34.6 20.7 15.2 17.6 43.8 6.2 -72.2 -74.6 14.3 17
18 Net increase in liabilities 186.0 173.1 152.9 195.1 188.9 209.5 210.6 171.4 189.5 215.1 275.6 18
19 Corporate equity issues -4.0 -4.7 -6.0 -0.8 -6.2 12.9 -4.9 -4.8 -6.8 -5.0 -4.4 1920 Other loans and advances 0.2 0.7 0.7 -0.7 -0.7 -1.1 -0.3 -0.7 -2.4 0.1 3.5 2021 Life insurance reserves 57.6 46.7 49.4 48.7 53.7 43.0 52.7 45.5 52.0 50.8 56.5 2122 Pension fund reserves (1) 95.0 86.4 70.7 121.8 104.2 132.3 132.1 118.6 94.3 77.0 119.0 22
23 Taxes payable 1.2 1.2 1.3 1.6 1.4 1.6 1.6 1.8 1.8 1.9 2.0 2324 Miscellaneous liabilities 36.0 42.8 36.8 24.5 36.5 20.9 29.5 11.0 50.6 90.3 99.0 24
25 Discrepancy -45.0 -33.6 -29.2 -21.4 -42.4 -13.9 -32.8 3.4 -83.3 -23.9 -19.1 25
(1) Annuity reserves held by life insurance companies, excluding unallocated contracts held by private pension funds, which are included in miscellaneous liabilities (line 24).
F.118 Other Insurance CompaniesBillions of dollars; quarterly figures are seasonally adjusted annual rates
1 Gross saving 0.9 3.5 3.0 4.6 3.9 4.6 5.7 4.3 4.5 -8.1 -34.5 1
2 Fixed nonresidential investment 9.3 10.8 11.8 12.9 12.6 13.0 13.1 13.1 12.8 11.2 10.8 2
3 Net acquisition of financial assets 37.1 16.5 -12.6 10.0 16.2 -14.7 8.5 29.9 13.3 19.2 48.6 3
4 Checkable deposits and currency 0.3 -0.2 0.2 -0.6 -4.5 -1.7 1.4 2.4 27.5 4.8 5.5 4 5 Security RPs -0.2 7.4 -14.4 10.0 26.1 1.9 2.0 10.0 -42.0 -4.6 17.3 5
6 Credit market instruments 25.2 5.8 -3.0 -8.7 -11.2 -18.1 6.2 -11.7 2.1 0.1 9.0 6
7 U.S. government securities 3.8 -21.9 -3.9 0.0 -1.4 -1.8 4.1 -0.8 -11.5 -2.0 -1.7 7 8 Treasury 2.1 -20.8 -9.7 -8.6 -9.2 -9.3 -6.9 -8.8 -15.8 -8.0 -7.2 8 9 Agency 1.7 -1.2 5.9 8.6 7.9 7.5 10.9 7.9 4.3 6.0 5.5 9
10 Municipal securities 2.6 16.5 -9.1 -14.9 -17.0 -17.5 -9.1 -15.9 4.7 -2.0 1.3 1011 Corporate and foreign bonds 18.9 11.6 10.0 6.4 4.7 4.0 11.9 5.2 8.8 4.0 9.4 1112 Commercial mortgages -0.2 -0.3 -0.0 -0.3 2.5 -2.8 -0.7 -0.2 0.0 0.1 0.1 12
13 Corporate equities 3.0 -5.0 -1.7 0.7 -9.3 -11.8 -16.4 40.4 6.0 2.9 6.0 1314 Trade receivables 2.7 1.6 2.0 1.0 10.0 4.5 6.1 -16.5 12.1 14.4 10.4 1415 Miscellaneous assets 6.1 6.9 4.2 7.5 5.2 10.5 9.2 5.3 7.6 1.6 0.4 15
16 Net increase in liabilities -1.2 2.9 6.7 3.7 -3.7 20.8 19.3 -21.7 15.1 23.6 67.6 16
17 Corporate equity issues -13.7 -4.7 -7.8 -4.5 -13.1 -1.5 -1.0 -2.4 -1.8 -2.2 -2.4 1718 Taxes payable 1.8 2.0 2.0 2.3 2.0 2.2 2.3 2.5 2.6 2.7 2.8 1819 Miscellaneous liabilities 10.7 5.6 12.4 5.9 7.4 20.1 17.9 -21.8 14.4 23.1 67.3 19
20 Discrepancy -46.7 -21.0 10.5 -14.6 -28.5 27.2 3.3 -60.3 -6.5 -14.8 -26.3 20

Z.1, December 7, 2001 31
F.119 Private Pension Funds (1)Billions of dollars; quarterly figures are seasonally adjusted annual rates
1997 1998 1999 2000 2000 2001 Q1 Q2 Q3 Q4 Q1 Q2 Q3
1 Gross saving 0.6 0.7 0.8 0.8 0.8 0.8 0.9 0.9 0.9 0.9 1.0 1
2 Fixed nonresidential investment 1.5 1.9 1.9 2.1 2.0 2.1 2.2 2.2 2.3 2.3 2.3 2
3 Net acquisition of financial assets -11.4 11.8 11.6 17.6 1.7 21.3 13.5 34.1 21.6 19.4 9.1 3
4 Checkable deposits and currency 1.3 0.2 1.2 0.7 0.5 0.5 1.3 0.4 1.0 1.9 0.9 4 5 Time and savings deposits 7.5 1.5 -4.0 2.0 -0.7 5.4 -0.8 4.0 -3.9 -1.2 -4.4 5 6 Money market fund shares 13.1 1.9 11.7 5.9 1.8 0.3 12.1 9.4 9.7 10.0 10.3 6 7 Security RPs 0.9 1.0 0.4 0.9 0.5 0.5 1.3 1.3 -3.6 1.3 1.4 7
8 Credit market instruments 47.6 56.4 45.0 41.3 46.8 24.7 64.9 28.7 26.1 -7.1 -0.9 8
9 Open market paper 1.2 2.9 3.7 -1.8 -7.6 0.4 1.2 -1.2 -13.2 -5.5 3.4 910 U.S. government securities 11.8 34.6 30.0 26.9 39.2 12.7 36.8 18.8 3.1 -33.4 -16.5 1011 Treasury 4.1 -4.4 -0.6 -0.8 -3.1 7.3 0.3 -7.7 -26.2 -14.7 -19.1 1112 Agency 7.7 39.0 30.6 27.7 42.3 5.4 36.6 26.5 29.3 -18.7 2.6 12
13 Corporate and foreign bonds 33.8 17.1 9.3 14.5 13.2 10.2 25.1 9.6 34.7 30.7 11.7 1314 Mortgages 0.7 1.9 1.9 1.7 2.1 1.4 1.7 1.4 1.5 1.0 0.5 14
15 Corporate equities -137.8 -113.0 -92.2 -81.8 -106.2 -62.4 -114.4 -44.2 -40.5 -23.8 -56.4 1516 Mutual fund shares 42.7 31.7 30.7 32.4 43.7 34.8 26.6 24.5 26.8 13.8 26.6 16
17 Miscellaneous assets 13.5 32.0 18.9 16.3 15.3 17.5 22.5 10.0 6.0 24.4 31.6 1718 Unallocated insurance contracts (2) -1.0 21.4 13.4 9.1 9.4 7.2 14.8 4.9 3.2 15.5 30.6 1819 Contributions receivable 7.1 1.9 1.0 1.0 1.0 1.0 1.0 1.0 1.0 1.0 1.0 1920 Other 7.4 8.7 4.5 6.2 4.9 9.3 6.7 4.1 1.8 7.9 -0.0 20
21 Pension fund reserves (liabilities) (3) -10.4 13.0 12.7 18.9 2.9 22.6 14.8 35.4 23.1 20.8 10.5 21
(1) Private defined benefit plans and defined contribution plans (including 401(k) type plans). Also includes the Federal Employees Retirement System Thrift Savings Plan.(2) Assets of private pension plans held at life insurance companies (e.g., GICs, variable annuities); series begins 1985:Q4.(3) Equal to the net acquisition of tangible and financial assets less gross saving (line 2 + line 3 - line 1). These liabilities are assets of the household sector.
F.120 State and Local Government Employee Retirement FundsBillions of dollars; quarterly figures are seasonally adjusted annual rates
1 Gross saving 0.6 0.7 0.7 0.8 0.8 0.8 0.8 0.8 0.8 1.0 1.0 1
2 Fixed nonresidential investment 1.5 1.8 1.8 2.0 1.9 1.9 2.0 2.1 2.2 2.5 2.4 2
3 Net acquisition of financial assets 75.6 60.4 58.8 53.1 60.7 65.4 42.8 43.4 19.3 25.0 30.4 3
4 Checkable deposits and currency -2.2 4.7 -0.7 -0.1 7.4 5.5 -1.7 -11.7 -7.6 18.7 2.4 4 5 Time and savings deposits 0.1 -0.4 -0.3 -0.6 2.9 1.3 6.9 -13.5 -1.0 1.2 1.5 5 6 Security RPs 0.4 8.9 2.8 4.3 20.1 5.8 -6.8 -1.8 -8.7 17.2 4.7 6
7 Credit market instruments 67.1 72.1 46.9 54.6 63.3 31.5 37.6 86.1 -70.7 53.4 18.5 7
8 Open market paper 0.4 8.9 2.8 4.3 20.1 5.8 -6.8 -1.8 -8.7 17.2 4.7 8 9 U.S. government securities 31.8 19.9 16.4 22.1 -18.2 56.2 7.5 42.9 -29.0 27.4 -8.6 910 Treasury 13.4 0.8 -6.6 -15.5 -0.3 -2.5 -39.2 -19.8 -1.5 7.0 -20.3 1011 Agency 18.4 19.1 22.9 37.6 -17.9 58.7 46.8 62.7 -27.5 20.4 11.7 11
12 Municipal securities 0.9 1.7 -0.2 -1.5 -0.5 -0.4 -2.5 -2.3 0.7 -0.7 0.0 1213 Corporate and foreign bonds 33.1 35.1 30.4 29.7 61.1 -27.2 37.5 47.3 -36.2 6.9 18.6 1314 Mortgages 0.9 6.5 -2.6 -0.0 0.9 -2.9 1.9 0.1 2.5 2.6 3.7 14
15 Corporate equities 9.4 -28.2 -6.2 -18.4 -27.9 8.0 -3.8 -49.9 55.8 -67.8 -6.0 1516 Miscellaneous assets 0.7 3.3 16.3 13.3 -5.0 13.3 10.6 34.3 51.4 2.3 9.3 16
17 Pension fund reserves (liabilities) (1) 76.5 61.5 59.8 54.2 61.8 66.5 44.0 44.7 20.7 26.5 31.8 17
(1) Equal to the net acquisition of tangible and financial assets less gross saving (line 2 + line 3 - line 1). These liabilities are assets of the household sector.

32 Z.1, December 7, 2001
F.121 Money Market Mutual Funds (1)Billions of dollars; quarterly figures are seasonally adjusted annual rates
1997 1998 1999 2000 2000 2001 Q1 Q2 Q3 Q4 Q1 Q2 Q3
1 Net acquisition of financial assets 155.9 287.2 249.1 233.3 239.7 71.5 250.9 371.1 621.4 322.5 367.7 1
2 Foreign deposits 0.1 7.4 12.2 48.2 54.1 68.3 8.0 62.5 87.1 -10.1 0.8 2 3 Checkable deposits and currency 2.6 -2.6 -1.2 4.5 -3.2 -2.4 14.7 8.8 -24.4 4.2 -27.4 3 4 Time and savings deposits 28.6 15.7 33.3 -23.8 -10.8 -130.3 16.9 29.0 147.1 -7.3 44.7 4 5 Security RPs 22.8 12.9 0.1 43.4 55.1 31.9 16.6 69.9 71.5 -5.6 60.7 5
6 Credit market instruments 87.5 244.0 182.0 148.9 161.5 -118.2 256.1 296.0 303.4 166.2 379.1 6
7 Open market paper 62.1 78.2 104.7 95.5 131.5 -13.0 134.2 129.1 3.3 17.1 79.9 7 8 U.S. government securities -9.5 95.0 17.3 -19.1 -80.4 -93.3 15.1 82.3 286.8 116.6 265.8 8 9 Treasury -4.0 17.5 0.1 -13.3 -7.5 -34.8 -0.1 -10.9 35.5 37.0 68.9 910 Agency -5.5 77.5 17.1 -5.8 -72.9 -58.5 15.2 93.2 251.3 79.7 196.8 10
11 Municipal securities 22.5 26.0 17.5 34.3 30.8 24.2 29.8 52.6 14.3 39.2 54.4 1112 Corporate and foreign bonds 12.5 44.8 42.5 38.2 79.7 -36.1 77.0 32.1 -1.1 -6.8 -20.9 12
13 Miscellaneous assets 14.3 9.6 22.6 12.2 -17.1 222.3 -61.4 -95.2 36.7 175.1 -90.1 13
14 Net share issues (liabilities) 155.9 287.2 249.1 233.3 239.7 71.5 250.9 371.1 621.4 322.5 367.7 14
(1) Open-end investment companies; excludes funding vehicles for variable annuities, which are included in the life insurance companies sector (table F.117).
F.122 Mutual Funds (1)Billions of dollars; quarterly figures are seasonally adjusted annual rates
1 Gross saving 8.0 -8.4 6.9 1.7 7.6 0.5 0.2 -1.6 -2.8 -2.2 -2.4 1
2 Net acquisition of financial assets 265.1 274.6 188.3 243.9 307.3 232.0 279.4 156.7 96.4 268.0 169.8 2
3 Security RPs 10.3 10.4 8.5 26.7 2.6 60.6 39.6 3.8 -67.0 -28.0 -41.0 3
4 Credit market instruments 80.9 124.8 47.2 26.8 -66.9 63.1 50.1 60.8 69.4 165.1 123.9 4
5 Open market paper 10.6 10.4 8.5 26.7 13.2 43.2 31.3 19.0 -53.5 -61.7 -34.9 5 6 U.S. government securities 19.5 26.1 12.5 10.3 -32.8 29.1 7.7 37.3 43.1 148.2 101.8 6 7 Treasury 11.0 5.2 -6.8 -9.2 -28.4 -5.6 -10.3 7.6 17.7 53.4 44.7 7 8 Agency 8.4 21.0 19.3 19.5 -4.4 34.7 17.9 29.7 25.4 94.8 57.1 8
9 Municipal securities 6.5 22.8 -3.2 -8.9 -28.3 -17.9 2.0 8.5 22.0 16.6 23.6 910 Corporate and foreign bonds 44.4 65.5 29.3 -1.3 -19.0 8.7 9.2 -4.0 57.8 62.1 33.4 10
11 Corporate equities 166.8 143.3 136.9 190.9 378.2 108.4 186.9 90.3 99.6 134.8 86.4 1112 Miscellaneous assets 7.1 -3.9 -4.3 -0.5 -6.6 -0.0 2.9 1.8 -5.6 -3.8 0.5 12
13 Net share issues (liabilities) 265.1 274.6 188.3 243.9 307.3 232.0 279.4 156.7 96.4 268.0 169.8 13
14 Discrepancy 8.0 -8.4 6.9 1.7 7.6 0.5 0.2 -1.6 -2.8 -2.2 -2.4 14
(1) Open-end investment companies; excludes funding vehicles for variable annuities, which are included in the life insurance companies sector (table F.117).
F.123 Closed-End and Exchange-Traded FundsBillions of dollars; quarterly figures are seasonally adjusted annual rates
Closed-end funds
1 Net acquisition of financial assets -7.7 -7.8 -7.5 -7.9 -7.9 -7.9 -7.9 -7.9 -7.9 -7.9 -7.9 1
2 Credit market instruments -2.6 5.5 7.4 -8.4 -8.4 -8.4 -8.4 -8.4 -8.4 -8.4 -8.4 2 3 U.S. government securities -1.2 -0.9 -1.3 -0.3 -0.3 -0.3 -0.3 -0.3 -0.3 -0.3 -0.3 3 4 Municipal securities -0.8 1.9 8.7 -4.6 -4.6 -4.6 -4.6 -4.6 -4.6 -4.6 -4.6 4 5 Corporate and foreign bonds -0.5 4.5 -0.0 -3.5 -3.5 -3.5 -3.5 -3.5 -3.5 -3.5 -3.5 5
6 Corporate equities -5.1 -13.3 -14.9 0.5 0.5 0.5 0.5 0.5 0.5 0.5 0.5 6
7 Net share issues (liabilities) -7.7 -7.8 -7.5 -7.9 -7.9 -7.9 -7.9 -7.9 -7.9 -7.9 -7.9 7
Exchange-traded funds
8 Net acquisition of financial assets (1) 3.4 6.0 12.2 42.4 2.1 46.3 14.1 107.0 57.9 11.3 27.9 8
9 Net share issues (liabilities) 3.4 6.0 12.2 42.4 2.1 46.3 14.1 107.0 57.9 11.3 27.9 9
(1) Corporate equities.

Z.1, December 7, 2001 33
F.124 Government-Sponsored Enterprises (1)Billions of dollars; quarterly figures are seasonally adjusted annual rates
1997 1998 1999 2000 2000 2001 Q1 Q2 Q3 Q4 Q1 Q2 Q3
1 Gross saving 1.9 2.1 2.0 1.7 1.7 1.7 1.9 1.7 1.8 1.8 1.8 1
2 Fixed nonresidential investment 0.3 0.4 0.4 0.4 0.4 0.4 0.4 0.4 0.5 0.5 0.5 2
3 Net acquisition of financial assets 110.8 304.4 316.7 248.8 126.8 239.2 278.9 350.3 351.6 275.6 387.9 3
4 Checkable deposits and currency 1.2 2.5 7.4 -9.7 -44.2 2.1 -0.7 4.3 -0.3 2.6 4.7 4 5 Federal funds and security RPs -4.1 -13.4 12.7 -1.7 3.4 -39.0 51.4 -22.5 60.4 -31.7 51.3 5
6 Credit market instruments 106.6 314.6 291.7 240.9 205.4 250.9 188.6 318.8 347.8 296.2 267.7 6
7 Open market paper -1.1 26.9 -27.1 16.8 17.0 -13.1 29.7 33.4 -48.9 40.5 0.6 7 8 U.S. government securities 76.1 162.3 184.5 136.2 97.3 56.4 148.0 242.8 239.3 163.4 177.7 8 9 Treasury 7.1 -0.7 5.8 -8.9 -23.2 -18.0 -6.5 12.2 4.9 0.5 -17.5 910 Agency 69.0 163.1 178.7 145.0 120.5 74.4 154.6 230.6 234.4 162.9 195.2 10
11 Municipal securities -0.4 4.1 1.4 -1.8 -5.7 -0.1 3.0 -4.5 4.7 8.3 0.3 1112 Corporate and foreign bonds 5.3 20.7 23.7 25.8 11.0 49.1 29.5 13.6 31.7 48.4 -1.3 12
13 Other loans and advances 31.2 92.3 113.6 41.3 79.0 119.9 -39.0 5.5 109.3 -0.6 64.4 1314 Sallie Mae -5.3 -1.4 5.1 -3.9 -8.8 -1.8 -11.1 6.2 2.4 4.7 3.4 1415 Farm Credit System 0.0 3.3 0.9 3.1 0.9 3.2 4.0 4.3 -0.8 5.6 3.0 1516 FHLB loans 36.4 90.4 107.6 42.1 86.9 118.5 -31.9 -5.0 107.8 -10.9 58.0 16
17 Mortgages -4.5 8.3 -4.3 22.7 6.8 38.6 17.3 28.0 11.6 36.3 26.1 1718 Home -4.2 5.3 -10.3 15.8 1.8 31.4 11.3 18.5 4.7 22.7 15.3 1819 Multifamily residential -1.2 0.8 4.8 4.9 5.2 4.6 3.3 6.6 4.1 7.5 6.9 1920 Farm 1.0 2.2 1.1 2.0 -0.2 2.6 2.7 2.9 2.8 6.1 3.9 20
21 Miscellaneous assets 7.1 0.7 5.0 19.2 -37.9 25.3 39.6 49.6 -56.3 8.5 64.3 21
22 Net increase in liabilities 106.2 298.6 312.1 241.5 122.9 233.0 270.5 339.5 344.4 270.8 386.1 22
23 Credit market instruments 98.4 278.3 318.2 234.1 104.9 248.9 278.1 304.5 262.3 268.3 328.0 2324 GSE issues (2) 98.4 278.3 318.2 234.1 104.9 248.9 278.1 304.5 262.3 268.3 328.0 2425 U.S. government loans 0.0 0.0 0.0 0.0 0.0 0.0 0.0 0.0 0.0 0.0 0.0 25
26 Miscellaneous liabilities 7.8 20.3 -6.0 7.4 18.0 -15.8 -7.6 35.0 82.1 2.5 58.1 26
27 Discrepancy -3.0 -4.1 -3.0 -6.0 -2.7 -5.0 -6.9 -9.5 -5.9 -3.5 -0.5 27
(1) Federal Home Loan Banks, Federal National Mortgage Association, Federal Home Loan Mortgage Corporation, Farm Credit System, the Financing Corporation, the Resolution Funding Corporation, and the Student Loan Marketing Association (Sallie Mae), which is a subsidiary of USA Education, Inc., a private company chartered in 1997.(2) Such issues are classified as U.S. government securities.
F.125 Federally Related Mortgage Pools (1)Billions of dollars; quarterly figures are seasonally adjusted annual rates
1 Net acquisition of financial assets 114.6 192.6 273.8 199.4 119.5 132.2 236.7 309.1 170.3 406.5 492.6 1
2 Home mortgages 109.3 182.1 264.6 190.9 113.0 124.5 228.9 297.0 157.2 387.3 479.6 2 3 Multifamily residential mortgages 5.3 10.5 9.2 8.5 6.5 7.7 7.8 12.0 13.1 19.2 13.0 3 4 Commercial mortgages -0.0 0.0 0.0 0.0 0.0 0.0 0.0 0.0 0.0 0.0 0.0 4 5 Farm mortgages -0.0 -0.0 -0.0 0.0 0.0 0.0 0.0 0.0 0.0 0.0 0.0 5
6 Net increase in pool securities (liabilities)(2) 114.6 192.6 273.8 199.4 119.5 132.2 236.7 309.1 170.3 406.5 492.6 6
(1) GNMA, FNMA, FHLMC, and Farmers Home Administration pools. Also includes federally related pools that are used as collateral for federally related agency-issued CMOs and privately issued CMOs. Excludes Federal Financing Bank holdings of pool securities, which are included with federal government mortgages and other loans.(2) Such issues are classified as U.S. government securities.

34 Z.1, December 7, 2001
F.126 Issuers of Asset-Backed Securities (ABSs)Billions of dollars; quarterly figures are seasonally adjusted annual rates
1997 1998 1999 2000 2000 2001 Q1 Q2 Q3 Q4 Q1 Q2 Q3
1 Gross saving 0.9 1.2 1.2 1.1 1.1 1.1 1.0 1.0 1.0 0.9 0.9 1
2 Fixed nonresidential investment 3.1 3.0 -1.7 -2.0 -2.4 -2.6 -1.7 -1.3 -0.8 -0.9 -0.4 2
3 Net acquisition of financial assets 200.1 319.6 226.3 199.3 178.4 149.7 158.9 310.2 297.6 174.2 304.4 3
4 Agency securities (1) 3.6 38.2 41.3 2.8 21.6 -0.7 -1.9 -7.6 39.5 -42.6 29.0 4
5 Other loans and advances 32.2 27.6 9.2 21.2 44.9 4.6 -4.5 39.9 -0.7 -23.3 64.4 5 6 Student loans 7.8 3.8 1.5 6.5 13.6 6.8 8.8 -3.3 2.5 2.0 0.8 6 7 Loans to business 24.4 23.8 7.7 14.7 31.3 -2.3 -13.2 43.2 -3.2 -25.3 63.6 7
8 Mortgages (2) 80.7 156.5 92.0 85.2 54.4 74.2 83.5 128.6 115.3 179.6 119.8 8 9 Home 54.5 94.5 49.9 44.8 34.0 33.5 51.0 60.8 93.9 63.6 44.0 910 Multifamily residential 5.0 12.8 8.5 7.3 3.4 5.4 6.9 13.5 4.9 24.9 11.3 1011 Commercial 21.3 49.2 33.6 33.1 17.1 35.3 25.7 54.3 16.5 91.1 64.5 11
12 Consumer credit 47.2 59.4 62.6 57.1 33.3 33.4 43.8 118.1 115.7 36.2 63.2 1213 Trade credit 36.3 37.9 21.1 33.0 24.2 38.4 38.0 31.3 27.8 24.2 28.0 13
14 Net increase in liabilities 202.2 321.4 223.4 196.3 175.0 146.0 156.2 307.9 295.8 172.3 303.2 14
15 Commercial paper 89.4 125.7 139.0 121.0 136.5 125.5 102.3 119.9 84.6 96.8 86.0 1516 Corporate bonds 112.9 195.7 84.4 75.2 38.4 20.6 53.9 188.0 211.2 75.5 217.2 16
17 Discrepancy 0.0 -0.0 -0.0 0.0 -0.0 -0.0 0.0 0.0 0.0 -0.0 -0.0 17
Memo: Securitized assets not included above18 Consumer leases (3) 2.1 1.8 -2.9 -3.1 -3.5 -3.7 -2.7 -2.3 -1.7 -1.8 -1.2 1819 REIT assets (4) 3.7 2.9 -1.0 -2.2 0.6 -2.9 -3.0 -3.4 -2.4 -0.6 -1.9 19
(1) Federally related mortgage pool securities backing privately issued CMOs.(2) Mortgages backing privately issued pool securities and privately issued CMOs.(3) Receivables from operating leases, such as consumer automobile leases, are booked as current income when payments are received and are not included in financial assets (or household liabilities). The leased automobile is a tangible asset; depreciation flows are included in line 1, and fixed investment flows are included in line 2.(4) Included in table F.129.
F.127 Finance Companies (1)Billions of dollars; quarterly figures are seasonally adjusted annual rates
1 Gross saving 26.3 30.6 37.6 39.8 37.4 39.3 39.7 42.6 42.2 45.8 46.9 1
2 Fixed nonresidential investment 31.1 28.6 35.1 39.6 38.8 39.9 39.1 40.7 36.6 34.6 31.2 2
3 Net acquisition of financial assets 47.1 88.8 150.3 134.9 125.8 153.7 226.6 33.6 -11.2 45.2 56.0 3
4 Checkable deposits and currency 2.1 2.3 2.5 2.6 2.6 2.6 2.7 2.7 2.8 2.8 2.9 4
5 Credit market instruments 23.1 77.3 97.0 108.0 145.4 147.6 102.8 36.2 -0.9 126.7 -42.1 5 6 Other loans and advances -0.6 36.8 54.2 63.3 98.1 84.0 48.2 23.0 -11.2 99.0 -76.5 6 7 Mortgages 11.0 24.7 24.6 26.4 20.0 36.4 23.1 26.2 23.4 26.8 12.1 7 8 Consumer credit 12.6 15.8 18.2 18.2 27.2 27.2 31.5 -13.0 -13.0 0.9 22.2 8
9 Miscellaneous assets 22.0 9.3 50.9 24.3 -22.1 3.5 121.2 -5.3 -13.1 -84.4 95.2 9
10 Net increase in liabilities 38.7 75.8 138.0 164.9 210.3 155.3 244.5 49.7 -20.9 56.6 66.8 10
11 Credit market instruments 57.8 57.1 70.3 81.2 61.1 139.4 98.1 26.1 -72.8 64.1 22.1 1112 Open market paper 24.6 30.7 -2.9 8.4 11.4 -26.5 -2.3 51.0 -231.8 14.0 -23.1 1213 Corporate bonds 28.7 24.2 64.3 72.2 66.8 148.3 94.4 -20.6 126.6 33.3 55.0 1314 Bank loans n.e.c. 4.5 2.2 8.9 0.5 -17.1 17.6 6.1 -4.3 32.3 16.8 -9.9 14
15 Taxes payable 0.8 0.8 0.8 1.0 0.9 0.9 1.0 1.0 1.1 1.1 1.2 15
16 Miscellaneous liabilities -20.0 17.8 66.9 82.8 148.4 15.0 145.4 22.5 50.9 -8.7 43.5 1617 Foreign direct investment in U.S. 6.6 2.6 11.4 17.6 -7.6 3.1 5.2 69.7 23.6 18.6 8.8 1718 Investment by parent -7.5 -12.8 53.5 14.7 77.5 -48.4 19.6 10.2 -21.5 -15.1 -10.3 1819 Other -19.1 28.0 1.9 50.5 78.5 60.3 120.6 -57.4 48.8 -12.1 45.0 19
20 Discrepancy -13.3 -11.1 -9.9 30.1 83.1 1.0 18.5 17.9 -4.1 22.7 26.5 20
Memo:21 Consumer leases not included above (2) 5.6 -2.2 6.3 5.3 15.0 10.0 3.1 -7.0 -6.9 15.2 -7.7 21
(1) Includes retail captive finance companies.(2) See footnote (3), table F.126.

Z.1, December 7, 2001 35
F.128 Mortgage CompaniesBillions of dollars; quarterly figures are seasonally adjusted annual rates
1997 1998 1999 2000 2000 2001 Q1 Q2 Q3 Q4 Q1 Q2 Q3
1 Net acquisition of financial assets -9.1 3.2 0.3 0.2 -6.0 5.5 -0.5 2.0 1.4 1.1 1.7 1
2 Home mortgages -10.2 3.1 0.3 0.2 -6.0 5.5 -0.6 1.9 1.4 1.0 1.6 2 3 Multifamily residential mortgages 1.0 0.1 0.0 0.0 0.0 0.0 0.0 0.0 0.1 0.1 0.1 3 4 Commercial mortgages 0.0 0.0 0.0 0.0 0.0 0.0 0.0 0.0 0.0 0.0 0.0 4
5 Net increase in liabilities -9.1 3.2 0.3 0.2 -6.0 5.5 -0.5 2.0 1.4 1.1 1.7 5
6 Bank loans n.e.c. -4.6 1.6 0.2 0.1 -3.0 2.7 -0.3 1.0 0.7 0.6 0.8 6 7 Investment by parent -4.6 1.6 0.2 0.1 -3.0 2.7 -0.3 1.0 0.7 0.6 0.9 7
F.129 Real Estate Investment Trusts (REITs)Billions of dollars; quarterly figures are seasonally adjusted annual rates
1 Gross saving 6.8 8.2 8.1 7.7 7.3 7.6 7.9 8.1 8.3 8.6 8.7 1
2 Fixed nonresidential investment 52.0 64.7 9.2 0.4 4.1 6.6 3.6 -12.8 3.4 -2.1 -10.4 2 3 Multifamily residential investment 11.3 11.4 1.6 0.1 0.7 1.2 0.6 -2.3 0.6 -0.4 -1.8 3
4 Net acquisition of financial assets 26.1 6.4 -2.3 -6.3 -14.1 -6.9 0.1 -4.4 5.8 8.0 8.9 4
5 Checkable deposits and currency 1.1 0.8 0.3 -0.0 0.4 -1.2 -1.4 2.0 -1.0 2.3 2.3 5
6 Credit market instruments 20.2 -5.1 -2.6 -6.3 -16.3 -2.5 -3.6 -2.8 4.0 1.1 7.7 6
7 Agency securities 9.0 -8.1 1.1 0.3 -0.4 -3.8 3.0 2.5 -2.6 14.3 3.4 7 8 Corporate and foreign bonds 2.1 -0.4 -0.3 -0.4 -0.7 3.5 -3.1 -1.4 8.6 -9.0 3.0 8
9 Mortgages 9.1 3.4 -3.3 -6.2 -15.2 -2.2 -3.5 -3.8 -1.9 -4.2 1.3 910 Home 6.0 0.8 -2.4 -4.6 -14.4 -1.9 -1.1 -0.8 -0.4 -0.8 1.7 1011 Multifamily residential 0.9 0.1 -0.6 -0.2 -0.8 0.9 -0.3 -0.7 -0.7 0.2 0.2 1112 Commercial 2.2 2.5 -0.4 -1.4 0.0 -1.2 -2.0 -2.4 -0.8 -3.6 -0.6 12
13 Miscellaneous assets 4.9 10.7 -0.1 0.0 1.7 -3.2 5.1 -3.6 2.8 4.7 -1.1 13
14 Net increase in liabilities 92.2 86.4 17.7 3.0 2.8 10.6 8.0 -9.6 19.2 2.7 3.4 14
15 Security RPs 11.2 -9.8 0.5 -3.8 -10.7 -7.2 4.5 -1.8 4.9 7.8 7.3 15
16 Credit market instruments 39.6 62.7 6.3 2.7 11.5 9.8 -2.4 -8.1 -6.1 10.5 -10.2 16
17 Open market paper 0.0 0.2 -0.1 0.0 0.0 3.5 -3.4 0.0 -0.2 -0.5 4.4 1718 Corporate bonds 14.8 21.7 8.9 4.8 6.6 13.2 5.6 -6.3 12.2 -5.9 -0.5 1819 Bank loans n.e.c. 9.9 16.0 -7.6 -8.3 -2.1 -16.9 -10.6 -3.7 -10.6 0.7 -5.8 1920 Mortgages 14.9 24.8 5.1 6.2 7.0 10.0 6.0 1.8 -7.5 16.2 -8.2 20
21 Corporate equity issues 32.5 19.8 6.6 2.2 2.6 2.0 1.4 3.0 1.4 3.2 7.5 2122 Miscellaneous liabilities 8.8 13.6 4.4 1.8 -0.6 6.0 4.5 -2.6 18.9 -18.9 -1.2 22
23 Discrepancy 9.5 11.9 17.4 16.6 19.4 17.3 11.6 18.0 17.7 5.7 15.5 23
Memo:24 Securitized assets included above 3.7 2.9 -1.0 -2.2 0.6 -2.9 -3.0 -3.4 -2.4 -0.6 -1.9 2425 Agency securities 0.4 0.1 -1.3 -0.2 0.5 -0.4 -0.5 -0.4 -0.4 -0.9 -0.9 2526 Home mortgages 3.1 1.8 0.0 -0.9 1.2 -2.3 -2.3 -0.2 -1.8 -1.0 -0.9 2627 Multifamily residential mortgages 0.2 0.4 0.1 -0.5 -0.6 -0.1 -0.2 -1.0 -0.1 0.5 -0.1 2728 Commercial mortgages 0.0 0.6 0.1 -0.6 -0.5 -0.0 -0.1 -1.7 -0.0 0.9 -0.0 28

36 Z.1, December 7, 2001
F.130 Security Brokers and DealersBillions of dollars; quarterly figures are seasonally adjusted annual rates
1997 1998 1999 2000 2000 2001 Q1 Q2 Q3 Q4 Q1 Q2 Q3
1 Gross saving 9.2 5.3 -0.0 -3.3 -0.7 -1.7 -3.9 -6.7 -6.9 -6.0 -3.3 1
2 Fixed nonresidential investment 14.5 18.1 19.5 21.4 20.8 21.4 21.8 21.8 21.6 19.2 18.7 2
3 Net acquisition of financial assets 142.8 142.0 79.8 220.4 627.7 28.5 287.6 -62.3 -17.7 603.4 448.0 3
4 Checkable deposits and currency 6.0 3.7 3.3 1.6 -6.4 -0.6 -24.8 38.2 -6.3 33.1 63.3 4
5 Credit market instruments 14.9 6.8 -34.7 68.9 102.9 89.8 152.1 -69.0 289.5 35.4 250.1 5
6 Open market paper 0.6 3.8 -2.0 13.2 16.9 32.1 28.8 -24.9 21.3 1.2 22.4 6 7 U.S. government securities 2.7 21.7 -43.4 37.1 24.1 65.2 89.4 -30.2 217.6 -1.9 140.2 7 8 Treasury 7.5 21.2 -58.4 39.4 86.8 46.0 59.3 -34.5 171.1 -86.1 203.8 8 9 Agency -4.8 0.5 15.0 -2.3 -62.7 19.2 30.1 4.3 46.4 84.2 -63.6 910 Municipal securities 2.4 -0.1 -1.2 -0.7 -4.4 -3.9 3.9 1.8 5.5 4.1 9.3 1011 Corporate and foreign bonds 9.2 -18.6 12.0 19.3 66.3 -3.5 30.0 -15.7 45.3 32.0 78.1 11
12 Corporate equities 2.4 -6.0 7.7 9.6 31.1 2.8 18.6 -14.2 23.9 41.8 -59.8 1213 Security credit 36.8 21.6 75.2 7.2 234.2 -64.9 14.6 -155.0 -166.5 9.7 228.2 1314 Miscellaneous assets 82.8 115.9 28.3 133.0 266.0 1.4 127.1 137.6 -158.4 483.4 -33.7 14
15 Net increase in liabilities 141.3 146.2 89.9 235.4 638.9 41.8 304.1 -43.3 -1.0 621.2 462.5 15
16 Security RPs (net) 22.7 4.5 37.2 56.9 150.2 -42.7 188.8 -68.5 -93.8 222.0 291.1 1617 Corporate bonds 8.1 7.2 -17.2 15.6 44.4 -0.7 25.4 -6.6 -23.9 35.7 12.3 1718 Corporate equity issues -5.9 2.5 7.6 -4.2 7.6 1.4 -26.1 0.1 19.0 -8.2 26.6 18
19 Trade payables 5.7 -1.0 11.9 5.1 11.6 22.6 -14.0 0.0 -2.7 -7.7 10.6 1920 Security credit 74.2 81.7 29.1 138.9 273.6 -30.3 83.0 229.4 25.6 -38.2 257.6 2021 Customer credit balances (HH) 52.6 61.2 47.2 88.6 189.4 -47.1 53.9 158.0 -48.2 49.9 285.6 2122 From banks 21.7 20.5 -18.1 50.4 84.2 16.8 29.1 71.4 73.8 -88.1 -27.9 2223 Taxes payable 0.1 -0.1 0.9 -0.1 1.0 -2.8 0.2 1.3 -3.6 0.5 0.4 23
24 Miscellaneous liabilities 21.6 44.7 7.2 -5.3 120.4 77.9 -0.5 -219.1 79.3 384.4 -115.3 2425 Foreign direct investment in U.S. 0.3 1.7 3.3 1.7 2.3 1.6 2.3 0.5 4.5 2.1 4.7 2526 Due to affiliates 75.9 97.4 61.6 62.5 88.6 55.2 41.9 64.3 120.3 9.3 -2.3 2627 Other -54.6 -54.3 -57.7 -69.5 29.4 21.0 -44.7 -283.9 -45.6 373.0 -117.7 27
28 Proprietors’ net investment 14.9 6.6 13.1 28.5 30.1 16.5 47.3 20.2 -0.8 32.6 -20.8 28
29 Discrepancy -6.8 -8.7 -9.5 -9.7 -10.3 -9.7 -9.2 -9.5 -11.7 -7.4 -7.6 29
F.131 Funding Corporations (1)Billions of dollars; quarterly figures are seasonally adjusted annual rates
1 Net acquisition of financial assets 118.2 105.6 257.1 123.3 81.6 227.6 32.0 152.2 5.3 -123.9 -283.4 1
2 Money market fund shares 10.4 57.9 48.9 33.5 10.5 -11.2 87.4 47.3 107.6 124.2 46.8 2
3 Credit market instruments 50.4 -12.9 133.8 35.9 -7.2 206.8 -73.0 17.0 -172.5 -192.4 -214.6 3 4 Open market paper 53.8 -17.4 137.6 35.8 32.8 177.4 -44.2 -23.0 -211.2 -231.1 -258.1 4 5 Corporate and foreign bonds -3.4 4.5 -3.8 0.1 -40.0 29.4 -28.8 40.0 38.7 38.7 43.6 5
6 Miscellaneous assets (2) 57.3 60.7 74.4 54.0 78.3 32.1 17.6 87.8 70.2 -55.7 -115.6 6 7 Investment in foreign banking offices 14.3 11.8 2.5 45.6 86.1 -0.1 21.5 75.0 14.6 -20.2 -94.9 7 8 Investment in brokers and dealers 43.0 48.9 71.9 8.3 -7.8 32.2 -3.9 12.9 55.7 -35.5 -20.7 8
9 Net increase in liabilities 118.2 105.6 257.1 123.3 81.6 227.6 32.0 152.2 5.3 -123.9 -283.4 9
10 Credit market instruments 79.9 40.0 91.5 -0.4 -37.5 50.6 -4.2 -10.4 30.1 -163.6 -150.0 1011 Open market paper 49.4 6.0 34.1 -2.3 -19.9 26.9 5.4 -21.6 -17.1 -188.3 -145.3 1112 Corporate bonds 30.6 34.0 57.4 1.9 -17.6 23.8 -9.6 11.2 47.2 24.7 -4.7 12
13 Miscellaneous liabilities 38.2 65.7 165.7 123.7 119.1 177.0 36.2 162.6 -24.8 39.7 -133.4 1314 Foreign direct investment in U.S. -22.6 20.7 -17.0 54.3 115.8 -18.6 21.8 98.2 40.1 107.9 34.4 1415 Securities loaned (net) 57.2 70.0 16.3 88.7 97.4 94.3 12.4 150.4 -102.1 233.6 68.5 1516 Other 3.6 -25.0 166.4 -19.3 -94.1 101.2 2.0 -86.1 37.2 -301.8 -236.3 16
(1) Funding subsidiaries, nonbank financial holding companies, and custodial accounts for reinvested collateral of securities lending operations.(2) Due from affiliated companies.

Z.1, December 7, 2001 37
F.200 Gold and Official Foreign Exchange Holdings (1)Billions of dollars; quarterly figures are seasonally adjusted annual rates
1997 1998 1999 2000 2000 2001 Q1 Q2 Q3 Q4 Q1 Q2 Q3
1 Total U.S. reserves 1.0 6.8 -8.7 0.3 2.2 -8.1 1.4 5.6 -0.8 5.4 21.2 1
2 U.S. gold stock and SDRs 0.4 0.1 -0.0 0.7 0.7 0.7 0.7 0.7 0.8 0.6 2.0 2
3 Federal govt.: Exchange Stab. Fund 0.4 0.1 -0.0 0.7 0.7 0.7 0.7 0.7 0.8 0.6 2.0 3 4 Monetary authority (2) -0.0 -0.0 0.0 -0.0 0.0 -0.0 0.0 0.0 0.0 -0.0 0.0 4
5 U.S. foreign exchange position 0.7 6.6 -8.7 -0.4 1.5 -8.8 0.7 4.9 -1.5 4.7 19.1 5
6 Official foreign currency holdings -2.9 1.5 -3.3 1.9 0.5 0.5 5.9 0.6 0.8 0.7 4.0 6 7 Treasury -1.5 0.8 -1.6 0.9 0.3 0.3 2.9 0.3 0.4 0.3 2.0 7 8 Monetary authority -1.5 0.8 -1.6 0.9 0.3 0.3 2.9 0.3 0.4 0.3 2.0 8
9 Net IMF position 3.6 5.1 -5.5 -2.3 0.9 -9.3 -5.2 4.3 -2.3 4.1 15.1 910 Federal government 3.6 5.1 -5.5 -2.3 0.9 -9.3 -5.2 4.3 -2.3 4.1 15.1 1011 Monetary authority 0.0 0.0 0.0 0.0 0.0 0.0 0.0 0.0 0.0 0.0 0.0 11
(1) Lines 1, 2, and 3 exclude increases in SDRs through allocations, which have occurred at various dates beginning January 1970. Transactions in SDRs are included. Also excluded from the table are revaluations of foreign currency holdings, gold, SDRs, and IMF position. Allocations and revaluations are included in tables on outstandings.
F.201 SDR Certificates and Treasury CurrencyBillions of dollars; quarterly figures are seasonally adjusted annual rates
SDR certificates:
1 Liab: Federal government -0.5 0.0 -3.0 -4.0 0.0 -8.0 -4.0 -4.0 0.0 0.0 0.0 1 2 Asset: Monetary authority -0.5 0.0 -3.0 -4.0 0.0 -8.0 -4.0 -4.0 0.0 0.0 0.0 2
Treasury currency:
3 Liab: Federal government 0.5 0.6 1.0 2.4 2.2 3.2 4.2 -0.0 -1.1 1.1 -0.0 3 4 Asset: Monetary authority 0.6 0.7 1.7 3.6 4.0 3.9 3.3 3.3 2.5 1.6 0.7 4
5 Discrepancy (seigniorage) -0.2 -0.1 -0.7 -1.2 -1.8 -0.7 0.9 -3.3 -3.6 -0.5 -0.7 5
F.202 U.S. Deposits in Foreign CountriesBillions of dollars; quarterly figures are seasonally adjusted annual rates
1 Total rest of the world liability 107.7 6.5 61.0 120.8 313.3 3.4 -40.8 207.4 235.5 -146.5 15.4 1 Held by:
2 Household sector 6.5 0.1 5.2 7.7 20.0 0.2 -2.6 13.3 -6.0 -16.0 -10.0 2 3 Nonfinancial corporate business -5.1 7.4 -2.3 -5.4 -24.0 17.2 54.0 -68.7 -27.1 0.9 -0.1 3 4 Money market mutual funds 0.1 7.4 12.2 48.2 54.1 68.3 8.0 62.5 87.1 -10.1 0.8 4
5 Discrepancy--unallocated assets 106.2 -8.5 45.8 70.2 263.1 -82.2 -100.2 200.3 181.5 -121.2 24.8 5

38 Z.1, December 7, 2001
F.203 Net Interbank TransactionsBillions of dollars; quarterly figures are seasonally adjusted annual rates
1997 1998 1999 2000 2000 2001 Q1 Q2 Q3 Q4 Q1 Q2 Q3
1 Net change in liabilities -19.7 -32.3 17.6 -20.3 -72.9 151.9 -170.6 10.6 -45.7 19.3 19.7 1
2 Monetary authority 6.1 -7.5 22.2 -27.1 -104.2 6.2 -15.5 5.0 7.1 5.2 19.2 2 3 Depository institution reserves 6.3 -4.5 -2.3 -5.0 -5.1 0.4 -4.6 -10.7 14.7 1.5 22.5 3 4 Vault cash -0.2 -2.9 24.5 -22.2 -99.1 5.7 -10.9 15.7 -7.6 3.7 -3.3 4
5 Commercial banking -25.8 -24.8 -4.6 6.9 31.3 145.7 -155.0 5.6 -52.8 14.1 0.4 5 6 To monetary authority -1.6 -1.1 -1.7 1.0 0.1 1.9 1.0 1.1 -3.2 -1.7 -0.5 6
7 To banks in foreign countries -4.3 -27.1 -6.5 -11.5 5.9 138.4 -143.9 -46.6 -66.3 2.2 -7.4 7
8 Liabilities, net -4.2 -32.0 -7.8 -12.0 5.2 140.6 -145.5 -48.4 -72.5 13.1 -7.7 8 9 U.S.-chartered commercial banks 13.6 23.0 45.0 28.8 42.3 169.5 -54.7 -41.9 -24.3 53.2 -92.1 910 Due to foreign affiliates 46.3 23.6 34.5 76.2 67.8 232.3 -9.1 13.8 -159.1 49.1 -28.0 1011 - Due from foreign affiliates 32.7 0.5 -10.5 47.4 25.5 62.8 45.6 55.8 -134.8 -4.0 64.1 11
12 Foreign banking offices in U.S. -18.5 -55.7 -48.6 -58.0 -119.1 -21.0 -78.8 -13.1 -92.6 -52.3 48.3 1213 Due to foreign affiliates -10.7 33.3 8.4 -8.4 41.4 -100.9 -86.2 112.0 120.7 -120.4 42.6 1314 - Due from foreign affiliates 7.8 88.9 57.0 49.6 160.5 -79.8 -7.4 125.1 213.2 -68.1 -5.7 14
15 Bank holding companies 0.8 0.6 -4.3 17.2 82.0 -7.9 -12.0 6.6 44.3 12.3 36.1 1516 Due to foreign affiliates 0.3 -0.1 5.5 -8.3 -33.4 0.0 0.0 0.0 160.2 35.1 33.1 1617 - Due from foreign affiliates -0.4 -0.7 9.7 -25.5 -115.4 7.9 12.0 -6.6 115.9 22.8 -3.0 17
18 Less: Deposits at foreign banks 0.2 -5.0 -1.3 -0.5 -0.7 2.2 -1.6 -1.8 -6.2 10.8 -0.4 1819 U.S.-chartered commercial banks 1.0 -1.0 -1.3 -1.0 -0.4 0.9 -2.2 -2.4 -4.3 8.8 -0.5 1920 Foreign banking offices in U.S. -0.9 -4.0 -0.0 0.6 -0.2 1.3 0.6 0.6 -1.9 2.0 0.2 20
21 To U.S. banking, net -19.9 3.4 3.5 17.4 25.3 5.4 -12.1 51.1 16.7 13.6 8.3 21
22 U.S.-chartered commercial banks -6.7 -2.6 -12.1 -12.5 -11.6 1.9 18.8 -59.2 208.3 -4.6 42.0 2223 Liabilities -14.7 6.0 19.6 8.4 -2.5 10.5 -20.1 45.8 27.0 -61.9 40.3 2324 To foreign offices in U.S. 5.4 2.1 16.4 -8.9 -27.2 4.2 -6.9 -5.5 9.9 -78.3 33.8 2425 To bank holding companies -0.2 0.6 -0.3 -0.1 -0.6 1.0 -1.0 0.3 0.4 2.9 -1.8 2526 Unallocated -19.9 3.4 3.5 17.4 25.3 5.4 -12.1 51.1 16.7 13.6 8.3 26
Less, due from:27 Foreign offices in U.S. -7.4 -1.6 23.7 8.1 -33.5 2.6 -23.8 87.2 -22.0 2.7 8.5 2728 Bank holding companies -0.6 10.2 8.0 12.9 42.7 6.0 -15.0 17.7 -159.3 -60.0 -10.3 28
29 Foreign banking offices in U.S. -12.7 -3.7 7.4 17.0 -6.4 -1.6 -16.9 92.8 -31.9 81.0 -25.3 2930 Due to U.S. banks -7.4 -1.6 23.7 8.1 -33.5 2.6 -23.8 87.2 -22.0 2.7 8.5 3031 - Due from U.S. banks 5.4 2.1 16.4 -8.9 -27.2 4.2 -6.9 -5.5 9.9 -78.3 33.8 31
32 Bank holding companies -0.4 9.6 8.2 12.9 43.3 5.0 -14.1 17.5 -159.7 -62.8 -8.5 3233 Due to U.S. banks -0.6 10.2 8.0 12.9 42.7 6.0 -15.0 17.7 -159.3 -60.0 -10.3 3334 - Due from U.S. banks -0.2 0.6 -0.3 -0.1 -0.6 1.0 -1.0 0.3 0.4 2.9 -1.8 34
35 Net change in assets 0.2 -35.6 14.0 -37.7 -98.2 146.5 -158.4 -40.5 -62.4 5.8 11.4 35
36 Rest of the world -4.3 -27.1 -6.5 -11.5 5.9 138.4 -143.9 -46.6 -66.3 2.2 -7.4 36
37 Domestic 4.5 -8.6 20.5 -26.1 -104.1 8.1 -14.6 6.1 3.8 3.5 18.8 37
38 Monetary authority -1.6 -1.1 -1.7 1.0 0.1 1.9 1.0 1.1 -3.2 -1.7 -0.5 3839 Federal Reserve float -3.6 0.9 -1.9 1.1 0.1 0.8 1.5 2.1 -2.9 -2.2 -0.2 3940 Loans to member banks 2.0 -2.0 0.2 -0.1 0.0 1.1 -0.6 -1.0 -0.4 0.5 -0.2 40
41 Commercial banking 6.6 -7.6 22.1 -26.1 -102.4 6.1 -13.7 5.5 7.1 5.2 18.3 4142 Reserves at Federal Reserve 6.8 -4.6 -2.4 -4.0 -3.3 0.4 -2.8 -10.1 14.7 1.5 21.6 4243 Vault cash -0.2 -2.9 24.5 -22.2 -99.1 5.7 -10.9 15.7 -7.6 3.7 -3.3 43
44 Savings insts.: Reserves at Fed. Res. -0.5 0.1 0.1 -1.0 -1.8 0.1 -1.9 -0.5 0.0 0.0 0.9 44
45 Discrepancy--floats, etc. -19.9 3.4 3.5 17.4 25.3 5.4 -12.1 51.1 16.7 13.6 8.3 45

Z.1, December 7, 2001 39
F.204 Checkable Deposits and CurrencyBillions of dollars; quarterly figures are seasonally adjusted annual rates
1997 1998 1999 2000 2000 2001 Q1 Q2 Q3 Q4 Q1 Q2 Q3
1 Net change in liabilities 41.2 47.4 151.4 -71.5 -206.8 -33.8 5.0 -50.2 90.3 100.8 245.3 1
2 Monetary authority 29.9 38.3 108.7 -35.3 -187.8 27.5 23.3 -4.1 48.8 50.2 84.2 2 3 Federal government cash and deposits -2.3 0.5 22.3 -22.9 -91.0 -19.5 30.4 -11.5 5.9 -17.7 30.1 3 4 Deposits due to foreign 0.3 -0.3 -0.1 0.1 0.2 -0.1 0.1 0.3 -0.6 0.1 2.0 4 5 Currency outside banks 31.9 38.0 86.4 -12.5 -97.0 47.1 -7.2 7.1 43.5 67.8 52.1 5
6 Commercial banking -19.8 -33.4 3.2 -85.2 -87.9 -100.7 -60.8 -91.4 -25.5 1.4 109.3 6 7 Federal government deposits -0.9 -14.6 36.4 -33.2 -30.5 -22.6 -17.3 -62.3 4.3 -3.8 24.6 7 8 Deposits due to foreign 4.8 -1.5 13.4 -9.5 -54.7 5.9 4.8 6.0 2.7 -4.1 3.7 8 9 Private domestic deposits -23.7 -17.3 -46.6 -42.6 -2.7 -84.1 -48.3 -35.2 -32.4 9.4 81.0 9
10 Savings institutions 27.1 36.1 37.2 43.1 45.2 42.8 40.6 43.9 51.1 53.2 46.3 1011 Credit unions 4.1 6.4 2.3 5.9 23.7 -3.5 1.9 1.4 15.8 -4.0 5.5 11
12 Net change in assets 41.2 47.4 151.4 -71.5 -206.8 -33.8 5.0 -50.2 90.3 100.8 245.3 12
13 Household sector -33.7 -28.6 -41.5 -42.3 46.9 -106.9 -76.5 -32.5 64.5 71.8 98.1 13
14 Nonfinancial business 30.0 69.2 59.0 49.1 23.4 93.4 106.4 -26.8 -58.3 -79.9 -35.9 1415 Corporate 7.6 35.2 34.8 24.7 -0.8 50.8 90.9 -42.0 -77.8 -100.2 -54.3 1516 Nonfarm noncorporate 22.2 32.1 25.0 25.0 25.0 43.4 15.9 15.7 20.0 20.8 18.9 1617 Farm 0.2 1.9 -0.8 -0.6 -0.8 -0.8 -0.4 -0.5 -0.5 -0.4 -0.5 17
18 State and local governments 4.4 -3.9 3.9 1.0 -5.9 -7.2 0.2 17.0 2.3 -6.5 -0.1 1819 Federal government -0.5 -16.7 66.2 -65.1 -140.3 -58.3 10.0 -71.7 40.1 -31.6 36.2 19
20 Rest of the world 29.9 14.8 39.9 -8.2 -81.9 9.8 8.0 31.3 11.3 7.1 38.5 2021 Checkable deposits 5.1 -1.8 13.3 -9.3 -54.5 5.9 5.0 6.4 2.1 -4.0 5.7 2122 Currency 24.8 16.6 26.6 1.1 -27.4 4.0 3.0 24.9 9.2 11.1 32.8 22
23 Financial sectors 17.8 13.0 32.2 -16.7 -68.6 17.7 -48.1 32.2 56.4 126.0 85.1 23
24 Commercial banking -0.1 0.6 0.3 -0.5 -1.3 0.6 -2.6 1.2 0.6 -0.6 3.2 2425 Savings institutions 1.0 3.2 1.7 -0.4 -15.3 4.7 -0.1 9.0 -0.2 8.2 0.5 2526 Credit unions 0.6 1.0 17.3 -14.2 1.1 0.9 -28.7 -30.2 12.7 25.5 22.4 2627 Bank personal trusts and estates 0.0 -0.5 -0.1 -0.0 -0.0 -0.0 -0.0 -0.0 -0.0 -0.0 -0.0 27
28 Life insurance companies 3.8 -2.7 0.0 -0.5 -5.6 6.4 -7.9 5.2 51.5 22.5 4.4 2829 Other insurance companies 0.3 -0.2 0.2 -0.6 -4.5 -1.7 1.4 2.4 27.5 4.8 5.5 2930 Private pension funds 1.3 0.2 1.2 0.7 0.5 0.5 1.3 0.4 1.0 1.9 0.9 3031 State and local govt. retirement funds -2.2 4.7 -0.7 -0.1 7.4 5.5 -1.7 -11.7 -7.6 18.7 2.4 31
32 Money market mutual funds 2.6 -2.6 -1.2 4.5 -3.2 -2.4 14.7 8.8 -24.4 4.2 -27.4 3233 Government-sponsored enterprises 1.2 2.5 7.4 -9.7 -44.2 2.1 -0.7 4.3 -0.3 2.6 4.7 3334 Finance companies 2.1 2.3 2.5 2.6 2.6 2.6 2.7 2.7 2.8 2.8 2.9 3435 REITs 1.1 0.8 0.3 -0.0 0.4 -1.2 -1.4 2.0 -1.0 2.3 2.3 3536 Brokers and dealers 6.0 3.7 3.3 1.6 -6.4 -0.6 -24.8 38.2 -6.3 33.1 63.3 36
37 Mail float -6.6 -0.5 -8.2 10.7 19.7 17.7 5.0 0.3 -26.1 13.9 23.6 37

40 Z.1, December 7, 2001
F.205 Time and Savings DepositsBillions of dollars; quarterly figures are seasonally adjusted annual rates
1997 1998 1999 2000 2000 2001 Q1 Q2 Q3 Q4 Q1 Q2 Q3
1 Net change in liabilities 219.6 244.5 175.3 309.1 258.7 224.2 377.4 376.0 418.9 246.1 244.1 1
2 Small time and savings deposits 97.1 152.4 44.7 190.7 104.6 123.0 224.5 310.8 288.3 194.2 229.2 2
3 Commercial banking 148.3 183.7 71.3 213.3 145.6 159.7 213.0 334.8 222.2 197.7 198.0 3 4 U.S.-chartered commercial banks 143.9 186.3 72.4 210.4 146.6 155.3 215.5 324.3 228.0 169.0 213.1 4 5 Foreign banking offices in U.S. 4.4 -3.6 -1.9 1.4 -1.3 1.8 -4.7 10.0 -5.2 23.2 -16.6 5 6 Banks in U.S.-affiliated areas -0.0 1.0 0.8 1.4 0.4 2.5 2.3 0.5 -0.6 5.4 1.4 6
7 Savings institutions -64.4 -54.3 -38.9 -35.5 -47.4 -35.1 -19.0 -40.7 6.7 -37.6 -30.6 7 8 Credit unions 13.2 23.1 12.3 13.0 6.4 -1.6 30.5 16.7 59.4 34.0 61.8 8
9 Large time deposits (1) 122.5 92.1 130.6 118.4 154.1 101.2 152.9 65.2 130.6 51.9 14.9 9
10 Commercial banking 107.9 72.3 119.0 94.9 128.8 86.5 122.6 41.8 87.8 20.9 -40.8 1011 U.S.-chartered commercial banks 63.2 34.8 61.5 87.9 91.7 141.6 73.7 44.6 17.7 25.6 -7.3 1112 Foreign banking offices in U.S. 44.7 36.5 56.7 5.6 36.7 -57.6 46.6 -3.4 70.6 -10.2 -35.0 1213 Banks in U.S.-affiliated areas -0.0 1.0 0.8 1.4 0.4 2.5 2.3 0.5 -0.6 5.4 1.4 13
14 Savings institutions 11.7 15.7 8.5 19.9 27.3 9.0 32.3 11.0 40.9 16.2 44.9 1415 Credit unions 2.9 4.1 3.1 3.5 -2.0 5.7 -2.0 12.4 2.0 14.9 10.8 15
16 Net change in assets 219.6 244.5 175.3 309.1 258.7 224.2 377.4 376.0 418.9 246.1 244.1 16
17 Household sector 131.9 193.6 99.5 305.2 332.8 340.7 339.1 208.4 341.8 267.0 200.9 17
18 Nonfinancial business 30.4 2.3 26.2 9.1 -43.8 -5.2 13.7 71.5 -32.0 -19.0 -0.0 1819 Corporate 19.7 -6.8 16.2 5.1 -47.8 -12.9 12.6 68.4 -37.0 -24.4 -5.5 1920 Nonfarm noncorporate 10.7 9.1 10.0 4.0 4.0 7.7 1.2 3.1 5.0 5.4 5.5 20
21 State and local governments 5.8 12.8 10.9 9.4 -18.4 20.3 7.0 28.9 -11.5 1.7 -2.9 2122 Federal government 1.0 1.3 0.7 1.0 0.4 1.0 2.1 0.4 8.2 5.9 7.2 2223 Rest of the world 13.1 13.0 15.0 5.7 -9.5 1.4 -6.4 37.2 -40.3 2.6 -7.7 23
24 Financial sectors 37.5 21.5 23.0 -21.3 -2.7 -134.0 21.9 29.7 152.7 -12.1 46.5 24
25 Savings institutions -0.4 0.5 -0.1 0.1 2.4 -2.4 -0.8 1.2 1.2 2.7 -0.7 2526 Credit unions 0.6 6.4 -6.8 0.5 2.6 -8.7 -0.7 8.6 8.8 -7.8 5.0 2627 Bank personal trusts and estates 1.0 -2.1 0.9 0.6 1.0 0.8 0.4 0.3 0.5 0.3 0.4 27
28 Private pension funds 7.5 1.5 -4.0 2.0 -0.7 5.4 -0.8 4.0 -3.9 -1.2 -4.4 2829 State and local govt. retirement funds 0.1 -0.4 -0.3 -0.6 2.9 1.3 6.9 -13.5 -1.0 1.2 1.5 2930 Money market mutual funds 28.6 15.7 33.3 -23.8 -10.8 -130.3 16.9 29.0 147.1 -7.3 44.7 30
(1) Large time deposits are those issued in amounts of $100,000 or more.
F.206 Money Market Mutual Fund SharesBillions of dollars; quarterly figures are seasonally adjusted annual rates
1 Net issues 155.9 287.2 249.1 233.3 239.7 71.5 250.9 371.1 621.4 322.5 367.7 1
2 Net purchases 155.9 287.2 249.1 233.3 239.7 71.5 250.9 371.1 621.4 322.5 367.7 2
3 Household sector 79.9 164.9 124.5 131.3 209.1 80.1 57.8 178.3 253.0 -44.6 242.2 3 4 Nonfinancial corporate business 20.2 26.5 23.1 40.4 7.9 2.9 63.4 87.4 130.2 112.6 31.3 4 5 Nonfarm noncorporate business 3.7 9.7 10.0 10.0 2.0 0.7 15.7 21.6 28.0 28.0 8.8 5
6 Bank personal trusts and estates -4.0 8.8 7.5 3.7 3.2 4.4 2.8 4.3 3.4 4.0 3.8 6 7 Life insurance companies 32.6 17.6 23.4 8.5 5.3 -5.7 11.8 22.6 89.5 88.2 24.5 7 8 Private pension funds 13.1 1.9 11.7 5.9 1.8 0.3 12.1 9.4 9.7 10.0 10.3 8 9 Funding corporations 10.4 57.9 48.9 33.5 10.5 -11.2 87.4 47.3 107.6 124.2 46.8 9

Z.1, December 7, 2001 41
F.207 Federal Funds and Security Repurchase AgreementsBillions of dollars; quarterly figures are seasonally adjusted annual rates
1997 1998 1999 2000 2000 2001 Q1 Q2 Q3 Q4 Q1 Q2 Q3
1 Net change in liabilities 120.9 91.3 169.7 110.7 275.8 155.1 277.1 -265.4 -12.8 177.7 262.2 1
2 Commercial banking (net) 89.0 87.0 110.6 63.6 133.1 198.9 59.2 -137.0 74.3 -62.1 23.7 2 3 U.S.-chartered commercial banks 63.4 66.8 128.7 12.8 124.6 137.8 -33.2 -178.1 45.1 58.1 41.0 3 4 Foreign banking offices in U.S. 25.6 19.7 -18.3 52.4 7.6 59.3 92.8 49.8 22.1 -120.7 -18.1 4 5 Bank holding companies 0.0 0.5 0.1 -1.6 0.8 1.8 -0.4 -8.7 7.0 0.5 0.7 5
6 Savings institutions -1.9 9.5 21.4 -6.1 3.2 6.0 24.6 -58.1 1.8 9.9 -59.8 6 7 REITs 11.2 -9.8 0.5 -3.8 -10.7 -7.2 4.5 -1.8 4.9 7.8 7.3 7 8 Brokers and dealers (net) 22.7 4.5 37.2 56.9 150.2 -42.7 188.8 -68.5 -93.8 222.0 291.1 8
9 Net change in assets 57.8 30.7 139.7 -0.4 -291.4 103.2 150.6 36.0 148.8 5.8 225.6 9
10 Nonfinancial corporate business 0.7 -0.4 1.1 -0.5 3.1 -7.7 -0.9 3.3 -6.0 2.4 -5.6 1011 State and local governments 3.6 7.2 5.0 9.7 51.3 -9.4 12.0 -15.0 19.0 17.2 40.8 1112 Rest of the world 20.0 -18.8 14.8 5.1 -43.2 48.5 20.6 -5.6 97.1 13.5 -36.2 12
13 Financial sectors 33.6 42.7 118.7 -14.6 -302.6 71.8 118.9 53.3 38.7 -27.3 226.6 1314 Monetary authority 2.3 6.5 110.3 -97.3 -402.8 26.9 -27.6 14.5 -15.1 24.2 106.7 1415 Savings institutions -0.8 5.5 -4.2 4.3 3.7 2.0 10.7 0.7 27.1 1.3 15.2 1516 Credit unions 2.0 3.4 2.4 -5.3 -11.4 -18.9 31.8 -22.7 16.0 -1.5 10.4 16
17 Other insurance companies -0.2 7.4 -14.4 10.0 26.1 1.9 2.0 10.0 -42.0 -4.6 17.3 1718 Private pension funds 0.9 1.0 0.4 0.9 0.5 0.5 1.3 1.3 -3.6 1.3 1.4 1819 State and local govt. retirement funds 0.4 8.9 2.8 4.3 20.1 5.8 -6.8 -1.8 -8.7 17.2 4.7 1920 Money market mutual funds 22.8 12.9 0.1 43.4 55.1 31.9 16.6 69.9 71.5 -5.6 60.7 2021 Mutual funds 10.3 10.4 8.5 26.7 2.6 60.6 39.6 3.8 -67.0 -28.0 -41.0 2122 Government-sponsored enterprises -4.1 -13.4 12.7 -1.7 3.4 -39.0 51.4 -22.5 60.4 -31.7 51.3 22
23 Discrepancy--unallocated assets 63.2 60.6 30.0 111.1 567.2 51.9 126.5 -301.4 -161.7 171.9 36.6 23
F.208 Open Market PaperBillions of dollars; quarterly figures are seasonally adjusted annual rates
1 Total net issues, all types 184.1 193.1 229.9 207.6 202.1 259.1 169.7 199.3 -367.2 -232.5 -186.3 1
2 Commercial paper 186.8 202.5 232.8 208.2 200.6 258.5 171.9 201.8 -366.5 -227.9 -179.7 2
3 Nonfinancial corporate business 13.7 24.4 37.4 48.1 29.8 110.4 56.1 -4.0 -207.2 -141.5 -74.1 3 4 Foreign issues in U.S. 3.7 7.8 16.3 31.7 57.8 12.0 7.0 50.1 -25.4 -5.6 -26.5 4 5 Nonfinancial -2.3 -1.6 8.2 10.9 36.6 19.7 -13.8 1.2 -31.7 -24.6 -24.5 5 6 Financial 6.0 9.4 8.1 20.8 21.2 -7.6 20.9 48.9 6.3 19.0 -2.0 6
7 Financial sectors 169.4 170.3 179.2 128.4 113.1 136.0 108.8 155.7 -133.9 -80.8 -79.0 7 8 Commercial banking 6.0 7.8 9.1 1.2 -14.9 6.7 6.8 6.3 30.5 -2.8 -0.9 8 9 ABS issuers 89.4 125.7 139.0 121.0 136.5 125.5 102.3 119.9 84.6 96.8 86.0 910 Finance companies 24.6 30.7 -2.9 8.4 11.4 -26.5 -2.3 51.0 -231.8 14.0 -23.1 1011 REITs 0.0 0.2 -0.1 0.0 0.0 3.5 -3.4 0.0 -0.2 -0.5 4.4 1112 Funding corporations 49.4 6.0 34.1 -2.3 -19.9 26.9 5.4 -21.6 -17.1 -188.3 -145.3 12
13 Bankers acceptances (1) -2.7 -9.4 -2.9 -0.7 1.5 0.6 -2.3 -2.5 -0.7 -4.6 -6.6 13
14 Net purchases, by sector 184.1 193.1 229.9 207.6 202.1 259.1 169.7 199.3 -367.2 -232.5 -186.3 14
15 Household sector 1.5 7.5 4.0 5.0 5.0 5.0 5.0 5.0 -22.0 -18.0 -15.0 1516 Nonfinancial corporate business 4.6 3.3 4.3 0.3 -6.1 0.8 7.6 -1.1 11.5 14.0 -13.5 1617 State and local governments 14.3 28.0 1.9 7.6 6.9 17.5 -4.0 10.0 4.0 -17.2 20.0 1718 Rest of the world 19.9 37.6 -13.0 8.7 -9.4 -7.2 -14.3 65.6 -4.1 12.8 -9.7 18
19 Monetary authority 0.0 0.0 0.0 0.0 0.0 0.0 0.0 0.0 0.0 0.0 0.0 1920 Commercial banking (1) -0.8 -0.2 0.3 0.1 0.4 -0.4 -0.1 0.7 0.1 0.0 0.0 2021 Savings institutions -0.3 0.0 0.0 0.0 0.0 0.0 0.0 0.0 0.0 0.0 0.0 2122 Credit unions -0.1 0.2 1.5 -0.6 -4.1 -2.0 3.6 -0.0 -0.4 1.8 -1.1 2223 Bank personal trusts and estates -0.2 -4.5 0.6 0.6 0.7 0.4 0.8 0.5 -4.2 -3.7 -3.4 23
24 Life insurance companies 17.5 7.5 2.0 -4.5 -15.1 12.2 -3.1 -12.2 -41.1 -0.2 18.6 2425 Private pension funds 1.2 2.9 3.7 -1.8 -7.6 0.4 1.2 -1.2 -13.2 -5.5 3.4 2526 State and local govt. retirement funds 0.4 8.9 2.8 4.3 20.1 5.8 -6.8 -1.8 -8.7 17.2 4.7 26
27 Money market mutual funds 62.1 78.2 104.7 95.5 131.5 -13.0 134.2 129.1 3.3 17.1 79.9 2728 Mutual funds 10.6 10.4 8.5 26.7 13.2 43.2 31.3 19.0 -53.5 -61.7 -34.9 2829 Government-sponsored enterprises -1.1 26.9 -27.1 16.8 17.0 -13.1 29.7 33.4 -48.9 40.5 0.6 2930 Brokers and dealers 0.6 3.8 -2.0 13.2 16.9 32.1 28.8 -24.9 21.3 1.2 22.4 3031 Funding corporations 53.8 -17.4 137.6 35.8 32.8 177.4 -44.2 -23.0 -211.2 -231.1 -258.1 31
(1) Excludes banks’ holdings of own acceptances.

42 Z.1, December 7, 2001
F.209 Treasury SecuritiesBillions of dollars; quarterly figures are seasonally adjusted annual rates
1997 1998 1999 2000 2000 2001 Q1 Q2 Q3 Q4 Q1 Q2 Q3
1 Net issues 23.2 -54.6 -71.0 -294.9 -215.2 -410.5 -223.8 -330.2 -2.1 -257.1 256.0 1
2 Savings bonds -0.5 0.1 -0.2 -1.7 -3.5 -2.1 -0.9 -0.3 1.4 3.3 3.9 2 3 Other Treasury issues 23.7 -54.7 -70.8 -293.2 -211.7 -408.5 -222.9 -329.9 -3.5 -260.5 252.1 3
4 Net purchases 23.2 -54.6 -71.0 -294.9 -215.2 -410.5 -223.8 -330.2 -2.1 -257.1 256.0 4
5 Household sector -162.4 -85.2 -1.3 -153.7 -226.8 -221.5 -134.8 -31.5 -73.8 -109.9 81.3 5 6 Savings bonds -0.5 0.1 -0.2 -1.7 -3.5 -2.1 -0.9 -0.3 1.4 3.3 3.9 6 7 Other Treasury issues -161.9 -85.4 -1.2 -152.0 -223.3 -219.5 -133.9 -31.3 -75.2 -113.2 77.3 7
8 Nonfinancial corporate business -20.2 -3.2 -4.0 -1.2 8.2 8.3 -1.9 -19.4 -1.6 -3.8 -4.3 8 9 Nonfarm noncorporate business 4.1 6.1 -3.1 -10.2 -10.2 -15.0 -6.5 -9.1 -11.0 -11.0 -13.4 910 State and local governments -17.7 30.0 -2.5 -30.6 -37.5 -15.2 -45.7 -24.1 -48.5 -41.5 -98.0 10
11 Rest of the world 139.7 38.7 -8.3 -63.0 27.4 -98.2 -86.0 -95.3 -1.5 -116.2 30.3 1112 Monetary authority 39.8 21.4 25.8 33.7 102.1 -5.4 39.2 -0.9 54.2 26.4 8.7 12
13 Commercial banking 8.3 -56.1 12.7 -44.5 -86.3 -35.1 22.9 -79.6 -82.8 39.5 22.1 1314 U.S.-chartered commercial banks -6.1 -42.1 -1.9 -35.0 -32.2 -13.7 -6.5 -87.6 -104.4 13.8 4.0 1415 Foreign banking offices in U.S. 14.4 -10.3 7.5 -0.6 -21.5 -21.5 29.9 10.7 24.5 26.0 16.4 1516 Bank holding companies -0.1 -3.1 7.9 -7.9 -31.4 0.6 0.1 -1.1 -0.3 0.7 -0.3 1617 Banks in U.S.-affiliated areas 0.1 -0.7 -0.7 -1.0 -1.2 -0.5 -0.6 -1.7 -2.6 -1.0 2.0 17
18 Savings institutions -2.8 -4.4 -0.0 -1.4 -0.8 -3.3 -1.4 -0.2 -3.0 -2.1 -3.5 1819 Credit unions -1.8 -2.5 -3.5 -1.4 -1.0 -2.1 -1.0 -1.5 -1.0 -5.7 -0.5 1920 Bank personal trusts and estates -5.4 -3.1 -0.0 -0.8 -0.9 -0.9 -0.7 -0.7 -1.4 -1.2 -1.8 20
21 Life insurance companies 1.6 -14.1 -9.3 -4.6 -4.0 -5.0 -4.1 -5.4 -17.3 -20.2 -18.0 2122 Other insurance companies 2.1 -20.8 -9.7 -8.6 -9.2 -9.3 -6.9 -8.8 -15.8 -8.0 -7.2 2223 Private pension funds 4.1 -4.4 -0.6 -0.8 -3.1 7.3 0.3 -7.7 -26.2 -14.7 -19.1 2324 State and local govt. retirement funds 13.4 0.8 -6.6 -15.5 -0.3 -2.5 -39.2 -19.8 -1.5 7.0 -20.3 24
25 Money market mutual funds -4.0 17.5 0.1 -13.3 -7.5 -34.8 -0.1 -10.9 35.5 37.0 68.9 2526 Mutual funds 11.0 5.2 -6.8 -9.2 -28.4 -5.6 -10.3 7.6 17.7 53.4 44.7 2627 Closed-end funds -1.2 -0.9 -1.3 -0.3 -0.3 -0.3 -0.3 -0.3 -0.3 -0.3 -0.3 2728 Government-sponsored enterprises 7.1 -0.7 5.8 -8.9 -23.2 -18.0 -6.5 12.2 4.9 0.5 -17.5 2829 Brokers and dealers 7.5 21.2 -58.4 39.4 86.8 46.0 59.3 -34.5 171.1 -86.1 203.8 29
Memo:
30 Federal government borrowing (1) 23.1 -52.6 -71.2 -295.9 -217.2 -408.7 -226.2 -331.3 -4.3 -256.0 255.7 30
(1) Total issues of Treasury securities (table F.209, line 1) plus budget agency securities (table F.210, line 2) and federal mortgage borrowing (table F.217, line 12).

Z.1, December 7, 2001 43
F.210 Agency Securities (1)Billions of dollars; quarterly figures are seasonally adjusted annual rates
1997 1998 1999 2000 2000 2001 Q1 Q2 Q3 Q4 Q1 Q2 Q3
1 Net issues 212.8 472.9 591.7 432.5 222.4 382.9 512.4 612.4 430.3 675.9 820.3 1
2 Budget agencies -0.1 2.0 -0.2 -1.0 -2.1 1.8 -2.4 -1.2 -2.2 1.1 -0.4 2 3 Government-sponsored enterprises 98.4 278.3 318.2 234.1 104.9 248.9 278.1 304.5 262.3 268.3 328.0 3 4 Federally related mortgage pools 114.6 192.6 273.8 199.4 119.5 132.2 236.7 309.1 170.3 406.5 492.6 4
5 Net purchases 212.8 472.9 591.7 432.5 222.4 382.9 512.4 612.4 430.3 675.9 820.3 5
6 Household sector 11.0 -74.8 82.4 -11.4 -57.8 75.3 28.1 -91.3 -422.5 131.0 -39.0 6 7 Nonfinancial corporate business -20.5 2.6 1.9 3.1 10.1 11.4 4.5 -13.4 1.1 6.1 30.1 7 8 State and local governments -0.8 63.6 28.5 23.5 23.1 26.9 24.0 20.0 27.8 22.7 27.6 8
9 Federal government 0.0 0.0 0.0 0.0 0.0 0.0 0.0 0.0 0.0 0.0 0.0 910 Rest of the world 49.8 56.7 92.1 152.7 136.5 117.3 171.4 185.7 168.9 157.2 131.6 1011 Monetary authority -1.5 -0.3 -0.2 -0.1 -0.1 -0.0 -0.0 0.0 -0.5 0.0 0.0 11
12 Commercial banking 75.5 91.4 35.7 22.6 70.6 13.8 -30.1 36.2 -20.7 -75.6 166.2 1213 U.S.-chartered commercial banks 60.4 81.6 29.3 18.2 75.3 15.3 -40.0 22.4 -30.9 12.5 141.5 1314 Foreign banking offices in U.S. 12.5 4.8 4.3 0.6 -3.1 -4.0 2.2 7.5 13.4 -87.0 23.6 1415 Bank holding companies 0.6 1.1 -1.3 -0.5 -2.4 0.9 0.4 -1.1 2.4 -1.4 -0.3 1516 Banks in U.S.-affiliated areas 2.0 3.9 3.3 4.3 0.8 1.6 7.3 7.4 -5.7 0.3 1.3 16
17 Savings institutions -0.8 -11.7 3.7 -6.7 -20.2 -9.1 -1.5 4.1 19.4 21.0 -7.4 1718 Credit unions 0.4 7.3 2.9 -0.4 7.7 -1.1 -14.8 6.8 20.1 -11.0 36.6 1819 Bank personal trusts and estates -4.7 -1.4 5.7 4.6 4.0 4.3 4.9 5.2 3.3 3.9 2.5 19
20 Life insurance companies -3.0 -9.6 7.0 11.0 14.6 7.3 12.8 9.3 32.9 19.7 34.2 2021 Other insurance companies 1.7 -1.2 5.9 8.6 7.9 7.5 10.9 7.9 4.3 6.0 5.5 2122 Private pension funds 7.7 39.0 30.6 27.7 42.3 5.4 36.6 26.5 29.3 -18.7 2.6 2223 State and local govt. retirement funds 18.4 19.1 22.9 37.6 -17.9 58.7 46.8 62.7 -27.5 20.4 11.7 23
24 Money market mutual funds -5.5 77.5 17.1 -5.8 -72.9 -58.5 15.2 93.2 251.3 79.7 196.8 2425 Mutual funds 8.4 21.0 19.3 19.5 -4.4 34.7 17.9 29.7 25.4 94.8 57.1 2526 Government-sponsored enterprises 69.0 163.1 178.7 145.0 120.5 74.4 154.6 230.6 234.4 162.9 195.2 26
27 ABS issuers 3.6 38.2 41.3 2.8 21.6 -0.7 -1.9 -7.6 39.5 -42.6 29.0 2728 REITs 9.0 -8.1 1.1 0.3 -0.4 -3.8 3.0 2.5 -2.6 14.3 3.4 2829 Brokers and dealers -4.8 0.5 15.0 -2.3 -62.7 19.2 30.1 4.3 46.4 84.2 -63.6 29
(1) Agency securities include: issues of federal budget agencies (line 2) such as those for the TVA; issues of government-sponsored enterprises (line 3) such as FNMA and FHLB; and federally related mortgage-backed securities issued by GNMA, FNMA, FHLMC, and the Farmers Home Administration (line 4). Only the budget agency issues are considered officially to be part of the total borrowing of the federal government, which is shown in table F.209, line 30.

44 Z.1, December 7, 2001
F.211 Municipal Securities and LoansBillions of dollars; quarterly figures are seasonally adjusted annual rates
1997 1998 1999 2000 2000 2001 Q1 Q2 Q3 Q4 Q1 Q2 Q3
1 Net change in liabilities 71.4 96.8 68.2 35.3 20.0 30.1 31.0 60.1 110.7 112.4 56.0 1
2 State and local governments 57.3 79.1 52.7 28.2 14.5 19.8 25.1 53.4 103.4 108.3 42.9 2 3 Short-term (1) 8.3 -6.3 3.6 3.2 4.4 8.4 -7.2 7.1 21.2 20.5 37.3 3 4 Long-term 49.0 85.4 49.1 25.0 10.1 11.5 32.3 46.3 82.3 87.7 5.6 4
5 Nonprofit organizations (2) 10.0 12.0 10.4 5.8 3.3 10.2 4.9 4.6 4.9 0.9 12.0 5 Nonfinancial corporate business 6 (industrial revenue bonds) 4.2 5.8 5.1 1.4 2.2 0.1 1.0 2.1 2.3 3.3 1.1 6
7 Net change in assets 71.4 96.8 68.2 35.3 20.0 30.1 31.0 60.1 110.7 112.4 56.0 7
8 Household sector 52.5 17.8 40.2 14.6 30.4 -4.6 32.4 -0.1 92.5 0.2 -49.0 8 9 Nonfinancial corporate business -3.6 -1.6 -3.4 10.7 6.3 47.9 -33.1 21.8 -36.7 30.7 13.3 910 Nonfarm noncorporate business 0.5 0.1 0.2 0.2 0.2 0.2 0.2 0.2 0.2 0.2 0.2 1011 State and local governments -0.7 -1.4 -1.5 0.6 -1.7 1.6 3.2 -0.8 2.1 -0.6 0.4 11
12 Commercial banking 2.4 8.2 5.8 3.4 7.6 3.1 1.6 1.1 -2.6 15.5 3.8 1213 Savings institutions 0.0 0.4 0.5 0.2 0.3 -0.2 -0.0 0.6 2.9 0.3 0.3 1314 Bank personal trusts and estates -13.3 -1.1 10.8 4.7 7.2 3.6 5.2 3.0 3.1 2.0 1.4 14
15 Life insurance companies 0.1 1.7 1.7 -1.0 -0.5 -1.4 -0.9 -1.2 1.6 3.4 1.5 1516 Other insurance companies 2.6 16.5 -9.1 -14.9 -17.0 -17.5 -9.1 -15.9 4.7 -2.0 1.3 1617 State and local govt. retirement funds 0.9 1.7 -0.2 -1.5 -0.5 -0.4 -2.5 -2.3 0.7 -0.7 0.0 17
18 Money market mutual funds 22.5 26.0 17.5 34.3 30.8 24.2 29.8 52.6 14.3 39.2 54.4 1819 Mutual funds 6.5 22.8 -3.2 -8.9 -28.3 -17.9 2.0 8.5 22.0 16.6 23.6 1920 Closed-end funds -0.8 1.9 8.7 -4.6 -4.6 -4.6 -4.6 -4.6 -4.6 -4.6 -4.6 2021 Government-sponsored enterprises -0.4 4.1 1.4 -1.8 -5.7 -0.1 3.0 -4.5 4.7 8.3 0.3 2122 Brokers and dealers 2.4 -0.1 -1.2 -0.7 -4.4 -3.9 3.9 1.8 5.5 4.1 9.3 22
(1) Debt with original maturity of 13 months or less.(2) Liability of the households and nonprofit organizations sector (tables F.100 and L.100).
F.212 Corporate and Foreign BondsBillions of dollars; quarterly figures are seasonally adjusted annual rates
1 Net issues 430.8 563.7 465.0 402.2 405.6 369.8 445.2 388.3 856.9 598.9 395.9 1
2 Nonfinancial corporate business 150.5 218.7 229.9 171.1 186.2 153.8 168.8 175.6 400.9 428.0 187.7 2 3 Rest of the world (1) 61.4 34.9 16.8 25.2 47.6 -27.3 71.4 9.0 17.1 -15.9 -101.4 3
4 Financial sectors 218.9 310.1 218.2 205.9 171.8 243.3 205.0 203.7 438.9 186.8 309.6 4 5 Commercial banking 23.7 27.6 20.4 32.6 33.1 38.1 32.7 26.5 79.5 9.0 31.5 5 6 Savings institutions 0.1 -0.2 0.2 3.5 -0.0 0.0 2.6 11.5 -14.0 14.5 -1.2 6
7 ABS issuers 112.9 195.7 84.4 75.2 38.4 20.6 53.9 188.0 211.2 75.5 217.2 7 8 Finance companies 28.7 24.2 64.3 72.2 66.8 148.3 94.4 -20.6 126.6 33.3 55.0 8 9 REITs 14.8 21.7 8.9 4.8 6.6 13.2 5.6 -6.3 12.2 -5.9 -0.5 910 Brokers and dealers 8.1 7.2 -17.2 15.6 44.4 -0.7 25.4 -6.6 -23.9 35.7 12.3 1011 Funding corporations 30.6 34.0 57.4 1.9 -17.6 23.8 -9.6 11.2 47.2 24.7 -4.7 11
12 Net purchases 430.8 563.7 465.0 402.2 405.6 369.8 445.2 388.3 856.9 598.9 395.9 12
13 Household sector 85.6 96.8 23.6 -25.6 -28.7 132.9 -114.9 -91.6 253.4 -147.0 -97.5 1314 State and local governments 1.3 10.2 12.6 3.7 6.1 4.7 1.6 2.4 11.5 7.2 14.8 1415 Rest of the world (2) 84.6 122.2 160.8 183.1 178.3 169.1 185.6 199.4 280.2 279.6 149.7 15
16 Commercial banking 27.8 38.0 38.8 57.6 -22.9 19.3 138.0 96.0 52.1 141.2 48.3 1617 Savings institutions -9.9 29.9 23.3 -2.5 15.0 -20.5 -13.2 8.7 -54.0 -11.1 -20.2 1718 Bank personal trusts and estates -0.8 -2.6 11.3 8.1 8.0 6.6 7.6 10.2 10.1 12.4 10.0 18
19 Life insurance companies 86.8 84.5 41.5 49.0 76.9 23.1 55.8 40.2 118.8 113.1 118.9 1920 Other insurance companies 18.9 11.6 10.0 6.4 4.7 4.0 11.9 5.2 8.8 4.0 9.4 2021 Private pension funds 33.8 17.1 9.3 14.5 13.2 10.2 25.1 9.6 34.7 30.7 11.7 2122 State and local govt. retirement funds 33.1 35.1 30.4 29.7 61.1 -27.2 37.5 47.3 -36.2 6.9 18.6 22
23 Money market mutual funds 12.5 44.8 42.5 38.2 79.7 -36.1 77.0 32.1 -1.1 -6.8 -20.9 2324 Mutual funds 44.4 65.5 29.3 -1.3 -19.0 8.7 9.2 -4.0 57.8 62.1 33.4 2425 Closed-end funds -0.5 4.5 -0.0 -3.5 -3.5 -3.5 -3.5 -3.5 -3.5 -3.5 -3.5 25
26 Government-sponsored enterprises 5.3 20.7 23.7 25.8 11.0 49.1 29.5 13.6 31.7 48.4 -1.3 2627 REITs 2.1 -0.4 -0.3 -0.4 -0.7 3.5 -3.1 -1.4 8.6 -9.0 3.0 2728 Brokers and dealers 9.2 -18.6 12.0 19.3 66.3 -3.5 30.0 -15.7 45.3 32.0 78.1 2829 Funding corporations -3.4 4.5 -3.8 0.1 -40.0 29.4 -28.8 40.0 38.7 38.7 43.6 29
(1) Net purchases of foreign issues by U.S. residents.(2) Net purchases of U.S. issues by foreign residents.

Z.1, December 7, 2001 45
F.213 Corporate Equities (1)Billions of dollars; quarterly figures are seasonally adjusted annual rates
1997 1998 1999 2000 2000 2001 Q1 Q2 Q3 Q4 Q1 Q2 Q3
1 Net issues -79.9 -165.8 -34.6 -36.2 82.8 -22.2 -33.8 -171.5 137.3 119.5 -80.9 1
2 Nonfinancial corporate business -114.4 -267.0 -143.5 -150.6 61.2 -245.2 -67.6 -350.8 -25.6 -72.6 -118.5 2
3 Rest of the world (2) 57.6 101.3 114.4 99.7 62.6 185.9 61.1 89.4 109.2 208.8 10.9 3
4 Financial sectors -23.1 -0.1 -5.6 14.7 -41.0 37.2 -27.3 89.8 53.7 -16.7 26.7 4 5 Commercial banking -27.7 -11.2 -10.6 -12.5 -26.1 -16.0 -2.8 -5.2 -8.1 -7.9 -20.6 5 6 Life insurance companies -4.0 -4.7 -6.0 -0.8 -6.2 12.9 -4.9 -4.8 -6.8 -5.0 -4.4 6 7 Other insurance companies -13.7 -4.7 -7.8 -4.5 -13.1 -1.5 -1.0 -2.4 -1.8 -2.2 -2.4 7 8 Closed-end funds -7.7 -7.8 -7.5 -7.9 -7.9 -7.9 -7.9 -7.9 -7.9 -7.9 -7.9 8 9 Exchange-traded funds 3.4 6.0 12.2 42.4 2.1 46.3 14.1 107.0 57.9 11.3 27.9 910 REITs 32.5 19.8 6.6 2.2 2.6 2.0 1.4 3.0 1.4 3.2 7.5 1011 Brokers and dealers -5.9 2.5 7.6 -4.2 7.6 1.4 -26.1 0.1 19.0 -8.2 26.6 11
12 Net purchases -79.9 -165.8 -34.6 -36.2 82.8 -22.2 -33.8 -171.5 137.3 119.5 -80.9 12
13 Household sector -293.4 -248.7 -264.4 -459.5 -554.9 -367.5 -410.6 -504.9 -324.0 -185.4 -199.9 1314 State and local governments 16.8 9.4 3.5 -1.2 -5.6 10.7 -4.1 -5.6 16.9 21.0 20.3 1415 Rest of the world (3) 67.8 42.0 112.3 193.8 266.2 136.1 214.9 158.2 164.4 137.8 37.2 15
16 Commercial banking 0.6 1.3 1.2 0.3 0.8 0.9 1.3 -1.8 -1.5 -0.5 5.6 1617 Savings institutions 0.2 1.5 -0.7 0.4 1.5 -1.3 1.5 0.1 4.7 3.0 2.4 1718 Bank personal trusts and estates -0.5 -70.4 -40.4 -20.0 -20.0 -20.0 -20.0 -20.0 -20.0 -20.0 -20.0 18
19 Life insurance companies 86.3 115.3 111.9 105.9 126.4 127.1 97.7 72.5 93.6 64.0 74.7 1920 Other insurance companies 3.0 -5.0 -1.7 0.7 -9.3 -11.8 -16.4 40.4 6.0 2.9 6.0 2021 Private pension funds -137.8 -113.0 -92.2 -81.8 -106.2 -62.4 -114.4 -44.2 -40.5 -23.8 -56.4 2122 State and local govt. retirement funds 9.4 -28.2 -6.2 -18.4 -27.9 8.0 -3.8 -49.9 55.8 -67.8 -6.0 22
23 Mutual funds 166.8 143.3 136.9 190.9 378.2 108.4 186.9 90.3 99.6 134.8 86.4 2324 Closed-end funds -5.1 -13.3 -14.9 0.5 0.5 0.5 0.5 0.5 0.5 0.5 0.5 2425 Exchange-traded funds 3.4 6.0 12.2 42.4 2.1 46.3 14.1 107.0 57.9 11.3 27.9 2526 Brokers and dealers 2.4 -6.0 7.7 9.6 31.1 2.8 18.6 -14.2 23.9 41.8 -59.8 26
(1) Excludes mutual fund shares shown on table F.214.(2) Net purchases of foreign issues by U.S. residents; includes American Depositary Receipts (ADRs).(3) Net purchases of U.S. issues by foreign residents.
F.214 Mutual Fund SharesBillions of dollars; quarterly figures are seasonally adjusted annual rates
1 Net issues 265.1 274.6 188.3 243.9 307.3 232.0 279.4 156.7 96.4 268.0 169.8 1
2 Net purchases 265.1 274.6 188.3 243.9 307.3 232.0 279.4 156.7 96.4 268.0 169.8 2
3 Household sector 259.6 243.4 141.7 229.8 286.8 215.6 271.1 145.6 67.4 261.9 162.0 3 4 Nonfinancial corporate business -8.2 7.3 -1.8 -1.8 -1.8 -1.8 -1.8 -1.8 -1.8 -1.8 -1.8 4 5 State and local governments -7.4 -12.3 4.3 0.8 -10.7 5.6 4.5 4.0 9.4 7.9 -0.8 5
6 Commercial banking 0.8 -0.4 1.2 2.5 5.1 -0.1 -0.3 5.4 13.6 -2.1 3.8 6 7 Credit unions -0.2 1.2 -1.1 -0.3 2.7 -3.8 -0.2 0.0 -0.9 6.4 -1.9 7 8 Bank personal trusts and estates -14.9 27.0 -1.5 -30.5 -30.5 -30.5 -30.5 -30.5 -20.0 -20.0 -20.0 8
9 Life insurance companies -7.2 -23.4 15.0 11.0 12.0 12.4 10.1 9.6 2.0 2.0 2.0 910 Private pension funds 42.7 31.7 30.7 32.4 43.7 34.8 26.6 24.5 26.8 13.8 26.6 10

46 Z.1, December 7, 2001
F.215 Bank Loans Not Elsewhere ClassifiedBillions of dollars; quarterly figures are seasonally adjusted annual rates
1997 1998 1999 2000 2000 2001 Q1 Q2 Q3 Q4 Q1 Q2 Q3
Total loans by commercial 1 banking, flow of funds basis 234.7 253.4 200.1 370.4 529.0 512.4 262.6 177.6 280.5 -70.6 -26.0 1
- Loans elsewhere classified: 2 Open market paper -0.8 -0.2 0.3 0.1 0.4 -0.4 -0.1 0.7 0.1 0.0 0.0 2 3 Mortgages 99.9 91.7 158.2 164.1 247.0 261.1 127.6 20.7 158.8 133.0 42.8 3 4 Consumer credit -14.2 -3.6 -9.2 41.7 39.5 55.7 53.9 17.8 13.7 54.4 -27.3 4 5 Security credit 21.7 20.5 -18.1 50.4 84.2 16.8 29.1 71.4 73.8 -88.1 -27.9 5
6 = Banking sector total bank loans n.e.c. 128.2 145.0 68.9 114.1 158.0 179.2 52.2 67.1 34.1 -170.0 -13.6 6
7 U.S.-chartered commercial banks 108.1 144.3 92.2 98.2 135.5 168.8 59.3 29.2 11.1 -93.0 -5.1 7 8 Foreign banking offices in U.S. 19.2 -1.9 -22.3 15.8 21.6 1.0 0.3 40.1 18.2 -78.8 -8.2 8 9 Bank holding companies -0.0 1.7 -1.6 -0.9 -2.9 8.6 -9.0 -0.5 4.3 -0.2 -0.1 910 Banks in U.S.-affiliated areas 0.9 0.9 0.5 1.1 3.8 0.8 1.6 -1.7 0.5 2.1 -0.2 10
11 + Loans from Federal Reserve banks 0.0 0.0 0.0 0.0 0.0 0.0 0.0 0.0 0.0 0.0 0.0 11
12 = Total bank loans n.e.c. 128.2 145.0 68.9 114.1 158.0 179.2 52.2 67.1 34.1 -170.0 -13.6 12
13 Net change in liabilities 128.2 145.0 68.9 114.1 158.0 179.2 52.2 67.1 34.1 -170.0 -13.6 13
14 Nonfinancial sectors 114.9 114.9 83.2 114.4 154.9 172.2 58.9 71.5 7.1 -184.2 -5.5 14
15 Household sector 8.0 6.2 -7.3 8.2 34.1 -2.6 4.1 -2.9 -17.3 -28.1 48.3 1516 Corporate business 51.1 81.8 73.0 74.3 84.9 134.5 36.3 41.5 8.5 -102.6 -39.6 1617 Nonfarm noncorporate business 43.8 18.9 17.9 17.9 18.3 33.4 7.3 12.5 0.7 -20.2 -14.5 1718 Farm business 3.5 1.2 -0.9 2.7 2.2 1.2 -0.8 8.2 2.2 -2.3 -4.2 18
19 Rest of the world 8.5 6.7 0.5 11.3 15.4 5.7 11.9 12.2 13.0 -31.0 4.4 1920 Foreign official institutions -0.8 0.8 0.2 0.5 -0.8 1.4 1.8 -0.3 0.4 -1.2 3.4 2021 Foreign banks -0.5 -0.7 -3.1 3.2 5.7 2.6 2.2 2.5 12.1 -28.3 1.1 2122 Other foreign 9.8 6.7 3.5 7.5 10.6 1.7 7.9 9.9 0.5 -1.5 -0.1 22
23 Financial sectors 13.3 30.1 -14.2 -0.3 3.2 6.9 -6.7 -4.4 27.1 14.3 -8.1 23
24 Savings institutions 3.5 10.3 -15.7 7.4 25.4 3.5 -1.9 2.7 4.6 -3.8 6.7 2425 Finance companies 4.5 2.2 8.9 0.5 -17.1 17.6 6.1 -4.3 32.3 16.8 -9.9 2526 Mortgage companies -4.6 1.6 0.2 0.1 -3.0 2.7 -0.3 1.0 0.7 0.6 0.8 2627 REITs 9.9 16.0 -7.6 -8.3 -2.1 -16.9 -10.6 -3.7 -10.6 0.7 -5.8 27

Z.1, December 7, 2001 47
F.216 Other Loans and AdvancesBillions of dollars; quarterly figures are seasonally adjusted annual rates
1997 1998 1999 2000 2000 2001 Q1 Q2 Q3 Q4 Q1 Q2 Q3
1 Total other loans and advances 93.2 166.3 158.5 142.7 226.6 245.1 -16.8 115.8 84.2 102.0 133.0 1
2 U.S. government loans 9.6 14.4 5.9 8.2 10.3 7.6 5.8 9.1 7.0 4.6 4.4 2 3 Liab.: Household sector 11.4 10.6 12.6 11.2 12.4 10.7 11.1 10.9 10.5 11.7 11.4 3 4 Nonfinancial corporate business -0.3 -0.1 -0.3 -0.4 -0.6 -0.4 -0.7 -0.0 0.3 -1.2 1.4 4 5 Nonfarm noncorporate business 1.8 4.0 -0.9 -1.1 -0.3 -1.3 -1.2 -1.6 -2.6 -2.2 -4.1 5 6 Farm business -0.5 -0.3 -0.3 0.1 0.2 -0.2 0.2 0.2 0.2 0.3 -0.2 6 7 State and local governments -1.2 1.2 -0.4 -1.0 -1.6 -1.6 -1.3 0.4 0.4 0.4 0.1 7 8 Rest of the world -1.6 -1.0 -4.8 -0.6 0.3 0.4 -2.2 -0.8 -1.8 -4.3 -4.2 8 9 Government-sponsored enterprises 0.0 0.0 0.0 0.0 0.0 0.0 0.0 0.0 0.0 0.0 0.0 9
10 Foreign loans to U.S. corporate business 17.3 -1.0 -22.7 -2.2 -17.6 16.9 -40.6 32.4 -32.4 16.2 80.1 1011 Liab.: Nonfinancial corporate business 17.3 -1.0 -22.7 -2.2 -17.6 16.9 -40.6 32.4 -32.4 16.2 80.1 11
Customers liability on acceptances12 outstanding (Commercial banking asset) -2.8 -9.3 -3.1 -0.7 2.0 0.7 -2.7 -2.9 0.0 -4.0 -7.4 1213 Liab.: Nonfinancial corporate business -2.6 -4.3 -2.2 -0.0 2.8 -0.6 -3.2 0.8 9.9 -3.7 -8.3 1314 Rest of the world -0.2 -5.0 -0.9 -0.7 -0.8 1.2 0.5 -3.7 -9.9 -0.3 0.9 14
15 Savings institution loans to business 3.1 5.3 6.5 8.7 11.2 7.8 10.1 5.7 8.2 9.6 -0.6 1516 Liab.: Nonfinancial corporate business 1.6 2.7 3.2 4.3 5.6 3.9 5.0 2.8 4.1 4.8 -0.3 1617 Nonfarm noncorporate business 1.6 2.7 3.2 4.3 5.6 3.9 5.0 2.8 4.1 4.8 -0.3 17
18 Policy loans (Household liability) 3.2 0.1 -5.1 2.8 -1.3 3.6 5.8 3.2 4.0 0.6 4.3 1819 Asset: Federal government 0.0 -0.0 -0.0 -0.0 -0.0 -0.0 -0.0 -0.0 0.0 0.0 0.0 1920 Life insurance companies 3.2 0.1 -5.0 2.9 -1.3 3.6 5.8 3.2 4.0 0.6 4.3 20
21 Govt.-sponsored enterprises loans 31.2 92.3 113.6 41.3 79.0 119.9 -39.0 5.5 109.3 -0.6 64.4 2122 Liab.: Household sector (SLMA) -4.4 -1.2 5.6 -4.2 -8.9 -2.5 -11.4 6.0 2.3 4.8 3.3 2223 Noncorporate business (FCS) 0.0 2.7 0.0 1.5 -3.2 4.6 2.7 2.0 -0.2 6.2 2.0 2324 Farm business (FCS) 0.0 0.6 0.9 1.5 4.1 -1.4 1.3 2.3 -0.6 -0.5 1.0 2425 Commercial banks (FHLB and SLMA) 19.1 46.9 40.6 26.8 58.6 53.9 6.2 -11.4 39.0 -17.4 45.9 2526 Savings institutions (FHLB and SLMA) 16.2 42.1 63.5 16.3 32.1 65.5 -38.6 6.3 71.9 5.4 7.2 2627 Credit unions (FHLB) 0.1 0.6 2.2 0.0 -2.9 0.9 1.1 1.0 -0.6 0.8 1.5 2728 Life insurance companies (FHLB) 0.2 0.7 0.7 -0.7 -0.7 -1.1 -0.3 -0.7 -2.4 0.1 3.5 28
29 Securitized loans held by ABS issuers 32.2 27.6 9.2 21.2 44.9 4.6 -4.5 39.9 -0.7 -23.3 64.4 2930 Liab.: Households (1) 7.8 3.8 1.5 6.5 13.6 6.8 8.8 -3.3 2.5 2.0 0.8 3031 Nonfinancial corporate business 24.4 23.8 7.7 14.7 31.3 -2.3 -13.2 43.2 -3.2 -25.3 63.6 31
32 Finance company loans to business -0.6 36.8 54.2 63.3 98.1 84.0 48.2 23.0 -11.2 99.0 -76.5 3233 Liab.: Nonfinancial corporate business -0.5 33.1 48.8 57.0 88.3 75.6 43.4 20.7 -10.1 89.1 -68.8 3334 Nonfarm noncorporate business -0.1 3.7 5.4 6.3 9.8 8.4 4.8 2.3 -1.1 9.9 -7.6 34
(1) Student loans.

48 Z.1, December 7, 2001
F.217 Total MortgagesBillions of dollars; quarterly figures are seasonally adjusted annual rates
1997 1998 1999 2000 2000 2001 Q1 Q2 Q3 Q4 Q1 Q2 Q3
1 Net change in mortgages 338.2 521.2 601.4 577.4 509.9 669.6 576.7 553.5 557.1 853.9 752.3 1
2 Home 258.3 389.9 435.2 422.5 361.9 490.3 441.9 395.9 434.3 622.9 544.7 2 3 Multifamily residential 12.4 31.9 42.2 39.0 31.6 51.3 30.8 42.3 36.9 60.9 55.0 3 4 Commercial 64.4 92.8 118.2 109.4 109.1 117.8 97.5 113.2 81.8 157.7 146.1 4 5 Farm 3.1 6.5 5.8 6.5 7.4 10.1 6.5 2.0 4.2 12.4 6.5 5
6 Net borrowing 338.2 521.2 601.4 577.4 509.9 669.6 576.7 553.5 557.1 853.9 752.3 6
7 Household sector 239.2 360.8 399.9 385.7 323.9 456.0 403.0 359.8 387.6 605.8 514.8 7
8 Nonfinancial business 84.2 135.6 196.4 185.5 179.0 203.6 167.7 191.9 177.0 231.8 245.8 8 9 Corporate 33.4 21.4 61.0 62.3 66.9 58.1 50.8 73.6 52.3 87.2 106.2 910 Nonfarm noncorporate 47.7 107.7 129.7 116.7 104.8 135.4 110.4 116.2 120.5 132.2 133.1 1011 Farm 3.1 6.5 5.8 6.5 7.4 10.1 6.5 2.0 4.2 12.4 6.5 11
12 Federal government -0.0 0.0 0.0 0.0 0.0 0.0 0.0 0.0 0.0 0.0 0.0 1213 REITs 14.9 24.8 5.1 6.2 7.0 10.0 6.0 1.8 -7.5 16.2 -8.2 13
14 Net change in assets 338.2 521.2 601.4 577.4 509.9 669.6 576.7 553.5 557.1 853.9 752.3 14
15 Household sector 0.1 0.9 -0.3 1.1 3.5 2.4 1.0 -2.5 -0.1 3.3 0.7 1516 Nonfinancial corporate business 25.9 -13.0 -7.0 -5.0 -5.0 -5.0 -5.0 -5.0 -5.0 -5.0 -5.0 1617 Nonfarm noncorporate business -1.6 11.9 10.0 7.9 7.9 15.2 2.3 6.2 6.0 5.6 6.9 17
18 State and local governments 3.7 4.1 4.3 4.5 4.4 4.5 4.5 4.6 4.6 4.7 4.8 1819 Federal government -4.5 -0.8 -0.1 -0.9 -3.8 0.1 -1.3 1.6 -2.4 -0.6 -3.4 19
20 Commercial banking 99.9 91.7 158.2 164.1 247.0 261.1 127.6 20.7 158.8 133.0 42.8 2021 Savings institutions (1) 3.5 12.1 24.7 55.2 60.3 82.4 62.4 15.5 75.2 40.3 10.5 2122 Credit unions 10.1 10.9 14.1 16.4 16.2 15.8 17.2 16.3 -0.5 14.4 34.1 2223 Bank personal trusts and estates -0.6 -0.2 -0.6 -0.1 -0.1 -0.2 -0.2 -0.1 -0.1 -0.0 -0.1 23
24 Life insurance companies -1.3 6.8 15.7 5.2 -5.7 13.0 8.5 4.8 -3.6 8.4 3.1 2425 Other insurance companies -0.2 -0.3 -0.0 -0.3 2.5 -2.8 -0.7 -0.2 0.0 0.1 0.1 2526 Private pension funds 0.7 1.9 1.9 1.7 2.1 1.4 1.7 1.4 1.5 1.0 0.5 2627 State and local govt. retirement funds 0.9 6.5 -2.6 -0.0 0.9 -2.9 1.9 0.1 2.5 2.6 3.7 27
28 Government-sponsored enterprises (1) -4.5 8.3 -4.3 22.7 6.8 38.6 17.3 28.0 11.6 36.3 26.1 2829 Federally related mortgage pools 114.6 192.6 273.8 199.4 119.5 132.2 236.7 309.1 170.3 406.5 492.6 2930 ABS issuers 80.7 156.5 92.0 85.2 54.4 74.2 83.5 128.6 115.3 179.6 119.8 30
31 Finance companies 11.0 24.7 24.6 26.4 20.0 36.4 23.1 26.2 23.4 26.8 12.1 3132 Mortgage companies -9.1 3.2 0.3 0.2 -6.0 5.5 -0.5 2.0 1.4 1.1 1.7 3233 REITs 9.1 3.4 -3.3 -6.2 -15.2 -2.2 -3.5 -3.8 -1.9 -4.2 1.3 33
(1) FHLB loans to savings institutions are included in other loans and advances.

Z.1, December 7, 2001 49
F.218 Home Mortgages (1)Billions of dollars; quarterly figures are seasonally adjusted annual rates
1997 1998 1999 2000 2000 2001 Q1 Q2 Q3 Q4 Q1 Q2 Q3
1 Net borrowing 258.3 389.9 435.2 422.5 361.9 490.3 441.9 395.9 434.3 622.9 544.7 1
2 Household sector 240.4 351.4 389.5 382.6 327.5 444.6 397.9 360.3 387.8 581.0 502.3 2 3 Nonfinancial corporate business 0.2 1.4 2.2 2.0 2.0 2.2 2.6 1.1 3.5 2.6 1.5 3 4 Nonfarm noncorporate business 17.8 37.2 43.6 38.0 32.4 43.6 41.4 34.4 42.9 39.4 40.9 4
5 Net change in assets 258.3 389.9 435.2 422.5 361.9 490.3 441.9 395.9 434.3 622.9 544.7 5
6 Household sector -1.1 -1.1 -1.1 -1.0 -1.1 -1.0 -1.0 -1.0 -1.0 -1.0 -1.0 6 7 Nonfinancial corporate business 5.3 -2.7 -1.4 -1.0 -1.0 -1.0 -1.0 -1.0 -1.0 -1.0 -1.0 7 8 Nonfarm noncorporate business -0.6 4.5 3.8 3.0 3.0 5.7 0.9 2.3 2.2 2.1 2.6 8
9 State and local governments 3.0 3.3 3.5 3.7 3.6 3.6 3.7 3.7 3.8 3.8 3.9 910 Federal government -2.0 -0.3 -0.4 -0.7 -0.3 -0.2 -2.0 -0.4 -0.4 -0.6 -1.0 10
11 Commercial banking 67.9 51.1 82.1 86.4 142.1 169.8 68.1 -34.2 93.8 70.6 -49.8 1112 Savings institutions 7.0 12.7 15.1 46.1 49.4 73.7 50.2 11.0 57.5 31.2 1.4 1213 Credit unions 10.1 10.9 14.1 16.4 16.2 15.8 17.2 16.3 -0.5 14.4 34.1 1314 Bank personal trusts and estates -0.6 -0.2 -0.6 -0.1 -0.1 -0.2 -0.2 -0.1 -0.1 -0.0 -0.1 14
15 Life insurance companies 0.2 -0.6 -0.7 -1.0 -1.5 -1.3 -1.3 -0.0 -0.1 0.5 0.1 1516 Private pension funds 0.8 1.3 1.4 1.5 1.6 1.3 1.5 1.4 1.5 1.3 1.1 1617 State and local govt. retirement funds 0.6 2.8 -0.9 -0.0 0.3 -1.0 0.7 0.0 0.9 0.9 1.3 17
18 Government-sponsored enterprises -4.2 5.3 -10.3 15.8 1.8 31.4 11.3 18.5 4.7 22.7 15.3 1819 Federally related mortgage pools 109.3 182.1 264.6 190.9 113.0 124.5 228.9 297.0 157.2 387.3 479.6 1920 ABS issuers 54.5 94.5 49.9 44.8 34.0 33.5 51.0 60.8 93.9 63.6 44.0 20
21 Finance companies 12.6 22.5 18.2 22.4 21.2 32.2 15.8 20.3 21.0 27.0 10.7 2122 Mortgage companies -10.2 3.1 0.3 0.2 -6.0 5.5 -0.6 1.9 1.4 1.0 1.6 2223 REITs 6.0 0.8 -2.4 -4.6 -14.4 -1.9 -1.1 -0.8 -0.4 -0.8 1.7 23
Memo:24 Home equity loans included above (2) 78.0 60.6 56.1 97.7 81.2 117.2 95.6 96.6 62.2 95.5 79.5 2425 Commercial banking 20.1 2.9 12.6 45.3 41.1 52.2 42.9 45.1 3.2 39.5 25.8 2526 Savings institutions 3.2 0.5 3.8 13.1 10.3 10.5 13.7 18.0 1.7 14.2 4.8 2627 Credit unions 3.5 0.7 3.7 7.3 9.3 7.7 9.3 2.9 2.7 3.2 12.4 2728 ABS issuers 38.6 34.0 17.7 9.6 6.4 16.4 6.4 9.2 41.6 13.6 17.6 2829 Finance companies 12.6 22.5 18.2 22.4 14.2 30.4 23.4 21.5 12.9 25.1 18.9 29
(1) Mortgages on 1-4 family properties.(2) Loans made under home equity lines of credit and home equity loans secured by junior liens. Excludes home equity loans held by mortgage companies and individuals.
F.219 Multifamily Residential MortgagesBillions of dollars; quarterly figures are seasonally adjusted annual rates
1 Net borrowing 12.4 31.9 42.2 39.0 31.6 51.3 30.8 42.3 36.9 60.9 55.0 1
2 Nonfinancial corporate business 1.1 1.1 1.2 1.3 1.3 1.3 1.3 1.3 1.3 1.5 1.5 2 3 Nonfarm noncorporate business 6.4 22.7 39.3 35.7 27.9 46.7 27.6 40.5 38.0 54.0 56.2 3
4 Federal government -0.0 0.0 0.0 0.0 0.0 0.0 0.0 0.0 0.0 0.0 0.0 4 5 REITs 4.9 8.2 1.7 2.1 2.3 3.3 2.0 0.6 -2.5 5.4 -2.7 5
6 Net change in assets 12.4 31.9 42.2 39.0 31.6 51.3 30.8 42.3 36.9 60.9 55.0 6
7 Household sector -0.1 -0.0 -0.0 -0.0 -0.0 -0.0 -0.0 -0.0 -0.0 -0.0 -0.0 7 8 Nonfinancial corporate business 0.6 -0.3 -0.2 -0.1 -0.1 -0.1 -0.1 -0.1 -0.1 -0.1 -0.1 8 9 Nonfarm noncorporate business -0.5 4.0 3.3 2.6 2.6 5.0 0.8 2.1 2.0 1.9 2.3 9
10 State and local governments 0.6 0.9 0.9 1.0 1.0 1.0 1.0 1.0 1.0 1.0 1.0 1011 Federal government -0.9 -0.3 -0.0 0.3 0.3 0.2 0.2 0.5 -2.4 0.2 1.0 11
12 Commercial banking 4.2 3.2 13.1 11.7 19.1 19.7 4.9 3.2 8.3 2.4 14.0 1213 Savings institutions -2.0 -2.5 2.3 1.9 -5.4 5.3 3.7 4.1 6.4 2.0 3.8 13
14 Life insurance companies -0.3 1.1 1.1 0.9 -0.7 2.0 1.3 0.8 -0.5 1.1 0.4 1415 Private pension funds -0.0 0.1 0.1 0.0 0.1 0.0 0.1 0.0 -0.0 -0.1 -0.2 1516 State and local govt. retirement funds 0.2 1.8 -0.7 -0.0 0.2 -0.8 0.5 0.0 0.7 0.7 1.0 16
17 Government-sponsored enterprises -1.2 0.8 4.8 4.9 5.2 4.6 3.3 6.6 4.1 7.5 6.9 1718 Federally related mortgage pools 5.3 10.5 9.2 8.5 6.5 7.7 7.8 12.0 13.1 19.2 13.0 1819 ABS issuers 5.0 12.8 8.5 7.3 3.4 5.4 6.9 13.5 4.9 24.9 11.3 19
20 Finance companies -0.3 -0.3 0.2 0.1 0.2 0.3 0.6 -0.6 0.0 -0.1 0.2 2021 Mortgage companies 1.0 0.1 0.0 0.0 0.0 0.0 0.0 0.0 0.1 0.1 0.1 2122 REITs 0.9 0.1 -0.6 -0.2 -0.8 0.9 -0.3 -0.7 -0.7 0.2 0.2 22

50 Z.1, December 7, 2001
F.220 Commercial MortgagesBillions of dollars; quarterly figures are seasonally adjusted annual rates
1997 1998 1999 2000 2000 2001 Q1 Q2 Q3 Q4 Q1 Q2 Q3
1 Net borrowing 64.4 92.8 118.2 109.4 109.1 117.8 97.5 113.2 81.8 157.7 146.1 1
2 Household sector -1.2 9.4 10.5 3.1 -3.6 11.4 5.1 -0.5 -0.2 24.9 12.5 2 3 Nonfinancial corporate business 32.2 18.9 57.6 59.1 63.6 54.7 46.9 71.2 47.5 83.1 103.1 3 4 Nonfarm noncorporate business 23.4 47.9 46.8 43.1 44.4 45.1 41.4 41.4 39.5 38.8 36.0 4 5 REITs 10.0 16.6 3.4 4.2 4.7 6.7 4.1 1.2 -5.0 10.9 -5.5 5
6 Net change in assets 64.4 92.8 118.2 109.4 109.1 117.8 97.5 113.2 81.8 157.7 146.1 6
7 Household sector 0.7 0.9 0.7 0.7 0.7 0.7 0.6 0.6 0.6 0.6 0.6 7 8 Nonfinancial corporate business 20.0 -10.0 -5.4 -3.8 -3.8 -3.8 -3.8 -3.8 -3.8 -3.8 -3.8 8 9 Nonfarm noncorporate business -0.4 3.1 2.6 2.1 2.1 4.0 0.6 1.6 1.6 1.5 1.8 9
10 State and local governments 0.2 -0.1 -0.1 -0.1 -0.1 -0.1 -0.1 -0.1 -0.1 -0.1 -0.1 1011 Federal government -0.7 0.1 0.6 -0.4 -3.5 0.1 0.5 1.5 0.7 -0.0 -3.2 11
12 Commercial banking 25.7 35.3 60.1 63.8 82.4 68.9 53.6 50.2 55.4 58.0 77.2 1213 Savings institutions -1.5 1.9 7.2 7.1 16.2 3.3 8.5 0.4 11.1 7.1 5.2 13
14 Life insurance companies -1.5 5.2 13.8 4.7 -3.6 10.8 7.2 4.4 -2.7 6.2 2.3 1415 Other insurance companies -0.2 -0.3 -0.0 -0.3 2.5 -2.8 -0.7 -0.2 0.0 0.1 0.1 1516 Private pension funds -0.1 0.4 0.4 0.1 0.4 0.0 0.2 0.0 -0.0 -0.2 -0.5 1617 State and local govt. retirement funds -0.0 1.9 -1.0 -0.0 0.3 -1.1 0.7 0.0 0.9 1.0 1.4 17
18 Federally related mortgage pools -0.0 0.0 0.0 0.0 0.0 0.0 0.0 0.0 0.0 0.0 0.0 1819 ABS issuers 21.3 49.2 33.6 33.1 17.1 35.3 25.7 54.3 16.5 91.1 64.5 1920 Finance companies -1.3 2.5 6.1 3.9 -1.4 3.9 6.7 6.5 2.4 -0.1 1.3 2021 Mortgage companies 0.0 0.0 0.0 0.0 0.0 0.0 0.0 0.0 0.0 0.0 0.0 2122 REITs 2.2 2.5 -0.4 -1.4 0.0 -1.2 -2.0 -2.4 -0.8 -3.6 -0.6 22
F.221 Farm MortgagesBillions of dollars; quarterly figures are seasonally adjusted annual rates
1 Net borrowing (Farm business) 3.1 6.5 5.8 6.5 7.4 10.1 6.5 2.0 4.2 12.4 6.5 1
2 Net change in assets 3.1 6.5 5.8 6.5 7.4 10.1 6.5 2.0 4.2 12.4 6.5 2
3 Household sector 0.6 1.1 0.2 1.5 4.0 2.8 1.3 -2.1 0.3 3.7 1.1 3 4 Nonfarm noncorporate business -0.1 0.4 0.3 0.3 0.3 0.5 0.1 0.2 0.2 0.2 0.2 4
5 State and local governments -0.0 -0.0 -0.0 0.0 0.0 -0.0 0.0 0.0 0.0 0.0 0.0 5 6 Federal government -0.9 -0.3 -0.2 -0.1 -0.3 -0.1 -0.0 -0.1 -0.2 -0.1 -0.2 6
7 Commercial banking 2.1 2.0 2.8 2.2 3.5 2.7 1.0 1.5 1.3 2.0 1.3 7 8 Savings institutions 0.0 0.1 0.1 0.1 0.1 0.1 0.0 0.0 0.1 0.1 -0.0 8
9 Life insurance companies 0.4 1.1 1.5 0.6 0.0 1.5 1.3 -0.4 -0.2 0.5 0.2 910 State and local govt. retirement funds 0.0 0.0 0.0 0.0 0.0 0.0 0.0 0.0 0.0 0.0 0.0 10
11 Government-sponsored enterprises 1.0 2.2 1.1 2.0 -0.2 2.6 2.7 2.9 2.8 6.1 3.9 1112 Federally related mortgage pools -0.0 -0.0 -0.0 0.0 0.0 0.0 0.0 0.0 0.0 0.0 0.0 12
Z.1, December 7, 2001 51
F.222 Consumer CreditBillions of dollars; quarterly figures are seasonally adjusted annual rates
1997 1998 1999 2000 2000 2001 Q1 Q2 Q3 Q4 Q1 Q2 Q3
1 Net change in liabilities (Households) 57.5 75.0 99.5 139.0 149.9 142.1 128.2 135.6 159.9 73.6 21.3 1
2 Net change in assets 57.5 75.0 99.5 139.0 149.9 142.1 128.2 135.6 159.9 73.6 21.3 2
3 Nonfinancial corporate business 1.2 -4.1 5.4 2.4 43.3 -3.1 -23.5 -7.3 34.8 -25.4 -44.3 3 4 Nonfarm noncorporate business 0.0 0.0 0.0 0.0 0.0 0.0 0.0 0.0 0.0 0.0 0.0 4
5 Commercial banking -14.2 -3.6 -9.2 41.7 39.5 55.7 53.9 17.8 13.7 54.4 -27.3 5 6 Savings institutions 2.5 4.4 9.9 3.0 -10.2 7.9 6.3 8.1 3.8 -0.7 14.9 6 7 Credit unions 8.2 3.0 12.5 16.5 16.9 20.9 16.2 12.0 5.0 8.0 -7.5 7
8 ABS issuers 47.2 59.4 62.6 57.1 33.3 33.4 43.8 118.1 115.7 36.2 63.2 8 9 Finance companies 12.6 15.8 18.2 18.2 27.2 27.2 31.5 -13.0 -13.0 0.9 22.2 9
F.223 Trade CreditBillions of dollars; quarterly figures are seasonally adjusted annual rates
1 Net change in trade payables 139.7 109.2 222.3 166.1 193.6 212.9 138.5 119.3 -16.2 -100.0 -81.4 1
2 Household sector 8.9 8.7 6.0 5.9 7.1 7.0 5.6 3.9 6.9 4.7 6.7 2
3 Nonfinancial corporate business 65.1 57.6 144.4 101.6 113.7 113.3 118.5 60.8 -42.8 -132.7 -123.8 3 4 Nonfarm noncorporate business 31.0 23.1 25.5 22.4 26.0 33.2 14.3 16.1 12.8 11.2 9.6 4 5 Farm business 1.4 0.8 0.4 0.9 1.1 1.6 -0.9 1.7 1.5 -0.2 -2.5 5
6 State and local governments 31.4 30.5 29.1 27.4 33.2 25.4 25.4 25.5 24.8 25.0 25.6 6 7 Federal government -8.8 -8.0 0.7 1.3 3.2 -2.2 2.2 2.1 -11.0 -12.0 -13.8 7
8 Rest of the world 5.1 -2.4 4.3 1.6 -2.4 12.1 -12.7 9.2 -5.8 11.5 6.3 8 9 Brokers and dealers 5.7 -1.0 11.9 5.1 11.6 22.6 -14.0 0.0 -2.7 -7.7 10.6 9
10 Net change in trade receivables 168.9 160.5 179.3 200.1 265.4 249.4 190.5 95.0 -18.1 -132.3 -70.7 10
11 Nonfinancial corporate business 93.5 86.3 113.4 109.6 185.9 117.1 116.0 19.3 -94.3 -190.3 -122.9 1112 Nonfarm noncorporate business 35.1 40.7 45.8 40.8 40.8 78.3 17.0 27.1 20.0 14.0 13.2 12
13 Federal government -3.2 1.5 4.6 5.3 6.0 7.2 4.3 3.7 9.9 10.0 7.4 1314 Rest of the world 4.5 -7.5 -7.5 10.4 -1.6 3.9 9.1 30.2 6.4 -4.6 -6.8 14
15 Other insurance companies 2.7 1.6 2.0 1.0 10.0 4.5 6.1 -16.5 12.1 14.4 10.4 1516 ABS issuers 36.3 37.9 21.1 33.0 24.2 38.4 38.0 31.3 27.8 24.2 28.0 16
17 Discrepancy -29.2 -51.3 42.9 -34.0 -71.8 -36.5 -51.9 24.3 2.0 32.3 -10.7 17
F.224 Security CreditBillions of dollars; quarterly figures are seasonally adjusted annual rates
1 Net change in liabilities 111.0 103.3 104.3 146.1 507.8 -95.3 97.5 74.4 -140.9 -28.5 485.8 1
2 Household sector 36.8 21.6 75.2 7.2 234.2 -64.9 14.6 -155.0 -166.5 9.7 228.2 2 3 Rest of the world 0.0 0.0 0.0 0.0 0.0 0.0 0.0 0.0 0.0 0.0 0.0 3
4 Brokers and dealers 74.2 81.7 29.1 138.9 273.6 -30.3 83.0 229.4 25.6 -38.2 257.6 4 5 Customer credit balances (HH) 52.6 61.2 47.2 88.6 189.4 -47.1 53.9 158.0 -48.2 49.9 285.6 5 6 From U.S.-chartered commercial banks 4.2 11.9 -8.7 7.1 35.8 -24.2 -11.6 28.5 30.0 6.2 35.3 6 7 From foreign banking offices in U.S. 17.5 8.6 -9.4 43.2 48.4 41.0 40.7 42.9 43.8 -94.3 -63.2 7
8 Net change in assets 111.0 103.3 104.3 146.1 507.8 -95.3 97.5 74.4 -140.9 -28.5 485.8 8
9 Household sector 52.6 61.2 47.2 88.6 189.4 -47.1 53.9 158.0 -48.2 49.9 285.6 910 Rest of the world 0.0 0.0 0.0 0.0 0.0 0.0 0.0 0.0 0.0 0.0 0.0 10
11 Commercial banking 21.7 20.5 -18.1 50.4 84.2 16.8 29.1 71.4 73.8 -88.1 -27.9 1112 Brokers and dealers 36.8 21.6 75.2 7.2 234.2 -64.9 14.6 -155.0 -166.5 9.7 228.2 12

52 Z.1, December 7, 2001
F.225 Life Insurance and Pension Fund ReservesBillions of dollars; quarterly figures are seasonally adjusted annual rates
1997 1998 1999 2000 2000 2001 Q1 Q2 Q3 Q4 Q1 Q2 Q3
Life insurance reserves:
1 Net change in liabilities 59.3 48.0 50.8 50.2 54.9 45.6 53.0 47.3 52.7 53.2 56.5 1
2 Federal government 1.7 1.3 1.4 1.4 1.2 2.6 0.2 1.8 0.6 2.4 0.0 2 3 Life insurance companies 57.6 46.7 49.4 48.7 53.7 43.0 52.7 45.5 52.0 50.8 56.5 3
4 Net change in assets (Households) 59.3 48.0 50.8 50.2 54.9 45.6 53.0 47.3 52.7 53.2 56.5 4
Pension fund reserves:
5 Net change in liabilities 201.4 202.1 184.4 215.9 206.9 260.7 227.0 168.8 255.5 168.7 192.9 5
6 Federal government (1) 40.3 41.2 41.1 20.9 38.1 39.3 36.1 -29.9 117.5 44.5 31.7 6 7 Life insurance companies 95.0 86.4 70.7 121.8 104.2 132.3 132.1 118.6 94.3 77.0 119.0 7
8 Private pension funds (2) -10.4 13.0 12.7 18.9 2.9 22.6 14.8 35.4 23.1 20.8 10.5 8 9 State and local govt. retirement funds 76.5 61.5 59.8 54.2 61.8 66.5 44.0 44.7 20.7 26.5 31.8 9
10 Net change in assets (Households) (3) 201.4 202.1 184.4 215.9 206.9 260.7 227.0 168.8 255.5 168.7 192.9 10
(1) Includes civil service retirement and disability fund, Railroad Retirement Board, military retirement fund, judicial retirement funds, and foreign service retirement and disability fund.(2) Includes unallocated insurance company contracts beginning 1985:Q4.(3) Excludes all individual retirement accounts (IRAs) (table F.225.i), except those at life insurance companies.
F.226 Taxes Payable by BusinessesBillions of dollars; quarterly figures are seasonally adjusted annual rates
1 Net change in taxes payable by all 22.3 21.3 22.3 21.7 31.0 26.5 3.3 26.0 3.3 16.3 114.4 1 businesses
2 Nonfinancial corporate business 9.3 4.8 7.0 6.9 16.3 11.1 -10.4 10.6 -4.1 5.5 103.0 2 3 Nonfarm noncorporate business 7.3 10.7 8.3 7.5 8.7 11.1 4.8 5.4 4.0 3.2 2.5 3
4 U.S.-chartered commercial banks 1.4 1.7 1.9 2.1 2.1 2.1 2.2 2.2 2.3 2.4 2.4 4 5 Savings institutions 0.4 0.2 0.0 0.4 -1.4 0.3 1.5 1.3 -0.7 -0.9 0.1 5
6 Life insurance companies 1.2 1.2 1.3 1.6 1.4 1.6 1.6 1.8 1.8 1.9 2.0 6 7 Other insurance companies 1.8 2.0 2.0 2.3 2.0 2.2 2.3 2.5 2.6 2.7 2.8 7
8 Finance companies 0.8 0.8 0.8 1.0 0.9 0.9 1.0 1.0 1.1 1.1 1.2 8 9 Brokers and dealers 0.1 -0.1 0.9 -0.1 1.0 -2.8 0.2 1.3 -3.6 0.5 0.4 9
10 Net change in business taxes receivable -5.7 1.6 15.8 7.6 21.5 21.7 5.9 -18.6 -1.1 26.1 101.5 10
11 State and local governments 3.3 9.1 8.8 11.9 13.3 16.6 9.9 7.7 4.6 3.0 -0.2 1112 Federal government -9.0 -7.5 7.0 -4.3 8.2 5.1 -4.0 -26.4 -5.7 23.1 101.6 12
13 Discrepancy 28.0 19.7 6.5 14.1 9.5 4.8 -2.6 44.6 4.4 -9.7 12.9 13
F.227 Investment in Bank Personal Trusts and EstatesBillions of dollars; quarterly figures are seasonally adjusted annual rates
1 Liab.: Bank personal trusts and estates -49.9 -41.8 -6.5 -29.7 -28.4 -33.1 -29.2 -28.0 -26.1 -22.7 -28.2 1
2 Asset: Household sector -49.9 -41.8 -6.5 -29.7 -28.4 -33.1 -29.2 -28.0 -26.1 -22.7 -28.2 2
F.228 Proprietors’ Equity in Noncorporate BusinessBillions of dollars; quarterly figures are seasonally adjusted annual rates
1 Total household investment -70.9 -80.6 -64.8 -46.2 -63.4 -45.0 -26.7 -49.7 -48.5 -25.1 -60.2 1
2 Nonfarm noncorporate business -85.8 -86.0 -68.8 -59.6 -70.2 -51.2 -65.1 -51.8 -38.9 -46.0 -38.3 2 3 Farm business 0.0 -1.2 -9.0 -15.1 -23.3 -10.3 -8.9 -18.1 -8.8 -11.6 -1.1 3 4 Brokers and dealers 14.9 6.6 13.1 28.5 30.1 16.5 47.3 20.2 -0.8 32.6 -20.8 4

Z.1, December 7, 2001 53
F.229 Total Miscellaneous Financial ClaimsBillions of dollars; quarterly figures are seasonally adjusted annual rates
1997 1998 1999 2000 2000 2001 Q1 Q2 Q3 Q4 Q1 Q2 Q3
1 Net change in liabilities 492.8 986.8 749.8 1030.2 904.3 1084.0 1399.2 733.1 500.7 789.8 571.8 1
2 Household sector 0.3 -1.4 2.1 0.1 -2.9 0.8 -0.6 3.2 -3.3 -1.0 2.0 2 3 Nonfinancial corporate business 30.8 414.2 285.1 330.7 175.9 318.7 448.0 380.4 155.0 -69.5 28.6 3 4 Nonfarm noncorporate business 56.5 74.3 50.1 46.1 46.1 46.2 41.1 51.1 34.7 35.6 27.0 4
5 Federal government 0.3 -7.1 -2.9 2.0 -7.6 5.4 7.9 2.3 0.6 4.1 -21.4 5 6 Rest of the world 134.9 173.5 211.1 207.9 249.3 129.8 331.1 121.1 184.0 157.6 133.6 6
7 Monetary authority 2.1 1.3 -1.3 1.1 -13.5 0.5 12.3 5.3 -21.6 -4.7 15.8 7 8 Commercial banking 171.2 120.9 -68.3 184.7 56.0 285.3 293.3 104.1 -103.7 129.2 336.0 8 9 Savings institutions -2.1 -1.6 -14.4 17.1 -43.5 -9.6 36.8 84.8 -9.5 14.7 34.8 910 Credit unions 0.1 0.5 0.9 -0.4 -1.5 3.3 4.3 -7.8 -7.4 10.8 -3.5 10
11 Life insurance companies 36.0 42.8 36.8 24.5 36.5 20.9 29.5 11.0 50.6 90.3 99.0 1112 Other insurance companies 10.7 5.6 12.4 5.9 7.4 20.1 17.9 -21.8 14.4 23.1 67.3 12
13 Government-sponsored enterprises 7.8 20.3 -6.0 7.4 18.0 -15.8 -7.6 35.0 82.1 2.5 58.1 1314 Finance companies -20.0 17.8 66.9 82.8 148.4 15.0 145.4 22.5 50.9 -8.7 43.5 1415 Mortgage companies -4.6 1.6 0.2 0.1 -3.0 2.7 -0.3 1.0 0.7 0.6 0.9 15
16 REITs 8.8 13.6 4.4 1.8 -0.6 6.0 4.5 -2.6 18.9 -18.9 -1.2 1617 Brokers and dealers 21.6 44.7 7.2 -5.3 120.4 77.9 -0.5 -219.1 79.3 384.4 -115.3 1718 Funding corporations 38.2 65.7 165.7 123.7 119.1 177.0 36.2 162.6 -24.8 39.7 -133.4 18
19 Net change in assets 738.3 1114.2 1168.7 1399.3 1405.4 1437.3 1631.4 1123.2 473.5 1267.4 658.8 19
20 Household sector 10.3 9.7 12.4 4.7 5.5 16.3 8.4 -11.5 3.2 25.8 36.3 2021 Nonfinancial corporate business 156.8 430.3 483.6 440.3 567.3 427.7 406.4 359.9 327.9 195.1 311.5 2122 Nonfarm noncorporate business 56.4 76.3 62.7 51.6 54.4 54.2 56.3 41.6 47.1 47.9 44.8 2223 Farm business 0.4 0.5 0.2 -0.1 0.0 1.6 0.8 -2.7 0.6 2.8 2.7 23
24 State and local governments -1.2 -9.7 7.7 12.3 18.7 -10.9 30.8 10.7 23.6 48.6 2.5 2425 Federal government -5.4 -3.5 -0.9 -1.4 -6.6 0.1 0.5 0.4 -0.5 6.3 6.9 2526 Rest of the world 208.0 203.8 406.4 466.6 529.5 405.5 568.5 363.0 254.5 171.0 37.8 26
27 Monetary authority 1.3 4.9 -1.3 1.1 -2.8 -1.0 4.5 3.6 -4.9 2.8 2.9 2728 Commercial banking 103.5 124.1 37.8 102.9 -46.1 185.7 189.4 82.5 -131.2 257.1 219.0 2829 Savings institutions -3.2 13.8 -2.5 7.4 -3.1 14.5 10.3 8.0 71.3 -0.0 38.2 2930 Credit unions 3.8 6.8 -16.3 15.4 -2.4 6.3 17.5 40.1 14.0 29.4 -17.8 3031 Bank personal trusts and estates -1.4 8.4 -2.5 -1.5 -2.1 -2.8 -0.2 -0.9 -1.1 -0.7 -1.2 31
32 Life insurance companies -6.7 3.5 -34.6 20.7 15.2 17.6 43.8 6.2 -72.2 -74.6 14.3 3233 Other insurance companies 6.1 6.9 4.2 7.5 5.2 10.5 9.2 5.3 7.6 1.6 0.4 3334 Private pension funds 13.5 32.0 18.9 16.3 15.3 17.5 22.5 10.0 6.0 24.4 31.6 3435 State and local govt. retirement funds 0.7 3.3 16.3 13.3 -5.0 13.3 10.6 34.3 51.4 2.3 9.3 35
36 Money market mutual funds 14.3 9.6 22.6 12.2 -17.1 222.3 -61.4 -95.2 36.7 175.1 -90.1 3637 Mutual funds 7.1 -3.9 -4.3 -0.5 -6.6 -0.0 2.9 1.8 -5.6 -3.8 0.5 3738 Government-sponsored enterprises 7.1 0.7 5.0 19.2 -37.9 25.3 39.6 49.6 -56.3 8.5 64.3 38
39 Finance companies 22.0 9.3 50.9 24.3 -22.1 3.5 121.2 -5.3 -13.1 -84.4 95.2 3940 REITs 4.9 10.7 -0.1 0.0 1.7 -3.2 5.1 -3.6 2.8 4.7 -1.1 4041 Brokers and dealers 82.8 115.9 28.3 133.0 266.0 1.4 127.1 137.6 -158.4 483.4 -33.7 4142 Funding corporations 57.3 60.7 74.4 54.0 78.3 32.1 17.6 87.8 70.2 -55.7 -115.6 42
43 Discrepancy -245.5 -127.4 -418.9 -369.2 -501.0 -353.3 -232.2 -390.1 27.3 -477.6 -87.0 43
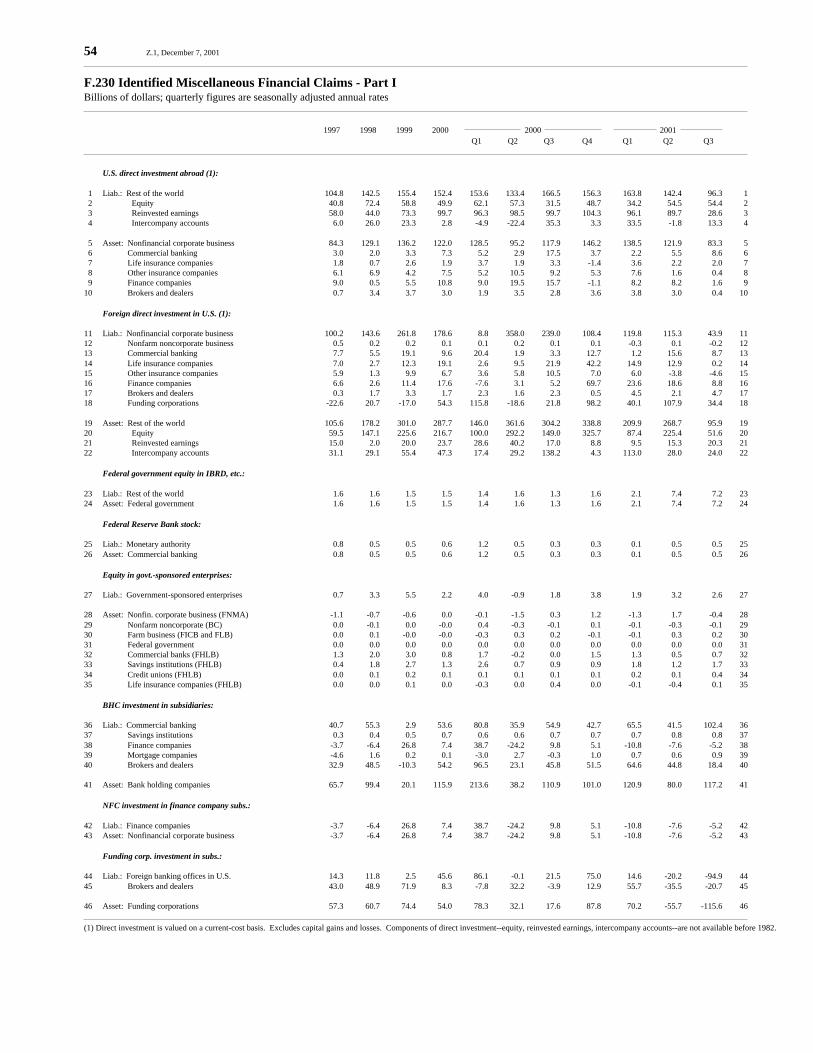
54 Z.1, December 7, 2001
F.230 Identified Miscellaneous Financial Claims - Part IBillions of dollars; quarterly figures are seasonally adjusted annual rates
1997 1998 1999 2000 2000 2001 Q1 Q2 Q3 Q4 Q1 Q2 Q3
U.S. direct investment abroad (1):
1 Liab.: Rest of the world 104.8 142.5 155.4 152.4 153.6 133.4 166.5 156.3 163.8 142.4 96.3 1 2 Equity 40.8 72.4 58.8 49.9 62.1 57.3 31.5 48.7 34.2 54.5 54.4 2 3 Reinvested earnings 58.0 44.0 73.3 99.7 96.3 98.5 99.7 104.3 96.1 89.7 28.6 3 4 Intercompany accounts 6.0 26.0 23.3 2.8 -4.9 -22.4 35.3 3.3 33.5 -1.8 13.3 4
5 Asset: Nonfinancial corporate business 84.3 129.1 136.2 122.0 128.5 95.2 117.9 146.2 138.5 121.9 83.3 5 6 Commercial banking 3.0 2.0 3.3 7.3 5.2 2.9 17.5 3.7 2.2 5.5 8.6 6 7 Life insurance companies 1.8 0.7 2.6 1.9 3.7 1.9 3.3 -1.4 3.6 2.2 2.0 7 8 Other insurance companies 6.1 6.9 4.2 7.5 5.2 10.5 9.2 5.3 7.6 1.6 0.4 8 9 Finance companies 9.0 0.5 5.5 10.8 9.0 19.5 15.7 -1.1 8.2 8.2 1.6 910 Brokers and dealers 0.7 3.4 3.7 3.0 1.9 3.5 2.8 3.6 3.8 3.0 0.4 10
Foreign direct investment in U.S. (1):
11 Liab.: Nonfinancial corporate business 100.2 143.6 261.8 178.6 8.8 358.0 239.0 108.4 119.8 115.3 43.9 1112 Nonfarm noncorporate business 0.5 0.2 0.2 0.1 0.1 0.2 0.1 0.1 -0.3 0.1 -0.2 1213 Commercial banking 7.7 5.5 19.1 9.6 20.4 1.9 3.3 12.7 1.2 15.6 8.7 1314 Life insurance companies 7.0 2.7 12.3 19.1 2.6 9.5 21.9 42.2 14.9 12.9 0.2 1415 Other insurance companies 5.9 1.3 9.9 6.7 3.6 5.8 10.5 7.0 6.0 -3.8 -4.6 1516 Finance companies 6.6 2.6 11.4 17.6 -7.6 3.1 5.2 69.7 23.6 18.6 8.8 1617 Brokers and dealers 0.3 1.7 3.3 1.7 2.3 1.6 2.3 0.5 4.5 2.1 4.7 1718 Funding corporations -22.6 20.7 -17.0 54.3 115.8 -18.6 21.8 98.2 40.1 107.9 34.4 18
19 Asset: Rest of the world 105.6 178.2 301.0 287.7 146.0 361.6 304.2 338.8 209.9 268.7 95.9 1920 Equity 59.5 147.1 225.6 216.7 100.0 292.2 149.0 325.7 87.4 225.4 51.6 2021 Reinvested earnings 15.0 2.0 20.0 23.7 28.6 40.2 17.0 8.8 9.5 15.3 20.3 2122 Intercompany accounts 31.1 29.1 55.4 47.3 17.4 29.2 138.2 4.3 113.0 28.0 24.0 22
Federal government equity in IBRD, etc.:
23 Liab.: Rest of the world 1.6 1.6 1.5 1.5 1.4 1.6 1.3 1.6 2.1 7.4 7.2 2324 Asset: Federal government 1.6 1.6 1.5 1.5 1.4 1.6 1.3 1.6 2.1 7.4 7.2 24
Federal Reserve Bank stock:
25 Liab.: Monetary authority 0.8 0.5 0.5 0.6 1.2 0.5 0.3 0.3 0.1 0.5 0.5 2526 Asset: Commercial banking 0.8 0.5 0.5 0.6 1.2 0.5 0.3 0.3 0.1 0.5 0.5 26
Equity in govt.-sponsored enterprises:
27 Liab.: Government-sponsored enterprises 0.7 3.3 5.5 2.2 4.0 -0.9 1.8 3.8 1.9 3.2 2.6 27
28 Asset: Nonfin. corporate business (FNMA) -1.1 -0.7 -0.6 0.0 -0.1 -1.5 0.3 1.2 -1.3 1.7 -0.4 2829 Nonfarm noncorporate (BC) 0.0 -0.1 0.0 -0.0 0.4 -0.3 -0.1 0.1 -0.1 -0.3 -0.1 2930 Farm business (FICB and FLB) 0.0 0.1 -0.0 -0.0 -0.3 0.3 0.2 -0.1 -0.1 0.3 0.2 3031 Federal government 0.0 0.0 0.0 0.0 0.0 0.0 0.0 0.0 0.0 0.0 0.0 3132 Commercial banks (FHLB) 1.3 2.0 3.0 0.8 1.7 -0.2 0.0 1.5 1.3 0.5 0.7 3233 Savings institutions (FHLB) 0.4 1.8 2.7 1.3 2.6 0.7 0.9 0.9 1.8 1.2 1.7 3334 Credit unions (FHLB) 0.0 0.1 0.2 0.1 0.1 0.1 0.1 0.1 0.2 0.1 0.4 3435 Life insurance companies (FHLB) 0.0 0.0 0.1 0.0 -0.3 0.0 0.4 0.0 -0.1 -0.4 0.1 35
BHC investment in subsidiaries:
36 Liab.: Commercial banking 40.7 55.3 2.9 53.6 80.8 35.9 54.9 42.7 65.5 41.5 102.4 3637 Savings institutions 0.3 0.4 0.5 0.7 0.6 0.6 0.7 0.7 0.7 0.8 0.8 3738 Finance companies -3.7 -6.4 26.8 7.4 38.7 -24.2 9.8 5.1 -10.8 -7.6 -5.2 3839 Mortgage companies -4.6 1.6 0.2 0.1 -3.0 2.7 -0.3 1.0 0.7 0.6 0.9 3940 Brokers and dealers 32.9 48.5 -10.3 54.2 96.5 23.1 45.8 51.5 64.6 44.8 18.4 40
41 Asset: Bank holding companies 65.7 99.4 20.1 115.9 213.6 38.2 110.9 101.0 120.9 80.0 117.2 41
NFC investment in finance company subs.:
42 Liab.: Finance companies -3.7 -6.4 26.8 7.4 38.7 -24.2 9.8 5.1 -10.8 -7.6 -5.2 4243 Asset: Nonfinancial corporate business -3.7 -6.4 26.8 7.4 38.7 -24.2 9.8 5.1 -10.8 -7.6 -5.2 43
Funding corp. investment in subs.:
44 Liab.: Foreign banking offices in U.S. 14.3 11.8 2.5 45.6 86.1 -0.1 21.5 75.0 14.6 -20.2 -94.9 4445 Brokers and dealers 43.0 48.9 71.9 8.3 -7.8 32.2 -3.9 12.9 55.7 -35.5 -20.7 45
46 Asset: Funding corporations 57.3 60.7 74.4 54.0 78.3 32.1 17.6 87.8 70.2 -55.7 -115.6 46
(1) Direct investment is valued on a current-cost basis. Excludes capital gains and losses. Components of direct investment--equity, reinvested earnings, intercompany accounts--are not available before 1982.

Z.1, December 7, 2001 55
F.231 Identified Miscellaneous Financial Claims - Part IIBillions of dollars; quarterly figures are seasonally adjusted annual rates
1997 1998 1999 2000 2000 2001 Q1 Q2 Q3 Q4 Q1 Q2 Q3
Nonofficial foreign currencies:
1 Liab.: Rest of the world -0.0 -0.1 0.6 0.0 -1.2 0.2 0.4 0.6 -0.4 0.0 -0.7 1 2 Asset: Federal government -0.0 -0.1 0.6 0.0 -1.2 0.2 0.4 0.6 -0.4 0.0 -0.7 2
Postal Savings System deposits:
3 Liab.: Federal government 0.0 0.0 0.0 0.0 0.0 0.0 0.0 0.0 0.0 0.0 0.0 3 4 Asset: Household sector 0.0 0.0 0.0 0.0 0.0 0.0 0.0 0.0 0.0 0.0 0.0 4
Deposits at Federal Home Loan Banks:
5 Liab.: Government-sponsored enterprises 0.0 6.8 -7.8 -0.0 -8.1 -8.7 2.8 13.8 51.5 -15.2 12.9 5 6 Asset: Savings institutions 0.0 6.8 -7.8 -0.0 -8.1 -8.7 2.8 13.8 51.5 -15.2 12.9 6
Deferred and unpaid life insurance premiums:
7 Liab.: Household sector 0.3 -1.4 2.1 0.1 -2.9 0.8 -0.6 3.2 -3.3 -1.0 2.0 7 8 Asset: Life insurance companies 0.3 -1.4 2.1 0.1 -2.9 0.8 -0.6 3.2 -3.3 -1.0 2.0 8
Life insurance company reserves:
9 Liab.: Life insurance companies 8.3 7.9 11.4 5.0 3.9 10.3 5.3 0.6 -0.3 14.5 10.2 910 Health 6.3 7.3 10.2 3.9 3.8 8.4 2.2 1.2 -2.4 10.9 8.7 1011 Policy dividend accumulation 2.0 0.7 1.2 1.1 0.0 1.8 3.0 -0.6 2.1 3.6 1.5 11
12 Asset: Household sector 8.3 7.9 11.4 5.0 3.9 10.3 5.3 0.6 -0.3 14.5 10.2 12
Policy payables:
13 Liab.: Other insurance companies 4.8 4.3 2.5 -0.8 3.8 14.3 7.4 -28.8 8.3 26.9 71.9 13
14 Asset: Household sector 2.0 1.8 1.1 -0.3 1.6 6.0 3.1 -12.1 3.5 11.3 26.1 1415 Nonfinancial corporate business 1.9 1.7 1.0 -0.3 1.5 5.7 2.9 -11.4 3.3 10.6 36.4 1516 Nonfarm noncorporate business 0.5 0.4 0.2 -0.1 0.4 1.4 0.7 -2.7 0.8 2.6 6.8 1617 Farm business 0.4 0.4 0.2 -0.1 0.3 1.3 0.7 -2.6 0.8 2.4 2.5 17
Unallocated insurance company contracts:
18 Liab.: Life insurance companies -1.0 21.4 13.4 9.1 9.4 7.2 14.8 4.9 3.2 15.5 30.6 1819 Asset: Private pension funds -1.0 21.4 13.4 9.1 9.4 7.2 14.8 4.9 3.2 15.5 30.6 19
Pension fund contributions payable:
20 Liab.: Nonfinancial corporate business 7.1 1.9 1.0 1.0 1.0 1.0 1.0 1.0 1.0 1.0 1.0 2021 Asset: Private pension funds 7.1 1.9 1.0 1.0 1.0 1.0 1.0 1.0 1.0 1.0 1.0 21
Securities borrowed (net):
22 Liab.: Funding corporations 57.2 70.0 16.3 88.7 97.4 94.3 12.4 150.4 -102.1 233.6 68.5 2223 Asset: Brokers and dealers 57.2 70.0 16.3 88.7 97.4 94.3 12.4 150.4 -102.1 233.6 68.5 23

56 Z.1, December 7, 2001
F.232 Unidentified Miscellaneous Financial ClaimsBillions of dollars; quarterly figures are seasonally adjusted annual rates
1997 1998 1999 2000 2000 2001 Q1 Q2 Q3 Q4 Q1 Q2 Q3
1 Net change in liabilities 83.4 396.1 125.2 305.6 164.1 422.4 743.3 -107.5 -15.2 75.7 176.5 1
2 Nonfinancial corporate business -76.5 268.7 22.2 151.1 166.0 -40.4 208.0 270.9 34.2 -185.8 -16.3 2 3 Nonfarm noncorporate business 56.0 74.2 49.9 46.0 46.0 46.0 41.0 51.0 35.0 35.5 27.2 3
4 Federal government 0.3 -7.1 -2.9 2.0 -7.6 5.4 7.9 2.3 0.6 4.1 -21.4 4 5 Rest of the world 28.6 29.5 53.6 53.9 95.6 -5.4 162.8 -37.4 18.5 7.8 30.9 5 6 Monetary authority 1.3 0.8 -1.8 0.6 -14.8 -0.0 12.0 5.0 -21.8 -5.2 15.3 6
7 Commercial banking 108.4 48.4 -92.7 75.9 -131.3 247.5 213.6 -26.3 -185.0 92.4 319.8 7 8 U.S.-chartered commercial banks 30.5 -2.4 -20.0 71.4 42.6 107.0 89.3 46.8 -179.5 -117.2 189.9 8 9 Foreign banking offices in U.S. 34.2 -11.5 -64.1 -39.4 -167.8 127.3 6.0 -123.0 -93.5 118.5 68.7 910 Bank holding companies 39.0 56.0 -10.8 43.1 -8.9 10.9 111.8 58.7 88.9 83.4 68.9 1011 Banks in U.S.-affiliated areas 4.7 6.3 2.2 0.7 2.8 2.3 6.5 -8.8 -1.0 7.6 -7.7 11
12 Savings institutions -2.4 -2.1 -15.0 16.5 -44.1 -10.2 36.1 84.1 -10.3 14.0 34.0 1213 Credit unions 0.1 0.5 0.9 -0.4 -1.5 3.3 4.3 -7.8 -7.4 10.8 -3.5 1314 Life insurance companies 21.8 10.8 -0.3 -8.7 20.6 -6.1 -12.5 -36.7 32.8 47.4 57.9 1415 Government-sponsored enterprises 7.1 10.1 -3.7 5.2 22.0 -6.2 -12.3 17.4 28.8 14.5 42.6 15
16 Finance companies -19.1 28.0 1.9 50.5 78.5 60.3 120.6 -57.4 48.8 -12.1 45.0 1617 REITs 8.8 13.6 4.4 1.8 -0.6 6.0 4.5 -2.6 18.9 -18.9 -1.2 1718 Brokers and dealers -54.6 -54.3 -57.7 -69.5 29.4 21.0 -44.7 -283.9 -45.6 373.0 -117.7 1819 Funding corporations 3.6 -25.0 166.4 -19.3 -94.1 101.2 2.0 -86.1 37.2 -301.8 -236.3 19
20 Net change in assets 328.9 523.5 544.1 674.7 665.1 775.7 975.4 282.6 -42.4 553.3 263.5 20
21 Nonfinancial corporate business 75.4 306.7 320.2 311.3 398.6 352.5 275.4 218.8 198.2 68.5 197.4 2122 Nonfarm noncorporate business 55.9 75.9 62.4 51.7 53.7 53.2 55.7 44.2 46.4 45.7 38.1 2223 State and local governments -1.2 -9.7 7.7 12.3 18.7 -10.9 30.8 10.7 23.6 48.6 2.5 23
24 Federal government -7.0 -5.0 -3.0 -2.9 -6.8 -1.8 -1.3 -1.9 -2.2 -1.1 0.5 2425 Rest of the world 102.4 25.6 105.4 179.0 383.5 43.9 264.3 24.2 44.6 -97.7 -58.1 2526 Monetary authority 1.3 4.9 -1.3 1.1 -2.8 -1.0 4.5 3.6 -4.9 2.8 2.9 26
27 Commercial banking 32.7 20.1 11.0 -21.7 -267.9 144.4 60.7 -24.0 -255.8 170.6 92.1 2728 U.S.-chartered commercial banks 0.5 4.5 4.5 -4.0 -44.2 23.9 25.1 -20.9 -47.7 -17.4 103.1 2829 Foreign banking offices in U.S. 37.0 0.4 -21.3 -36.5 -199.2 90.0 -12.7 -24.1 -204.8 169.9 -21.6 2930 Bank holding companies -6.7 12.1 28.9 20.9 -23.2 28.8 46.6 31.4 -5.2 2.0 22.3 3031 Banks in U.S.-affiliated areas 1.8 3.1 -1.0 -2.1 -1.4 1.6 1.7 -10.5 1.9 16.2 -11.7 31
32 Savings institutions -3.6 5.1 2.5 6.2 2.4 22.6 6.6 -6.8 18.0 13.9 23.6 3233 Credit unions 3.8 6.7 -16.5 15.3 -2.5 6.2 17.5 40.0 13.7 29.2 -18.1 3334 Bank personal trusts and estates -1.4 8.4 -2.5 -1.5 -2.1 -2.8 -0.2 -0.9 -1.1 -0.7 -1.2 34
35 Life insurance companies -8.8 4.1 -39.4 18.7 14.8 14.9 40.7 4.3 -72.4 -75.4 10.2 3536 Private pension funds 7.4 8.7 4.5 6.2 4.9 9.3 6.7 4.1 1.8 7.9 -0.0 3637 State and local govt. retirement funds 0.7 3.3 16.3 13.3 -5.0 13.3 10.6 34.3 51.4 2.3 9.3 37
38 Money market mutual funds 14.3 9.6 22.6 12.2 -17.1 222.3 -61.4 -95.2 36.7 175.1 -90.1 3839 Mutual funds 7.1 -3.9 -4.3 -0.5 -6.6 -0.0 2.9 1.8 -5.6 -3.8 0.5 3940 Government-sponsored enterprises 7.1 0.7 5.0 19.2 -37.9 25.3 39.6 49.6 -56.3 8.5 64.3 40
41 Finance companies 13.0 8.8 45.4 13.5 -31.1 -16.0 105.4 -4.2 -21.2 -92.6 93.6 4142 REITs 4.9 10.7 -0.1 0.0 1.7 -3.2 5.1 -3.6 2.8 4.7 -1.1 4243 Brokers and dealers 24.9 42.6 8.3 41.4 166.7 -96.5 111.8 -16.3 -60.0 246.8 -102.6 43
44 Discrepancy -245.5 -127.4 -418.9 -369.2 -501.0 -353.3 -232.2 -390.1 27.3 -477.6 -87.0 44

Z.1, December 7, 2001 57
F.11 Sector DiscrepanciesBillions of dollars; quarterly figures are seasonally adjusted annual rates
1997 1998 1999 2000 2000 2001 Q1 Q2 Q3 Q4 Q1 Q2 Q3
1 All sectors -130.7 -72.4 -231.4 -50.6 403.6 -280.4 -111.2 -214.4 161.3 -234.2 148.3 1
2 Household sector 64.8 48.0 20.0 28.9 61.0 -17.4 29.8 42.0 -269.4 -19.0 -42.2 2 3 Nonfinancial corporate business -40.0 -89.2 -97.8 -91.3 -84.9 -95.0 -93.6 -91.9 -77.3 -38.3 -47.3 3
4 State and local governments 39.1 -50.9 -27.9 -28.6 -35.6 -47.1 -20.5 -11.1 19.4 14.2 -12.8 4 5 Federal government 15.2 22.6 -2.2 -4.6 149.7 -124.4 29.8 -73.6 241.5 -71.7 46.1 5 6 Rest of the world -149.4 53.5 -63.0 -14.2 163.7 -209.7 -7.5 -3.2 96.5 -93.5 -31.8 6
7 Financial sectors -60.5 -56.4 -60.5 59.3 149.7 213.3 -49.2 -76.6 150.6 -25.9 236.3 7
8 Monetary authority 1.7 -3.1 -0.6 3.8 -2.2 19.8 5.1 -7.4 5.0 1.0 2.4 8 9 Commercial banking 42.4 25.1 -47.4 55.4 123.7 169.6 -39.0 -32.6 242.7 -9.1 244.3 9
10 Savings institutions -1.9 -3.0 1.7 3.4 2.1 4.2 0.9 6.2 0.6 4.4 3.5 1011 Credit unions -0.2 -0.2 0.8 -0.9 -1.3 1.0 -1.5 -1.8 -1.4 0.9 -0.2 1112 Bank personal trusts and estates -5.3 -0.2 1.7 0.9 1.1 1.2 0.8 0.7 0.5 0.3 0.1 12
13 Life insurance companies -45.0 -33.6 -29.2 -21.4 -42.4 -13.9 -32.8 3.4 -83.3 -23.9 -19.1 1314 Other insurance companies -46.7 -21.0 10.5 -14.6 -28.5 27.2 3.3 -60.3 -6.5 -14.8 -26.3 14
15 Mutual funds 8.0 -8.4 6.9 1.7 7.6 0.5 0.2 -1.6 -2.8 -2.2 -2.4 1516 Government-sponsored enterprises -3.0 -4.1 -3.0 -6.0 -2.7 -5.0 -6.9 -9.5 -5.9 -3.5 -0.5 16
17 Issuers of asset-backed securities 0.0 -0.0 -0.0 0.0 -0.0 -0.0 0.0 0.0 0.0 -0.0 -0.0 1718 Finance companies -13.3 -11.1 -9.9 30.1 83.1 1.0 18.5 17.9 -4.1 22.7 26.5 1819 REITs 9.5 11.9 17.4 16.6 19.4 17.3 11.6 18.0 17.7 5.7 15.5 1920 Brokers and dealers -6.8 -8.7 -9.5 -9.7 -10.3 -9.7 -9.2 -9.5 -11.7 -7.4 -7.6 20
F.12 Instrument DiscrepanciesBillions of dollars; quarterly figures are seasonally adjusted annual rates
1 All types -130.7 -72.4 -231.4 -50.6 403.6 -280.4 -111.2 -214.4 161.3 -234.2 148.3 1
2 Treasury currency -0.2 -0.1 -0.7 -1.2 -1.8 -0.7 0.9 -3.3 -3.6 -0.5 -0.7 2 3 Foreign deposits 106.2 -8.5 45.8 70.2 263.1 -82.2 -100.2 200.3 181.5 -121.2 24.8 3
4 Net interbank transactions -19.9 3.4 3.5 17.4 25.3 5.4 -12.1 51.1 16.7 13.6 8.3 4 5 Security RPs 63.2 60.6 30.0 111.1 567.2 51.9 126.5 -301.4 -161.7 171.9 36.6 5
Mail floats: 6 Federal government -2.7 2.6 -7.4 9.0 18.7 16.3 3.0 -2.1 -29.8 10.1 18.5 6 7 Other -3.9 -3.1 -0.8 1.7 1.0 1.4 1.9 2.4 3.8 3.9 5.1 7
8 Trade credit -29.2 -51.3 42.9 -34.0 -71.8 -36.5 -51.9 24.3 2.0 32.3 -10.7 8 9 Taxes payable 28.0 19.7 6.5 14.1 9.5 4.8 -2.6 44.6 4.4 -9.7 12.9 9
10 Miscellaneous -245.5 -127.4 -418.9 -369.2 -501.0 -353.3 -232.2 -390.1 27.3 -477.6 -87.0 10
11 Nonfinancial -26.8 31.7 67.7 130.4 93.5 112.6 155.6 159.8 120.7 143.2 140.6 11
Nonfinancial components (sign reversed):12 Statistical discrepancy (NIPA) 29.7 -31.0 -72.9 -130.4 -93.5 -112.6 -155.6 -159.8 -120.7 -143.3 -140.5 1213 Private wage accruals less disbursements -2.9 -0.7 5.2 0.0 0.0 0.0 0.0 0.0 0.0 0.0 0.0 13

58 Z.1, December 7, 2001
L.1 Credit Market Debt Outstanding (1)Billions of dollars; amounts outstanding end of period, not seasonally adjusted
1996 1997 1998 1999 2000 2001 Q1 Q2 Q3 Q4 Q1 Q2 Q3
1 Total credit market debt owed by: 19812.1 21311.1 23490.6 25737.7 26135.3 26535.9 26960.1 27524.7 27964.2 28330.8 28874.3 1
2 Domestic nonfinancial sectors 14441.1 15245.1 16293.9 17428.5 17658.2 17839.9 18038.3 18320.9 18563.5 18746.8 19054.8 2
3 Federal government 3781.8 3804.9 3752.2 3681.0 3653.5 3464.0 3410.2 3385.2 3408.8 3251.4 3320.1 3
4 Nonfederal sectors 10659.4 11440.2 12541.7 13747.4 14004.7 14376.0 14628.1 14935.7 15154.7 15495.3 15734.8 4
5 Household sector 5223.9 5556.9 6024.1 6541.5 6608.3 6772.9 6938.9 7115.5 7186.3 7362.9 7531.7 5 6 Nonfinancial corporate business 3093.0 3383.9 3790.2 4265.3 4415.3 4562.2 4618.0 4695.9 4785.7 4881.5 4922.8 6 7 Nonfarm noncorporate business 1129.3 1224.0 1363.7 1519.1 1553.1 1599.1 1630.3 1664.8 1695.5 1727.9 1753.9 7 8 Farm business 149.7 155.9 163.9 169.4 170.7 176.2 177.9 180.2 179.7 185.2 185.8 8 9 State and local governments 1063.4 1119.5 1199.8 1252.1 1257.3 1265.7 1263.1 1279.3 1307.5 1337.8 1340.6 9
10 Rest of the world 542.2 608.0 651.5 679.6 707.9 702.5 731.0 746.7 743.4 727.8 698.5 10
11 Financial sectors 4828.8 5458.0 6545.2 7629.6 7769.2 7993.5 8190.8 8457.1 8657.3 8856.2 9121.0 11
12 Commercial banking 263.6 309.2 382.1 449.3 463.6 494.7 502.0 509.3 540.3 543.7 556.8 1213 U.S.-chartered commercial banks 103.9 133.4 186.2 228.0 240.3 263.4 263.2 264.8 271.9 273.4 282.0 1314 Foreign banking offices in U.S. 9.6 7.2 2.4 2.0 2.0 2.0 1.9 2.0 1.8 1.4 1.0 1415 Bank holding companies 150.0 168.6 193.5 219.3 221.4 229.3 236.9 242.5 266.5 269.0 273.8 15
16 Savings institutions 140.5 160.3 212.4 260.4 266.9 280.7 276.0 287.7 295.1 294.4 303.9 1617 Credit unions 0.4 0.6 1.1 3.4 2.6 2.9 3.1 3.4 3.2 3.5 3.8 17
18 Life insurance companies 1.6 1.8 2.5 3.2 3.0 2.7 2.7 2.5 1.9 1.9 2.8 1819 Government-sponsored enterprises 896.9 995.3 1273.6 1591.7 1618.0 1680.2 1749.7 1825.8 1888.7 1955.8 2037.8 1920 Federally related mortgage pools 1711.3 1825.8 2018.4 2292.2 2322.1 2355.2 2414.3 2491.6 2534.2 2635.8 2759.0 2021 ABS issuers 863.3 1076.6 1398.0 1621.4 1655.8 1697.0 1742.3 1829.6 1893.7 1942.4 2020.2 21
22 Finance companies 534.5 568.3 625.5 695.7 708.4 740.8 761.8 776.9 756.2 769.0 771.3 2223 Mortgage companies 20.6 16.0 17.7 17.8 17.1 17.8 17.7 17.9 18.1 18.2 18.5 2324 REITs 56.5 96.1 158.8 165.1 167.9 170.4 169.8 167.8 166.2 168.9 166.3 2425 Brokers and dealers 27.3 35.3 42.5 25.3 36.4 36.2 42.6 40.9 35.0 43.9 47.0 2526 Funding corporations 312.4 372.6 412.6 504.0 507.4 515.0 508.7 503.7 524.7 478.6 433.6 26
27 Total credit market assets held by: 19812.1 21311.1 23490.6 25737.7 26135.3 26535.9 26960.1 27524.7 27964.2 28330.8 28874.3 27
28 Domestic nonfederal nonfinancial sectors 3011.5 2946.5 3017.7 3284.1 3205.6 3209.3 3144.7 3094.4 3021.4 2964.3 2914.0 28
29 Household sector 2086.8 2031.3 1967.7 2184.5 2114.4 2089.7 2040.3 1977.4 1928.0 1869.6 1832.7 2930 Nonfinancial corporate business 270.2 257.5 241.5 238.7 230.8 246.1 239.0 249.1 226.3 232.1 231.1 3031 Nonfarm noncorporate business 49.7 52.7 69.1 78.0 77.5 77.6 76.6 75.9 74.7 73.4 71.9 3132 State and local governments 604.8 605.0 739.4 782.8 782.9 795.8 788.7 792.0 792.4 789.1 778.3 32
33 Federal government 200.2 205.4 219.1 258.0 259.6 261.6 262.7 265.4 266.6 267.6 267.8 3334 Rest of the world 1926.6 2257.3 2539.8 2676.2 2760.7 2809.9 2861.7 3004.6 3113.0 3200.4 3293.2 34
35 Financial sectors 14673.8 15901.8 17714.0 19519.4 19909.4 20255.2 20691.0 21160.3 21563.2 21898.6 22399.3 35
36 Monetary authority 393.1 431.4 452.5 478.1 501.9 505.1 511.5 511.8 523.9 535.1 534.1 36
37 Commercial banking 3707.7 4031.9 4335.7 4643.9 4725.0 4847.4 4931.0 5002.3 5015.7 5044.4 5096.5 3738 U.S.-chartered commercial banks 3175.8 3450.7 3761.2 4078.9 4171.3 4295.4 4368.2 4418.7 4424.4 4463.2 4508.8 3839 Foreign banking offices in U.S. 475.8 516.1 504.2 484.1 482.0 478.1 487.5 508.1 515.0 504.2 509.9 3940 Bank holding companies 22.0 27.4 26.5 32.7 22.1 23.0 21.3 20.5 22.3 21.6 21.3 4041 Banks in U.S.-affiliated areas 34.1 37.8 43.8 48.3 49.6 51.0 54.0 55.0 54.1 55.5 56.5 41
42 Savings institutions 933.2 928.5 964.6 1033.2 1045.8 1062.5 1082.2 1089.7 1101.6 1116.4 1119.0 4243 Credit unions 288.5 305.3 324.2 351.7 359.0 370.1 376.0 382.2 386.5 391.8 407.8 4344 Bank personal trusts and estates 232.0 207.0 194.1 222.0 226.7 230.2 234.6 239.1 241.8 245.1 247.3 44
45 Life insurance companies 1657.0 1751.1 1828.0 1886.0 1902.2 1914.1 1935.1 1943.9 1967.2 1996.9 2040.0 4546 Other insurance companies 491.2 515.3 521.1 518.2 515.4 510.8 512.4 509.4 510.0 510.0 512.3 4647 Private pension funds 627.0 674.6 731.0 775.9 787.6 793.8 810.0 817.2 823.7 822.0 821.7 4748 State and local govt. retirement funds 565.4 632.5 704.6 751.4 767.2 775.1 784.5 806.0 788.3 801.7 806.3 48
49 Money market mutual funds 634.3 721.9 965.9 1147.8 1217.1 1159.4 1212.5 1296.7 1403.8 1414.6 1498.0 4950 Mutual funds 820.2 901.1 1025.9 1073.1 1053.7 1073.9 1088.5 1099.9 1113.8 1160.1 1193.0 5051 Closed-end funds 100.8 98.3 103.7 111.1 109.0 106.9 104.8 102.7 100.6 98.5 96.4 5152 Government-sponsored enterprises 832.8 939.4 1253.9 1545.6 1584.0 1649.2 1704.3 1793.7 1864.7 1941.1 2009.5 5253 Federally related mortgage pools 1711.3 1825.8 2018.4 2292.2 2322.1 2355.2 2414.3 2491.6 2534.2 2635.8 2759.0 5354 ABS issuers 773.9 937.7 1219.4 1424.6 1453.8 1486.3 1522.9 1602.9 1660.5 1703.7 1774.7 54
55 Finance companies 545.1 568.2 645.5 742.5 776.6 812.3 830.0 850.5 848.0 878.5 859.4 5556 Mortgage companies 41.2 32.1 35.3 35.6 34.1 35.5 35.4 35.9 36.2 36.5 36.9 5657 REITs 30.4 50.6 45.5 42.9 38.8 38.2 37.3 36.6 37.6 37.9 39.8 5758 Brokers and dealers 167.7 182.6 189.4 154.7 194.8 188.2 243.3 223.6 312.3 288.4 369.9 5859 Funding corporations 121.0 166.7 155.3 288.8 294.5 341.0 320.4 324.7 292.7 240.1 177.8 59
(1) Excludes corporate equities and mutual fund shares.

Z.1, December 7, 2001 59
L.2 Credit Market Debt Owed by Nonfinancial SectorsBillions of dollars; amounts outstanding end of period, not seasonally adjusted
1996 1997 1998 1999 2000 2001 Q1 Q2 Q3 Q4 Q1 Q2 Q3
1 Domestic 14441.1 15245.1 16293.9 17428.5 17658.2 17839.9 18038.3 18320.9 18563.5 18746.8 19054.8 1
2 Federal government 3781.8 3804.9 3752.2 3681.0 3653.5 3464.0 3410.2 3385.2 3408.8 3251.4 3320.1 2 3 Treasury securities 3755.1 3778.3 3723.7 3652.8 3625.8 3435.7 3382.6 3357.8 3382.1 3224.4 3293.1 3 4 Budget agency secur. and mortgages 26.6 26.5 28.5 28.3 27.8 28.2 27.6 27.3 26.8 27.0 27.0 4
5 Nonfederal, by instrument 10659.4 11440.2 12541.7 13747.4 14004.7 14376.0 14628.1 14935.7 15154.7 15495.3 15734.8 5 6 Commercial paper 156.4 168.6 193.0 230.3 260.8 296.8 307.0 278.4 253.2 223.3 201.3 6 7 Municipal securities and loans 1296.0 1367.5 1464.3 1532.5 1539.2 1551.6 1550.3 1567.8 1597.5 1629.8 1635.3 7 8 Corporate bonds 1460.4 1610.9 1829.6 2059.5 2106.0 2144.5 2186.7 2230.6 2330.8 2437.8 2484.7 8 9 Bank loans n.e.c. 934.0 1040.4 1148.5 1231.2 1258.7 1306.9 1311.3 1334.2 1323.9 1292.9 1282.9 910 Other loans and advances 765.6 825.1 907.2 964.5 1008.3 1037.2 1039.5 1077.1 1083.4 1110.6 1116.0 10
11 Mortgages 4832.9 5156.2 5652.6 6283.3 6394.6 6562.6 6713.9 6854.5 6980.6 7192.8 7391.9 1112 Home 3720.0 3978.3 4368.2 4803.4 4879.4 5005.1 5124.3 5225.9 5319.5 5477.9 5623.1 1213 Multifamily residential 278.2 285.7 309.5 350.2 357.5 369.5 376.7 387.2 397.0 410.9 425.3 1314 Commercial 747.8 802.2 878.3 1027.3 1053.4 1081.2 1104.5 1132.5 1154.2 1190.9 1228.9 1415 Farm 86.9 90.0 96.6 102.3 104.2 106.8 108.3 108.8 109.9 113.1 114.6 1516 Consumer credit 1214.1 1271.6 1346.6 1446.1 1437.0 1476.5 1519.6 1593.1 1585.3 1608.1 1622.8 16
17 Nonfederal, by sector 10659.4 11440.2 12541.7 13747.4 14004.7 14376.0 14628.1 14935.7 15154.7 15495.3 15734.8 1718 Household sector 5223.9 5556.9 6024.1 6541.5 6608.3 6772.9 6938.9 7115.5 7186.3 7362.9 7531.7 1819 Nonfinancial business 4372.0 4763.8 5317.8 5953.8 6139.1 6337.4 6426.2 6540.9 6660.9 6794.6 6862.4 1920 Corporate 3093.0 3383.9 3790.2 4265.3 4415.3 4562.2 4618.0 4695.9 4785.7 4881.5 4922.8 2021 Nonfarm noncorporate 1129.3 1224.0 1363.7 1519.1 1553.1 1599.1 1630.3 1664.8 1695.5 1727.9 1753.9 2122 Farm 149.7 155.9 163.9 169.4 170.7 176.2 177.9 180.2 179.7 185.2 185.8 2223 State and local governments 1063.4 1119.5 1199.8 1252.1 1257.3 1265.7 1263.1 1279.3 1307.5 1337.8 1340.6 23
Foreign credit market debt24 held in U.S. 542.2 608.0 651.5 679.6 707.9 702.5 731.0 746.7 743.4 727.8 698.5 24
25 Commercial paper 67.5 65.1 72.9 89.2 101.6 101.2 109.8 120.9 112.8 110.1 106.3 2526 Bonds 366.3 427.7 462.6 479.4 491.3 484.5 502.4 504.6 508.9 504.9 479.6 2627 Bank loans n.e.c. 43.7 52.1 58.9 59.4 63.3 64.7 67.7 70.7 73.9 66.2 67.3 2728 Other loans and advances 64.7 63.0 57.2 51.7 51.7 52.1 51.2 50.5 47.7 46.6 45.3 28
29 Domestic and foreign 14983.3 15853.1 16945.4 18108.1 18366.1 18542.5 18769.3 19067.6 19306.9 19474.6 19753.3 29
L.3 Credit Market Debt Owed by Financial SectorsBillions of dollars; amounts outstanding end of period, not seasonally adjusted
1 By instrument 4828.8 5458.0 6545.2 7629.6 7769.2 7993.5 8190.8 8457.1 8657.3 8856.2 9121.0 1
2 Federal government-related 2608.2 2821.1 3292.0 3884.0 3940.1 4035.3 4164.0 4317.4 4422.9 4591.6 4796.8 2 3 Govt.-sponsored enterprise securities 896.9 995.3 1273.6 1591.7 1618.0 1680.2 1749.7 1825.8 1888.7 1955.8 2037.8 3 4 Mortgage pool securities 1711.3 1825.8 2018.4 2292.2 2322.1 2355.2 2414.3 2491.6 2534.2 2635.8 2759.0 4 5 U.S. government loans 0.0 0.0 0.0 0.0 0.0 0.0 0.0 0.0 0.0 0.0 0.0 5
6 Private financial sectors 2220.6 2636.9 3253.2 3745.6 3829.1 3958.1 4026.7 4139.7 4234.4 4264.6 4324.3 6 7 Open market paper 579.1 745.7 906.7 1082.9 1115.7 1135.2 1151.6 1210.7 1180.8 1144.5 1110.2 7 8 Corporate bonds 1382.7 1568.6 1878.7 2096.9 2138.8 2212.0 2269.7 2314.8 2424.3 2483.9 2563.8 8 9 Bank loans n.e.c. 64.0 77.3 107.5 93.2 91.8 93.1 92.8 93.0 97.3 100.4 100.0 910 Other loans and advances 162.9 198.5 288.7 395.8 404.4 436.9 430.2 438.3 450.9 450.7 467.2 1011 Mortgages 31.9 46.8 71.6 76.7 78.5 81.0 82.5 82.9 81.1 85.1 83.0 11
12 By sector 4828.8 5458.0 6545.2 7629.6 7769.2 7993.5 8190.8 8457.1 8657.3 8856.2 9121.0 12
13 Commercial banks 113.6 140.6 188.6 230.0 242.2 265.4 265.2 266.7 273.8 274.7 283.0 1314 Bank holding companies 150.0 168.6 193.5 219.3 221.4 229.3 236.9 242.5 266.5 269.0 273.8 1415 Savings institutions 140.5 160.3 212.4 260.4 266.9 280.7 276.0 287.7 295.1 294.4 303.9 1516 Credit unions 0.4 0.6 1.1 3.4 2.6 2.9 3.1 3.4 3.2 3.5 3.8 16
17 Life insurance companies 1.6 1.8 2.5 3.2 3.0 2.7 2.7 2.5 1.9 1.9 2.8 1718 Government-sponsored enterprises 896.9 995.3 1273.6 1591.7 1618.0 1680.2 1749.7 1825.8 1888.7 1955.8 2037.8 1819 Federally related mortgage pools 1711.3 1825.8 2018.4 2292.2 2322.1 2355.2 2414.3 2491.6 2534.2 2635.8 2759.0 1920 ABS issuers 863.3 1076.6 1398.0 1621.4 1655.8 1697.0 1742.3 1829.6 1893.7 1942.4 2020.2 20
21 Brokers and dealers 27.3 35.3 42.5 25.3 36.4 36.2 42.6 40.9 35.0 43.9 47.0 2122 Finance companies 534.5 568.3 625.5 695.7 708.4 740.8 761.8 776.9 756.2 769.0 771.3 2223 Mortgage companies 20.6 16.0 17.7 17.8 17.1 17.8 17.7 17.9 18.1 18.2 18.5 2324 REITs 56.5 96.1 158.8 165.1 167.9 170.4 169.8 167.8 166.2 168.9 166.3 2425 Funding corporations 312.4 372.6 412.6 504.0 507.4 515.0 508.7 503.7 524.7 478.6 433.6 25

60 Z.1, December 7, 2001
L.4 Credit Market Debt, All Sectors, by InstrumentBillions of dollars; amounts outstanding end of period, not seasonally adjusted
1996 1997 1998 1999 2000 2001 Q1 Q2 Q3 Q4 Q1 Q2 Q3
1 Total 19812.1 21311.1 23490.6 25737.7 26135.3 26535.9 26960.1 27524.7 27964.2 28330.8 28874.3 1
2 Open market paper 803.0 979.4 1172.6 1402.4 1478.1 1533.3 1568.3 1610.0 1546.8 1477.9 1417.8 2 3 U.S. government securities 6389.9 6626.0 7044.3 7565.0 7593.6 7499.3 7574.2 7702.6 7831.7 7843.0 8116.8 3 4 Municipal securities 1296.0 1367.5 1464.3 1532.5 1539.2 1551.6 1550.3 1567.8 1597.5 1629.8 1635.3 4 5 Corporate and foreign bonds 3209.4 3607.2 4170.8 4635.8 4736.1 4841.0 4958.7 5050.0 5264.0 5426.6 5528.1 5
6 Bank loans n.e.c. 1041.7 1169.8 1314.9 1383.8 1413.7 1464.6 1471.7 1497.9 1495.1 1459.5 1450.2 6 7 Other loans and advances 993.2 1086.6 1253.0 1412.0 1464.4 1526.2 1520.9 1565.9 1582.0 1607.9 1628.5 7 8 Mortgages 4864.8 5203.0 5724.2 6360.0 6473.1 6643.5 6796.4 6937.4 7061.7 7277.9 7474.9 8 9 Consumer credit 1214.1 1271.6 1346.6 1446.1 1437.0 1476.5 1519.6 1593.1 1585.3 1608.1 1622.8 9
Memo: Selected claims not included above:10 Corporate equities 10281.6 13301.7 15577.3 19581.2 20276.3 19395.9 19249.0 17566.4 15311.6 16239.1 13625.2 1011 Mutual fund shares 2342.4 2989.4 3610.5 4553.4 4863.3 4759.6 4814.4 4457.2 3999.8 4275.3 3705.2 11
L.5 Total Liabilities and Its Relation to Total Financial AssetsBillions of dollars; amounts outstanding end of period, not seasonally adjusted
Total credit market debt 1 (from table L.4) 19812.1 21311.1 23490.6 25737.7 26135.3 26535.9 26960.1 27524.7 27964.2 28330.8 28874.3 1
2 Official foreign exchange 53.7 48.9 60.1 50.1 46.6 46.0 44.9 46.1 42.8 43.4 49.0 2 3 SDR certificates 9.7 9.2 9.2 6.2 6.2 4.2 3.2 2.2 2.2 2.2 2.2 3 4 Treasury currency 18.9 19.3 19.9 20.9 21.4 22.1 23.2 23.2 22.9 23.2 23.2 4 5 Foreign deposits 521.7 618.5 642.3 703.6 781.9 782.8 772.6 824.5 883.4 846.8 850.6 5 6 Net interbank liabilities 240.8 219.4 189.0 204.5 169.7 210.6 173.2 188.0 155.1 163.1 176.8 6
7 Checkable deposits and currency 1244.8 1286.1 1333.4 1484.8 1392.9 1409.7 1385.7 1413.3 1385.2 1416.8 1453.0 7 8 Small time and savings deposits 2377.0 2474.1 2626.5 2671.2 2728.0 2738.8 2790.9 2861.9 2965.3 2992.3 3047.1 8 9 Large time deposits 590.9 713.4 805.5 936.1 966.5 987.4 1025.9 1054.5 1078.0 1087.1 1090.4 910 Money market fund shares 886.7 1042.5 1329.7 1578.8 1666.0 1627.1 1697.8 1812.1 1994.7 2014.8 2116.1 1011 Security RPs 701.5 822.4 913.7 1083.4 1149.4 1185.2 1238.6 1194.1 1199.7 1240.5 1287.8 11
12 Mutual fund shares 2342.4 2989.4 3610.5 4553.4 4863.3 4759.6 4814.4 4457.2 3999.8 4275.3 3705.2 1213 Security credit 358.1 469.1 572.3 676.6 801.1 780.3 805.8 822.7 785.4 781.5 904.6 1314 Life insurance reserves 610.6 665.0 718.3 783.9 801.0 806.5 818.7 819.1 823.0 840.3 841.5 1415 Pension fund reserves 6325.1 7323.4 8193.7 9041.7 9237.9 9166.7 9307.9 9054.8 8588.9 8849.7 8281.0 15
16 Trade payables 1827.6 1967.3 2076.5 2298.8 2321.7 2371.6 2418.2 2464.9 2436.3 2406.9 2412.2 1617 Taxes payable 128.8 151.1 172.4 194.7 210.1 211.4 214.7 216.4 224.8 224.0 254.9 1718 Investment in bank personal trusts 871.3 942.5 1001.0 1130.4 1158.0 1114.4 1106.7 1019.4 929.1 964.4 859.6 1819 Miscellaneous 6387.1 6730.7 7692.9 8269.8 8464.3 8731.9 9221.0 9104.9 9536.4 9763.7 10222.5 19
20 Total liabilities 45308.7 49803.3 55457.6 61426.6 62921.3 63492.5 64823.6 64903.9 65017.3 66266.6 66452.1 20
+ Financial assets not included in liabilities:21 Gold and SDRs 21.4 21.1 21.6 21.4 21.4 21.5 21.4 21.6 21.4 21.5 22.0 2122 Corporate equities 10281.6 13301.7 15577.3 19581.2 20276.3 19395.9 19249.0 17566.4 15311.6 16239.1 13625.2 2223 Household equity in noncorp. bus. 3786.6 4051.0 4394.1 4623.6 4652.1 4745.9 4782.7 4850.2 4882.4 4893.8 4897.1 23
- Liabilities not identified as assets:24 Treasury currency -6.1 -6.3 -6.4 -7.1 -7.6 -7.9 -7.6 -8.5 -9.4 -9.5 -9.7 2425 Foreign deposits 434.9 535.0 542.8 588.9 654.7 634.2 609.1 659.3 704.6 674.3 680.5 2526 Net interbank transactions -10.6 -32.2 -27.0 -25.5 -13.9 -11.6 -17.6 -4.3 1.7 5.5 6.3 26
27 Security RPs 109.8 172.9 233.5 263.6 410.5 423.0 446.0 374.6 353.7 396.2 394.1 2728 Taxes payable 81.9 104.2 122.9 122.7 118.7 134.5 124.4 128.4 113.3 133.2 152.1 2829 Miscellaneous -1226.5 -1548.9 -2323.1 -2740.5 -2908.3 -2939.4 -2727.8 -3224.6 -3066.2 -3040.8 -2760.7 29
- Floats not included in assets:30 Checkable deposits: Federal govt. -1.6 -8.1 -3.9 -9.9 -9.2 -5.6 -7.8 -2.3 -22.3 -40.1 -38.4 3031 Other 30.1 26.2 23.1 22.3 18.7 22.5 15.5 24.0 21.1 25.5 19.2 3132 Trade credit 165.7 126.8 76.6 120.9 50.2 16.5 6.0 91.6 38.4 21.8 35.7 32
33 Totals identified to sectors as assets 59820.7 67807.3 76812.0 87317.3 89557.3 89389.6 90436.5 89303.8 87097.8 89254.8 86517.1 33

Z.1, December 7, 2001 61
L.10 Assets and Liabilities of the Personal Sector (1)Billions of dollars; amounts outstanding end of period, not seasonally adjusted
1996 1997 1998 1999 2000 2001 Q1 Q2 Q3 Q4 Q1 Q2 Q3
1 Total financial assets 20898.0 24204.0 27231.5 31666.2 32499.0 31677.1 31572.9 30119.0 28215.9 29036.0 26982.9 1
2 Foreign deposits 35.5 37.2 38.3 43.5 48.6 48.6 48.0 51.3 49.8 45.8 43.3 2 3 Checkable deposits and currency 611.2 600.0 605.4 588.1 593.3 562.8 534.2 570.2 576.8 584.4 600.1 3 4 Time and savings deposits 2509.0 2651.6 2854.4 2963.9 3067.5 3133.5 3215.1 3273.1 3379.1 3424.9 3474.0 4 5 Money market fund shares 519.9 605.2 779.7 914.2 994.2 957.7 984.0 1055.6 1153.0 1088.4 1160.4 5
6 Securities 8397.6 10199.4 11517.4 14520.8 14848.3 14112.5 13755.7 12423.7 10866.1 11358.0 9755.8 6
7 Open market paper 54.7 56.1 63.7 67.7 68.9 70.2 71.4 72.7 67.2 62.7 58.9 7 8 U.S. savings bonds 187.0 186.5 186.6 186.4 185.3 184.6 184.3 184.8 184.8 185.5 186.4 8 9 Other Treasury securities 578.7 443.1 335.8 402.4 351.2 243.9 205.9 194.1 175.6 94.3 106.8 910 Agency securities 259.4 266.2 191.2 274.2 257.5 275.7 283.9 259.8 150.3 182.4 174.0 10
11 Municipal securities 435.8 471.9 489.8 530.1 532.6 546.9 546.7 544.9 563.2 578.4 558.7 1112 Corporate and foreign bonds 491.0 531.7 628.5 650.8 642.5 688.1 665.9 637.1 700.3 676.4 654.5 1213 Corporate equities (2) 4895.6 6302.5 7259.7 9342.8 9507.6 8862.9 8518.0 7487.1 6285.5 6643.8 5471.8 1314 Mutual fund shares 1495.4 1941.2 2362.0 3066.3 3302.7 3240.1 3279.5 3043.2 2739.3 2934.5 2544.7 14
15 Private life insurance reserves 580.1 632.7 684.7 748.9 765.7 770.6 782.7 782.7 786.5 803.1 804.3 1516 Private insured pension reserves 953.9 1086.1 1209.9 1367.3 1414.2 1403.2 1424.9 1373.8 1335.8 1379.8 1319.8 1617 Private noninsured pension reserves 3295.2 3793.6 4255.4 4728.0 4877.9 4799.4 4853.3 4644.6 4327.0 4471.8 4099.2 1718 Govt. insurance and pension reserves 2106.5 2476.0 2761.9 2981.3 2981.0 3000.0 3065.7 3072.8 2962.6 3035.3 2899.2 18
19 Investment in bank personal trusts 871.3 942.5 1001.0 1130.4 1158.0 1114.4 1106.7 1019.4 929.1 964.4 859.6 1920 Miscellaneous and other assets 1017.6 1179.8 1523.3 1679.7 1750.3 1774.4 1802.6 1851.8 1850.2 1880.1 1967.2 20
21 Total liabilities 7147.0 7722.4 8514.6 9366.2 9547.4 9773.3 9992.3 10187.0 10259.3 10490.8 10755.0 21
22 Mortgage debt on nonfarm homes 3712.2 3970.3 4358.8 4791.9 4867.4 4992.5 5111.1 5212.4 5305.1 5462.9 5607.7 2223 Other mortgage debt (3) 892.3 923.8 1010.3 1112.6 1132.5 1158.7 1181.4 1200.9 1222.2 1252.6 1283.2 2324 Consumer credit 1214.1 1271.6 1346.6 1446.1 1437.0 1476.5 1519.6 1593.1 1585.3 1608.1 1622.8 24
25 Policy loans 101.4 104.6 104.7 100.0 99.6 100.5 102.0 102.8 103.8 104.0 105.0 2526 Security credit 94.4 131.2 152.8 227.9 286.5 270.2 273.9 235.1 193.5 195.9 253.0 2627 Other liabilities (3) 1132.6 1320.8 1541.4 1687.7 1724.3 1774.8 1804.4 1842.6 1849.3 1867.4 1883.2 27
(1) Combined statement for household sector, nonfarm noncorporate business, and farm business.(2) Directly held and those in closed-end and exchange-traded funds. Other equities are included in mutual funds (line 14), life insurance and pension reserves (lines 15, 16, 17, and 18), and bank personal trusts (line 19).(3) Includes corporate farms.

62 Z.1, December 7, 2001
L.100 Households and Nonprofit Organizations (1)Billions of dollars; amounts outstanding end of period, not seasonally adjusted
1996 1997 1998 1999 2000 2001 Q1 Q2 Q3 Q4 Q1 Q2 Q3
1 Total financial assets 23976.5 27406.1 30447.9 34972.3 35807.7 35039.0 34952.6 33545.6 31654.8 32464.9 30403.8 1
2 Deposits 3440.7 3622.2 3953.3 4141.0 4327.3 4313.6 4384.2 4543.1 4738.4 4709.8 4835.9 2
3 Foreign deposits 35.5 37.2 38.3 43.5 48.6 48.6 48.0 51.3 49.8 45.8 43.3 3 4 Checkable deposits and currency 470.6 436.8 408.3 366.8 365.9 324.8 292.3 324.5 326.2 328.7 339.8 4 5 Time and savings deposits 2434.0 2565.9 2759.6 2859.1 2961.7 3025.8 3107.1 3164.3 3269.0 3313.5 3361.2 5 6 Money market fund shares 500.7 582.3 747.1 871.6 951.2 914.4 936.9 1003.0 1093.4 1021.8 1091.7 6
7 Credit market instruments 2086.8 2031.3 1967.7 2184.5 2114.4 2089.7 2040.3 1977.4 1928.0 1869.6 1832.7 7
8 Open market paper 54.7 56.1 63.7 67.7 68.9 70.2 71.4 72.7 67.2 62.7 58.9 8 9 U.S. government securities 998.4 865.0 676.7 829.2 762.7 676.6 648.2 615.0 489.8 444.0 452.4 910 Treasury 739.1 598.8 485.5 555.0 505.1 400.9 364.3 355.2 339.4 261.6 278.4 1011 Savings bonds 187.0 186.5 186.6 186.4 185.3 184.6 184.3 184.8 184.8 185.5 186.4 1112 Other Treasury 552.1 412.3 298.9 368.6 319.9 216.3 179.9 170.5 154.7 76.2 92.0 1213 Agency 259.4 266.2 191.2 274.2 257.5 275.7 283.9 259.8 150.3 182.4 174.0 13
14 Municipal securities 433.2 468.8 488.3 526.6 529.1 543.4 543.1 541.2 559.4 574.7 554.8 1415 Corporate and foreign bonds 491.0 531.7 628.5 650.8 642.5 688.1 665.9 637.1 700.3 676.4 654.5 1516 Mortgages 109.5 109.6 110.5 110.2 111.2 111.5 111.7 111.3 111.4 111.9 112.0 16
17 Corporate equities (2) 4895.6 6302.5 7259.7 9342.8 9507.6 8862.9 8518.0 7487.1 6285.5 6643.8 5471.8 1718 Mutual fund shares 1495.4 1941.2 2362.0 3066.3 3302.7 3240.1 3279.5 3043.2 2739.3 2934.5 2544.7 1819 Security credit 162.9 215.5 276.7 323.9 371.2 359.5 372.9 412.4 400.4 412.8 484.2 1920 Life insurance reserves 610.6 665.0 718.3 783.9 801.0 806.5 818.7 819.1 823.0 840.3 841.5 2021 Pension fund reserves 6325.1 7323.4 8193.7 9041.7 9237.9 9166.7 9307.9 9054.8 8588.9 8849.7 8281.0 2122 Investment in bank personal trusts 871.3 942.5 1001.0 1130.4 1158.0 1114.4 1106.7 1019.4 929.1 964.4 859.6 2223 Equity in noncorporate business 3786.6 4051.0 4394.1 4623.6 4652.1 4745.9 4782.7 4850.2 4882.4 4893.8 4897.1 2324 Miscellaneous assets 301.4 311.7 321.4 334.2 335.6 339.6 341.7 338.9 339.6 346.1 355.2 24
25 Total liabilities 5445.8 5824.8 6320.9 6921.6 7048.0 7198.2 7369.2 7508.8 7538.9 7718.9 7946.9 25
26 Credit market instruments 5223.9 5556.9 6024.1 6541.5 6608.3 6772.9 6938.9 7115.5 7186.3 7362.9 7531.7 26
27 Home mortgages (3) 3577.7 3818.1 4169.5 4558.9 4626.3 4740.5 4848.7 4941.5 5023.4 5171.3 5305.9 2728 Consumer credit 1214.1 1271.6 1346.6 1446.1 1437.0 1476.5 1519.6 1593.1 1585.3 1608.1 1622.8 2829 Municipal securities 104.9 114.9 126.9 137.3 138.0 141.4 141.9 143.0 144.2 145.3 147.5 29
30 Bank loans n.e.c. 58.0 66.5 72.7 65.4 69.3 71.4 67.1 73.5 63.4 59.3 65.7 3031 Other loans and advances 172.7 190.7 204.0 218.9 222.8 227.4 242.1 246.3 251.1 255.9 260.9 3132 Commercial mortgages 96.6 95.1 104.5 115.0 114.9 115.6 119.5 118.1 118.9 122.9 128.9 32
33 Security credit 94.4 131.2 152.8 227.9 286.5 270.2 273.9 235.1 193.5 195.9 253.0 3334 Trade payables 109.1 118.0 126.8 132.7 134.5 136.3 137.7 138.6 140.4 141.5 143.2 34 Deferred and unpaid35 life insurance premiums 18.3 18.6 17.2 19.4 18.7 18.9 18.8 19.6 18.7 18.5 19.0 35
(1) Sector includes farm households. Supplementary tables (tables F.100.a and L.100.a) show estimates of annual flows and year-end outstandings of nonprofit organizations.(2) Directly held and those in closed-end and exchange-traded funds. Other equities are included in mutual funds (line 18), life insurance and pension reserves (lines 20 and 21), and bank personal trusts (line 22).(3) Includes loans made under home equity lines of credit and home equity loans secured by junior liens, shown on table L.218, line 24.
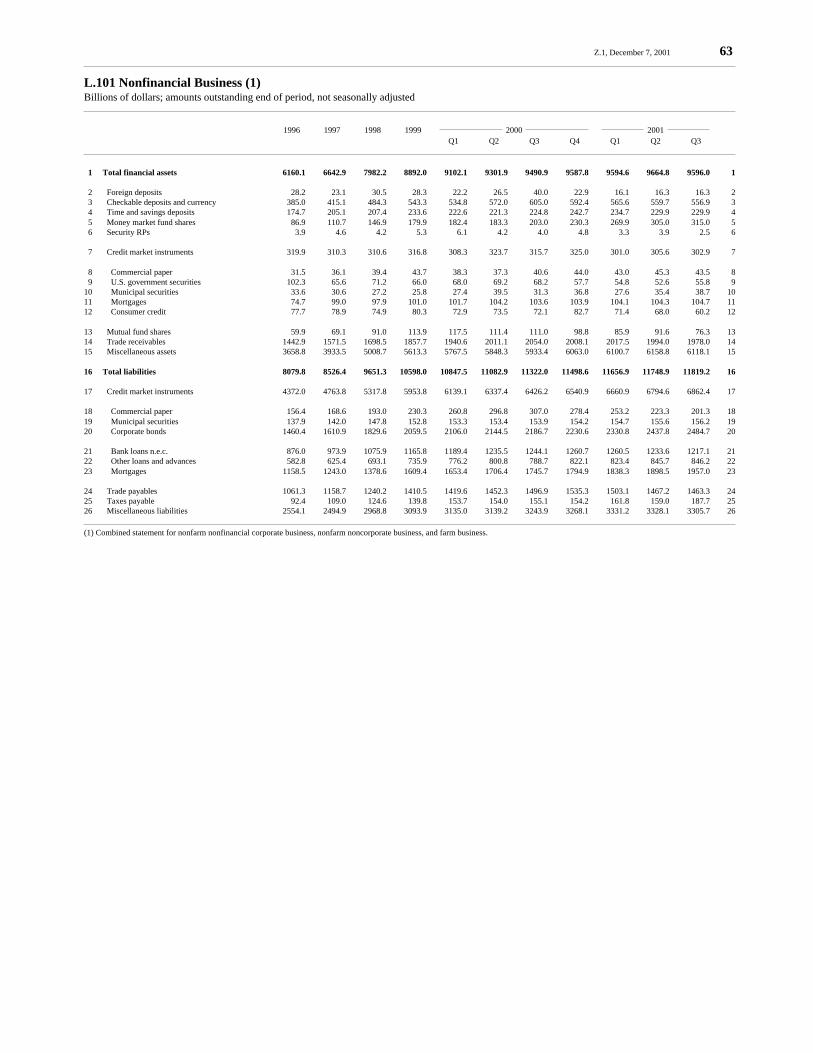
Z.1, December 7, 2001 63
L.101 Nonfinancial Business (1)Billions of dollars; amounts outstanding end of period, not seasonally adjusted
1996 1997 1998 1999 2000 2001 Q1 Q2 Q3 Q4 Q1 Q2 Q3
1 Total financial assets 6160.1 6642.9 7982.2 8892.0 9102.1 9301.9 9490.9 9587.8 9594.6 9664.8 9596.0 1
2 Foreign deposits 28.2 23.1 30.5 28.3 22.2 26.5 40.0 22.9 16.1 16.3 16.3 2 3 Checkable deposits and currency 385.0 415.1 484.3 543.3 534.8 572.0 605.0 592.4 565.6 559.7 556.9 3 4 Time and savings deposits 174.7 205.1 207.4 233.6 222.6 221.3 224.8 242.7 234.7 229.9 229.9 4 5 Money market fund shares 86.9 110.7 146.9 179.9 182.4 183.3 203.0 230.3 269.9 305.0 315.0 5 6 Security RPs 3.9 4.6 4.2 5.3 6.1 4.2 4.0 4.8 3.3 3.9 2.5 6
7 Credit market instruments 319.9 310.3 310.6 316.8 308.3 323.7 315.7 325.0 301.0 305.6 302.9 7
8 Commercial paper 31.5 36.1 39.4 43.7 38.3 37.3 40.6 44.0 43.0 45.3 43.5 8 9 U.S. government securities 102.3 65.6 71.2 66.0 68.0 69.2 68.2 57.7 54.8 52.6 55.8 910 Municipal securities 33.6 30.6 27.2 25.8 27.4 39.5 31.3 36.8 27.6 35.4 38.7 1011 Mortgages 74.7 99.0 97.9 101.0 101.7 104.2 103.6 103.9 104.1 104.3 104.7 1112 Consumer credit 77.7 78.9 74.9 80.3 72.9 73.5 72.1 82.7 71.4 68.0 60.2 12
13 Mutual fund shares 59.9 69.1 91.0 113.9 117.5 111.4 111.0 98.8 85.9 91.6 76.3 1314 Trade receivables 1442.9 1571.5 1698.5 1857.7 1940.6 2011.1 2054.0 2008.1 2017.5 1994.0 1978.0 1415 Miscellaneous assets 3658.8 3933.5 5008.7 5613.3 5767.5 5848.3 5933.4 6063.0 6100.7 6158.8 6118.1 15
16 Total liabilities 8079.8 8526.4 9651.3 10598.0 10847.5 11082.9 11322.0 11498.6 11656.9 11748.9 11819.2 16
17 Credit market instruments 4372.0 4763.8 5317.8 5953.8 6139.1 6337.4 6426.2 6540.9 6660.9 6794.6 6862.4 17
18 Commercial paper 156.4 168.6 193.0 230.3 260.8 296.8 307.0 278.4 253.2 223.3 201.3 1819 Municipal securities 137.9 142.0 147.8 152.8 153.3 153.4 153.9 154.2 154.7 155.6 156.2 1920 Corporate bonds 1460.4 1610.9 1829.6 2059.5 2106.0 2144.5 2186.7 2230.6 2330.8 2437.8 2484.7 20
21 Bank loans n.e.c. 876.0 973.9 1075.9 1165.8 1189.4 1235.5 1244.1 1260.7 1260.5 1233.6 1217.1 2122 Other loans and advances 582.8 625.4 693.1 735.9 776.2 800.8 788.7 822.1 823.4 845.7 846.2 2223 Mortgages 1158.5 1243.0 1378.6 1609.4 1653.4 1706.4 1745.7 1794.9 1838.3 1898.5 1957.0 23
24 Trade payables 1061.3 1158.7 1240.2 1410.5 1419.6 1452.3 1496.9 1535.3 1503.1 1467.2 1463.3 2425 Taxes payable 92.4 109.0 124.6 139.8 153.7 154.0 155.1 154.2 161.8 159.0 187.7 2526 Miscellaneous liabilities 2554.1 2494.9 2968.8 3093.9 3135.0 3139.2 3243.9 3268.1 3331.2 3328.1 3305.7 26
(1) Combined statement for nonfarm nonfinancial corporate business, nonfarm noncorporate business, and farm business.

64 Z.1, December 7, 2001
L.102 Nonfarm Nonfinancial Corporate BusinessBillions of dollars; amounts outstanding end of period, not seasonally adjusted
1996 1997 1998 1999 2000 2001 Q1 Q2 Q3 Q4 Q1 Q2 Q3
1 Total financial assets 5457.7 5808.7 6816.1 7564.2 7743.4 7896.8 8060.3 8131.3 8109.3 8151.2 8060.6 1
2 Foreign deposits 28.2 23.1 30.5 28.3 22.2 26.5 40.0 22.9 16.1 16.3 16.3 2 3 Checkable deposits and currency 244.3 251.9 287.1 321.9 307.3 333.9 363.1 346.6 315.0 304.0 296.7 3 4 Time and savings deposits 99.7 119.4 112.6 128.8 116.8 113.6 116.8 133.9 124.6 118.5 117.1 4 5 Money market fund shares 67.6 87.8 114.3 137.3 139.3 140.0 155.9 177.7 210.3 238.4 246.3 5 6 Security RPs 3.9 4.6 4.2 5.3 6.1 4.2 4.0 4.8 3.3 3.9 2.5 6
7 Commercial paper 31.5 36.1 39.4 43.7 38.3 37.3 40.6 44.0 43.0 45.3 43.5 7 8 U.S. government securities 75.6 34.8 34.2 32.1 36.7 41.6 42.3 34.0 33.9 34.5 41.0 8 9 Municipal securities 31.0 27.4 25.7 22.3 23.9 35.9 27.6 33.1 23.9 31.6 34.9 910 Mortgages 54.4 80.2 67.3 60.3 59.0 57.8 56.5 55.3 54.0 52.8 51.5 1011 Consumer credit 77.7 78.9 74.9 80.3 72.9 73.5 72.1 82.7 71.4 68.0 60.2 1112 Trade receivables 1273.1 1366.6 1452.9 1566.3 1639.0 1689.9 1728.6 1675.8 1680.3 1653.3 1633.9 1213 Mutual fund shares 59.9 69.1 91.0 113.9 117.5 111.4 111.0 98.8 85.9 91.6 76.3 13
14 Miscellaneous assets 3410.8 3628.7 4482.0 5023.6 5164.3 5231.1 5301.9 5421.8 5447.6 5493.0 5440.4 1415 U.S. direct investment abroad (1) 863.2 932.5 1048.4 1160.4 1194.5 1220.3 1252.3 1247.2 1284.2 1316.5 1339.5 1516 Insurance receivables 186.2 188.1 189.8 190.8 191.1 192.5 193.3 190.4 191.3 193.9 203.0 1617 Equity in GSEs 1.6 0.5 -0.2 -0.8 -0.8 -1.2 -1.1 -0.8 -6.5 -4.2 -10.8 1718 Investment in finance company subs. 27.3 23.5 17.1 43.9 53.6 47.5 50.0 51.3 48.6 46.7 45.4 1819 Other 2332.6 2484.1 3226.9 3629.3 3725.8 3771.9 3807.5 3933.7 3930.0 3940.1 3863.3 19
20 Total liabilities 6378.6 6628.8 7457.6 8153.4 8348.1 8507.9 8698.9 8820.5 8936.6 8976.9 9011.2 20
21 Credit market instruments 3093.0 3383.9 3790.2 4265.3 4415.3 4562.2 4618.0 4695.9 4785.7 4881.5 4922.8 21
22 Commercial paper 156.4 168.6 193.0 230.3 260.8 296.8 307.0 278.4 253.2 223.3 201.3 2223 Municipal securities (2) 137.9 142.0 147.8 152.8 153.3 153.4 153.9 154.2 154.7 155.6 156.2 2324 Corporate bonds (1) 1460.4 1610.9 1829.6 2059.5 2106.0 2144.5 2186.7 2230.6 2330.8 2437.8 2484.7 2425 Bank loans n.e.c. 642.1 692.7 774.5 847.5 868.3 902.5 909.0 921.8 923.2 898.7 886.5 25
26 Other loans and advances 467.9 507.7 562.0 596.5 632.2 653.7 639.9 669.9 670.6 688.8 693.2 2627 Savings institutions 7.9 9.4 12.1 15.3 16.7 17.7 19.0 19.7 20.7 21.9 21.8 2728 Finance companies 274.2 273.7 306.8 355.6 380.5 397.7 398.7 412.6 413.2 433.7 406.0 2829 Federal government 8.7 8.4 8.3 8.0 7.9 7.7 7.6 7.6 7.6 7.3 7.7 2930 Acceptance liabilities to banks 13.4 10.8 6.6 4.4 4.9 4.9 4.6 4.3 6.6 5.8 4.3 3031 Rest of the world 126.0 143.3 142.3 119.5 120.8 124.8 112.4 117.3 114.9 118.9 136.2 3132 ABS issuers 37.7 62.1 85.9 93.6 101.5 100.9 97.6 108.4 107.6 101.3 117.2 3233 Mortgages 228.4 262.1 283.4 378.8 394.7 411.4 421.4 441.1 453.3 477.3 501.0 33
34 Trade payables 927.0 992.1 1049.7 1194.1 1197.6 1220.3 1261.2 1295.7 1261.0 1221.2 1215.2 3435 Taxes payable 49.9 59.2 64.1 71.0 82.8 80.2 80.1 77.9 84.5 81.0 109.0 3536 Miscellaneous liabilities 2308.7 2193.6 2553.7 2622.9 2652.5 2645.1 2739.5 2751.0 2805.3 2793.3 2764.2 3637 Foreign direct investment in U.S. 698.4 749.6 804.6 945.5 960.8 1045.5 1101.3 1112.3 1156.1 1180.2 1184.6 3738 Pension fund contributions payable 86.4 93.5 95.4 96.4 96.7 96.9 97.2 97.4 97.7 97.9 98.2 3839 Other 1523.9 1350.5 1653.6 1581.0 1595.0 1502.7 1541.1 1541.2 1551.5 1515.1 1481.4 39
Memo:
40 Trade receivables net of payables 346.1 374.5 403.2 372.2 441.4 469.5 467.3 380.2 419.3 432.1 418.8 4041 Market value of equities 7644.4 9774.6 11606.7 15117.0 15727.7 14938.5 14458.4 12740.8 10989.6 11691.2 9681.6 41
42 Securities and mortgages 1826.6 2014.9 2260.8 2591.1 2654.0 2709.2 2762.0 2825.9 2938.8 3070.7 3141.9 4243 Loans and short-term paper 1266.4 1369.0 1529.4 1674.3 1761.3 1853.0 1855.9 1870.0 1847.0 1810.8 1780.9 43
44 Total short-term liabilities (3) 2243.3 2420.3 2643.2 2939.4 3041.7 3153.5 3197.3 3243.6 3192.5 3112.9 3105.1 4445 Total liquid assets (4) 641.7 654.3 739.1 833.7 808.2 844.6 901.2 895.8 856.0 884.1 874.5 45
Analytical measures (percent)46 Long-term debt/credit market debt 59.1 59.5 59.6 60.7 60.1 59.4 59.8 60.2 61.4 62.9 63.8 4647 Short-term debt/credit market debt 40.9 40.5 40.4 39.3 39.9 40.6 40.2 39.8 38.6 37.1 36.2 47
48 Liquid assets/short-term liabilities 28.6 27.0 28.0 28.4 26.6 26.8 28.2 27.6 26.8 28.4 28.2 48
(1) Through 1992:Q4, corporate bonds include net issues by Netherlands Antillean financial subsidiaries, and U.S. direct investment abroad excludes net inflows from those bond issues.(2) Industrial revenue bonds. Issued by state and local governments to finance private investment and secured in interest and principal by the industrial user of the funds.(3) Loans (except mortgages), short-term paper, taxes payable, and trade payables. Includes loans due in more than one year and excludes current maturities of bonds and mortgages.(4) Sum of lines 2 through 9, plus line 13.

Z.1, December 7, 2001 65
L.103 Nonfarm Noncorporate BusinessBillions of dollars; amounts outstanding end of period, not seasonally adjusted
1996 1997 1998 1999 2000 2001 Q1 Q2 Q3 Q4 Q1 Q2 Q3
1 Total financial assets 641.3 772.4 1101.8 1264.3 1295.3 1341.5 1367.0 1393.6 1422.4 1450.2 1471.4 1
2 Checkable deposits and currency 124.0 146.2 178.3 203.3 209.6 220.4 224.4 228.3 233.3 238.5 243.3 2 3 Time and savings deposits 75.0 85.7 94.8 104.8 105.8 107.7 108.0 108.8 110.1 111.4 112.8 3 4 Money market fund shares 19.2 22.9 32.6 42.6 43.1 43.2 47.2 52.6 59.6 66.6 68.8 4
5 Treasury securities 26.7 30.8 37.0 33.9 31.3 27.6 25.9 23.7 20.9 18.2 14.8 5 6 Municipal securities 2.6 3.2 1.5 3.5 3.5 3.6 3.6 3.7 3.7 3.8 3.8 6 7 Mortgages 20.4 18.7 30.7 40.7 42.7 46.5 47.0 48.6 50.1 51.5 53.2 7 8 Consumer credit 0.0 0.0 0.0 0.0 0.0 0.0 0.0 0.0 0.0 0.0 0.0 8
9 Trade receivables 169.8 204.9 245.6 291.4 301.6 321.2 325.5 332.2 337.2 340.7 344.0 910 Miscellaneous assets 203.5 259.9 481.4 544.1 557.7 571.2 585.3 595.7 607.5 619.5 630.7 1011 Insurance receivables 44.8 45.2 45.6 45.9 46.0 46.3 46.5 45.8 46.0 46.6 48.3 1112 Equity investment in GSEs (1) 1.7 1.7 1.6 1.6 1.7 1.6 1.6 1.6 1.6 1.5 1.5 1213 Other 157.1 213.0 434.2 496.6 510.0 523.3 537.2 548.3 559.9 571.3 580.8 13
14 Total liabilities 1534.1 1722.9 2010.2 2255.3 2309.5 2378.1 2424.3 2477.1 2520.6 2565.6 2601.3 14
15 Credit market instruments 1129.3 1224.0 1363.7 1519.1 1553.1 1599.1 1630.3 1664.8 1695.5 1727.9 1753.9 15
16 Bank loans n.e.c. 193.6 237.3 256.3 274.2 278.7 287.1 288.9 292.0 292.2 287.2 283.5 1617 Other loans and advances 92.5 95.8 108.9 116.7 119.9 123.7 125.4 127.8 128.2 132.6 128.9 1718 Mortgages 843.2 890.9 998.6 1128.3 1154.5 1188.3 1215.9 1245.0 1275.1 1308.2 1341.4 18
19 Trade payables 116.8 147.8 170.9 196.4 202.9 211.2 214.8 218.8 222.0 224.8 227.2 1920 Taxes payable 42.5 49.8 60.5 68.8 71.0 73.7 74.9 76.3 77.3 78.1 78.7 2021 Miscellaneous liabilities 245.5 301.3 415.1 471.0 482.5 494.1 504.3 517.2 525.9 534.8 541.5 21
(1) Equity in the Farm Credit System.
L.104 Farm Business (1)Billions of dollars; amounts outstanding end of period, not seasonally adjusted
1 Total financial assets 61.1 61.7 64.2 63.6 63.4 63.6 63.7 62.9 62.9 63.5 64.0 1
2 Checkable deposits and currency 16.7 16.9 18.8 18.0 17.8 17.6 17.5 17.4 17.2 17.1 17.0 2
3 Miscellaneous assets 44.4 44.8 45.4 45.6 45.6 46.0 46.2 45.5 45.6 46.3 47.0 3 4 Insurance receivables 42.9 43.3 43.7 43.9 44.0 44.4 44.5 43.9 44.1 44.7 45.3 4 5 Equity investment in GSEs (2) 1.5 1.5 1.7 1.6 1.5 1.6 1.6 1.6 1.6 1.7 1.7 5
6 Total liabilities 167.1 174.7 183.5 189.4 189.8 197.0 198.8 201.1 199.7 206.4 206.8 6
7 Credit market instruments 149.7 155.9 163.9 169.4 170.7 176.2 177.9 180.2 179.7 185.2 185.8 7
8 Bank loans n.e.c. 40.4 43.9 45.1 44.2 42.4 45.9 46.2 46.9 45.1 47.8 47.1 8 9 Other loans and advances 22.4 21.9 22.2 22.8 24.0 23.5 23.4 24.5 24.6 24.3 24.0 910 Mortgages 86.9 90.0 96.6 102.3 104.2 106.8 108.3 108.8 109.9 113.1 114.6 10
11 Trade payables 17.4 18.8 19.6 20.0 19.2 20.8 20.9 20.9 20.1 21.3 21.0 11
(1) Corporate and noncorporate farms.(2) Equity in the Farm Credit System.

66 Z.1, December 7, 2001
L.105 State and Local Governments (1)Billions of dollars; amounts outstanding end of period, not seasonally adjusted
1996 1997 1998 1999 2000 2001 Q1 Q2 Q3 Q4 Q1 Q2 Q3
1 Total financial assets 1007.9 1033.3 1180.3 1267.8 1278.6 1297.9 1305.8 1321.0 1337.5 1357.4 1361.5 1
2 Checkable deposits and currency 27.8 32.2 28.3 32.1 27.2 27.0 25.7 33.2 30.2 30.2 28.8 2 3 Time and savings deposits 72.6 78.4 91.1 102.1 98.9 100.7 103.4 111.5 109.9 107.1 107.4 3 4 Security RPs 147.8 151.4 158.5 163.5 176.4 174.0 177.0 173.3 178.0 182.3 192.5 4
5 Credit market instruments 604.8 605.0 739.4 782.8 782.9 795.8 788.7 792.0 792.4 789.1 778.3 5
6 Open market paper 59.7 74.0 102.0 103.9 105.6 110.0 109.0 111.5 112.5 108.2 113.2 6 7 U.S. government securities 373.2 354.8 448.3 474.3 470.5 476.4 467.9 467.2 461.9 460.2 439.4 7 8 Treasury 257.0 239.3 269.3 266.8 257.2 256.4 241.9 236.2 224.0 216.5 188.9 8 9 Agency 116.2 115.4 179.0 207.5 213.3 220.0 226.0 231.0 237.9 243.6 250.5 9
10 Municipal securities 4.6 3.9 2.5 1.0 0.6 1.0 1.8 1.6 2.1 2.0 2.1 1011 Corporate and foreign bonds 49.7 51.0 61.2 73.8 75.3 76.5 76.9 77.5 80.4 82.2 85.9 1112 Mortgages 117.6 121.3 125.4 129.8 130.9 132.0 133.1 134.3 135.4 136.6 137.8 12
13 Corporate equities 46.8 79.0 102.0 115.0 113.2 115.0 117.6 115.1 108.6 118.6 108.8 1314 Mutual fund shares 41.0 33.6 21.3 25.6 22.9 24.3 25.4 26.4 28.8 30.7 30.5 14
15 Taxes receivable 26.1 26.9 28.1 33.5 35.5 39.0 42.9 45.6 49.1 50.8 51.4 1516 Miscellaneous assets 41.0 27.0 11.5 13.1 21.5 21.9 25.0 24.1 40.5 48.6 63.8 16
17 Total liabilities 1581.0 1668.5 1779.3 1860.7 1874.1 1888.9 1892.6 1915.2 1949.6 1986.2 1995.4 17
18 Credit market instruments 1063.4 1119.5 1199.8 1252.1 1257.3 1265.7 1263.1 1279.3 1307.5 1337.8 1340.6 18
19 Municipal securities 1053.3 1110.6 1189.7 1242.4 1247.9 1256.7 1254.5 1270.6 1298.7 1328.9 1331.7 1920 Short-term 39.1 47.5 41.2 44.8 46.4 45.2 43.5 47.9 53.7 55.7 64.9 2021 Other 1014.1 1063.1 1148.5 1197.6 1201.5 1211.6 1211.0 1222.7 1244.9 1273.3 1266.8 2122 U.S. government loans 10.1 8.9 10.1 9.7 9.3 8.9 8.6 8.7 8.8 8.9 8.9 22
23 Trade payables 517.6 549.0 579.5 608.6 616.9 623.2 629.6 635.9 642.1 648.4 654.8 23
(1) Data for employee retirement funds are shown in table L.120.
L.106 Federal GovernmentBillions of dollars; amounts outstanding end of period, not seasonally adjusted
1 Total financial assets 440.7 437.9 442.9 557.4 537.6 532.4 538.3 506.5 537.2 540.0 561.7 1
2 Gold, SDRs, and official foreign exchange 44.9 42.0 51.0 44.4 41.3 41.0 39.7 41.0 38.7 39.5 44.6 2 3 Checkable deposits and currency 38.3 41.6 23.2 87.9 51.2 60.6 55.7 24.3 30.7 48.9 50.6 3 4 Time and savings deposits 2.4 3.4 4.7 5.4 5.5 5.7 6.2 6.3 8.4 9.9 11.7 4
5 Credit market instruments 200.2 205.4 219.1 258.0 259.6 261.6 262.7 265.4 266.6 267.6 267.8 5
6 Agency securities 0.0 0.0 0.0 0.0 0.0 0.0 0.0 0.0 0.0 0.0 0.0 6 7 Mortgages 50.3 45.7 44.9 77.7 76.8 76.8 76.5 76.9 76.3 76.2 75.3 7 8 Other loans and advances 149.9 159.7 174.2 180.3 182.8 184.7 186.2 188.6 190.3 191.4 192.5 8
9 Trade receivables 24.0 20.8 22.3 22.9 25.4 26.9 27.7 28.1 31.7 33.9 33.4 910 Taxes receivable 20.7 20.0 21.4 38.5 55.9 37.9 47.4 42.4 62.3 39.9 51.4 1011 Miscellaneous assets 110.2 104.8 101.2 100.3 98.7 98.7 98.8 98.9 98.8 100.4 102.1 11
12 Total liabilities 4491.3 4546.9 4529.4 4499.3 4463.0 4283.5 4244.8 4225.2 4255.1 4108.1 4187.0 12
13 SDR certificates 9.7 9.2 9.2 6.2 6.2 4.2 3.2 2.2 2.2 2.2 2.2 1314 Treasury currency 18.9 19.3 19.9 20.9 21.4 22.1 23.2 23.2 22.9 23.2 23.2 14
15 Credit market instruments 3781.8 3804.9 3752.2 3681.0 3653.5 3464.0 3410.2 3385.2 3408.8 3251.4 3320.1 15
16 Savings bonds 187.0 186.5 186.6 186.4 185.3 184.6 184.3 184.8 184.8 185.5 186.4 1617 Other Treasury securities 3568.1 3591.8 3537.1 3466.3 3440.5 3251.1 3198.2 3173.1 3197.3 3038.9 3106.7 1718 Budget agency securities 26.6 26.5 28.5 28.3 27.8 28.2 27.6 27.3 26.8 27.0 27.0 1819 Multifamily residential mortgages 0.0 0.0 0.0 0.0 0.0 0.0 0.0 0.0 0.0 0.0 0.0 19
20 Trade payables 81.8 72.9 64.9 65.6 67.0 67.5 68.4 66.9 64.8 62.9 59.7 2021 Insurance and pension reserves 591.9 634.0 676.5 719.0 708.2 719.2 733.3 741.3 749.8 762.1 775.4 2122 Miscellaneous liabilities 7.3 6.6 6.7 6.6 6.6 6.5 6.6 6.4 6.5 6.4 6.4 22
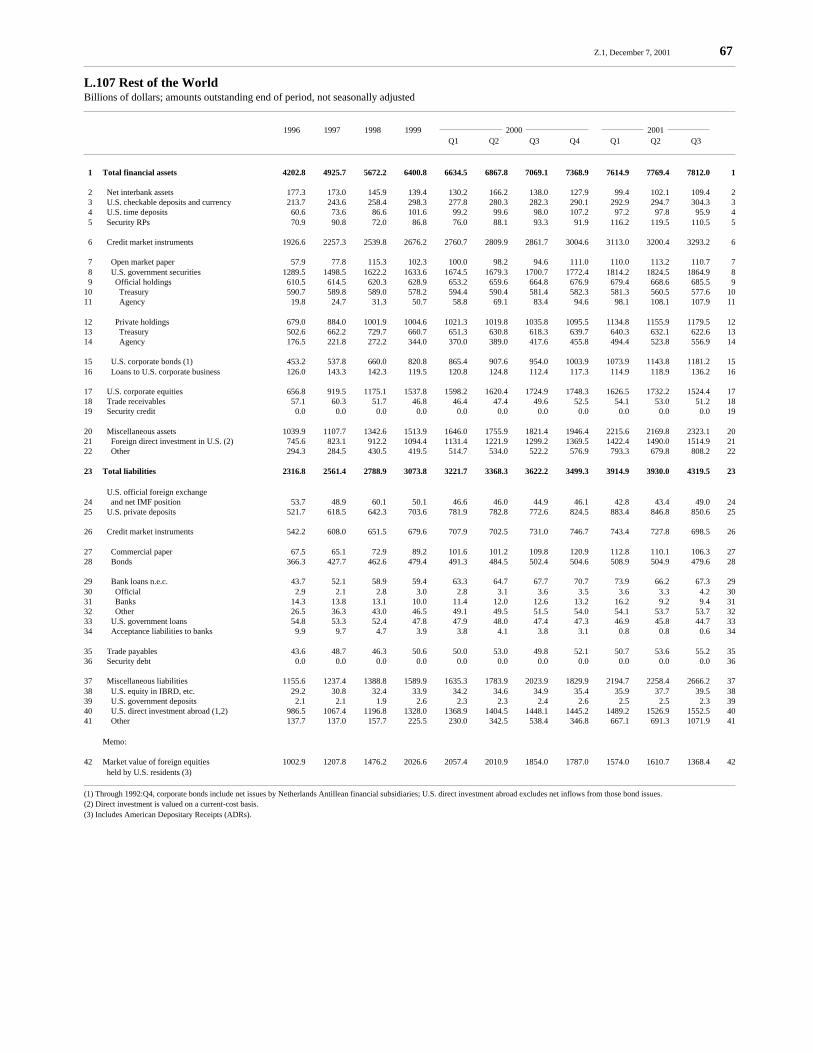
Z.1, December 7, 2001 67
L.107 Rest of the WorldBillions of dollars; amounts outstanding end of period, not seasonally adjusted
1996 1997 1998 1999 2000 2001 Q1 Q2 Q3 Q4 Q1 Q2 Q3
1 Total financial assets 4202.8 4925.7 5672.2 6400.8 6634.5 6867.8 7069.1 7368.9 7614.9 7769.4 7812.0 1
2 Net interbank assets 177.3 173.0 145.9 139.4 130.2 166.2 138.0 127.9 99.4 102.1 109.4 2 3 U.S. checkable deposits and currency 213.7 243.6 258.4 298.3 277.8 280.3 282.3 290.1 292.9 294.7 304.3 3 4 U.S. time deposits 60.6 73.6 86.6 101.6 99.2 99.6 98.0 107.2 97.2 97.8 95.9 4 5 Security RPs 70.9 90.8 72.0 86.8 76.0 88.1 93.3 91.9 116.2 119.5 110.5 5
6 Credit market instruments 1926.6 2257.3 2539.8 2676.2 2760.7 2809.9 2861.7 3004.6 3113.0 3200.4 3293.2 6
7 Open market paper 57.9 77.8 115.3 102.3 100.0 98.2 94.6 111.0 110.0 113.2 110.7 7 8 U.S. government securities 1289.5 1498.5 1622.2 1633.6 1674.5 1679.3 1700.7 1772.4 1814.2 1824.5 1864.9 8 9 Official holdings 610.5 614.5 620.3 628.9 653.2 659.6 664.8 676.9 679.4 668.6 685.5 910 Treasury 590.7 589.8 589.0 578.2 594.4 590.4 581.4 582.3 581.3 560.5 577.6 1011 Agency 19.8 24.7 31.3 50.7 58.8 69.1 83.4 94.6 98.1 108.1 107.9 11
12 Private holdings 679.0 884.0 1001.9 1004.6 1021.3 1019.8 1035.8 1095.5 1134.8 1155.9 1179.5 1213 Treasury 502.6 662.2 729.7 660.7 651.3 630.8 618.3 639.7 640.3 632.1 622.6 1314 Agency 176.5 221.8 272.2 344.0 370.0 389.0 417.6 455.8 494.4 523.8 556.9 14
15 U.S. corporate bonds (1) 453.2 537.8 660.0 820.8 865.4 907.6 954.0 1003.9 1073.9 1143.8 1181.2 1516 Loans to U.S. corporate business 126.0 143.3 142.3 119.5 120.8 124.8 112.4 117.3 114.9 118.9 136.2 16
17 U.S. corporate equities 656.8 919.5 1175.1 1537.8 1598.2 1620.4 1724.9 1748.3 1626.5 1732.2 1524.4 1718 Trade receivables 57.1 60.3 51.7 46.8 46.4 47.4 49.6 52.5 54.1 53.0 51.2 1819 Security credit 0.0 0.0 0.0 0.0 0.0 0.0 0.0 0.0 0.0 0.0 0.0 19
20 Miscellaneous assets 1039.9 1107.7 1342.6 1513.9 1646.0 1755.9 1821.4 1946.4 2215.6 2169.8 2323.1 2021 Foreign direct investment in U.S. (2) 745.6 823.1 912.2 1094.4 1131.4 1221.9 1299.2 1369.5 1422.4 1490.0 1514.9 2122 Other 294.3 284.5 430.5 419.5 514.7 534.0 522.2 576.9 793.3 679.8 808.2 22
23 Total liabilities 2316.8 2561.4 2788.9 3073.8 3221.7 3368.3 3622.2 3499.3 3914.9 3930.0 4319.5 23
U.S. official foreign exchange24 and net IMF position 53.7 48.9 60.1 50.1 46.6 46.0 44.9 46.1 42.8 43.4 49.0 2425 U.S. private deposits 521.7 618.5 642.3 703.6 781.9 782.8 772.6 824.5 883.4 846.8 850.6 25
26 Credit market instruments 542.2 608.0 651.5 679.6 707.9 702.5 731.0 746.7 743.4 727.8 698.5 26
27 Commercial paper 67.5 65.1 72.9 89.2 101.6 101.2 109.8 120.9 112.8 110.1 106.3 2728 Bonds 366.3 427.7 462.6 479.4 491.3 484.5 502.4 504.6 508.9 504.9 479.6 28
29 Bank loans n.e.c. 43.7 52.1 58.9 59.4 63.3 64.7 67.7 70.7 73.9 66.2 67.3 2930 Official 2.9 2.1 2.8 3.0 2.8 3.1 3.6 3.5 3.6 3.3 4.2 3031 Banks 14.3 13.8 13.1 10.0 11.4 12.0 12.6 13.2 16.2 9.2 9.4 3132 Other 26.5 36.3 43.0 46.5 49.1 49.5 51.5 54.0 54.1 53.7 53.7 3233 U.S. government loans 54.8 53.3 52.4 47.8 47.9 48.0 47.4 47.3 46.9 45.8 44.7 3334 Acceptance liabilities to banks 9.9 9.7 4.7 3.9 3.8 4.1 3.8 3.1 0.8 0.8 0.6 34
35 Trade payables 43.6 48.7 46.3 50.6 50.0 53.0 49.8 52.1 50.7 53.6 55.2 3536 Security debt 0.0 0.0 0.0 0.0 0.0 0.0 0.0 0.0 0.0 0.0 0.0 36
37 Miscellaneous liabilities 1155.6 1237.4 1388.8 1589.9 1635.3 1783.9 2023.9 1829.9 2194.7 2258.4 2666.2 3738 U.S. equity in IBRD, etc. 29.2 30.8 32.4 33.9 34.2 34.6 34.9 35.4 35.9 37.7 39.5 3839 U.S. government deposits 2.1 2.1 1.9 2.6 2.3 2.3 2.4 2.6 2.5 2.5 2.3 3940 U.S. direct investment abroad (1,2) 986.5 1067.4 1196.8 1328.0 1368.9 1404.5 1448.1 1445.2 1489.2 1526.9 1552.5 4041 Other 137.7 137.0 157.7 225.5 230.0 342.5 538.4 346.8 667.1 691.3 1071.9 41
Memo:
42 Market value of foreign equities 1002.9 1207.8 1476.2 2026.6 2057.4 2010.9 1854.0 1787.0 1574.0 1610.7 1368.4 42 held by U.S. residents (3)
(1) Through 1992:Q4, corporate bonds include net issues by Netherlands Antillean financial subsidiaries; U.S. direct investment abroad excludes net inflows from those bond issues.(2) Direct investment is valued on a current-cost basis.(3) Includes American Depositary Receipts (ADRs).

68 Z.1, December 7, 2001
L.108 Monetary Authority (1)Billions of dollars; amounts outstanding end of period, not seasonally adjusted
1996 1997 1998 1999 2000 2001 Q1 Q2 Q3 Q4 Q1 Q2 Q3
1 Total financial assets 495.2 534.0 566.8 696.9 604.1 609.8 608.5 636.0 625.3 638.6 663.5 1
2 Gold and foreign exchange 30.2 28.0 30.7 27.1 26.8 26.5 26.6 26.6 25.5 25.4 26.3 2 3 SDR certificates 9.7 9.2 9.2 6.2 6.2 4.2 3.2 2.2 2.2 2.2 2.2 3 4 Treasury currency 25.0 25.6 26.3 28.0 29.0 30.0 30.8 31.6 32.3 32.7 32.9 4
5 Federal Reserve float 4.3 0.7 1.6 -0.2 -0.2 -0.0 0.4 0.9 0.2 -0.4 -0.4 5 6 Fed. Res. loans to domestic banks 0.1 2.0 0.0 0.2 0.2 0.5 0.4 0.1 0.0 0.2 0.1 6 7 Security RPs 21.6 23.8 30.4 140.6 23.7 26.9 17.3 43.4 22.0 23.3 47.9 7
8 Credit market instruments 393.1 431.4 452.5 478.1 501.9 505.1 511.5 511.8 523.9 535.1 534.1 8
9 Acceptances 0.0 0.0 0.0 0.0 0.0 0.0 0.0 0.0 0.0 0.0 0.0 910 U.S. government securities 393.1 431.4 452.5 478.1 501.9 505.1 511.5 511.8 523.9 535.1 534.1 1011 Treasury 390.9 430.7 452.1 478.0 501.7 505.0 511.4 511.7 523.9 535.1 534.1 1112 Agency 2.2 0.7 0.3 0.2 0.2 0.1 0.1 0.1 0.0 0.0 0.0 1213 Bank loans n.e.c. 0.0 0.0 0.0 0.0 0.0 0.0 0.0 0.0 0.0 0.0 0.0 13
14 Miscellaneous assets 11.2 13.2 16.1 16.8 16.5 16.6 18.3 19.3 19.3 20.2 20.5 14
15 Total liabilities 490.7 528.8 560.9 690.5 596.1 605.7 604.7 629.2 618.8 631.3 655.9 15
16 Depository institution reserves 24.5 30.8 26.3 24.0 18.2 18.5 17.6 19.0 17.8 18.6 24.9 1617 Vault cash of commercial banks 45.2 45.0 42.1 66.5 35.2 37.0 34.5 44.4 36.0 37.2 36.6 17
18 Checkable deposits and currency 413.6 443.5 481.8 590.4 532.7 540.6 542.9 555.2 556.1 567.3 586.1 1819 Due to federal government 8.0 5.7 6.2 28.5 4.5 6.3 8.6 5.6 6.1 7.6 10.2 1920 Due to rest of the world 0.2 0.5 0.2 0.1 0.2 0.1 0.2 0.3 0.1 0.1 0.6 2021 Currency outside banks 405.5 437.4 475.4 561.8 528.0 534.1 534.1 549.3 549.8 559.5 575.3 21
22 Miscellaneous liabilities 7.4 9.5 10.7 9.4 10.0 9.6 9.6 10.6 8.8 8.2 8.2 2223 Federal Reserve Bank stock 4.6 5.4 6.0 6.4 6.7 6.9 6.9 7.0 7.0 7.1 7.3 2324 Other 2.8 4.0 4.8 3.0 3.3 2.8 2.7 3.6 1.8 1.0 0.9 24
(1) Assets and liabilities of Federal Reserve Banks and Treasury monetary accounts that supply or absorb bank reserves. Excludes the accounts of the Federal Reserve Board.

Z.1, December 7, 2001 69
L.109 Commercial Banking (1)Billions of dollars; amounts outstanding end of period, not seasonally adjusted
1996 1997 1998 1999 2000 2001 Q1 Q2 Q3 Q4 Q1 Q2 Q3
1 Total financial assets 4710.4 5174.6 5642.2 5989.3 6065.7 6228.3 6368.1 6487.8 6505.8 6574.0 6688.6 1
2 Vault cash 45.2 45.0 42.1 66.5 35.2 37.0 34.5 44.4 36.0 37.2 36.6 2 3 Reserves at Federal Reserve 22.3 29.1 24.4 22.0 16.6 16.9 16.5 18.0 16.8 17.6 23.7 3 4 Checkable deposits and currency 1.4 1.4 2.0 2.2 1.9 2.1 1.4 1.7 1.9 1.7 2.5 4
5 Total bank credit 3794.5 4144.5 4483.3 4782.0 4882.5 5011.6 5105.9 5194.7 5223.4 5235.4 5280.4 5
6 U.S. government securities 757.5 841.2 876.6 925.0 931.5 920.8 912.8 903.1 887.6 872.8 914.3 6 7 Treasury 261.8 270.1 214.0 226.7 215.6 201.4 200.9 182.2 171.9 176.0 175.9 7 8 Agency 495.7 571.2 662.6 698.3 715.9 719.4 711.8 720.9 715.7 696.8 738.3 8
9 Municipal securities 94.2 96.7 104.8 110.7 111.9 112.3 113.4 114.0 112.7 116.2 117.9 910 Corporate and foreign bonds 112.3 143.1 181.1 219.9 214.1 219.0 253.5 277.5 290.5 325.8 337.9 10
11 Total loans 2821.1 3052.9 3304.8 3504.9 3602.1 3736.9 3801.9 3875.3 3909.0 3895.7 3889.0 1112 Open market paper 6.5 2.7 1.1 1.4 1.4 1.4 1.3 1.5 0.6 0.0 0.0 1213 Bank loans n.e.c. 1041.7 1169.8 1314.9 1383.8 1413.7 1464.6 1471.7 1497.9 1495.1 1459.5 1450.2 1314 Mortgages 1145.4 1245.3 1337.0 1495.2 1546.5 1614.1 1648.1 1659.3 1688.1 1723.3 1736.1 1415 Consumer credit 526.8 512.6 508.9 499.8 497.1 506.2 521.8 541.5 533.7 540.2 535.3 1516 Security credit 100.8 122.5 142.9 124.8 143.4 150.6 159.0 175.2 191.6 172.7 167.4 16
17 Corporate equities 6.8 2.6 6.8 10.4 10.5 10.5 11.8 11.0 7.7 8.8 6.4 1718 Mutual fund shares 2.6 8.1 9.2 11.1 12.4 12.2 12.5 13.8 15.9 16.0 15.0 18
19 Customers’ liab. on acceptances (2) 23.4 20.6 11.3 8.2 8.7 9.0 8.4 7.5 7.4 6.6 4.8 1920 Miscellaneous assets 823.7 934.0 1079.1 1108.3 1120.8 1151.7 1201.4 1221.5 1220.2 1275.5 1340.4 20
21 Total liabilities 4547.4 5053.0 5519.3 5836.9 5932.5 6138.2 6253.0 6364.7 6418.6 6482.4 6643.6 21
22 Net interbank liabilities 171.1 143.5 120.6 113.9 116.3 155.1 121.1 124.6 101.3 107.3 115.3 2223 To monetary authority 4.4 2.8 1.7 -0.0 0.0 0.5 0.7 1.0 0.2 -0.2 -0.3 2324 To domestic banks (3) -10.6 -32.2 -27.0 -25.5 -13.9 -11.6 -17.6 -4.3 1.7 5.5 6.3 2425 To foreign banks 177.3 173.0 145.9 139.4 130.2 166.2 138.0 127.9 99.4 102.1 109.4 25
26 Checkable deposits 676.3 656.4 623.0 626.2 574.9 574.0 537.0 541.0 495.3 503.4 507.7 2627 Federal government 28.7 27.8 13.2 49.6 37.5 48.7 39.3 16.4 2.2 1.2 1.9 2728 Rest of the world 26.9 31.7 30.2 43.6 29.9 31.4 32.6 34.1 34.8 33.8 34.7 2829 Private domestic 620.7 597.0 579.7 533.1 507.4 493.9 465.1 490.5 458.4 468.4 471.1 29
30 Small time and savings deposits 1613.2 1761.5 1945.2 2016.5 2077.5 2100.3 2156.2 2229.8 2311.6 2342.3 2395.4 3031 Large time deposits 493.1 601.0 673.3 792.3 816.4 833.6 864.5 887.2 900.0 901.3 890.7 3132 Federal funds and security RPs (net) 463.2 552.2 639.2 749.8 777.6 827.4 827.5 813.4 838.7 822.7 812.1 32
33 Credit market instruments 263.6 309.2 382.1 449.3 463.6 494.7 502.0 509.3 540.3 543.7 556.8 33
34 Open market paper 55.7 58.5 56.9 63.1 59.7 61.7 62.9 63.6 71.2 69.4 67.5 3435 Corporate bonds 168.9 192.6 220.2 240.6 248.9 258.4 266.6 273.2 293.1 295.3 303.2 3536 Other loans and advances 39.0 58.1 104.9 145.6 155.0 174.6 172.6 172.4 176.1 179.0 186.1 36
37 Taxes payable 4.0 5.4 7.1 9.0 9.5 10.0 10.6 11.1 11.7 12.3 12.9 3738 Miscellaneous liabilities 863.0 1023.7 1128.7 1079.9 1096.8 1143.2 1234.1 1248.4 1219.7 1249.4 1352.7 38
Memo:
39 Credit market funds advanced (4) 3707.7 4031.9 4335.7 4643.9 4725.0 4847.4 4931.0 5002.3 5015.7 5044.4 5096.5 39
(1) U.S.-chartered commercial banks, foreign banking offices in U.S., bank holding companies, and banks in U.S.-affiliated areas. IBFs are excluded from domestic banking and treated the same as branches in foreign countries.(2) Included in other loans and advances (table L.216).(3) Floats and discrepancies in interbank transactions.(4) Total bank credit (line 5) less security credit (line 16) less corporate equities (line 17) less mutual fund shares (line 18) plus customers’ liability on acceptances (line 19).

70 Z.1, December 7, 2001
L.110 U.S.-Chartered Commercial BanksBillions of dollars; amounts outstanding end of period, not seasonally adjusted
1996 1997 1998 1999 2000 2001 Q1 Q2 Q3 Q4 Q1 Q2 Q3
1 Total financial assets 3444.5 3742.2 4094.2 4433.0 4507.6 4627.6 4700.2 4772.9 4788.5 4830.2 4915.8 1
2 Vault cash and reserves at Federal Reserve 66.3 71.2 65.5 87.1 51.4 53.3 50.6 62.0 52.3 54.4 59.7 2
3 Total bank credit 3231.5 3512.2 3844.4 4161.3 4263.5 4381.3 4453.3 4512.3 4524.1 4566.4 4618.8 3
4 U.S. government securities 609.7 664.0 703.5 730.9 752.2 747.1 729.3 714.2 690.8 691.6 722.4 4 5 Treasury 173.0 166.8 124.7 122.8 125.3 116.4 108.6 87.9 72.2 69.9 65.3 5 6 Agency 436.7 497.2 578.8 608.1 626.9 630.7 620.7 626.3 618.6 621.7 657.1 6 7 Mortgage pool securities 216.6 247.7 301.4 283.6 289.8 289.9 283.5 297.8 308.2 323.5 346.0 7 8 Agency-issued CMOs 89.5 107.0 115.9 120.8 120.4 119.2 108.8 111.0 114.7 116.4 133.6 8 9 Other agency securities 130.7 142.4 161.5 203.7 216.8 221.6 228.5 217.6 195.7 181.8 177.6 9
10 Municipal securities 93.7 96.1 104.4 110.1 111.2 111.7 112.7 113.3 112.3 115.9 117.6 1011 Corporate and foreign bonds 64.8 85.8 118.2 161.5 156.2 162.6 195.7 214.0 229.7 242.1 258.7 1112 Private mortgage pool securities 4.2 3.0 3.9 4.8 3.5 2.5 3.4 4.1 7.9 8.6 8.0 1213 Privately issued CMOs 21.8 22.5 42.8 48.5 46.1 47.0 51.0 56.5 57.5 64.0 53.9 1314 Other bonds 38.9 60.4 71.5 108.2 106.6 113.2 141.3 153.4 164.3 169.5 196.9 14
15 Total loans 2453.9 2655.6 2902.4 3137.3 3221.1 3337.1 3391.2 3446.0 3467.8 3492.0 3498.7 1516 Open market paper 4.2 2.3 0.8 0.7 0.7 0.6 0.6 0.9 0.0 0.0 0.0 1617 Bank loans n.e.c. 759.8 867.9 1012.2 1104.4 1131.9 1178.7 1186.5 1202.6 1197.5 1179.3 1170.7 1718 Mortgages 1102.9 1208.4 1304.2 1464.8 1515.0 1581.1 1614.7 1626.3 1654.4 1688.8 1700.3 1819 Consumer credit 526.8 512.6 508.9 499.8 497.1 506.2 521.8 541.5 533.7 540.2 535.3 1920 Security credit 60.2 64.4 76.3 67.6 76.5 70.5 67.5 74.7 82.2 83.7 92.6 20
21 Corporate equities 6.8 2.6 6.8 10.4 10.5 10.5 11.8 11.0 7.7 8.8 6.4 2122 Mutual fund shares 2.6 8.1 9.2 11.1 12.4 12.2 12.5 13.8 15.9 16.0 15.0 22
23 Customers’ liab. on acceptances (1) 13.9 13.7 9.1 6.6 7.1 7.3 6.8 5.9 6.0 5.3 3.9 2324 Miscellaneous assets 132.8 145.2 175.2 177.9 185.7 185.8 189.6 192.8 206.1 204.1 233.4 24
25 Total liabilities 3598.7 3959.7 4366.8 4684.0 4789.8 4958.9 5023.0 5107.0 5181.0 5227.7 5376.3 25
26 Net interbank liabilities 0.4 2.9 25.1 55.7 57.1 103.0 87.9 77.8 113.2 126.3 109.2 2627 Federal Reserve float 4.3 0.7 1.6 -0.2 -0.2 -0.0 0.4 0.9 0.2 -0.4 -0.4 2728 Borrowing from Federal Reserve banks 0.1 2.0 0.0 0.2 0.2 0.5 0.4 0.1 0.0 0.2 0.1 2829 To domestic banks -41.8 -50.2 -51.0 -65.1 -65.0 -66.2 -65.1 -73.8 -21.0 -24.6 -16.1 2930 To foreign banks 37.8 50.4 74.4 120.8 122.1 168.7 152.3 150.6 134.1 151.2 125.6 30
31 Checkable deposits 661.4 640.3 605.9 608.6 558.4 556.5 520.8 523.8 478.7 486.1 490.2 3132 Federal government 28.7 27.8 13.2 49.6 37.5 48.7 39.3 16.4 2.2 1.2 1.9 3233 Rest of the world 21.6 26.0 24.8 37.6 24.4 25.3 27.5 28.4 29.3 30.9 31.9 3334 Private domestic 611.1 586.5 567.9 521.5 496.5 482.5 454.0 479.0 447.2 454.0 456.3 34
35 Small time and savings deposits 1594.2 1738.0 1924.4 1996.8 2058.0 2079.7 2136.2 2207.2 2290.4 2314.1 2370.9 3536 Large time deposits 306.1 369.3 404.1 465.6 480.4 511.4 530.0 553.5 548.8 551.3 549.0 3637 Federal funds and security RPs (net) 408.2 471.7 538.5 667.3 693.7 721.3 705.5 680.1 698.5 705.6 706.2 37
38 Acceptance liabilities 14.0 13.7 9.1 6.6 7.0 7.2 6.8 6.0 6.0 5.4 4.1 3839 Corporate bonds 50.9 61.6 72.1 75.8 78.3 81.6 83.9 86.4 89.9 89.0 91.8 3940 Other loans and advances 39.0 58.1 104.9 145.6 155.0 174.6 172.6 172.4 176.1 179.0 186.1 4041 Taxes payable 4.0 5.4 7.1 9.0 9.5 10.0 10.6 11.1 11.7 12.3 12.9 41
42 Miscellaneous liabilities 520.6 598.7 675.5 653.0 692.5 713.6 768.7 788.7 767.6 758.6 856.0 4243 Investment by bank holding companies 372.9 413.6 469.0 471.9 492.1 501.0 514.8 525.4 541.8 552.2 577.8 4344 Other 147.7 185.1 206.6 181.2 200.4 212.6 253.9 263.3 225.8 206.4 278.2 44
Memo:
45 Credit market funds advanced (2) 3175.8 3450.7 3761.2 4078.9 4171.3 4295.4 4368.2 4418.7 4424.4 4463.2 4508.8 45
(1) Included in other loans and advances (table L.216).(2) Total bank credit (line 3) less security credit (line 20) less corporate equities (line 21) less mutual fund shares (line 22) plus customers’ liability on acceptances (line 23).

Z.1, December 7, 2001 71
L.111 Foreign Banking Offices in U.S. (1)Billions of dollars; amounts outstanding end of period, not seasonally adjusted
1996 1997 1998 1999 2000 2001 Q1 Q2 Q3 Q4 Q1 Q2 Q3
1 Total financial assets 714.8 811.3 806.5 756.1 720.1 743.2 769.9 785.9 757.9 759.2 754.7 1
2 Reserves at Federal Reserve 1.1 2.9 1.0 1.4 0.5 0.6 0.4 0.5 0.6 0.5 0.6 2
3 Total bank credit 507.0 567.2 568.6 539.7 547.2 556.4 577.3 607.0 622.9 591.9 583.9 3
4 U.S. government securities 130.4 157.3 151.8 163.6 157.4 151.1 159.1 163.6 173.1 157.9 167.8 4 5 Treasury 80.7 95.1 84.8 92.3 86.9 81.6 89.0 91.7 97.8 104.3 108.4 5 6 Agency 49.7 62.2 67.0 71.3 70.5 69.5 70.1 71.9 75.3 53.5 59.4 6 7 Municipal securities 0.0 0.0 0.0 0.0 0.0 0.0 0.0 0.0 0.0 0.0 0.0 7 8 Corporate and foreign bonds 36.6 41.3 47.1 42.0 43.0 43.0 43.7 49.6 45.9 69.4 64.9 8
9 Total loans 339.9 368.6 369.7 334.1 346.8 362.3 374.5 393.8 403.9 364.6 351.1 910 Open market paper 2.3 0.4 0.3 0.6 0.8 0.8 0.7 0.6 0.6 0.0 0.0 1011 Bank loans n.e.c. 264.8 284.0 282.2 259.9 262.2 263.9 265.1 275.7 276.8 259.0 258.3 1112 Mortgages 32.2 26.1 20.6 16.4 17.0 17.5 17.3 17.1 17.1 16.7 17.9 1213 Security credit 40.6 58.0 66.6 57.2 66.8 80.1 91.5 100.5 109.4 88.9 74.9 13
14 Corporate equities 0.0 0.0 0.0 0.0 0.0 0.0 0.0 0.0 0.0 0.0 0.0 14
15 Customers’ liab. on acceptances (2) 9.4 6.9 2.2 1.6 1.6 1.7 1.6 1.6 1.5 1.2 0.9 1516 Miscellaneous assets 197.2 234.3 234.6 213.3 170.7 184.4 190.5 176.8 133.0 165.6 169.4 16
17 Total liabilities 731.9 830.8 828.7 781.5 746.3 770.3 797.9 814.9 787.8 790.1 786.7 17
18 Net interbank liabilities 178.6 148.2 92.8 51.6 21.3 14.9 2.5 10.1 -19.8 -14.3 3.9 1819 To foreign banks 162.1 144.4 92.7 44.2 13.1 4.5 -4.3 -14.4 -37.4 -54.9 -31.1 1920 To domestic banks 16.5 3.8 0.1 7.4 8.1 10.4 6.8 24.4 17.5 40.6 35.0 20
21 Checkable deposits 8.0 8.8 8.6 9.1 8.3 9.3 8.1 8.8 8.2 8.2 8.8 2122 Small time and savings deposits 8.7 13.1 9.5 7.5 7.2 7.7 6.5 9.0 7.7 13.5 9.3 2223 Large time deposits 176.6 221.3 257.8 314.5 323.7 309.3 321.0 320.1 337.8 335.2 326.5 23
24 Federal funds and security RPs (net) 55.1 80.7 100.4 82.1 83.2 104.9 120.9 134.5 139.6 116.3 105.0 2425 Acceptance liabilities 9.6 7.2 2.4 2.0 2.0 2.0 1.9 2.0 1.8 1.4 1.0 25
26 Miscellaneous liabilities 295.2 351.5 357.2 314.7 300.7 322.2 337.0 330.5 312.6 329.7 332.1 2627 Foreign direct investment in U.S. 30.3 38.8 44.2 63.3 68.4 68.9 69.7 72.9 73.2 77.1 79.2 2728 Due to affiliates 64.5 78.8 90.6 93.0 114.6 114.5 119.9 138.7 142.3 137.3 113.5 2829 Other 200.5 233.9 222.4 158.4 117.7 138.8 147.4 119.0 97.1 115.4 139.3 29
Memo:
30 Credit market funds advanced (3) 475.8 516.1 504.2 484.1 482.0 478.1 487.5 508.1 515.0 504.2 509.9 30
(1) Branches and agencies of foreign banks, Edge Act and Agreement corporations, New York investment companies (through 1996:Q2), and American Express Bank.(2) Included in other loans and advances (table L.216).(3) Total bank credit (line 3) less security credit (line 13) less corporate equities (line 14) plus customers’ liability on acceptances (line 15).

72 Z.1, December 7, 2001
L.112 Bank Holding CompaniesBillions of dollars; amounts outstanding end of period, not seasonally adjusted
1996 1997 1998 1999 2000 2001 Q1 Q2 Q3 Q4 Q1 Q2 Q3
1 Total financial assets 510.8 575.3 685.9 741.0 778.1 795.7 833.4 865.7 896.4 916.2 950.8 1
2 Credit market instruments 22.0 27.4 26.5 32.7 22.1 23.0 21.3 20.5 22.3 21.6 21.3 2
3 U.S. government securities 9.0 9.5 7.5 14.1 5.7 6.0 6.2 5.6 6.2 6.0 5.8 3 4 Treasury issues 4.0 4.0 0.9 8.8 0.9 1.1 1.1 0.8 0.8 0.9 0.8 4 5 Agency 4.9 5.5 6.6 5.4 4.7 5.0 5.1 4.8 5.4 5.1 5.0 5 6 Corporate and foreign bonds 10.5 15.5 14.8 15.9 14.6 12.9 13.3 13.2 13.4 12.9 12.8 6 7 Bank loans n.e.c. 2.5 2.4 4.1 2.6 1.9 4.0 1.8 1.6 2.7 2.7 2.6 7
8 Miscellaneous assets 488.9 547.9 659.5 708.4 756.0 772.7 812.1 845.2 874.1 894.6 929.5 8 9 Investment in bank subsidiaries 372.9 413.6 469.0 471.9 492.1 501.0 514.8 525.4 541.8 552.2 577.8 910 Investment in nonbank subsidiaries 64.9 89.9 134.0 151.2 184.4 184.9 198.9 213.5 227.3 237.0 240.7 1011 Other 51.1 44.4 56.5 85.4 79.6 86.8 98.4 106.3 105.0 105.5 111.1 11
12 Total liabilities 178.3 218.8 270.6 314.5 338.9 349.7 370.0 382.5 390.0 399.6 417.1 12
13 Net interbank liabilities -7.9 -7.6 2.7 6.6 37.9 37.2 30.7 36.7 7.9 -4.8 2.1 1314 To domestic banks 14.7 14.3 23.9 32.1 43.0 44.2 40.7 45.1 5.2 -10.6 -12.7 1415 To foreign banks -22.6 -21.9 -21.3 -25.5 -5.0 -7.0 -10.0 -8.4 2.7 5.8 14.8 15
16 Federal funds and security RPs (net) -0.2 -0.2 0.4 0.5 0.7 1.2 1.1 -1.1 0.6 0.7 0.9 16
17 Credit market instruments 150.0 168.6 193.5 219.3 221.4 229.3 236.9 242.5 266.5 269.0 273.8 1718 Commercial paper 32.0 37.6 45.4 54.5 50.8 52.4 54.1 55.7 63.4 62.7 62.4 1819 Corporate bonds 118.0 131.0 148.1 164.8 170.6 176.8 182.7 186.8 203.2 206.4 211.4 19
20 Miscellaneous liabilities 36.3 57.9 74.1 88.1 78.9 82.1 101.4 104.4 115.0 134.6 140.2 20
L.113 Banks in U.S.-Affiliated Areas (1)Billions of dollars; amounts outstanding end of period, not seasonally adjusted
1 Total financial assets 40.3 45.8 55.5 59.2 59.9 61.8 64.7 63.3 63.0 68.3 67.2 1
2 Checkable deposits and currency 1.4 1.4 2.0 2.2 1.9 2.1 1.4 1.7 1.9 1.7 2.5 2
3 Credit market instruments 34.1 37.8 43.8 48.3 49.6 51.0 54.0 55.0 54.1 55.5 56.5 3
4 U.S. government securities 8.4 10.5 13.8 16.3 16.2 16.5 18.2 19.6 17.6 17.4 18.2 4 5 Treasury 4.1 4.2 3.6 2.8 2.5 2.4 2.2 1.8 1.2 0.9 1.4 5 6 Agency 4.3 6.3 10.2 13.5 13.7 14.2 16.0 17.8 16.4 16.5 16.8 6 7 Municipal securities 0.5 0.5 0.5 0.6 0.7 0.7 0.7 0.7 0.4 0.4 0.3 7 8 Corporate and foreign bonds 0.3 0.4 1.0 0.5 0.4 0.4 0.7 0.8 1.5 1.3 1.4 8
9 Bank loans n.e.c. 14.6 15.5 16.3 16.9 17.8 18.0 18.4 18.0 18.1 18.6 18.6 910 Home mortgages 6.3 6.4 7.5 8.1 8.4 9.0 9.4 9.1 7.1 7.6 7.6 1011 Commercial mortgages 3.9 4.4 4.8 6.0 6.1 6.4 6.7 6.8 9.5 10.2 10.3 11
12 Miscellaneous assets 4.8 6.6 9.7 8.7 8.4 8.8 9.2 6.6 7.1 11.1 8.2 12
13 Total liabilities 38.6 43.7 53.1 56.9 57.5 59.3 62.0 60.4 59.8 65.0 63.6 13
14 Checkable deposits 6.9 7.3 8.5 8.5 8.2 8.2 8.1 8.4 8.4 9.0 8.8 1415 Small time and savings deposits 10.4 10.4 11.4 12.2 12.3 12.9 13.5 13.6 13.4 14.8 15.2 1516 Large time deposits 10.4 10.4 11.4 12.2 12.3 12.9 13.5 13.6 13.4 14.8 15.2 16
17 Miscellaneous liabilities 10.9 15.6 21.9 24.1 24.7 25.3 26.9 24.8 24.5 26.4 24.5 17
(1) Commercial banks and branches of U.S.-chartered commercial banks located in Puerto Rico, the U.S. Virgin Islands, American Samoa, Guam, and other U.S.-affiliated insular areas.

Z.1, December 7, 2001 73
L.114 Savings Institutions (1)Billions of dollars; amounts outstanding end of period, not seasonally adjusted
1996 1997 1998 1999 2000 2001 Q1 Q2 Q3 Q4 Q1 Q2 Q3
1 Total financial assets 1031.7 1028.6 1088.4 1151.4 1160.4 1182.5 1202.9 1218.6 1254.9 1274.0 1287.6 1
2 Reserves at Federal Reserve 2.3 1.8 1.9 2.0 1.6 1.6 1.1 1.0 1.0 1.0 1.2 2 3 Checkable deposits and currency 14.2 15.2 18.4 20.1 16.3 17.5 17.5 19.7 19.6 21.7 21.8 3 4 Time and savings deposits 1.4 1.0 1.5 1.3 1.9 1.3 1.1 1.4 1.7 2.4 2.2 4 5 Federal funds and security RPs 10.0 9.2 14.8 10.6 11.5 12.0 14.7 14.9 21.7 22.0 25.8 5
6 Credit market instruments 933.2 928.5 964.6 1033.2 1045.8 1062.5 1082.2 1089.7 1101.6 1116.4 1119.0 6
7 Open market paper 0.3 0.0 0.0 0.0 0.0 0.0 0.0 0.0 0.0 0.0 0.0 7 8 U.S. government securities 173.4 169.8 153.7 157.4 152.2 149.1 148.4 149.3 153.5 158.2 155.4 8 9 Treasury 17.4 14.6 10.2 10.1 9.9 9.1 8.8 8.7 8.0 7.5 6.6 910 Agency 156.1 155.3 143.6 147.3 142.2 140.0 139.6 140.6 145.5 150.7 148.9 10
11 Municipal securities 2.1 2.1 2.5 3.0 3.1 3.0 3.0 3.2 3.9 4.0 4.1 1112 Corporate and foreign bonds 68.6 58.7 88.6 112.0 115.7 110.6 107.3 109.5 96.0 93.2 88.1 1213 Other loans and advances 15.7 18.8 24.2 30.7 33.4 35.4 37.9 39.3 41.4 43.8 43.6 1314 Mortgages 628.3 631.8 644.0 668.6 682.4 703.5 723.1 723.8 741.4 751.9 758.6 1415 Consumer credit 44.7 47.2 51.6 61.5 59.0 61.0 62.5 64.6 65.5 65.3 69.1 15
16 Corporate equities 17.8 23.3 24.5 23.8 23.7 24.2 24.4 24.2 24.6 25.6 27.1 1617 Miscellaneous assets 52.9 49.7 62.8 60.3 59.5 63.4 61.9 67.7 84.6 84.8 90.4 17
18 Total liabilities 1010.5 1001.0 1058.6 1120.4 1129.4 1150.7 1170.4 1186.7 1222.8 1241.4 1253.5 18
19 Deposits 721.4 695.7 693.1 699.9 705.3 707.0 718.4 727.4 750.0 755.5 769.2 1920 Checkable 122.4 149.5 185.6 222.7 234.0 244.7 254.9 265.9 278.7 291.9 303.5 2021 Small time and savings 512.5 448.2 393.8 354.9 342.2 331.0 324.1 319.4 318.9 307.2 298.0 2122 Large time 86.4 98.1 113.7 122.2 129.1 131.3 139.4 142.2 152.4 156.4 167.6 22
23 Security RPs 43.7 41.8 51.3 72.7 73.5 75.0 81.2 66.7 67.1 69.6 54.6 23
24 Credit market instruments 140.5 160.3 212.4 260.4 266.9 280.7 276.0 287.7 295.1 294.4 303.9 2425 Corporate bonds 2.7 2.8 2.6 2.7 2.7 2.7 3.4 6.3 2.8 6.4 6.1 2526 Bank loans n.e.c. 15.9 19.4 29.7 14.0 20.4 21.3 20.8 21.5 22.6 21.7 23.3 2627 Other loans and advances 121.9 138.0 180.1 243.7 243.8 256.7 251.8 260.0 269.7 266.4 274.5 27
28 Taxes payable 1.4 1.8 2.0 2.0 1.7 1.8 2.1 2.4 2.3 2.0 2.0 2829 Miscellaneous liabilities 103.5 101.4 99.8 85.4 82.0 86.1 92.7 102.5 108.4 119.8 123.7 2930 Investment by parent 4.7 5.0 5.4 6.0 6.1 6.3 6.4 6.6 6.8 7.0 7.2 3031 Other 98.8 96.4 94.4 79.4 75.9 79.8 86.2 95.9 101.6 112.8 116.6 31
(1) Savings and loan associations, mutual savings banks, and federal savings banks.

74 Z.1, December 7, 2001
L.115 Credit UnionsBillions of dollars; amounts outstanding end of period, not seasonally adjusted
1996 1997 1998 1999 2000 2001 Q1 Q2 Q3 Q4 Q1 Q2 Q3
1 Total financial assets 330.1 353.8 391.5 414.5 428.3 429.7 435.6 441.1 466.5 480.7 496.4 1
2 Checkable deposits and currency 7.5 8.1 9.1 26.4 26.4 24.0 17.6 12.2 15.0 18.1 25.0 2 3 Time and savings deposits 16.4 17.0 23.4 16.6 18.8 16.6 15.2 17.1 20.9 19.0 18.7 3 4 Federal funds and security RPs 1.4 3.5 6.8 9.3 9.6 2.8 7.8 4.0 10.8 8.3 7.9 4
5 Credit market instruments 288.5 305.3 324.2 351.7 359.0 370.1 376.0 382.2 386.5 391.8 407.8 5
6 Open market paper 0.3 0.2 0.4 1.9 0.8 0.3 1.2 1.2 1.1 1.6 1.3 6 7 U.S. government securities 68.1 66.7 71.5 70.9 74.8 74.7 69.5 69.2 76.4 72.8 80.6 7 8 Treasury 17.4 15.6 13.1 9.6 9.4 8.8 8.6 8.2 8.0 6.6 6.4 8 9 Agency 50.7 51.0 58.4 61.3 65.4 65.8 60.9 60.9 68.4 66.3 74.1 9
10 Home mortgages 76.0 86.0 96.9 111.0 114.1 119.1 124.0 127.4 126.2 130.9 140.2 1011 Consumer credit 144.1 152.4 155.4 167.9 169.2 176.0 181.3 184.4 182.8 186.4 185.7 11
12 Mutual fund shares 2.6 2.4 3.6 2.5 3.2 2.3 2.2 2.2 2.0 3.6 3.1 1213 Miscellaneous assets 13.7 17.6 24.3 8.0 11.3 13.9 16.7 23.4 31.2 39.9 33.8 13
14 Total liabilities 300.1 320.6 355.3 376.1 388.7 389.5 394.1 398.1 422.3 435.8 450.6 14
15 Shares/deposits 295.1 315.4 349.0 366.7 380.7 380.5 383.5 389.1 415.6 426.3 441.3 1516 Checkable 32.5 36.6 43.0 45.4 51.3 50.4 50.9 51.3 55.2 54.2 55.6 1617 Small time and savings 251.2 264.4 287.5 299.8 308.3 307.6 310.6 312.7 334.8 342.8 353.7 1718 Large time 11.4 14.4 18.5 21.6 21.1 22.5 22.0 25.1 25.6 29.3 32.0 18
19 Other loans and advances 0.4 0.6 1.1 3.4 2.6 2.9 3.1 3.4 3.2 3.5 3.8 1920 Miscellaneous liabilities 4.6 4.6 5.2 6.0 5.4 6.1 7.5 5.6 3.5 6.0 5.5 20
L.116 Bank Personal Trusts and Estates (1)Billions of dollars; amounts outstanding end of period, not seasonally adjusted
1 Total financial assets 841.2 917.7 976.3 1104.1 1131.4 1087.5 1079.6 992.1 901.7 936.9 832.2 1
2 Deposits 51.1 48.2 54.4 62.7 63.8 65.1 65.9 67.0 68.0 69.0 70.1 2 3 Checkable deposits and currency 0.8 0.8 0.3 0.3 0.3 0.3 0.3 0.3 0.3 0.2 0.2 3 4 Time and savings deposits 9.0 10.0 7.8 8.7 9.0 9.2 9.3 9.4 9.5 9.6 9.7 4 5 Money market fund shares 41.4 37.4 46.2 53.7 54.5 55.6 56.3 57.4 58.2 59.2 60.2 5
6 Credit market instruments 232.0 207.0 194.1 222.0 226.7 230.2 234.6 239.1 241.8 245.1 247.3 6
7 Open market paper 21.1 21.0 16.5 17.1 17.3 17.4 17.6 17.7 16.7 15.8 14.9 7 8 U.S. government securities 71.3 61.2 56.8 62.5 63.3 64.1 65.2 66.3 66.7 67.4 67.6 8 9 Treasury 25.7 20.4 17.3 17.3 17.1 16.9 16.7 16.5 16.2 15.8 15.4 910 Agency 45.6 40.8 39.4 45.2 46.2 47.2 48.5 49.8 50.6 51.6 52.2 10
11 Municipal securities 104.0 90.7 89.5 100.3 102.1 103.0 104.3 105.0 105.8 106.3 106.7 1112 Corporate and foreign bonds 31.9 31.1 28.5 39.8 41.8 43.5 45.4 48.0 50.5 53.6 56.1 1213 Mortgages 3.6 3.0 2.8 2.2 2.2 2.2 2.1 2.1 2.0 2.0 2.0 13
14 Corporate equities 248.9 321.0 314.0 338.3 345.1 323.8 318.6 280.0 239.8 251.9 206.2 1415 Mutual fund shares 293.2 326.9 390.8 460.6 475.8 449.2 441.3 387.0 333.4 352.2 290.3 15
16 Miscellaneous assets 16.0 14.6 23.0 20.5 20.0 19.3 19.3 19.0 18.7 18.6 18.3 16
17 Total liabilities (2) 871.3 942.5 1001.0 1130.4 1158.0 1114.4 1106.7 1019.4 929.1 964.4 859.6 17
(1) Includes personal trusts and estates administered by nondeposit noninsured trust companies.(2) Equal to value of tangible and financial assets. These liabilities are assets of the household sector.

Z.1, December 7, 2001 75
L.117 Life Insurance CompaniesBillions of dollars; amounts outstanding end of period, not seasonally adjusted
1996 1997 1998 1999 2000 2001 Q1 Q2 Q3 Q4 Q1 Q2 Q3
1 Total financial assets 2246.3 2514.8 2769.5 3067.9 3155.5 3153.0 3203.9 3135.7 3103.0 3198.5 3139.8 1
2 Checkable deposits and currency 4.3 8.1 5.4 5.5 4.0 5.6 3.7 5.0 17.8 23.5 24.6 2 3 Money market fund shares 61.9 92.8 110.4 133.8 135.1 133.7 136.6 142.3 164.7 186.7 192.9 3
4 Credit market instruments 1657.0 1751.1 1828.0 1886.0 1902.2 1914.1 1935.1 1943.9 1967.2 1996.9 2040.0 4
5 Open market paper 48.4 65.9 73.4 75.8 72.0 73.7 75.2 71.2 60.4 58.9 66.0 5 6 U.S. government securities 337.4 312.1 288.4 287.1 289.7 290.3 292.5 293.5 297.4 297.2 301.3 6 7 Treasury 93.2 85.5 71.3 62.8 61.7 60.5 59.5 58.1 53.8 48.7 44.2 7 8 Agency 244.1 226.7 217.0 224.4 228.0 229.8 233.0 235.4 243.6 248.5 257.0 8
9 Municipal securities 13.4 16.7 18.4 20.1 20.0 19.6 19.4 19.1 19.5 20.4 20.7 910 Corporate and foreign bonds 949.3 1046.0 1130.4 1173.2 1192.5 1198.2 1212.2 1222.2 1252.0 1280.2 1310.0 1011 Policy loans 100.5 103.7 103.8 99.0 98.7 99.6 101.1 101.9 102.9 103.0 104.1 1112 Mortgages 208.2 206.8 213.6 230.8 229.4 232.6 234.7 235.9 235.1 237.1 237.9 12
13 Corporate equities 414.1 558.6 733.2 964.5 1027.6 1007.8 1023.3 940.8 873.2 926.4 820.8 1314 Mutual fund shares 35.3 38.4 23.3 43.3 47.8 48.6 51.1 48.1 42.6 46.1 39.1 14
15 Miscellaneous assets 73.7 65.7 69.2 34.9 38.7 43.1 54.0 55.6 37.5 18.9 22.5 15
16 Total liabilities 2115.6 2359.7 2599.7 2882.8 2963.5 2958.8 3003.1 2942.8 2902.2 2994.5 2939.6 16
17 Other loans and advances 1.6 1.8 2.5 3.2 3.0 2.7 2.7 2.5 1.9 1.9 2.8 1718 Life insurance reserves 580.1 632.7 684.7 748.9 765.7 770.6 782.7 782.7 786.5 803.1 804.3 1819 Pension fund reserves (1) 953.9 1086.1 1209.9 1367.3 1414.2 1403.2 1424.9 1373.8 1335.8 1379.8 1319.8 19
20 Taxes payable 12.5 13.7 14.9 16.2 16.5 16.9 17.3 17.8 18.2 18.7 19.2 2021 Miscellaneous liabilities 567.5 625.4 687.7 747.2 764.1 765.3 775.4 766.1 759.8 791.0 793.5 21
(1) Annuity reserves held by life insurance companies, excluding unallocated contracts held by private pension funds, which are included in miscellaneous liabilities (line 21).
L.118 Other Insurance CompaniesBillions of dollars; amounts outstanding end of period, not seasonally adjusted
1 Total financial assets 770.0 843.5 879.1 875.9 879.8 877.6 879.3 871.6 851.4 863.1 863.5 1
2 Checkable deposits and currency 3.9 4.2 4.0 4.3 3.1 2.7 3.1 3.7 10.6 11.8 13.1 2 3 Security RPs 35.4 35.2 42.7 28.3 34.8 35.3 35.8 38.3 27.8 26.6 30.9 3
4 Credit market instruments 491.2 515.3 521.1 518.2 515.4 510.8 512.4 509.4 510.0 510.0 512.3 4
5 U.S. government securities 171.8 161.9 140.0 136.2 135.8 135.4 136.4 136.2 133.3 132.8 132.4 5 6 Treasury 120.9 91.1 70.4 60.6 58.3 56.0 54.3 52.1 48.1 46.1 44.3 6 7 Agency 51.0 70.8 69.7 75.5 77.5 79.4 82.1 84.1 85.2 86.7 88.1 7
8 Municipal securities 175.4 191.6 208.1 199.0 194.7 190.4 188.1 184.1 185.3 184.8 185.1 8 9 Corporate and foreign bonds 141.6 159.5 171.1 181.1 182.3 183.3 186.2 187.5 189.7 190.7 193.1 910 Commercial mortgages 2.4 2.2 2.0 1.9 2.5 1.8 1.7 1.6 1.6 1.7 1.7 10
11 Corporate equities 148.6 186.0 200.1 207.9 205.3 203.9 199.4 194.3 172.2 179.9 169.6 1112 Trade receivables 57.2 59.9 61.5 63.6 66.1 67.2 68.7 64.6 67.6 71.2 73.8 1213 Miscellaneous assets 33.6 42.8 49.7 53.8 55.1 57.7 60.0 61.4 63.3 63.7 63.8 13
14 Total liabilities 521.4 535.7 543.3 557.7 560.1 565.7 570.7 565.9 570.1 576.6 594.1 14
15 Taxes payable 11.6 13.4 15.4 17.4 17.9 18.5 19.0 19.7 20.3 21.0 21.7 1516 Miscellaneous liabilities 509.9 522.3 527.9 540.3 542.2 547.2 551.7 546.3 549.8 555.6 572.4 16

76 Z.1, December 7, 2001
L.119 Private Pension Funds (1)Billions of dollars; amounts outstanding end of period, not seasonally adjusted
1996 1997 1998 1999 2000 2001 Q1 Q2 Q3 Q4 Q1 Q2 Q3
1 Total financial assets 3251.1 3746.5 4204.5 4674.0 4823.1 4743.8 4796.8 4587.2 4268.8 4412.7 4039.3 1
2 Checkable deposits and currency 5.4 6.6 6.9 8.0 8.2 8.3 8.6 8.7 8.9 9.4 9.7 2 3 Time and savings deposits 111.9 119.4 120.9 116.9 116.7 118.0 117.8 118.8 117.9 117.6 116.5 3 4 Money market fund shares 48.4 61.4 63.4 75.1 75.5 75.6 78.6 81.0 83.4 85.9 88.5 4 5 Security RPs 26.7 27.6 28.6 29.0 29.1 29.2 29.5 29.9 29.0 29.3 29.6 5
6 Credit market instruments 627.0 674.6 731.0 775.9 787.6 793.8 810.0 817.2 823.7 822.0 821.7 6
7 Open market paper 30.1 31.3 34.1 37.8 35.9 36.0 36.3 36.0 32.8 31.4 32.2 7 8 U.S. government securities 343.1 354.9 389.5 419.5 429.3 432.4 441.7 446.4 447.1 438.8 434.7 8 9 Treasury 139.4 143.5 139.1 138.5 137.8 139.6 139.7 137.7 131.2 127.5 122.7 910 Agency 203.7 211.4 250.3 280.9 291.5 292.9 302.0 308.6 315.9 311.3 311.9 10
11 Corporate and foreign bonds 244.9 278.7 295.8 305.1 308.4 311.0 317.3 319.7 328.3 336.0 338.9 1112 Mortgages 9.0 9.7 11.5 13.5 14.0 14.3 14.8 15.1 15.5 15.8 15.9 12
13 Corporate equities 1463.9 1696.4 1902.2 2156.9 2231.2 2153.2 2158.3 2001.1 1778.5 1858.0 1591.3 1314 Mutual fund shares 412.3 569.6 709.3 830.1 881.1 871.5 891.4 837.6 752.0 800.4 706.2 14
15 Miscellaneous assets 555.5 590.9 642.3 682.1 693.7 694.1 702.5 692.9 675.5 690.2 675.8 1516 Unallocated insurance contracts (2) 361.1 381.9 422.8 457.1 467.2 465.0 471.5 460.7 442.5 455.0 440.4 1617 Contributions receivable 86.4 93.5 95.4 96.4 96.7 96.9 97.2 97.4 97.7 97.9 98.2 1718 Other 108.0 115.4 124.1 128.6 129.8 132.1 133.8 134.8 135.3 137.3 137.2 18
19 Pension fund reserves (liabilities) (3) 3295.2 3793.6 4255.4 4728.0 4877.9 4799.4 4853.3 4644.6 4327.0 4471.8 4099.2 19
(1) Private defined benefit plans and defined contribution plans (including 401(k) type plans). Also includes the Federal Employees Retirement System Thrift Savings Plan.(2) Assets of private pension plans held at life insurance companies (e.g., GICs, variable annuities); series begins 1985:Q4.(3) Equal to the value of tangible and financial assets. These liabilities are assets of the household sector.
L.120 State and Local Government Employee Retirement FundsBillions of dollars; amounts outstanding end of period, not seasonally adjusted
1 Total financial assets 1494.6 1817.1 2054.1 2226.8 2236.5 2242.0 2292.0 2289.6 2169.4 2228.6 2077.9 1
2 Checkable deposits and currency 7.5 5.3 10.0 9.2 11.1 12.5 12.0 9.1 7.2 11.9 12.5 2 3 Time and savings deposits 2.3 2.4 2.0 1.7 2.4 2.7 4.4 1.1 0.8 1.1 1.5 3 4 Security RPs 28.2 28.6 37.5 40.4 45.4 46.8 45.1 44.7 42.5 46.8 48.0 4
5 Credit market instruments 565.4 632.5 704.6 751.4 767.2 775.1 784.5 806.0 788.3 801.7 806.3 5
6 Open market paper 28.2 28.6 37.5 40.4 45.4 46.8 45.1 44.7 42.5 46.8 48.0 6 7 U.S. government securities 308.4 340.2 360.1 376.4 371.9 385.9 387.8 398.5 391.3 398.1 396.0 7 8 Treasury 203.5 216.9 217.7 211.2 211.1 210.5 200.7 195.7 195.3 197.1 192.0 8 9 Agency 104.9 123.3 142.4 165.3 160.8 175.5 187.2 202.8 196.0 201.1 204.0 9
10 Municipal securities 0.6 1.5 3.3 3.0 2.9 2.8 2.2 1.6 1.8 1.6 1.6 1011 Corporate and foreign bonds 211.4 244.5 279.6 310.0 325.3 318.5 327.9 339.7 330.6 332.4 337.0 1112 Mortgages 16.7 17.6 24.1 21.5 21.7 21.0 21.5 21.5 22.1 22.8 23.7 12
13 Corporate equities 828.5 1084.8 1233.9 1343.2 1331.0 1322.5 1360.9 1335.1 1224.1 1260.0 1100.3 1314 Miscellaneous assets 62.8 63.5 66.1 81.0 79.4 82.3 85.0 93.5 106.4 106.9 109.3 14
15 Pension fund reserves (liabilities) (1) 1514.6 1842.0 2085.4 2262.3 2272.8 2280.8 2332.4 2331.5 2212.8 2273.2 2123.8 15
(1) Equal to the value of tangible and financial assets. These liabilities are assets of the household sector.

Z.1, December 7, 2001 77
L.121 Money Market Mutual Funds (1)Billions of dollars; amounts outstanding end of period, not seasonally adjusted
1996 1997 1998 1999 2000 2001 Q1 Q2 Q3 Q4 Q1 Q2 Q3
1 Total financial assets 886.7 1042.5 1329.7 1578.8 1666.0 1627.1 1697.8 1812.1 1994.7 2014.8 2116.1 1
2 Foreign deposits 23.1 23.2 30.6 42.9 56.4 73.5 75.5 91.1 112.9 110.4 110.6 2 3 Checkable deposits and currency -1.1 1.5 -1.0 -2.2 -3.0 -3.6 0.0 2.2 -3.9 -2.8 -9.6 3 4 Time and savings deposits 82.7 111.3 127.0 160.4 157.7 125.1 129.3 136.6 173.3 171.5 182.7 4 5 Security RPs 103.8 126.6 139.5 139.6 158.3 169.4 172.0 183.0 205.9 208.2 221.5 5
6 Credit market instruments 634.3 721.9 965.9 1147.8 1217.1 1159.4 1212.5 1296.7 1403.8 1414.6 1498.0 6
7 Open market paper 273.9 336.0 414.2 519.0 576.0 566.4 589.3 614.4 641.9 638.2 647.2 7 8 U.S. government securities 192.0 182.5 277.5 294.7 271.7 236.8 241.7 275.6 344.3 361.3 429.0 8 9 Treasury 90.2 86.2 103.6 103.8 98.9 78.8 79.8 90.4 96.3 93.4 111.9 910 Agency 101.8 96.3 173.8 190.9 172.7 158.1 161.9 185.2 248.0 267.9 317.1 10
11 Municipal securities 144.5 167.0 193.0 210.4 225.8 221.5 227.6 244.8 256.0 255.2 267.1 1112 Corporate and foreign bonds 23.9 36.4 81.2 123.7 143.6 134.6 153.9 161.9 161.6 159.9 154.7 12
13 Miscellaneous assets 43.8 58.1 67.7 90.4 79.6 103.4 108.5 102.5 102.6 112.8 113.0 13
14 Total shares outstanding (liabilities) 886.7 1042.5 1329.7 1578.8 1666.0 1627.1 1697.8 1812.1 1994.7 2014.8 2116.1 14
(1) Open-end investment companies; excludes funding vehicles for variable annuities, which are included in the life insurance sector (table L.117).
L.122 Mutual Funds (1)Billions of dollars; amounts outstanding end of period, not seasonally adjusted
1 Total financial assets 2342.4 2989.4 3610.5 4553.4 4863.3 4759.6 4814.4 4457.2 3999.8 4275.3 3705.2 1
2 Security RPs 47.5 57.8 68.2 76.7 77.4 92.5 102.4 103.4 86.6 79.6 69.4 2
3 Credit market instruments 820.2 901.1 1025.9 1073.1 1053.7 1073.9 1088.5 1099.9 1113.8 1160.1 1193.0 3
4 Open market paper 47.2 57.8 68.2 76.7 77.4 92.5 102.4 103.4 86.6 76.2 69.4 4 5 U.S. government securities 330.2 349.7 375.8 388.4 380.2 387.4 389.3 398.7 409.4 446.5 471.9 5 6 Treasury 214.2 225.2 230.4 223.6 216.5 215.1 212.5 214.4 218.9 232.2 243.4 6 7 Agency 116.1 124.5 145.5 164.7 163.6 172.3 176.8 184.2 190.6 214.3 228.5 7
8 Municipal securities 213.3 219.8 242.6 239.4 232.3 227.9 228.4 230.5 236.0 240.1 246.0 8 9 Corporate and foreign bonds 229.5 273.8 339.3 368.6 363.9 366.0 368.3 367.3 381.8 397.3 405.6 9
10 Corporate equities 1470.0 2018.7 2508.5 3400.0 3730.2 3591.3 3620.9 3250.8 2797.6 3034.8 2442.0 1011 Miscellaneous assets 4.7 11.8 7.9 3.6 1.9 1.9 2.6 3.1 1.7 0.7 0.9 11
12 Total shares outstanding (liabilities) 2342.4 2989.4 3610.5 4553.4 4863.3 4759.6 4814.4 4457.2 3999.8 4275.3 3705.2 12
(1) Open-end investment companies; excludes funding vehicles for variable annuities, which are included in the life insurance sector (table L.117).
L.123 Closed-End and Exchange-Traded FundsBillions of dollars; amounts outstanding end of period, not seasonally adjusted
Closed-end funds
1 Total financial assets 144.4 149.0 151.0 151.0 150.4 146.5 144.5 138.3 131.9 132.1 124.7 1
2 Credit market instruments 100.8 98.3 103.7 111.1 109.0 106.9 104.8 102.7 100.6 98.5 96.4 2 3 U.S. government securities 11.4 10.2 9.3 8.0 8.0 7.9 7.8 7.7 7.6 7.6 7.5 3 4 Municipal securities 60.8 59.9 61.8 70.5 69.3 68.2 67.0 65.9 64.7 63.6 62.4 4 5 Corporate and foreign bonds 28.6 28.1 32.6 32.6 31.7 30.8 30.0 29.1 28.2 27.3 26.5 5
6 Corporate equities 43.6 50.7 47.3 39.9 41.4 39.6 39.7 35.7 31.3 33.7 28.4 6
Exchange-traded funds
7 Total financial assets (1) 2.4 6.7 15.6 33.9 36.8 46.1 49.7 65.6 66.0 75.6 64.3 7
Memo:
8 Market value of equities 146.8 155.7 166.6 184.9 187.2 192.6 194.2 203.9 197.9 207.7 189.1 8 9 Closed-end funds 144.4 149.0 151.0 151.0 150.4 146.5 144.5 138.3 131.9 132.1 124.7 910 Exchange-traded funds 2.4 6.7 15.6 33.9 36.8 46.1 49.7 65.6 66.0 75.6 64.3 10
(1) Corporate equities.

78 Z.1, December 7, 2001
L.124 Government-Sponsored Enterprises (GSEs) (1)Billions of dollars; amounts outstanding end of period, not seasonally adjusted
1996 1997 1998 1999 2000 2001 Q1 Q2 Q3 Q4 Q1 Q2 Q3
1 Total financial assets 988.6 1099.4 1403.8 1720.6 1752.3 1812.1 1881.8 1969.4 2054.5 2123.4 2220.3 1
2 Checkable deposits and currency 0.7 1.9 4.4 11.8 0.7 1.2 1.0 2.1 2.0 2.7 3.9 2 3 Federal funds and security RPs 94.5 90.4 77.0 89.7 90.6 80.9 93.7 88.1 102.3 94.4 107.2 3
4 Credit market instruments 832.8 939.4 1253.9 1545.6 1584.0 1649.2 1704.3 1793.7 1864.7 1941.1 2009.5 4
5 Open market paper 35.1 34.0 60.9 33.8 38.1 34.8 42.2 50.6 38.0 48.1 48.2 5 6 U.S. government securities 276.3 352.4 514.7 699.2 723.5 737.6 774.7 835.4 893.7 934.6 979.0 6 7 Treasury 18.8 25.9 25.2 30.9 25.2 20.7 19.0 22.1 23.1 23.2 18.9 7 8 Agency 257.6 326.5 489.6 668.3 698.4 717.0 755.6 813.3 870.6 911.4 960.2 8
9 Municipal securities 5.6 5.2 9.2 10.6 9.2 9.1 9.9 8.8 9.9 12.0 12.1 910 Corporate and foreign bonds 41.8 47.1 67.8 91.5 94.2 106.5 113.9 117.3 125.2 137.3 137.0 10
11 Other loans and advances 229.1 260.3 352.6 466.2 472.9 505.4 503.5 514.6 527.9 530.1 547.6 1112 Sallie Mae 36.2 30.9 29.5 34.6 32.4 31.9 36.3 37.8 38.4 39.6 40.4 1213 Farm Credit System 31.6 31.6 34.9 35.8 36.2 36.8 37.4 38.9 39.0 40.1 40.4 1314 FHLB 161.4 197.8 288.2 395.7 404.3 436.6 429.8 437.9 450.5 450.3 466.8 14
15 Mortgages 244.9 240.5 248.7 244.4 246.1 255.7 260.1 267.1 270.0 279.1 285.6 1516 Home 198.5 194.3 199.6 189.3 189.8 197.6 200.5 205.1 206.3 211.9 215.8 1617 Multifamily residential 18.6 17.3 18.1 22.9 24.2 25.3 26.2 27.8 28.8 30.7 32.4 1718 Farm 27.9 28.9 31.0 32.2 32.1 32.8 33.5 34.2 34.9 36.4 37.4 18
19 Miscellaneous assets 60.6 67.8 68.5 73.5 77.0 80.8 82.8 85.5 85.4 85.2 99.8 19
20 Total liabilities 964.1 1070.3 1368.9 1681.1 1711.8 1770.0 1837.6 1922.5 2008.4 2074.3 2170.4 20
21 Credit market instruments 896.9 995.3 1273.6 1591.7 1618.0 1680.2 1749.7 1825.8 1888.7 1955.8 2037.8 2122 GSE issues (2) 896.9 995.3 1273.6 1591.7 1618.0 1680.2 1749.7 1825.8 1888.7 1955.8 2037.8 2223 U.S. government loans 0.0 0.0 0.0 0.0 0.0 0.0 0.0 0.0 0.0 0.0 0.0 23
24 Miscellaneous liabilities 67.2 75.1 95.3 89.3 93.8 89.8 87.9 96.7 119.7 118.5 132.6 24
(1) Federal Home Loan Banks, Federal National Mortgage Association, Federal Home Loan Mortgage Corporation, Farm Credit System, the Financing Corporation, the Resolution Funding Corporation, and the Student Loan Marketing Association (Sallie Mae), which is a subsidiary of USA Education, Inc., a private company chartered in 1997.(2) Such issues are classified as U.S. government securities.
L.125 Federally Related Mortgage Pools (1)Billions of dollars; amounts outstanding end of period, not seasonally adjusted
1 Total financial assets 1711.3 1825.8 2018.4 2292.2 2322.1 2355.2 2414.3 2491.6 2534.2 2635.8 2759.0 1
2 Home mortgages 1678.8 1788.1 1970.2 2234.7 2263.0 2294.1 2351.4 2425.6 2464.9 2561.7 2681.6 2 3 Multifamily residential mortgages 32.5 37.8 48.3 57.5 59.1 61.0 63.0 66.0 69.3 74.1 77.3 3 4 Commercial mortgages 0.0 0.0 0.0 0.0 0.0 0.0 0.0 0.0 0.0 0.0 0.0 4 5 Farm mortgages 0.0 0.0 0.0 0.0 0.0 0.0 0.0 0.0 0.0 0.0 0.0 5
6 Total pool securities (liabilities)(2) 1711.3 1825.8 2018.4 2292.2 2322.1 2355.2 2414.3 2491.6 2534.2 2635.8 2759.0 6
(1) GNMA, FNMA, FHLMC, and Farmers Home Administration pools. Also includes federally related pools which are used as collateral for federally related agency-issued CMOs and privately issued CMOs. Excludes Federal Financing Bank holdings of pool securities, which are included with federal government mortgages and other loans and advances.(2) Such issues are classified as U.S. government securities.

Z.1, December 7, 2001 79
L.126 Issuers of Asset-Backed Securities (ABSs)Billions of dollars; amounts outstanding end of period, not seasonally adjusted
1996 1997 1998 1999 2000 2001 Q1 Q2 Q3 Q4 Q1 Q2 Q3
1 Total financial assets 854.6 1065.8 1385.4 1611.6 1646.9 1689.0 1735.1 1822.9 1887.5 1936.7 2014.7 1
2 Agency securities (1) 137.8 141.5 179.7 221.0 226.4 226.2 225.7 223.8 233.7 223.0 230.3 2
3 Other loans and advances 44.0 76.2 103.8 113.0 124.3 125.4 128.3 138.3 138.1 132.3 148.4 3 4 Student loans 6.3 14.1 17.9 19.4 22.8 24.5 30.7 29.9 30.5 31.0 31.2 4 5 Loans to business 37.7 62.1 85.9 93.6 101.5 100.9 97.6 108.4 107.6 101.3 117.2 5
6 Mortgages (2) 326.3 407.0 563.5 655.5 669.1 687.7 708.6 740.7 769.5 814.4 844.4 6 7 Home 256.2 310.7 405.2 455.0 463.5 471.9 484.6 499.8 523.3 539.2 550.2 7 8 Multifamily residential 15.9 20.9 33.8 42.2 43.1 44.4 46.1 49.5 50.7 57.0 59.8 8 9 Commercial 54.2 75.4 124.6 158.3 162.6 171.4 177.8 191.4 195.5 218.3 234.4 9
10 Consumer credit 265.8 313.1 372.4 435.1 434.0 447.0 460.3 500.1 519.2 533.9 551.7 1011 Trade receivables 80.7 128.1 165.9 187.0 193.1 202.7 212.2 220.0 227.0 233.0 240.0 11
12 Total liabilities 863.3 1076.6 1398.0 1621.4 1655.8 1697.0 1742.3 1829.6 1893.7 1942.4 2020.2 12
13 Commercial paper 146.7 256.1 381.8 520.8 546.6 570.3 595.7 641.8 653.3 670.3 691.3 1314 Corporate bonds 716.6 820.5 1016.2 1100.6 1109.1 1126.7 1146.6 1187.8 1240.4 1272.2 1328.9 14
Memo: Securitized assets not included above15 Consumer leases (3) 8.7 10.8 12.6 9.7 8.9 7.9 7.3 6.7 6.3 5.8 5.5 1516 REIT assets (4) 7.4 11.1 13.9 12.9 13.0 12.3 11.6 10.7 10.1 10.0 9.5 16
(1) Federally related mortgage pool securities backing privately issued CMOs.(2) Mortgages backing privately issued pool securities and privately issued CMOs.(3) Receivables from operating leases, such as consumer automobile leases, are booked as current income when payments are received and are not included in financial assets (or household liabilities). The leased automobile is a tangible asset.(4) Included in table L.129.
L.127 Finance Companies (1)Billions of dollars; amounts outstanding end of period, not seasonally adjusted
1 Total financial assets 716.7 763.9 852.7 1003.0 1038.3 1073.0 1106.3 1137.9 1140.1 1145.4 1135.6 1
2 Checkable deposits and currency 18.5 20.6 22.8 25.3 25.9 26.6 27.2 27.9 28.6 29.3 30.0 2
3 Credit market instruments 545.1 568.2 645.5 742.5 776.6 812.3 830.0 850.5 848.0 878.5 859.4 3 4 Other loans and advances 304.7 304.1 340.9 395.1 422.7 441.9 443.0 458.4 459.1 481.9 451.1 4 5 Mortgages 85.5 96.5 121.2 145.8 149.1 157.7 165.4 172.3 176.1 182.3 187.4 5 6 Consumer credit 154.9 167.5 183.3 201.5 204.8 212.7 221.5 219.8 212.8 214.3 220.8 6
7 Miscellaneous assets 153.1 175.1 184.4 235.3 235.8 234.1 249.0 259.6 263.5 237.7 246.2 7
8 Total liabilities 742.1 780.8 856.6 994.6 1051.0 1086.1 1123.8 1159.5 1159.3 1167.4 1160.3 8
9 Credit market instruments 534.5 568.3 625.5 695.7 708.4 740.8 761.8 776.9 756.2 769.0 771.3 910 Open market paper 178.0 202.6 233.3 230.4 233.0 224.3 218.8 238.8 180.9 181.6 171.0 1011 Corporate bonds 336.8 341.5 365.6 429.9 446.6 483.7 507.3 502.2 533.8 542.1 555.9 1112 Bank loans n.e.c. 19.7 24.2 26.5 35.4 28.8 32.8 35.7 35.9 41.6 45.3 44.5 12
13 Taxes payable 5.7 6.5 7.3 8.1 8.3 8.6 8.8 9.1 9.3 9.6 9.9 13
14 Miscellaneous liabilities 202.0 206.0 223.8 290.7 334.2 336.7 353.2 373.5 393.7 388.8 379.1 1415 Foreign direct investment in U.S. 29.7 35.7 38.3 49.7 47.8 48.6 49.9 67.3 73.2 77.9 80.1 1516 Investment by parent 54.6 47.1 34.3 87.8 107.2 95.1 100.0 102.5 97.2 93.4 90.8 1617 Other 117.8 123.2 151.2 153.1 179.2 193.0 203.3 203.6 223.3 217.5 208.2 17
Memo:18 Consumer leases not included above (2) 93.2 98.8 96.6 102.9 106.6 109.1 109.9 108.2 106.4 110.2 108.3 18
(1) Includes retail captive finance companies.(2) See footnote (3), table L.126.
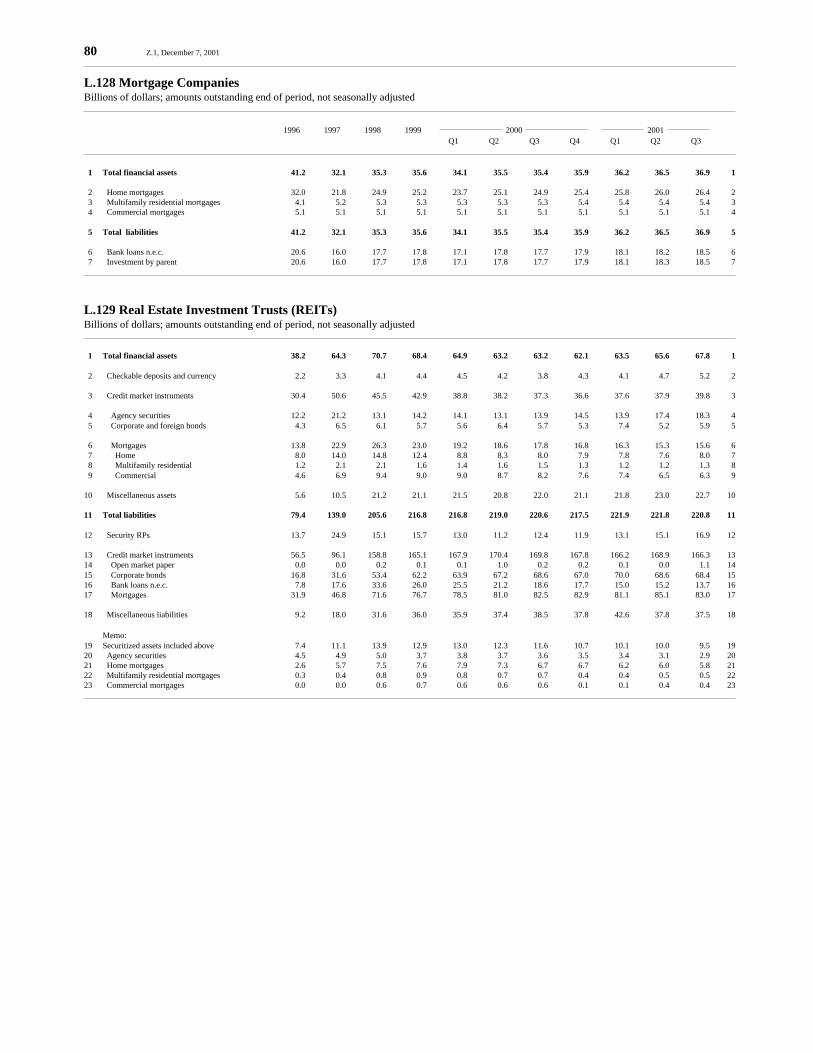
80 Z.1, December 7, 2001
L.128 Mortgage CompaniesBillions of dollars; amounts outstanding end of period, not seasonally adjusted
1996 1997 1998 1999 2000 2001 Q1 Q2 Q3 Q4 Q1 Q2 Q3
1 Total financial assets 41.2 32.1 35.3 35.6 34.1 35.5 35.4 35.9 36.2 36.5 36.9 1
2 Home mortgages 32.0 21.8 24.9 25.2 23.7 25.1 24.9 25.4 25.8 26.0 26.4 2 3 Multifamily residential mortgages 4.1 5.2 5.3 5.3 5.3 5.3 5.3 5.4 5.4 5.4 5.4 3 4 Commercial mortgages 5.1 5.1 5.1 5.1 5.1 5.1 5.1 5.1 5.1 5.1 5.1 4
5 Total liabilities 41.2 32.1 35.3 35.6 34.1 35.5 35.4 35.9 36.2 36.5 36.9 5
6 Bank loans n.e.c. 20.6 16.0 17.7 17.8 17.1 17.8 17.7 17.9 18.1 18.2 18.5 6 7 Investment by parent 20.6 16.0 17.7 17.8 17.1 17.8 17.7 17.9 18.1 18.3 18.5 7
L.129 Real Estate Investment Trusts (REITs)Billions of dollars; amounts outstanding end of period, not seasonally adjusted
1 Total financial assets 38.2 64.3 70.7 68.4 64.9 63.2 63.2 62.1 63.5 65.6 67.8 1
2 Checkable deposits and currency 2.2 3.3 4.1 4.4 4.5 4.2 3.8 4.3 4.1 4.7 5.2 2
3 Credit market instruments 30.4 50.6 45.5 42.9 38.8 38.2 37.3 36.6 37.6 37.9 39.8 3
4 Agency securities 12.2 21.2 13.1 14.2 14.1 13.1 13.9 14.5 13.9 17.4 18.3 4 5 Corporate and foreign bonds 4.3 6.5 6.1 5.7 5.6 6.4 5.7 5.3 7.4 5.2 5.9 5
6 Mortgages 13.8 22.9 26.3 23.0 19.2 18.6 17.8 16.8 16.3 15.3 15.6 6 7 Home 8.0 14.0 14.8 12.4 8.8 8.3 8.0 7.9 7.8 7.6 8.0 7 8 Multifamily residential 1.2 2.1 2.1 1.6 1.4 1.6 1.5 1.3 1.2 1.2 1.3 8 9 Commercial 4.6 6.9 9.4 9.0 9.0 8.7 8.2 7.6 7.4 6.5 6.3 9
10 Miscellaneous assets 5.6 10.5 21.2 21.1 21.5 20.8 22.0 21.1 21.8 23.0 22.7 10
11 Total liabilities 79.4 139.0 205.6 216.8 216.8 219.0 220.6 217.5 221.9 221.8 220.8 11
12 Security RPs 13.7 24.9 15.1 15.7 13.0 11.2 12.4 11.9 13.1 15.1 16.9 12
13 Credit market instruments 56.5 96.1 158.8 165.1 167.9 170.4 169.8 167.8 166.2 168.9 166.3 1314 Open market paper 0.0 0.0 0.2 0.1 0.1 1.0 0.2 0.2 0.1 0.0 1.1 1415 Corporate bonds 16.8 31.6 53.4 62.2 63.9 67.2 68.6 67.0 70.0 68.6 68.4 1516 Bank loans n.e.c. 7.8 17.6 33.6 26.0 25.5 21.2 18.6 17.7 15.0 15.2 13.7 1617 Mortgages 31.9 46.8 71.6 76.7 78.5 81.0 82.5 82.9 81.1 85.1 83.0 17
18 Miscellaneous liabilities 9.2 18.0 31.6 36.0 35.9 37.4 38.5 37.8 42.6 37.8 37.5 18
Memo:19 Securitized assets included above 7.4 11.1 13.9 12.9 13.0 12.3 11.6 10.7 10.1 10.0 9.5 1920 Agency securities 4.5 4.9 5.0 3.7 3.8 3.7 3.6 3.5 3.4 3.1 2.9 2021 Home mortgages 2.6 5.7 7.5 7.6 7.9 7.3 6.7 6.7 6.2 6.0 5.8 2122 Multifamily residential mortgages 0.3 0.4 0.8 0.9 0.8 0.7 0.7 0.4 0.4 0.5 0.5 2223 Commercial mortgages 0.0 0.0 0.6 0.7 0.6 0.6 0.6 0.1 0.1 0.4 0.4 23

Z.1, December 7, 2001 81
L.130 Security Brokers and DealersBillions of dollars; amounts outstanding end of period, not seasonally adjusted
1996 1997 1998 1999 2000 2001 Q1 Q2 Q3 Q4 Q1 Q2 Q3
1 Total financial assets 636.4 779.2 921.2 1001.0 1132.5 1132.9 1208.6 1221.4 1191.4 1333.3 1451.2 1
2 Checkable deposits and currency 15.7 21.7 25.4 28.7 27.1 27.0 20.8 30.3 28.8 37.0 52.8 2
3 Credit market instruments 167.7 182.6 189.4 154.7 194.8 188.2 243.3 223.6 312.3 288.4 369.9 3
4 Open market paper 23.7 24.3 28.0 26.0 30.2 38.2 45.4 39.2 44.5 44.8 50.4 4 5 U.S. government securities 42.4 45.1 66.7 23.3 43.8 31.0 70.5 60.4 131.2 97.9 151.9 5 6 Treasury -12.8 -5.3 15.8 -42.6 -6.5 -24.1 7.8 -3.3 55.9 1.6 71.5 6 7 Agency 55.2 50.4 50.9 66.0 50.3 55.1 62.6 63.7 75.3 96.3 80.4 7 8 Municipal securities 10.8 13.2 13.1 11.9 10.8 9.9 10.8 11.3 12.7 13.7 16.0 8 9 Corporate and foreign bonds 90.9 100.0 81.4 93.4 110.0 109.1 116.6 112.7 124.0 132.0 151.5 9
10 Corporate equities 37.9 51.9 54.4 66.9 74.4 74.5 81.5 77.2 76.0 89.8 63.6 1011 Security credit 94.4 131.2 152.8 227.9 286.5 270.2 273.9 235.1 193.5 195.9 253.0 1112 Miscellaneous assets 320.7 391.8 499.3 522.8 549.7 573.0 589.1 655.1 580.8 722.1 711.9 12
13 Total liabilities 597.5 729.2 866.2 937.7 1062.6 1061.8 1136.4 1148.0 1117.6 1257.9 1377.9 13
14 Security RPs (net) 180.9 203.5 208.1 245.2 285.3 271.6 317.6 302.2 280.8 333.1 404.2 1415 Corporate bonds 27.3 35.3 42.5 25.3 36.4 36.2 42.6 40.9 35.0 43.9 47.0 15
16 Trade payables 14.3 19.9 18.9 30.9 33.8 39.4 35.9 35.9 35.2 33.3 36.0 1617 Security credit 263.7 337.9 419.6 448.7 514.6 510.0 531.9 587.6 591.9 585.5 651.7 1718 Customer credit balances (HH) 162.9 215.5 276.7 323.9 371.2 359.5 372.9 412.4 400.4 412.8 484.2 1819 From banks 100.8 122.5 142.9 124.8 143.4 150.6 159.0 175.2 191.6 172.7 167.4 1920 Taxes payable 1.3 1.3 1.3 2.2 2.4 1.7 1.8 2.1 1.2 1.3 1.4 20
21 Miscellaneous liabilities 110.1 131.1 175.8 185.5 190.1 202.9 206.5 179.3 173.5 260.7 237.7 2122 Foreign direct investment in U.S. 8.8 8.5 10.1 15.8 16.4 16.8 17.4 16.7 17.8 18.3 19.5 2223 Due to affiliates 178.6 254.5 351.9 413.6 435.7 449.5 460.0 476.1 506.2 508.5 507.9 2324 Other -77.3 -131.9 -186.2 -243.9 -262.0 -263.5 -270.8 -313.5 -350.4 -266.1 -289.6 24
L.131 Funding Corporations (1)Billions of dollars; amounts outstanding end of period, not seasonally adjusted
1 Total financial assets 499.2 612.7 719.8 976.6 1004.5 1056.3 1061.9 1099.9 1112.4 1077.0 997.5 1
2 Money market fund shares 147.5 157.9 215.8 264.7 267.3 264.5 286.4 298.2 325.1 356.1 367.8 2
3 Credit market instruments 121.0 166.7 155.3 288.8 294.5 341.0 320.4 324.7 292.7 240.1 177.8 3 4 Open market paper 84.5 133.6 117.7 255.0 270.7 309.9 296.5 290.7 249.1 186.9 113.7 4 5 Corporate and foreign bonds 36.5 33.1 37.6 33.8 23.8 31.1 23.9 33.9 43.6 53.3 64.2 5
6 Miscellaneous assets (2) 230.7 288.0 348.7 423.1 442.7 450.7 455.1 477.1 494.6 480.7 451.8 6 7 Investment in foreign banking offices 64.5 78.8 90.6 93.0 114.6 114.5 119.9 138.7 142.3 137.3 113.5 7 8 Investment in brokers and dealers 166.3 209.2 258.2 330.1 328.1 336.2 335.2 338.4 352.3 343.5 338.3 8
9 Total liabilities 499.2 612.7 719.8 976.6 1004.5 1056.3 1061.9 1099.9 1112.4 1077.0 997.5 9
10 Credit market instruments 312.4 372.6 412.6 504.0 507.4 515.0 508.7 503.7 524.7 478.6 433.6 1011 Open market paper 198.8 228.5 234.4 268.5 276.2 277.9 274.1 266.2 275.4 223.1 179.3 1112 Corporate bonds 113.6 144.2 178.2 235.5 231.1 237.1 234.7 237.5 249.3 255.5 254.3 12
13 Miscellaneous liabilities 186.9 240.1 307.2 472.5 497.2 541.3 553.2 596.3 587.7 598.4 563.9 1314 Foreign direct investment in U.S. -81.6 -84.6 -63.9 -80.9 -64.7 -64.3 -53.6 -26.6 -30.0 2.1 18.2 1415 Securities loaned (net) 276.1 333.3 403.3 419.5 443.9 467.5 470.6 508.2 482.6 541.0 558.2 1516 Other -7.6 -8.6 -32.2 133.9 117.9 138.1 136.2 114.7 135.1 55.2 -12.5 16
(1) Funding subsidiaries, nonbank financial holding companies, and custodial accounts for reinvested collateral of securities lending operations.(2) Due from affiliated companies.

82 Z.1, December 7, 2001
L.200 Gold and Official Foreign Exchange Holdings (1)Billions of dollars; amounts outstanding end of period, not seasonally adjusted
1996 1997 1998 1999 2000 2001 Q1 Q2 Q3 Q4 Q1 Q2 Q3
1 Total U.S. reserves 75.1 70.0 81.8 71.5 68.0 67.5 66.3 67.6 64.2 64.8 71.0 1
2 U.S. gold stock and SDRs 21.4 21.1 21.6 21.4 21.4 21.5 21.4 21.6 21.4 21.5 22.0 2
3 Federal govt.: Exchange Stab. Fund 10.3 10.0 10.6 10.3 10.3 10.4 10.3 10.5 10.4 10.4 10.9 3 4 Monetary authority (2) 11.0 11.0 11.0 11.0 11.0 11.0 11.0 11.0 11.0 11.0 11.0 4
5 U.S. foreign exchange position 53.7 48.9 60.1 50.1 46.6 46.0 44.9 46.1 42.8 43.4 49.0 5
6 Official foreign currency holdings 38.3 30.8 36.0 32.2 28.8 30.6 31.2 31.2 29.0 28.8 30.6 6 7 Treasury 19.0 13.8 16.2 16.0 13.0 15.0 15.6 15.6 14.5 14.3 15.2 7 8 Monetary authority 19.3 17.0 19.8 16.1 15.8 15.6 15.6 15.7 14.6 14.4 15.4 8
9 Net IMF position 15.4 18.1 24.1 18.0 17.9 15.4 13.7 14.8 13.8 14.6 18.4 910 Federal government 15.5 18.2 24.2 18.0 18.0 15.5 13.8 14.9 13.9 14.7 18.5 1011 Monetary authority -0.1 -0.1 -0.1 -0.1 -0.1 -0.1 -0.1 -0.1 -0.1 -0.1 -0.1 11
(1) Lines 1, 2, and 3 include increases in SDRs through allocations, which occurred at various dates beginning January 1970. Also included in the table are revaluations of foreign currency holdings, gold, SDRs, and IMF position. These allocations and revaluations are excluded from tables on flows.(2) Treasury gold stock.
L.201 SDR Certificates and Treasury CurrencyBillions of dollars; amounts outstanding end of period, not seasonally adjusted
SDR certificates:
1 Liab: Federal government 9.7 9.2 9.2 6.2 6.2 4.2 3.2 2.2 2.2 2.2 2.2 1 2 Asset: Monetary authority 9.7 9.2 9.2 6.2 6.2 4.2 3.2 2.2 2.2 2.2 2.2 2
Treasury currency:
3 Liab: Federal government 18.9 19.3 19.9 20.9 21.4 22.1 23.2 23.2 22.9 23.2 23.2 3 4 Asset: Monetary authority 25.0 25.6 26.3 28.0 29.0 30.0 30.8 31.6 32.3 32.7 32.9 4
5 Discrepancy (seigniorage) -6.1 -6.3 -6.4 -7.1 -7.6 -7.9 -7.6 -8.5 -9.4 -9.5 -9.7 5
L.202 U.S. Deposits in Foreign CountriesBillions of dollars; amounts outstanding end of period, not seasonally adjusted
1 Total rest of the world liability 521.7 618.5 642.3 703.6 781.9 782.8 772.6 824.5 883.4 846.8 850.6 1 Held by:
2 Household sector 35.5 37.2 38.3 43.5 48.6 48.6 48.0 51.3 49.8 45.8 43.3 2 3 Nonfinancial corporate business 28.2 23.1 30.5 28.3 22.2 26.5 40.0 22.9 16.1 16.3 16.3 3 4 Money market mutual funds 23.1 23.2 30.6 42.9 56.4 73.5 75.5 91.1 112.9 110.4 110.6 4
5 Discrepancy--unallocated assets 434.9 535.0 542.8 588.9 654.7 634.2 609.1 659.3 704.6 674.3 680.5 5
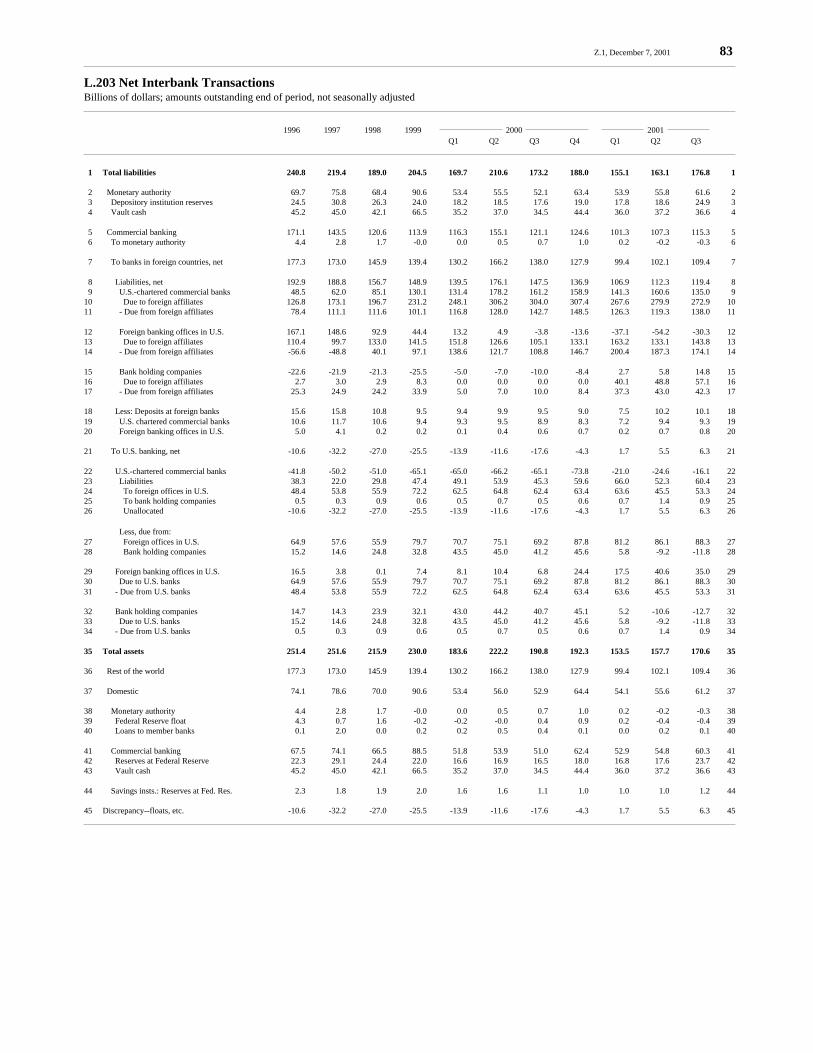
Z.1, December 7, 2001 83
L.203 Net Interbank TransactionsBillions of dollars; amounts outstanding end of period, not seasonally adjusted
1996 1997 1998 1999 2000 2001 Q1 Q2 Q3 Q4 Q1 Q2 Q3
1 Total liabilities 240.8 219.4 189.0 204.5 169.7 210.6 173.2 188.0 155.1 163.1 176.8 1
2 Monetary authority 69.7 75.8 68.4 90.6 53.4 55.5 52.1 63.4 53.9 55.8 61.6 2 3 Depository institution reserves 24.5 30.8 26.3 24.0 18.2 18.5 17.6 19.0 17.8 18.6 24.9 3 4 Vault cash 45.2 45.0 42.1 66.5 35.2 37.0 34.5 44.4 36.0 37.2 36.6 4
5 Commercial banking 171.1 143.5 120.6 113.9 116.3 155.1 121.1 124.6 101.3 107.3 115.3 5 6 To monetary authority 4.4 2.8 1.7 -0.0 0.0 0.5 0.7 1.0 0.2 -0.2 -0.3 6
7 To banks in foreign countries, net 177.3 173.0 145.9 139.4 130.2 166.2 138.0 127.9 99.4 102.1 109.4 7
8 Liabilities, net 192.9 188.8 156.7 148.9 139.5 176.1 147.5 136.9 106.9 112.3 119.4 8 9 U.S.-chartered commercial banks 48.5 62.0 85.1 130.1 131.4 178.2 161.2 158.9 141.3 160.6 135.0 910 Due to foreign affiliates 126.8 173.1 196.7 231.2 248.1 306.2 304.0 307.4 267.6 279.9 272.9 1011 - Due from foreign affiliates 78.4 111.1 111.6 101.1 116.8 128.0 142.7 148.5 126.3 119.3 138.0 11
12 Foreign banking offices in U.S. 167.1 148.6 92.9 44.4 13.2 4.9 -3.8 -13.6 -37.1 -54.2 -30.3 1213 Due to foreign affiliates 110.4 99.7 133.0 141.5 151.8 126.6 105.1 133.1 163.2 133.1 143.8 1314 - Due from foreign affiliates -56.6 -48.8 40.1 97.1 138.6 121.7 108.8 146.7 200.4 187.3 174.1 14
15 Bank holding companies -22.6 -21.9 -21.3 -25.5 -5.0 -7.0 -10.0 -8.4 2.7 5.8 14.8 1516 Due to foreign affiliates 2.7 3.0 2.9 8.3 0.0 0.0 0.0 0.0 40.1 48.8 57.1 1617 - Due from foreign affiliates 25.3 24.9 24.2 33.9 5.0 7.0 10.0 8.4 37.3 43.0 42.3 17
18 Less: Deposits at foreign banks 15.6 15.8 10.8 9.5 9.4 9.9 9.5 9.0 7.5 10.2 10.1 1819 U.S. chartered commercial banks 10.6 11.7 10.6 9.4 9.3 9.5 8.9 8.3 7.2 9.4 9.3 1920 Foreign banking offices in U.S. 5.0 4.1 0.2 0.2 0.1 0.4 0.6 0.7 0.2 0.7 0.8 20
21 To U.S. banking, net -10.6 -32.2 -27.0 -25.5 -13.9 -11.6 -17.6 -4.3 1.7 5.5 6.3 21
22 U.S.-chartered commercial banks -41.8 -50.2 -51.0 -65.1 -65.0 -66.2 -65.1 -73.8 -21.0 -24.6 -16.1 2223 Liabilities 38.3 22.0 29.8 47.4 49.1 53.9 45.3 59.6 66.0 52.3 60.4 2324 To foreign offices in U.S. 48.4 53.8 55.9 72.2 62.5 64.8 62.4 63.4 63.6 45.5 53.3 2425 To bank holding companies 0.5 0.3 0.9 0.6 0.5 0.7 0.5 0.6 0.7 1.4 0.9 2526 Unallocated -10.6 -32.2 -27.0 -25.5 -13.9 -11.6 -17.6 -4.3 1.7 5.5 6.3 26
Less, due from:27 Foreign offices in U.S. 64.9 57.6 55.9 79.7 70.7 75.1 69.2 87.8 81.2 86.1 88.3 2728 Bank holding companies 15.2 14.6 24.8 32.8 43.5 45.0 41.2 45.6 5.8 -9.2 -11.8 28
29 Foreign banking offices in U.S. 16.5 3.8 0.1 7.4 8.1 10.4 6.8 24.4 17.5 40.6 35.0 2930 Due to U.S. banks 64.9 57.6 55.9 79.7 70.7 75.1 69.2 87.8 81.2 86.1 88.3 3031 - Due from U.S. banks 48.4 53.8 55.9 72.2 62.5 64.8 62.4 63.4 63.6 45.5 53.3 31
32 Bank holding companies 14.7 14.3 23.9 32.1 43.0 44.2 40.7 45.1 5.2 -10.6 -12.7 3233 Due to U.S. banks 15.2 14.6 24.8 32.8 43.5 45.0 41.2 45.6 5.8 -9.2 -11.8 3334 - Due from U.S. banks 0.5 0.3 0.9 0.6 0.5 0.7 0.5 0.6 0.7 1.4 0.9 34
35 Total assets 251.4 251.6 215.9 230.0 183.6 222.2 190.8 192.3 153.5 157.7 170.6 35
36 Rest of the world 177.3 173.0 145.9 139.4 130.2 166.2 138.0 127.9 99.4 102.1 109.4 36
37 Domestic 74.1 78.6 70.0 90.6 53.4 56.0 52.9 64.4 54.1 55.6 61.2 37
38 Monetary authority 4.4 2.8 1.7 -0.0 0.0 0.5 0.7 1.0 0.2 -0.2 -0.3 3839 Federal Reserve float 4.3 0.7 1.6 -0.2 -0.2 -0.0 0.4 0.9 0.2 -0.4 -0.4 3940 Loans to member banks 0.1 2.0 0.0 0.2 0.2 0.5 0.4 0.1 0.0 0.2 0.1 40
41 Commercial banking 67.5 74.1 66.5 88.5 51.8 53.9 51.0 62.4 52.9 54.8 60.3 4142 Reserves at Federal Reserve 22.3 29.1 24.4 22.0 16.6 16.9 16.5 18.0 16.8 17.6 23.7 4243 Vault cash 45.2 45.0 42.1 66.5 35.2 37.0 34.5 44.4 36.0 37.2 36.6 43
44 Savings insts.: Reserves at Fed. Res. 2.3 1.8 1.9 2.0 1.6 1.6 1.1 1.0 1.0 1.0 1.2 44
45 Discrepancy--floats, etc. -10.6 -32.2 -27.0 -25.5 -13.9 -11.6 -17.6 -4.3 1.7 5.5 6.3 45
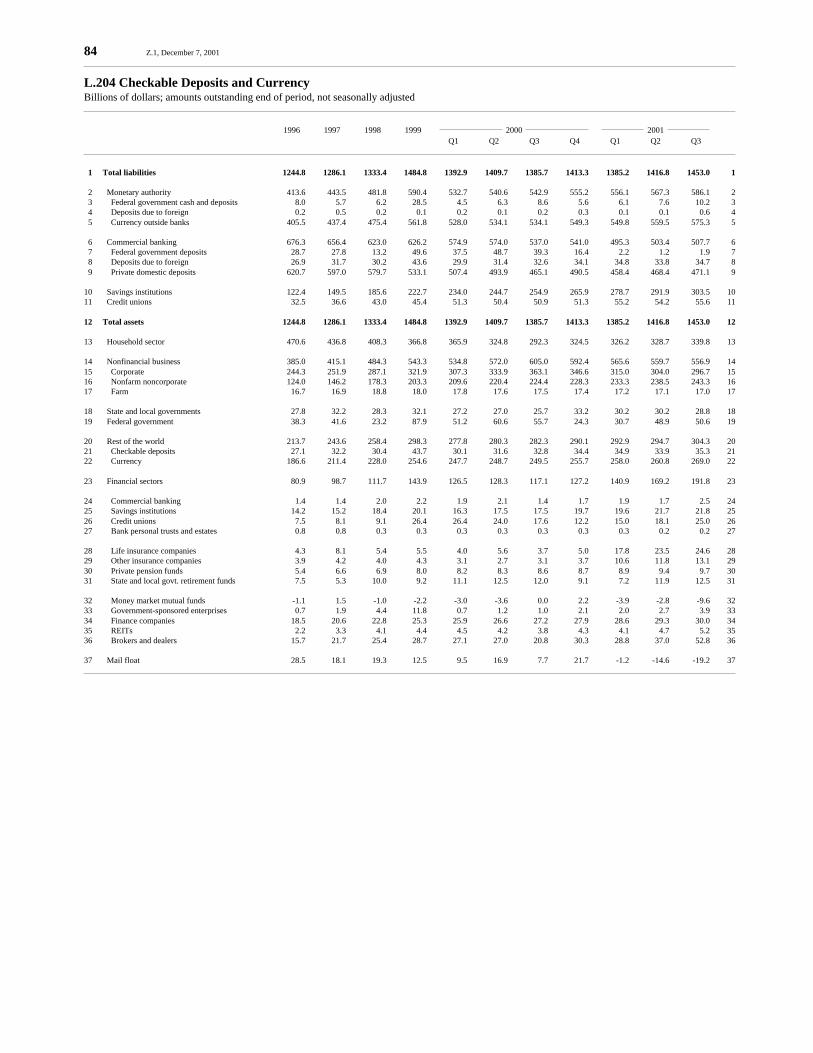
84 Z.1, December 7, 2001
L.204 Checkable Deposits and CurrencyBillions of dollars; amounts outstanding end of period, not seasonally adjusted
1996 1997 1998 1999 2000 2001 Q1 Q2 Q3 Q4 Q1 Q2 Q3
1 Total liabilities 1244.8 1286.1 1333.4 1484.8 1392.9 1409.7 1385.7 1413.3 1385.2 1416.8 1453.0 1
2 Monetary authority 413.6 443.5 481.8 590.4 532.7 540.6 542.9 555.2 556.1 567.3 586.1 2 3 Federal government cash and deposits 8.0 5.7 6.2 28.5 4.5 6.3 8.6 5.6 6.1 7.6 10.2 3 4 Deposits due to foreign 0.2 0.5 0.2 0.1 0.2 0.1 0.2 0.3 0.1 0.1 0.6 4 5 Currency outside banks 405.5 437.4 475.4 561.8 528.0 534.1 534.1 549.3 549.8 559.5 575.3 5
6 Commercial banking 676.3 656.4 623.0 626.2 574.9 574.0 537.0 541.0 495.3 503.4 507.7 6 7 Federal government deposits 28.7 27.8 13.2 49.6 37.5 48.7 39.3 16.4 2.2 1.2 1.9 7 8 Deposits due to foreign 26.9 31.7 30.2 43.6 29.9 31.4 32.6 34.1 34.8 33.8 34.7 8 9 Private domestic deposits 620.7 597.0 579.7 533.1 507.4 493.9 465.1 490.5 458.4 468.4 471.1 9
10 Savings institutions 122.4 149.5 185.6 222.7 234.0 244.7 254.9 265.9 278.7 291.9 303.5 1011 Credit unions 32.5 36.6 43.0 45.4 51.3 50.4 50.9 51.3 55.2 54.2 55.6 11
12 Total assets 1244.8 1286.1 1333.4 1484.8 1392.9 1409.7 1385.7 1413.3 1385.2 1416.8 1453.0 12
13 Household sector 470.6 436.8 408.3 366.8 365.9 324.8 292.3 324.5 326.2 328.7 339.8 13
14 Nonfinancial business 385.0 415.1 484.3 543.3 534.8 572.0 605.0 592.4 565.6 559.7 556.9 1415 Corporate 244.3 251.9 287.1 321.9 307.3 333.9 363.1 346.6 315.0 304.0 296.7 1516 Nonfarm noncorporate 124.0 146.2 178.3 203.3 209.6 220.4 224.4 228.3 233.3 238.5 243.3 1617 Farm 16.7 16.9 18.8 18.0 17.8 17.6 17.5 17.4 17.2 17.1 17.0 17
18 State and local governments 27.8 32.2 28.3 32.1 27.2 27.0 25.7 33.2 30.2 30.2 28.8 1819 Federal government 38.3 41.6 23.2 87.9 51.2 60.6 55.7 24.3 30.7 48.9 50.6 19
20 Rest of the world 213.7 243.6 258.4 298.3 277.8 280.3 282.3 290.1 292.9 294.7 304.3 2021 Checkable deposits 27.1 32.2 30.4 43.7 30.1 31.6 32.8 34.4 34.9 33.9 35.3 2122 Currency 186.6 211.4 228.0 254.6 247.7 248.7 249.5 255.7 258.0 260.8 269.0 22
23 Financial sectors 80.9 98.7 111.7 143.9 126.5 128.3 117.1 127.2 140.9 169.2 191.8 23
24 Commercial banking 1.4 1.4 2.0 2.2 1.9 2.1 1.4 1.7 1.9 1.7 2.5 2425 Savings institutions 14.2 15.2 18.4 20.1 16.3 17.5 17.5 19.7 19.6 21.7 21.8 2526 Credit unions 7.5 8.1 9.1 26.4 26.4 24.0 17.6 12.2 15.0 18.1 25.0 2627 Bank personal trusts and estates 0.8 0.8 0.3 0.3 0.3 0.3 0.3 0.3 0.3 0.2 0.2 27
28 Life insurance companies 4.3 8.1 5.4 5.5 4.0 5.6 3.7 5.0 17.8 23.5 24.6 2829 Other insurance companies 3.9 4.2 4.0 4.3 3.1 2.7 3.1 3.7 10.6 11.8 13.1 2930 Private pension funds 5.4 6.6 6.9 8.0 8.2 8.3 8.6 8.7 8.9 9.4 9.7 3031 State and local govt. retirement funds 7.5 5.3 10.0 9.2 11.1 12.5 12.0 9.1 7.2 11.9 12.5 31
32 Money market mutual funds -1.1 1.5 -1.0 -2.2 -3.0 -3.6 0.0 2.2 -3.9 -2.8 -9.6 3233 Government-sponsored enterprises 0.7 1.9 4.4 11.8 0.7 1.2 1.0 2.1 2.0 2.7 3.9 3334 Finance companies 18.5 20.6 22.8 25.3 25.9 26.6 27.2 27.9 28.6 29.3 30.0 3435 REITs 2.2 3.3 4.1 4.4 4.5 4.2 3.8 4.3 4.1 4.7 5.2 3536 Brokers and dealers 15.7 21.7 25.4 28.7 27.1 27.0 20.8 30.3 28.8 37.0 52.8 36
37 Mail float 28.5 18.1 19.3 12.5 9.5 16.9 7.7 21.7 -1.2 -14.6 -19.2 37

Z.1, December 7, 2001 85
L.205 Time and Savings Deposits Billions of dollars; amounts outstanding end of period, not seasonally adjusted
1996 1997 1998 1999 2000 2001 Q1 Q2 Q3 Q4 Q1 Q2 Q3
1 Total liabilities 2967.9 3187.5 3432.0 3607.3 3694.5 3726.2 3816.7 3916.4 4043.3 4079.3 4137.4 1
2 Small time and savings deposits 2377.0 2474.1 2626.5 2671.2 2728.0 2738.8 2790.9 2861.9 2965.3 2992.3 3047.1 2
3 Commercial banking 1613.2 1761.5 1945.2 2016.5 2077.5 2100.3 2156.2 2229.8 2311.6 2342.3 2395.4 3 4 U.S.-chartered commercial banks 1594.2 1738.0 1924.4 1996.8 2058.0 2079.7 2136.2 2207.2 2290.4 2314.1 2370.9 4 5 Foreign banking offices in U.S. 8.7 13.1 9.5 7.5 7.2 7.7 6.5 9.0 7.7 13.5 9.3 5 6 Banks in U.S.-affiliated areas 10.4 10.4 11.4 12.2 12.3 12.9 13.5 13.6 13.4 14.8 15.2 6
7 Savings institutions 512.5 448.2 393.8 354.9 342.2 331.0 324.1 319.4 318.9 307.2 298.0 7 8 Credit unions 251.2 264.4 287.5 299.8 308.3 307.6 310.6 312.7 334.8 342.8 353.7 8
9 Large time deposits (1) 590.9 713.4 805.5 936.1 966.5 987.4 1025.9 1054.5 1078.0 1087.1 1090.4 9
10 Commercial banking 493.1 601.0 673.3 792.3 816.4 833.6 864.5 887.2 900.0 901.3 890.7 1011 U.S.-chartered commercial banks 306.1 369.3 404.1 465.6 480.4 511.4 530.0 553.5 548.8 551.3 549.0 1112 Foreign banking offices in U.S. 176.6 221.3 257.8 314.5 323.7 309.3 321.0 320.1 337.8 335.2 326.5 1213 Banks in U.S.-affiliated areas 10.4 10.4 11.4 12.2 12.3 12.9 13.5 13.6 13.4 14.8 15.2 13
14 Savings institutions 86.4 98.1 113.7 122.2 129.1 131.3 139.4 142.2 152.4 156.4 167.6 1415 Credit unions 11.4 14.4 18.5 21.6 21.1 22.5 22.0 25.1 25.6 29.3 32.0 15
16 Total assets 2967.9 3187.5 3432.0 3607.3 3694.5 3726.2 3816.7 3916.4 4043.3 4079.3 4137.4 16
17 Household sector 2434.0 2565.9 2759.6 2859.1 2961.7 3025.8 3107.1 3164.3 3269.0 3313.5 3361.2 17
18 Nonfinancial business 174.7 205.1 207.4 233.6 222.6 221.3 224.8 242.7 234.7 229.9 229.9 1819 Corporate 99.7 119.4 112.6 128.8 116.8 113.6 116.8 133.9 124.6 118.5 117.1 1920 Nonfarm noncorporate 75.0 85.7 94.8 104.8 105.8 107.7 108.0 108.8 110.1 111.4 112.8 20
21 State and local governments 72.6 78.4 91.1 102.1 98.9 100.7 103.4 111.5 109.9 107.1 107.4 2122 Federal government 2.4 3.4 4.7 5.4 5.5 5.7 6.2 6.3 8.4 9.9 11.7 2223 Rest of the world 60.6 73.6 86.6 101.6 99.2 99.6 98.0 107.2 97.2 97.8 95.9 23
24 Financial sectors 223.7 261.1 282.6 305.6 306.5 273.0 277.2 284.4 324.2 321.1 331.3 24
25 Savings institutions 1.4 1.0 1.5 1.3 1.9 1.3 1.1 1.4 1.7 2.4 2.2 2526 Credit unions 16.4 17.0 23.4 16.6 18.8 16.6 15.2 17.1 20.9 19.0 18.7 2627 Bank personal trusts and estates 9.0 10.0 7.8 8.7 9.0 9.2 9.3 9.4 9.5 9.6 9.7 27
28 Private pension funds 111.9 119.4 120.9 116.9 116.7 118.0 117.8 118.8 117.9 117.6 116.5 2829 State and local govt. retirement funds 2.3 2.4 2.0 1.7 2.4 2.7 4.4 1.1 0.8 1.1 1.5 2930 Money market mutual funds 82.7 111.3 127.0 160.4 157.7 125.1 129.3 136.6 173.3 171.5 182.7 30
(1) Large time deposits are those issued in amounts of $100,000 or more.
L.206 Money Market Mutual Fund SharesBillions of dollars; amounts outstanding end of period, not seasonally adjusted
1 Total assets 886.7 1042.5 1329.7 1578.8 1666.0 1627.1 1697.8 1812.1 1994.7 2014.8 2116.1 1
2 Household sector 500.7 582.3 747.1 871.6 951.2 914.4 936.9 1003.0 1093.4 1021.8 1091.7 2 3 Nonfinancial corporate business 67.6 87.8 114.3 137.3 139.3 140.0 155.9 177.7 210.3 238.4 246.3 3 4 Nonfarm noncorporate business 19.2 22.9 32.6 42.6 43.1 43.2 47.2 52.6 59.6 66.6 68.8 4
5 Bank personal trusts and estates 41.4 37.4 46.2 53.7 54.5 55.6 56.3 57.4 58.2 59.2 60.2 5 6 Life insurance companies 61.9 92.8 110.4 133.8 135.1 133.7 136.6 142.3 164.7 186.7 192.9 6 7 Private pension funds 48.4 61.4 63.4 75.1 75.5 75.6 78.6 81.0 83.4 85.9 88.5 7 8 Funding corporations 147.5 157.9 215.8 264.7 267.3 264.5 286.4 298.2 325.1 356.1 367.8 8

86 Z.1, December 7, 2001
L.207 Federal Funds and Security Repurchase AgreementsBillions of dollars; amounts outstanding end of period, not seasonally adjusted
1996 1997 1998 1999 2000 2001 Q1 Q2 Q3 Q4 Q1 Q2 Q3
1 Total liabilities 701.5 822.4 913.7 1083.4 1149.4 1185.2 1238.6 1194.1 1199.7 1240.5 1287.8 1
2 Commercial banking (net) 463.2 552.2 639.2 749.8 777.6 827.4 827.5 813.4 838.7 822.7 812.1 2 3 U.S.-chartered commercial banks 408.2 471.7 538.5 667.3 693.7 721.3 705.5 680.1 698.5 705.6 706.2 3 4 Foreign banking offices in U.S. 55.1 80.7 100.4 82.1 83.2 104.9 120.9 134.5 139.6 116.3 105.0 4 5 Bank holding companies -0.2 -0.2 0.4 0.5 0.7 1.2 1.1 -1.1 0.6 0.7 0.9 5
6 Savings institutions 43.7 41.8 51.3 72.7 73.5 75.0 81.2 66.7 67.1 69.6 54.6 6 7 REITs 13.7 24.9 15.1 15.7 13.0 11.2 12.4 11.9 13.1 15.1 16.9 7 8 Brokers and dealers (net) 180.9 203.5 208.1 245.2 285.3 271.6 317.6 302.2 280.8 333.1 404.2 8
9 Total assets 591.7 649.5 680.2 819.9 738.9 762.2 792.7 819.5 846.1 844.3 893.7 9
10 Nonfinancial corporate business 3.9 4.6 4.2 5.3 6.1 4.2 4.0 4.8 3.3 3.9 2.5 1011 State and local governments 147.8 151.4 158.5 163.5 176.4 174.0 177.0 173.3 178.0 182.3 192.5 1112 Rest of the world 70.9 90.8 72.0 86.8 76.0 88.1 93.3 91.9 116.2 119.5 110.5 12
13 Financial sectors 369.2 402.7 445.4 564.2 480.4 495.9 518.4 549.5 548.6 538.6 588.2 1314 Monetary authority 21.6 23.8 30.4 140.6 23.7 26.9 17.3 43.4 22.0 23.3 47.9 1415 Savings institutions 10.0 9.2 14.8 10.6 11.5 12.0 14.7 14.9 21.7 22.0 25.8 1516 Credit unions 1.4 3.5 6.8 9.3 9.6 2.8 7.8 4.0 10.8 8.3 7.9 16
17 Other insurance companies 35.4 35.2 42.7 28.3 34.8 35.3 35.8 38.3 27.8 26.6 30.9 1718 Private pension funds 26.7 27.6 28.6 29.0 29.1 29.2 29.5 29.9 29.0 29.3 29.6 1819 State and local govt. retirement funds 28.2 28.6 37.5 40.4 45.4 46.8 45.1 44.7 42.5 46.8 48.0 1920 Money market mutual funds 103.8 126.6 139.5 139.6 158.3 169.4 172.0 183.0 205.9 208.2 221.5 2021 Mutual funds 47.5 57.8 68.2 76.7 77.4 92.5 102.4 103.4 86.6 79.6 69.4 2122 Government-sponsored enterprises 94.5 90.4 77.0 89.7 90.6 80.9 93.7 88.1 102.3 94.4 107.2 22
23 Discrepancy--unallocated assets 109.8 172.9 233.5 263.6 410.5 423.0 446.0 374.6 353.7 396.2 394.1 23
L.208 Open Market PaperBillions of dollars; amounts outstanding end of period, not seasonally adjusted
1 Total outstanding, all types 803.0 979.4 1172.6 1402.4 1478.1 1533.3 1568.3 1610.0 1546.8 1477.9 1417.8 1
2 Commercial paper 779.4 958.5 1161.0 1393.8 1469.1 1524.0 1559.6 1602.1 1539.0 1471.1 1412.7 2
3 Nonfinancial corporate business 156.4 168.6 193.0 230.3 260.8 296.8 307.0 278.4 253.2 223.3 201.3 3 4 Foreign issues in U.S. 67.5 65.1 72.9 89.2 101.6 101.2 109.8 120.9 112.8 110.1 106.3 4 5 Nonfinancial 18.7 20.0 18.5 26.7 33.8 35.4 38.7 37.6 27.9 20.5 17.2 5 6 Financial 48.8 45.0 54.4 62.5 67.8 65.9 71.1 83.3 84.9 89.6 89.1 6
7 Financial business 555.5 724.8 895.2 1074.3 1106.7 1125.9 1142.8 1202.7 1173.0 1137.7 1105.1 7 8 Commercial banking 32.0 37.6 45.4 54.5 50.8 52.4 54.1 55.7 63.4 62.7 62.4 8 9 ABS issuers 146.7 256.1 381.8 520.8 546.6 570.3 595.7 641.8 653.3 670.3 691.3 910 Finance companies 178.0 202.6 233.3 230.4 233.0 224.3 218.8 238.8 180.9 181.6 171.0 1011 REITs 0.0 0.0 0.2 0.1 0.1 1.0 0.2 0.2 0.1 0.0 1.1 1112 Funding corporations 198.8 228.5 234.4 268.5 276.2 277.9 274.1 266.2 275.4 223.1 179.3 12
13 Bankers acceptances (1) 23.6 20.9 11.5 8.6 9.0 9.3 8.7 7.9 7.8 6.8 5.1 13
14 Holdings, by sector 803.0 979.4 1172.6 1402.4 1478.1 1533.3 1568.3 1610.0 1546.8 1477.9 1417.8 14
15 Household sector 54.7 56.1 63.7 67.7 68.9 70.2 71.4 72.7 67.2 62.7 58.9 1516 Nonfinancial corporate business 31.5 36.1 39.4 43.7 38.3 37.3 40.6 44.0 43.0 45.3 43.5 1617 State and local governments 59.7 74.0 102.0 103.9 105.6 110.0 109.0 111.5 112.5 108.2 113.2 1718 Rest of the world 57.9 77.8 115.3 102.3 100.0 98.2 94.6 111.0 110.0 113.2 110.7 18
19 Monetary authority 0.0 0.0 0.0 0.0 0.0 0.0 0.0 0.0 0.0 0.0 0.0 1920 Commercial banking (1) 6.5 2.7 1.1 1.4 1.4 1.4 1.3 1.5 0.6 0.0 0.0 2021 Savings institutions 0.3 0.0 0.0 0.0 0.0 0.0 0.0 0.0 0.0 0.0 0.0 2122 Credit unions 0.3 0.2 0.4 1.9 0.8 0.3 1.2 1.2 1.1 1.6 1.3 2223 Bank personal trusts and estates 21.1 21.0 16.5 17.1 17.3 17.4 17.6 17.7 16.7 15.8 14.9 23
24 Life insurance companies 48.4 65.9 73.4 75.8 72.0 73.7 75.2 71.2 60.4 58.9 66.0 2425 Private pension funds 30.1 31.3 34.1 37.8 35.9 36.0 36.3 36.0 32.8 31.4 32.2 2526 State and local govt. retirement funds 28.2 28.6 37.5 40.4 45.4 46.8 45.1 44.7 42.5 46.8 48.0 26
27 Money market mutual funds 273.9 336.0 414.2 519.0 576.0 566.4 589.3 614.4 641.9 638.2 647.2 2728 Mutual funds 47.2 57.8 68.2 76.7 77.4 92.5 102.4 103.4 86.6 76.2 69.4 2829 Government-sponsored enterprises 35.1 34.0 60.9 33.8 38.1 34.8 42.2 50.6 38.0 48.1 48.2 2930 Brokers and dealers 23.7 24.3 28.0 26.0 30.2 38.2 45.4 39.2 44.5 44.8 50.4 3031 Funding corporations 84.5 133.6 117.7 255.0 270.7 309.9 296.5 290.7 249.1 186.9 113.7 31
(1) Excludes banks’ holdings of own acceptances.

Z.1, December 7, 2001 87
L.209 Treasury SecuritiesBillions of dollars; amounts outstanding end of period, not seasonally adjusted
1996 1997 1998 1999 2000 2001 Q1 Q2 Q3 Q4 Q1 Q2 Q3
1 Total liabilities 3755.1 3778.3 3723.7 3652.8 3625.8 3435.7 3382.6 3357.8 3382.1 3224.4 3293.1 1
2 Savings bonds 187.0 186.5 186.6 186.4 185.3 184.6 184.3 184.8 184.8 185.5 186.4 2 3 Other Treasury issues 3568.1 3591.8 3537.1 3466.3 3440.5 3251.1 3198.2 3173.1 3197.3 3038.9 3106.7 3
4 Total assets 3755.1 3778.3 3723.7 3652.8 3625.8 3435.7 3382.6 3357.8 3382.1 3224.4 3293.1 4
5 Household sector 739.1 598.8 485.5 555.0 505.1 400.9 364.3 355.2 339.4 261.6 278.4 5 6 Savings bonds 187.0 186.5 186.6 186.4 185.3 184.6 184.3 184.8 184.8 185.5 186.4 6 7 Other Treasury issues 552.1 412.3 298.9 368.6 319.9 216.3 179.9 170.5 154.7 76.2 92.0 7
8 Nonfinancial corporate business 47.1 26.8 23.6 19.6 21.6 23.7 23.2 18.4 18.0 17.0 16.0 8 9 Nonfarm noncorporate business 26.7 30.8 37.0 33.9 31.3 27.6 25.9 23.7 20.9 18.2 14.8 910 State and local governments 257.0 239.3 269.3 266.8 257.2 256.4 241.9 236.2 224.0 216.5 188.9 10
11 Rest of the world 1093.3 1252.0 1318.8 1238.9 1245.8 1221.2 1199.7 1222.0 1221.7 1192.6 1200.2 1112 Monetary authority 390.9 430.7 452.1 478.0 501.7 505.0 511.4 511.7 523.9 535.1 534.1 12
13 Commercial banking 261.8 270.1 214.0 226.7 215.6 201.4 200.9 182.2 171.9 176.0 175.9 1314 U.S.-chartered commercial banks 173.0 166.8 124.7 122.8 125.3 116.4 108.6 87.9 72.2 69.9 65.3 1415 Foreign banking offices in U.S. 80.7 95.1 84.8 92.3 86.9 81.6 89.0 91.7 97.8 104.3 108.4 1516 Bank holding companies 4.0 4.0 0.9 8.8 0.9 1.1 1.1 0.8 0.8 0.9 0.8 1617 Banks in U.S.-affiliated areas 4.1 4.2 3.6 2.8 2.5 2.4 2.2 1.8 1.2 0.9 1.4 17
18 Savings institutions 17.4 14.6 10.2 10.1 9.9 9.1 8.8 8.7 8.0 7.5 6.6 1819 Credit unions 17.4 15.6 13.1 9.6 9.4 8.8 8.6 8.2 8.0 6.6 6.4 1920 Bank personal trusts and estates 25.7 20.4 17.3 17.3 17.1 16.9 16.7 16.5 16.2 15.8 15.4 20
21 Life insurance companies 93.2 85.5 71.3 62.8 61.7 60.5 59.5 58.1 53.8 48.7 44.2 2122 Other insurance companies 120.9 91.1 70.4 60.6 58.3 56.0 54.3 52.1 48.1 46.1 44.3 2223 Private pension funds 139.4 143.5 139.1 138.5 137.8 139.6 139.7 137.7 131.2 127.5 122.7 2324 State and local govt. retirement funds 203.5 216.9 217.7 211.2 211.1 210.5 200.7 195.7 195.3 197.1 192.0 24
25 Money market mutual funds 90.2 86.2 103.6 103.8 98.9 78.8 79.8 90.4 96.3 93.4 111.9 2526 Mutual funds 214.2 225.2 230.4 223.6 216.5 215.1 212.5 214.4 218.9 232.2 243.4 2627 Closed-end funds 11.4 10.2 9.3 8.0 8.0 7.9 7.8 7.7 7.6 7.6 7.5 2728 Government-sponsored enterprises 18.8 25.9 25.2 30.9 25.2 20.7 19.0 22.1 23.1 23.2 18.9 2829 Brokers and dealers -12.8 -5.3 15.8 -42.6 -6.5 -24.1 7.8 -3.3 55.9 1.6 71.5 29
Memo:
30 Federal government debt (1) 3781.8 3804.9 3752.2 3681.0 3653.5 3464.0 3410.2 3385.2 3408.8 3251.4 3320.1 30
(1) Total Treasury securities (table L.209, line 1) plus budget agency securities (table L.210, line 2) and federal mortgage debt (table L.217, line 12).

88 Z.1, December 7, 2001
L.210 Agency Securities (1)Billions of dollars; amounts outstanding end of period, not seasonally adjusted
1996 1997 1998 1999 2000 2001 Q1 Q2 Q3 Q4 Q1 Q2 Q3
1 Total liabilities 2634.8 2847.6 3320.5 3912.2 3967.8 4063.6 4191.7 4344.8 4449.7 4618.7 4823.7 1
2 Budget agencies 26.6 26.5 28.5 28.3 27.8 28.2 27.6 27.3 26.8 27.0 27.0 2 3 Government-sponsored enterprises 896.9 995.3 1273.6 1591.7 1618.0 1680.2 1749.7 1825.8 1888.7 1955.8 2037.8 3 4 Federally related mortgage pools 1711.3 1825.8 2018.4 2292.2 2322.1 2355.2 2414.3 2491.6 2534.2 2635.8 2759.0 4
5 Total assets 2634.8 2847.6 3320.5 3912.2 3967.8 4063.6 4191.7 4344.8 4449.7 4618.7 4823.7 5
6 Household sector 259.4 266.2 191.2 274.2 257.5 275.7 283.9 259.8 150.3 182.4 174.0 6 7 Nonfinancial corporate business 28.5 8.0 10.6 12.5 15.0 17.9 19.0 15.7 15.9 17.5 25.0 7 8 State and local governments 116.2 115.4 179.0 207.5 213.3 220.0 226.0 231.0 237.9 243.6 250.5 8
9 Federal government 0.0 0.0 0.0 0.0 0.0 0.0 0.0 0.0 0.0 0.0 0.0 910 Rest of the world 196.3 246.5 303.4 394.6 428.8 458.1 500.9 550.3 592.6 631.9 664.8 1011 Monetary authority 2.2 0.7 0.3 0.2 0.2 0.1 0.1 0.1 0.0 0.0 0.0 11
12 Commercial banking 495.7 571.2 662.6 698.3 715.9 719.4 711.8 720.9 715.7 696.8 738.3 1213 U.S.-chartered commercial banks 436.7 497.2 578.8 608.1 626.9 630.7 620.7 626.3 618.6 621.7 657.1 1314 Foreign banking offices in U.S. 49.7 62.2 67.0 71.3 70.5 69.5 70.1 71.9 75.3 53.5 59.4 1415 Bank holding companies 4.9 5.5 6.6 5.4 4.7 5.0 5.1 4.8 5.4 5.1 5.0 1516 Banks in U.S.-affiliated areas 4.3 6.3 10.2 13.5 13.7 14.2 16.0 17.8 16.4 16.5 16.8 16
17 Savings institutions 156.1 155.3 143.6 147.3 142.2 140.0 139.6 140.6 145.5 150.7 148.9 1718 Credit unions 50.7 51.0 58.4 61.3 65.4 65.8 60.9 60.9 68.4 66.3 74.1 1819 Bank personal trusts and estates 45.6 40.8 39.4 45.2 46.2 47.2 48.5 49.8 50.6 51.6 52.2 19
20 Life insurance companies 244.1 226.7 217.0 224.4 228.0 229.8 233.0 235.4 243.6 248.5 257.0 2021 Other insurance companies 51.0 70.8 69.7 75.5 77.5 79.4 82.1 84.1 85.2 86.7 88.1 2122 Private pension funds 203.7 211.4 250.3 280.9 291.5 292.9 302.0 308.6 315.9 311.3 311.9 2223 State and local govt. retirement funds 104.9 123.3 142.4 165.3 160.8 175.5 187.2 202.8 196.0 201.1 204.0 23
24 Money market mutual funds 101.8 96.3 173.8 190.9 172.7 158.1 161.9 185.2 248.0 267.9 317.1 2425 Mutual funds 116.1 124.5 145.5 164.7 163.6 172.3 176.8 184.2 190.6 214.3 228.5 2526 Government-sponsored enterprises 257.6 326.5 489.6 668.3 698.4 717.0 755.6 813.3 870.6 911.4 960.2 26
27 ABS issuers 137.8 141.5 179.7 221.0 226.4 226.2 225.7 223.8 233.7 223.0 230.3 2728 REITs 12.2 21.2 13.1 14.2 14.1 13.1 13.9 14.5 13.9 17.4 18.3 2829 Brokers and dealers 55.2 50.4 50.9 66.0 50.3 55.1 62.6 63.7 75.3 96.3 80.4 29
(1) Agency securities include: issues of federal budget agencies (line 2) such as those for the TVA; issues of government sponsored enterprises (line 3) such as FNMA and FHLB; and federally related mortgage-backed securities issued by GNMA, FNMA, FHLMC, and the Farmers Home Administration (line 4). Only the budget agency issues are considered officially to be part of the total debt of the federal government, which is shown in table L.209, line 30.

Z.1, December 7, 2001 89
L.211 Municipal Securities and LoansBillions of dollars; amounts outstanding end of period, not seasonally adjusted
1996 1997 1998 1999 2000 2001 Q1 Q2 Q3 Q4 Q1 Q2 Q3
1 Total liabilities 1296.0 1367.5 1464.3 1532.5 1539.2 1551.6 1550.3 1567.8 1597.5 1629.8 1635.3 1
2 State and local governments 1053.3 1110.6 1189.7 1242.4 1247.9 1256.7 1254.5 1270.6 1298.7 1328.9 1331.7 2 3 Short-term (1) 39.1 47.5 41.2 44.8 46.4 45.2 43.5 47.9 53.7 55.7 64.9 3 4 Long-term 1014.1 1063.1 1148.5 1197.6 1201.5 1211.6 1211.0 1222.7 1244.9 1273.3 1266.8 4
5 Nonprofit organizations (2) 104.9 114.9 126.9 137.3 138.0 141.4 141.9 143.0 144.2 145.3 147.5 5 6 Nonfinancial corporate business 137.9 142.0 147.8 152.8 153.3 153.4 153.9 154.2 154.7 155.6 156.2 6 (industrial revenue bonds)
7 Total assets 1296.0 1367.5 1464.3 1532.5 1539.2 1551.6 1550.3 1567.8 1597.5 1629.8 1635.3 7
8 Household sector 433.2 468.8 488.3 526.6 529.1 543.4 543.1 541.2 559.4 574.7 554.8 8 9 Nonfinancial corporate business 31.0 27.4 25.7 22.3 23.9 35.9 27.6 33.1 23.9 31.6 34.9 910 Nonfarm noncorporate business 2.6 3.2 1.5 3.5 3.5 3.6 3.6 3.7 3.7 3.8 3.8 1011 State and local governments 4.6 3.9 2.5 1.0 0.6 1.0 1.8 1.6 2.1 2.0 2.1 11
12 Commercial banking 94.2 96.7 104.8 110.7 111.9 112.3 113.4 114.0 112.7 116.2 117.9 1213 Savings institutions 2.1 2.1 2.5 3.0 3.1 3.0 3.0 3.2 3.9 4.0 4.1 1314 Bank personal trusts and estates 104.0 90.7 89.5 100.3 102.1 103.0 104.3 105.0 105.8 106.3 106.7 14
15 Life insurance companies 13.4 16.7 18.4 20.1 20.0 19.6 19.4 19.1 19.5 20.4 20.7 1516 Other insurance companies 175.4 191.6 208.1 199.0 194.7 190.4 188.1 184.1 185.3 184.8 185.1 1617 State and local govt. retirement funds 0.6 1.5 3.3 3.0 2.9 2.8 2.2 1.6 1.8 1.6 1.6 17
18 Money market mutual funds 144.5 167.0 193.0 210.4 225.8 221.5 227.6 244.8 256.0 255.2 267.1 1819 Mutual funds 213.3 219.8 242.6 239.4 232.3 227.9 228.4 230.5 236.0 240.1 246.0 1920 Closed-end funds 60.8 59.9 61.8 70.5 69.3 68.2 67.0 65.9 64.7 63.6 62.4 2021 Government-sponsored enterprises 5.6 5.2 9.2 10.6 9.2 9.1 9.9 8.8 9.9 12.0 12.1 2122 Brokers and dealers 10.8 13.2 13.1 11.9 10.8 9.9 10.8 11.3 12.7 13.7 16.0 22
(1) Debt with original maturity of 13 months or less.(2) Liability of the households and nonprofit organizations sector (tables F.100 and L.100).
L.212 Corporate and Foreign BondsBillions of dollars; amounts outstanding end of period, not seasonally adjusted
1 Total liabilities 3209.4 3607.2 4170.8 4635.8 4736.1 4841.0 4958.7 5050.0 5264.0 5426.6 5528.1 1
2 Nonfinancial corporate business 1460.4 1610.9 1829.6 2059.5 2106.0 2144.5 2186.7 2230.6 2330.8 2437.8 2484.7 2 3 Rest of the world (1) 366.3 427.7 462.6 479.4 491.3 484.5 502.4 504.6 508.9 504.9 479.6 3
4 Financial sectors 1382.7 1568.6 1878.7 2096.9 2138.8 2212.0 2269.7 2314.8 2424.3 2483.9 2563.8 4 5 Commercial banking 168.9 192.6 220.2 240.6 248.9 258.4 266.6 273.2 293.1 295.3 303.2 5 6 Savings institutions 2.7 2.8 2.6 2.7 2.7 2.7 3.4 6.3 2.8 6.4 6.1 6
7 ABS issuers 716.6 820.5 1016.2 1100.6 1109.1 1126.7 1146.6 1187.8 1240.4 1272.2 1328.9 7 8 Finance companies 336.8 341.5 365.6 429.9 446.6 483.7 507.3 502.2 533.8 542.1 555.9 8 9 REITs 16.8 31.6 53.4 62.2 63.9 67.2 68.6 67.0 70.0 68.6 68.4 910 Brokers and dealers 27.3 35.3 42.5 25.3 36.4 36.2 42.6 40.9 35.0 43.9 47.0 1011 Funding corporations 113.6 144.2 178.2 235.5 231.1 237.1 234.7 237.5 249.3 255.5 254.3 11
12 Total assets 3209.4 3607.2 4170.8 4635.8 4736.1 4841.0 4958.7 5050.0 5264.0 5426.6 5528.1 12
13 Household sector 491.0 531.7 628.5 650.8 642.5 688.1 665.9 637.1 700.3 676.4 654.5 1314 State and local governments 49.7 51.0 61.2 73.8 75.3 76.5 76.9 77.5 80.4 82.2 85.9 1415 Rest of the world (2) 453.2 537.8 660.0 820.8 865.4 907.6 954.0 1003.9 1073.9 1143.8 1181.2 15
16 Commercial banking 112.3 143.1 181.1 219.9 214.1 219.0 253.5 277.5 290.5 325.8 337.9 1617 Savings institutions 68.6 58.7 88.6 112.0 115.7 110.6 107.3 109.5 96.0 93.2 88.1 1718 Bank personal trusts and estates 31.9 31.1 28.5 39.8 41.8 43.5 45.4 48.0 50.5 53.6 56.1 18
19 Life insurance companies 949.3 1046.0 1130.4 1173.2 1192.5 1198.2 1212.2 1222.2 1252.0 1280.2 1310.0 1920 Other insurance companies 141.6 159.5 171.1 181.1 182.3 183.3 186.2 187.5 189.7 190.7 193.1 2021 Private pension funds 244.9 278.7 295.8 305.1 308.4 311.0 317.3 319.7 328.3 336.0 338.9 2122 State and local govt. retirement funds 211.4 244.5 279.6 310.0 325.3 318.5 327.9 339.7 330.6 332.4 337.0 22
23 Money market mutual funds 23.9 36.4 81.2 123.7 143.6 134.6 153.9 161.9 161.6 159.9 154.7 2324 Mutual funds 229.5 273.8 339.3 368.6 363.9 366.0 368.3 367.3 381.8 397.3 405.6 2425 Closed-end funds 28.6 28.1 32.6 32.6 31.7 30.8 30.0 29.1 28.2 27.3 26.5 25
26 Government-sponsored enterprises 41.8 47.1 67.8 91.5 94.2 106.5 113.9 117.3 125.2 137.3 137.0 2627 REITs 4.3 6.5 6.1 5.7 5.6 6.4 5.7 5.3 7.4 5.2 5.9 2728 Brokers and dealers 90.9 100.0 81.4 93.4 110.0 109.1 116.6 112.7 124.0 132.0 151.5 2829 Funding corporations 36.5 33.1 37.6 33.8 23.8 31.1 23.9 33.9 43.6 53.3 64.2 29
(1) Holdings of foreign issues by U.S. residents.(2) Holdings of U.S. issues by foreign residents.

90 Z.1, December 7, 2001
L.213 Corporate Equities (1)Billions of dollars; amounts outstanding end of period, not seasonally adjusted
1996 1997 1998 1999 2000 2001 Q1 Q2 Q3 Q4 Q1 Q2 Q3
1 Issues at market value 10281.6 13301.7 15577.3 19581.2 20276.3 19395.9 19249.0 17566.4 15311.6 16239.1 13625.2 1
2 Nonfinancial corporate business 7644.4 9774.6 11606.7 15117.0 15727.7 14938.5 14458.4 12740.8 10989.6 11691.2 9681.6 2
3 Rest of the world (2) 1002.9 1207.8 1476.2 2026.6 2057.4 2010.9 1854.0 1787.0 1574.0 1610.7 1368.4 3 4 Financial corporations 1634.3 2319.3 2494.5 2437.5 2491.2 2446.5 2936.6 3038.7 2747.9 2937.2 2575.1 4
5 Holdings at market value 10281.6 13301.7 15577.3 19581.2 20276.3 19395.9 19249.0 17566.4 15311.6 16239.1 13625.2 5
6 Household sector 4895.6 6302.5 7259.7 9342.8 9507.6 8862.9 8518.0 7487.1 6285.5 6643.8 5471.8 6 7 State and local governments 46.8 79.0 102.0 115.0 113.2 115.0 117.6 115.1 108.6 118.6 108.8 7 8 Rest of the world (3) 656.8 919.5 1175.1 1537.8 1598.2 1620.4 1724.9 1748.3 1626.5 1732.2 1524.4 8
9 Commercial banking 6.8 2.6 6.8 10.4 10.5 10.5 11.8 11.0 7.7 8.8 6.4 910 Savings institutions 17.8 23.3 24.5 23.8 23.7 24.2 24.4 24.2 24.6 25.6 27.1 1011 Bank personal trusts and estates 248.9 321.0 314.0 338.3 345.1 323.8 318.6 280.0 239.8 251.9 206.2 11
12 Life insurance companies 414.1 558.6 733.2 964.5 1027.6 1007.8 1023.3 940.8 873.2 926.4 820.8 1213 Other insurance companies 148.6 186.0 200.1 207.9 205.3 203.9 199.4 194.3 172.2 179.9 169.6 1314 Private pension funds 1463.9 1696.4 1902.2 2156.9 2231.2 2153.2 2158.3 2001.1 1778.5 1858.0 1591.3 1415 State and local govt. retirement funds 828.5 1084.8 1233.9 1343.2 1331.0 1322.5 1360.9 1335.1 1224.1 1260.0 1100.3 15
16 Mutual funds 1470.0 2018.7 2508.5 3400.0 3730.2 3591.3 3620.9 3250.8 2797.6 3034.8 2442.0 1617 Closed-end funds 43.6 50.7 47.3 39.9 41.4 39.6 39.7 35.7 31.3 33.7 28.4 1718 Exchange-traded funds 2.4 6.7 15.6 33.9 36.8 46.1 49.7 65.6 66.0 75.6 64.3 1819 Brokers and dealers 37.9 51.9 54.4 66.9 74.4 74.5 81.5 77.2 76.0 89.8 63.6 19
Memo:
20 Market value of domestic corporations (4) 9039.4 11795.9 13777.0 17195.7 17850.5 17010.3 17013.0 15395.7 13384.3 14240.6 11924.4 20
(1) Excludes mutual fund shares shown on table L.214.(2) Holdings of foreign issues by U.S. residents; includes American Depositary Receipts (ADRs).(3) Holdings of U.S. issues by foreign residents.(4) Sum of lines 2 and 4 less the sum of lines 9, 13, 17, 18; line 1 excludes intercorporate holdings of nonfinancial corporations.
L.214 Mutual Fund SharesBillions of dollars; amounts outstanding end of period, not seasonally adjusted
1 Shares at market value 2342.4 2989.4 3610.5 4553.4 4863.3 4759.6 4814.4 4457.2 3999.8 4275.3 3705.2 1
2 Holdings at market value 2342.4 2989.4 3610.5 4553.4 4863.3 4759.6 4814.4 4457.2 3999.8 4275.3 3705.2 2
3 Household sector 1495.4 1941.2 2362.0 3066.3 3302.7 3240.1 3279.5 3043.2 2739.3 2934.5 2544.7 3 4 Nonfinancial corporate business 59.9 69.1 91.0 113.9 117.5 111.4 111.0 98.8 85.9 91.6 76.3 4 5 State and local governments 41.0 33.6 21.3 25.6 22.9 24.3 25.4 26.4 28.8 30.7 30.5 5
6 Commercial banking 2.6 8.1 9.2 11.1 12.4 12.2 12.5 13.8 15.9 16.0 15.0 6 7 Credit unions 2.6 2.4 3.6 2.5 3.2 2.3 2.2 2.2 2.0 3.6 3.1 7 8 Bank personal trusts and estates 293.2 326.9 390.8 460.6 475.8 449.2 441.3 387.0 333.4 352.2 290.3 8
9 Life insurance companies 35.3 38.4 23.3 43.3 47.8 48.6 51.1 48.1 42.6 46.1 39.1 910 Private pension funds 412.3 569.6 709.3 830.1 881.1 871.5 891.4 837.6 752.0 800.4 706.2 10

Z.1, December 7, 2001 91
L.215 Bank Loans Not Elsewhere ClassifiedBillions of dollars; amounts outstanding end of period, not seasonally adjusted
1996 1997 1998 1999 2000 2001 Q1 Q2 Q3 Q4 Q1 Q2 Q3
Total loans by commercial 1 banking, flow of funds basis 2821.1 3052.9 3304.8 3504.9 3602.1 3736.9 3801.9 3875.3 3909.0 3895.7 3889.0 1
- Loans elsewhere classified: 2 Open market paper 6.5 2.7 1.1 1.4 1.4 1.4 1.3 1.5 0.6 0.0 0.0 2 3 Mortgages 1145.4 1245.3 1337.0 1495.2 1546.5 1614.1 1648.1 1659.3 1688.1 1723.3 1736.1 3 4 Consumer credit 526.8 512.6 508.9 499.8 497.1 506.2 521.8 541.5 533.7 540.2 535.3 4 5 Security credit 100.8 122.5 142.9 124.8 143.4 150.6 159.0 175.2 191.6 172.7 167.4 5
6 = Banking sector total bank loans n.e.c. 1041.7 1169.8 1314.9 1383.8 1413.7 1464.6 1471.7 1497.9 1495.1 1459.5 1450.2 6
7 U.S.-chartered commercial banks 759.8 867.9 1012.2 1104.4 1131.9 1178.7 1186.5 1202.6 1197.5 1179.3 1170.7 7 8 Foreign banking offices in U.S. 264.8 284.0 282.2 259.9 262.2 263.9 265.1 275.7 276.8 259.0 258.3 8 9 Bank holding companies 2.5 2.4 4.1 2.6 1.9 4.0 1.8 1.6 2.7 2.7 2.6 910 Banks in U.S.-affiliated areas 14.6 15.5 16.3 16.9 17.8 18.0 18.4 18.0 18.1 18.6 18.6 10
11 + Loans from Federal Reserve banks 0.0 0.0 0.0 0.0 0.0 0.0 0.0 0.0 0.0 0.0 0.0 11
12 = Total bank loans n.e.c. 1041.7 1169.8 1314.9 1383.8 1413.7 1464.6 1471.7 1497.9 1495.1 1459.5 1450.2 12
13 Total liabilities 1041.7 1169.8 1314.9 1383.8 1413.7 1464.6 1471.7 1497.9 1495.1 1459.5 1450.2 13
14 Nonfinancial sectors 977.7 1092.5 1207.4 1290.6 1322.0 1371.5 1378.9 1404.9 1397.8 1359.1 1350.2 14
15 Households 58.0 66.5 72.7 65.4 69.3 71.4 67.1 73.5 63.4 59.3 65.7 1516 Corporate business 642.1 692.7 774.5 847.5 868.3 902.5 909.0 921.8 923.2 898.7 886.5 1617 Nonfarm noncorporate business 193.6 237.3 256.3 274.2 278.7 287.1 288.9 292.0 292.2 287.2 283.5 1718 Farm business 40.4 43.9 45.1 44.2 42.4 45.9 46.2 46.9 45.1 47.8 47.1 18
19 Rest of the world 43.7 52.1 58.9 59.4 63.3 64.7 67.7 70.7 73.9 66.2 67.3 1920 Foreign official institutions 2.9 2.1 2.8 3.0 2.8 3.1 3.6 3.5 3.6 3.3 4.2 2021 Foreign banks 14.3 13.8 13.1 10.0 11.4 12.0 12.6 13.2 16.2 9.2 9.4 2122 Other foreign 26.5 36.3 43.0 46.5 49.1 49.5 51.5 54.0 54.1 53.7 53.7 22
23 Financial sectors 64.0 77.3 107.5 93.2 91.8 93.1 92.8 93.0 97.3 100.4 100.0 23
24 Savings institutions 15.9 19.4 29.7 14.0 20.4 21.3 20.8 21.5 22.6 21.7 23.3 2425 Finance companies 19.7 24.2 26.5 35.4 28.8 32.8 35.7 35.9 41.6 45.3 44.5 2526 Mortgage companies 20.6 16.0 17.7 17.8 17.1 17.8 17.7 17.9 18.1 18.2 18.5 2627 REITs 7.8 17.6 33.6 26.0 25.5 21.2 18.6 17.7 15.0 15.2 13.7 27

92 Z.1, December 7, 2001
L.216 Other Loans and AdvancesBillions of dollars; amounts outstanding end of period, not seasonally adjusted
1996 1997 1998 1999 2000 2001 Q1 Q2 Q3 Q4 Q1 Q2 Q3
1 Total other loans and advances 993.2 1086.6 1253.0 1412.0 1464.4 1526.2 1520.9 1565.9 1582.0 1607.9 1628.5 1
2 U.S. government loans 149.0 158.8 173.3 179.3 181.9 183.8 185.3 187.6 189.4 190.5 191.6 2 3 Liab.: Household sector 30.4 41.8 52.4 65.0 68.1 70.7 73.5 76.2 78.8 81.8 84.6 3 4 Nonfinancial corporate business 8.7 8.4 8.3 8.0 7.9 7.7 7.6 7.6 7.6 7.3 7.7 4 5 Nonfarm noncorporate business 39.1 40.9 44.8 43.9 43.9 43.5 43.2 42.8 42.2 41.6 40.6 5 6 Farm business 5.9 5.5 5.1 4.9 4.9 4.9 4.9 5.0 5.0 5.1 5.1 6 7 State and local governments 10.1 8.9 10.1 9.7 9.3 8.9 8.6 8.7 8.8 8.9 8.9 7 8 Rest of the world 54.8 53.3 52.4 47.8 47.9 48.0 47.4 47.3 46.9 45.8 44.7 8 9 Government-sponsored enterprises 0.0 0.0 0.0 0.0 0.0 0.0 0.0 0.0 0.0 0.0 0.0 9
10 Foreign loans to U.S. corporate business 126.0 143.3 142.3 119.5 120.8 124.8 112.4 117.3 114.9 118.9 136.2 1011 Liab.: Nonfinancial corporate business 126.0 143.3 142.3 119.5 120.8 124.8 112.4 117.3 114.9 118.9 136.2 11
Customers’ liability on acceptances12 outstanding (bank asset) 23.4 20.6 11.3 8.2 8.7 9.0 8.4 7.5 7.4 6.6 4.8 1213 Liab.: Nonfinancial corporate business 13.4 10.8 6.6 4.4 4.9 4.9 4.6 4.3 6.6 5.8 4.3 1314 Rest of the world 9.9 9.7 4.7 3.9 3.8 4.1 3.8 3.1 0.8 0.8 0.6 14
15 Savings institution loans to business 15.7 18.8 24.2 30.7 33.4 35.4 37.9 39.3 41.4 43.8 43.6 1516 Liab.: Nonfinancial corporate business 7.9 9.4 12.1 15.3 16.7 17.7 19.0 19.7 20.7 21.9 21.8 1617 Nonfarm noncorporate business 7.9 9.4 12.1 15.3 16.7 17.7 19.0 19.7 20.7 21.9 21.8 17
18 Policy loans (Household liability) 101.4 104.6 104.7 100.0 99.6 100.5 102.0 102.8 103.8 104.0 105.0 1819 Asset: Federal government 1.0 1.0 0.9 0.9 0.9 0.9 0.9 0.9 0.9 0.9 0.9 1920 Life insurance companies 100.5 103.7 103.8 99.0 98.7 99.6 101.1 101.9 102.9 103.0 104.1 20
21 Government-sponsored enterprise loans 229.1 260.3 352.6 466.2 472.9 505.4 503.5 514.6 527.9 530.1 547.6 2122 Liab.: Household sector (SLMA) 34.6 30.2 29.0 34.5 32.3 31.7 35.9 37.4 38.0 39.2 40.0 2223 Noncorporate business (FCS) 15.1 15.1 17.8 17.9 17.1 18.2 18.9 19.4 19.4 20.9 21.4 2324 Farm business (FCS) 16.5 16.5 17.1 17.9 19.1 18.6 18.5 19.5 19.6 19.2 19.0 2425 Commercial banks (FHLB and SLMA) 39.0 58.1 104.9 145.6 155.0 174.6 172.6 172.4 176.1 179.0 186.1 2526 Savings institutions (FHLB and SLMA) 121.9 138.0 180.1 243.7 243.8 256.7 251.8 260.0 269.7 266.4 274.5 2627 Credit unions (FHLB) 0.4 0.6 1.1 3.4 2.6 2.9 3.1 3.4 3.2 3.5 3.8 2728 Life insurance companies (FHLB) 1.6 1.8 2.5 3.2 3.0 2.7 2.7 2.5 1.9 1.9 2.8 28
29 Securitized loans held by ABS issuers 44.0 76.2 103.8 113.0 124.3 125.4 128.3 138.3 138.1 132.3 148.4 2930 Liab.: Households (1) 6.3 14.1 17.9 19.4 22.8 24.5 30.7 29.9 30.5 31.0 31.2 3031 Nonfinancial corporate business 37.7 62.1 85.9 93.6 101.5 100.9 97.6 108.4 107.6 101.3 117.2 31
32 Finance company loans to business 304.7 304.1 340.9 395.1 422.7 441.9 443.0 458.4 459.1 481.9 451.1 3233 Liab.: Nonfinancial corporate business 274.2 273.7 306.8 355.6 380.5 397.7 398.7 412.6 413.2 433.7 406.0 3334 Nonfarm noncorporate business 30.5 30.4 34.1 39.5 42.3 44.2 44.3 45.8 45.9 48.2 45.1 34
(1) Student loans.

Z.1, December 7, 2001 93
L.217 Total MortgagesBillions of dollars; amounts outstanding end of period, not seasonally adjusted
1996 1997 1998 1999 2000 2001 Q1 Q2 Q3 Q4 Q1 Q2 Q3
1 Total mortgages 4864.8 5203.0 5724.2 6360.0 6473.1 6643.5 6796.4 6937.4 7061.7 7277.9 7474.9 1
2 Home 3720.0 3978.3 4368.2 4803.4 4879.4 5005.1 5124.3 5225.9 5319.5 5477.9 5623.1 2 3 Multifamily residential 288.7 301.1 333.1 375.5 383.4 396.3 404.0 414.5 423.8 439.0 452.7 3 4 Commercial 769.2 833.6 926.3 1078.7 1106.0 1135.4 1159.8 1188.1 1208.5 1248.0 1284.5 4 5 Farm 86.9 90.0 96.6 102.3 104.2 106.8 108.3 108.8 109.9 113.1 114.6 5
6 Total liabilities 4864.8 5203.0 5724.2 6360.0 6473.1 6643.5 6796.4 6937.4 7061.7 7277.9 7474.9 6
7 Household sector 3674.3 3913.2 4274.0 4673.9 4741.2 4856.1 4968.2 5059.5 5142.3 5294.3 5434.8 7
8 Nonfinancial business 1158.5 1243.0 1378.6 1609.4 1653.4 1706.4 1745.7 1794.9 1838.3 1898.5 1957.0 8 9 Corporate 228.4 262.1 283.4 378.8 394.7 411.4 421.4 441.1 453.3 477.3 501.0 910 Nonfarm noncorporate 843.2 890.9 998.6 1128.3 1154.5 1188.3 1215.9 1245.0 1275.1 1308.2 1341.4 1011 Farm 86.9 90.0 96.6 102.3 104.2 106.8 108.3 108.8 109.9 113.1 114.6 11
12 Federal government 0.0 0.0 0.0 0.0 0.0 0.0 0.0 0.0 0.0 0.0 0.0 1213 REITs 31.9 46.8 71.6 76.7 78.5 81.0 82.5 82.9 81.1 85.1 83.0 13
14 Total assets 4864.8 5203.0 5724.2 6360.0 6473.1 6643.5 6796.4 6937.4 7061.7 7277.9 7474.9 14
15 Household sector 109.5 109.6 110.5 110.2 111.2 111.5 111.7 111.3 111.4 111.9 112.0 1516 Nonfinancial corporate business 54.4 80.2 67.3 60.3 59.0 57.8 56.5 55.3 54.0 52.8 51.5 1617 Nonfarm noncorporate business 20.4 18.7 30.7 40.7 42.7 46.5 47.0 48.6 50.1 51.5 53.2 17
18 State and local governments 117.6 121.3 125.4 129.8 130.9 132.0 133.1 134.3 135.4 136.6 137.8 1819 Federal government 50.3 45.7 44.9 77.7 76.8 76.8 76.5 76.9 76.3 76.2 75.3 19
20 Commercial banking 1145.4 1245.3 1337.0 1495.2 1546.5 1614.1 1648.1 1659.3 1688.1 1723.3 1736.1 2021 Savings institutions (1) 628.3 631.8 644.0 668.6 682.4 703.5 723.1 723.8 741.4 751.9 758.6 2122 Credit unions 76.0 86.0 96.9 111.0 114.1 119.1 124.0 127.4 126.2 130.9 140.2 2223 Bank personal trusts and estates 3.6 3.0 2.8 2.2 2.2 2.2 2.1 2.1 2.0 2.0 2.0 23
24 Life insurance companies 208.2 206.8 213.6 230.8 229.4 232.6 234.7 235.9 235.1 237.1 237.9 2425 Other insurance companies 2.4 2.2 2.0 1.9 2.5 1.8 1.7 1.6 1.6 1.7 1.7 2526 Private pension funds 9.0 9.7 11.5 13.5 14.0 14.3 14.8 15.1 15.5 15.8 15.9 2627 State and local govt. retirement funds 16.7 17.6 24.1 21.5 21.7 21.0 21.5 21.5 22.1 22.8 23.7 27
28 Government-sponsored enterprises (1) 244.9 240.5 248.7 244.4 246.1 255.7 260.1 267.1 270.0 279.1 285.6 2829 Federally related mortgage pools 1711.3 1825.8 2018.4 2292.2 2322.1 2355.2 2414.3 2491.6 2534.2 2635.8 2759.0 2930 ABS issuers 326.3 407.0 563.5 655.5 669.1 687.7 708.6 740.7 769.5 814.4 844.4 30
31 Finance companies 85.5 96.5 121.2 145.8 149.1 157.7 165.4 172.3 176.1 182.3 187.4 3132 Mortgage companies 41.2 32.1 35.3 35.6 34.1 35.5 35.4 35.9 36.2 36.5 36.9 3233 REITs 13.8 22.9 26.3 23.0 19.2 18.6 17.8 16.8 16.3 15.3 15.6 33
(1) FHLB loans to savings institutions are included in other loans and advances.
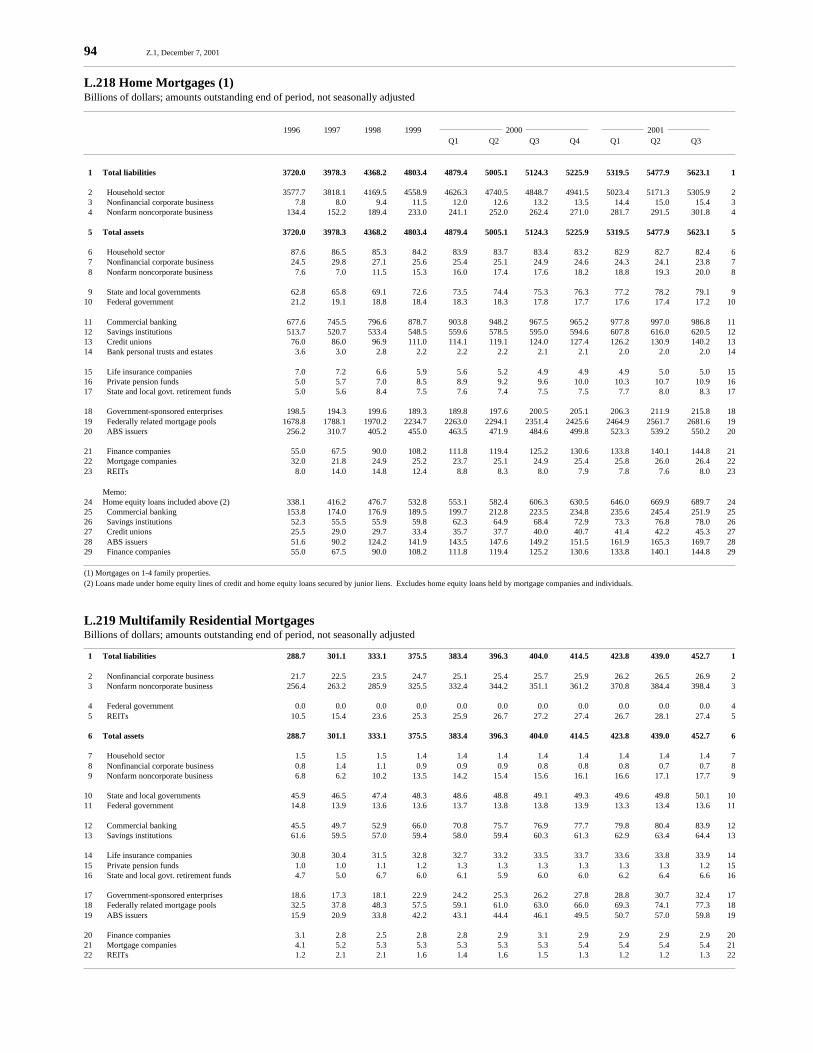
94 Z.1, December 7, 2001
L.218 Home Mortgages (1)Billions of dollars; amounts outstanding end of period, not seasonally adjusted
1996 1997 1998 1999 2000 2001 Q1 Q2 Q3 Q4 Q1 Q2 Q3
1 Total liabilities 3720.0 3978.3 4368.2 4803.4 4879.4 5005.1 5124.3 5225.9 5319.5 5477.9 5623.1 1
2 Household sector 3577.7 3818.1 4169.5 4558.9 4626.3 4740.5 4848.7 4941.5 5023.4 5171.3 5305.9 2 3 Nonfinancial corporate business 7.8 8.0 9.4 11.5 12.0 12.6 13.2 13.5 14.4 15.0 15.4 3 4 Nonfarm noncorporate business 134.4 152.2 189.4 233.0 241.1 252.0 262.4 271.0 281.7 291.5 301.8 4
5 Total assets 3720.0 3978.3 4368.2 4803.4 4879.4 5005.1 5124.3 5225.9 5319.5 5477.9 5623.1 5
6 Household sector 87.6 86.5 85.3 84.2 83.9 83.7 83.4 83.2 82.9 82.7 82.4 6 7 Nonfinancial corporate business 24.5 29.8 27.1 25.6 25.4 25.1 24.9 24.6 24.3 24.1 23.8 7 8 Nonfarm noncorporate business 7.6 7.0 11.5 15.3 16.0 17.4 17.6 18.2 18.8 19.3 20.0 8
9 State and local governments 62.8 65.8 69.1 72.6 73.5 74.4 75.3 76.3 77.2 78.2 79.1 910 Federal government 21.2 19.1 18.8 18.4 18.3 18.3 17.8 17.7 17.6 17.4 17.2 10
11 Commercial banking 677.6 745.5 796.6 878.7 903.8 948.2 967.5 965.2 977.8 997.0 986.8 1112 Savings institutions 513.7 520.7 533.4 548.5 559.6 578.5 595.0 594.6 607.8 616.0 620.5 1213 Credit unions 76.0 86.0 96.9 111.0 114.1 119.1 124.0 127.4 126.2 130.9 140.2 1314 Bank personal trusts and estates 3.6 3.0 2.8 2.2 2.2 2.2 2.1 2.1 2.0 2.0 2.0 14
15 Life insurance companies 7.0 7.2 6.6 5.9 5.6 5.2 4.9 4.9 4.9 5.0 5.0 1516 Private pension funds 5.0 5.7 7.0 8.5 8.9 9.2 9.6 10.0 10.3 10.7 10.9 1617 State and local govt. retirement funds 5.0 5.6 8.4 7.5 7.6 7.4 7.5 7.5 7.7 8.0 8.3 17
18 Government-sponsored enterprises 198.5 194.3 199.6 189.3 189.8 197.6 200.5 205.1 206.3 211.9 215.8 1819 Federally related mortgage pools 1678.8 1788.1 1970.2 2234.7 2263.0 2294.1 2351.4 2425.6 2464.9 2561.7 2681.6 1920 ABS issuers 256.2 310.7 405.2 455.0 463.5 471.9 484.6 499.8 523.3 539.2 550.2 20
21 Finance companies 55.0 67.5 90.0 108.2 111.8 119.4 125.2 130.6 133.8 140.1 144.8 2122 Mortgage companies 32.0 21.8 24.9 25.2 23.7 25.1 24.9 25.4 25.8 26.0 26.4 2223 REITs 8.0 14.0 14.8 12.4 8.8 8.3 8.0 7.9 7.8 7.6 8.0 23
Memo:24 Home equity loans included above (2) 338.1 416.2 476.7 532.8 553.1 582.4 606.3 630.5 646.0 669.9 689.7 2425 Commercial banking 153.8 174.0 176.9 189.5 199.7 212.8 223.5 234.8 235.6 245.4 251.9 2526 Savings institutions 52.3 55.5 55.9 59.8 62.3 64.9 68.4 72.9 73.3 76.8 78.0 2627 Credit unions 25.5 29.0 29.7 33.4 35.7 37.7 40.0 40.7 41.4 42.2 45.3 2728 ABS issuers 51.6 90.2 124.2 141.9 143.5 147.6 149.2 151.5 161.9 165.3 169.7 2829 Finance companies 55.0 67.5 90.0 108.2 111.8 119.4 125.2 130.6 133.8 140.1 144.8 29
(1) Mortgages on 1-4 family properties.(2) Loans made under home equity lines of credit and home equity loans secured by junior liens. Excludes home equity loans held by mortgage companies and individuals.
L.219 Multifamily Residential MortgagesBillions of dollars; amounts outstanding end of period, not seasonally adjusted
1 Total liabilities 288.7 301.1 333.1 375.5 383.4 396.3 404.0 414.5 423.8 439.0 452.7 1
2 Nonfinancial corporate business 21.7 22.5 23.5 24.7 25.1 25.4 25.7 25.9 26.2 26.5 26.9 2 3 Nonfarm noncorporate business 256.4 263.2 285.9 325.5 332.4 344.2 351.1 361.2 370.8 384.4 398.4 3
4 Federal government 0.0 0.0 0.0 0.0 0.0 0.0 0.0 0.0 0.0 0.0 0.0 4 5 REITs 10.5 15.4 23.6 25.3 25.9 26.7 27.2 27.4 26.7 28.1 27.4 5
6 Total assets 288.7 301.1 333.1 375.5 383.4 396.3 404.0 414.5 423.8 439.0 452.7 6
7 Household sector 1.5 1.5 1.5 1.4 1.4 1.4 1.4 1.4 1.4 1.4 1.4 7 8 Nonfinancial corporate business 0.8 1.4 1.1 0.9 0.9 0.9 0.8 0.8 0.8 0.7 0.7 8 9 Nonfarm noncorporate business 6.8 6.2 10.2 13.5 14.2 15.4 15.6 16.1 16.6 17.1 17.7 9
10 State and local governments 45.9 46.5 47.4 48.3 48.6 48.8 49.1 49.3 49.6 49.8 50.1 1011 Federal government 14.8 13.9 13.6 13.6 13.7 13.8 13.8 13.9 13.3 13.4 13.6 11
12 Commercial banking 45.5 49.7 52.9 66.0 70.8 75.7 76.9 77.7 79.8 80.4 83.9 1213 Savings institutions 61.6 59.5 57.0 59.4 58.0 59.4 60.3 61.3 62.9 63.4 64.4 13
14 Life insurance companies 30.8 30.4 31.5 32.8 32.7 33.2 33.5 33.7 33.6 33.8 33.9 1415 Private pension funds 1.0 1.0 1.1 1.2 1.3 1.3 1.3 1.3 1.3 1.3 1.2 1516 State and local govt. retirement funds 4.7 5.0 6.7 6.0 6.1 5.9 6.0 6.0 6.2 6.4 6.6 16
17 Government-sponsored enterprises 18.6 17.3 18.1 22.9 24.2 25.3 26.2 27.8 28.8 30.7 32.4 1718 Federally related mortgage pools 32.5 37.8 48.3 57.5 59.1 61.0 63.0 66.0 69.3 74.1 77.3 1819 ABS issuers 15.9 20.9 33.8 42.2 43.1 44.4 46.1 49.5 50.7 57.0 59.8 19
20 Finance companies 3.1 2.8 2.5 2.8 2.8 2.9 3.1 2.9 2.9 2.9 2.9 2021 Mortgage companies 4.1 5.2 5.3 5.3 5.3 5.3 5.3 5.4 5.4 5.4 5.4 2122 REITs 1.2 2.1 2.1 1.6 1.4 1.6 1.5 1.3 1.2 1.2 1.3 22

Z.1, December 7, 2001 95
L.220 Commercial MortgagesBillions of dollars; amounts outstanding end of period, not seasonally adjusted
1996 1997 1998 1999 2000 2001 Q1 Q2 Q3 Q4 Q1 Q2 Q3
1 Total liabilities 769.2 833.6 926.3 1078.7 1106.0 1135.4 1159.8 1188.1 1208.5 1248.0 1284.5 1
2 Household sector 96.6 95.1 104.5 115.0 114.9 115.6 119.5 118.1 118.9 122.9 128.9 2 3 Nonfinancial corporate business 198.9 231.6 250.5 342.5 357.6 373.4 382.6 401.7 412.7 435.7 458.7 3 4 Nonfarm noncorporate business 452.3 475.5 523.3 569.8 580.9 592.1 602.5 612.8 622.6 632.3 641.2 4 5 REITs 21.4 31.4 48.0 51.4 52.6 54.2 55.3 55.6 54.3 57.0 55.6 5
6 Total assets 769.2 833.6 926.3 1078.7 1106.0 1135.4 1159.8 1188.1 1208.5 1248.0 1284.5 6
7 Household sector 4.4 5.1 6.0 6.7 6.8 7.0 7.1 7.3 7.5 7.6 7.8 7 8 Nonfinancial corporate business 29.1 49.1 39.1 33.7 32.8 31.8 30.8 29.9 28.9 27.9 27.0 8 9 Nonfarm noncorporate business 5.3 4.9 8.0 10.6 11.1 12.1 12.3 12.7 13.1 13.4 13.9 9
10 State and local governments 7.5 7.7 7.6 7.5 7.4 7.4 7.4 7.4 7.3 7.3 7.3 1011 Federal government 8.5 7.8 7.9 41.5 40.6 40.6 40.7 41.1 41.3 41.3 40.5 11
12 Commercial banking 397.5 423.1 458.5 518.6 539.2 556.4 569.8 582.4 596.2 610.7 630.0 1213 Savings institutions 52.7 51.3 53.1 60.3 64.3 65.1 67.3 67.4 70.2 71.9 73.2 13
14 Life insurance companies 160.3 158.8 164.0 179.0 178.2 180.9 182.6 183.8 183.1 184.6 185.2 1415 Other insurance companies 2.4 2.2 2.0 1.9 2.5 1.8 1.7 1.6 1.6 1.7 1.7 1516 Private pension funds 3.0 3.0 3.4 3.7 3.8 3.8 3.9 3.9 3.9 3.8 3.7 1617 State and local govt. retirement funds 7.0 7.0 8.9 8.0 8.0 7.8 7.9 8.0 8.2 8.4 8.8 17
18 Federally related mortgage pools 0.0 0.0 0.0 0.0 0.0 0.0 0.0 0.0 0.0 0.0 0.0 1819 ABS issuers 54.2 75.4 124.6 158.3 162.6 171.4 177.8 191.4 195.5 218.3 234.4 1920 Finance companies 27.5 26.2 28.7 34.8 34.5 35.5 37.1 38.8 39.4 39.3 39.6 2021 Mortgage companies 5.1 5.1 5.1 5.1 5.1 5.1 5.1 5.1 5.1 5.1 5.1 2122 REITs 4.6 6.9 9.4 9.0 9.0 8.7 8.2 7.6 7.4 6.5 6.3 22
L.221 Farm MortgagesBillions of dollars; amounts outstanding end of period, not seasonally adjusted
1 Total liabilities (Farm business) 86.9 90.0 96.6 102.3 104.2 106.8 108.3 108.8 109.9 113.1 114.6 1
2 Total assets 86.9 90.0 96.6 102.3 104.2 106.8 108.3 108.8 109.9 113.1 114.6 2
3 Household sector 15.9 16.5 17.7 17.9 19.0 19.4 19.7 19.4 19.6 20.2 20.4 3 4 Nonfarm noncorporate business 0.7 0.6 1.0 1.3 1.4 1.5 1.5 1.6 1.6 1.6 1.7 4
5 State and local governments 1.4 1.4 1.4 1.4 1.4 1.4 1.4 1.4 1.4 1.4 1.4 5 6 Federal government 5.8 4.9 4.5 4.3 4.2 4.2 4.2 4.1 4.1 4.1 4.0 6
7 Commercial banking 24.9 27.0 29.0 31.8 32.7 33.7 33.9 34.0 34.3 35.2 35.4 7 8 Savings institutions 0.3 0.4 0.4 0.5 0.5 0.5 0.5 0.5 0.6 0.6 0.6 8
9 Life insurance companies 10.1 10.5 11.5 13.0 13.0 13.4 13.7 13.6 13.5 13.7 13.7 910 State and local govt. retirement funds 0.0 0.0 0.0 0.0 0.0 0.0 0.0 0.0 0.0 0.0 0.0 10
11 Government-sponsored enterprises 27.9 28.9 31.0 32.2 32.1 32.8 33.5 34.2 34.9 36.4 37.4 1112 Federally related mortgage pools 0.0 0.0 0.0 0.0 0.0 0.0 0.0 0.0 0.0 0.0 0.0 12

96 Z.1, December 7, 2001
L.222 Consumer CreditBillions of dollars; amounts outstanding end of period, not seasonally adjusted
1996 1997 1998 1999 2000 2001 Q1 Q2 Q3 Q4 Q1 Q2 Q3
1 Total liabilities (Households) 1214.1 1271.6 1346.6 1446.1 1437.0 1476.5 1519.6 1593.1 1585.3 1608.1 1622.8 1
2 Total assets 1214.1 1271.6 1346.6 1446.1 1437.0 1476.5 1519.6 1593.1 1585.3 1608.1 1622.8 2
3 Nonfinancial corporate business 77.7 78.9 74.9 80.3 72.9 73.5 72.1 82.7 71.4 68.0 60.2 3 4 Nonfarm noncorporate business 0.0 0.0 0.0 0.0 0.0 0.0 0.0 0.0 0.0 0.0 0.0 4
5 Commercial banking 526.8 512.6 508.9 499.8 497.1 506.2 521.8 541.5 533.7 540.2 535.3 5 6 Savings institutions 44.7 47.2 51.6 61.5 59.0 61.0 62.5 64.6 65.5 65.3 69.1 6 7 Credit unions 144.1 152.4 155.4 167.9 169.2 176.0 181.3 184.4 182.8 186.4 185.7 7
8 ABS issuers 265.8 313.1 372.4 435.1 434.0 447.0 460.3 500.1 519.2 533.9 551.7 8 9 Finance companies 154.9 167.5 183.3 201.5 204.8 212.7 221.5 219.8 212.8 214.3 220.8 9
L.223 Trade CreditBillions of dollars; amounts outstanding end of period, not seasonally adjusted
1 Total trade payables 1827.6 1967.3 2076.5 2298.8 2321.7 2371.6 2418.2 2464.9 2436.3 2406.9 2412.2 1
2 Household sector 109.1 118.0 126.8 132.7 134.5 136.3 137.7 138.6 140.4 141.5 143.2 2
3 Nonfinancial corporate business 927.0 992.1 1049.7 1194.1 1197.6 1220.3 1261.2 1295.7 1261.0 1221.2 1215.2 3 4 Nonfarm noncorporate business 116.8 147.8 170.9 196.4 202.9 211.2 214.8 218.8 222.0 224.8 227.2 4 5 Farm business 17.4 18.8 19.6 20.0 19.2 20.8 20.9 20.9 20.1 21.3 21.0 5
6 State and local governments 517.6 549.0 579.5 608.6 616.9 623.2 629.6 635.9 642.1 648.4 654.8 6 7 Federal government 81.8 72.9 64.9 65.6 67.0 67.5 68.4 66.9 64.8 62.9 59.7 7
8 Rest of the world 43.6 48.7 46.3 50.6 50.0 53.0 49.8 52.1 50.7 53.6 55.2 8 9 Brokers and dealers 14.3 19.9 18.9 30.9 33.8 39.4 35.9 35.9 35.2 33.3 36.0 9
10 Total trade receivables 1661.9 1840.5 2000.0 2177.9 2271.6 2355.2 2412.2 2373.3 2397.9 2385.1 2376.5 10
11 Nonfinancial corporate business 1273.1 1366.6 1452.9 1566.3 1639.0 1689.9 1728.6 1675.8 1680.3 1653.3 1633.9 1112 Nonfarm noncorporate business 169.8 204.9 245.6 291.4 301.6 321.2 325.5 332.2 337.2 340.7 344.0 12
13 Federal government 24.0 20.8 22.3 22.9 25.4 26.9 27.7 28.1 31.7 33.9 33.4 1314 Rest of the world 57.1 60.3 51.7 46.8 46.4 47.4 49.6 52.5 54.1 53.0 51.2 14
15 Other insurance companies 57.2 59.9 61.5 63.6 66.1 67.2 68.7 64.6 67.6 71.2 73.8 1516 ABS issuers 80.7 128.1 165.9 187.0 193.1 202.7 212.2 220.0 227.0 233.0 240.0 16
17 Discrepancy 165.7 126.8 76.6 120.9 50.2 16.5 6.0 91.6 38.4 21.8 35.7 17
L.224 Security CreditBillions of dollars; amounts outstanding end of period, not seasonally adjusted
1 Total liabilities 358.1 469.1 572.3 676.6 801.1 780.3 805.8 822.7 785.4 781.5 904.6 1
2 Household sector 94.4 131.2 152.8 227.9 286.5 270.2 273.9 235.1 193.5 195.9 253.0 2 3 Rest of the world 0.0 0.0 0.0 0.0 0.0 0.0 0.0 0.0 0.0 0.0 0.0 3
4 Brokers and dealers 263.7 337.9 419.6 448.7 514.6 510.0 531.9 587.6 591.9 585.5 651.7 4 5 Customer credit balances (HH) 162.9 215.5 276.7 323.9 371.2 359.5 372.9 412.4 400.4 412.8 484.2 5 6 From U.S.-chartered commercial banks 60.2 64.4 76.3 67.6 76.5 70.5 67.5 74.7 82.2 83.7 92.6 6 7 From foreign banking offices in U.S. 40.6 58.0 66.6 57.2 66.8 80.1 91.5 100.5 109.4 88.9 74.9 7
8 Total assets 358.1 469.1 572.3 676.6 801.1 780.3 805.8 822.7 785.4 781.5 904.6 8
9 Household sector 162.9 215.5 276.7 323.9 371.2 359.5 372.9 412.4 400.4 412.8 484.2 910 Rest of the world 0.0 0.0 0.0 0.0 0.0 0.0 0.0 0.0 0.0 0.0 0.0 10
11 Commercial banking 100.8 122.5 142.9 124.8 143.4 150.6 159.0 175.2 191.6 172.7 167.4 1112 Brokers and dealers 94.4 131.2 152.8 227.9 286.5 270.2 273.9 235.1 193.5 195.9 253.0 12

Z.1, December 7, 2001 97
L.225 Life Insurance and Pension Fund ReservesBillions of dollars; amounts outstanding end of period, not seasonally adjusted
1996 1997 1998 1999 2000 2001 Q1 Q2 Q3 Q4 Q1 Q2 Q3
Life insurance reserves:
1 Total liabilities 610.6 665.0 718.3 783.9 801.0 806.5 818.7 819.1 823.0 840.3 841.5 1
2 Federal government 30.5 32.3 33.6 35.0 35.2 35.9 36.0 36.4 36.6 37.1 37.2 2 3 Life insurance companies 580.1 632.7 684.7 748.9 765.7 770.6 782.7 782.7 786.5 803.1 804.3 3
4 Total assets (Households) 610.6 665.0 718.3 783.9 801.0 806.5 818.7 819.1 823.0 840.3 841.5 4
Pension fund reserves:
5 Total liabilities 6325.1 7323.4 8193.7 9041.7 9237.9 9166.7 9307.9 9054.8 8588.9 8849.7 8281.0 5
6 Federal government (1) 561.4 601.7 642.9 684.0 673.0 683.3 697.4 704.9 713.3 724.9 738.2 6 7 Life insurance companies 953.9 1086.1 1209.9 1367.3 1414.2 1403.2 1424.9 1373.8 1335.8 1379.8 1319.8 7
8 Private pension funds (2) 3295.2 3793.6 4255.4 4728.0 4877.9 4799.4 4853.3 4644.6 4327.0 4471.8 4099.2 8 9 State and local govt. retirement funds 1514.6 1842.0 2085.4 2262.3 2272.8 2280.8 2332.4 2331.5 2212.8 2273.2 2123.8 9
10 Total assets (Households) (3) 6325.1 7323.4 8193.7 9041.7 9237.9 9166.7 9307.9 9054.8 8588.9 8849.7 8281.0 10
(1) Includes civil service retirement and disability fund, Railroad Retirement Board, military retirement fund, judicial retirement funds, and foreign service retirement and disability fund.(2) Includes unallocated insurance company contracts beginning 1985:Q4.(3) Excludes all individual retirement accounts (IRAs) (table L.225.i), except those at life insurance companies.
L.226 Taxes Payable by BusinessesBillions of dollars; amounts outstanding end of period, not seasonally adjusted
1 Total taxes payable by all businesses 128.8 151.1 172.4 194.7 210.1 211.4 214.7 216.4 224.8 224.0 254.9 1
2 Nonfinancial corporate business 49.9 59.2 64.1 71.0 82.8 80.2 80.1 77.9 84.5 81.0 109.0 2 3 Nonfarm noncorporate business 42.5 49.8 60.5 68.8 71.0 73.7 74.9 76.3 77.3 78.1 78.7 3
4 U.S.-chartered commercial banks 4.0 5.4 7.1 9.0 9.5 10.0 10.6 11.1 11.7 12.3 12.9 4 5 Savings institutions 1.4 1.8 2.0 2.0 1.7 1.8 2.1 2.4 2.3 2.0 2.0 5
6 Life insurance companies 12.5 13.7 14.9 16.2 16.5 16.9 17.3 17.8 18.2 18.7 19.2 6 7 Other insurance companies 11.6 13.4 15.4 17.4 17.9 18.5 19.0 19.7 20.3 21.0 21.7 7
8 Finance companies 5.7 6.5 7.3 8.1 8.3 8.6 8.8 9.1 9.3 9.6 9.9 8 9 Brokers and dealers 1.3 1.3 1.3 2.2 2.4 1.7 1.8 2.1 1.2 1.3 1.4 9
10 Total business taxes receivable 46.8 46.9 49.5 72.0 91.4 77.0 90.4 87.9 111.5 90.7 102.8 10
11 State and local governments 26.1 26.9 28.1 33.5 35.5 39.0 42.9 45.6 49.1 50.8 51.4 1112 Federal government 20.7 20.0 21.4 38.5 55.9 37.9 47.4 42.4 62.3 39.9 51.4 12
13 Discrepancy 81.9 104.2 122.9 122.7 118.7 134.5 124.4 128.4 113.3 133.2 152.1 13
L.227 Investment in Bank Personal Trusts and EstatesBillions of dollars; amounts outstanding end of period, not seasonally adjusted
1 Liab.: Bank personal trusts and estates 871.3 942.5 1001.0 1130.4 1158.0 1114.4 1106.7 1019.4 929.1 964.4 859.6 1
2 Asset: Household sector 871.3 942.5 1001.0 1130.4 1158.0 1114.4 1106.7 1019.4 929.1 964.4 859.6 2

98 Z.1, December 7, 2001
L.229 Total Miscellaneous Financial ClaimsBillions of dollars; amounts outstanding end of period, not seasonally adjusted
1996 1997 1998 1999 2000 2001 Q1 Q2 Q3 Q4 Q1 Q2 Q3
1 Total liabilities 6387.1 6730.7 7692.9 8269.8 8464.3 8731.9 9221.0 9104.9 9536.4 9763.7 10222.5 1
2 Household sector 18.3 18.6 17.2 19.4 18.7 18.9 18.8 19.6 18.7 18.5 19.0 2 3 Nonfinancial corporate business 2308.7 2193.6 2553.7 2622.9 2652.5 2645.1 2739.5 2751.0 2805.3 2793.3 2764.2 3 4 Nonfarm noncorporate business 245.5 301.3 415.1 471.0 482.5 494.1 504.3 517.2 525.9 534.8 541.5 4
5 Federal government 7.3 6.6 6.7 6.6 6.6 6.5 6.6 6.4 6.5 6.4 6.4 5 6 Rest of the world 1155.6 1237.4 1388.8 1589.9 1635.3 1783.9 2023.9 1829.9 2194.7 2258.4 2666.2 6
7 Monetary authority 7.4 9.5 10.7 9.4 10.0 9.6 9.6 10.6 8.8 8.2 8.2 7 8 Commercial banking 863.0 1023.7 1128.7 1079.9 1096.8 1143.2 1234.1 1248.4 1219.7 1249.4 1352.7 8 9 Savings institutions 103.5 101.4 99.8 85.4 82.0 86.1 92.7 102.5 108.4 119.8 123.7 910 Credit unions 4.6 4.6 5.2 6.0 5.4 6.1 7.5 5.6 3.5 6.0 5.5 10
11 Life insurance companies 567.5 625.4 687.7 747.2 764.1 765.3 775.4 766.1 759.8 791.0 793.5 1112 Other insurance companies 509.9 522.3 527.9 540.3 542.2 547.2 551.7 546.3 549.8 555.6 572.4 12
13 Government-sponsored enterprises 67.2 75.1 95.3 89.3 93.8 89.8 87.9 96.7 119.7 118.5 132.6 1314 Finance companies 202.0 206.0 223.8 290.7 334.2 336.7 353.2 373.5 393.7 388.8 379.1 1415 Mortgage companies 20.6 16.0 17.7 17.8 17.1 17.8 17.7 17.9 18.1 18.3 18.5 15
16 REITs 9.2 18.0 31.6 36.0 35.9 37.4 38.5 37.8 42.6 37.8 37.5 1617 Brokers and dealers 110.1 131.1 175.8 185.5 190.1 202.9 206.5 179.3 173.5 260.7 237.7 1718 Funding corporations 186.9 240.1 307.2 472.5 497.2 541.3 553.2 596.3 587.7 598.4 563.9 18
19 Total assets 7613.6 8279.6 10016.0 11010.3 11372.7 11671.3 11948.9 12329.4 12602.5 12804.6 12983.2 19
20 Household sector 301.4 311.7 321.4 334.2 335.6 339.6 341.7 338.9 339.6 346.1 355.2 2021 Nonfinancial corporate business 3410.8 3628.7 4482.0 5023.6 5164.3 5231.1 5301.9 5421.8 5447.6 5493.0 5440.4 2122 Nonfarm noncorporate business 203.5 259.9 481.4 544.1 557.7 571.2 585.3 595.7 607.5 619.5 630.7 2223 Farm business 44.4 44.8 45.4 45.6 45.6 46.0 46.2 45.5 45.6 46.3 47.0 23
24 State and local governments 41.0 27.0 11.5 13.1 21.5 21.9 25.0 24.1 40.5 48.6 63.8 2425 Federal government 110.2 104.8 101.2 100.3 98.7 98.7 98.8 98.9 98.8 100.4 102.1 2526 Rest of the world 1039.9 1107.7 1342.6 1513.9 1646.0 1755.9 1821.4 1946.4 2215.6 2169.8 2323.1 26
27 Monetary authority 11.2 13.2 16.1 16.8 16.5 16.6 18.3 19.3 19.3 20.2 20.5 2728 Commercial banking 823.7 934.0 1079.1 1108.3 1120.8 1151.7 1201.4 1221.5 1220.2 1275.5 1340.4 2829 Savings institutions 52.9 49.7 62.8 60.3 59.5 63.4 61.9 67.7 84.6 84.8 90.4 2930 Credit unions 13.7 17.6 24.3 8.0 11.3 13.9 16.7 23.4 31.2 39.9 33.8 3031 Bank personal trusts and estates 16.0 14.6 23.0 20.5 20.0 19.3 19.3 19.0 18.7 18.6 18.3 31
32 Life insurance companies 73.7 65.7 69.2 34.9 38.7 43.1 54.0 55.6 37.5 18.9 22.5 3233 Other insurance companies 33.6 42.8 49.7 53.8 55.1 57.7 60.0 61.4 63.3 63.7 63.8 3334 Private pension funds 555.5 590.9 642.3 682.1 693.7 694.1 702.5 692.9 675.5 690.2 675.8 3435 State and local govt. retirement funds 62.8 63.5 66.1 81.0 79.4 82.3 85.0 93.5 106.4 106.9 109.3 35
36 Money market mutual funds 43.8 58.1 67.7 90.4 79.6 103.4 108.5 102.5 102.6 112.8 113.0 3637 Mutual funds 4.7 11.8 7.9 3.6 1.9 1.9 2.6 3.1 1.7 0.7 0.9 3738 Government-sponsored enterprises 60.6 67.8 68.5 73.5 77.0 80.8 82.8 85.5 85.4 85.2 99.8 38
39 Finance companies 153.1 175.1 184.4 235.3 235.8 234.1 249.0 259.6 263.5 237.7 246.2 3940 REITs 5.6 10.5 21.2 21.1 21.5 20.8 22.0 21.1 21.8 23.0 22.7 4041 Brokers and dealers 320.7 391.8 499.3 522.8 549.7 573.0 589.1 655.1 580.8 722.1 711.9 4142 Funding corporations 230.7 288.0 348.7 423.1 442.7 450.7 455.1 477.1 494.6 480.7 451.8 42
43 Discrepancy -1226.5 -1548.9 -2323.1 -2740.5 -2908.3 -2939.4 -2727.8 -3224.6 -3066.2 -3040.8 -2760.7 43

Z.1, December 7, 2001 99
L.230 Identified Miscellaneous Financial Claims - Part IBillions of dollars; amounts outstanding end of period, not seasonally adjusted
1996 1997 1998 1999 2000 2001 Q1 Q2 Q3 Q4 Q1 Q2 Q3
U.S. direct investment abroad:
1 Liab.: Rest of the world 986.5 1067.4 1196.8 1328.0 1368.9 1404.5 1448.1 1445.2 1489.2 1526.9 1552.5 1 2 Asset: Nonfinancial corporate business 863.2 932.5 1048.4 1160.4 1194.5 1220.3 1252.3 1247.2 1284.2 1316.5 1339.5 2 3 Commercial banking 42.8 44.2 46.2 49.5 51.4 52.4 56.2 56.8 58.0 59.7 61.2 3 4 Life insurance companies 6.6 8.6 9.4 11.9 12.9 13.3 14.2 13.8 14.7 15.3 15.8 4 5 Other insurance companies 33.6 42.8 49.7 53.8 55.1 57.7 60.0 61.4 63.3 63.7 63.8 5 6 Finance companies 27.9 35.1 35.6 41.1 43.3 48.2 52.1 51.9 53.9 56.0 56.4 6 7 Brokers and dealers 12.4 4.2 7.5 11.2 11.7 12.6 13.3 14.2 15.1 15.8 15.9 7
Foreign direct investment in U.S.:
8 Liab.: Nonfinancial corporate business 698.4 749.6 804.6 945.5 960.8 1045.5 1101.3 1112.3 1156.1 1180.2 1184.6 8 9 Nonfarm noncorporate business 4.0 3.9 3.5 3.4 3.4 3.4 3.4 3.5 3.5 3.5 3.5 910 Commercial banking 30.3 38.8 44.2 63.3 68.4 68.9 69.7 72.9 73.2 77.1 79.2 1011 Life insurance companies 17.6 25.2 27.9 40.2 40.8 43.2 48.7 59.2 63.0 66.2 66.3 1112 Other insurance companies 38.5 46.2 47.5 57.4 58.3 59.8 62.4 64.1 65.6 64.7 63.6 1213 Finance companies 29.7 35.7 38.3 49.7 47.8 48.6 49.9 67.3 73.2 77.9 80.1 1314 Brokers and dealers 8.8 8.5 10.1 15.8 16.4 16.8 17.4 16.7 17.8 18.3 19.5 1415 Funding corporations -81.6 -84.6 -63.9 -80.9 -64.7 -64.3 -53.6 -26.6 -30.0 2.1 18.2 15
16 Asset: Rest of the world 745.6 823.1 912.2 1094.4 1131.4 1221.9 1299.2 1369.5 1422.4 1490.0 1514.9 16
Federal government equity in IBRD, etc.:
17 Liab.: Rest of the world 29.2 30.8 32.4 33.9 34.2 34.6 34.9 35.4 35.9 37.7 39.5 1718 Asset: Federal government 29.2 30.8 32.4 33.9 34.2 34.6 34.9 35.4 35.9 37.7 39.5 18
Federal Reserve Bank stock:
19 Liab.: Monetary authority 4.6 5.4 6.0 6.4 6.7 6.9 6.9 7.0 7.0 7.1 7.3 1920 Asset: Commercial banking 4.6 5.4 6.0 6.4 6.7 6.9 6.9 7.0 7.0 7.1 7.3 20
Equity in government-sponsored enterprises:
21 Liab.: Government-sponsored enterprises 21.3 21.9 25.3 30.8 31.8 31.6 32.0 33.0 28.0 30.7 24.9 21
22 Asset: Nonfin. corporate business (FNMA) 1.6 0.5 -0.2 -0.8 -0.8 -1.2 -1.1 -0.8 -6.5 -4.2 -10.8 2223 Nonfarm noncorporate (BC) 1.7 1.7 1.6 1.6 1.7 1.6 1.6 1.6 1.6 1.5 1.5 2324 Farm business (FICB and FLB) 1.5 1.5 1.7 1.6 1.5 1.6 1.6 1.6 1.6 1.7 1.7 2425 Federal government 0.0 0.0 0.0 0.0 0.0 0.0 0.0 0.0 0.0 0.0 0.0 2526 Commercial banks (FHLB) 6.7 8.0 10.0 13.0 13.4 13.4 13.4 13.8 14.1 14.2 14.4 2627 Savings institutions (FHLB) 9.5 9.9 11.8 14.5 15.1 15.3 15.5 15.7 16.2 16.5 16.9 2728 Credit unions (FHLB) 0.2 0.2 0.3 0.5 0.6 0.6 0.6 0.6 0.7 0.7 0.8 2829 Life insurance companies (FHLB) 0.2 0.2 0.2 0.3 0.3 0.3 0.4 0.4 0.3 0.2 0.3 29
BHC investment in subsidiaries:
30 Liab.: Commercial banking 372.9 413.6 469.0 471.9 492.1 501.0 514.8 525.4 541.8 552.2 577.8 3031 Savings institutions 4.7 5.0 5.4 6.0 6.1 6.3 6.4 6.6 6.8 7.0 7.2 3132 Finance companies 27.3 23.5 17.1 43.9 53.6 47.5 50.0 51.3 48.6 46.7 45.4 3233 Mortgage companies 20.6 16.0 17.7 17.8 17.1 17.8 17.7 17.9 18.1 18.3 18.5 3334 Brokers and dealers 12.3 45.3 93.8 83.5 107.6 113.4 124.8 137.7 153.8 165.0 169.6 34
35 Asset: Bank holding companies 437.8 503.5 603.0 623.0 676.4 686.0 713.7 738.9 769.2 789.2 818.5 35
NFC inv. in finance company subs.:
36 Liab.: Finance companies 27.3 23.5 17.1 43.9 53.6 47.5 50.0 51.3 48.6 46.7 45.4 3637 Asset: Nonfinancial corporate business 27.3 23.5 17.1 43.9 53.6 47.5 50.0 51.3 48.6 46.7 45.4 37
Funding corp. investment in subs.:
38 Liab.: Foreign banking offices in U.S. 64.5 78.8 90.6 93.0 114.6 114.5 119.9 138.7 142.3 137.3 113.5 3839 Brokers and dealers 166.3 209.2 258.2 330.1 328.1 336.2 335.2 338.4 352.3 343.5 338.3 39
40 Asset: Funding corporations 230.7 288.0 348.7 423.1 442.7 450.7 455.1 477.1 494.6 480.7 451.8 40

100 Z.1, December 7, 2001
L.231 Identified Miscellaneous Financial Claims - Part IIBillions of dollars; amounts outstanding end of period, not seasonally adjusted
1996 1997 1998 1999 2000 2001 Q1 Q2 Q3 Q4 Q1 Q2 Q3
Nonofficial foreign currencies:
1 Liab.: Rest of the world 2.1 2.1 1.9 2.6 2.3 2.3 2.4 2.6 2.5 2.5 2.3 1 2 Asset: Federal government 2.1 2.1 1.9 2.6 2.3 2.3 2.4 2.6 2.5 2.5 2.3 2
Postal Savings System deposits:
3 Liab.: Federal government 0.0 0.0 0.0 0.0 0.0 0.0 0.0 0.0 0.0 0.0 0.0 3 4 Asset: Household sector 0.0 0.0 0.0 0.0 0.0 0.0 0.0 0.0 0.0 0.0 0.0 4
Deposits at Federal Home Loan Banks:
5 Liab.: Government-sponsored enterprises 18.0 18.0 24.9 17.1 15.1 12.9 13.6 17.0 29.9 26.1 29.3 5 6 Asset: Savings institutions 18.0 18.0 24.9 17.1 15.1 12.9 13.6 17.0 29.9 26.1 29.3 6
Deferred and unpaid life insurance premiums:
7 Liab.: Household sector 18.3 18.6 17.2 19.4 18.7 18.9 18.8 19.6 18.7 18.5 19.0 7 8 Asset: Life insurance companies 18.3 18.6 17.2 19.4 18.7 18.9 18.8 19.6 18.7 18.5 19.0 8
Life insurance company reserves:
9 Liab.: Life insurance companies 103.9 112.2 120.1 131.9 132.8 135.4 136.7 136.8 136.8 140.4 142.9 910 Health 69.4 75.7 83.0 93.5 94.4 96.5 97.1 97.4 96.8 99.5 101.7 1011 Policy dividend accumulation 34.5 36.4 37.1 38.4 38.4 38.8 39.6 39.5 40.0 40.9 41.3 11
12 Asset: Household sector 103.9 112.2 120.1 131.9 132.8 135.4 136.7 136.8 136.8 140.4 142.9 12
Policy payables:
13 Liab.: Other insurance companies 471.4 476.2 480.4 482.9 483.9 487.5 489.3 482.1 484.2 490.9 508.9 13
14 Asset: Household sector 197.5 199.5 201.3 202.3 202.7 204.2 205.0 202.0 202.9 205.7 212.2 1415 Nonfinancial corporate business 186.2 188.1 189.8 190.8 191.1 192.5 193.3 190.4 191.3 193.9 203.0 1516 Nonfarm noncorporate business 44.8 45.2 45.6 45.9 46.0 46.3 46.5 45.8 46.0 46.6 48.3 1617 Farm business 42.9 43.3 43.7 43.9 44.0 44.4 44.5 43.9 44.1 44.7 45.3 17
Unallocated insurance company contracts:
18 Liab.: Life insurance companies 361.1 381.9 422.8 457.1 467.2 465.0 471.5 460.7 442.5 455.0 440.4 1819 Asset: Private pension funds 361.1 381.9 422.8 457.1 467.2 465.0 471.5 460.7 442.5 455.0 440.4 19
Pension fund contributions payable:
20 Liab.: Nonfinancial corporate business 86.4 93.5 95.4 96.4 96.7 96.9 97.2 97.4 97.7 97.9 98.2 2021 Asset: Private pension funds 86.4 93.5 95.4 96.4 96.7 96.9 97.2 97.4 97.7 97.9 98.2 21
Securities borrowed (net):
22 Liab.: Funding corporations 276.1 333.3 403.3 419.5 443.9 467.5 470.6 508.2 482.6 541.0 558.2 2223 Asset: Brokers and dealers 276.1 333.3 403.3 419.5 443.9 467.5 470.6 508.2 482.6 541.0 558.2 23

Z.1, December 7, 2001 101
L.232 Unidentified Miscellaneous Financial ClaimsBillions of dollars; amounts outstanding end of period, not seasonally adjusted
1996 1997 1998 1999 2000 2001 Q1 Q2 Q3 Q4 Q1 Q2 Q3
1 Total liabilities 2566.8 2531.1 2985.5 3059.3 3058.1 3161.9 3481.1 3223.2 3546.6 3582.4 3968.6 1
2 Nonfinancial corporate business 1523.9 1350.5 1653.6 1581.0 1595.0 1502.7 1541.1 1541.2 1551.5 1515.1 1481.4 2 3 Nonfarm noncorporate business 241.5 297.5 411.7 467.7 479.2 490.7 500.9 513.7 522.4 531.3 538.1 3
4 Federal government 7.3 6.6 6.7 6.6 6.6 6.5 6.6 6.4 6.5 6.4 6.4 4 5 Rest of the world 137.7 137.0 157.7 225.5 230.0 342.5 538.4 346.8 667.1 691.3 1071.9 5 6 Monetary authority 2.8 4.0 4.8 3.0 3.3 2.8 2.7 3.6 1.8 1.0 0.9 6
7 Commercial banking 395.4 492.5 525.0 451.7 421.8 458.7 529.7 511.4 462.4 482.8 582.1 7 8 U.S.-chartered commercial banks 147.7 185.1 206.6 181.2 200.4 212.6 253.9 263.3 225.8 206.4 278.2 8 9 Foreign banking offices in U.S. 200.5 233.9 222.4 158.4 117.7 138.8 147.4 119.0 97.1 115.4 139.3 910 Bank holding companies 36.3 57.9 74.1 88.1 78.9 82.1 101.4 104.4 115.0 134.6 140.2 1011 Banks in U.S.-affiliated areas 10.9 15.6 21.9 24.1 24.7 25.3 26.9 24.8 24.5 26.4 24.5 11
12 Savings institutions 98.8 96.4 94.4 79.4 75.9 79.8 86.2 95.9 101.6 112.8 116.6 1213 Credit unions 4.6 4.6 5.2 6.0 5.4 6.1 7.5 5.6 3.5 6.0 5.5 1314 Life insurance companies 84.9 106.2 116.9 118.0 123.2 121.6 118.5 109.3 117.6 129.4 143.9 1415 Government-sponsored enterprises 28.0 35.1 45.2 41.4 47.0 45.4 42.3 46.7 61.7 61.7 78.4 15
16 Finance companies 117.8 123.2 151.2 153.1 179.2 193.0 203.3 203.6 223.3 217.5 208.2 1617 REITs 9.2 18.0 31.6 36.0 35.9 37.4 38.5 37.8 42.6 37.8 37.5 1718 Brokers and dealers -77.3 -131.9 -186.2 -243.9 -262.0 -263.5 -270.8 -313.5 -350.4 -266.1 -289.6 1819 Funding corporations -7.6 -8.6 -32.2 133.9 117.9 138.1 136.2 114.7 135.1 55.2 -12.5 19
20 Total assets 3793.3 4080.0 5308.6 5799.9 5966.5 6101.2 6208.9 6447.7 6612.7 6623.2 6729.3 20
21 Nonfinancial corporate business 2332.6 2484.1 3226.9 3629.3 3725.8 3771.9 3807.5 3933.7 3930.0 3940.1 3863.3 2122 Nonfarm noncorporate business 157.1 213.0 434.2 496.6 510.0 523.3 537.2 548.3 559.9 571.3 580.8 2223 State and local governments 41.0 27.0 11.5 13.1 21.5 21.9 25.0 24.1 40.5 48.6 63.8 23
24 Federal government 78.8 71.9 66.9 63.9 62.2 61.8 61.5 61.0 60.4 60.2 60.3 2425 Rest of the world 294.3 284.5 430.5 419.5 514.7 534.0 522.2 576.9 793.3 679.8 808.2 2526 Monetary authority 11.2 13.2 16.1 16.8 16.5 16.6 18.3 19.3 19.3 20.2 20.5 26
27 Commercial banking 331.8 372.9 414.0 416.4 372.8 393.2 411.2 404.9 372.0 405.3 439.1 2728 U.S.-chartered commercial banks 78.7 87.6 113.1 109.0 114.2 113.2 113.1 115.2 126.9 123.1 150.5 2829 Foreign banking offices in U.S. 197.2 234.3 234.6 213.3 170.7 184.4 190.5 176.8 133.0 165.6 169.4 2930 Bank holding companies 51.1 44.4 56.5 85.4 79.6 86.8 98.4 106.3 105.0 105.5 111.1 3031 Banks in U.S.-affiliated areas 4.8 6.6 9.7 8.7 8.4 8.8 9.2 6.6 7.1 11.1 8.2 31
32 Savings institutions 25.3 21.7 26.2 28.7 29.4 35.2 32.8 34.9 38.5 42.3 44.1 3233 Credit unions 13.6 17.3 24.0 7.5 10.7 13.3 16.1 22.8 30.5 39.2 33.0 3334 Bank personal trusts and estates 16.0 14.6 23.0 20.5 20.0 19.3 19.3 19.0 18.7 18.6 18.3 34
35 Life insurance companies 48.7 38.3 42.4 3.2 6.9 10.6 20.8 21.9 3.7 -15.1 -12.6 3536 Private pension funds 108.0 115.4 124.1 128.6 129.8 132.1 133.8 134.8 135.3 137.3 137.2 3637 State and local govt. retirement funds 62.8 63.5 66.1 81.0 79.4 82.3 85.0 93.5 106.4 106.9 109.3 37
38 Mutual funds 4.7 11.8 7.9 3.6 1.9 1.9 2.6 3.1 1.7 0.7 0.9 3839 Money market mutual funds 43.8 58.1 67.7 90.4 79.6 103.4 108.5 102.5 102.6 112.8 113.0 3940 Government-sponsored enterprises 60.6 67.8 68.5 73.5 77.0 80.8 82.8 85.5 85.4 85.2 99.8 40
41 Finance companies 125.3 140.0 148.8 194.2 192.5 185.9 196.9 207.7 209.6 181.7 189.8 4142 REITs 5.6 10.5 21.2 21.1 21.5 20.8 22.0 21.1 21.8 23.0 22.7 4243 Brokers and dealers 32.2 54.4 88.6 92.1 94.2 93.0 105.3 132.7 83.0 165.3 137.8 43
44 Discrepancy -1226.5 -1548.9 -2323.1 -2740.5 -2908.3 -2939.4 -2727.8 -3224.6 -3066.2 -3040.8 -2760.7 44
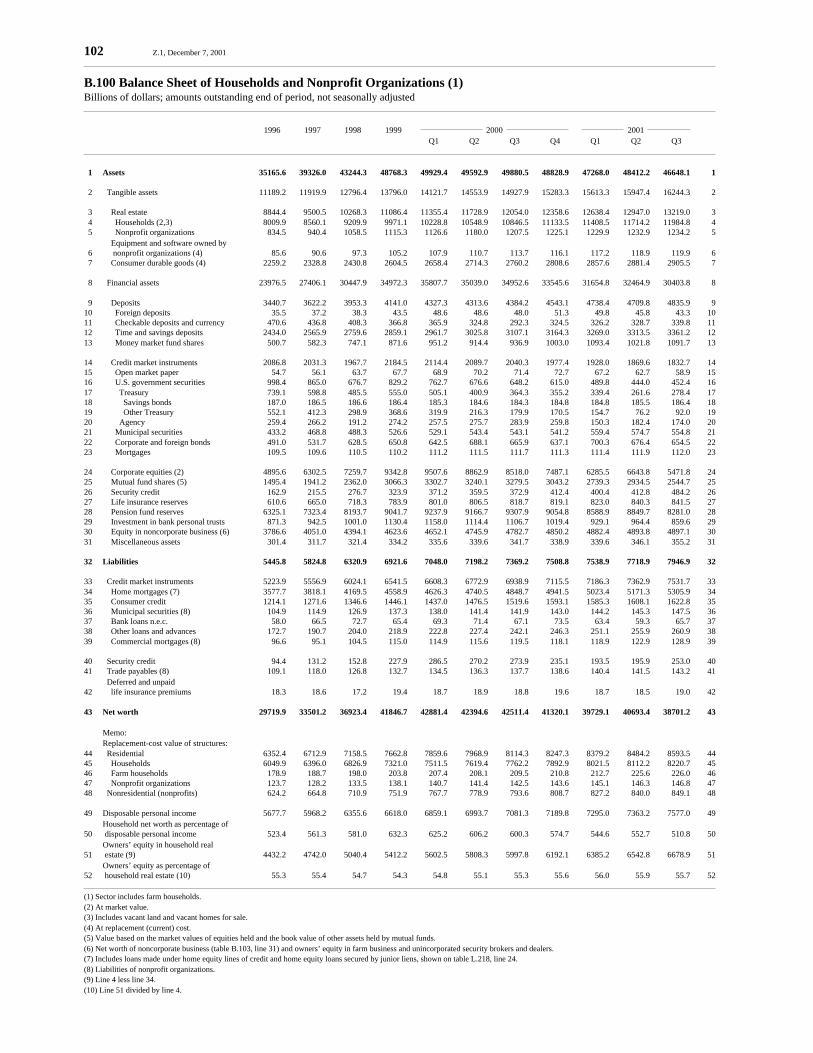
102 Z.1, December 7, 2001
B.100 Balance Sheet of Households and Nonprofit Organizations (1)Billions of dollars; amounts outstanding end of period, not seasonally adjusted
1996 1997 1998 1999 2000 2001 Q1 Q2 Q3 Q4 Q1 Q2 Q3
1 Assets 35165.6 39326.0 43244.3 48768.3 49929.4 49592.9 49880.5 48828.9 47268.0 48412.2 46648.1 1
2 Tangible assets 11189.2 11919.9 12796.4 13796.0 14121.7 14553.9 14927.9 15283.3 15613.3 15947.4 16244.3 2
3 Real estate 8844.4 9500.5 10268.3 11086.4 11355.4 11728.9 12054.0 12358.6 12638.4 12947.0 13219.0 3 4 Households (2,3) 8009.9 8560.1 9209.9 9971.1 10228.8 10548.9 10846.5 11133.5 11408.5 11714.2 11984.8 4 5 Nonprofit organizations 834.5 940.4 1058.5 1115.3 1126.6 1180.0 1207.5 1225.1 1229.9 1232.9 1234.2 5 Equipment and software owned by 6 nonprofit organizations (4) 85.6 90.6 97.3 105.2 107.9 110.7 113.7 116.1 117.2 118.9 119.9 6 7 Consumer durable goods (4) 2259.2 2328.8 2430.8 2604.5 2658.4 2714.3 2760.2 2808.6 2857.6 2881.4 2905.5 7
8 Financial assets 23976.5 27406.1 30447.9 34972.3 35807.7 35039.0 34952.6 33545.6 31654.8 32464.9 30403.8 8
9 Deposits 3440.7 3622.2 3953.3 4141.0 4327.3 4313.6 4384.2 4543.1 4738.4 4709.8 4835.9 910 Foreign deposits 35.5 37.2 38.3 43.5 48.6 48.6 48.0 51.3 49.8 45.8 43.3 1011 Checkable deposits and currency 470.6 436.8 408.3 366.8 365.9 324.8 292.3 324.5 326.2 328.7 339.8 1112 Time and savings deposits 2434.0 2565.9 2759.6 2859.1 2961.7 3025.8 3107.1 3164.3 3269.0 3313.5 3361.2 1213 Money market fund shares 500.7 582.3 747.1 871.6 951.2 914.4 936.9 1003.0 1093.4 1021.8 1091.7 13
14 Credit market instruments 2086.8 2031.3 1967.7 2184.5 2114.4 2089.7 2040.3 1977.4 1928.0 1869.6 1832.7 1415 Open market paper 54.7 56.1 63.7 67.7 68.9 70.2 71.4 72.7 67.2 62.7 58.9 1516 U.S. government securities 998.4 865.0 676.7 829.2 762.7 676.6 648.2 615.0 489.8 444.0 452.4 1617 Treasury 739.1 598.8 485.5 555.0 505.1 400.9 364.3 355.2 339.4 261.6 278.4 1718 Savings bonds 187.0 186.5 186.6 186.4 185.3 184.6 184.3 184.8 184.8 185.5 186.4 1819 Other Treasury 552.1 412.3 298.9 368.6 319.9 216.3 179.9 170.5 154.7 76.2 92.0 1920 Agency 259.4 266.2 191.2 274.2 257.5 275.7 283.9 259.8 150.3 182.4 174.0 2021 Municipal securities 433.2 468.8 488.3 526.6 529.1 543.4 543.1 541.2 559.4 574.7 554.8 2122 Corporate and foreign bonds 491.0 531.7 628.5 650.8 642.5 688.1 665.9 637.1 700.3 676.4 654.5 2223 Mortgages 109.5 109.6 110.5 110.2 111.2 111.5 111.7 111.3 111.4 111.9 112.0 23
24 Corporate equities (2) 4895.6 6302.5 7259.7 9342.8 9507.6 8862.9 8518.0 7487.1 6285.5 6643.8 5471.8 2425 Mutual fund shares (5) 1495.4 1941.2 2362.0 3066.3 3302.7 3240.1 3279.5 3043.2 2739.3 2934.5 2544.7 2526 Security credit 162.9 215.5 276.7 323.9 371.2 359.5 372.9 412.4 400.4 412.8 484.2 2627 Life insurance reserves 610.6 665.0 718.3 783.9 801.0 806.5 818.7 819.1 823.0 840.3 841.5 2728 Pension fund reserves 6325.1 7323.4 8193.7 9041.7 9237.9 9166.7 9307.9 9054.8 8588.9 8849.7 8281.0 2829 Investment in bank personal trusts 871.3 942.5 1001.0 1130.4 1158.0 1114.4 1106.7 1019.4 929.1 964.4 859.6 2930 Equity in noncorporate business (6) 3786.6 4051.0 4394.1 4623.6 4652.1 4745.9 4782.7 4850.2 4882.4 4893.8 4897.1 3031 Miscellaneous assets 301.4 311.7 321.4 334.2 335.6 339.6 341.7 338.9 339.6 346.1 355.2 31
32 Liabilities 5445.8 5824.8 6320.9 6921.6 7048.0 7198.2 7369.2 7508.8 7538.9 7718.9 7946.9 32
33 Credit market instruments 5223.9 5556.9 6024.1 6541.5 6608.3 6772.9 6938.9 7115.5 7186.3 7362.9 7531.7 3334 Home mortgages (7) 3577.7 3818.1 4169.5 4558.9 4626.3 4740.5 4848.7 4941.5 5023.4 5171.3 5305.9 3435 Consumer credit 1214.1 1271.6 1346.6 1446.1 1437.0 1476.5 1519.6 1593.1 1585.3 1608.1 1622.8 3536 Municipal securities (8) 104.9 114.9 126.9 137.3 138.0 141.4 141.9 143.0 144.2 145.3 147.5 3637 Bank loans n.e.c. 58.0 66.5 72.7 65.4 69.3 71.4 67.1 73.5 63.4 59.3 65.7 3738 Other loans and advances 172.7 190.7 204.0 218.9 222.8 227.4 242.1 246.3 251.1 255.9 260.9 3839 Commercial mortgages (8) 96.6 95.1 104.5 115.0 114.9 115.6 119.5 118.1 118.9 122.9 128.9 39
40 Security credit 94.4 131.2 152.8 227.9 286.5 270.2 273.9 235.1 193.5 195.9 253.0 4041 Trade payables (8) 109.1 118.0 126.8 132.7 134.5 136.3 137.7 138.6 140.4 141.5 143.2 41 Deferred and unpaid42 life insurance premiums 18.3 18.6 17.2 19.4 18.7 18.9 18.8 19.6 18.7 18.5 19.0 42
43 Net worth 29719.9 33501.2 36923.4 41846.7 42881.4 42394.6 42511.4 41320.1 39729.1 40693.4 38701.2 43
Memo: Replacement-cost value of structures:44 Residential 6352.4 6712.9 7158.5 7662.8 7859.6 7968.9 8114.3 8247.3 8379.2 8484.2 8593.5 4445 Households 6049.9 6396.0 6826.9 7321.0 7511.5 7619.4 7762.2 7892.9 8021.5 8112.2 8220.7 4546 Farm households 178.9 188.7 198.0 203.8 207.4 208.1 209.5 210.8 212.7 225.6 226.0 4647 Nonprofit organizations 123.7 128.2 133.5 138.1 140.7 141.4 142.5 143.6 145.1 146.3 146.8 4748 Nonresidential (nonprofits) 624.2 664.8 710.9 751.9 767.7 778.9 793.6 808.7 827.2 840.0 849.1 48
49 Disposable personal income 5677.7 5968.2 6355.6 6618.0 6859.1 6993.7 7081.3 7189.8 7295.0 7363.2 7577.0 49 Household net worth as percentage of50 disposable personal income 523.4 561.3 581.0 632.3 625.2 606.2 600.3 574.7 544.6 552.7 510.8 50 Owners’ equity in household real51 estate (9) 4432.2 4742.0 5040.4 5412.2 5602.5 5808.3 5997.8 6192.1 6385.2 6542.8 6678.9 51 Owners’ equity as percentage of52 household real estate (10) 55.3 55.4 54.7 54.3 54.8 55.1 55.3 55.6 56.0 55.9 55.7 52
(1) Sector includes farm households.(2) At market value.(3) Includes vacant land and vacant homes for sale.(4) At replacement (current) cost.(5) Value based on the market values of equities held and the book value of other assets held by mutual funds.(6) Net worth of noncorporate business (table B.103, line 31) and owners’ equity in farm business and unincorporated security brokers and dealers.(7) Includes loans made under home equity lines of credit and home equity loans secured by junior liens, shown on table L.218, line 24.(8) Liabilities of nonprofit organizations.(9) Line 4 less line 34.(10) Line 51 divided by line 4.
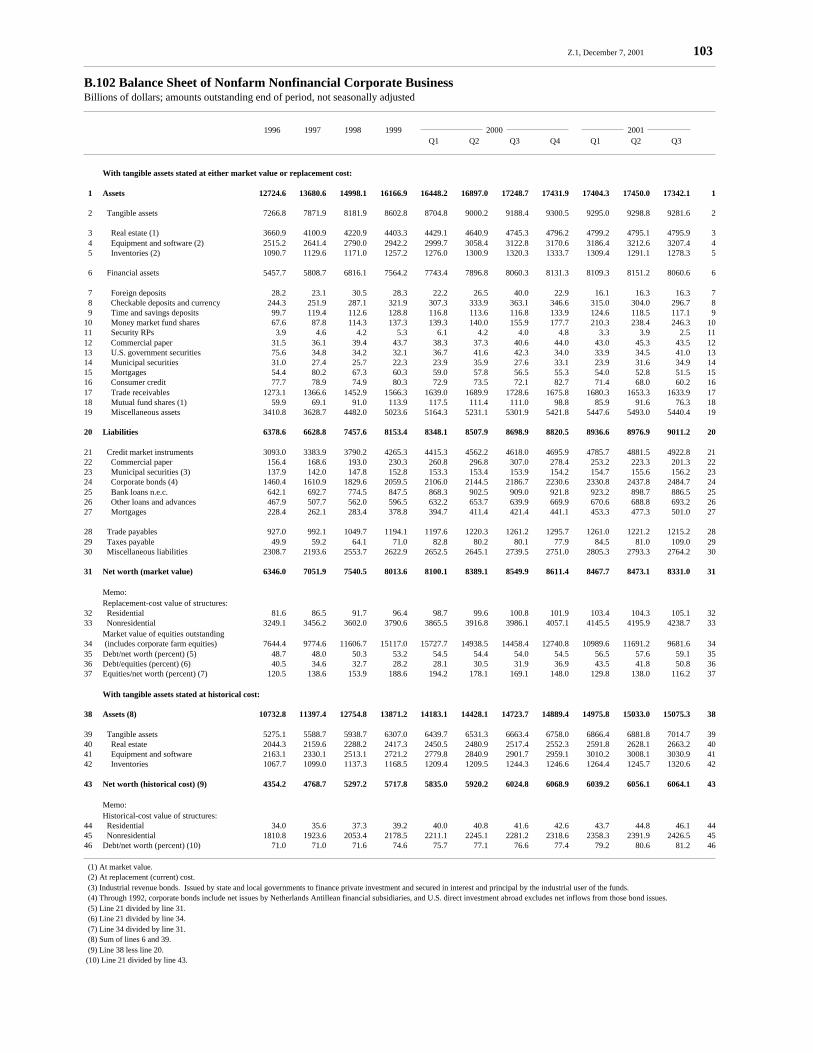
Z.1, December 7, 2001 103
B.102 Balance Sheet of Nonfarm Nonfinancial Corporate BusinessBillions of dollars; amounts outstanding end of period, not seasonally adjusted
1996 1997 1998 1999 2000 2001 Q1 Q2 Q3 Q4 Q1 Q2 Q3
With tangible assets stated at either market value or replacement cost:
1 Assets 12724.6 13680.6 14998.1 16166.9 16448.2 16897.0 17248.7 17431.9 17404.3 17450.0 17342.1 1
2 Tangible assets 7266.8 7871.9 8181.9 8602.8 8704.8 9000.2 9188.4 9300.5 9295.0 9298.8 9281.6 2
3 Real estate (1) 3660.9 4100.9 4220.9 4403.3 4429.1 4640.9 4745.3 4796.2 4799.2 4795.1 4795.9 3 4 Equipment and software (2) 2515.2 2641.4 2790.0 2942.2 2999.7 3058.4 3122.8 3170.6 3186.4 3212.6 3207.4 4 5 Inventories (2) 1090.7 1129.6 1171.0 1257.2 1276.0 1300.9 1320.3 1333.7 1309.4 1291.1 1278.3 5
6 Financial assets 5457.7 5808.7 6816.1 7564.2 7743.4 7896.8 8060.3 8131.3 8109.3 8151.2 8060.6 6
7 Foreign deposits 28.2 23.1 30.5 28.3 22.2 26.5 40.0 22.9 16.1 16.3 16.3 7 8 Checkable deposits and currency 244.3 251.9 287.1 321.9 307.3 333.9 363.1 346.6 315.0 304.0 296.7 8 9 Time and savings deposits 99.7 119.4 112.6 128.8 116.8 113.6 116.8 133.9 124.6 118.5 117.1 910 Money market fund shares 67.6 87.8 114.3 137.3 139.3 140.0 155.9 177.7 210.3 238.4 246.3 1011 Security RPs 3.9 4.6 4.2 5.3 6.1 4.2 4.0 4.8 3.3 3.9 2.5 1112 Commercial paper 31.5 36.1 39.4 43.7 38.3 37.3 40.6 44.0 43.0 45.3 43.5 1213 U.S. government securities 75.6 34.8 34.2 32.1 36.7 41.6 42.3 34.0 33.9 34.5 41.0 1314 Municipal securities 31.0 27.4 25.7 22.3 23.9 35.9 27.6 33.1 23.9 31.6 34.9 1415 Mortgages 54.4 80.2 67.3 60.3 59.0 57.8 56.5 55.3 54.0 52.8 51.5 1516 Consumer credit 77.7 78.9 74.9 80.3 72.9 73.5 72.1 82.7 71.4 68.0 60.2 1617 Trade receivables 1273.1 1366.6 1452.9 1566.3 1639.0 1689.9 1728.6 1675.8 1680.3 1653.3 1633.9 1718 Mutual fund shares (1) 59.9 69.1 91.0 113.9 117.5 111.4 111.0 98.8 85.9 91.6 76.3 1819 Miscellaneous assets 3410.8 3628.7 4482.0 5023.6 5164.3 5231.1 5301.9 5421.8 5447.6 5493.0 5440.4 19
20 Liabilities 6378.6 6628.8 7457.6 8153.4 8348.1 8507.9 8698.9 8820.5 8936.6 8976.9 9011.2 20
21 Credit market instruments 3093.0 3383.9 3790.2 4265.3 4415.3 4562.2 4618.0 4695.9 4785.7 4881.5 4922.8 2122 Commercial paper 156.4 168.6 193.0 230.3 260.8 296.8 307.0 278.4 253.2 223.3 201.3 2223 Municipal securities (3) 137.9 142.0 147.8 152.8 153.3 153.4 153.9 154.2 154.7 155.6 156.2 2324 Corporate bonds (4) 1460.4 1610.9 1829.6 2059.5 2106.0 2144.5 2186.7 2230.6 2330.8 2437.8 2484.7 2425 Bank loans n.e.c. 642.1 692.7 774.5 847.5 868.3 902.5 909.0 921.8 923.2 898.7 886.5 2526 Other loans and advances 467.9 507.7 562.0 596.5 632.2 653.7 639.9 669.9 670.6 688.8 693.2 2627 Mortgages 228.4 262.1 283.4 378.8 394.7 411.4 421.4 441.1 453.3 477.3 501.0 27
28 Trade payables 927.0 992.1 1049.7 1194.1 1197.6 1220.3 1261.2 1295.7 1261.0 1221.2 1215.2 2829 Taxes payable 49.9 59.2 64.1 71.0 82.8 80.2 80.1 77.9 84.5 81.0 109.0 2930 Miscellaneous liabilities 2308.7 2193.6 2553.7 2622.9 2652.5 2645.1 2739.5 2751.0 2805.3 2793.3 2764.2 30
31 Net worth (market value) 6346.0 7051.9 7540.5 8013.6 8100.1 8389.1 8549.9 8611.4 8467.7 8473.1 8331.0 31
Memo: Replacement-cost value of structures:32 Residential 81.6 86.5 91.7 96.4 98.7 99.6 100.8 101.9 103.4 104.3 105.1 3233 Nonresidential 3249.1 3456.2 3602.0 3790.6 3865.5 3916.8 3986.1 4057.1 4145.5 4195.9 4238.7 33 Market value of equities outstanding34 (includes corporate farm equities) 7644.4 9774.6 11606.7 15117.0 15727.7 14938.5 14458.4 12740.8 10989.6 11691.2 9681.6 3435 Debt/net worth (percent) (5) 48.7 48.0 50.3 53.2 54.5 54.4 54.0 54.5 56.5 57.6 59.1 3536 Debt/equities (percent) (6) 40.5 34.6 32.7 28.2 28.1 30.5 31.9 36.9 43.5 41.8 50.8 3637 Equities/net worth (percent) (7) 120.5 138.6 153.9 188.6 194.2 178.1 169.1 148.0 129.8 138.0 116.2 37
With tangible assets stated at historical cost:
38 Assets (8) 10732.8 11397.4 12754.8 13871.2 14183.1 14428.1 14723.7 14889.4 14975.8 15033.0 15075.3 38
39 Tangible assets 5275.1 5588.7 5938.7 6307.0 6439.7 6531.3 6663.4 6758.0 6866.4 6881.8 7014.7 3940 Real estate 2044.3 2159.6 2288.2 2417.3 2450.5 2480.9 2517.4 2552.3 2591.8 2628.1 2663.2 4041 Equipment and software 2163.1 2330.1 2513.1 2721.2 2779.8 2840.9 2901.7 2959.1 3010.2 3008.1 3030.9 4142 Inventories 1067.7 1099.0 1137.3 1168.5 1209.4 1209.5 1244.3 1246.6 1264.4 1245.7 1320.6 42
43 Net worth (historical cost) (9) 4354.2 4768.7 5297.2 5717.8 5835.0 5920.2 6024.8 6068.9 6039.2 6056.1 6064.1 43
Memo: Historical-cost value of structures:44 Residential 34.0 35.6 37.3 39.2 40.0 40.8 41.6 42.6 43.7 44.8 46.1 4445 Nonresidential 1810.8 1923.6 2053.4 2178.5 2211.1 2245.1 2281.2 2318.6 2358.3 2391.9 2426.5 4546 Debt/net worth (percent) (10) 71.0 71.0 71.6 74.6 75.7 77.1 76.6 77.4 79.2 80.6 81.2 46
(1) At market value. (2) At replacement (current) cost. (3) Industrial revenue bonds. Issued by state and local governments to finance private investment and secured in interest and principal by the industrial user of the funds. (4) Through 1992, corporate bonds include net issues by Netherlands Antillean financial subsidiaries, and U.S. direct investment abroad excludes net inflows from those bond issues. (5) Line 21 divided by line 31. (6) Line 21 divided by line 34. (7) Line 34 divided by line 31. (8) Sum of lines 6 and 39. (9) Line 38 less line 20. (10) Line 21 divided by line 43.

104 Z.1, December 7, 2001
B.103 Balance Sheet of Nonfarm Noncorporate BusinessBillions of dollars; amounts outstanding end of period, not seasonally adjusted
1996 1997 1998 1999 2000 2001 Q1 Q2 Q3 Q4 Q1 Q2 Q3
1 Assets 4491.1 4898.7 5517.0 5987.5 6069.5 6243.7 6338.1 6458.7 6537.8 6614.5 6672.2 1
2 Tangible assets 3849.7 4126.3 4415.2 4723.3 4774.2 4902.2 4971.1 5065.1 5115.4 5164.3 5200.8 2
3 Real estate (1) 3361.2 3615.9 3866.9 4116.8 4185.8 4331.6 4419.4 4504.9 4544.5 4581.9 4619.8 3 4 Residential 2534.9 2727.6 2911.8 3139.5 3210.9 3305.8 3368.9 3434.7 3483.0 3519.7 3551.0 4 5 Nonresidential 826.2 888.3 955.1 977.3 974.9 1025.7 1050.4 1070.2 1061.5 1062.2 1068.8 5
6 Equipment and software (2) 431.2 450.9 486.7 540.3 521.2 502.1 482.2 490.0 502.0 514.5 529.3 6 7 Residential (3) 74.3 75.6 77.7 77.6 77.7 77.9 77.9 78.0 78.2 74.3 74.4 7 8 Nonresidential 356.9 375.3 409.0 462.7 443.5 424.2 404.3 412.0 423.8 440.2 454.9 8
9 Inventories (2) 57.4 59.5 61.6 66.2 67.2 68.5 69.5 70.2 68.9 68.0 51.7 9
10 Financial assets 641.3 772.4 1101.8 1264.3 1295.3 1341.5 1367.0 1393.6 1422.4 1450.2 1471.4 10
11 Checkable deposits and currency 124.0 146.2 178.3 203.3 209.6 220.4 224.4 228.3 233.3 238.5 243.3 1112 Time and savings deposits 75.0 85.7 94.8 104.8 105.8 107.7 108.0 108.8 110.1 111.4 112.8 1213 Money market fund shares 19.2 22.9 32.6 42.6 43.1 43.2 47.2 52.6 59.6 66.6 68.8 13
14 Treasury securities 26.7 30.8 37.0 33.9 31.3 27.6 25.9 23.7 20.9 18.2 14.8 1415 Municipal securities 2.6 3.2 1.5 3.5 3.5 3.6 3.6 3.7 3.7 3.8 3.8 1516 Mortgages 20.4 18.7 30.7 40.7 42.7 46.5 47.0 48.6 50.1 51.5 53.2 1617 Consumer credit 0 0 0 0 0 0 0 0 0 0 0 17
18 Trade receivables 169.8 204.9 245.6 291.4 301.6 321.2 325.5 332.2 337.2 340.7 344.0 1819 Miscellaneous assets 203.5 259.9 481.4 544.1 557.7 571.2 585.3 595.7 607.5 619.5 630.7 1920 Insurance receivables 44.8 45.2 45.6 45.9 46.0 46.3 46.5 45.8 46.0 46.6 48.3 2021 Equity investment in GSEs (4) 1.7 1.7 1.6 1.6 1.7 1.6 1.6 1.6 1.6 1.5 1.5 2122 Other 157.1 213.0 434.2 496.6 510.0 523.3 537.2 548.3 559.9 571.3 580.8 22
23 Liabilities 1534.1 1722.9 2010.2 2255.3 2309.5 2378.1 2424.3 2477.1 2520.6 2565.6 2601.3 23
24 Credit market instruments 1129.3 1224.0 1363.7 1519.1 1553.1 1599.1 1630.3 1664.8 1695.5 1727.9 1753.9 24
25 Bank loans n.e.c. 193.6 237.3 256.3 274.2 278.7 287.1 288.9 292.0 292.2 287.2 283.5 2526 Other loans and advances 92.5 95.8 108.9 116.7 119.9 123.7 125.4 127.8 128.2 132.6 128.9 2627 Mortgages 843.2 890.9 998.6 1128.3 1154.5 1188.3 1215.9 1245.0 1275.1 1308.2 1341.4 27
28 Trade payables 116.8 147.8 170.9 196.4 202.9 211.2 214.8 218.8 222.0 224.8 227.2 2829 Taxes payable 42.5 49.8 60.5 68.8 71.0 73.7 74.9 76.3 77.3 78.1 78.7 2930 Miscellaneous liabilities 245.5 301.3 415.1 471.0 482.5 494.1 504.3 517.2 525.9 534.8 541.5 30
31 Net worth (5) 2957.0 3175.8 3506.8 3732.3 3759.9 3865.6 3913.7 3981.6 4017.2 4048.9 4070.9 31
Memo:
Replacement-cost value of structures:32 Residential 1711.9 1751.5 1834.3 1965.7 1957.5 1976.5 1959.4 1956.7 1958.4 1985.2 2006.3 3233 Nonresidential 709.2 666.1 626.5 674.9 677.6 682.3 687.9 679.2 667.7 661.1 663.8 33
34 Debt/net worth (percent) (6) 38.2 38.5 38.9 40.7 41.3 41.4 41.7 41.8 42.2 42.7 43.1 34
(1) At market value.(2) At replacement (current) cost.(3) Durable goods in rental properties.(4) Equity in the Farm Credit System.(5) Line 1 less line 23. Included in table B.100, line 30.(6) Line 24 divided by line 31.

Z.1, December 7, 2001 105
R.100 Change in Net Worth of Households and Nonprofit OrganizationsBillions of dollars; not seasonally adjusted
1996 1997 1998 1999 2000 2001 Q1 Q2 Q3 Q4 Q1 Q2 Q3
1 Change in net worth (1) 2530.3 3781.3 3422.2 4923.3 1034.7 -486.8 116.8 -1191.3 -1591.0 964.3 -1992.2 1
2 Net investment 403.1 329.6 429.1 337.5 105.4 -31.9 44.3 131.8 164.9 -48.7 114.0 2
3 Net physical investment 310.6 366.6 438.9 500.7 123.1 136.3 142.0 130.4 104.2 123.0 131.0 3 4 Capital expenditures 907.2 982.0 1081.7 1195.4 305.0 322.0 331.7 323.7 301.2 328.5 341.7 4 5 - Consumption of fixed capital 596.6 615.4 642.8 694.7 181.9 185.6 189.7 193.3 197.0 205.5 210.8 5
6 Net financial investment 92.5 -37.0 -9.8 -163.3 -17.7 -168.3 -97.7 1.4 60.7 -171.7 -17.0 6 7 Net acquisition of financial assets 461.0 341.7 486.3 437.1 108.7 -18.1 62.1 133.0 90.8 8.3 211.1 7 8 - Net increase in liabilities 368.5 378.7 496.1 600.4 126.4 150.2 159.8 131.7 30.1 179.9 228.0 8
Holding gains on assets stated 9 at market value (2) 2113.5 3594.3 3121.6 4580.9 942.1 -452.9 94.8 -1268.4 -1748.6 1040.6 -2085.9 9
10 Real estate 246.9 459.6 540.6 562.3 215.4 297.7 247.2 230.5 231.8 238.8 186.2 1011 Corporate equities 927.3 1700.2 1206.0 2347.5 316.2 -547.2 -251.8 -913.4 -1107.0 410.2 -1132.4 1112 Mutual fund shares 141.0 186.2 177.4 562.6 154.7 -126.5 -20.9 -260.1 -331.0 119.2 -421.9 1213 Equity in noncorporate business 219.2 335.3 423.7 294.2 52.7 101.1 42.3 76.7 59.4 9.3 15.2 13 Life insurance and14 pension fund reserves 505.5 791.9 673.6 678.4 168.5 -142.7 78.4 -321.8 -518.0 222.1 -635.3 14 Investment in bank personal15 trusts and estates 73.6 121.1 100.3 135.9 34.7 -35.4 -0.4 -80.3 -83.8 41.0 -97.7 15
Holding gains on assets stated16 at current cost (2) -55.1 -96.9 -103.2 -57.2 -12.0 -5.5 -14.9 -8.5 -6.7 -25.6 -20.6 16
17 Consumer durable goods -53.6 -94.9 -100.8 -54.9 -11.9 -5.4 -15.0 -8.1 -5.3 -25.4 -20.2 1718 Equipment and software -1.5 -2.0 -2.4 -2.3 -0.1 -0.2 0.1 -0.4 -1.4 -0.2 -0.4 18
19 Other factors (3) 68.8 -45.7 -25.2 62.2 -0.8 3.6 -7.4 -46.2 -0.6 -2.0 0.3 19
Memo:
20 Net worth outstanding (4) 29719.9 33501.2 36923.4 41846.7 42881.4 42394.6 42511.4 41320.1 39729.1 40693.4 38701.2 2021 Disposable personal income 5677.7 5968.2 6355.6 6618.0 6859.1 6993.7 7081.3 7189.8 7295.0 7363.2 7577.0 21
(1) Sum of net investment (line 2), holding gains (lines 9 and 16), and other factors (line 19).(2) Calculated as change in amount outstanding during period less net purchases during period.(3) Consists of the difference between series for consumption of fixed capital published by BEA and statistical discontinuities.(4) Table B.100, line 43.

106 Z.1, December 7, 2001
R.102 Change in Net Worth of Nonfarm Nonfinancial Corporate BusinessBillions of dollars; not seasonally adjusted
1996 1997 1998 1999 2000 2001 Q1 Q2 Q3 Q4 Q1 Q2 Q3
With tangible assets valued at either market or replacement cost:
1 Change in net worth (1) 620.0 705.9 488.6 473.1 86.5 289.0 160.8 61.5 -143.6 5.4 -142.1 1
2 Net investment 206.4 146.2 -5.1 148.9 66.0 32.3 46.3 -0.1 20.5 36.2 -7.5 2
3 Net physical investment 220.3 271.7 308.0 360.9 99.3 104.4 97.6 90.3 73.8 59.9 34.8 3 4 Capital expenditures 687.7 778.6 849.6 916.2 236.3 248.0 252.6 245.3 231.8 218.4 209.2 4 5 - Consumption of fixed capital 459.5 489.7 519.2 556.5 145.9 149.0 152.4 155.1 158.1 162.9 174.3 5 6 - Inventory valuation adjustment 3.1 8.5 18.4 -2.9 -8.9 -5.7 2.5 -0.2 -0.2 -4.5 0.0 6 7 - Access rights from fed. government 4.8 8.8 4.1 1.7 0 0.3 0.2 0.1 0.1 0.1 0.1 7
8 Net financial investment 55.5 -11.1 -46.1 -68.5 -48.6 -10.8 -34.4 -2.7 -46.9 -5.5 -12.7 8 9 Net acquisition of financial assets 454.0 272.4 569.9 665.2 163.0 176.2 163.7 119.8 30.1 15.7 21.9 910 - Net increase in liabilities 398.5 283.5 616.0 733.7 211.7 187.0 198.1 122.4 76.9 21.3 34.6 10
11 Net corporate equity issues -69.5 -114.4 -267.0 -143.5 15.3 -61.3 -16.9 -87.7 -6.4 -18.2 -29.6 11
Holding gains on assets stated12 at market value (2) 289.9 396.0 70.3 121.6 9.0 192.8 80.7 21.1 -35.0 -24.1 -35.5 1213 Real estate 279.0 378.6 55.8 96.8 5.0 198.3 80.7 32.8 -22.6 -30.3 -20.7 1314 Mutual fund shares 10.9 17.5 14.6 24.8 4.0 -5.6 -0.0 -11.7 -12.4 6.2 -14.8 14
Holding gains on assets stated at current cost less holding gains on liabilities stated15 at current cost (2) 8.1 -12.1 28.1 57.9 -2.3 -2.9 10.4 -30.9 -55.5 -27.3 -30.6 1516 Equipment and software -17.0 -36.5 -38.4 -65.0 -3.3 -4.6 1.6 -11.7 -37.2 -13.0 -30.7 1617 Inventories (3) 2.9 -9.6 -8.9 26.3 1.0 1.6 8.7 4.2 -18.3 -14.4 0.1 1718 Direct investment abroad 7.7 -15.0 -13.2 -24.2 0 0 0 -35.2 0 0 0 1819 - Foreign direct investment in U.S. -14.5 -49.0 -88.6 -120.9 0.0 -0.0 0.0 -11.8 0.0 0.0 0.0 19
20 Other factors (4) 115.6 175.7 395.2 144.7 13.8 66.8 23.4 71.4 -73.7 20.5 -68.5 20
Memo:
21 Net worth outstanding (market value) 6346.0 7051.9 7540.5 8013.6 8100.1 8389.1 8549.9 8611.4 8467.7 8473.1 8331.0 21
With tangible assets valued at historical cost:
22 Change in net worth (5) 425.6 414.4 528.5 420.6 117.2 85.2 104.6 44.1 -29.7 16.9 8.0 22
23 Net investment flow 206.4 146.2 -5.1 148.9 66.0 32.3 46.3 -0.1 20.5 36.2 -7.5 23
24 Net physical investment 220.3 271.7 308.0 360.9 99.3 104.4 97.6 90.3 73.8 59.9 34.8 2425 Capital expenditures 687.7 778.6 849.6 916.2 236.3 248.0 252.6 245.3 231.8 218.4 209.2 2526 - Consumption of fixed capital 459.5 489.7 519.2 556.5 145.9 149.0 152.4 155.1 158.1 162.9 174.3 2627 - Inventory valuation adjustment 3.1 8.5 18.4 -2.9 -8.9 -5.7 2.5 -0.2 -0.2 -4.5 0.0 2728 - Access rights from fed. government 4.8 8.8 4.1 1.7 0 0.3 0.2 0.1 0.1 0.1 0.1 28
29 Net financial investment 55.5 -11.1 -46.1 -68.5 -48.6 -10.8 -34.4 -2.7 -46.9 -5.5 -12.7 2930 Net acquisition of financial assets 454.0 272.4 569.9 665.2 163.0 176.2 163.7 119.8 30.1 15.7 21.9 3031 - Net increase in liabilities 398.5 283.5 616.0 733.7 211.7 187.0 198.1 122.4 76.9 21.3 34.6 31
32 Net corporate equity issues -69.5 -114.4 -267.0 -143.5 15.3 -61.3 -16.9 -87.7 -6.4 -18.2 -29.6 32
Valuation adjustment on33 reproducible assets (6) 5.1 -23.6 -15.6 -62.0 15.3 -27.8 14.3 -13.5 13.4 -71.2 64.3 33
34 Holding gains on mutual fund shares (2) 10.9 17.5 14.6 24.8 4.0 -5.6 -0.0 -11.7 -12.4 6.2 -14.8 34
Holding gains on assets stated at current cost less holding gains on liabilities stated35 at current cost (2) 22.2 34.0 75.4 96.7 -0.0 0.0 -0.0 -23.4 -0.0 -0.0 -0.0 3536 Direct investment abroad 7.7 -15.0 -13.2 -24.2 0 0 0 -35.2 0 0 0 3637 - Foreign direct investment in U.S. -14.5 -49.0 -88.6 -120.9 0.0 -0.0 0.0 -11.8 0.0 0.0 0.0 37
38 Other factors (4) 181.0 240.3 459.2 212.2 31.9 86.2 44.1 92.7 -51.2 45.7 -34.0 38
Memo:
39 Net worth outstanding (historical cost) 4354.2 4768.7 5297.2 5717.8 5835.0 5920.2 6024.8 6068.9 6039.2 6056.1 6064.1 39
(1) Sum of net investment (line 2), holding gains (lines 12 and 15), and other factors (line 20).(2) Calculated as change in amount outstanding during period less net purchases during period.(3) Before inventory valuation adjustment.(4) Consists of statistical discontinuities.(5) Sum of net investment flow (line 23), valuation adjustment on reproducible assets (line 33), holding gains (lines 34 and 35), and other factors (line 38).(6) Effect of different treatment of certain items in BEA capital accounts from the NIPA accounts in the calculation of historical-cost investment flows; also reflects adjustments for intersectoral transfers of assets.

Z.1, December 7, 2001 107
R.103 Change in Net Worth of Nonfarm Noncorporate BusinessBillions of dollars; not seasonally adjusted
1996 1997 1998 1999 2000 2001 Q1 Q2 Q3 Q4 Q1 Q2 Q3
1 Change in net worth (1) 155.5 218.8 331.0 225.5 27.7 105.6 48.2 67.9 35.6 31.7 22.0 1
2 Net investment (2) -45.7 -85.8 -86.0 -68.8 -29.2 -4.6 -14.8 -11.0 -28.0 1.1 -6.2 2
3 Net physical investment -8.5 -27.4 -24.1 9.8 -5.9 17.8 5.9 15.0 -13.2 18.3 8.4 3 4 Capital expenditures 102.2 91.1 100.3 145.8 29.4 53.6 42.4 52.1 24.5 57.6 47.8 4 5 - Consumption of fixed capital 110.8 118.5 124.4 136.0 35.3 35.8 36.5 37.1 37.7 39.3 39.4 5
6 Net acquisition of financial assets 95.4 131.1 186.0 160.6 31.0 46.2 25.5 26.6 28.8 27.7 21.2 6
- Net increase in liabilities from: 7 Credit market instruments 67.3 94.7 139.7 155.4 34.1 45.9 31.2 34.5 30.7 32.4 26.0 7 8 Trade payables 30.6 31.0 23.1 25.5 6.5 8.3 3.6 4.0 3.2 2.8 2.4 8 9 Taxes payable 4.9 7.3 10.7 8.3 2.2 2.8 1.2 1.4 1.0 0.8 0.6 910 Miscellaneous liabilities 29.7 56.5 74.3 50.1 11.5 11.5 10.3 12.8 8.7 8.9 6.8 10
Holding gains on assets stated11 at market value (real estate) (3) 165.8 281.3 279.5 247.3 71.6 139.0 81.4 73.1 42.9 29.8 24.4 1112 Residential 145.7 192.5 183.9 226.6 71.0 94.8 63.4 66.4 48.8 36.5 31.1 1213 Nonresidential 20.1 88.7 95.6 20.7 0.5 44.2 18.0 6.8 -5.9 -6.8 -6.7 13
Holding gains on assets stated14 at current cost (3) 33.1 18.7 29.2 53.3 -14.1 -27.9 -17.5 6.9 21.8 0.5 2.0 1415 Residential equipment and software 1.7 -0.0 0.6 -1.7 -0.4 -0.2 -0.4 -0.2 -0.1 -4.6 -0.5 1516 Nonresidential equipment and software 31.4 19.7 30.1 53.5 -14.3 -28.2 -17.4 6.9 23.0 5.7 18.1 1617 Inventories -0.0 -0.9 -1.5 1.6 0.5 0.4 0.3 0.2 -1.0 -0.5 -15.6 17
18 Other factors (4) 2.3 4.6 108.2 -6.4 -0.6 -0.8 -0.9 -1.1 -1.2 0.3 1.8 18
Memo:
19 Net worth outstanding (5) 2957.0 3175.8 3506.8 3732.3 3759.9 3865.6 3913.7 3981.6 4017.2 4048.9 4070.9 19
(1) Sum of net investment (line 2), holding gains (lines 11 and 14), and other factors (line 18).(2) Also equal to proprietor’s net investment shown on table F.103, line 29.(3) Calculated as change in amount outstanding during period less net investment during period.(4) Consists of statistical discontinuities.(5) Table B.103, line 31.
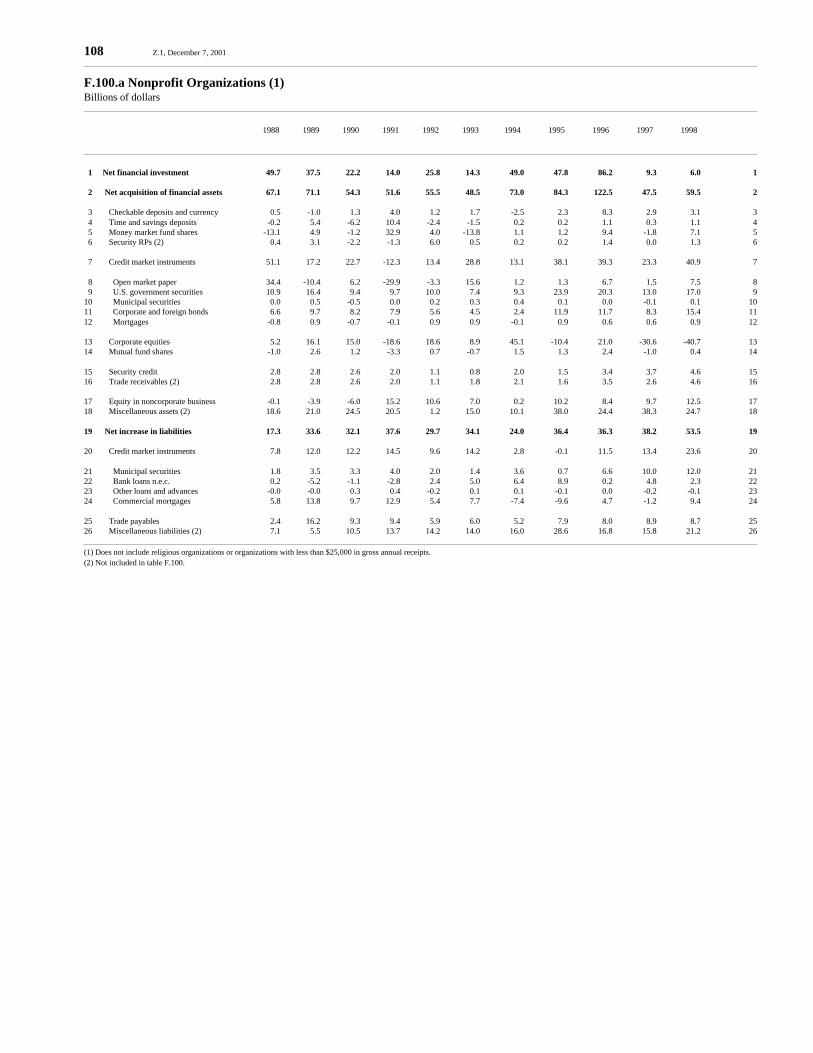
108 Z.1, December 7, 2001
F.100.a Nonprofit Organizations (1)Billions of dollars
1988 1989 1990 1991 1992 1993 1994 1995 1996 1997 1998
1 Net financial investment 49.7 37.5 22.2 14.0 25.8 14.3 49.0 47.8 86.2 9.3 6.0 1
2 Net acquisition of financial assets 67.1 71.1 54.3 51.6 55.5 48.5 73.0 84.3 122.5 47.5 59.5 2
3 Checkable deposits and currency 0.5 -1.0 1.3 4.0 1.2 1.7 -2.5 2.3 8.3 2.9 3.1 3 4 Time and savings deposits -0.2 5.4 -6.2 10.4 -2.4 -1.5 0.2 0.2 1.1 0.3 1.1 4 5 Money market fund shares -13.1 4.9 -1.2 32.9 4.0 -13.8 1.1 1.2 9.4 -1.8 7.1 5 6 Security RPs (2) 0.4 3.1 -2.2 -1.3 6.0 0.5 0.2 0.2 1.4 0.0 1.3 6
7 Credit market instruments 51.1 17.2 22.7 -12.3 13.4 28.8 13.1 38.1 39.3 23.3 40.9 7
8 Open market paper 34.4 -10.4 6.2 -29.9 -3.3 15.6 1.2 1.3 6.7 1.5 7.5 8 9 U.S. government securities 10.9 16.4 9.4 9.7 10.0 7.4 9.3 23.9 20.3 13.0 17.0 910 Municipal securities 0.0 0.5 -0.5 0.0 0.2 0.3 0.4 0.1 0.0 -0.1 0.1 1011 Corporate and foreign bonds 6.6 9.7 8.2 7.9 5.6 4.5 2.4 11.9 11.7 8.3 15.4 1112 Mortgages -0.8 0.9 -0.7 -0.1 0.9 0.9 -0.1 0.9 0.6 0.6 0.9 12
13 Corporate equities 5.2 16.1 15.0 -18.6 18.6 8.9 45.1 -10.4 21.0 -30.6 -40.7 1314 Mutual fund shares -1.0 2.6 1.2 -3.3 0.7 -0.7 1.5 1.3 2.4 -1.0 0.4 14
15 Security credit 2.8 2.8 2.6 2.0 1.1 0.8 2.0 1.5 3.4 3.7 4.6 1516 Trade receivables (2) 2.8 2.8 2.6 2.0 1.1 1.8 2.1 1.6 3.5 2.6 4.6 16
17 Equity in noncorporate business -0.1 -3.9 -6.0 15.2 10.6 7.0 0.2 10.2 8.4 9.7 12.5 1718 Miscellaneous assets (2) 18.6 21.0 24.5 20.5 1.2 15.0 10.1 38.0 24.4 38.3 24.7 18
19 Net increase in liabilities 17.3 33.6 32.1 37.6 29.7 34.1 24.0 36.4 36.3 38.2 53.5 19
20 Credit market instruments 7.8 12.0 12.2 14.5 9.6 14.2 2.8 -0.1 11.5 13.4 23.6 20
21 Municipal securities 1.8 3.5 3.3 4.0 2.0 1.4 3.6 0.7 6.6 10.0 12.0 2122 Bank loans n.e.c. 0.2 -5.2 -1.1 -2.8 2.4 5.0 6.4 8.9 0.2 4.8 2.3 2223 Other loans and advances -0.0 -0.0 0.3 0.4 -0.2 0.1 0.1 -0.1 0.0 -0.2 -0.1 2324 Commercial mortgages 5.8 13.8 9.7 12.9 5.4 7.7 -7.4 -9.6 4.7 -1.2 9.4 24
25 Trade payables 2.4 16.2 9.3 9.4 5.9 6.0 5.2 7.9 8.0 8.9 8.7 2526 Miscellaneous liabilities (2) 7.1 5.5 10.5 13.7 14.2 14.0 16.0 28.6 16.8 15.8 21.2 26
(1) Does not include religious organizations or organizations with less than $25,000 in gross annual receipts.(2) Not included in table F.100.
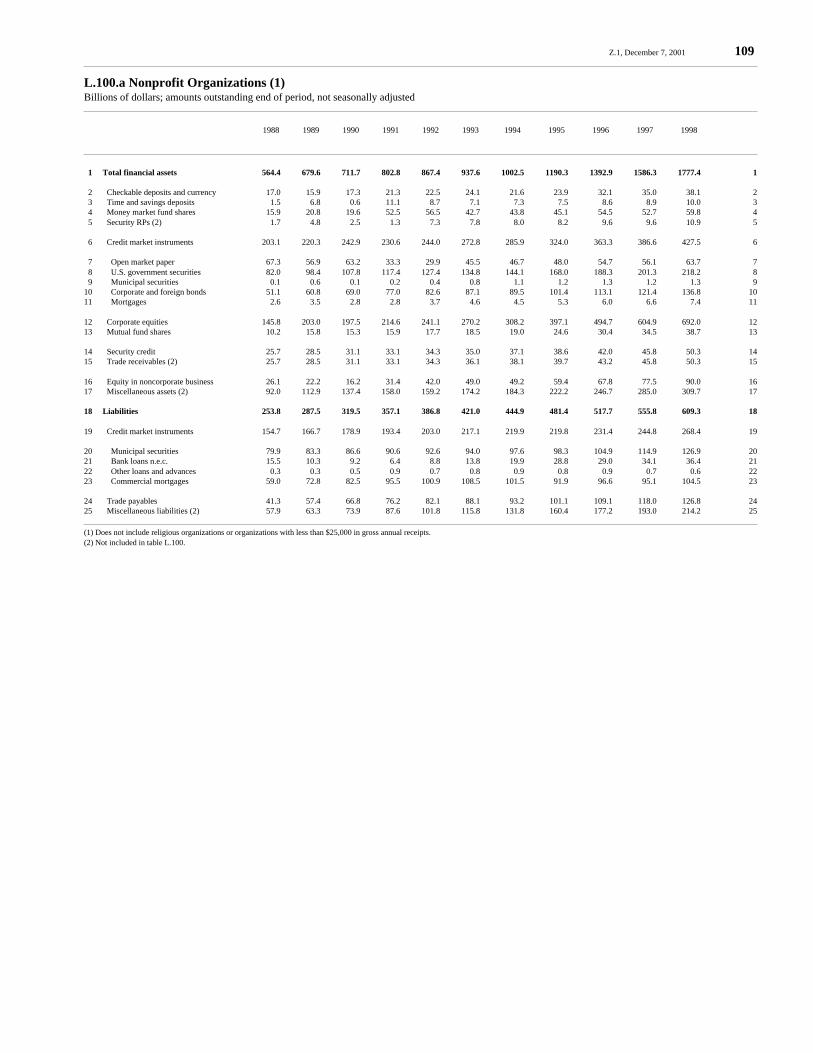
Z.1, December 7, 2001 109
L.100.a Nonprofit Organizations (1)Billions of dollars; amounts outstanding end of period, not seasonally adjusted
1988 1989 1990 1991 1992 1993 1994 1995 1996 1997 1998
1 Total financial assets 564.4 679.6 711.7 802.8 867.4 937.6 1002.5 1190.3 1392.9 1586.3 1777.4 1
2 Checkable deposits and currency 17.0 15.9 17.3 21.3 22.5 24.1 21.6 23.9 32.1 35.0 38.1 2 3 Time and savings deposits 1.5 6.8 0.6 11.1 8.7 7.1 7.3 7.5 8.6 8.9 10.0 3 4 Money market fund shares 15.9 20.8 19.6 52.5 56.5 42.7 43.8 45.1 54.5 52.7 59.8 4 5 Security RPs (2) 1.7 4.8 2.5 1.3 7.3 7.8 8.0 8.2 9.6 9.6 10.9 5
6 Credit market instruments 203.1 220.3 242.9 230.6 244.0 272.8 285.9 324.0 363.3 386.6 427.5 6
7 Open market paper 67.3 56.9 63.2 33.3 29.9 45.5 46.7 48.0 54.7 56.1 63.7 7 8 U.S. government securities 82.0 98.4 107.8 117.4 127.4 134.8 144.1 168.0 188.3 201.3 218.2 8 9 Municipal securities 0.1 0.6 0.1 0.2 0.4 0.8 1.1 1.2 1.3 1.2 1.3 910 Corporate and foreign bonds 51.1 60.8 69.0 77.0 82.6 87.1 89.5 101.4 113.1 121.4 136.8 1011 Mortgages 2.6 3.5 2.8 2.8 3.7 4.6 4.5 5.3 6.0 6.6 7.4 11
12 Corporate equities 145.8 203.0 197.5 214.6 241.1 270.2 308.2 397.1 494.7 604.9 692.0 1213 Mutual fund shares 10.2 15.8 15.3 15.9 17.7 18.5 19.0 24.6 30.4 34.5 38.7 13
14 Security credit 25.7 28.5 31.1 33.1 34.3 35.0 37.1 38.6 42.0 45.8 50.3 1415 Trade receivables (2) 25.7 28.5 31.1 33.1 34.3 36.1 38.1 39.7 43.2 45.8 50.3 15
16 Equity in noncorporate business 26.1 22.2 16.2 31.4 42.0 49.0 49.2 59.4 67.8 77.5 90.0 1617 Miscellaneous assets (2) 92.0 112.9 137.4 158.0 159.2 174.2 184.3 222.2 246.7 285.0 309.7 17
18 Liabilities 253.8 287.5 319.5 357.1 386.8 421.0 444.9 481.4 517.7 555.8 609.3 18
19 Credit market instruments 154.7 166.7 178.9 193.4 203.0 217.1 219.9 219.8 231.4 244.8 268.4 19
20 Municipal securities 79.9 83.3 86.6 90.6 92.6 94.0 97.6 98.3 104.9 114.9 126.9 2021 Bank loans n.e.c. 15.5 10.3 9.2 6.4 8.8 13.8 19.9 28.8 29.0 34.1 36.4 2122 Other loans and advances 0.3 0.3 0.5 0.9 0.7 0.8 0.9 0.8 0.9 0.7 0.6 2223 Commercial mortgages 59.0 72.8 82.5 95.5 100.9 108.5 101.5 91.9 96.6 95.1 104.5 23
24 Trade payables 41.3 57.4 66.8 76.2 82.1 88.1 93.2 101.1 109.1 118.0 126.8 2425 Miscellaneous liabilities (2) 57.9 63.3 73.9 87.6 101.8 115.8 131.8 160.4 177.2 193.0 214.2 25
(1) Does not include religious organizations or organizations with less than $25,000 in gross annual receipts.(2) Not included in table L.100.

110 Z.1, December 7, 2001
F.106.c Consolidated Statement for Federal, State, and Local Governments (1)Billions of dollars; quarterly figures are seasonally adjusted annual rates
1997 1998 1999 2000 2000 2001 Q1 Q2 Q3 Q4 Q1 Q2 Q3
1 Current receipts, NIPA basis 2440.0 2613.8 2786.1 3023.9 2960.3 3013.6 3047.7 3073.9 3096.8 3104.6 2929.5 1 2 Personal tax and nontax receipts 968.8 1070.5 1159.3 1288.2 1245.3 1277.3 1300.2 1329.8 1345.2 1351.4 1195.5 2 3 Corporate profit tax accruals 237.2 238.9 253.0 271.5 277.0 280.4 274.9 253.5 236.8 228.0 206.0 3 4 Indirect business tax and nontax accruals 646.2 681.3 713.1 762.7 749.4 758.3 767.6 775.6 785.7 792.4 794.7 4 5 Contributions for social insurance 587.8 623.3 660.8 701.6 688.6 697.6 705.0 715.0 729.1 732.8 733.3 5
6 Current expenditures, NIPA basis 2462.4 2529.3 2624.8 2772.5 2714.2 2770.0 2783.0 2822.8 2869.2 2896.5 2937.4 6 7 Consumption expenditures 1223.3 1261.4 1327.9 1422.8 1390.6 1426.1 1430.2 1444.1 1474.2 1491.4 1504.2 7 8 Transfer payments (net) 945.0 965.9 1000.1 1050.0 1022.6 1043.4 1053.2 1080.7 1094.6 1111.6 1130.2 8 9 Net interest paid 275.3 278.8 263.8 262.6 263.9 264.0 262.7 259.7 253.0 241.7 231.6 910 - Dividends received by government 0.3 0.4 0.4 0.4 0.4 0.4 0.4 0.4 0.4 0.4 0.4 1011 Subsidies less current surplus of govt. enterprises 19.1 23.6 33.3 37.6 37.5 36.9 37.3 38.7 47.8 52.2 71.8 1112 - Wage accruals less disbursements 0.0 0.0 0.0 0.0 0.0 0.0 0.0 0.0 0.0 0.0 0.0 12
13 Current surplus or deficit (-), NIPA basis -22.4 84.6 161.4 251.4 246.1 243.6 264.7 251.1 227.6 208.1 -7.9 1314 + Consumption of fixed capital 181.0 187.7 198.1 211.4 206.5 209.9 213.1 215.9 218.6 221.3 229.4 1415 - Insurance and pension fund reserves (2) 3.4 4.4 3.8 1.8 0.3 2.7 0.8 3.3 2.8 6.9 0.1 1516 + Net capital transfers (3) 26.8 32.4 32.4 36.2 37.0 36.2 35.8 35.8 38.4 37.0 34.9 16
17 = Gross saving and net capital transfers 182.0 300.2 388.0 497.2 489.3 487.0 512.8 499.6 481.8 459.5 256.3 17
18 Gross investment 127.7 328.5 418.1 530.4 375.2 658.6 503.5 584.3 220.9 516.9 223.0 1819 Fixed investment 264.7 277.1 304.6 318.3 321.1 315.0 314.1 322.8 330.9 344.1 335.5 1920 Access rights sales -8.8 -4.1 -1.7 -0.6 0.0 -1.2 -0.7 -0.5 -0.3 -0.3 -0.3 20
21 Net financial investment -128.2 55.5 115.2 212.7 54.1 344.7 190.1 262.0 -109.7 173.1 -112.2 21
22 Net acquisition of financial assets 34.7 110.4 166.5 27.1 -40.9 36.8 106.7 5.9 169.4 131.9 306.6 22
23 Gold, SDRs, and official foreign exchange 2.5 6.0 -7.1 -0.6 1.9 -8.3 -1.5 5.3 -1.2 5.0 19.2 2324 Checkable deposits and currency 3.8 -20.6 70.0 -64.0 -146.2 -65.6 10.2 -54.7 42.4 -38.1 36.0 2425 Time and savings deposits 6.8 14.1 11.6 10.4 -18.1 21.3 9.1 29.2 -3.2 7.7 4.4 2526 Security RPs 3.6 7.2 5.0 9.7 51.3 -9.4 12.0 -15.0 19.0 17.2 40.8 26
27 Credit market instruments 24.1 116.8 52.0 48.2 46.9 64.5 35.2 46.4 54.2 20.4 68.6 2728 Open market paper 14.3 28.0 1.9 7.6 6.9 17.5 -4.0 10.0 4.0 -17.2 20.0 2829 U.S. government agency securities (4) -0.8 63.6 28.5 23.5 23.1 26.9 24.0 20.0 27.8 22.7 27.6 2930 Municipal securities -0.7 -1.4 -1.5 0.6 -1.7 1.6 3.2 -0.8 2.1 -0.6 0.4 3031 Corporate and foreign bonds 1.3 10.2 12.6 3.7 6.1 4.7 1.6 2.4 11.5 7.2 14.8 3132 Mortgages -0.9 3.3 4.2 3.7 0.7 4.6 3.2 6.1 2.3 4.1 1.4 3233 Other loans and advances (5) 10.9 13.2 6.2 9.2 11.9 9.2 7.1 8.7 6.6 4.2 4.3 33
34 Corporate equities 16.8 9.4 3.5 -1.2 -5.6 10.7 -4.1 -5.6 16.9 21.0 20.3 3435 Mutual fund shares -7.4 -12.3 4.3 0.8 -10.7 5.6 4.5 4.0 9.4 7.9 -0.8 35
36 Trade receivables -3.2 1.5 4.6 5.3 6.0 7.2 4.3 3.7 9.9 10.0 7.4 3637 Taxes receivable -5.7 1.6 15.8 7.6 21.5 21.7 5.9 -18.6 -1.1 26.1 101.5 3738 Miscellaneous assets -6.6 -13.3 6.8 10.9 12.1 -10.8 31.2 11.1 23.1 54.8 9.4 38
39 Net increase in liabilities 162.9 55.0 51.3 -185.6 -94.9 -308.0 -83.4 -256.1 279.1 -41.2 418.8 39
40 SDR certificates -0.5 0.0 -3.0 -4.0 0.0 -8.0 -4.0 -4.0 0.0 0.0 0.0 4041 Treasury currency 0.5 0.6 1.0 2.4 2.2 3.2 4.2 -0.0 -1.1 1.1 -0.0 41
42 Credit market instruments 98.1 -3.5 -16.0 -237.0 -165.2 -373.7 -155.4 -253.9 147.6 -106.2 396.6 4243 Savings bonds -0.5 0.1 -0.2 -1.7 -3.5 -2.1 -0.9 -0.3 1.4 3.3 3.9 4344 Other Treasury securities (6) 41.4 -84.7 -68.3 -262.6 -174.2 -393.3 -177.1 -305.8 45.0 -218.9 350.1 4445 Budget agency securities -0.1 2.0 -0.2 -1.0 -2.1 1.8 -2.4 -1.2 -2.2 1.1 -0.4 4546 Municipal securities 57.3 79.1 52.7 28.2 14.5 19.8 25.1 53.4 103.4 108.3 42.9 4647 Multifamily residential mortgages -0.0 0.0 0.0 0.0 0.0 0.0 0.0 0.0 0.0 0.0 0.0 47
48 Trade payables 22.6 22.5 29.7 28.7 36.5 23.2 27.6 27.6 13.8 13.0 11.8 4849 Insurance and pension reserves (7) 42.0 42.5 42.5 22.3 39.3 41.9 36.3 -28.1 118.1 46.9 31.8 4950 Miscellaneous liabilities 0.3 -7.1 -2.9 2.0 -7.6 5.4 7.9 2.3 0.6 4.1 -21.4 50
51 Discrepancy 54.3 -28.3 -30.1 -33.2 114.1 -171.6 9.3 -84.7 260.9 -57.5 33.3 51
Memo:52 Current surplus less fixed investment (8) -287.1 -192.6 -143.3 -66.9 -75.0 -71.4 -49.4 -71.7 -103.3 -136.0 -343.4 5253 Adjustment between NIPA and FOF (9) 158.9 248.0 258.5 279.6 129.1 416.1 239.5 333.7 -6.4 309.1 231.2 5354 Items to be financed (10) -128.2 55.5 115.2 212.7 54.1 344.7 190.1 262.0 -109.7 173.1 -112.2 54
(1) This table is consistent with NIPA table 3.1 in the Survey of Current Business, Department of Commerce.(2) Railroad Retirement Board and federal government life insurance reserves. Saving transferred to the households and nonprofit organizations sector. Includes value of Treasury and agency securities held by state and local government employee retirement funds.(3) Table F.9, line 1.(4) Holdings by state and local governments may include small amounts of agency securities issued by the federal government.(5) Excludes loans to state and local governments.(6) Excludes Treasury securities owed to state and local governments.(7) Line 15 plus civil service retirement and disability fund, judicial retirement fund, military retirement fund, and foreign service retirement and disability fund.(8) Line 13 less line 19(9) Line 14 plus line 16 less sum of lines 15, 20, and 51.(10) Line 52 plus line 53.

Z.1, December 7, 2001 111
L.106.c Consolidated Statement for Federal, State, and Local GovernmentsBillions of dollars; amounts outstanding end of period, not seasonally adjusted
1997 1998 1999 2000 2000 2001 Q1 Q2 Q3 Q4 Q1 Q2 Q3
1 Total financial assets 1223.0 1343.8 1548.7 1582.7 1549.6 1565.0 1593.6 1582.7 1641.9 1672.0 1725.5 1
2 Gold, SDRs, and official foreign exchange 42.0 51.0 44.4 41.0 41.3 41.0 39.7 41.0 38.7 39.5 44.6 2 3 Checkable deposits and currency 73.8 51.5 120.1 57.4 78.4 87.6 81.4 57.4 60.9 79.1 79.3 3 4 Time and savings deposits 81.8 95.8 107.5 117.8 104.4 106.5 109.7 117.8 118.3 117.0 119.1 4 5 Security RPs 151.4 158.5 163.5 173.3 176.4 174.0 177.0 173.3 178.0 182.3 192.5 5
6 Credit market instruments 562.2 679.1 764.3 812.6 776.0 792.1 800.9 812.6 826.2 831.3 848.4 6
7 Open market paper 74.0 102.0 103.9 111.5 105.6 110.0 109.0 111.5 112.5 108.2 113.2 7 8 Agency securities (1) 115.4 179.0 207.5 231.0 213.3 220.0 226.0 231.0 237.9 243.6 250.5 8 9 Municipal securities 3.9 2.5 1.0 1.6 0.6 1.0 1.8 1.6 2.1 2.0 2.1 910 Corporate and foreign bonds 51.0 61.2 73.8 77.5 75.3 76.5 76.9 77.5 80.4 82.2 85.9 1011 Mortgages 167.0 170.3 207.5 211.2 207.7 208.8 209.6 211.2 211.7 212.8 213.1 1112 Other loans and advances (2) 150.8 164.1 170.5 179.9 173.5 175.8 177.6 179.9 181.5 182.5 183.6 12
13 Corporate equities 79.0 102.0 115.0 115.1 113.2 115.0 117.6 115.1 108.6 118.6 108.8 1314 Mutual fund shares 33.6 21.3 25.6 26.4 22.9 24.3 25.4 26.4 28.8 30.7 30.5 14
15 Trade receivables 20.8 22.3 22.9 28.1 25.4 26.9 27.7 28.1 31.7 33.9 33.4 1516 Taxes receivable 46.9 49.5 72.0 87.9 91.4 77.0 90.4 87.9 111.5 90.7 102.8 1617 Miscellaneous assets 131.8 112.7 113.5 123.0 120.2 120.7 123.9 123.0 139.3 149.0 165.9 17
18 Total liabilities 5967.1 6029.3 6083.4 5895.6 6070.5 5907.1 5886.9 5895.6 5971.9 5868.9 5984.6 18
19 SDR certificates 9.2 9.2 6.2 2.2 6.2 4.2 3.2 2.2 2.2 2.2 2.2 1920 Treasury currency 19.3 19.9 20.9 23.2 21.4 22.1 23.2 23.2 22.9 23.2 23.2 20
21 Credit market instruments 4676.1 4672.6 4656.6 4419.6 4644.2 4464.4 4422.8 4419.6 4483.5 4363.8 4462.9 2122 Savings bonds 186.5 186.6 186.4 184.8 185.3 184.6 184.3 184.8 184.8 185.5 186.4 2223 Other Treasury securities (3) 3352.5 3267.8 3199.5 2936.9 3183.3 2994.8 2956.3 2936.9 2973.3 2822.4 2917.8 2324 Budget agency securities 26.5 28.5 28.3 27.3 27.8 28.2 27.6 27.3 26.8 27.0 27.0 2425 Municipal securities 1110.6 1189.7 1242.4 1270.6 1247.9 1256.7 1254.5 1270.6 1298.7 1328.9 1331.7 2526 Multifamily residential mortgages 0.0 0.0 0.0 0.0 0.0 0.0 0.0 0.0 0.0 0.0 0.0 26
27 Trade payables 621.9 644.4 674.1 702.9 683.9 690.7 697.9 702.9 707.0 711.2 714.5 2728 Insurance and pension reserves 634.0 676.5 719.0 741.3 708.2 719.2 733.3 741.3 749.8 762.1 775.4 2829 Miscellaneous liabilities 6.6 6.7 6.6 6.4 6.6 6.5 6.6 6.4 6.5 6.4 6.4 29
(1) Holdings by state and local governments may include small amounts of agency securities issued by the federal government.(2) Excludes loans to state and local governments.(3) Excludes Treasury securities owed to state and local governments.

112 Z.1, December 7, 2001
F.119.b Private Pension Funds: Defined Benefit PlansBillions of dollars
1988 1989 1990 1991 1992 1993 1994 1995 1996 1997 1998 1999 2000
1 Net acquisition of financial assets 22.3 23.9 -3.2 27.5 11.8 47.8 45.2 -27.2 -40.6 -47.0 -32.4 -23.9 -36.0 1
2 Checkable deposits and currency 1.9 -1.0 -0.5 -0.1 0.0 -0.0 0.8 0.3 0.2 0.4 0.1 0.5 0.3 2 3 Time and savings deposits -3.5 9.6 -5.5 5.5 -9.1 6.4 13.1 4.8 10.8 13.3 0.9 4.3 3.4 3 4 Money market fund shares 0.0 0.0 0.0 0.0 0.0 0.0 0.0 0.0 0.0 0.0 0.0 0.0 0.0 4 5 Security RPs 1.6 0.3 -1.7 1.8 -1.1 -0.0 -4.2 -0.2 3.2 0.3 -0.3 1.2 1.3 5
6 Credit market instruments 28.3 41.6 32.0 12.8 17.1 22.9 35.6 24.1 -8.9 39.7 43.4 39.2 18.8 6
7 Open market paper -3.9 -2.5 -1.7 1.8 -1.1 -0.0 -4.2 -0.2 3.2 0.3 -0.3 1.2 1.3 7 8 U.S. government securities 15.2 29.7 21.1 3.9 0.4 10.4 40.8 6.7 -15.4 12.3 28.7 24.5 15.0 8 9 Treasury 1.7 7.9 0.6 -8.9 -11.0 -5.6 10.1 2.0 -4.6 3.7 -1.8 -0.1 0.2 910 Agency 13.5 21.8 20.5 12.8 11.5 15.9 30.7 4.7 -10.8 8.6 30.5 24.6 14.8 10
11 Corporate and foreign bonds 11.2 8.8 11.2 13.8 20.8 14.0 2.7 17.4 3.1 26.5 13.9 12.6 2.1 1112 Mortgages 5.9 5.6 1.5 -6.8 -3.1 -1.4 -3.7 0.2 0.1 0.6 1.1 0.9 0.4 12
13 Corporate equities -0.4 -22.4 0.2 2.0 8.7 6.8 -3.8 -51.1 -55.3 -100.9 -78.8 -77.0 -67.0 1314 Mutual fund shares -0.6 0.0 0.4 1.4 2.3 4.4 3.7 1.9 -2.2 1.3 1.8 2.4 -0.3 14
15 Miscellaneous assets -5.1 -4.2 -28.0 4.1 -6.1 7.3 0.1 -6.9 11.7 -1.2 0.6 5.5 7.6 1516 Unallocated insurance contracts (1) -15.2 -1.9 -6.2 -2.2 -5.0 -0.6 -5.1 -6.0 2.3 -5.6 1.6 1.9 2.4 1617 Contributions receivable -0.3 4.4 2.8 8.2 5.6 7.4 6.2 -0.3 -0.3 3.5 0.0 0.0 0.0 1718 Other 10.4 -6.8 -24.6 -1.9 -6.7 0.6 -1.0 -0.6 9.7 0.9 -1.0 3.6 5.2 18
(1) Assets of private pension plans held at life insurance companies (e.g., GICs, variable annuities); series begins 1985:Q4.
F.119.c Private Pension Funds: Defined Contribution Plans (1)Billions of dollars
1 Net acquisition of financial assets 46.7 38.7 32.2 66.3 56.6 56.2 45.8 59.4 45.2 35.7 44.1 35.5 53.6 1
2 Checkable deposits and currency 0.9 0.6 -0.3 -0.3 -0.1 0.2 0.1 0.4 0.4 0.8 0.1 0.7 0.4 2 3 Time and savings deposits 14.4 17.9 1.3 0.1 -8.0 -9.9 -6.3 -0.2 -5.5 -5.8 0.5 -8.3 -1.5 3 4 Money market fund shares 2.0 2.9 -0.0 1.0 1.0 6.5 5.3 6.0 10.8 13.1 1.9 11.7 5.9 4 5 Security RPs 0.6 1.8 0.4 1.9 1.3 0.9 -2.0 0.2 1.3 0.6 1.3 -0.8 -0.4 5
6 Credit market instruments -4.7 12.2 14.1 15.2 11.9 16.3 7.8 -4.2 4.8 7.9 13.0 5.7 22.5 6
7 Open market paper -2.2 1.8 1.3 1.4 0.9 0.7 -2.0 0.7 2.4 0.9 3.2 2.5 -3.1 7 8 U.S. government securities 0.5 6.0 3.9 6.2 4.3 2.0 20.3 -1.5 2.1 -0.5 5.8 5.5 11.8 8 9 Treasury -0.3 4.0 1.8 6.1 5.2 3.8 10.2 0.6 1.9 0.4 -2.6 -0.5 -1.0 910 Agency 0.9 2.0 2.1 0.0 -0.9 -1.8 10.2 -2.0 0.2 -0.9 8.4 6.0 12.9 10
11 Corporate and foreign bonds -5.7 3.4 8.7 7.6 7.3 13.8 -9.1 -3.9 -0.2 7.4 3.2 -3.3 12.4 1112 Mortgages 2.6 1.0 0.1 0.1 -0.6 -0.2 -1.4 0.5 0.5 0.1 0.8 1.0 1.3 12
13 Corporate equities 7.2 -11.5 0.7 11.3 28.8 15.1 5.8 -18.4 -16.2 -36.9 -34.2 -15.2 -14.8 1314 Mutual fund shares 0.1 5.1 6.2 9.8 13.0 22.4 20.1 43.1 25.3 41.4 30.0 28.3 32.7 14
15 Miscellaneous assets 26.2 9.7 9.9 27.3 8.8 4.6 15.0 32.6 24.2 14.7 31.4 13.4 8.8 1516 Unallocated insurance contracts (2) 17.0 14.2 15.9 23.0 10.6 12.9 8.9 23.7 12.2 4.6 19.8 11.6 6.7 1617 Contributions receivable -0.9 2.8 3.2 3.9 4.4 4.9 5.5 4.4 4.3 3.6 1.9 1.0 1.0 1718 Other 10.1 -7.3 -9.2 0.4 -6.2 -13.2 0.6 4.5 7.7 6.5 9.7 0.9 1.1 18
(1) Includes 401(k) type plans and the Federal Employees Retirement System Thrift Savings Plan.(2) Assets of private pension plans held at life insurance companies (e.g., GICs, variable annuities); series begins 1985:Q4.
F.225.i Individual Retirement Accounts (IRAs) (1)Billions of dollars
1 Total held at: 50.4 56.9 89.6 67.4 58.5 49.1 53.0 58.5 52.8 68.5 91.7 112.5 117.0 1
2 Commercial banking 11.1 15.6 21.6 16.6 -0.5 -2.9 -1.1 6.5 0.7 0.1 -0.5 -3.4 8.9 2 3 Saving institutions 12.0 7.3 -2.6 -3.8 -8.3 -9.1 -6.3 -1.9 -3.9 -6.0 -5.3 -3.0 -2.3 3 4 Credit unions 1.5 1.9 3.2 3.6 0.9 -0.3 -0.0 1.2 0.9 1.2 0.3 0.9 0.4 4 5 Life insurance companies 8.0 -1.3 4.4 7.1 4.9 12.6 13.2 11.2 10.3 47.5 24.6 41.4 10.1 5 6 Money market mutual funds 5.0 9.0 13.0 -1.0 3.0 6.0 13.0 14.0 15.0 2.0 24.0 22.0 1.0 6 7 Mutual funds 8.0 10.6 10.4 41.7 38.9 59.4 13.5 64.1 49.8 80.3 84.8 81.9 67.3 7 8 Other self-directed accounts 4.7 13.9 39.6 3.2 19.5 -16.6 20.9 -36.5 -20.0 -56.5 -36.2 -27.3 31.4 8
(1) Assets of the household sector (F.100). IRA assets are not included in pension fund reserves (table F.225), except for those at life insurance companies. Figures for depositories (lines 2 through 4) include Keogh accounts. Variable annuities in IRAs are in the life insurance sector (line 5) and are excluded from the mutual fund sector (line 7).

Z.1, December 7, 2001 113
L.119.b Private Pension Funds: Defined Benefit PlansBillions of dollars; amounts outstanding end of period, not seasonally adjusted
1988 1989 1990 1991 1992 1993 1994 1995 1996 1997 1998 1999 2000
1 Total financial assets 812.8 921.5 899.9 1051.7 1079.9 1195.1 1276.0 1460.5 1579.0 1746.8 1900.8 2143.0 2061.6 1
2 Checkable deposits and currency 2.5 1.6 1.0 1.0 1.0 1.0 1.8 2.1 2.2 2.6 2.7 3.2 3.5 2 3 Time and savings deposits 47.3 56.9 51.3 56.8 47.6 54.1 67.1 71.9 82.7 96.0 97.0 101.2 104.7 3 4 Money market fund shares 0.0 0.0 0.0 0.0 0.0 0.0 0.0 0.0 0.0 0.0 0.0 0.0 0.0 4 5 Security RPs 16.5 16.8 15.0 16.9 15.8 15.8 11.6 11.4 14.6 14.9 14.6 15.8 17.1 5
6 Credit market instruments 276.4 318.0 349.9 362.7 379.8 402.7 438.3 462.4 453.5 493.1 536.5 575.8 594.6 6
7 Open market paper 19.2 16.8 15.0 16.9 15.8 15.8 11.6 11.4 14.6 14.9 14.6 15.8 17.1 7 8 U.S. government securities 154.3 184.0 205.1 209.0 209.4 219.8 260.6 267.3 252.0 264.2 293.0 317.5 332.6 8 9 Treasury 85.1 93.0 93.6 84.7 73.7 68.1 78.2 80.2 75.6 79.3 77.5 77.4 77.6 910 Agency 69.2 91.0 111.5 124.3 135.8 151.7 182.4 187.1 176.4 185.0 215.5 240.1 254.9 10
11 Corporate and foreign bonds 90.2 99.0 110.1 123.9 144.7 158.7 161.4 178.8 181.9 208.4 222.3 234.9 237.0 1112 Mortgages 12.6 18.2 19.7 13.0 9.9 8.5 4.7 4.9 5.0 5.6 6.7 7.6 8.0 12
13 Corporate equities 300.6 358.9 341.4 458.6 484.5 555.6 559.9 699.6 785.8 876.0 960.9 1114.0 1008.6 1314 Mutual fund shares 6.5 6.8 6.8 11.4 15.6 22.3 39.0 54.8 63.8 81.4 99.4 126.9 121.8 14
15 Miscellaneous assets 163.0 162.7 134.3 144.3 135.5 143.5 158.2 158.3 176.4 182.6 189.7 206.0 211.3 1516 Unallocated insurance contracts (1) 78.2 80.1 73.6 77.3 69.6 69.7 79.2 80.3 88.9 90.7 98.8 111.4 111.6 1617 Contributions receivable 9.7 14.1 16.9 25.1 30.7 38.0 44.2 43.9 43.6 47.1 47.1 47.2 47.2 1718 Other 75.2 68.4 43.8 41.9 35.2 35.8 34.8 34.2 43.9 44.8 43.8 47.4 52.6 18
(1) Assets of private pension plans held at life insurance companies (e.g., GICs, variable annuities); series begins 1985:Q4.
L.119.c Private Pension Funds: Defined Contribution Plans (1)Billions of dollars; amounts outstanding end of period, not seasonally adjusted
1 Total financial assets 594.7 712.8 734.6 888.0 971.5 1108.4 1183.8 1462.9 1672.1 1999.8 2303.7 2531.0 2525.7 1
2 Checkable deposits and currency 2.0 2.6 2.3 2.0 2.0 2.2 2.3 2.7 3.1 4.0 4.1 4.8 5.2 2 3 Time and savings deposits 39.9 57.8 59.1 59.2 51.1 41.3 35.0 34.7 29.3 23.4 24.0 15.6 14.2 3 4 Money market fund shares 14.8 17.8 17.8 18.8 19.8 26.3 31.6 37.5 48.4 61.4 63.4 75.1 81.0 4 5 Security RPs 6.2 8.1 8.5 10.4 11.6 12.6 10.6 10.7 12.1 12.7 14.0 13.1 12.7 5
6 Credit market instruments 95.5 107.6 121.7 136.9 148.8 165.2 173.0 168.8 173.6 181.5 194.4 200.2 222.6 6
7 Open market paper 8.2 10.0 11.3 12.7 13.6 14.3 12.3 13.0 15.4 16.3 19.5 22.0 18.9 7 8 U.S. government securities 47.8 53.8 57.7 63.9 68.2 70.2 90.5 89.0 91.1 90.7 96.5 102.0 113.8 8 9 Treasury 30.3 34.3 36.1 42.2 47.5 51.2 61.4 62.0 63.8 64.3 61.7 61.1 60.1 910 Agency 17.5 19.5 21.6 21.7 20.7 18.9 29.1 27.1 27.3 26.4 34.8 40.8 53.7 10
11 Corporate and foreign bonds 35.4 38.8 47.5 55.1 62.4 76.2 67.1 63.2 63.0 70.4 73.5 70.3 82.7 1112 Mortgages 4.0 5.1 5.2 5.3 4.7 4.5 3.1 3.6 4.0 4.1 4.9 5.9 7.2 12
13 Corporate equities 214.6 276.6 264.8 348.6 391.5 463.0 459.9 589.6 678.1 820.4 941.3 1042.9 992.5 1314 Mutual fund shares 16.9 26.2 33.7 55.0 80.6 119.9 166.9 272.0 348.5 488.2 609.9 703.1 715.9 14
15 Miscellaneous assets 204.8 216.1 226.8 257.1 266.1 278.0 304.7 346.8 379.1 408.3 452.6 476.2 481.6 1516 Unallocated insurance contracts (2) 108.7 124.6 141.2 167.2 178.0 198.2 218.7 252.0 272.2 291.3 324.0 345.7 349.1 1617 Contributions receivable 9.3 12.2 15.4 19.3 23.7 28.6 34.1 38.5 42.8 46.4 48.3 49.3 50.3 1718 Other 86.7 79.4 70.2 70.6 64.4 51.3 51.9 56.4 64.1 70.6 80.3 81.2 82.2 18
(1) Includes 401(k) type plans and the Federal Employees Retirement System Thrift Savings Plan.(2) Assets of private pension plans held at life insurance companies (e.g., GICs, variable annuities); series begins 1985:Q4.
L.225.i Individual Retirement Accounts (IRAs) (1)Billions of dollars; amounts outstanding end of period, not seasonally adjusted
1 Total held at: 452.0 546.0 637.0 776.0 873.0 993.0 1056.0 1288.0 1467.0 1728.0 2150.0 2663.0 2650.0 1
2 Commercial banking 95.4 111.0 132.6 149.2 148.6 145.8 144.7 151.1 151.9 152.0 151.4 148.0 156.9 2 3 Saving institutions 101.6 108.9 106.3 102.5 94.2 85.1 78.9 76.9 73.0 67.0 61.8 58.7 56.5 3 4 Credit unions 22.4 24.3 27.5 31.1 32.1 31.8 31.8 33.0 33.8 35.0 35.3 36.2 36.7 4 5 Life insurance companies 38.9 37.9 42.0 49.7 55.6 69.5 78.7 94.3 110.3 160.0 190.1 245.5 245.8 5 6 Money market mutual funds 19.0 28.0 41.0 40.0 43.0 49.0 62.0 76.0 91.0 93.0 117.0 139.0 140.0 6 7 Mutual funds 73.4 93.0 97.9 144.0 189.0 265.7 279.4 386.6 489.0 649.0 809.0 1060.0 1048.0 7 8 Other self-directed accounts 101.3 143.0 189.7 259.5 310.5 346.1 380.6 470.1 517.9 572.0 785.4 975.6 966.1 8
(1) Assets of the household sector (L.100), shown at market value. IRA assets are not included in pension fund reserves (table L.225), except for those at life insurance companies. Figures for depositories (lines 2 through 4) include Keogh accounts. Variable annuities in IRAs are in the life insurance sector (line 5) and are excluded from the mutual fund sector (line 7).

114
Z.1, December 7, 2001 Flow of Funds Matrix for 2000(Billions of dollars; All Sectors -- Flows)
Memo:Households State Domestic Instrument National
and Nonprofit Nonfinancial and Local Federal Nonfinancial Rest of Financial All Discrep- Saving andOrganizations Business Governments Government Sectors the World Sectors Sectors ancy Investment
U S U S U S U S U S U S U S U S U
(1) (2) (3) (4) (5) (6) (7) (8) (9) (10) (11) (12) (13) (14) (15) (16) (17) (18)
1 Gross saving and net cap. transfers -- 1028.9 -- 968.1 -- 191.9 -- 305.2 -- 2494.2 -- 429.8 -- 127.8 -- 3051.8 -- 2622.0 2 Capital consumption -- 750.5 -- 774.5 -- 114.9 -- 96.4 -- 1736.3 -- -- -- 96.1 -- 1832.4 -- 1832.4 3 Net saving (1 less 2) -- 313.9 -- 193.6 -- 77.0 -- 208.8 -- 793.3 -- 429.8 -- 31.7 -- 1219.3 -- 789.5
4 Gross investment (5 plus 11) 1000.1 -- 1059.4 -- 220.5 -- 309.9 -- 2589.9 -- 444.0 -- 68.5 -- 3102.4 -- -50.6 2477.4 5 Capital expenditures 1282.5 -- 1186.1 -- 221.8 -- 95.9 -- 2786.2 -- -- -- 135.2 -- 2921.4 -- 130.4 2921.4 6 Consumer durables 835.7 -- -- -- -- -- -- -- 835.7 -- -- -- -- -- 819.6 -- -- 819.6 7 Residential 375.4 -- 49.6 -- -- -- -- -- 425.0 -- -- -- 0.1 -- 425.1 -- -- 425.1 8 Nonresidential 71.4 -- 1086.6 -- 221.8 -- 96.5 -- 1476.2 -- -- -- 135.1 -- 1611.3 -- -- 1611.3 9 Inventory change -- -- 49.4 -- -- -- -- -- 49.4 -- -- -- -- -- 49.4 -- -- 49.410 Access rights from fed. govt. -- -- 0.6 -- -- -- -0.6 -- 0.0 -- -- -- -- -- -- -- -- --
11 Net financial investment -282.4 -- -126.6 -- -1.3 -- 214.0 -- -196.3 -- 444.0 -- -66.7 -- 181.0 -- -181.0 -444.012 Financial uses 285.7 -- 751.3 -- 53.3 -- -57.8 -- 1032.5 -- 940.5 -- 2405.9 -- 4378.9 -- -181.0 496.513 Financial sources -- 568.1 -- 877.9 -- 54.5 -- -271.8 -- 1228.8 -- 496.5 -- 2472.6 -- 4197.9 -- 940.5
14 Gold and off. fgn. exchange -- -- -- -- -- -- -0.6 -- -0.6 -- -0.7 -0.4 0.9 -- -0.4 -0.4 -- -- 15 SDR certificates -- -- -- -- -- -- -- -4.0 -- -4.0 -- -- -4.0 -- -4.0 -4.0 -- -- 16 Treasury currency -- -- -- -- -- -- -- 2.4 -- 2.4 -- -- 3.6 -- 3.6 2.4 -1.2 -- 17 Foreign deposits 7.7 -- -5.4 -- -- -- -- -- 2.3 -- -- 120.8 48.2 -- 50.6 120.8 70.2 -- 18 Interbank claims -- -- -- -- -- -- -- -- -- -- -11.5 -- -26.1 -20.3 -37.7 -20.3 17.4 -- 19 Checkable dep. and currency -42.3 -- 49.1 -- 1.0 -- -65.1 -- -57.2 -- -8.2 -- -16.7 -71.5 -82.1 -71.5 10.7 -- 20 Time and savings deposits 305.2 -- 9.1 -- 9.4 -- 1.0 -- 324.7 -- 5.7 -- -21.3 309.1 309.1 309.1 -- -- 21 Money market fund shares 131.3 -- 50.4 -- -- -- -- -- 181.8 -- -- -- 51.6 233.3 233.3 233.3 -- -- 22 Fed. funds and security RPs -- -- -0.5 -- 9.7 -- -- -- 9.2 -- 5.1 -- -14.6 110.7 -0.4 110.7 111.1 --
23 Credit market instruments -170.0 554.9 8.2 587.2 9.2 27.2 7.3 -295.9 -145.3 873.4 279.3 67.0 1621.8 815.6 1755.9 1755.9 -- -- 24 Open market paper 5.0 -- 0.3 48.1 7.6 -- -- -- 12.9 48.1 8.7 31.7 186.0 127.7 207.6 207.6 -- -- 25 Treasury securities -153.7 -- -11.4 -- -30.6 -- -- -294.9 -195.7 -294.9 -63.0 -- -36.2 -- -294.9 -294.9 -- -- 26 Federal agency securities -11.4 -- 3.1 -- 23.5 -- 0.0 -1.0 15.2 -1.0 152.7 -- 264.6 433.5 432.5 432.5 -- -- 27 Municipal securities 14.6 5.8 10.9 1.4 0.6 28.2 -- -- 26.1 35.3 -- -- 9.3 -- 35.3 35.3 -- -- 28 Corporate and fgn. bonds -25.6 -- -- 171.1 3.7 -- -- -- -21.9 171.1 183.1 25.2 241.0 205.9 402.2 402.2 -- -- 29 Bank loans n.e.c. -- 8.2 -- 94.9 -- -- -- -- -- 103.1 -- 11.3 114.1 -0.3 114.1 114.1 -- -- 30 Other loans and advances -- 16.4 -- 86.2 -- -1.0 8.2 -- 8.2 101.5 -2.2 -1.3 136.7 42.5 142.7 142.7 -- -- 31 Mortgages 1.1 385.7 2.9 185.5 4.5 -- -0.9 0.0 7.7 571.2 -- -- 569.8 6.2 577.4 577.4 -- -- 32 Consumer credit -- 139.0 2.4 -- -- -- -- -- 2.4 139.0 -- -- 136.6 -- 139.0 139.0 -- --
33 Corporate equities -459.5 -- -- -150.6 -1.2 -- -- -- -460.6 -150.6 193.8 99.7 230.6 14.7 -36.2 -36.2 -- -- 34 Mutual fund shares 229.8 -- -1.8 -- 0.8 -- -- -- 228.8 -- -- -- 15.1 243.9 243.9 243.9 -- -- 35 Trade credit -- 5.9 150.4 124.9 -- 27.4 5.3 1.3 155.7 159.5 10.4 1.6 34.0 5.1 200.1 166.1 -34.0 -- 36 Security credit 88.6 7.2 -- -- -- -- -- -- 88.6 7.2 0.0 0.0 57.6 138.9 146.1 146.1 -- --
37 Life insurance reserves 50.2 -- -- -- -- -- -- 1.4 50.2 1.4 -- -- -- 48.7 50.2 50.2 -- -- 38 Pension fund reserves 215.9 -- -- -- -- -- -- 20.9 215.9 20.9 -- -- -- 195.0 215.9 215.9 -- -- 39 Taxes payable -- -- -- 14.4 11.9 -- -4.3 -- 7.6 14.4 -- -- -- 7.3 7.6 21.7 14.1 -- 40 Inv. in bank personal trusts -29.7 -- -- -- -- -- -- -- -29.7 -- -- -- -- -29.7 -29.7 -29.7 -- -- 41 Equity in noncorp. business -46.2 -- -- -74.7 -- -- -- -- -46.2 -74.7 -- -- -- 28.5 -46.2 -46.2 -- -- 42 Miscellaneous 4.7 0.1 491.9 376.8 12.3 -- -1.4 2.0 507.4 378.9 466.6 207.9 425.3 443.4 1399.3 1030.2 -369.2 --
43 Sector discrepancies (1 less 4) 28.9 -- -91.3 -- -28.6 -- -4.6 -- -95.7 -- -14.2 -- 59.3 -- -50.6 -- -50.6 144.5
General notes: U = use of funds; S = source of funds. Domestic nonfinancial sectors (columns 9 and 10) are households and nonprofit organizations, nonfinancial business, state and local governments, and federal government.
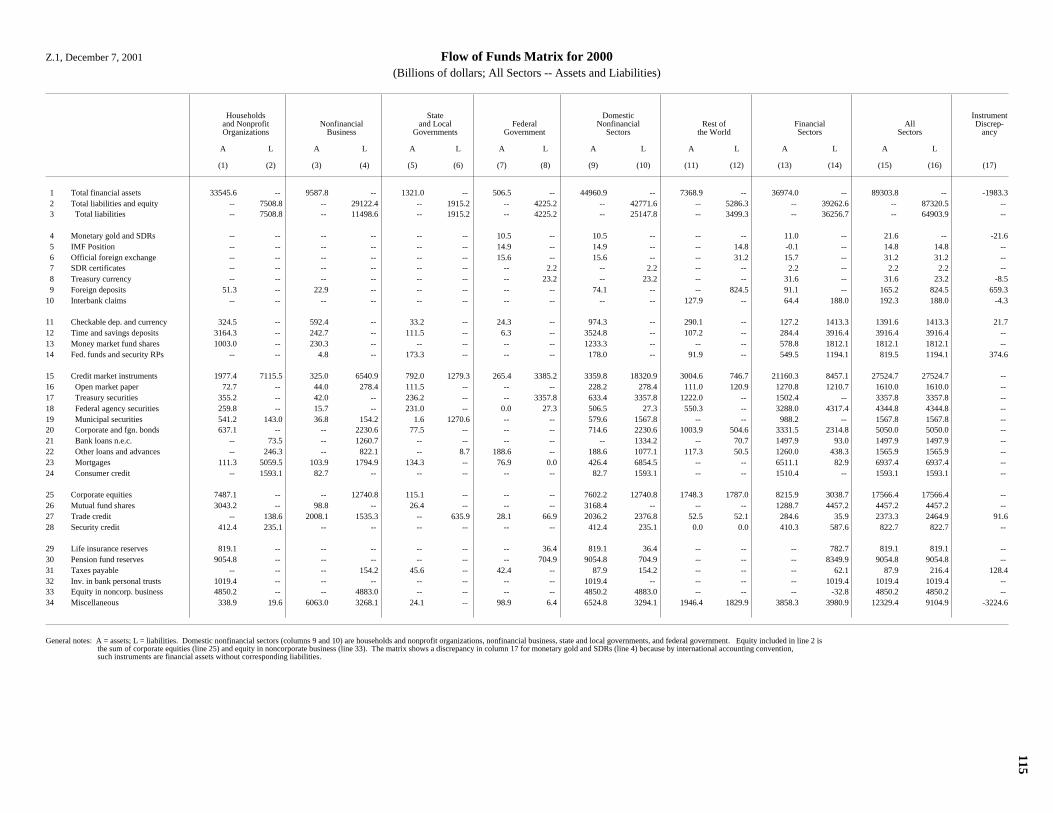
115
Z.1, December 7, 2001 Flow of Funds Matrix for 2000(Billions of dollars; All Sectors -- Assets and Liabilities)
Households State Domestic Instrumentand Nonprofit Nonfinancial and Local Federal Nonfinancial Rest of Financial All Discrep-Organizations Business Governments Government Sectors the World Sectors Sectors ancy
A L A L A L A L A L A L A L A L
(1) (2) (3) (4) (5) (6) (7) (8) (9) (10) (11) (12) (13) (14) (15) (16) (17)
1 Total financial assets 33545.6 -- 9587.8 -- 1321.0 -- 506.5 -- 44960.9 -- 7368.9 -- 36974.0 -- 89303.8 -- -1983.3 2 Total liabilities and equity -- 7508.8 -- 29122.4 -- 1915.2 -- 4225.2 -- 42771.6 -- 5286.3 -- 39262.6 -- 87320.5 -- 3 Total liabilities -- 7508.8 -- 11498.6 -- 1915.2 -- 4225.2 -- 25147.8 -- 3499.3 -- 36256.7 -- 64903.9 --
4 Monetary gold and SDRs -- -- -- -- -- -- 10.5 -- 10.5 -- -- -- 11.0 -- 21.6 -- -21.6 5 IMF Position -- -- -- -- -- -- 14.9 -- 14.9 -- -- 14.8 -0.1 -- 14.8 14.8 -- 6 Official foreign exchange -- -- -- -- -- -- 15.6 -- 15.6 -- -- 31.2 15.7 -- 31.2 31.2 -- 7 SDR certificates -- -- -- -- -- -- -- 2.2 -- 2.2 -- -- 2.2 -- 2.2 2.2 -- 8 Treasury currency -- -- -- -- -- -- -- 23.2 -- 23.2 -- -- 31.6 -- 31.6 23.2 -8.5 9 Foreign deposits 51.3 -- 22.9 -- -- -- -- -- 74.1 -- -- 824.5 91.1 -- 165.2 824.5 659.310 Interbank claims -- -- -- -- -- -- -- -- -- -- 127.9 -- 64.4 188.0 192.3 188.0 -4.3
11 Checkable dep. and currency 324.5 -- 592.4 -- 33.2 -- 24.3 -- 974.3 -- 290.1 -- 127.2 1413.3 1391.6 1413.3 21.712 Time and savings deposits 3164.3 -- 242.7 -- 111.5 -- 6.3 -- 3524.8 -- 107.2 -- 284.4 3916.4 3916.4 3916.4 -- 13 Money market fund shares 1003.0 -- 230.3 -- -- -- -- -- 1233.3 -- -- -- 578.8 1812.1 1812.1 1812.1 -- 14 Fed. funds and security RPs -- -- 4.8 -- 173.3 -- -- -- 178.0 -- 91.9 -- 549.5 1194.1 819.5 1194.1 374.6
15 Credit market instruments 1977.4 7115.5 325.0 6540.9 792.0 1279.3 265.4 3385.2 3359.8 18320.9 3004.6 746.7 21160.3 8457.1 27524.7 27524.7 -- 16 Open market paper 72.7 -- 44.0 278.4 111.5 -- -- -- 228.2 278.4 111.0 120.9 1270.8 1210.7 1610.0 1610.0 -- 17 Treasury securities 355.2 -- 42.0 -- 236.2 -- -- 3357.8 633.4 3357.8 1222.0 -- 1502.4 -- 3357.8 3357.8 -- 18 Federal agency securities 259.8 -- 15.7 -- 231.0 -- 0.0 27.3 506.5 27.3 550.3 -- 3288.0 4317.4 4344.8 4344.8 -- 19 Municipal securities 541.2 143.0 36.8 154.2 1.6 1270.6 -- -- 579.6 1567.8 -- -- 988.2 -- 1567.8 1567.8 -- 20 Corporate and fgn. bonds 637.1 -- -- 2230.6 77.5 -- -- -- 714.6 2230.6 1003.9 504.6 3331.5 2314.8 5050.0 5050.0 -- 21 Bank loans n.e.c. -- 73.5 -- 1260.7 -- -- -- -- -- 1334.2 -- 70.7 1497.9 93.0 1497.9 1497.9 -- 22 Other loans and advances -- 246.3 -- 822.1 -- 8.7 188.6 -- 188.6 1077.1 117.3 50.5 1260.0 438.3 1565.9 1565.9 -- 23 Mortgages 111.3 5059.5 103.9 1794.9 134.3 -- 76.9 0.0 426.4 6854.5 -- -- 6511.1 82.9 6937.4 6937.4 -- 24 Consumer credit -- 1593.1 82.7 -- -- -- -- -- 82.7 1593.1 -- -- 1510.4 -- 1593.1 1593.1 --
25 Corporate equities 7487.1 -- -- 12740.8 115.1 -- -- -- 7602.2 12740.8 1748.3 1787.0 8215.9 3038.7 17566.4 17566.4 -- 26 Mutual fund shares 3043.2 -- 98.8 -- 26.4 -- -- -- 3168.4 -- -- -- 1288.7 4457.2 4457.2 4457.2 -- 27 Trade credit -- 138.6 2008.1 1535.3 -- 635.9 28.1 66.9 2036.2 2376.8 52.5 52.1 284.6 35.9 2373.3 2464.9 91.628 Security credit 412.4 235.1 -- -- -- -- -- -- 412.4 235.1 0.0 0.0 410.3 587.6 822.7 822.7 --
29 Life insurance reserves 819.1 -- -- -- -- -- -- 36.4 819.1 36.4 -- -- -- 782.7 819.1 819.1 -- 30 Pension fund reserves 9054.8 -- -- -- -- -- -- 704.9 9054.8 704.9 -- -- -- 8349.9 9054.8 9054.8 -- 31 Taxes payable -- -- -- 154.2 45.6 -- 42.4 -- 87.9 154.2 -- -- -- 62.1 87.9 216.4 128.432 Inv. in bank personal trusts 1019.4 -- -- -- -- -- -- -- 1019.4 -- -- -- -- 1019.4 1019.4 1019.4 -- 33 Equity in noncorp. business 4850.2 -- -- 4883.0 -- -- -- -- 4850.2 4883.0 -- -- -- -32.8 4850.2 4850.2 -- 34 Miscellaneous 338.9 19.6 6063.0 3268.1 24.1 -- 98.9 6.4 6524.8 3294.1 1946.4 1829.9 3858.3 3980.9 12329.4 9104.9 -3224.6
General notes: A = assets; L = liabilities. Domestic nonfinancial sectors (columns 9 and 10) are households and nonprofit organizations, nonfinancial business, state and local governments, and federal government. Equity included in line 2 is the sum of corporate equities (line 25) and equity in noncorporate business (line 33). The matrix shows a discrepancy in column 17 for monetary gold and SDRs (line 4) because by international accounting convention, such instruments are financial assets without corresponding liabilities.

116 Z.1, December 7, 2001
B.100.e Balance Sheet of Households and Nonprofit Organizations with Equity Detail (1)Billions of dollars; amounts outstanding end of period, not seasonally adjusted
1989 1990 1991 1992 1993 1994 1995 1996 1997 1998 1999 2000
1 Assets 23551.1 24173.9 25827.5 26879.9 28298.8 29252.8 32300.5 35165.6 39326.0 43244.3 48768.3 48828.9 1
2 Tangible assets 9124.4 9326.1 9447.2 9686.6 9908.2 10228.5 10696.7 11189.2 11919.9 12796.4 13796.0 15283.3 2
3 Financial assets 14426.7 14847.7 16380.3 17193.4 18390.7 19024.3 21603.8 23976.5 27406.1 30447.9 34972.3 33545.6 3
4 Deposits 3212.3 3259.3 3253.3 3219.6 3156.0 3109.6 3298.0 3440.7 3622.2 3953.3 4141.0 4543.1 4 5 Credit market instruments 1316.2 1556.3 1634.4 1684.8 1666.4 1953.4 1927.8 2086.8 2031.3 1967.7 2184.5 1977.4 5
6 Equity shares at market value 3361.7 3135.6 4363.2 4896.2 5686.4 5673.2 7622.5 9188.8 11833.7 13784.0 17348.3 15121.0 6
7 Directly held 1946.5 1781.4 2548.7 2869.2 3237.1 3081.7 4160.9 4895.6 6302.5 7259.7 9342.8 7487.1 7
8 Indirectly held 1415.2 1354.2 1814.5 2026.9 2449.3 2591.5 3461.6 4293.2 5531.2 6524.2 8005.4 7633.8 8
9 Bank personal trusts and estates 231.9 214.1 271.7 268.7 262.0 263.6 365.2 432.9 541.7 585.5 682.2 562.3 910 Life insurance companies 59.3 57.8 93.8 113.3 163.5 199.6 274.7 373.3 510.5 665.4 904.4 882.8 1011 Private pension funds 649.6 622.7 840.9 930.7 1100.5 1142.0 1501.8 1720.0 2083.4 2398.2 2786.1 2634.0 1112 Defined benefit plans 361.8 344.0 463.2 490.8 565.5 578.6 729.9 825.9 931.0 1030.0 1208.8 1097.4 1213 Defined contribution plans 287.8 278.6 377.7 439.9 534.9 563.3 771.9 894.1 1152.4 1368.3 1577.3 1536.6 1314 State and local govt. retirement funds 277.8 284.6 379.1 428.5 497.3 507.6 678.9 828.5 1084.8 1233.9 1343.2 1335.1 1415 Mutual funds 196.7 175.1 229.0 285.7 426.0 478.7 641.1 938.5 1310.9 1641.1 2289.6 2219.6 15
16 Other 6536.5 6896.5 7129.5 7392.8 7881.9 8288.1 8755.5 9260.1 9918.9 10742.9 11298.5 11904.2 16
17 Liabilities 3471.6 3746.8 3961.4 4168.4 4440.8 4759.6 5111.0 5445.8 5824.8 6320.9 6921.6 7508.8 17
18 Net worth 20079.4 20427.1 21866.1 22711.5 23858.1 24493.2 27189.5 29719.9 33501.2 36923.4 41846.7 41320.1 18
Memo:
19 Equity shares excluding defined benefit plans 2722.1 2507.0 3521.0 3976.8 4623.6 4587.0 6213.7 7534.4 9818.0 11520.1 14796.3 12688.419 (line 6 minus lines 12 and 14)
Equity shares (line 6) as a percent of20 Total assets (line 1) 14.3 13.0 16.9 18.2 20.1 19.4 23.6 26.1 30.1 31.9 35.6 31.0 2021 Financial assets (line 3) 23.3 21.1 26.6 28.5 30.9 29.8 35.3 38.3 43.2 45.3 49.6 45.1 21
(1) Estimates of equity shares (lines 7 through 15) could differ from other sources owing to alternative definitions of ownership of equity by households. Prior to 1985, all pension assets are assumed to have been in defined benefit plans.