flowable fill for rapid pavement repairdocs.trb.org/prp/11-1893.pdf · 12 flowable fill for rapid...
TRANSCRIPT

1 2 3 4 5 6 7 8 9 10 11
Flowable Fill for Rapid Pavement Repair 12 13
Resubmission Date: October 28, 2010 14 15
Word Count: 4,915 + 2,250 (Figures) 16 17 18
Jonathon R. Griffin - Corresponding 19 U.S. Army Engineer Research and Development Center 20
3909 Halls Ferry Road, Vicksburg, MS 39180 21 Phone: (601) 634-4268 22 Fax: (601) 634-3020 23
[email protected] 24 25
E. Ray Brown 26 U.S. Army Engineer Research and Development Center 27
3909 Halls Ferry Road, Vicksburg, MS 39180 28 Phone: (601) 634-2492 29 Fax: (601) 634-3020 30
[email protected] 31 32 33 34 35 36 37 38 39 40 41 42 43 44
TRB 2011 Annual Meeting Paper revised from original submittal.

J.R. Griffin and E.R. Brown 2
ABSTRACT 1 The federal, state, and local highway authorities in the United States invested $3.9 billion in the 2 rehabilitation of roughly 8,000 miles of pavement in 2008. This significant investment 3 emphasizes the importance of ensuring that rehabilitation techniques perform well to help reduce 4 the high annual cost for repairs. 5
The repair of pavement base layers using compacted lifts of crushed aggregate requires 6 specialized labor and equipment, contributes significantly to total construction time, and is very 7 difficult to perform, particularly in restricted access areas, often resulting in a poorly constructed 8 repair and loss in performance. Flowable fill technology has shown some success when used for 9 backfilling patches and utility cut repairs. 10
The purpose of this paper is to present the performance and cost advantages of using pre-11 blended flowable fill for rapid repair of damaged areas in highway and airfield pavements. 12 Eleven commercially available flowable fill blends were evaluated using both laboratory and 13 field testing methods. The laboratory evaluation consisted of standard material characterization 14 testing including compressive strength, flowability, hardening time, and excavatability. Field 15 testing included constructing and trafficking simulated utility cuts and full-depth patches in 16 existing pavements. An examination of structural capacity, surface deformation, and visible 17 surface distress was conducted for each repair at regular traffic intervals. Additionally, 18 construction time, difficulty, and cost were compared to a traditional aggregate repair. 19
Testing results indicate that backfilling utilities and patches in pavements using flowable 20 fill reduces the potential for premature failure, reduces construction time, and reduces total 21 project cost while increasing repair performance. 22
23 24 25 26 27 28 29 30 31 32 33 34 35 36 37 38 39 40 41 42 43 44 45 46
TRB 2011 Annual Meeting Paper revised from original submittal.

J.R. Griffin and E.R. Brown 3
INTRODUCTION 1 Billions of dollars are spent every year across the U.S. repairing pavements that have failed 2 prematurely [Highway 2009]. The importance of timely maintenance and rehabilitation efforts is 3 well known. However, with the decreasing availability of funds for these activities, timely repair 4 has become more critical than ever to reduce the potential for follow-up repairs. 5
One of the biggest problems in making repairs is the difficulty in achieving adequate 6 density. Site limitations, soil conditions, equipment availability, and laborer experience all 7 impact the ability to achieve required compaction levels [Wu 2007]. Inadequate compaction 8 increases the potential for undesired settlement of the repair, decreasing ride quality and 9 increasing potential for premature failure. 10
Lundvall and Turner [2007] investigated mitigation techniques for pavement settlement 11 above buried culverts and pipes in Wyoming. The researchers determined the early replacement 12 of these facilities results in a significant economic impact in addition to neglecting other 13 pavement needs. The three factors found to increase the probability of settlement included 14 inadequate compaction, inadequate cover of fill, and the use of plastic, compressible soils. The 15 authors recommend backfilling with properly compacted high quality aggregate to reduce 16 settlement potential. When high quality aggregates are not available, or when obtaining adequate 17 compaction is an issue, flowable fill should be considered. 18
Flowable fill is a viscous, grout-like material used in place of traditional compacted 19 aggregate in backfilling operations. Flowable fill is also referred to as controlled low-strength 20 material (CLSM), controlled density fill, soil-cement slurry, soil-cement grout, unshrinkable fill, 21 and K-Krete. Common applications of flowable fill include backfill, structural fill, pavement 22 base, void fill, pipe bedding, and in closure projects for tanks, pipes, and culverts [Riggs 1998]. 23 The material is commonly a blend of portland cement, fine aggregate, water, and waste materials 24 including fly ash, foundry sand, and bottom ash. Chemical admixtures commonly used in 25 portland cement concrete (PCC), such as air-entrainers, water reducers, set accelerators, and 26 retarders, can be used to modify the performance characteristics of flowable fill. The material is 27 self-leveling and self-compacting and possesses other desirable properties including flow under 28 gravity, rapid hardening capability, strength selectability, material uniformity, and reduced 29 construction requirements. 30
Lin et al. [2007] investigated the application of flowable fill as pavement base near 31 limited accessibility areas subjected to heavy truck traffic. Following an investigation of 32 premature pavement failure, it was determined that insufficient compaction near utilities 33 accelerated the development of distress in the pavement. The identified weak areas were 34 excavated to a depth of 500 mm (19.7 in.), flowable fill was used to backfill the excavation, and 35 a stone matrix asphalt (SMA) surface course was placed on top of the flowable fill. After 18-36 months of heavy truck traffic, the repairs showed no visible distress. Flowable fill was noted to 37 be especially useful on bridge approach slabs and around utilities where it is often difficult to fill 38 all of the voids and to achieve target compaction levels. Additionally, when considering material, 39 labor, transportation, and placement costs, the cost of backfilling with flowable fill was found to 40 be 15% lower than when using traditional granular base. The authors determined that when 41 considering performance and cost, flowable fill is an ideal material for problematic pavement 42 areas where vertical deformation is commonly observed. 43
Due to its inherent merits, the Department of Defense (DoD) and most state departments 44 of transportation (DOTs) are already recommending the use of flowable fill in lieu of traditional 45 compacted aggregate backfill in restrictive access areas [Pierce 2004]. However, deviations from 46
TRB 2011 Annual Meeting Paper revised from original submittal.

J.R. Griffin and E.R. Brown 4
expected performance have dissuaded widespread application of the material [Pierce 2004]. The 1 performance of flowable fill is most significantly influenced by the type and proportioning of 2 constituent materials used in the mixture. The development of an effective mix design requires 3 familiarity with locally available materials, knowledge of typical deviations in laboratory and 4 field performance, experience with the effects of mixing and placement techniques, and an 5 iterative trial and error process until a mix with the required properties can be attained. Pre-6 blended commercially available products provide reliable performance without investing in a 7 significant mix design procedure. Typical blends possess high early penetration resistance, low 8 shrinkage and densification potential, ease of construction, excavation capability, resistance to 9 adverse moisture effects, and low comparative cost [Pons 1998]. 10 The objective of this paper is to present the performance and cost advantages of using 11 pre-blended flowable fill for the rapid repair of damaged areas in highway and airfield 12 pavements. This objective was accomplished by analyzing the laboratory test results and field 13 performance of the pre-blended and locally available materials investigated in this study. 14 15 TEST PLAN 16 Eleven flowable fill blends were investigated in this study. Two blends were locally produced 17 ready-mix blends representative of what is typically available; the remaining nine blends were 18 pre-blended commercially available materials. The two primary applications of flowable fill, 19 utility backfill, and full-depth pavement patching, require different performance characteristics. 20 Flowable fill used in backfilling utility trenches has to provide sufficient bearing capacity but 21 also should remain excavatable. Pavement base applications require high strength and rapid-22 setting times to minimize facility closure duration. Of the eleven investigated blends, five are 23 targeted for utility backfill applications, and the remaining six are marketed for rapid pavement 24 repair. The eleven blends evaluated in this study are presented in Table 1. 25 26
TABLE 1 Description of Flowable Fill Blends 27
Material Designation Product Name Manufacturer Application
Product A-1 Low-strength Flowable Fill Vicksburg Ready-Mix (locally available) Utility Backfill
Product A-2 High-strength Flowable Fill Vicksburg Ready-Mix (locally available) Utility Backfill
Product B-1 Flowable Fill Blend ABC Cement Pavement Base Product C-1 Utility Fill 1-Step Buzzi-Unicem USA Utility Backfill Product C-2 High-strength Utility Fill 1-Step Buzzi-Unicem USA Utility Backfill Product C-3 Utility Fill 1-Step 750 Buzzi-Unicem USA Pavement Base Product D-1 Flowable Fill CTS Cement Pavement Base Product D-2 Mil-spec Flowable Fill CTS Cement Pavement Base Product E-1 Flowable Base Custom-Crete Pavement Base Product F-1 Flowable Fill Quikrete Utility Backfill Product F-2 Mil-spec Flowable Fill Quikrete Pavement Base
28 The performance of the flowable fill blends investigated in this study was determined in 29
both the laboratory and in the field. The laboratory investigation was undertaken to determine the 30 key material properties in accordance with standard testing methods. The field study was 31 undertaken to evaluate the performance of the most applicable materials in field repairs including 32
TRB 2011 Annual Meeting Paper revised from original submittal.

J.R. Griffin and E.R. Brown 5
utility trenches and full-depth pavement patches. The testing methodology is presented 1 graphically in Figure 1. 2
3
4 FIGURE 1 Test plan methodology flowchart. 5
6 The laboratory characterization of the investigated blends consisted of determining the 7
compressive strength, flowability (workability), time to initial hardening, and excavatability. The 8 strength, flow, and hardening time tests were conducted in accordance with American Society 9 for Testing and Materials (ASTM) standard test methods including D 4832, Standard Test 10 Method for Preparation and Testing of Controlled Low Strength Material (CLSM) Test 11 Cylinders; D 6103, Standard Test Method for Flow Consistency of Controlled Low Strength 12 Material (CLSM); and D 6024, Standard Test Method for Ball Drop on Controlled Low Strength 13 Material (CLSM) to Determine Suitability for Load Application. 14
The strength or bearing capacity of flowable fill is commonly quantified by measuring 15 the unconfined compressive strength (UCS). Compressive strengths of 50 to 100 psi (345 to 689 16 kPa) are equivalent to the bearing capacity of high quality compacted aggregate [ACI 229 2008]. 17 Flowable fills possess maximum compressive strengths of 1,200 psi (8,268 kPa) or less. Unlike 18 PCC, higher compressive strength is not beneficial for flowable fill. PCC requires a minimum 19 strength to perform properly in structures. Flowable fill requires both a minimum and maximum 20 strength to perform properly. Minimum strength recommendations are to ensure that the 21 flowable fill has adequate bearing capacity and does not deform excessively under load. 22 Maximum strength recommendations are required to ensure that the flowable fill can be 23 excavated [Crouch 2004]. 24
Flowability quantifies the ability of flowable fill to be self-leveling, self-compacting, and 25 to easily flow into confined areas to fill voids. Flowability is a property of flowable fill that 26 separates it from traditional backfilling methods. Flowability is a critical parameter affecting 27 performance and productivity when using flowable fill in engineering applications [Du 2002] 28 and should be designed for and monitored during construction activities. Properly designed 29 flowable fill can flow long distances to fill voids and cavities located in hard-to-reach places. 30 Voids need not be cleaned, as the slurry will fill in irregularities and encapsulate any loose 31 materials [ACI 229 2008]. 32
Hardening time is defined as the time required for a flowable fill mixture to transition 33 from a plastic to a hardened state with sufficient bearing capacity to support the weight of a 34 person [ACI 229 2008]. Factors affecting the hardening time of a flowable fill mixture include: 35
TRB 2011 Annual Meeting Paper revised from original submittal.

J.R. Griffin and E.R. Brown 6
type and quantity of cementitious material employed, permeability of confining material, water 1 content of mixture, mixture proportions, mixture and ambient temperature, humidity, and depth 2 of fill [ACI 229 2008]. Typical hardening times range from one to five hours but can be 3 accelerated by the use of set accelerator admixtures or the substitution of Type III for Type I / II 4 portland cement. Thorough discussion on the selection and application of set accelerating 5 admixtures can be found in Pierce and Ihekweazu (2004). 6
The ability to excavate flowable fill repairs is essential for certain engineering 7 applications. The excavatability of flowable fill mixes is determined by a number of factors 8 including maximum aggregate size, unit weight, compressive strength, and air content. A 9 standard method for directly measuring the excavatability of cured flowable fill does not 10 currently exist. UCS is commonly used as an indicator of excavatability with maximum 11 compressive strengths of 100 to 200 psi (689 to 1,378 kPa) indicating excavatable blends [ACI 12 229 2008]. Hamilton County, Ohio, introduced the concept of removability modulus (RE), which 13 can be used to estimate long-term excavatability [NCHRP 597 2008]. The RE is a function of 14 unconfined compressive strength (C’) and unit weight (w), as shown in Equation 1 in units of psi 15 and pcf, respectively. Unit weight was determined in this investigation using the standard 16 procedures outlined in ASTM D 6023, Standard Test Method for Unit Weight, Yield, Cement 17 Content, and Air Content (Gravimetric) of Controlled Low Strength Material (CLSM). Using the 18 standard method, the density of a blend is determined by measuring the mass of freshly mixed 19 flowable fill required to fill a known volume. 20
21 The proportioning of constituent materials determines the density or unit weight of a 22
flowable fill blend. The unit weight for typical flowable fill blends range from 115 to 145 pcf 23 (1,842 to 2,323 kg/m3). However, when waste materials are used in place of aggregates, unit 24 weights can range from 85 to 110 pcf (1,362 to 1,762 kg/m3) [ACI 229 2008]. Employing air 25 entraining agents or foams can also reduce the density of a blend. 26
Demonstration sections simulating utility cuts and full-depth patches were constructed at 27 the U.S. Army Engineer Research and Development Center (ERDC) in Vicksburg, Mississippi. 28 Three foot by 9-ft (0.92- by 2.75-m) sections were removed from an existing rigid pavement and 29 excavated to a depth of 36 in. (914 mm). The utility cut excavations were backfilled using three 30 pre-blended flowable fill products, two typical flowable fill blends supplied by a local ready-mix 31 producer, and a compacted aggregate backfill using common, locally available material. These 32 materials were selected based on the laboratory test results. The compacted aggregate included 33 in the test was local clay-gravel commonly used for backfill in Mississippi. The cross-section of 34 the simulated utility backfills is presented in Figure 2. 35
(1)
TRB 2011 Annual Meeting Paper revised from original submittal.

J.R. Griffin and E.R. Brown 7
1 FIGURE 2 Existing pavement cross-section (left) and cross-section of simulated utility repair (right). 2
3 Two flowable fills were selected from the six investigated pavement repair blends and 4
used to backfill 10- by 10-ft (3.05- by 3.05-m) simulated full-depth patches. Products C-3 and D-5 2 were selected for the field evaluation based on meeting strength and hardening time 6 requirements. The minimum required compressive strength for base layers underlying a flexible 7 pavement is 750 psi (5,168 kPa) [Soil Stabilization 1994], to provide sufficient support to the 8 flexible pavement layer. Extended hardening times have impeded the widespread application of 9 flowable fill technology [Pierce 2004]. The ability to place a riding surface within an hour of 10 backfill was considered critical for the effective implementation of flowable fill technology for 11 rapid pavement repair [Tingle 2009]. Products C-2 and D-2 were the only investigated materials 12 to provide 750-psi (5,168-kPa) compressive strengths within an hour of placement. The 13 simulated patches were excavated in an existing rigid pavement to a depth of 24 in. (610 mm). 14 The existing subgrade was compacted, and the excavation was backfilled using the selected 15 flowable fill blends. The cross-section of the full-depth patch repairs is presented in Figure 3. 16 17
18 FIGURE 3 Existing pavement cross-section (left) and cross-section of simulated full-depth repair (right). 19
20 The time and difficulty of construction was recorded for both repair scenarios. At the 21
conclusion of a 7-day curing period, the repairs were capped with a 6-in. (152-mm) PCC wearing 22 surface. The investigated materials are intended for rapid repair and can typically be capped 23 immediately following the onset of initial hardening. However, to accommodate logistical issues, 24 the rigid capping surfaces for all of the repairs were placed on the same day, preventing capping 25 of each repair directly after initial hardening. The demonstration sections were trafficked with 26 2,000 passes of a simulated Boeing C-17 Globemaster III aircraft using a single main gear wheel 27 (142 psi (978 kPa)) loaded to 44.9 kips (200 kN), which is roughly 165,000 18-kip (80-kN) 28 equivalent single axle loads (ESALs). The demonstration sections were subjected to structural 29
TRB 2011 Annual Meeting Paper revised from original submittal.

J.R. Griffin and E.R. Brown 8
and visual evaluations to determine the performance of the repair. The excavatability and total 1 in-place cost of each section was determined upon completion of trafficking. 2
3 TEST RESULTS AND ANALYSIS 4 Laboratory Testing 5 The laboratory characterization of the flowable fill blends investigated in this study consisted of 6 measuring the UCS, flowability, hardening time, and density according to ASTM standard 7 methods, and estimating the excavatability by applying the RE equation. The results of the 8 characterization testing are presented in Table 2. 9
10 TABLE 2 Material Characterization Data for Investigated Flowable Fills 11
Material 28-day UCS Flowability Hardening Time Density Removability Designation (psi) (in.) (hours) (pcf) Modulus Product A-1 110 9.5 6.00 126 1.5 Product A-2 140 11.0 4.00 128 1.8 Product B-1 1,070 15.0 0.50 132 5.2 Product C-1 60 ---a 1.75 108 0.9 Product C-2 170 ---a 1.25 112 1.6 Product C-3 640 ---a 0.75 128 3.8 Product D-1 500 9.5 0.75 104 2.5 Product D-2 2,140 10.5 0.50 102 4.9 Product E-1 1,890 8.0 0.50 ---b ---b Product F-1 180 4.0 2.75 110 1.6 Product F-2 520 6.5 1.75 124 3.3 a Not an applicable testing method b Rapid-hardening times prevented collection of density according to standard methods
12 The compressive strength values measured for the investigated flowable fill materials 13
range from 60 to 2,140 psi (413 to 14,745 kPa). As defined in the American Concrete Institute 14 (ACI) manual, the maximum strength of flowable fill is typically 1,200 psi (8,268 kPa), and 15 therefore, Products D-2 and E-1 would be classified as lean concrete materials versus flowable 16 fill. The flowability of products C-1 through C-3 was not measured, because these materials are 17 placed dry and therefore do not exhibit measurable flow. These products are placed by 18 dispensing the dry blend directly into the excavation and metering the required amount of water 19 over the surface of the dry material. 20
ACI suggests that effective flowable fill designs exhibit 8 to 12 in. (203 to 305 mm) of 21 spread when measured using standard methods. Products B-1, F-1, and F-2 were outside of this 22 range; however, Product B-1 was found to be easy to use without segregation or subsidence. The 23 hardening time directly affects the construction time when using the material, and therefore, has 24 a significant impact on project cost. The hardening time for the utility backfill materials ranged 25 from 1.25 to 6 hours. The pavement patch backfill materials exhibited hardening times ranging 26 from 30 to 105 minutes. The calculated RE for the investigated materials ranged from 0.9 to 5.2. 27 Using the UCS as the primary indicator of excavatability, Products A-1, A-2, C-1, C-2, and F-1 28 would be considered to have long-term excavatability. However, when using the RE 29 methodology, only Product C-1 would be considered excavatable. 30
TRB 2011 Annual Meeting Paper revised from original submittal.

J.R. Griffin and E.R. Brown 9
Field Testing 1 Pons et al. [1998] found flowable fill to be an ideal backfill material due to the high-early 2 bearing capacity development, low potential for shrinkage and compression, low economic 3 impact, low construction labor intensity, excavatability, and resistance to detrimental effects of 4 moisture. Advantages of flowable fill over traditional compacted aggregate backfill in 5 construction applications include a reduction in equipment required on site and construction 6 time, increases in worker safety due to reduced exposure to traffic and confined work areas, and 7 reduced settlement potential. 8
The structural capacity of the repair items was determined in this study by measuring the 9 stiffness of the material. Stiffness is defined as the resistance to deflection under a given load. 10 The stiffness can be quantified in terms of impulse stiffness modulus (ISM) determined using a 11 falling-weight deflectometer (FWD). A dynamic load is imparted to the surface of the repair by 12 allowing a given load dropped from a fixed height to impact buffers connected to an 11.8-in. 13 (300-mm) diameter loading plate in contact with the repair surface. The magnitude of the load is 14 measured using a load cell, and the resulting deflection in the repair surface is measured at the 15 center of the loading plate. The ISM is calculated by dividing the imparted load by the resulting 16 deflection. The calculated ISM values for the simulated utility cuts at 0, 11, 96, 776, and 2,000 17 passes and at 0 and 2,000 passes for the full depth pavement repairs are presented in Table 3. 18 19
TABLE 3 ISM Measurements with Increasing Traffic for Utility and Patch Sections 20 Load Passes 0 11 96 776 2,000
Utility Cut Sections ISM (kips/in.) Product A-1 3221 2798 2435 2035 2228 Product A-2 2253 2573 2110 1688 1768 Product C-1 2104 1809 1163 879 1011 Product C-2 2187 2268 1687 1539 1898 Product F-1 2518 2557 1991 1991 1714 Aggregate Base 964 622 161 ---a ---a Patch Sections
Product C-3 3189 NA NA NA 2860 Product D-2 2691 NA NA NA 2194 a Trafficking discontinued due to tire hazard
21 The data shows that the repairs made using flowable fill maintained a significant portion 22
of the structural capacity during the load cycles. However, after 96 passes, traffic was 23 discontinued on the aggregate base repair due to a safety hazard posed by potentially puncturing 24 the aircraft tire on the edge of the repair. 25
A visual survey of the condition of the repair was conducted by determining the 26 pavement condition index (PCI) in accordance with standards established in Unified Facilities 27 Criteria (UFC) 3-260-03, Airfield Pavement Evaluation [2001]. The visual survey records the 28 type, severity, and quantity of typical pavement distresses in the pavement surfacing at regular 29 traffic intervals. Pavements with PCI values between 100 and 70 are considered to be in good 30 condition, between 70 and 55 are considered fair, and less than 55 are considered poor condition 31 pavements. The PCI for the utility trench and full depth patch repairs are presented in Table 4. 32 The most predominate distress observed for the flowable fill repairs was spalling of the edges of 33 the rigid cap. The primary cause of the spalling was likely due to construction practices more 34
TRB 2011 Annual Meeting Paper revised from original submittal.

J.R. Griffin and E.R. Brown 10
than movement of the rigid cap under load. The PCI continued to remain relatively high for all 1 of the flowable fill sections after 2,000 load passes but dropped very low for the section 2 containing the aggregate base due to shattering of the rigid cap after less than 11 load passes. 3
4 TABLE 4 PCI Measurements of Rigid Pavement Surfacing with Increasing Traffic for Utility Sections 5
Load Passes 0 11 96 776 2,000 Utility Cut Sections PCI Product A-1 100 100 100 81 72 Product A-2 100 100 100 86 86 Product C-1 100 100 100 100 100 Product C-2 100 100 100 100 100 Product F-1 100 100 100 100 100 Aggregate Base 100 15 0 ---a ---a Patch Sections
Product C-3 100 NA NA NA 100 Product D-2 100 NA NA NA 100 a Trafficking discontinued due to tire hazard
6 Permanent deformation of a pavement base layer can significantly impact pavement 7
performance, often resulting in increased roughness, reduced level of service, and premature 8 pavement failure. The permanent deformation of the investigated backfill materials was 9 determined at the pavement surface after live loading. The permanent deformation under load 10 was determined by measuring the relative elevation of the repair surface before, after, and at 11 regular intervals during trafficking. There was no change in surface elevation for the utility 12 repair sections using flowable fill (after 2,000 load passes), but there was a significant change in 13 the surface deformation for the section using the aggregate base. The repair backfilled with 14 compacted aggregate depressed 2 in. (51 mm) after 96 load passes. No appreciable deformation 15 was measured for either of the simulated full-depth patch repairs. 16
Prediction of long-term excavatability was attempted in the laboratory investigation by 17 examining the 28-day UCS and calculating the RE. The excavatability of the investigated blends 18 was determined in the field by rubblizing the PCC surface at the conclusion of trafficking and 19 attempting to remove the flowable fill backfill using a pick and shovel. The field ease of 20 excavation analysis found Products C-1, C-2, and F-1 to have long-term excavatability. UCS 21 predictions also included Products A-1 and A-2 that were not excavatable. The RE prediction 22 was more conservative, only predicting Product C-1 to maintain long-term excavatability. 23 24 Construction Efficiency and Cost Analysis 25 The performance benefits of flowable fill as compared to traditional compacted aggregate 26 backfill are well documented [Wu 2007, Lundvall 2007, Lin 2007]; however, the technology 27 presents a number of additional benefits to users including increased worker safety, reduced 28 construction time and labor intensity, and reduced in-place cost. An early application of flowable 29 fill for pipeline bedding revealed that the new technology yielded faster construction time and an 30 overall savings of 40% of the initial budget [Du 2002]. 31
Increased worker safety results from the use of reduced trench widths and worker 32 exposure time. Flowable fill is self-leveling and compacting, eliminating the need for workers or 33 compaction equipment to enter prepared excavations. Additionally, rapid-setting blends reduce 34
TRB 2011 Annual Meeting Paper revised from original submittal.
J.R. Griffin and E.R. Brown 11
the time that traffic control measures are needed and the time workers operate in close proximity 1 to moving traffic on pavement projects. 2
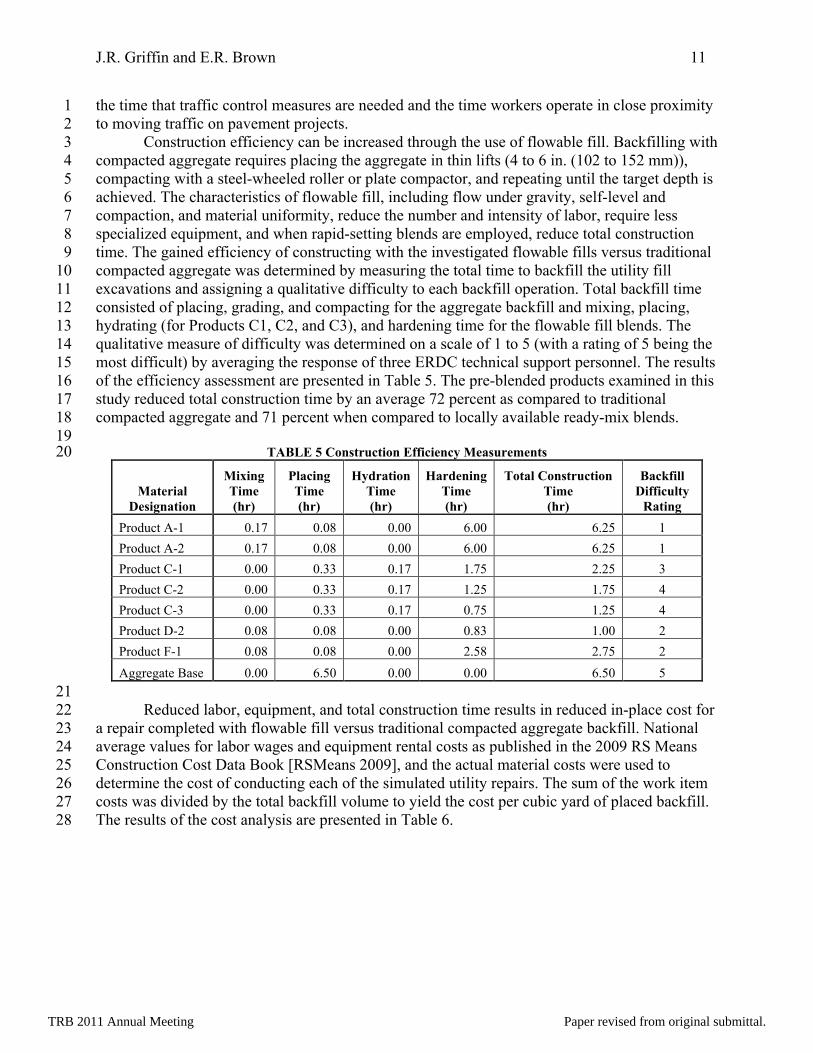
Construction efficiency can be increased through the use of flowable fill. Backfilling with 3 compacted aggregate requires placing the aggregate in thin lifts (4 to 6 in. (102 to 152 mm)), 4 compacting with a steel-wheeled roller or plate compactor, and repeating until the target depth is 5 achieved. The characteristics of flowable fill, including flow under gravity, self-level and 6 compaction, and material uniformity, reduce the number and intensity of labor, require less 7 specialized equipment, and when rapid-setting blends are employed, reduce total construction 8 time. The gained efficiency of constructing with the investigated flowable fills versus traditional 9 compacted aggregate was determined by measuring the total time to backfill the utility fill 10 excavations and assigning a qualitative difficulty to each backfill operation. Total backfill time 11 consisted of placing, grading, and compacting for the aggregate backfill and mixing, placing, 12 hydrating (for Products C1, C2, and C3), and hardening time for the flowable fill blends. The 13 qualitative measure of difficulty was determined on a scale of 1 to 5 (with a rating of 5 being the 14 most difficult) by averaging the response of three ERDC technical support personnel. The results 15 of the efficiency assessment are presented in Table 5. The pre-blended products examined in this 16 study reduced total construction time by an average 72 percent as compared to traditional 17 compacted aggregate and 71 percent when compared to locally available ready-mix blends. 18
19 TABLE 5 Construction Efficiency Measurements 20
Material Designation
Mixing Time (hr)
Placing Time (hr)
Hydration Time (hr)
Hardening Time (hr)
Total Construction Time (hr)
Backfill Difficulty
Rating Product A-1 0.17 0.08 0.00 6.00 6.25 1 Product A-2 0.17 0.08 0.00 6.00 6.25 1 Product C-1 0.00 0.33 0.17 1.75 2.25 3 Product C-2 0.00 0.33 0.17 1.25 1.75 4 Product C-3 0.00 0.33 0.17 0.75 1.25 4 Product D-2 0.08 0.08 0.00 0.83 1.00 2 Product F-1 0.08 0.08 0.00 2.58 2.75 2 Aggregate Base 0.00 6.50 0.00 0.00 6.50 5
21 Reduced labor, equipment, and total construction time results in reduced in-place cost for 22
a repair completed with flowable fill versus traditional compacted aggregate backfill. National 23 average values for labor wages and equipment rental costs as published in the 2009 RS Means 24 Construction Cost Data Book [RSMeans 2009], and the actual material costs were used to 25 determine the cost of conducting each of the simulated utility repairs. The sum of the work item 26 costs was divided by the total backfill volume to yield the cost per cubic yard of placed backfill. 27 The results of the cost analysis are presented in Table 6. 28
TRB 2011 Annual Meeting Paper revised from original submittal.

J.R. Griffin and E.R. Brown 12
TABLE 6 Estimated Major Work Item Costs 1 Material
Designation Total Repair Time
(hr) Material Cost
per yd3 Labor Cost
per yd3 Equipment Cost
per yd3 Total Cost
per yd3 Product A-1 6.25 $66.00 $339.63 $136.50 $542.13 Product A-2 6.25 $75.00 $339.63 $136.50 $551.13 Product C-1 2.25 $435.00 $122.27 $238.66 $795.92 Product C-2 1.75 $435.00 $95.10 $225.27 $755.36 Product C-3 1.25 $435.00 $30.54 $95.27 $560.81 Product D-2 1.00 $400.00 $24.43 $102.08 $526.51 Product F-1 2.75 $283.00 $149.44 $312.11 $744.54 Aggregate Base 6.50 $12.00 $353.21 $279.99 $645.20
2 Material costs for products A-1, A-2, and the aggregate base were very inexpensive as 3 compared to the pre-blended materials. However, rapid setting times and reduced equipment 4 requirements allow for lower labor and equipment costs for the pre-blended materials. 5 Examination of the total cost per cubic yard of backfill shows pre-blended flowable fills with 6 rapid hardening times are the most cost effective of the backfill technologies examined. Locally 7 available ready-mix flowable fill blends were also observed to be relatively inexpensive with 8 reduced material and equipment costs. On average, backfilling with flowable fill was 7% cheaper 9 per cubic yard of flowable fill placed in this investigation. 10 11 CONCLUSIONS AND RECOMMENDATIONS 12 The use of flowable fill in lieu of traditional compacted aggregate for rapid pavement repairs was 13 investigated in this study. Laboratory and field testing was undertaken to characterize and 14 evaluate the performance of nine pre-blended commercially available materials and two locally 15 available ready-mix products. Simulated utility trenches and pavement patches were constructed 16 to evaluate the performance of the material under simulated aircraft loading. Additionally, 17 construction time, effort, and cost were recorded. The following conclusions can be drawn from 18 this investigation: 19
20 • The primary material performance characteristics for flowable fill include UCS, 21
flowability, hardening time, and excavatability. 22 • The standard testing methods used in this study are applicable for measuring the primary 23
material characteristics of flowable fill. 24 • Calculation of RE was found to be a simple and effective method for estimating long-25
term excavatability and should be applied during the mix design process when the 26 removal of the flowable fill material at a later date is required. 27
• All flowable fills provide key material advantages over compacted aggregate; however, 28 pre-blended materials can be employed anywhere without an extensive mixture design 29 process. 30
• Flowable fill reduces the required number and skill set of laborers, eliminates the need 31 for specialized equipment, and allows for reduced excavation dimensions. 32
• Properly designed flowable fills are capable of withstanding numerous passes of high 33 load traffic without a loss of provided support. 34
TRB 2011 Annual Meeting Paper revised from original submittal.

J.R. Griffin and E.R. Brown 13
• Examination of the total in-place cost of utility repairs indicates that project savings 1 ranging from 5 to 40% can be realized through the implementation of flowable fill 2 technology. 3
• The results of this study indicate that repairs backfilled with flowable fill are more easily 4 performed, reduce total construction time, possess greater bearing capacity, and can be 5 completed at a lower cost as compared to traditional compacted aggregate methods. 6
7 Recommendations based upon the research and conclusions drawn from this paper include: 8 9 • Flowable fill should be used in problem areas where site access, equipment and material 10
availability, or problematic soils are an issue. 11 • The techniques and precautions typically observed when working with PCC generally 12
apply to the use of flowable fill. Further guidance on the performance, handling, and 13 safety requirements of a product is available from the material manufacturer. 14
• Care should be exercised when using flowable fill where the surface structure 15 incorporates super-elevation or a crown. The self-leveling nature of the material will 16 result in a flat backfill surface. Deviations can be accommodated using thickened sections 17 of surface material or through the use of forms and a ‘terracing’ approach. 18
• Further research is required for development of accelerated acceptance (QA) methods 19 that are easier to conduct and less conservative than the current standard methods. 20
21 22 23 24 25 26 27 28 29 30 31 32 33 34 35 36 37 38 39 40 41 42 43 44 45 46
TRB 2011 Annual Meeting Paper revised from original submittal.

J.R. Griffin and E.R. Brown 14
ACKNOWLEDGEMENTS 1 The tests described and the resulting data presented herein were obtained from research 2 conducted under the combined forces Airfield Damage Repair (ADR) Civil Engineer 3 Modernization program, sponsored by Headquarters, U.S. Air Force Air Combat Command, by 4 the U.S. Army Engineer Research and Development Center, Waterways Experiment Station. 5 Permission to publish was granted by the Director, Geotechnical and Structures Laboratory, U.S. 6 Army Engineer Research and Development Center. 7 8 9 10 11 12 13 14 15 16 17 18 19 20 21 22 23 24 25 26 27 28 29 30 31 32 33 34 35 36 37 38 39 40 41 42 43 44 45 46
TRB 2011 Annual Meeting Paper revised from original submittal.

J.R. Griffin and E.R. Brown 15
REFERENCES 1 Highway Statistics 2008. Oct. 2009. US Department of Transportation, Federal Highway 2 Administration. 12 May 2010 <http://fhwa.dot.gov/policyinformation/statistics/2008/fa10.cfm>. 3 4 Wu, Jason Y. Soil-Based Flowable Fill for Pipeline Construction. Pipelines 2005. 5 http://www.ascelibrary.org/. 5 November 2007. 6 7 ACI 229R-99: Controlled Low-Strength Materials. ACI Manual of Concrete Practice 2008. Part 8 2. Bischof, Carl R, ed. Farmington Hills: American Concrete Institute, 2008. 6 parts. 9 10 Lundvall, Justin F. and John P. Turner. Mitigation of Roadway Settlement Above Buried 11 Culverts and Pipes. Wyoming Department of Transportation, FHWA/WY – 97/01, 2007. 12 13 Lin, Deng, Huan-Lin Luo, He-Yuan Wang, and Ming-Jui Hung. Successful Application of 14 CLSM on a Weak Pavement Base/Subgrade for Heavy Truck Traffic. Journal of Performance of 15 Constructed Facilities, ASCE, 21:1(70), 2007. 16 17 Riggs, Eugene H. and Keck, Roy H. Specifications and Use of Controlled Low-Strength Material 18 by State Transportation Agencies. The Design and Application of Controlled Low-Strength 19 Materials (Flowable Fill). Howard, Amster K. and Hitch, Jennifer L. Eds. ASTM STP 1331. 20 American Society for Testing and Materials, West Conshohocken, 1998. pp. 296-305. 21 22 Pierce, Charles E. and Stanley Ihekweazu. A Rapid-Setting Controlled Low-Strength Material 23 for Routine and Emergency Rehabilitation of Transportation Facilities. James E. Clyburn 24 University Transportation Center, South Carolina State University, R-03-UTC-Material-USC-25 010, 2004. 26 27 NCHRP Report 597: Development of a Recommended Practice for Use of Controlled Low-28 Strength Material in Highway Construction. National Cooperative Highway Research Program. 29 Washington D.C.: Transportation Research Board, 2008. 30 31 Pons, Fernando, John S. Landwermeyer, and Larry Kerns. Development of Engineering 32 Properties for Regular and Quick-Set Flowable Fill. The Design and Application of Controlled 33 Low-Strength Materials (Flowable Fill). Howard, Amster K. and Hitch, Jennifer L. Eds. ASTM 34 STP 1331. American Society for Testing and Materials, West Conshohocken, 1998. pp. 67-86. 35 36 American Society for Testing and Materials (ASTM). Annual Book of ASTM Standards. West 37 Conshohocken, PA: American Society for Testing and Materials (ASTM), 2006. 38 39 Crouch, L. K., Vernon J. Dotson, Daniel A. Badoe, Richard A. Maxwell, Timothy R. Dunn, and 40 Alan Sparkman. Long Term Study of 23 Excavatable Tennessee Flowable Fill Mixtures. Journal 41 of ASTM International, Vol. 1 (6). ASTM International, West Conshohocken, 2004. 42 43 Du, Lianxiang Kevin J. Folliard, and David Trejo. Effects of Constituent Materials and 44 Quantities on Water Demand and Compressive Strength of Controlled Low-Strength Material. 45
TRB 2011 Annual Meeting Paper revised from original submittal.

J.R. Griffin and E.R. Brown 16
Journal of Materials in Civil Engineering, Vol. 14 (6). American Society of Civil Engineers, 1 2002. pp. 485-495. 2
3 Soil Stabilization for Pavements. Army Technical Manual 5-822-14 / Air Force Manual 32-1019. 4 Departments of the Army, the Navy, and the Air Force, 1994. 5 6 Tingle, Jeb S., Lucy P. Priddy, Micael C. Edwards, Chad A. Gartrell, and Timothy J. McCaffrey. 7 CRATR Limited Operational Utility Assessment 1 (LOUA1), Tyndall Air Force Base, Florida. 8 Technical Report ERDC/GSL TR-09-12. U.S. Army Corps of Engineers, Department of the 9 Army, 2009. 10 11 Airfield Pavement Evaluation. United Facilities Criteria UFCS 3-260-03. Joint Departments of 12 the Air Force, Army, and Navy, 2001. 13 14 RSMeans Costworks. 2009. Reed Construction Data. 8 Jul. 2010 <http://www.meanscostworks 15 .com>. 16
TRB 2011 Annual Meeting Paper revised from original submittal.