flowsense: a natural language interface for visual data
TRANSCRIPT
© 2019 IEEE. This is the author’s version of the article that has been published in IEEE Transactions on Visualization andComputer Graphics. The final version of this record is available at: 10.1109/TVCG.2019.2934668
FlowSense: A Natural Language Interface for Visual DataExploration within a Dataflow System
Bowen Yu and Claudio T. Silva Fellow, IEEE
Show only segments
with a sign of yes2
Show the data
in a map1
Load segment monthly speed3
Link roads with a same segment id from West Village/Alphabet City4
5 Set blue/red color
7 Show speed over time grouped by segment id
6 Merge
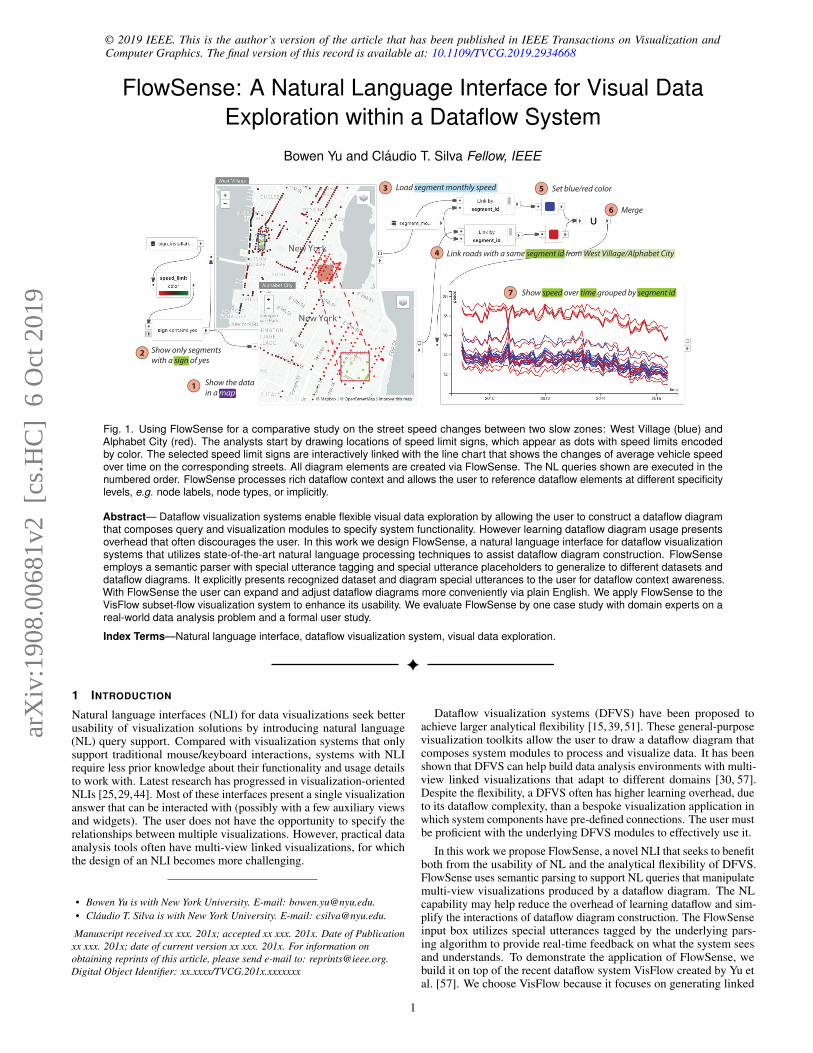
Fig. 1. Using FlowSense for a comparative study on the street speed changes between two slow zones: West Village (blue) andAlphabet City (red). The analysts start by drawing locations of speed limit signs, which appear as dots with speed limits encodedby color. The selected speed limit signs are interactively linked with the line chart that shows the changes of average vehicle speedover time on the corresponding streets. All diagram elements are created via FlowSense. The NL queries shown are executed in thenumbered order. FlowSense processes rich dataflow context and allows the user to reference dataflow elements at different specificitylevels, e.g. node labels, node types, or implicitly.
Abstract— Dataflow visualization systems enable flexible visual data exploration by allowing the user to construct a dataflow diagramthat composes query and visualization modules to specify system functionality. However learning dataflow diagram usage presentsoverhead that often discourages the user. In this work we design FlowSense, a natural language interface for dataflow visualizationsystems that utilizes state-of-the-art natural language processing techniques to assist dataflow diagram construction. FlowSenseemploys a semantic parser with special utterance tagging and special utterance placeholders to generalize to different datasets anddataflow diagrams. It explicitly presents recognized dataset and diagram special utterances to the user for dataflow context awareness.With FlowSense the user can expand and adjust dataflow diagrams more conveniently via plain English. We apply FlowSense to theVisFlow subset-flow visualization system to enhance its usability. We evaluate FlowSense by one case study with domain experts on areal-world data analysis problem and a formal user study.
Index Terms—Natural language interface, dataflow visualization system, visual data exploration.
1 INTRODUCTION
Natural language interfaces (NLI) for data visualizations seek betterusability of visualization solutions by introducing natural language(NL) query support. Compared with visualization systems that onlysupport traditional mouse/keyboard interactions, systems with NLIrequire less prior knowledge about their functionality and usage detailsto work with. Latest research has progressed in visualization-orientedNLIs [25,29,44]. Most of these interfaces present a single visualizationanswer that can be interacted with (possibly with a few auxiliary viewsand widgets). The user does not have the opportunity to specify therelationships between multiple visualizations. However, practical dataanalysis tools often have multi-view linked visualizations, for whichthe design of an NLI becomes more challenging.
• Bowen Yu is with New York University. E-mail: [email protected].• Claudio T. Silva is with New York University. E-mail: [email protected].
Manuscript received xx xxx. 201x; accepted xx xxx. 201x. Date of Publicationxx xxx. 201x; date of current version xx xxx. 201x. For information onobtaining reprints of this article, please send e-mail to: [email protected] Object Identifier: xx.xxxx/TVCG.201x.xxxxxxx
Dataflow visualization systems (DFVS) have been proposed toachieve larger analytical flexibility [15, 39, 51]. These general-purposevisualization toolkits allow the user to draw a dataflow diagram thatcomposes system modules to process and visualize data. It has beenshown that DFVS can help build data analysis environments with multi-view linked visualizations that adapt to different domains [30, 57].Despite the flexibility, a DFVS often has higher learning overhead, dueto its dataflow complexity, than a bespoke visualization application inwhich system components have pre-defined connections. The user mustbe proficient with the underlying DFVS modules to effectively use it.
In this work we propose FlowSense, a novel NLI that seeks to benefitboth from the usability of NL and the analytical flexibility of DFVS.FlowSense uses semantic parsing to support NL queries that manipulatemulti-view visualizations produced by a dataflow diagram. The NLcapability may help reduce the overhead of learning dataflow and sim-plify the interactions of dataflow diagram construction. The FlowSenseinput box utilizes special utterances tagged by the underlying pars-ing algorithm to provide real-time feedback on what the system seesand understands. To demonstrate the application of FlowSense, webuild it on top of the recent dataflow system VisFlow created by Yu etal. [57]. We choose VisFlow because it focuses on generating linked
1
arX
iv:1
908.
0068
1v2
[cs
.HC
] 6
Oct
201
9

visualizations that have good interactivity and support brushing andlinking, which are two essential aspects of visual data exploration. Withthe integration of FlowSense, dataflow diagram editing becomes moreintuitive in VisFlow, and consequently the user can use the DFVS moreefficiently. The contributions of this work are summarized as follows:
1) We propose FlowSense, a novel NLI for visual data explorationwithin a DFVS. FlowSense uses NL to reduce the dataflow learningoverhead and improve the DFVS usability, while taking advantageof the flexibility of a DFVS.
2) We exemplify a generalizable approach of applying state-of-the-artsemantic parsing techniques to create a grammar that is tailored fora DFVS. In particular, FlowSense employs special utterance tag-ging and special utterance placeholders to be aware of the dataflowcontext, and make its grammar independent of datasets, dataflowdiagram elements, and analytical tasks. The identified special utter-ances are presented interactively as the user types the query. Such adesign echoes the underlying parsing state to the user. It not onlyhelps the user understand the query semantics behind the scene, butalso is useful for identifying errors and resolving ambiguity.
3) We demonstrate that FlowSense is able to support NL queries forthe majority of dataflow diagram editing operations in VisFlow. Weshowcase the application of FlowSense by a case study with domainexperts on studying the traffic speed reduction based on NYC taxitrip data. We further conduct a formal user study to evaluate theproposed NLI. We measure the task completion time, collect userfeedback, and analyze the NL query logs to identify the strengthsand weaknesses of FlowSense.
Details on the FlowSense grammar and its implementation can be foundin the appendix and the FlowSense GitHub repository1.
2 RELATED WORK
2.1 Dataflow Visualization System (DFVS)Dataflow systems enable the user to configure system functionalityby drawing a dataflow diagram that defines how the system modulesinteract with each other. While dataflow systems are effective in fieldsother than data visualization such as computational workflow design [2,4, 53], we focus on dataflow systems for visualization purposes inthis section. Previous DFVS have demonstrated the effectiveness ofusing dataflow to render scientific data [28, 39, 51] and manage volumerendering pipelines [15, 37]. Dataflow systems that pass only datasubsets (versus program method arguments) yield simpler dataflowdiagrams and lower learning overhead [42, 43]. ExPlates [30] andVisFlow [57] present embedded visualizations in their dataflow, andfocus on interactive information visualization. Most dataflow systemssupport diagram editing in a drag-and-drop manner. However, it isobserved that even with drag-and-drop interfaces, users may often havedifficulty in translating their intention to system operations [27]. Inthis work we design FlowSense to further simplify dataflow diagramconstruction, so that the user can intuitively use dataflow and make themost of the analytical capability of a DFVS. In particular, we buildFlowSense for VisFlow, as its subset flow model supports many ofthe low-level visual data analysis tasks [12, 45], such as characterizingdistribution, finding extremum, etc.
2.2 NLI for Data VisualizationExtensive research has been devoted to NLIs for decades. These inter-faces address NL queries that otherwise have to be manually translatedto formal query languages, e.g. SQL. A few examples are the interfacesfor querying XML [33], entity-relational database [13, 55], and se-quence translator to SQL [58]. NLIs for data visualizations answer thequeries by presenting visual data representations. Compared with otherinterfaces that simply return a numerical answer or a set of database en-tries, visualization NLIs present results that are more human-readable.Cox et al. [19] design the Sisl service within the InfoStill data analysis
1https://github.com/yubowenok/flowsense
framework. The service asks a series of NL questions to complete anunambiguous query. The Articulate system [49] uses a Graph Rea-soner to select proper visualizations to answer a query. DataTone [25]addresses query ambiguity by showing ambiguity widgets along withthe main visualization so that the user is able to switch to desiredalternative views. Eviza [44] and Evizeon [29] further improve theuser experience by allowing for conversation-like follow-up questions.Fast et al. [22] propose a conversational user interface called Iris thatmay perform analytical tasks and plot data upon requests in dialogues.Kumar et al. [31] also propose a dialogue system for visualization.Orko [47] is an NLI designed for visual exploration of network data.Dhamdhere et al. [21] design Analyza that provides database-based NLquery and visualizations. Srinivasan et al. [48] provide a summary andcomparison of the majority of these NLIs. Several commercial toolsintegrate NLIs. IBM Watson Analytics [3] and Microsoft Power BI [5]provide a list of relevant data and visualizations to an NL question,from which the user may choose to continue an analysis. Wolfram Al-pha [10] supports knowledge-based Q&A and is able to plot the results.ThoughtSpot [8] enables interactive search in a relational database, andprovides multiple types of visualizations for the database. The NLIdesign for data visualization has two challenges: First, modern naturallanguage processing (NLP) techniques cannot yet understand well arbi-trary NL input due to the complex nature of NL. User queries are apt tobe free-form and ambiguous; Second, choosing a proper visualizationto answer an analytical question is non-trivial as there can be multiplepossible visual representations [35].
2.3 Comparison with Other NLIs
FlowSense makes a distinction from the other interfaces as it is to ourbest knowledge the first NLI to address a dataflow context. We set thescope of FlowSense to focus on assisting dataflow diagram construction,rather than to directly answer free-form analytical questions or seek abest visualization for a given query. We believe such an approach isbeneficial in several aspects:Capability: The analytical capability of FlowSense is rooted in the de-sign of the DFVS. The outcome of FlowSense is a complete, interactive,and iterative visual data exploration process supported by the DFVS,rather than a single visualization that only answers one particular queryas in many other interfaces. Dataflow also naturally preserves analysisprovenance [24], allowing the user to frequently revisit and reassess thecurrent workflow. The diagram created by FlowSense explicitly keepsthe user’s preference and intention from previous queries, which mustotherwise be maintained by a model behind the scene [25, 44].Usability: FlowSense integrates real-time presentation of tagged spe-cial utterances in the interface that reflect the state of the underlyingsemantic parser and help the user understand the dataset and dataflowpresent in the system (Sect. 3.2). This is a novel design that facilitatesthe user’s understanding of the NLI behavior, as in most other NLIsthe parsing feedback is only given after the query is submitted. Theauto-completion suggestions of FlowSense also present special utter-ance tags so that the user may better understand the expected querycomponents. Consequently, FlowSense may ease DFVS usage andmake DFVS more accessible. Our case study and user study (Sect. 5)show that FlowSense improves the DFVS usability, and its convenienceis desirable by both novice and experienced VisFlow users. Besides,the DFVS is able to recover from errors more easily as the user alwayshas full control over the system. However in other interfaces the userhas to mostly rely on the behavior of the NLI and can hardly makecorrections in case of misinterpretation.Feasibility: The scope of assisting dataflow diagram construction iswell defined and practicable. Even state-of-the-art NLP techniqueshave limited success in understanding an arbitrary query. Because eachquery is expected to update dataflow diagram and the user decideswhat the system should do and what visual representation to apply,FlowSense can produce more expected results and give better userexperience under a well-defined scope. The mixed-initiative designmitigates the ambiguity problem. The DFVS users in our case studyand user study are all able to understand the scope of FlowSense anduse FlowSense effectively.
2
© 2019 IEEE. This is the author’s version of the article that has been published in IEEE Transactions on Visualization andComputer Graphics. The final version of this record is available at: 10.1109/TVCG.2019.2934668
# Function Sample Queries Description Sample Sub-Diagram
A Visualizing Show a scatterplot of mpgand horsepower
Present the data in a visual-ization
id mpgname
a
b
c chevrolet
buick
amc 15
18
14
Data Source
{a, b, c}
a
b
c
Visualization
B VisualEncoding
Encode mpg by red greencolor scale
Map data attributes to visualchannels
{a, b, c}
Visual Editor
{a, b, c}
a
b
c
Visualization
mpg
CFiltering and
FindingExtremum
Find all cars with mpg be-tween 15 and 20;List five cars with maximummpg
Filter data items and locateextremums and outliers
{a, b, c}15 ≤ mpg ≤ 20
Attribute Filters
{a, c}
{a, b, c}
{a, b, c} {a, c}
max {mpg}{c}
D SubsetManipulation
Merge the cars with thosefrom the scatterplot
Refine and identify interest-ing subsets Union Intersection
U
U
E Highlighting Highlight the selected cars ina parallel coordinates plot
View the characteristics ofone subset among its super-set or another subset
User Selection
Union
a
b
c
Visualization
for Selection
Visual Editora
b
c
Highlighted
Visualization
{a, b, c}
{a, b, c}
{a, b}
{a, b}
U
F Linking Link the cars with a samename from the sales table
Extract primary keys fromone table and find their corre-sponding rows from another(heterogeneous) table
id mpgnamex
y
z chevrolet
buick
amc 15
18
14
Data Source 1
Linker
{a, b}
{x, y, z}{x, y}link name
“amc” or “buick”?
id salename
ab buick
amc 32
Data Source 2
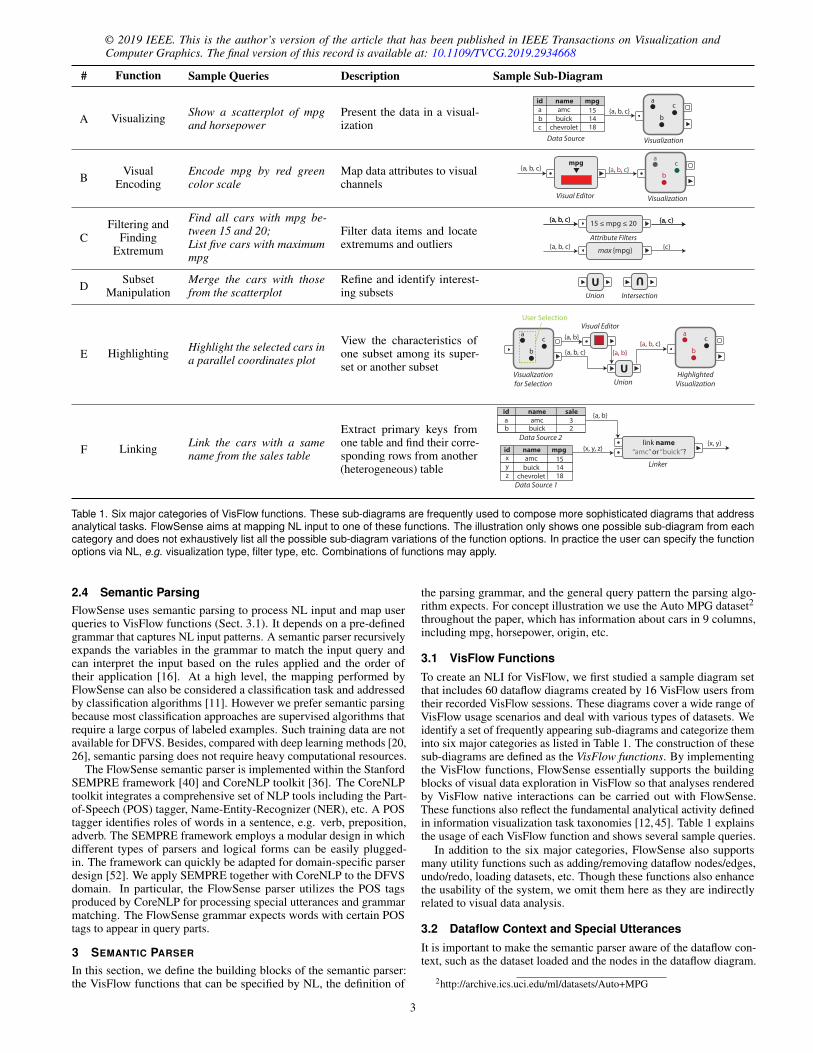
Table 1. Six major categories of VisFlow functions. These sub-diagrams are frequently used to compose more sophisticated diagrams that addressanalytical tasks. FlowSense aims at mapping NL input to one of these functions. The illustration only shows one possible sub-diagram from eachcategory and does not exhaustively list all the possible sub-diagram variations of the function options. In practice the user can specify the functionoptions via NL, e.g. visualization type, filter type, etc. Combinations of functions may apply.
2.4 Semantic ParsingFlowSense uses semantic parsing to process NL input and map userqueries to VisFlow functions (Sect. 3.1). It depends on a pre-definedgrammar that captures NL input patterns. A semantic parser recursivelyexpands the variables in the grammar to match the input query andcan interpret the input based on the rules applied and the order oftheir application [16]. At a high level, the mapping performed byFlowSense can also be considered a classification task and addressedby classification algorithms [11]. However we prefer semantic parsingbecause most classification approaches are supervised algorithms thatrequire a large corpus of labeled examples. Such training data are notavailable for DFVS. Besides, compared with deep learning methods [20,26], semantic parsing does not require heavy computational resources.
The FlowSense semantic parser is implemented within the StanfordSEMPRE framework [40] and CoreNLP toolkit [36]. The CoreNLPtoolkit integrates a comprehensive set of NLP tools including the Part-of-Speech (POS) tagger, Name-Entity-Recognizer (NER), etc. A POStagger identifies roles of words in a sentence, e.g. verb, preposition,adverb. The SEMPRE framework employs a modular design in whichdifferent types of parsers and logical forms can be easily plugged-in. The framework can quickly be adapted for domain-specific parserdesign [52]. We apply SEMPRE together with CoreNLP to the DFVSdomain. In particular, the FlowSense parser utilizes the POS tagsproduced by CoreNLP for processing special utterances and grammarmatching. The FlowSense grammar expects words with certain POStags to appear in query parts.
3 SEMANTIC PARSER
In this section, we define the building blocks of the semantic parser:the VisFlow functions that can be specified by NL, the definition of
the parsing grammar, and the general query pattern the parsing algo-rithm expects. For concept illustration we use the Auto MPG dataset2throughout the paper, which has information about cars in 9 columns,including mpg, horsepower, origin, etc.
3.1 VisFlow FunctionsTo create an NLI for VisFlow, we first studied a sample diagram setthat includes 60 dataflow diagrams created by 16 VisFlow users fromtheir recorded VisFlow sessions. These diagrams cover a wide range ofVisFlow usage scenarios and deal with various types of datasets. Weidentify a set of frequently appearing sub-diagrams and categorize theminto six major categories as listed in Table 1. The construction of thesesub-diagrams are defined as the VisFlow functions. By implementingthe VisFlow functions, FlowSense essentially supports the buildingblocks of visual data exploration in VisFlow so that analyses renderedby VisFlow native interactions can be carried out with FlowSense.These functions also reflect the fundamental analytical activity definedin information visualization task taxonomies [12, 45]. Table 1 explainsthe usage of each VisFlow function and shows several sample queries.
In addition to the six major categories, FlowSense also supportsmany utility functions such as adding/removing dataflow nodes/edges,undo/redo, loading datasets, etc. Though these functions also enhancethe usability of the system, we omit them here as they are indirectlyrelated to visual data analysis.
3.2 Dataflow Context and Special UtterancesIt is important to make the semantic parser aware of the dataflow con-text, such as the dataset loaded and the nodes in the dataflow diagram.
2http://archive.ics.uci.edu/ml/datasets/Auto+MPG
3

Function OptionsFunction Type Port Speci!cation Source Node Target Node
Special Utterances column node label node typecolumn column
VB NN NN NNCC IN DT VBN NNS IN NN IN DT JJ VBZ NNPOS Tags
Visualize mpg, horsepower, and origin of the selected cars from MyChart in a parallel coordinates plot
id mpgnamea
b
c toyota
buick
amc 15
2017
Data Source
{a, b, c}
a
b
c
MyChart
{a, c}
horsepower
190
122
110
origin
AmericanAmerican
JapaneseUser Selection
...
mpg horsepower origin
Parallel Coordinates
<Columns><ShowVerb> <Selection>
<SourceNode>
<NodeType>
<TargetNodeWithNodeType>
<Node>
<SelectionPort>
<SourceWithPort>
<Visualization>
<Preposition><Preposition><Preposition>
<VisualizationFunction>
<VisualizationFunctionWithColumns>
Grammar
Fig. 2. An example FlowSense query and its execution over the Auto MPG dataset. The derivation of the query is shown as a parse tree in themiddle. The sub-diagram expanded by the query is illustrated at the bottom. The five major components of a query pattern are underscored. Eachcomponent and its relevant parts in the parse tree and the dataflow diagram are highlighted by a unique color. The result of executing this query is tocreate a parallel coordinates plot of columns mpg, horsepower, and origin, with its input coming from the selection port of the node labelled MyChart.
FlowSense extracts a special group of tokens called the special utter-ances from NL input. Special utterances are words that refer to entitiesin the dataset or the dataflow diagram. They are the arguments andoperands of VisFlow functions. FlowSense recognizes table columnnames, node labels, node types, and dataset names as special utterances.For the query shown in Fig. 2, FlowSense identifies “mpg”, “horse-power”, and “origin” as table columns, “MyChart” as a node label, and“parallel coordinates” as a node type. The special utterances identi-fied by FlowSense are shown in colored tags in the FlowSense inputbox (Fig. 3). Each distinct color represents one special utterance type:green for table column, light green for node label, purple for node type,and light blue for dataset name. The colors are applied consistentlythroughout the user interface.
3.3 GrammarFlowSense applies a semantic parser to map an NL query to one of theVisFlow functions based on an elaborate grammar designed for thesefunctions. The grammar is context-free [46] and formally defined as a4-tuple G = (V,Σ,R,S). V is a finite set of variables. Σ is a finite set ofterminals. A terminal represents an English word or phrase. R is therule set that defines how a single variable matches an ordered list ofterminals and variables (possibly itself in a recursive rule). Below is anexample rule:
〈Visualization〉 → 〈ShowVerb〉 〈Columns〉 in 〈VisualizationType〉
In this rule, 〈Visualization〉 is a high-level variable that matches a querythat requests a visualization. 〈ShowVerb〉 matches a verb that has ameaning similar to “show”. 〈Columns〉 matches one or more columnsfrom the data. 〈VisualizationType〉 stands for a phrase that describes avisualization metaphor such as scatterplot or parallel coordinates. Thetoken “in” is a terminal symbol that comes from the NL input directly.The example rule above is simplified for the convenience of explanation.In practice, a rule often matches against generic variables rather than aspecific word. S is the start variable that expands to other variables tomatch the whole query.
The grammar of the FlowSense semantic parser attempts to derivean input query by recursively searching for all possible matches (up toa preset limit) of the grammar rules. This procedure is called deriva-tion [16]. FlowSense uses the semantic parsing implementation fromSEMPRE. It also uses the Stanford CoreNLP [36] toolkit that is builtinto SEMPRE for special utterance tagging. The variables and rules(i.e. SEMPRE formulas) are defined in SEMPRE grammar files.
3.3.1 Special Utterance Placeholders
The FlowSense grammar consists of static grammar rules and the spe-cial utterance placeholders. The special utterance placeholders areat runtime dynamically replaced by their corresponding dataflow ele-ments. Therefore, the FlowSense semantic parsing is independent ofthe dataset, the dataflow diagram, and the analytical tasks. The rules aregeneralizable across domains: No new rules need to be created whenthe system switches to new datasets or tasks.
For example, FlowSense uses the generic variable 〈column〉 in itsgrammar as a special utterance placeholder. At runtime, a real col-umn name (e.g. “mpg”) is automatically extracted from the dataset.FlowSense identifies column names on the fly as the user types thequery. “mpg” would show up as a tagged column, and then matchedwith 〈column〉 by the parser. A reverse mapping is performed fromthe placeholder to the particular column after query parsing so that thesystem may operate on that column.
Using special utterances in the grammar has several benefits. First,special utterances enable VisFlow functions to operate on elements thatare important for dataflow diagram editing and visual data exploration.Second, it makes the grammar set small as rules may be written withgeneric variables rather than specific dataset or diagram content. Lastbut not least, the real-time tagging of special utterances provides im-portant feedback to the user about what operations are available in thesystem and how the NLI interprets the query.
3.3.2 Derivation Ambiguity
It is possible to have ambiguity when multiple possible query deriva-tions exist, which can be defined as syntactic ambiguity [25]. Forexample, FlowSense uses wildcard variables to match general tablerow references. Over the Auto MPG dataset, the token “cars” from“Show a plot of cars” describes the user’s understanding of data entitiesbut should be only treated as table rows from the NLI perspective.Meanwhile, the token “horsepower” from “Show a plot of horsepower”is a special utterance and should be treated as a column to visualize.Therefore a wildcard rule that matches “cars” as table rows may alsomatch “horsepower”, resulting in the second query getting improperlyexecuted. We could handle this case by creating a wildcard variablethat rejects a special utterance token. Nevertheless, such a design wouldlead to a larger number of variables and rules in the grammar, which areharder to maintain and develop. Therefore we choose to resolve certainsyntactic ambiguity in the parsing phase with supervised learning ona weight vector w ∈ Rd that gives the probability of derivations based
4
© 2019 IEEE. This is the author’s version of the article that has been published in IEEE Transactions on Visualization andComputer Graphics. The final version of this record is available at: 10.1109/TVCG.2019.2934668
on input utterances. Stochastic gradient descent (SGD) is employedto optimize the multiclass hinge loss objective [50], as introduced byLiang et al. [34] in the SEMPRE framework. The objective is given by:
minw ∑
(x,y)max
y′{w · feature(x,y′)+penalty(y,y′)}−w · feature(x,y)
In the above, x is the input query, y is the preferred derivation, andy′ is a derivation choice. The pair (x,y) is iterated over all trainingdata. The feature of a derivation, feature(x,y), maps the pair (x,y) toa d-dimensional space and is determined by the applied rules in thederivation. penalty(y,y′) is 0 if y = y′ and 1 otherwise. The objectivefunction has a penalty for possible choices of incorrect predictions thatare within a margin of one from the correct predictions. The parser fitsthe training examples by giving intended derivations higher probabilityso that they are preferred in case of ambiguity. In particular, the rulethat expands to a column special utterance will be preferred over arule that expands to a wildcard. Note that we only apply this trainingto facilitate the simplicity of the FlowSense grammar and reduce thenumber of required rules. The training cannot address the ambiguity innatural language itself at large. We were able to use a small trainingset of fewer than twenty examples to guide the preferred derivation incase of syntactic ambiguity for a rule set of around 500 rules. Thisis feasible because the FlowSense rules are independent of data anddataflow diagrams. The training set only needs to guide the semanticparser to focus on certain important grammatical features, such asspecial utterances or word proximity.
3.4 Query PatternThe main goal of FlowSense is to support progressive construction ofdataflow diagrams. We studied the creation process of the VisFlowdiagrams in our sample diagram set and empirically identified a com-mon pattern with five key query components that all VisFlow functionsmay contain: function type, function options, source node(s), targetnode(s), and port specification. This pattern is illustrated in Fig. 2 witha sample query “Visualize mpg, horsepower, and origin of the selectedcars from MyChart in a parallel coordinates plot”. In this query, theverb “visualize” implies applying a visualization function. The threecolumns “mpg, horsepower, and origin” indicate the options (i.e. whatto visualize) for the visualization function. The phrase “from MyChart”tells the system the location of the data to be plotted and providessource node information. The phrase “in a parallel coordinates plot”indicates a new visualization node of the given visualization type is tobe created as the target node. As VisFlow explicitly exports interactivedata selection from visualization nodes, the phrase “selected cars” is aport specification that further describes that the user wants to visualizethe selection from MyChart and the new visualization node should beconnected to the selection output port of MyChart.
The grammar of FlowSense includes a variable hierarchy thatmatches the five key components of an NL query. Fig. 2 illustratesthe parse tree that derives the sample query. The variables involved inthe derivation are shown in the parse tree, in which rule expansionsare bottom-up. A variable may carry information for multiple querycomponents. We design a broad set of variables and rules that are ableto not only accept queries with a particular component order, but alsotheir different arrangements. For instance, “Show mpg and horsepowerin a scatterplot” is equivalent to “Show a scatterplot of mpg and horse-power”. They both can be accepted by FlowSense. FlowSense is alsoable to derive multiple functions from one single query and executetheir combination, e.g. “Show the cars with mpg greater than 15 in ascatterplot” infers both visualization and filtering functions.
A query may not necessarily contain all the five components ex-plicitly. For example, the user may simply say “Show mpg and horse-power” without mentioning any source node or target visualizationtype. FlowSense may automatically locate source and target nodesin its query pattern completion phase (Sect. 4.3). An NL query mayalso contain implicit information, e.g. “Find cars with maximum mpg”intends to perform data filtering to search for cars with the largest mpg
(a) (c)
(b)
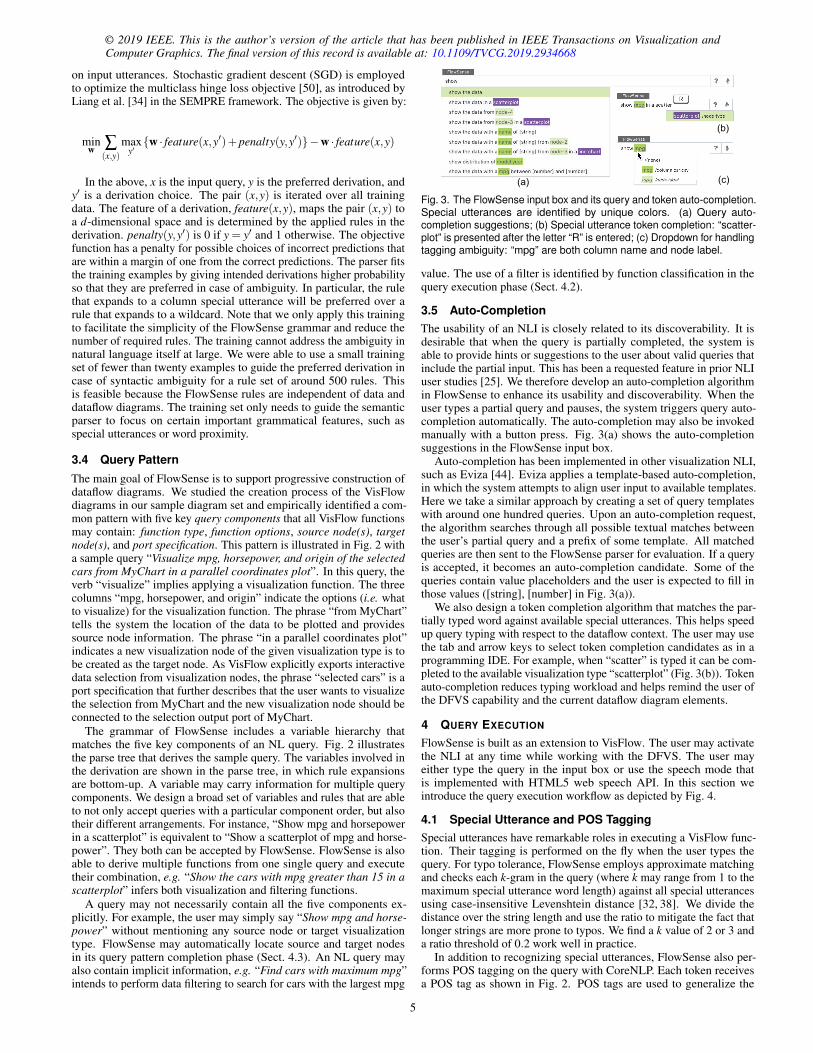
Fig. 3. The FlowSense input box and its query and token auto-completion.Special utterances are identified by unique colors. (a) Query auto-completion suggestions; (b) Special utterance token completion: “scatter-plot” is presented after the letter “R” is entered; (c) Dropdown for handlingtagging ambiguity: “mpg” are both column name and node label.
value. The use of a filter is identified by function classification in thequery execution phase (Sect. 4.2).
3.5 Auto-CompletionThe usability of an NLI is closely related to its discoverability. It isdesirable that when the query is partially completed, the system isable to provide hints or suggestions to the user about valid queries thatinclude the partial input. This has been a requested feature in prior NLIuser studies [25]. We therefore develop an auto-completion algorithmin FlowSense to enhance its usability and discoverability. When theuser types a partial query and pauses, the system triggers query auto-completion automatically. The auto-completion may also be invokedmanually with a button press. Fig. 3(a) shows the auto-completionsuggestions in the FlowSense input box.
Auto-completion has been implemented in other visualization NLI,such as Eviza [44]. Eviza applies a template-based auto-completion,in which the system attempts to align user input to available templates.Here we take a similar approach by creating a set of query templateswith around one hundred queries. Upon an auto-completion request,the algorithm searches through all possible textual matches betweenthe user’s partial query and a prefix of some template. All matchedqueries are then sent to the FlowSense parser for evaluation. If a queryis accepted, it becomes an auto-completion candidate. Some of thequeries contain value placeholders and the user is expected to fill inthose values ([string], [number] in Fig. 3(a)).
We also design a token completion algorithm that matches the par-tially typed word against available special utterances. This helps speedup query typing with respect to the dataflow context. The user may usethe tab and arrow keys to select token completion candidates as in aprogramming IDE. For example, when “scatter” is typed it can be com-pleted to the available visualization type “scatterplot” (Fig. 3(b)). Tokenauto-completion reduces typing workload and helps remind the user ofthe DFVS capability and the current dataflow diagram elements.
4 QUERY EXECUTION
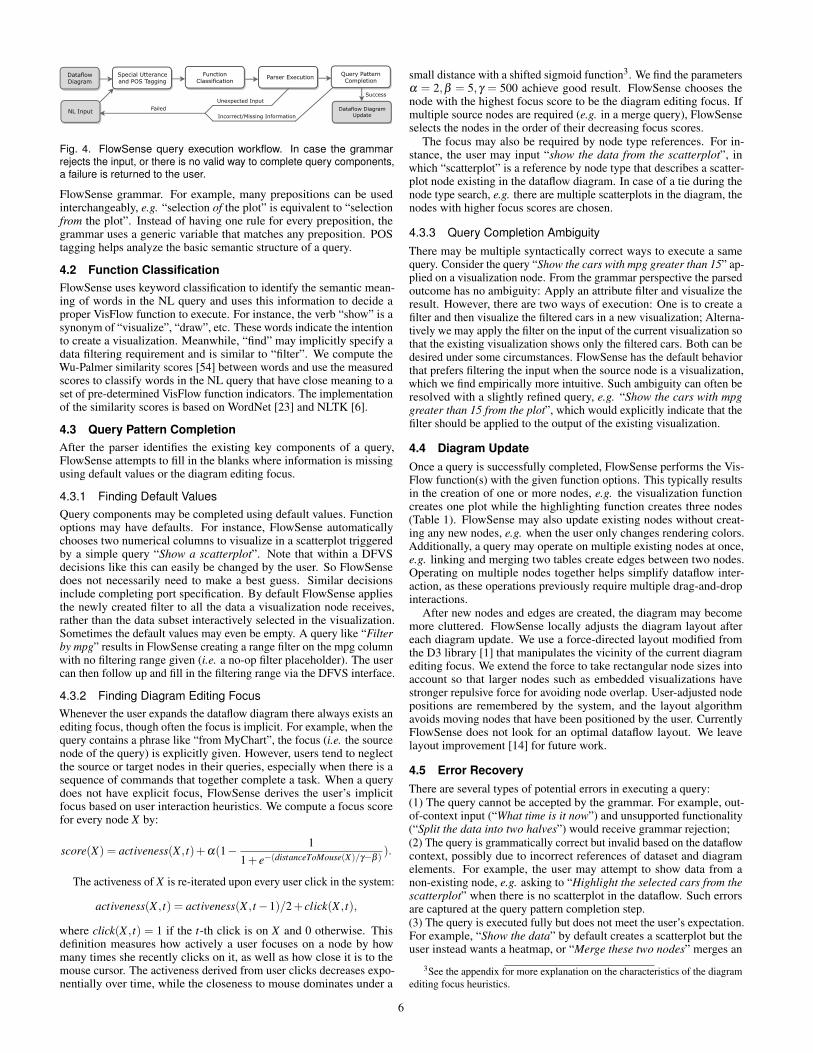
FlowSense is built as an extension to VisFlow. The user may activatethe NLI at any time while working with the DFVS. The user mayeither type the query in the input box or use the speech mode thatis implemented with HTML5 web speech API. In this section weintroduce the query execution workflow as depicted by Fig. 4.
4.1 Special Utterance and POS TaggingSpecial utterances have remarkable roles in executing a VisFlow func-tion. Their tagging is performed on the fly when the user types thequery. For typo tolerance, FlowSense employs approximate matchingand checks each k-gram in the query (where k may range from 1 to themaximum special utterance word length) against all special utterancesusing case-insensitive Levenshtein distance [32, 38]. We divide thedistance over the string length and use the ratio to mitigate the fact thatlonger strings are more prone to typos. We find a k value of 2 or 3 anda ratio threshold of 0.2 work well in practice.
In addition to recognizing special utterances, FlowSense also per-forms POS tagging on the query with CoreNLP. Each token receivesa POS tag as shown in Fig. 2. POS tags are used to generalize the
5
NL Input
Special Utteranceand POS Tagging
DataflowDiagram
Parser ExecutionQuery PatternCompletion
Dataflow DiagramUpdateIncorrect/Missing Information
Unexpected InputSuccess
FunctionClassification
Failed
Fig. 4. FlowSense query execution workflow. In case the grammarrejects the input, or there is no valid way to complete query components,a failure is returned to the user.
FlowSense grammar. For example, many prepositions can be usedinterchangeably, e.g. “selection of the plot” is equivalent to “selectionfrom the plot”. Instead of having one rule for every preposition, thegrammar uses a generic variable that matches any preposition. POStagging helps analyze the basic semantic structure of a query.
4.2 Function ClassificationFlowSense uses keyword classification to identify the semantic mean-ing of words in the NL query and uses this information to decide aproper VisFlow function to execute. For instance, the verb “show” is asynonym of “visualize”, “draw”, etc. These words indicate the intentionto create a visualization. Meanwhile, “find” may implicitly specify adata filtering requirement and is similar to “filter”. We compute theWu-Palmer similarity scores [54] between words and use the measuredscores to classify words in the NL query that have close meaning to aset of pre-determined VisFlow function indicators. The implementationof the similarity scores is based on WordNet [23] and NLTK [6].
4.3 Query Pattern CompletionAfter the parser identifies the existing key components of a query,FlowSense attempts to fill in the blanks where information is missingusing default values or the diagram editing focus.
4.3.1 Finding Default ValuesQuery components may be completed using default values. Functionoptions may have defaults. For instance, FlowSense automaticallychooses two numerical columns to visualize in a scatterplot triggeredby a simple query “Show a scatterplot”. Note that within a DFVSdecisions like this can easily be changed by the user. So FlowSensedoes not necessarily need to make a best guess. Similar decisionsinclude completing port specification. By default FlowSense appliesthe newly created filter to all the data a visualization node receives,rather than the data subset interactively selected in the visualization.Sometimes the default values may even be empty. A query like “Filterby mpg” results in FlowSense creating a range filter on the mpg columnwith no filtering range given (i.e. a no-op filter placeholder). The usercan then follow up and fill in the filtering range via the DFVS interface.
4.3.2 Finding Diagram Editing FocusWhenever the user expands the dataflow diagram there always exists anediting focus, though often the focus is implicit. For example, when thequery contains a phrase like “from MyChart”, the focus (i.e. the sourcenode of the query) is explicitly given. However, users tend to neglectthe source or target nodes in their queries, especially when there is asequence of commands that together complete a task. When a querydoes not have explicit focus, FlowSense derives the user’s implicitfocus based on user interaction heuristics. We compute a focus scorefor every node X by:
score(X) = activeness(X , t)+α(1− 11+ e−(distanceToMouse(X)/γ−β ) ).
The activeness of X is re-iterated upon every user click in the system:
activeness(X , t) = activeness(X , t−1)/2+ click(X , t),
where click(X , t) = 1 if the t-th click is on X and 0 otherwise. Thisdefinition measures how actively a user focuses on a node by howmany times she recently clicks on it, as well as how close it is to themouse cursor. The activeness derived from user clicks decreases expo-nentially over time, while the closeness to mouse dominates under a
small distance with a shifted sigmoid function3. We find the parametersα = 2,β = 5,γ = 500 achieve good result. FlowSense chooses thenode with the highest focus score to be the diagram editing focus. Ifmultiple source nodes are required (e.g. in a merge query), FlowSenseselects the nodes in the order of their decreasing focus scores.
The focus may also be required by node type references. For in-stance, the user may input “show the data from the scatterplot”, inwhich “scatterplot” is a reference by node type that describes a scatter-plot node existing in the dataflow diagram. In case of a tie during thenode type search, e.g. there are multiple scatterplots in the diagram, thenodes with higher focus scores are chosen.
4.3.3 Query Completion AmbiguityThere may be multiple syntactically correct ways to execute a samequery. Consider the query “Show the cars with mpg greater than 15” ap-plied on a visualization node. From the grammar perspective the parsedoutcome has no ambiguity: Apply an attribute filter and visualize theresult. However, there are two ways of execution: One is to create afilter and then visualize the filtered cars in a new visualization; Alterna-tively we may apply the filter on the input of the current visualization sothat the existing visualization shows only the filtered cars. Both can bedesired under some circumstances. FlowSense has the default behaviorthat prefers filtering the input when the source node is a visualization,which we find empirically more intuitive. Such ambiguity can often beresolved with a slightly refined query, e.g. “Show the cars with mpggreater than 15 from the plot”, which would explicitly indicate that thefilter should be applied to the output of the existing visualization.
4.4 Diagram UpdateOnce a query is successfully completed, FlowSense performs the Vis-Flow function(s) with the given function options. This typically resultsin the creation of one or more nodes, e.g. the visualization functioncreates one plot while the highlighting function creates three nodes(Table 1). FlowSense may also update existing nodes without creat-ing any new nodes, e.g. when the user only changes rendering colors.Additionally, a query may operate on multiple existing nodes at once,e.g. linking and merging two tables create edges between two nodes.Operating on multiple nodes together helps simplify dataflow inter-action, as these operations previously require multiple drag-and-dropinteractions.
After new nodes and edges are created, the diagram may becomemore cluttered. FlowSense locally adjusts the diagram layout aftereach diagram update. We use a force-directed layout modified fromthe D3 library [1] that manipulates the vicinity of the current diagramediting focus. We extend the force to take rectangular node sizes intoaccount so that larger nodes such as embedded visualizations havestronger repulsive force for avoiding node overlap. User-adjusted nodepositions are remembered by the system, and the layout algorithmavoids moving nodes that have been positioned by the user. CurrentlyFlowSense does not look for an optimal dataflow layout. We leavelayout improvement [14] for future work.
4.5 Error RecoveryThere are several types of potential errors in executing a query:(1) The query cannot be accepted by the grammar. For example, out-of-context input (“What time is it now”) and unsupported functionality(“Split the data into two halves”) would receive grammar rejection;(2) The query is grammatically correct but invalid based on the dataflowcontext, possibly due to incorrect references of dataset and diagramelements. For example, the user may attempt to show data from anon-existing node, e.g. asking to “Highlight the selected cars from thescatterplot” when there is no scatterplot in the dataflow. Such errorsare captured at the query pattern completion step.(3) The query is executed fully but does not meet the user’s expectation.For example, “Show the data” by default creates a scatterplot but theuser instead wants a heatmap, or “Merge these two nodes” merges an
3See the appendix for more explanation on the characteristics of the diagramediting focus heuristics.
6

© 2019 IEEE. This is the author’s version of the article that has been published in IEEE Transactions on Visualization andComputer Graphics. The final version of this record is available at: 10.1109/TVCG.2019.2934668
Open speed with limits
Encode speed limit by color
Show speed distribution
1
2
3
4 Draw speed over time grouped by speed limit
Fig. 5. Using FlowSense to study the aggregated monthly average vehicle speed on NYC streets with different speed limits. The queries are appliedin the numbered order. The result shows a histogram for speed distribution and a line chart for speed changes over time. Both charts use colorencoding based on the speed limit of the roads. The smaller histogram snapshot shows the speed histogram without color encoding before step 3.
unexpected pair of nodes when “these” appears to be a vague reference(the system chooses two nodes with the highest focus scores).
Upon the first two types of errors the system displays a message andasks for a query correction. For the last type of error it is up to the userto adjust the dataflow diagram. Since the user is simultaneously usingthe underlying VisFlow DFVS while using FlowSense, she alwayshas the flexibility to undo the FlowSense action or to make partialadjustments when the NLI does not yield exactly the desired outcome.
5 EVALUATION
To evaluate the effectiveness of FlowSense, we describe the results ofone case study and one formal user study.
5.1 Speed Reduction Study
We invite several users to try out the FlowSense prototype in differentdata analysis domains and analyze their usage of our NLI. In this paperwe introduce one case study in which we work with two domain expertsin person to address a practical research task using a comprehensiveset of NL queries. The analysts are researching the city regulationissued on November 7, 2014 that reduces the default speed limit onall New York City streets from 30 MPH to 25 MPH. The data containthe estimated average hourly speed [41] for each road segment inManhattan from January 2009 to June 2016. The speed estimation wasperformed based on the TLC yellow taxi records [9] that only havepickup and dropoff information. The analysts are familiar with the data,and the visualizations to be created are similar to the visualizations theypreviously generated for the project using Tableau [7]. However theyhave no prior experience with either VisFlow or FlowSense. We met theanalysts in person and first introduced VisFlow and FlowSense in a 30-minute session. Then we guided the analysts through how FlowSensecan be used to create visualizations to study the speed reduction. Weobserved in this study that almost all the analysts’ visualization requests(excluding those that exceed the scope of the VisFlow subset flow) canbe effectively supported by FlowSense. Here we summarize the NLqueries applied in the speed reduction study.
Initially, the analysts would like to look at the speed reductionimpact at a larger scale. They first load a pre-computed speed table(Fig. 5(1)) with the FlowSense data loading utility function (the analystsknow the dataset name). The table contains the monthly average speedaggregated by the speed limits of the streets. The analysts ask thesystem to present a histogram of speed by “Show speed distribution”(Fig. 5(2)). The first histogram has no color encoding but the analystsare able to immediately add a color scale by “Encode speed limit bycolor”. FlowSense inserts a color mapping node with a red-green colorscale at the input of the histogram (Fig. 5(3)). The histogram showsthe street groups with higher speed limit in green, and lower speedlimit in red. To view the speed changes over time, the analysts use thequery “Draw speed over time grouped by speed limit” (Fig. 5(4)). Thequery result is a line chart showing average speed changes for differentspeed limit groups. The analysts observe that overall there is a speedreduction in all speed limit groups that started around middle 2013.
Seeing the overall trend, the analysts move on to a comparativeanalysis between individual streets from two slow zones. They load and
visualize a table about speed limit sign installation in a map (Fig. 1(1))by “Show the data in a map”. This dataset has for each road segmentin Manhattan its speed limit, geographical location, and whether thestreet has speed limit signs installed (signs are shown as dots in themap). As the slow zones mostly have speed limit signs installed, theanalysts narrow down the data in the map by placing a filter on the“sign” column (Fig. 1(2)). The filtered map reveals two slow zoneneighborhoods with densely located signs: Alphabet City and WestVillage. The analysts apply one map visualization for each zone fora comparison between the two zones. They label the two maps bythe slow zone names and select a few streets from each zone (markedin the maps of Fig. 1). To study the speed changes of these selectedstreets, another table (named “segment monthly speed”, also knownto the analysts) that includes monthly average speed for each roadsegment is added to the diagram (Fig. 1(3)). The analysts then usethe link queries to create a sequence of nodes that extract segment IDsfrom the selected streets and find their monthly average speed fromthe segment monthly speed table (Fig. 1(4)). Blue and red colors areassigned to the streets in West Village and Alphabet City respectivelyto visually differentiate them (Fig. 1(5)). The two groups of streets arethen merged by a subset manipulation function (Fig. 1(6)). Note thatthe query “Merge” only has a single word. It works because the querycompletion of FlowSense automatically locates the recently focusedcolor editors as the source nodes for this query. Finally, the two groupsare rendered together in a speed series visualization (Fig. 1(7)), whichcompares the speed changes between the two groups of streets. Asthe visualizations produced by FlowSense are linked, the analysts caneasily change the street selection in the maps to compare differentgroups of streets.
This case study demonstrates that FlowSense can be applied to apractical, comprehensive analytical task. The generated visualizationsmay guide the analysts towards further data analysis. The analystsparticipating in this study think FlowSense is helpful, especially since itexemplifies how to build VisFlow diagrams and facilitates their learningof the DFVS.
5.2 User Study
We conduct a formal user study to evaluate the effective of FlowSensetogether with the VisFlow framework. Through the user study we vali-date whether a user is able to smoothly apply FlowSense for dataflowdiagram construction, and how well FlowSense responses meet theuser’s expectation. We design an experiment that introduces FlowSenseand VisFlow to the participant and assigns analytical tasks to be solvedwithin the system.
5.2.1 Experiment Overview
The user study is carried out in a fully automated manner using anonline system with step-by-step instructions. The participants join thestudy using a web browser on their own machines. Participants mayask the experiment assistant for help and clarification via web chat orphone call during the experiment session.
We recruited 17 participants (11 male, 6 female, all with an agebetween 20 and 30) who work or study in the field of computer science.
7

12 participants have a data visualization background. 9 are graduate stu-dents, and the other 8 are professionals (software engineer, researcher,faculty). 3 participants have prior experience with VisFlow. No par-ticipants have prior knowledge about FlowSense. The participants arechosen to have a variety of specialities so as to represent potentialDFVS users. The participant group includes visualization designers,data scientists, and software engineers who share data analysis interestbut have different skill sets. The study is structured into two phases:Tutorial Phase. The participant completes a tutorial of the VisFlowdataflow framework, and then a tutorial of the FlowSense NLI. Aftereach tutorial, the participant is asked to complete the tutorial diagramto demonstrate familiarity with the introduced tool. Each tutorial isexpected to take 10 to 20 minutes. After the tutorials there is an on-demand practice session with a flexible duration.Task Phase. The participant explores an SDE Test dataset and con-structs dataflow diagrams using FlowSense and VisFlow to answer ques-tions about the data. The participant is encouraged to use FlowSenseas much as possible. The usage of the NLI is not enforced because thegoal of the NLI design is to improve the user experience of the DFVS,rather than to completely replace the traditional DFVS interactions(which is likely infeasible). The entire task phase is expected to take30 to 60 minutes.
At the end of the study, the participant takes a survey to give com-ments and quantitative feedback about FlowSense and VisFlow.
5.2.2 Dataset and TasksThe SDE Test dataset includes the test results of software developmentengineer (SDE) candidates stored in two tables. The first table describesthe test results for each candidate. A test consists of answering severalmulti-choice questions selected by the system from a large questionpool. Each question has a unique ID, a pre-determined difficulty, itssupported programming language(s), and possibly a time limit. Foreach question, the candidate receives a result (correct, wrong, skipped,unanswered)4. The dataset also has a “TimeTaken” column that storeshow much time a candidate took to answer a question. The secondtable includes background information about each candidate, such asthe candidate’s highest degree level, field of study, and institution. Wegive three analytical tasks about this dataset. The tasks are designed toreflect common tasks performed in visual data exploration:(T1) Overview Task. The participant is asked to visualize the overviewdistribution of the question answering results, and figure out the totalnumber of questions that were skipped, and the percentage of a questionbeing answered correctly.(T2) Outlier Task. The participant is first asked to find a candidatewith an outlier background information value (who incorrectly enteredthe current year “2018” in place of his own information). Then theparticipant is asked to investigate a data recording discrepancy regard-ing the “TimeTaken” column: Some of the “TimeTaken” values areerroneously large numbers when a question is unanswered.(T3) Comprehensive Task. The participant is asked to identify onequestion that Masters candidates answer significantly better than Bache-lors candidates. This task requires comprehensive usage of the dataflowfeatures: attribute filtering, brushing, and heterogeneous table linking.
All the three tasks have definitive correct answers to ensure that par-ticipants explore the data and draw conclusions reasonably. Each userstudy session is logged with anonymous full diagram editing history.We analyze the study results based on task answers and completiontime, comments and quantitative feedback, and NL query logs.
5.2.3 Task Completion QualityFig. 6(a) shows the verdict distribution of the participants’ answers. Itcan be seen that the majority of the participants were able to come upwith the correct answers to the tasks. Fig. 6(b) shows the completiontime distribution for each step of the user study.
It can be observed that the time taken for the tutorials and tasks aremostly as expected. Yet the time required for a task increases when thetask involves heterogeneous tables and interactive data filtering to find
4See the appendix for additional remarks and results of the user study.
03
14
12
14
31
13
10
16
21
14
0
5
10
15
T1Skipped#
T1Correct%
T2Candidate
T2TimeTaken
T3Question
Count
VerdictCorrectIncorrectUnanswered
(a)
Task3
Task2
Task1
FlowSenseTutorial
VisFlowTutorial
0 20 40 60Time (minutes)
(b)
Fig. 6. (a) Verdict distribution of participant answers to each of the userstudy tasks. (b) Box plot of completion time for each user study step4.
solutions (T3). After reading the user comments in the feedback, webelieve this may be due to the fact that many participants are first-timeVisFlow users and need to digest the concept of the VisFlow subset flowmodel. In particular, linking heterogeneous tables can be challenging tounderstand at first. However, most users were able to get the idea andformulate a solution. This is reflected by one of the feedback comments:“The linker functions are confusing at first. But after experimenting withthe tool for a while and getting to know how they work, things becomeeasier.” We believe such a learning curve is natural for DFVS.
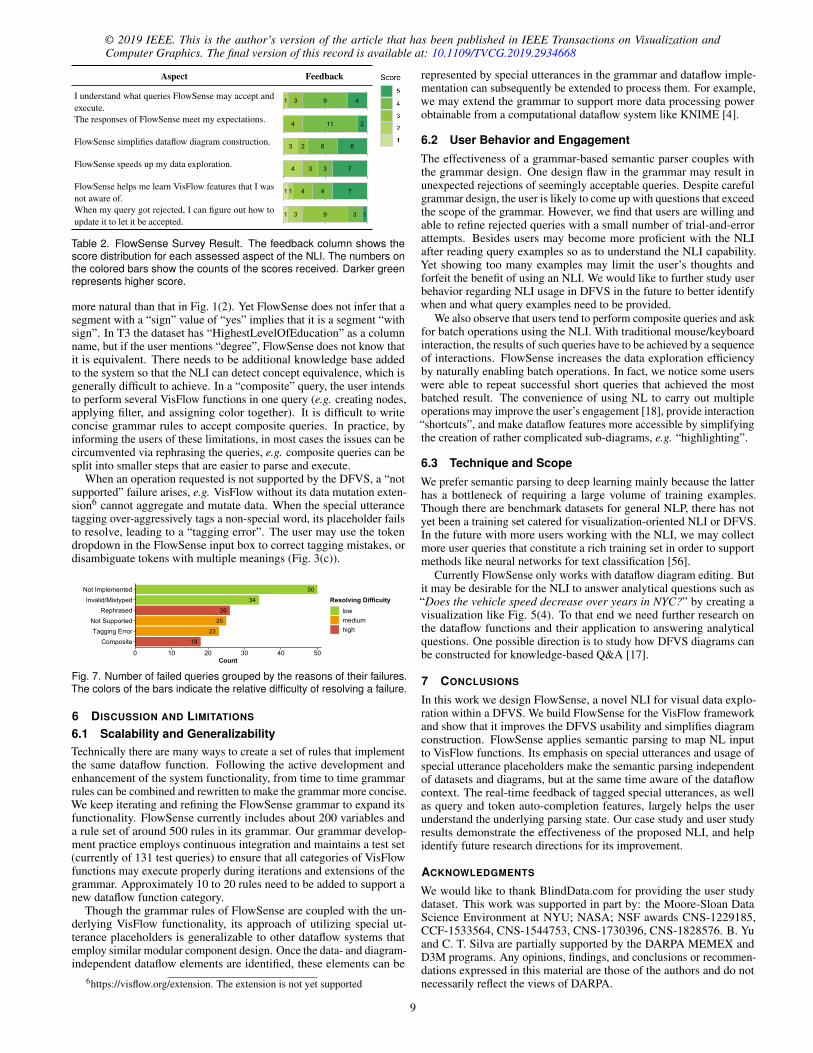
5.2.4 Quantitative FeedbackWe ask for feedback on six aspects regarding FlowSense (and alsoVisFlow4) in our survey. Each aspect is presented with a statementand a 1–5 Likert scale for the participant to express agreement (5) ordisagreement (1). Table 2 lists the feedback for the FlowSense NLI. Thequantitative feedback shows that most users were able to understandthe scope of FlowSense, and apply it for dataflow diagram construction.The users were also asked to compare the NLI-assisted dataflow usageagainst their earlier experience in the tutorial phase with the standaloneVisFlow framework. Twelve users agree (with a feedback score of atleast 4) that FlowSense simplifies the diagram construction, and tenusers agree that FlowSense speeds up the data exploration.
The feedback also reveals space for improving the NLI. In particular,it is unclear to most users how to update a rejected query to makeit accepted. It may be helpful to design an algorithm that providessuggested corrections or changes to a failed query. However, this istechnically challenging as changing minimally a query to fit it into theparse tree is algorithmically non-trivial. We would like to leave querycorrection suggestions for future work.
5.2.5 Query Log AnalysisTo closely study where FlowSense does not accept a query, we manuallywent over the rejected queries and categorized each rejected query by itsreason of rejection. Overall, we analyzed 649 queries, out of which 421were accepted by FlowSense. Excluding the 34 invalid and mistypedqueries, the raw acceptance rate was 68.455%. We found some of therejection issues straightforward to resolve: the requested functionalitywas not implemented, bugs in the query execution code, etc. We wereable to fix those issues in a short iteration of the NLI implementation,resolving 34 “not implemented” queries and 18 software bugs. Theimproved acceptance rate would be 76.911%. In general, it requiressystematic engineering efforts to thoroughly increase query coveragefor the “not implemented” category, which is beyond the scope of thispaper. The remaining unresolved failures are summarized in Fig. 7 withtheir counts5.
Some of those failures are more challenging to resolve. Specifically,FlowSense does not make logical inferences and deals only with the rawvalues in the data. If the user rephrases the query by natural languagevariation or implication (26 occurrences in Fig. 7), the query wouldbe difficult to parse. The query “Show only segments with signs” is
5See the appendix for the detailed definition and examples for each category.
8
© 2019 IEEE. This is the author’s version of the article that has been published in IEEE Transactions on Visualization andComputer Graphics. The final version of this record is available at: 10.1109/TVCG.2019.2934668
Aspect Feedback
I understand what queries FlowSense may accept andexecute.
1 3 9 4
The responses of FlowSense meet my expectations. 4 11 2
FlowSense simplifies dataflow diagram construction. 3 2 6 6
FlowSense speeds up my data exploration. 4 3 3 7
FlowSense helps me learn VisFlow features that I wasnot aware of.
1 1 4 4 7
When my query got rejected, I can figure out how toupdate it to let it be accepted.
1 3 9 3 1
Table 2. FlowSense Survey Result. The feedback column shows thescore distribution for each assessed aspect of the NLI. The numbers onthe colored bars show the counts of the scores received. Darker greenrepresents higher score.
more natural than that in Fig. 1(2). Yet FlowSense does not infer that asegment with a “sign” value of “yes” implies that it is a segment “withsign”. In T3 the dataset has “HighestLevelOfEducation” as a columnname, but if the user mentions “degree”, FlowSense does not know thatit is equivalent. There needs to be additional knowledge base addedto the system so that the NLI can detect concept equivalence, which isgenerally difficult to achieve. In a “composite” query, the user intendsto perform several VisFlow functions in one query (e.g. creating nodes,applying filter, and assigning color together). It is difficult to writeconcise grammar rules to accept composite queries. In practice, byinforming the users of these limitations, in most cases the issues can becircumvented via rephrasing the queries, e.g. composite queries can besplit into smaller steps that are easier to parse and execute.
When an operation requested is not supported by the DFVS, a “notsupported” failure arises, e.g. VisFlow without its data mutation exten-sion6 cannot aggregate and mutate data. When the special utterancetagging over-aggressively tags a non-special word, its placeholder failsto resolve, leading to a “tagging error”. The user may use the tokendropdown in the FlowSense input box to correct tagging mistakes, ordisambiguate tokens with multiple meanings (Fig. 3(c)).
50
34
25
23
26
18CompositeTagging Error
Not SupportedRephrased
Invalid/MistypedNot Implemented
0 10 20 30 40 50Count
Resolving Difficultylowmediumhigh
Fig. 7. Number of failed queries grouped by the reasons of their failures.The colors of the bars indicate the relative difficulty of resolving a failure.
6 DISCUSSION AND LIMITATIONS
6.1 Scalability and GeneralizabilityTechnically there are many ways to create a set of rules that implementthe same dataflow function. Following the active development andenhancement of the system functionality, from time to time grammarrules can be combined and rewritten to make the grammar more concise.We keep iterating and refining the FlowSense grammar to expand itsfunctionality. FlowSense currently includes about 200 variables anda rule set of around 500 rules in its grammar. Our grammar develop-ment practice employs continuous integration and maintains a test set(currently of 131 test queries) to ensure that all categories of VisFlowfunctions may execute properly during iterations and extensions of thegrammar. Approximately 10 to 20 rules need to be added to support anew dataflow function category.
Though the grammar rules of FlowSense are coupled with the un-derlying VisFlow functionality, its approach of utilizing special ut-terance placeholders is generalizable to other dataflow systems thatemploy similar modular component design. Once the data- and diagram-independent dataflow elements are identified, these elements can be
6https://visflow.org/extension. The extension is not yet supported
represented by special utterances in the grammar and dataflow imple-mentation can subsequently be extended to process them. For example,we may extend the grammar to support more data processing powerobtainable from a computational dataflow system like KNIME [4].
6.2 User Behavior and EngagementThe effectiveness of a grammar-based semantic parser couples withthe grammar design. One design flaw in the grammar may result inunexpected rejections of seemingly acceptable queries. Despite carefulgrammar design, the user is likely to come up with questions that exceedthe scope of the grammar. However, we find that users are willing andable to refine rejected queries with a small number of trial-and-errorattempts. Besides users may become more proficient with the NLIafter reading query examples so as to understand the NLI capability.Yet showing too many examples may limit the user’s thoughts andforfeit the benefit of using an NLI. We would like to further study userbehavior regarding NLI usage in DFVS in the future to better identifywhen and what query examples need to be provided.
We also observe that users tend to perform composite queries and askfor batch operations using the NLI. With traditional mouse/keyboardinteraction, the results of such queries have to be achieved by a sequenceof interactions. FlowSense increases the data exploration efficiencyby naturally enabling batch operations. In fact, we notice some userswere able to repeat successful short queries that achieved the mostbatched result. The convenience of using NL to carry out multipleoperations may improve the user’s engagement [18], provide interaction“shortcuts”, and make dataflow features more accessible by simplifyingthe creation of rather complicated sub-diagrams, e.g. “highlighting”.
6.3 Technique and ScopeWe prefer semantic parsing to deep learning mainly because the latterhas a bottleneck of requiring a large volume of training examples.Though there are benchmark datasets for general NLP, there has notyet been a training set catered for visualization-oriented NLI or DFVS.In the future with more users working with the NLI, we may collectmore user queries that constitute a rich training set in order to supportmethods like neural networks for text classification [56].
Currently FlowSense only works with dataflow diagram editing. Butit may be desirable for the NLI to answer analytical questions such as“Does the vehicle speed decrease over years in NYC?” by creating avisualization like Fig. 5(4). To that end we need further research onthe dataflow functions and their application to answering analyticalquestions. One possible direction is to study how DFVS diagrams canbe constructed for knowledge-based Q&A [17].
7 CONCLUSIONS
In this work we design FlowSense, a novel NLI for visual data explo-ration within a DFVS. We build FlowSense for the VisFlow frameworkand show that it improves the DFVS usability and simplifies diagramconstruction. FlowSense applies semantic parsing to map NL inputto VisFlow functions. Its emphasis on special utterances and usage ofspecial utterance placeholders make the semantic parsing independentof datasets and diagrams, but at the same time aware of the dataflowcontext. The real-time feedback of tagged special utterances, as wellas query and token auto-completion features, largely helps the userunderstand the underlying parsing state. Our case study and user studyresults demonstrate the effectiveness of the proposed NLI, and helpidentify future research directions for its improvement.
ACKNOWLEDGMENTS
We would like to thank BlindData.com for providing the user studydataset. This work was supported in part by: the Moore-Sloan DataScience Environment at NYU; NASA; NSF awards CNS-1229185,CCF-1533564, CNS-1544753, CNS-1730396, CNS-1828576. B. Yuand C. T. Silva are partially supported by the DARPA MEMEX andD3M programs. Any opinions, findings, and conclusions or recommen-dations expressed in this material are those of the authors and do notnecessarily reflect the views of DARPA.
9

REFERENCES
[1] D3: Data-Driven Documents. https://d3js.org[2] IBM SPSS Modeler. https://www.ibm.com/products/
spss-modeler/
[3] IBM Watson Analytics. https://www.ibm.com/watson-analytics[4] KNIME data analysis platform. http://www.knime.org/[5] Microsoft Power BI. https://powerbi.microsoft.com/[6] NLTK. http://www.nltk.org/[7] Tableau Software. http://www.tableausoftware.com/[8] Thoughtspot. http://www.thoughtspot.com/[9] TLC trip records. http://www.nyc.gov/html/tlc/html/about/
trip_record_data.shtml
[10] Wolfram Alpha. http://www.wolframalpha.com/[11] M. Allahyari, S. A. Pouriyeh, M. Assefi, S. Safaei, E. D. Trippe, J. B.
Gutierrez, and K. Kochut. A brief survey of text mining: Classification,clustering and extraction techniques. In Proc. KDD Bigdas, 2017.
[12] R. Amar, J. Eagan, and J. Stasko. Low-level components of analyticactivity in information visualization. In IEEE Symposium on InformationVisualization (InfoVis’05), pages 111–117, 2005.
[13] I. Androutsopoulos, G. D. Ritchie, and P. Thanisch. Natural languageinterfaces to databases – an introduction. Natural Language Engineering,1(1):29–81, 1995.
[14] C. Batini, E. Nardelli, and R. Tamassia. A layout algorithm for data flowdiagrams. IEEE Trans. Software Engineering, 12(4):538–546, 1986.
[15] L. Bavoil, S. P. Callahan, C. E. Scheidegger, H. T. Vo, P. Crossno, C. T.Silva, and J. Freire. VisTrails: Enabling interactive multiple-view vi-sualizations. In Proc. IEEE Visualization Conference, pages 135–142,2005.
[16] J. Berant, A. Chou, R. Frostig, and P. Liang. Semantic parsing on Freebasefrom question-answer pairs. In Proc. Empirical Methods in NaturalLanguage Processing (EMNLP’13), pages 1533–1544, 2013.
[17] P. Clark, J. Thompson, and B. Porter. A knowledge-based approachto question-answering. In Proc. AAAI Fall Symposium on Question-Answering Systems, pages 43–51, 1999.
[18] P. R. Cohen. The role of natural language in a multimodal interface.In Proc. 5th Annual ACM Symposium on User Interface Software andTechnology (UIST’92), pages 143–149, 1992.
[19] K. Cox, R. E. Grinter, S. L. Hibino, Lalita, J. Jagadeesan, and D. Mantilla.A multi-modal natural language interface to an information visualisationenvironment. International Journal of Speech Technology, 4:297–314,2001.
[20] L. Deng. A tutorial survey of architectures, algorithms, and applicationsfor deep learning. APSIPA Trans. Signal and Information Processing, 3,2014.
[21] K. Dhamdhere, K. McCurley, M. Sundararajan, Q. Yan, and R. Nahmias.Analyza: Exploring data with conversation. In Proc. 22nd InternationalConference on Intelligent User Interfaces, pages 493–504, 2017.
[22] E. Fast, B. Chen, J. Mendelsohn, J. Bassen, and M. S. Bernstein. Iris:A conversational agent for complex tasks. In Proc. CHI Conference onHuman Factors in Computing Systems (CHI’18), 2018.
[23] C. Fellbaum. WordNet: An Electronic Lexical Database. MIT Press, 1998.[24] J. Freire, C. T. Silva, S. P. Callahan, E. Santos, C. E. Scheidegger, and
H. T. Vo. Managing rapidly-evolving scientific workflows. In Proc. Prove-nance and Annotation of Data: International Provenance and AnnotationWorkshop, pages 10–18, 2006.
[25] T. Gao, M. Dontcheva, E. Adar, Z. Liu, and K. G. Karahalios. DataTone:managing ambiguity in natural language interfaces for data visualiza-tion. In Proc. 28th Annual Symposium on User Interface Software andTechnology (UIST’15), pages 489–500, 2015.
[26] I. Goodfellow, Y. Bengio, and A. Courville. Deep Learning. MIT press,2016.
[27] L. Grammel, M. Tory, and M. A. Storey. How information visualizationnovices construct visualizations. IEEE Trans. Visualization and ComputerGraphics, 16(6):943–952, 2010.
[28] P. E. Haeberli. ConMan: A visual programming language for interactivegraphics. ACM SigGraph Computer Graphics, 22(4):103–111, 1988.
[29] E. Hoque, V. Setlur, M. Tory, and I. Dykeman. Applying pragmaticsprinciples for interaction with visual analytics. IEEE Trans. Visualizationand Computer Graphics, 24(1):309–318, 2018.
[30] W. Javed and N. Elmqvist. ExPlates: Spatializing interactive analysis toscaffold visual exploration. Computer Graphics Forum, 32(2):441–450,2013.
[31] A. Kumar, J. Aurisano, B. D. Eugenio, A. Johnson, A. Gonzalez, andJ. Leigh. Towards a dialogue system that supports rich visualizationsof data. In Proc. 17th Annual Meeting of the Special Interest Group onDiscourse and Dialogue, 2016.
[32] V. I. Levenshtein. Binary codes capable of correcting deletions, insertionsand reversals. Soviet Physics Doklady, 10:707, 1966.
[33] Y. Li, H. Yang, and H. V. Jagadish. NaLIX: A generic natural languagesearch environment for XML data. ACM Trans. Database Systems, 32(4),2007.
[34] P. Liang and C. Potts. Bringing machine learning and compositionalsemantics together. Annual Review of Linguistics, 1:355–376, 2014.
[35] J. Mackinlay, P. Hanrahan, and C. Stolte. Show Me: Automatic pre-sentation for visual analysis. IEEE Trans. Visualization and ComputerGraphics, 13(6):1137–1144, 2007.
[36] C. D. Manning, M. Surdeanu, J. Bauer, J. Finkel, P. Inc, S. J. Bethard, andD. Mcclosky. The Stanford CoreNLP natural language processing toolkit.In Proc. 52nd Annual Meeting of the Association for Computational Lin-guistics (ACL’14): System Demonstrations, pages 55–60, 2014.
[37] J. Meyer-Spradow, T. Ropinski, J. Mensmann, and K. Hinrichs. Voreen:A rapid-prototyping environment for ray-casting-based volume visualiza-tions. IEEE Computer Graphics and Applications, 29(6):6–13, 2009.
[38] G. Navarro. A guided tour to approximate string matching. ACM Comput-ing Surveys, 33(1):31–88, 2001.
[39] S. G. Parker and C. R. Johnson. SCIRun: A scientific programmingenvironment for computational steering. In Proc. ACM/IEEE Conferenceon Supercomputing, 1995.
[40] P. Pasupat and P. Liang. Compositional semantic parsing on semi-structured tables. In Proc. Annual Meeting of the Association for Compu-tational Linguistics (ACL’15), 2015.
[41] J. Poco, H. Doraiswamy, H. T. Vo, J. L. D. Comba, J. Freire, and C. T.Silva. Exploring traffic dynamics in urban environments using vector-valued functions. Computer Graphics Forum, 34(3):161–170, 2015.
[42] J. C. Roberts. Waltz - an exploratory visualization tool for volume data,using multiform abstract displays. In Proc. SPIE Visual Data Explorationand Analysis V, volume 3298, pages 112–122, 1998.
[43] J. C. Roberts. On encouraging coupled views for visualization exploration.In Proc. SPIE Visual Data Exploration and Analysis VI, volume 3643,pages 14–24, 1999.
[44] V. Setlur, S. E. Battersby, M. Tory, R. Gossweiler, and A. X. Chang. Eviza:A natural language interface for visual analysis. In Proc. 29th AnnualSymposium on User Interface Software and Technology (UIST’16), pages365–377, 2016.
[45] B. Shneiderman. The eyes have it: A task by data type taxonomy for in-formation visualizations. In Proc. IEEE Symposium on Visual Languages,pages 336–343, 1996.
[46] M. Sipser. Introduction to the Theory of Computation. Cengage Learning,3rd edition, 2012.
[47] A. Srinivasan and J. Stasko. Orko: Facilitating multimodal interaction forvisual exploration and analysis of networks. IEEE Trans. Visualizationand Computer Graphics, 24(1):511–521, 2018.
[48] A. Srinivasan and J. T. Stasko. Natural language interfaces for dataanalysis with visualization: Considering what has and could be asked.In Eurographics Conference on Visualization (EuroVis’17 short paper),2017.
[49] Y. Sun, J. Leigh, A. Johnson, and S. Lee. Articulate: A semi-automatedmodel for translating natural language queries into meaningful visualiza-tions. In Proc. 10th International Conference on Smart Graphics, pages184–195, 2010.
[50] B. Taskar, C. Guestrin, and D. Koller. Max-margin markov networks. MITPress, 2003.
[51] C. Upson, J. Faulhaber, T.A., D. Kamins, D. Laidlaw, D. Schlegel,J. Vroom, R. Gurwitz, and A. van Dam. The application visualizationsystem: a computational environment for scientific visualization. IEEEComputer Graphics and Applications, 9(4):30–42, 1989.
[52] Y. Wang, J. Berant, and P. Liang. Building a semantic parser overnight. InProc. Annual Meeting of the Association for Computational Linguistics(ACL’15), 2015.
[53] K. Wolstencroft, R. Haines, D. Fellows, A. R. Williams, D. Withers,S. Owen, S. Soiland-Reyes, I. Dunlop, A. Nenadic, P. Fisher, J. Bhagat,K. Belhajjame, F. Bacall, A. Hardisty, A. N. de la Hidalga, M. P. B. Vargas,S. Sufi, and C. A. Goble. The Taverna workflow suite: designing andexecuting workflows of web services on the desktop, web or in the cloud.Nucleic Acids Research, 41(W1):557–561, 2013.
10
© 2019 IEEE. This is the author’s version of the article that has been published in IEEE Transactions on Visualization andComputer Graphics. The final version of this record is available at: 10.1109/TVCG.2019.2934668
[54] Z. Wu and M. Palmer. Verbs semantics and lexical selection. In Proc. 32ndAnnual Meeting on Association for Computational Linguistics (ACL’94),pages 133–138, 1994.
[55] P. Yin, Z. Lu, H. Li, and B. Kao. Neural Enquirer: Learning to querytables with natural language. In Proc. International Joint Conference onArtificial Intelligence (IJCAI’16), 2016.
[56] T. Young, D. Hazarika, S. Poria, and E. Cambria. Recent trends in deeplearning based natural language processing. IEEE Computational Intelli-gence Magazine, 13(3):55–75, 2018.
[57] B. Yu and C. T. Silva. VisFlow – Web-based visualization frameworkfor tabular data with a subset flow model. IEEE Trans. Visualization andComputer Graphics, 23(1):251–260, 2017.
[58] V. Zhong, C. Xiong, and R. Socher. Seq2SQL: Generating structuredqueries from natural language using reinforcement learning. CoRR,abs/1709.00103, 2017.
11

FlowSense: A Natural Language Interface for Visual Data Exploration within a Dataflow System(Appendix)
A FlowSense Grammar Design
We provide an open source repository that contains the details of the FlowSense implementation:https://github.com/yubowenok/flowsense. This repository includes the grammarrules, backend API (implemented in TypeScript and Python), and integration tests. The structureof this repository and its installation and setup guide can be found within its README file.
In particular, the grammar rules are located in the *.grammar files. The entry point ismain.grammar. The grammar rules are written in the SEMPRE grammar format (i.e. SEM-PRE formulas). More details on SEMPRE can be found at the SEMPRE GitHub repository.
B Characteristics of the Diagram Editing Focus Heuristics
Intuitively, the focus score keeps track of the diagram element that is last interacted with. It hastwo components: the activeness resulted from mouse clicks, and the distance-to-mouse bonus.The activeness score exponentially decreases when there is no interaction on the node, while thedistance-to-mouse bonus prioritizes the elements around the last interaction.
When the mouse hits a node x, node x receives a high activeness score of one from the Click(X,t) part, which almost certainly ensures that the focus score of x is higher than any other node y thatis not interacted with. Though y (when it is in the proximity of x) may receive a distance-to-mousebonus that remedies its exponential loss on the activeness score, note that x receives a distance-to-mouse bonus too, and the bonus can only be higher than the bonus received by y because xis clicked on and thus closer to the mouse. Therefore, the outcome is that x becomes the firstprioritized node, and y becomes the second prioritized. In other words, if a VisFlow functionrequires two node operands, then x is chosen first, and then y is chosen.
If the user clicks on the background, all nodes have exponentially decreasing activeness score,and their distance-to-mouse bonus will likely dominate the focus score. Consequently, the nodesthat are closer to the last click become the chosen query targets. As there can be multiple nodesaround the background click, occasionally a node not actually focused by the user may happen tobe close to an unintentional background click (e.g. accidentally performed during canvas panning).The next NL query may then be incorrectly performed on this node. This error can be fixed byclicking on a specific node to focus on it and redoing the NL query.
C Additional User Study Remarks
* In the SDE test, answering a question wrong results in negative score penalty. Therefore skippinga question can be worthy. Skipping requires an explicit button click. The “unanswered” result isgiven when the user has no action within the allocated time limit of a question.
* In Fig. 6(b), four outliers due to interruptions on the participant’s end are not shown: 2550minutes on Task1, and 109, 119, 212 minutes on Task3 were measured as the task completiontime that includes the interruptions.
1
arX
iv:1
908.
0068
1v2
[cs
.HC
] 6
Oct
201
9

FlowSense: A Natural Language Interface for Visual Data Exploration within a Dataflow System(Appendix)
Aspect Feedback
I understand the majority of VisFlow features. 6 11
I understand the subset flow in VisFlow. 1 5 11
I can follow the VisFlow dataflow diagram and understand theirfunctionality.
6 11
VisFlow is relatively simple to learn and use. 6 5 6
VisFlow is an effective system for visual data exploration. 1 7 9
I would like to use VisFlow for my future data exploration tasks. 1 2 8 6
Table 1: VisFlow Survey Result. The feedback column shows the score distribution for each as-sessed aspect of VisFlow. The numbers on the colored bars show the counts of the scores received.Darker green represents higher score. Overall the users were able to understand well the DFVSfunctionality and use it effectively for visual data exploration.
D VisFlow Survey Results
The VisFlow user study is part of the FlowSense user study. Before FlowSense was introduced tothe users, a tutorial on the details of the VisFlow dataflow framework was given. The participantgroup of the VisFlow user study is thus exactly the same as the group described in the paper: Intotal, 17 users (11 male, 6 female, all with an age between 20 and 30) who work or study in the fieldof computer science participated in this study. 12 participants have a data visualization background.9 are graduate students, and the other 8 are professionals (software engineer, researcher, faculty).3 participants have prior experience with VisFlow, who may yet formally evaluate it through taskcompletion. The participants are chosen to have a variety of specialities so as to represent potentialDFVS users. The participant group includes visualization designers, data scientists, and softwareengineers who share data analysis interest but have different skill sets.
The users were given a form to assess the effectiveness of VisFlow quantitatively using a Likertscale of 1 to 5 (5 is “strongly agree” and 1 is “strongly disagree”). Table 1 shows the quantitativesurvey feedback for the VisFlow DFVS. It can be observed that the users were able to understandthe subset flow model of VisFlow. The majority of the users agree (with a score of at least 4)that VisFlow presents an effective approach to visual data exploration, and can successfully utilizeVisFlow features for their data exploration.
2
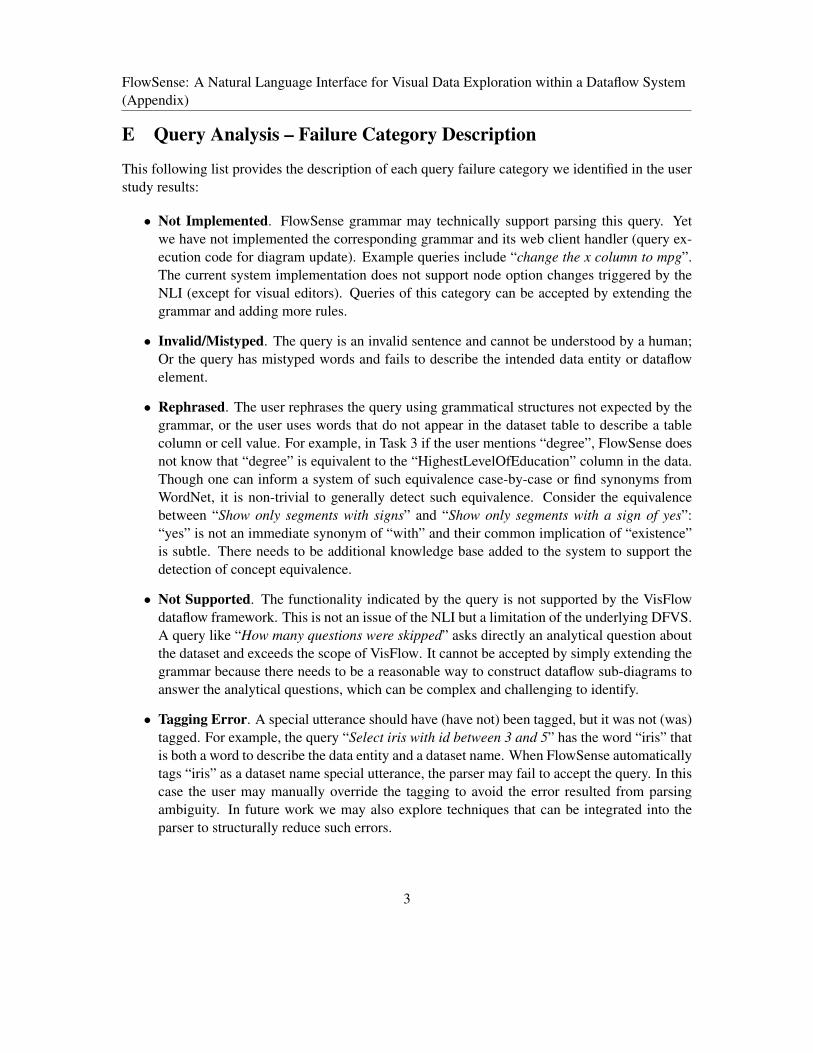
FlowSense: A Natural Language Interface for Visual Data Exploration within a Dataflow System(Appendix)
E Query Analysis – Failure Category Description
This following list provides the description of each query failure category we identified in the userstudy results:
• Not Implemented. FlowSense grammar may technically support parsing this query. Yetwe have not implemented the corresponding grammar and its web client handler (query ex-ecution code for diagram update). Example queries include “change the x column to mpg”.The current system implementation does not support node option changes triggered by theNLI (except for visual editors). Queries of this category can be accepted by extending thegrammar and adding more rules.
• Invalid/Mistyped. The query is an invalid sentence and cannot be understood by a human;Or the query has mistyped words and fails to describe the intended data entity or dataflowelement.
• Rephrased. The user rephrases the query using grammatical structures not expected by thegrammar, or the user uses words that do not appear in the dataset table to describe a tablecolumn or cell value. For example, in Task 3 if the user mentions “degree”, FlowSense doesnot know that “degree” is equivalent to the “HighestLevelOfEducation” column in the data.Though one can inform a system of such equivalence case-by-case or find synonyms fromWordNet, it is non-trivial to generally detect such equivalence. Consider the equivalencebetween “Show only segments with signs” and “Show only segments with a sign of yes”:“yes” is not an immediate synonym of “with” and their common implication of “existence”is subtle. There needs to be additional knowledge base added to the system to support thedetection of concept equivalence.
• Not Supported. The functionality indicated by the query is not supported by the VisFlowdataflow framework. This is not an issue of the NLI but a limitation of the underlying DFVS.A query like “How many questions were skipped” asks directly an analytical question aboutthe dataset and exceeds the scope of VisFlow. It cannot be accepted by simply extending thegrammar because there needs to be a reasonable way to construct dataflow sub-diagrams toanswer the analytical questions, which can be complex and challenging to identify.
• Tagging Error. A special utterance should have (have not) been tagged, but it was not (was)tagged. For example, the query “Select iris with id between 3 and 5” has the word “iris” thatis both a word to describe the data entity and a dataset name. When FlowSense automaticallytags “iris” as a dataset name special utterance, the parser may fail to accept the query. In thiscase the user may manually override the tagging to avoid the error resulted from parsingambiguity. In future work we may also explore techniques that can be integrated into theparser to structurally reduce such errors.
3
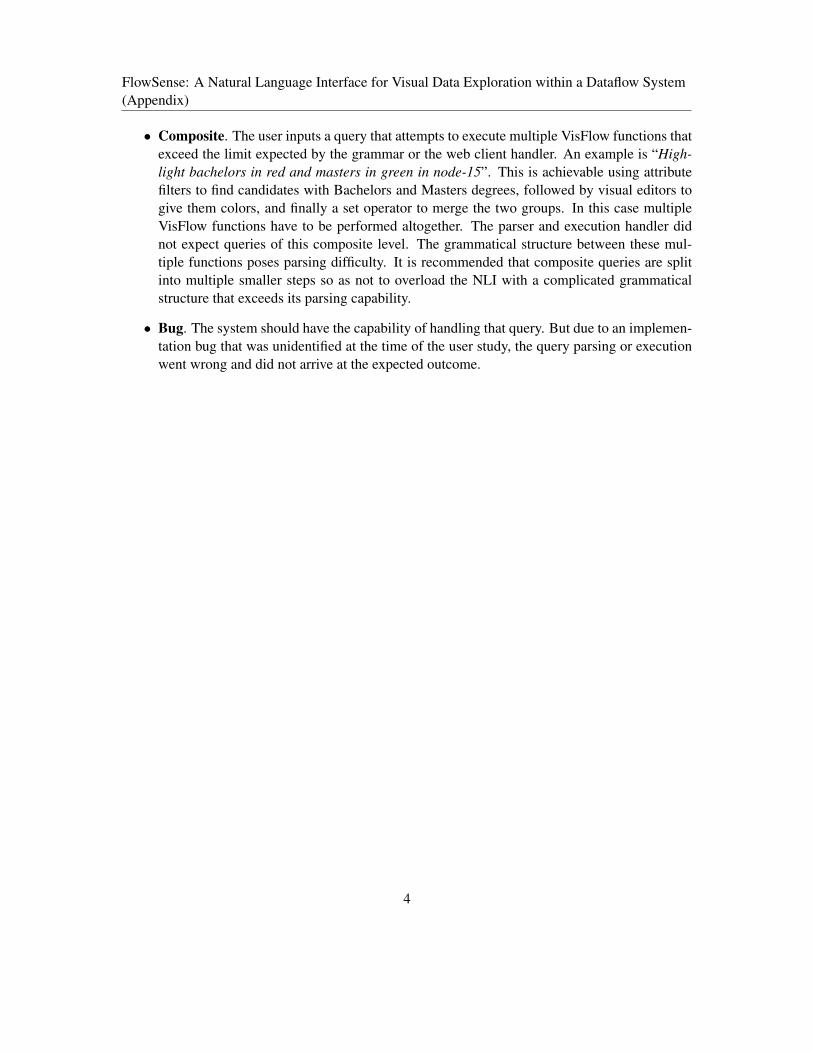
FlowSense: A Natural Language Interface for Visual Data Exploration within a Dataflow System(Appendix)
• Composite. The user inputs a query that attempts to execute multiple VisFlow functions thatexceed the limit expected by the grammar or the web client handler. An example is “High-light bachelors in red and masters in green in node-15”. This is achievable using attributefilters to find candidates with Bachelors and Masters degrees, followed by visual editors togive them colors, and finally a set operator to merge the two groups. In this case multipleVisFlow functions have to be performed altogether. The parser and execution handler didnot expect queries of this composite level. The grammatical structure between these mul-tiple functions poses parsing difficulty. It is recommended that composite queries are splitinto multiple smaller steps so as not to overload the NLI with a complicated grammaticalstructure that exceeds its parsing capability.
• Bug. The system should have the capability of handling that query. But due to an implemen-tation bug that was unidentified at the time of the user study, the query parsing or executionwent wrong and did not arrive at the expected outcome.
4