external visual interface for a nikon 6d autocollimator
TRANSCRIPT

External visual interface for a Nikon 6Dautocollimator
Guillermo BerguesGuillermo Ames
Luis CanaliCIII at UTN-FRC
Cordoba, [email protected]
Clemar SchurrerCEMETRO at UTN-FRC
Cordoba, [email protected]
Ana Georgina FlesiaFamaf-UNC
Conicet at UTN-FRCCordoba, Argentina
Abstract—The goal of this paper is to describe the potentialof a visual interface applied to a Nikon 6B/6D autocollimator inorder to replace human operator within a “laboratory grade”measurement. The optical interface implemented consists of aBasler HD camera attached to the autocollimator’s eyepiece,camera positioning devices, and a proprietary digital imageprocessing package, built around Matlab environment. The wholesystem is used to analyze the reticle image to detect both the scaleand the measuring crosshair lines at sub-pixel level. The systemperformance was compared in a controlled experiment againstan electronic level with internationally traceable certification. Theresolution of the pitch angles obtained was 10 times better thanthat originally obtained with the instrument. This example showsthat the value of 0.02 pixels for the uncertainty associated withsub-pixel position of reticle lines is realistic, allowing for continueworking on a robust interface for all angle parameters that canbe measured using autocollimators.
I. INTRODUCTION
An autocollimator is an optical instrument that measuresangles with no physical contact and high accuracy. This deviceis very useful when measuring parallelism, perpendicularity,straightness, and pitch and yaw angles. These above mentionedparameters are of vital importance in the metrological evalua-tion of Coordinate Measuring Machines and Machine Tools inproduction plants or metrology laboratories. They are also anindispensable tool for the characterization of the topographyof surfaces on ultra precise mirrors for X-ray optics, [1]-[2].
To perform a measurement with an autocollimator theoperator places one of his eyes against the instrument’s eye-piece and observes the displacement of the crosshair lineson the measurement reticle. This kind of procedure inducessystematic and random errors due to the existence of parallax,inherent to this method, and defects of the observer’s eye.
This paper presents the implementation of an external (i.e.no tampering of the instrument required) visual interface toa Nikon 6B/6D standard autocollimator, comprising a digitalcamera, a computer for processing the camera images, andthe image processing package built around Matlab / Octaveenvironment. This system reduces the previous errors.
This interface allows for extend the resolution of theinstrument, since the camera image has much more informa-tion available than that the operator can resolve inspectingthe autocollimator measurement reticle. This information is
processed so as to determine the position of the center of aline with subpixel resolution.
The location of curves within a picture with sub-pixelresolution is of high interest in very different fields, such asglass width estimation, [3]; high temperature specimen contourestimation, [4]; among others.
In Section II we describe the operational principles of theautocollimator, and we introduce the basic concepts employedwhen measuring using these instruments. Finally, we describehow we proceeded to make a measurement with the visualinterface. In Section III we discuss the results of segmentationand detection algorithms that were developed to reproduce thework of the operator during the measurement. Conclusions andfuture work are detailed in the final section.
II. EXPERIMENTAL
A. Autocollimator
An autocollimator (Fig. 1) is an optic instrument used formeasuring small angular displacements (at the seconds of arclevel).
Fig. 1: Nikon 6D Autocollimator and Basler Camera, locatedin front of the autocollimator’s eyepiece.
It has the capability of performing measurements withoutmaking contact with the measured object. This is a veryuseful feature within an assembly line or in a reference lab,where instruments and ancillary devices must be manipulateddelicately.
978-1-4673-6386-0/14/$31.00 ©2014 IEEE
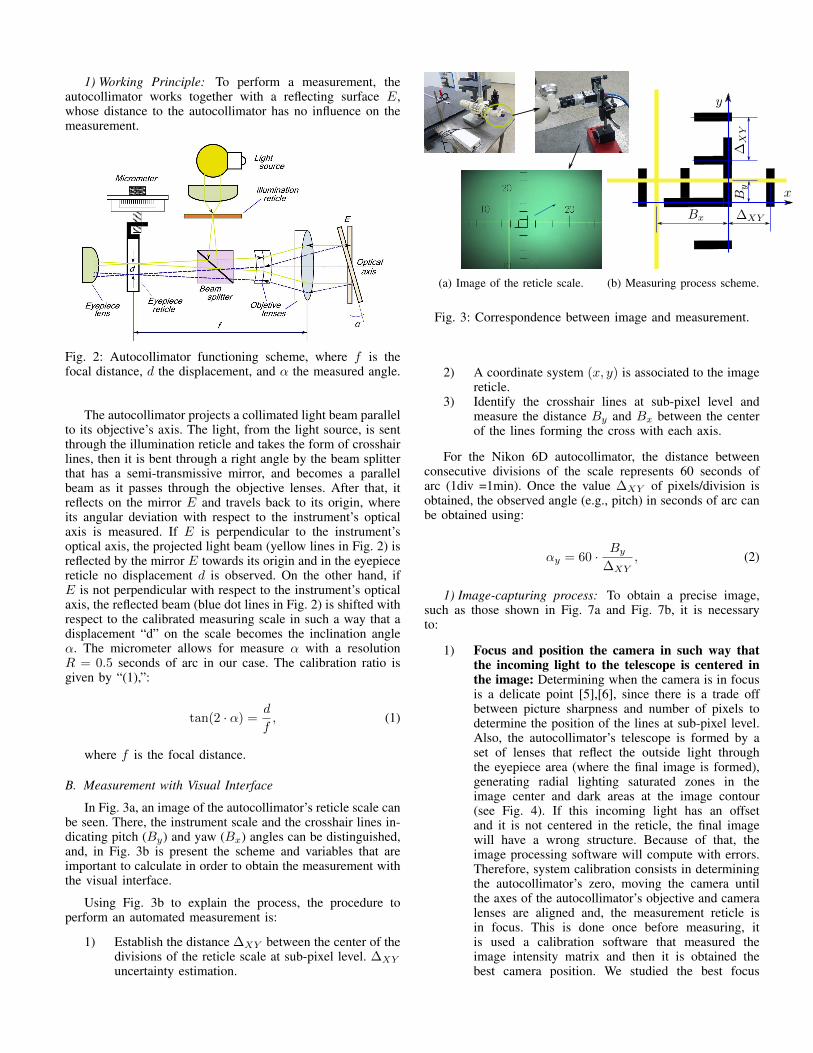
1) Working Principle: To perform a measurement, theautocollimator works together with a reflecting surface E,whose distance to the autocollimator has no influence on themeasurement.
Fig. 2: Autocollimator functioning scheme, where f is thefocal distance, d the displacement, and α the measured angle.
The autocollimator projects a collimated light beam parallelto its objective’s axis. The light, from the light source, is sentthrough the illumination reticle and takes the form of crosshairlines, then it is bent through a right angle by the beam splitterthat has a semi-transmissive mirror, and becomes a parallelbeam as it passes through the objective lenses. After that, itreflects on the mirror E and travels back to its origin, whereits angular deviation with respect to the instrument’s opticalaxis is measured. If E is perpendicular to the instrument’soptical axis, the projected light beam (yellow lines in Fig. 2) isreflected by the mirror E towards its origin and in the eyepiecereticle no displacement d is observed. On the other hand, ifE is not perpendicular with respect to the instrument’s opticalaxis, the reflected beam (blue dot lines in Fig. 2) is shifted withrespect to the calibrated measuring scale in such a way that adisplacement “d” on the scale becomes the inclination angleα. The micrometer allows for measure α with a resolutionR = 0.5 seconds of arc in our case. The calibration ratio isgiven by “(1),”:
tan(2 · α) =d
f, (1)
where f is the focal distance.
B. Measurement with Visual Interface
In Fig. 3a, an image of the autocollimator’s reticle scale canbe seen. There, the instrument scale and the crosshair lines in-dicating pitch (By) and yaw (Bx) angles can be distinguished,and, in Fig. 3b is present the scheme and variables that areimportant to calculate in order to obtain the measurement withthe visual interface.
Using Fig. 3b to explain the process, the procedure toperform an automated measurement is:
1) Establish the distance ∆XY between the center of thedivisions of the reticle scale at sub-pixel level. ∆XY
uncertainty estimation.
(a) Image of the reticle scale.
Bx ∆XY
By
∆X
Y
y
x
(b) Measuring process scheme.
Fig. 3: Correspondence between image and measurement.
2) A coordinate system (x, y) is associated to the imagereticle.
3) Identify the crosshair lines at sub-pixel level andmeasure the distance By and Bx between the centerof the lines forming the cross with each axis.
For the Nikon 6D autocollimator, the distance betweenconsecutive divisions of the scale represents 60 seconds ofarc (1div =1min). Once the value ∆XY of pixels/division isobtained, the observed angle (e.g., pitch) in seconds of arc canbe obtained using:
αy = 60 · By
∆XY, (2)
1) Image-capturing process: To obtain a precise image,such as those shown in Fig. 7a and Fig. 7b, it is necessaryto:
1) Focus and position the camera in such way thatthe incoming light to the telescope is centered inthe image: Determining when the camera is in focusis a delicate point [5],[6], since there is a trade offbetween picture sharpness and number of pixels todetermine the position of the lines at sub-pixel level.Also, the autocollimator’s telescope is formed by aset of lenses that reflect the outside light throughthe eyepiece area (where the final image is formed),generating radial lighting saturated zones in theimage center and dark areas at the image contour(see Fig. 4). If this incoming light has an offsetand it is not centered in the reticle, the final imagewill have a wrong structure. Because of that, theimage processing software will compute with errors.Therefore, system calibration consists in determiningthe autocollimator’s zero, moving the camera untilthe axes of the autocollimator’s objective and cameralenses are aligned and, the measurement reticle isin focus. This is done once before measuring, itis used a calibration software that measured theimage intensity matrix and then it is obtained thebest camera position. We studied the best focus
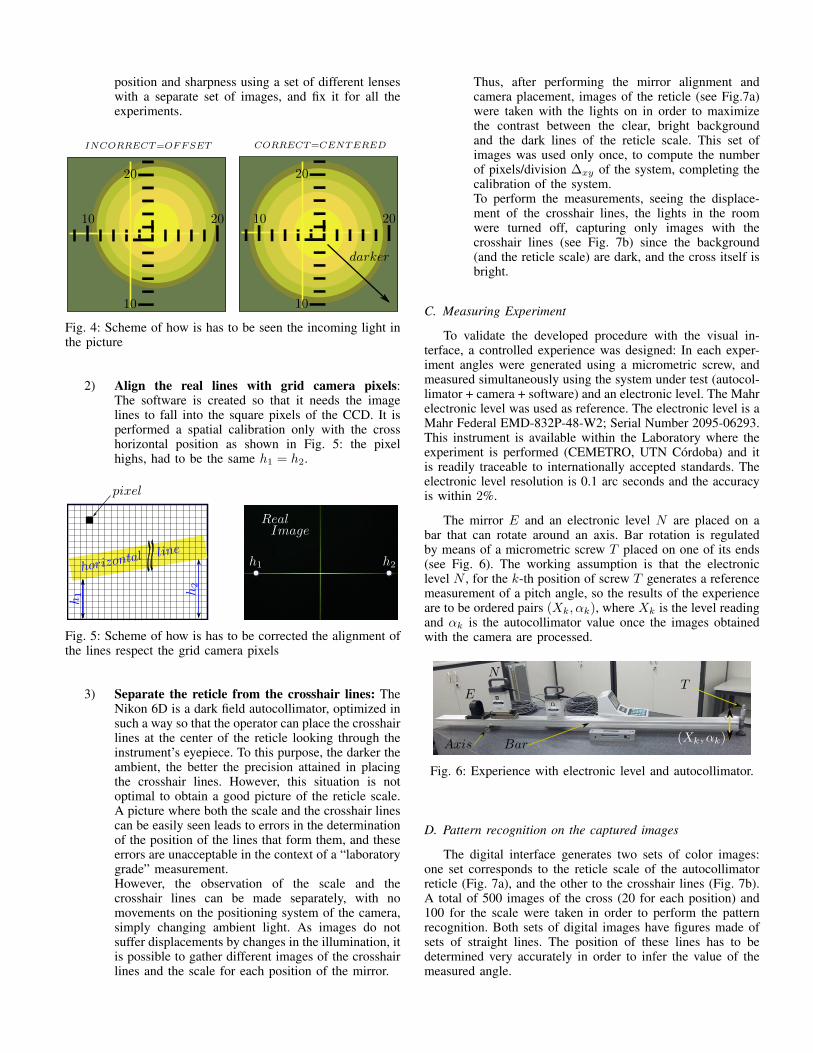
position and sharpness using a set of different lenseswith a separate set of images, and fix it for all theexperiments.
2010
20
10
darker
INCORRECT=OFFSET CORRECT=CENTERED
2010
20
10
Fig. 4: Scheme of how is has to be seen the incoming light inthe picture
2) Align the real lines with grid camera pixels:The software is created so that it needs the imagelines to fall into the square pixels of the CCD. It isperformed a spatial calibration only with the crosshorizontal position as shown in Fig. 5: the pixelhighs, had to be the same h1 = h2.
pixel
horizontal
line
h1 h2
h1 h2
RealImage
Fig. 5: Scheme of how is has to be corrected the alignment ofthe lines respect the grid camera pixels
3) Separate the reticle from the crosshair lines: TheNikon 6D is a dark field autocollimator, optimized insuch a way so that the operator can place the crosshairlines at the center of the reticle looking through theinstrument’s eyepiece. To this purpose, the darker theambient, the better the precision attained in placingthe crosshair lines. However, this situation is notoptimal to obtain a good picture of the reticle scale.A picture where both the scale and the crosshair linescan be easily seen leads to errors in the determinationof the position of the lines that form them, and theseerrors are unacceptable in the context of a “laboratorygrade” measurement.However, the observation of the scale and thecrosshair lines can be made separately, with nomovements on the positioning system of the camera,simply changing ambient light. As images do notsuffer displacements by changes in the illumination, itis possible to gather different images of the crosshairlines and the scale for each position of the mirror.
Thus, after performing the mirror alignment andcamera placement, images of the reticle (see Fig.7a)were taken with the lights on in order to maximizethe contrast between the clear, bright backgroundand the dark lines of the reticle scale. This set ofimages was used only once, to compute the numberof pixels/division ∆xy of the system, completing thecalibration of the system.To perform the measurements, seeing the displace-ment of the crosshair lines, the lights in the roomwere turned off, capturing only images with thecrosshair lines (see Fig. 7b) since the background(and the reticle scale) are dark, and the cross itself isbright.
C. Measuring Experiment
To validate the developed procedure with the visual in-terface, a controlled experience was designed: In each exper-iment angles were generated using a micrometric screw, andmeasured simultaneously using the system under test (autocol-limator + camera + software) and an electronic level. The Mahrelectronic level was used as reference. The electronic level is aMahr Federal EMD-832P-48-W2; Serial Number 2095-06293.This instrument is available within the Laboratory where theexperiment is performed (CEMETRO, UTN Cordoba) and itis readily traceable to internationally accepted standards. Theelectronic level resolution is 0.1 arc seconds and the accuracyis within 2%.
The mirror E and an electronic level N are placed on abar that can rotate around an axis. Bar rotation is regulatedby means of a micrometric screw T placed on one of its ends(see Fig. 6). The working assumption is that the electroniclevel N , for the k-th position of screw T generates a referencemeasurement of a pitch angle, so the results of the experienceare to be ordered pairs (Xk, αk), where Xk is the level readingand αk is the autocollimator value once the images obtainedwith the camera are processed.
TN
E
Bar(Xk, αk)
Axis
Fig. 6: Experience with electronic level and autocollimator.
D. Pattern recognition on the captured images
The digital interface generates two sets of color images:one set corresponds to the reticle scale of the autocollimatorreticle (Fig. 7a), and the other to the crosshair lines (Fig. 7b).A total of 500 images of the cross (20 for each position) and100 for the scale were taken in order to perform the patternrecognition. Both sets of digital images have figures made ofsets of straight lines. The position of these lines has to bedetermined very accurately in order to infer the value of themeasured angle.

(a) Reticle scale image. (b) Crosshair line image.
Fig. 7: Image set.
1) Establish the distance ∆XY : The first stage on the de-tection is to model the measurement reticle (eyepiece reticle).Using the algorithm shown in Fig. 8, we obtain the distancebetween segments.
...
Background
substraction
Reticle scale
detection and
Centroids
F itting
∆xy
cropping
start
Selection of
1D section of
the scale
SLOP
E=
∆xy
CE
NT
RO
ID
N◦ OF CENTROID
1D SECTION
p1
∆xy1 ∆xyk
pk
PO
SIT
IO
NS
Fig. 8: Flowchart detection of ∆XY .
We have work using eight vertical and horizontal scalesegments taken from the center of the image. This was carriedout to minimize optical aberration. A linear fitting to theeight obtained segment centres pk is performed using a simpleregression model “(3),”.
pk = ∆XY ∗ k + ε, k : 1, . . . , 8, ε ∼ N(0, σ). (3)
Estimated sub-pixel values for the autocollimator scalepitch on each axis are coincident within the 95% confidenceinterval. Therefore a mean value for scale calibration can beset as:
∆XY = (97.31±0.02)pixels/division (95% confidence). (4)
This allows for conclude that scales are linear within anuncertainty margin of 0.02 pixels/div for both axes.
2) Identify the crosshair lines: To perform the detectionwe propose the algorithm that is explain in Fig. 9.
start
Backgroundsubstraction
Center scan
and cropping
n 1D − independent
gaussian fitting
Mean
value
Measurement
Centroid fitting
1 n...
SLOPE=M
easu
remen
t
CE
NT
RO
ID
N◦ OF CENTROIDP
OSIT
IO
NS
...1 n
Fig. 9: Flowchart detection crosshair lines position.
The position of the one dimensional straight line is es-timated with the centroid of a Gaussian function, as it wascarried out with the scale. It is named Bk.
αk is the relative position with respect to centroid B1,corresponding to the reference value (first measurement) ofthe visual interface and the electronic level. It is converted toarc seconds using “(5),”:
αk =(Bk − (B1)) ∗ 60
∆XY=
(Bk − (B1)) ∗ 60
97.31. (5)
III. RESULTS AND DISCUSSION
A. Comparison of measures performed with the modified au-tocollimator and the electronic level
The data (Xk, αk) for k = 1...25 were fitted with a linearregression model:
αk = a ∗Xk + b+ ε, ε ∼ N(0, σ) (6)
The slope a = 1.0232 ± 0.0004 (95% confidence) and theintercept b = 0.81 ± 0.02 seconds of arc (95% confidence).
The difference between (a) and unity is near 2%. Thisvalue is very close to the electronic level accuracy.
The error in the fitting produced for the calibration ofthe Electronic Level was disregarded because this research isfocused on the new instrument’s resolution. This indicates thaterrors in measurements using the camera plus the autocollima-tor ensemble are not random in nature.
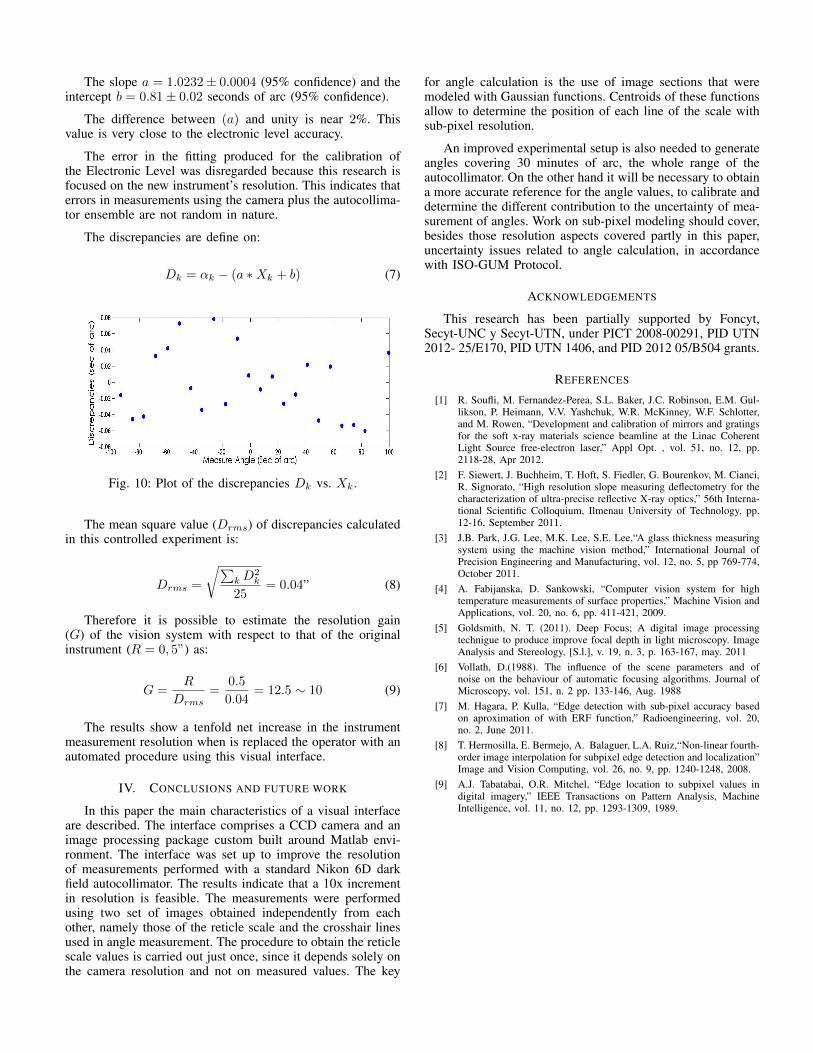
The discrepancies are define on:
Dk = αk − (a ∗Xk + b) (7)
Fig. 10: Plot of the discrepancies Dk vs. Xk.
The mean square value (Drms) of discrepancies calculatedin this controlled experiment is:
Drms =
√∑kD
2k
25= 0.04” (8)
Therefore it is possible to estimate the resolution gain(G) of the vision system with respect to that of the originalinstrument (R = 0, 5”) as:
G =R
Drms=
0.5
0.04= 12.5 ∼ 10 (9)
The results show a tenfold net increase in the instrumentmeasurement resolution when is replaced the operator with anautomated procedure using this visual interface.
IV. CONCLUSIONS AND FUTURE WORK
In this paper the main characteristics of a visual interfaceare described. The interface comprises a CCD camera and animage processing package custom built around Matlab envi-ronment. The interface was set up to improve the resolutionof measurements performed with a standard Nikon 6D darkfield autocollimator. The results indicate that a 10x incrementin resolution is feasible. The measurements were performedusing two set of images obtained independently from eachother, namely those of the reticle scale and the crosshair linesused in angle measurement. The procedure to obtain the reticlescale values is carried out just once, since it depends solely onthe camera resolution and not on measured values. The key
for angle calculation is the use of image sections that weremodeled with Gaussian functions. Centroids of these functionsallow to determine the position of each line of the scale withsub-pixel resolution.
An improved experimental setup is also needed to generateangles covering 30 minutes of arc, the whole range of theautocollimator. On the other hand it will be necessary to obtaina more accurate reference for the angle values, to calibrate anddetermine the different contribution to the uncertainty of mea-surement of angles. Work on sub-pixel modeling should cover,besides those resolution aspects covered partly in this paper,uncertainty issues related to angle calculation, in accordancewith ISO-GUM Protocol.
ACKNOWLEDGEMENTS
This research has been partially supported by Foncyt,Secyt-UNC y Secyt-UTN, under PICT 2008-00291, PID UTN2012- 25/E170, PID UTN 1406, and PID 2012 05/B504 grants.
REFERENCES
[1] R. Soufli, M. Fernandez-Perea, S.L. Baker, J.C. Robinson, E.M. Gul-likson, P. Heimann, V.V. Yashchuk, W.R. McKinney, W.F. Schlotter,and M. Rowen, “Development and calibration of mirrors and gratingsfor the soft x-ray materials science beamline at the Linac CoherentLight Source free-electron laser,” Appl Opt. , vol. 51, no. 12, pp.2118-28, Apr 2012.
[2] F. Siewert, J. Buchheim, T. Hoft, S. Fiedler, G. Bourenkov, M. Cianci,R. Signorato, “High resolution slope measuring deflectometry for thecharacterization of ultra-precise reflective X-ray optics,” 56th Interna-tional Scientific Colloquium, Ilmenau University of Technology, pp.12-16, September 2011.
[3] J.B. Park, J.G. Lee, M.K. Lee, S.E. Lee,“A glass thickness measuringsystem using the machine vision method,” International Journal ofPrecision Engineering and Manufacturing, vol. 12, no. 5, pp 769-774,October 2011.
[4] A. Fabijanska, D. Sankowski, “Computer vision system for hightemperature measurements of surface properties,” Machine Vision andApplications, vol. 20, no. 6, pp. 411-421, 2009.
[5] Goldsmith, N. T. (2011). Deep Focus; A digital image processingtechnigue to produce improve focal depth in light microscopy. ImageAnalysis and Stereology, [S.l.], v. 19, n. 3, p. 163-167, may. 2011
[6] Vollath, D.(1988). The influence of the scene parameters and ofnoise on the behaviour of automatic focusing algorithms. Journal ofMicroscopy, vol. 151, n. 2 pp. 133-146, Aug. 1988
[7] M. Hagara, P. Kulla, “Edge detection with sub-pixel accuracy basedon aproximation of with ERF function,” Radioengineering, vol. 20,no. 2, June 2011.
[8] T. Hermosilla, E. Bermejo, A. Balaguer, L.A. Ruiz,“Non-linear fourth-order image interpolation for subpixel edge detection and localization”Image and Vision Computing, vol. 26, no. 9, pp. 1240-1248, 2008.
[9] A.J. Tabatabai, O.R. Mitchel, “Edge location to subpixel values indigital imagery,” IEEE Transactions on Pattern Analysis, MachineIntelligence, vol. 11, no. 12, pp. 1293-1309, 1989.