flu review season 2017-18 · note: surveillance case definitions for influenza-like illness vary...
TRANSCRIPT

County Influenza Activity
State influenza and influenza-like illness (ILI) activity: • Week 20 marks the end of the production of the weekly influenza report. The Florida
Department of Health will continue to distribute influenza reports in an abbreviated format during the summer months on a biweekly basis. RSV surveillance information will continue to be included in these biweekly reports. Surveillance for influenza will continue during the summer months with a focus on identification of outbreaks and unusually severe presentations of influenza or ILI.
• The influenza season is coming to a close. Statewide, influenza and ILI activity continued to decrease and remained at normal levels for this time. While activity has declined overall, it is important to note that influenza continues to circulate at low levels throughout the summer months in Florida and may cause outbreaks.
• Data indicate influenza activity this season peaked during week 5 (ending February 3, 2018). Peak influenza activity this season was higher than in past flu seasons.
• No new influenza-associated pediatric deaths were confirmed in week 20. Eight influenza-associated pediatric deaths have been confirmed since the start of the 2017-18 influenza season. The number of confirmed influenza-associated pediatric deaths ranged from three to 11 during the last five flu seasons.
• Deaths due to pneumonia and influenza (P&I) were below expected levels. Deaths due to P&I also peaked during week 5.
• Two outbreaks of influenza or ILI were reported in week 20: one with laboratory confirmation of influenza and one ILI. A total of 507 outbreaks of influenza and ILI have been reported since the start of the 2017-18 season. More outbreaks were reported this season than in previous seasons on record. An average of 91 total influenza or ILI outbreaks were reported during the last five seasons.
• In week 20, two cases of intensive-care unit patients aged <65 years with laboratory-confirmed influenza were reported; 378 cases have been reported since February 1, 2018.
• Of the 242 cases with known vaccination status, the majority (69%) were unvaccinated individuals. Of the 374 cases with medical histories available, the majority (89%) had underlying medical conditions.
Prevention and Treatment: • Timely use of antivirals remains important throughout the summer months for
unusually severe presentations of influenza and for people at higher risk for complications with suspect influenza. A Centers for Disease Control and Prevention (CDC) health advisory stresses the importance of rapid and early antiviral treatment this season. Visit: http://www.floridahealth.gov/diseases-and-conditions/influenza/_documents/cdc-han-influenza-12-27-2017.pdf.
• The Florida Department of Health recommends that sick people stay home until fever-free for at least 24 hours (without the use of fever-reducing medication) and that all people use good handwashing practices.
National influenza activity: • Influenza activity decreased and remained below the national baseline. • As in Florida, influenza A (H3) has been the most common strain of influenza identified
for the season; however, influenza B viruses have been more frequently reported than influenza A viruses since early March.
• This late-season circulation of influenza B is expected.
Florida 2017-18
Season FLU REVIEW Week 20: May 13-19, 2018 Summary
Posted May 23, 2018 on the Bureau of Epidemiology (BOE) website: www.floridahealth.gov/floridaflu Produced by the BOE, Florida Department of Health Contributors: Heather Rubino, PhD; Julia Munroe, MS; Mwedu Mtenga, MPH; Katie Kendrick, MPH; Amy Bogucki, MPH; Lea Heberlein-Larson, MPH; Valerie Mock, BS; Marshall Cone, MPH; Pam Colarusso, MSH; Janet Hamilton, MPH, Leah Eisenstein, MPH.
Influenza and ILI Outbreaks Reported as of 5/20/2018
Sporadic
Weekly State Influenza Activity
Table of Contents
on the next page
A (H3)
Predominately Circulating Strain
For more information see
page 6
For more information see
page 2
For more information see page 4
For more information see page 5

Page 2 In This Issue Page 2
Statewide ILI Visits
2017-18 2016-17 2015-16 2014-15
Figure 1 shows the percent of visits for ILI from ED and UCC chief complaint data for ESSENCE-FL participating facilities (n=323), week 40, 2014 to week 20, 2018.
In week 20, the percent of visits to EDs and UCCs decreased statewide. Levels were similar to those observed during previous seasons at this time.
Data indicate influenza activity this season peaked during week 5 (ending February 3, 2018).
ED and UCC Visits for ILI by Flu Season ED = emergency department, UCC = urgent care center, ILI = influenza-like illness
2017-181 1 1 1 1 1 1 1 1
2016-171 1 1 1 1 1 1 1 1 1 1 1 1
2015-161 1 1 1 1 1 1 1 1 1 1 1 1 1 1 1 1 1 1 1 1 1 1 1
2014-151 1 1 1
2013-141 1 1 1 1 1 1 1 1 1 1 1
8 11 14Se
aso
n17 20
Week40 43 46 49 52 2 5
Influenza surveillance goals:
• Influenza surveillance is conducted to detect changes in the influenza virus. These data are used to help determine the annual national vaccine composition and to prepare for potential epidemics or pandemics.
• Surveillance is also conducted to identify unusually severe presentations of influenza infection, detect outbreaks, and determine seasonal influenza trends in order to guide influenza prevention, particularly in high-risk populations like children, adults ≥65 years old, and pregnant women. These activities are particularly important at the start of flu season in order to identify potential changes in circulating influenza strains.
Note: Surveillance case definitions for influenza-like illness vary across surveillance systems. For more information on influenza surveillance systems and associated case definitions used in Florida, see page 17
In This Issue .................................................................. 2
Statewide ILI Visits ....................................................... 2
Statewide ILI Outpatient Visits and P&I Deaths ........... 3
County influenza and ILI Activity Maps ........................ 4
ILI Activity and Outbreaks by Setting ........................... 5
Influenza Laboratory Surveillance ................................ 6
Regional ILI Visits ......................................................... 7
Age Groups: ILI Visits and P&I Deaths .......................... 8
At-Risk Populations: Children ....................................... 9
Influenza-Associated Pediatric Deaths ....................... 10
At-Risk Populations: Pregnant Women ...................... 10
At-Risk Populations: Adults ≥ 65 Years Old ................ 11
Respiratory Syncytial Virus Surveillance .................... 12
Other Respiratory Virus Surveillance ........................ 13
Outbreak Summaries ................................................. 14
Florida ILI Surveillance System Summary .................. 17
Weekly State Influenza Activity Reporting Table of Contents
Influenza activity in Florida can vary widely from season to season. This unpredictability underscores the importance of influenza surveillance in Florida.
0
2
4
6
8
10
12
40 42 44 46 48 50 52 1 3 5 7 9 11 13 15 17 19 21 23 25 27 29 31 33 35 37 39
Pe
rce
nt
of V
isit
s
Week
Figure 1
Below is the state influenza activity level reported to the Centers for Disease Control and Prevention each week since the 2013-14 influenza season. Florida reported sporadic influenza activity for week 20.
No data Sporadic Local Regional Widespread
The ESSENCE-FL ILI syndrome is composed of chief complaints that include the words “influenza” or “flu,” or chief complaints that include the words “fever” and “cough,” or
“fever” and “sore throat.” For more information on ESSENCE-FL , see page 17.
2017-181 1 1 1 1 1 1 1 1
2016-171 1 1 1 1 1 1 1 1 1 1 1 1
2015-161 1 1 1 1 1 1 1 1 1 1 1 1 1 1 1 1 1 1 1 1 1 1 1
2014-151 1 1 1
2013-141 1 1 1 1 1 1 1 1 1 1 1
8 11 14
Seas
on
17 20
Week40 43 46 49 52 2 5

Page 3 Statewide ILI Outpatient Visits and P&I Deaths Page 3
0
50
100
150
200
250
300
350
400
450
40 46 52 5 11 17 23 29 35 41 47 1 7 13 19 25 31 37 43 49 3 9 15 21 27 33 39 45 51 5 11 17
Nu
mb
er
of P
&I D
eath
s
Week
Expected Data
Upper Bounds
P&I Death Count
Figure 4 shows the number of preliminary estimated P&I deaths* for all Florida counties, the number of deaths predicted using a multi-year regression model, and the upper bound of the 95% confidence interval for this prediction.
P&I Deaths* Multi-Year Regression Model P&I = pneumonia and influenza
0
50
100
150
200
250
300
350
400
40 42 44 46 48 50 52 1 3 5 7 9 11 13 15 17 19 21 23 25 27 29 31 33 35 37 39
Nu
mb
er
of P
&I D
eath
s
Week
Figure 3 shows P&I deaths* for all Florida counties from the Bureau of Vital Statistics, as reported into ESSENCE-FL, week 40, 2014 to week 19, 2018.
In week 19 (ending May 12, 2018), 183 P&I deaths were reported.
The preliminary number of P&I deaths increased, but remained below levels observed during previous seasons at this time for the fourth week in a row.
P&I Deaths* from Vital Statistics by Flu Season P&I = pneumonia and influenza
Figure 2 shows the percent of visits for ILI reported by ILINet outpatient providers statewide (n=44), week 40, 2014 to week 20, 2018. For ILINet, ILI is defined as a fever ≥100°F AND sore throat and/or cough in the absence of another known cause.
In week 20, the percent of visits for ILI reported by ILINet outpatient providers decreased and was similar to levels observed in previous seasons at this time.
Visits for ILI to Outpatient Providers by Flu Season ILI = influenza-like illness
* Current season P&I death counts are preliminary estimates and may change as more data are received. The most recent data available are displayed here. Vital statistics death records received in ESSENCE-FL are considered to be complete through week 19, 2018.
Figure 4
0
1
2
3
4
5
6
7
40 42 44 46 48 50 52 1 3 5 7 9 11 13 15 17 19 21 23 25 27 29 31 33 35 37 39
Pe
rce
nt
of V
isit
s
Week
Figure 2
0
50
100
150
200
250
300
350
400
450
40 42 44 46 48 50 52 1 3 5 7 9 11 13 15 17 19 21 23 25 27 29 31 33 35 37 39
Nu
mb
er
of P
&I D
eath
s
Week
Figure 3
2014-15 2015-16 2016-17 2017-18
2017-18 2016-17 2015-16 2014-15
For week 19 (ending May 12, 2018), 183 preliminary estimated P&I deaths were reported.
The upper bound of the 95% confidence interval for prediction is 237 deaths, with no excess deaths.
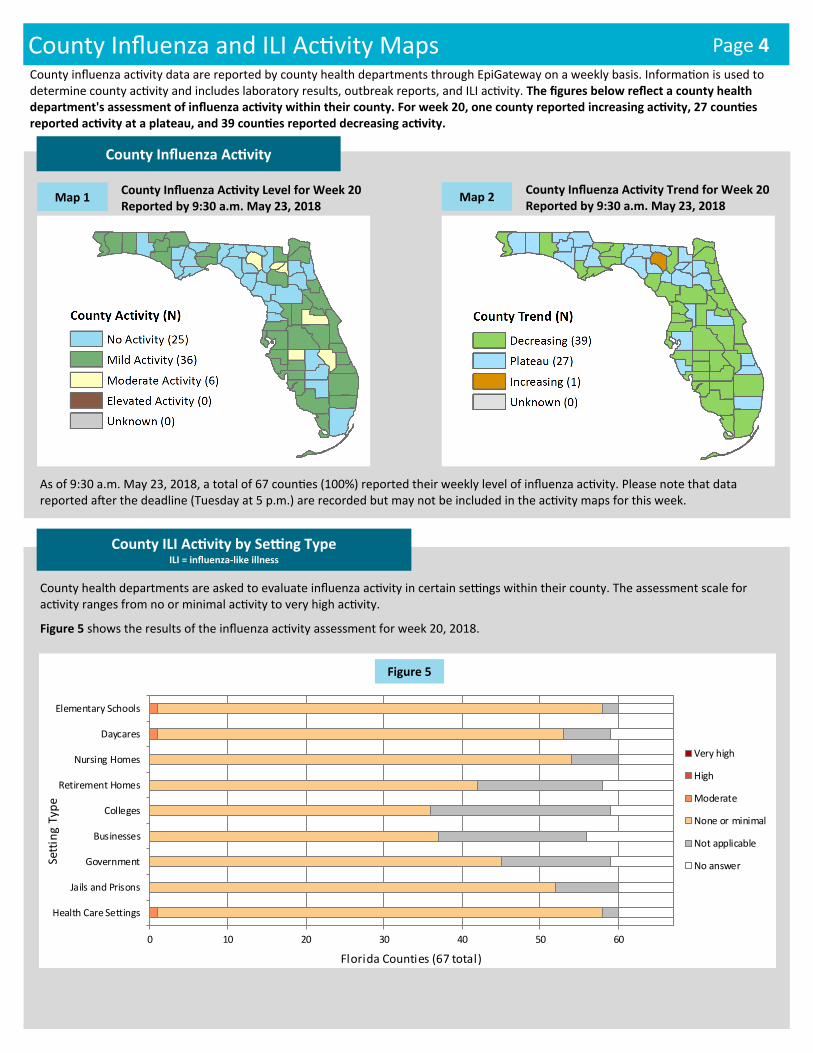
Page 4 County Influenza and ILI Activity Maps
As of 9:30 a.m. May 23, 2018, a total of 67 counties (100%) reported their weekly level of influenza activity. Please note that data reported after the deadline (Tuesday at 5 p.m.) are recorded but may not be included in the activity maps for this week.
County influenza activity data are reported by county health departments through EpiGateway on a weekly basis. Information is used to determine county activity and includes laboratory results, outbreak reports, and ILI activity. The figures below reflect a county health department's assessment of influenza activity within their county. For week 20, one county reported increasing activity, 27 counties reported activity at a plateau, and 39 counties reported decreasing activity.
County Influenza Activity
County Influenza Activity Level for Week 20 Reported by 9:30 a.m. May 23, 2018
Map 1 County Influenza Activity Trend for Week 20 Reported by 9:30 a.m. May 23, 2018
Map 2
County health departments are asked to evaluate influenza activity in certain settings within their county. The assessment scale for activity ranges from no or minimal activity to very high activity.
Figure 5 shows the results of the influenza activity assessment for week 20, 2018.
0 10 20 30 40 50 60
Health Care Settings
Jails and Prisons
Government
Businesses
Colleges
Retirement Homes
Nursing Homes
Daycares
Elementary Schools
Florida Counties (67 total)
Sett
ing
Typ
e
Very high
High
Moderate
None or minimal
Not applicable
No answer
Figure 5
County ILI Activity by Setting Type ILI = influenza-like illness

Page 5
Map 3 shows influenza and ILI outbreaks by county for week 40, 2017 through week 20, 2018, as reported into Merlin.
Total Outbreaks:
• In week 20, two outbreaks were reported: one with laboratory evidence of influenza and one ILI.
• Influenza and ILI outbreaks were reported in two counties, both located in the southern part of the state (see map 3). Both of these outbreak investigations are closed.
• A total of 507 outbreaks have been reported this season; this number may increase as sporadic outbreak reports are expected during the summer months. Of those, 465 (92%) have been in facilities serving people at higher risk for complications due to influenza infection (children and adults aged ≥65 years).
• More outbreaks have been reported this season than in previous seasons on record. An average of 91 total outbreaks were reported during the last five seasons.
Settings:
• In week 20, outbreaks occurred in the following settings: one in an assisted living facility and one in a school/camp.
• In the 2017-18 season, outbreaks occurred in the following settings: 64 (12%) in assisted living facilities, 86 (17%) in nursing facilities, 98 (19%) in other long-term care facilities, 2 (0.4%) in adult daycares, 85 (17%) in child daycares, 132 (26%) in schools/camps, 18 (4%) in correctional facilities/juvenile detention centers, 6 (1%) in hospitals, 2 (0.4%) in shelters, and 14 (3%) in other settings (figure 6).
Laboratory Testing:
• Neither of the two outbreaks reported in week 20 had specimens collected and submitted to the Bureau of Public Health Laboratories.
Control Measures:
• Outbreak control measures were not reviewed with facility leadership for one of the two outbreaks reported by county health departments (CHDs) in week 20. Information regarding control measures is not yet available for the other outbreak.
• Antiviral treatment for ill individuals was not recommended by CHDs for either of these outbreaks. • Antiviral chemoprophylaxis for at-risk individuals was not recommended by the CHDs for either of these outbreaks.
Hospitalizations and Deaths:
• Of the two outbreaks reported in week 20, one reported hospitalizations. No deaths have been reported in these two outbreaks.
• Of the 507 outbreaks reported so far this season, people were hospitalized in 131 outbreaks (26%) and deaths were reported in 25 outbreaks (5%).
For detailed information on select outbreaks reported during week 20, see page 16. For updates on select outbreaks reported in week 19 (ending May 12, 2018), see page 16.
For information on outbreaks reported in settings serving children, see page 9. For information on outbreaks reported in settings serving adults aged ≥65 years, see page 11.
Influenza and ILI Outbreaks by County Week 40, 2017 through Week 20, 2018
Map 3
Reported Influenza and ILI Outbreaks ILI = influenza-like illness
ILI Activity and Outbreaks by Setting
Reported Influenza and ILI Outbreaks by Facility Type ILI = influenza-like illness
0102030405060708090
Nu
mb
er o
f O
utb
rea
ks
Week
Schools/camps
Child daycares
Adult daycares
Nursing facilities
Assisted living facilities
Other long-term care facilities
Correctional facilities andjuvenile detention centersHospitals
Shelters
Other
Figure 6 Figure 6 shows the distribution of outbreaks by facility as reported in Merlin, week 40, 2017-week 20, 2018 by facility type.
In week 20, two outbreaks were reported: one with laboratory confirmation of influenza and one ILI.
0
2
4

Page 6 Laboratory Surveillance
Figure 7 shows the number of influenza-positive specimens tested by subtype and lab event date.*
While the most common influenza subtype detected at BPHL statewide for the 2017-18 influenza season has been influenza A (H3), in recent weeks, the percentage of specimens testing positive for influenza A viruses declined. The majority of influenza B viruses identified at BPHL thus far were Yamagata lineage, which is consistent with the national trend. A recent increase in influenza B activity has also been observed nationally. This late-season circulation of influenza B is expected.
Seasons in which A (H3) viruses predominate are associated with more severe illness in young children and adults ≥65 years old. While statewide data indicate influenza A (H3) is the predominantly circulating strain this season, these data also indicate a substantial amount of influenza B Yamagata lineage and influenza A 2009 (H1N1) viruses present and co-circulating.
*“Lab event date” is defined as the earliest of the following dates associated with influenza testing at the laboratory: date specimen collected, date received by the laboratory, date reported, or date inserted.
For county health departments seeking county-specific laboratory data, please refer to the Flu Lab Report in Merlin. For instructions on how to use the Flu Lab Report, please see the Guide to Flu Lab Report on the Bureau of Epidemiology website: www.floridahealth.gov/diseases-and-conditions/influenza/_documents/flulabreportguide.pdf
BPHL Viral Influenza Specimen Testing BPHL = Bureau of Public Health Laboratories
Table 1: Bureau of Public Health Laboratories (BPHL) Viral Surveillance by Lab Event Date*
Reported by 10:00 a.m. May 23, 2018
Influenza Type Current Week 20 Previous Week 19 Current 2017-18 Season
Total Specimens Tested 7 20 2593
Influenza positive specimens (% of total specimen tested) 4 (57.1%) 8 (40.0%) 1644 (63.4%)
Influenza A 2009 (H1N1) (% of influenza positives) 1 (25.0%) 1 (12.5%) 231 (14.1%)
Influenza A (H3) (% of influenza positives) - - 991 (60.3%)
Influenza A not yet subtyped (% of influenza positives) 1 (25.0%) 1 (12.5%) 60 (3.6%)
Influenza B Yamagata (% of influenza positives) 2 (50.0%) 6 (75%) 328 (20.0%)
Influenza B Victoria (% of influenza positives) - - 19 (1.2%)
Influenza B not yet subtyped (% of influenza positives) - 15 (0.9%) -
0
25
50
75
100
125
150
175
200
225
40 48 4 12 20 28 36 44 52 8 16 24 32 40 48 4 12 20
Tota
l Nu
mb
er o
f P
osi
tive
Tes
ts
Week
A (H3)
A 2009 (H1N1)
A (not yet subtyped)
B Victoria
B Yamagata
B (not yet subtyped)
2015-16 2016-17 2017-18
Figure 7

Page 7 Regional ILI Visits
Figures 8-14 show the percent of visits for ILI from ED and UCC chief complaints for ESSENCE-FL participating facilities (n=323), by ESSENCE-FL Regional Domestic Security Task Force regions (see map 4) from week 40, 2014 to week 20, 2018.* In week 20, the percent of ED and UCC visits
for ILI increased slightly in regions 1 and 6, remained the same in region 5, and decreased in all other regions. Levels were similar to those observed in previous seasons at this time in all regions.
ED and UCC Visits for ILI by Region ED = emergency department, UCC = urgent care center, ILI = influenza-like illness
0
5
10
15
20
40 44 48 52 3 7 11 15 19 23 27 31 35 39
Per
cen
t o
f V
isit
s
Week
Figure 8: Region 1 (21 facilities)
0
5
10
15
20
40 44 48 52 3 7 11 15 19 23 27 31 35 39
Per
cen
t o
f V
isit
s
Week
Figure 9: Region 2 (10 facilities)
0
5
10
15
20
40 44 48 52 3 7 11 15 19 23 27 31 35 39
Per
cen
t o
f V
isit
s
Week
Figure 10: Region 3 (37 facilities)
0
5
10
15
20
40 44 48 52 3 7 11 15 19 23 27 31 35 39
Percent of Visits
Week
0
5
10
15
20
40 44 48 52 3 7 11 15 19 23 27 31 35 39
Per
cen
t o
f V
isit
s
Week
Figure 11: Region 4 (55 facilities)
0
5
10
15
20
40 44 48 52 3 7 11 15 19 23 27 31 35 39
Per
cen
t o
f V
isit
s
Week
Figure 12: Region 5 (74 facilities)
0
5
10
15
20
40 44 48 52 3 7 11 15 19 23 27 31 35 39
Per
cen
t o
f V
isit
s
Week
Figure 13: Region 6 (40 facilities)
0
5
10
15
20
40 44 48 52 3 7 11 15 19 23 27 31 35 39
Per
cen
t o
f V
isit
s
Week
Figure 14: Region 7 (86 facilities)
2017-18 2016-17 2015-16 2014-15
Map 4
Emergency Departments (EDs) and
Urgent Care Centers (UCCs) Reporting
Data to ESSENCE-FL by Regional
Domestic Security Task Force Region,
May 23, 2018 (n=323)

Page 8
Figure 16 shows the number of visits for ILI reported by ILINet outpatient providers statewide (n=44) by age group, week 40, 2014 to week 20, 2018.
In week 20, the number of visits for ILI increased slightly in the 0-4 age group and decreased in all other age groups. In all age groups, levels were similar to those observed during previous seasons at this time.
Figure 15 shows the percent of visits for ILI from ED and UCC chief complaints by age group for ESSENCE-FL participating facilities (n=323), week 40, 2014 to week 20, 2018.
In week 20, ED and UCC visits for ILI decreased in all age groups. Levels were similar to those observed in previous seasons at this time in all age groups.
0
200
400
600
800
1000
40 46 52 5 11 17 23 29 35 41 47 1 7 13 19 25 31 37 43 49 3 9 15 21 27 33 39 45 51 5 11 17
Nu
mb
er
of
ILI V
isit
s
Week
Figure 16
Visits to Outpatient Providers for ILI by Age Group* ILI = influenza-like illness
*Data presented here are counts, not proportions. This is because age group denominator data is not available through ILINet.
0
5
10
15
20
25
40 46 52 5 11 17 23 29 35 41 47 1 7 13 19 25 31 37 43 49 3 9 15 21 27 33 39 45 51 5 11 17
Pe
rce
nt
of V
isit
s
Week
ED and UCC Visits for ILI by Age Group ED = emergency department, UCC = urgent care center, ILI = influenza-like illness
Figure 15
0
50
100
150
200
250
300
350
400
41 47 53 6 12 18 24 30 36 42 48 2 8 14 20 26 32 38 44 50 4 10 16 22 28 34 40 46 52 6 12 18
Nu
mb
er
of
P&
I De
ath
s
Week
P&I Deaths* from Vital Statistics by Age Group P&I = pneumonia and influenza
Figure 17
*Current season P&I death numbers are preliminary estimates and may change as more data are received. The most recent data available are displayed here. Vital statistics death records received in ESSENCE-FL are currently considered to be complete through week 19, 2018.
Figure 17 shows P&I deaths* for all Florida counties by age group, as reported into ESSENCE-FL, week 40, 2014 to week 19, 2018.
In week 19 (ending May 12, 2018), the preliminary number of P&I deaths increased in the ≥65 age group and decreased or remained the same in all other age groups. In all age groups, levels were similar to or below those observed during previous seasons at this time.
0 to 4 years old 5 to 24 years old 25 to 64 years old ≥65 years old
Age Groups: ILI Visits and P&I Deaths
2014-15 2015-16 2016-17 2017-18
2014-15 2015-16 2016-17 2017-18
2014-15 2015-16 2016-17 2017-18

Page 9 At-Risk Populations: Children
Figure 18 shows the percent of ILI visits among all ED and UCC visits for children ≤18 years old, as reported into ESSENCE-FL, week 40, 2014 to week 20, 2018.
In week 20, the percent of ILI visits among all ED and UCC visits for children ≤18 years old decreased and remained similar to levels observed during previous seasons at this time.
ED and UCC Visits for ILI by Children ≤18 Years Old ED = emergency department, UCC = urgent care center, ILI = influenza-like illness
0
5
10
15
20
25
40 42 44 46 48 50 52 1 3 5 7 9 11 13 15 17 19 21 23 25 27 29 31 33 35 37 39
Pe
rce
nt
of V
isit
s
Week
2014-15
2015-16
2016-17
2017-18
Figure 18
Background: Children, especially those with underlying health conditions, are at higher risk for severe complications from influenza infection. The single best way to protect children from influenza is to get them vaccinated every year. The Centers for Disease Control and Prevention recommends vaccination as long as influenza viruses are circulating. To find a flu shot near you, please visit: www.floridahealth.gov/findaflushot.
Outbreaks in Facilities Serving Children ILI = influenza-like illness
Total outbreaks in facilities serving children:
• In week 20, two total outbreaks were reported. One of the two outbreaks was reported in a facility serving children (schools/camps or child daycares). This outbreak does not have laboratory confirmation of influenza.
• This outbreak were reported in the southern part of the state and its investigation is closed.
Settings:
• This outbreak was reported in a school/camp.
Laboratory testing:
• No specimens were available for testing at the Bureau of Public Health Laboratories for this outbreak.
Control measures:
• Control measures were not discussed with facility leadership for this outbreak.
Hospitalizations and deaths:
• No hospitalizations or deaths were reported for this outbreak.
0
20
40
60
80
100
120
140
160
Schools/camps Child daycares
Nu
mb
er o
f O
utb
rea
ks
Single etiology
Multiple etiologies
Unknown etiology
Figure 20
Figure 19 shows the distribution of each outbreak etiology reported in facilities serving children (schools/camps and child daycares) as reported into Merlin, week 40, 2017 through week 20, 2018. Outbreaks with multiple etiologies are displayed more than once.
Figure 20 shows the number of outbreaks reported in facilities serving children (schools/camps and child daycares) by single, multiple or unknown etiology as reported into Merlin, week 40, 2017 through week 20, 2018.
0
20
40
60
80
100
120
140
160
Schools/camps Child daycares
Nu
mb
er o
f O
utb
rea
ks
Influenza A (H3)
Influenza A 2009 (H1N1)
Influenza A unspecified
Influenza B Yamagata
Influenza unspecified
Influenza B unspecified
Respiratory syncytial virus
Rhinovirus
Human metapneumovirus
Streptococcal phargngitis
Unknown etiology
Figure 19

Page 10
At-Risk Populations: Children
ESSENCE-FL collects data daily from 323 EDs and UCCs. Data are processed into 11 different syndrome categories based on the patient's chief complaint. One of the categories is ILI, which is composed of chief complaints that include the words "influenza" or "flu," or complaints that contain “fever” and “cough,” or “fever” and “sore throat.” The Florida Department of Health uses ED and UCC chief complaint data to monitor influenza and ILI activity in a timely manner in groups at higher risk of severe health outcomes (such as hospitalization and death) from influenza infection. These at-risk groups include pregnant women, children ≤18 years old, and adults ≥65 years old.
Pregnant women and their babies are at higher risk for severe complications due to influenza infection.
Figure 24 shows the number of visits* to EDs and UCCs with chief complaints of influenza infection and pregnancy, as reported into ESSSENCE-FL, week 40, 2014 to week 20, 2018.
In week 20, the number of visits to EDs and UCCs by pregnant women with mention of influenza decreased and was similar to levels observed during previous seasons at this time.
ED and UCC Visits for ILI by Pregnant Women ED = emergency department, UCC = urgent care center, ILI = influenza-like illness
0
20
40
60
80
100
120
40 42 44 46 48 50 52 1 3 5 7 9 11 13 15 17 19 21 23 25 27 29 31 33 35 37 39
Nu
mb
er
of V
isit
s
Week
2014 -15
2015- 16
2016-17
2017-18
Figure 24 *This count under-represents the true number of pregnant women presenting for care to EDs and UCCs with influenza. The overall trend has been validated through review of hospital discharge data collected by the Agency for Health Care Administration.
Figures 21-23 show the number of pediatric deaths associated with influenza infection, week 40, 2013 to week 20, 2018.
In week 20, no new influenza-associated pediatric deaths were confirmed. A total of eight influenza-associated pediatric deaths have been confirmed as of week 20. All of the deaths confirmed so far this season have been in unvaccinated children.
While rare, Florida receives reports of influenza-associated pediatric deaths each season. Most deaths occur in unvaccinated children with underlying health conditions. Children, especially those with underlying health conditions, are at higher risk of severe outcomes from influenza infection.
A recent study showed that flu vaccination can reduce a child’s likelihood of dying from influenza by 50-60%. For more information, visit: https://www.cdc.gov/media/releases/2017/p0403-flu-vaccine.html.
0
5
10
15
2013-14 2014-15 2015-16 2016-17 2017-18
Co
un
t
Influenza Season
Influenza-Associated Pediatric Deaths by Vaccination Status
Unvaccinated
Vaccinated
Vaccination statusunknown
Influenza-Associated Pediatric Deaths
0
5
10
15
2013-14 2014-15 2015-16 2016-17 2017-18
Co
un
t
Influenza Season
Influenza-Associated Pediatric Deaths by Strain Type
Influenza A (H3)
Influenza A 2009 (H1N1)
Influenza A unspecified
Influenza B
Influenza subtyping notperformed
0
5
10
15
2013-14 2014-15 2015-16 2016-17 2017-18
Co
un
t
Influenza Season
Influenza-Associated Pediatric Deaths by Medical History
No known underlyingconditions
Underlying health conditions
At-Risk Populations: Pregnant Women
Figure 21
Figure 22
Figure 23
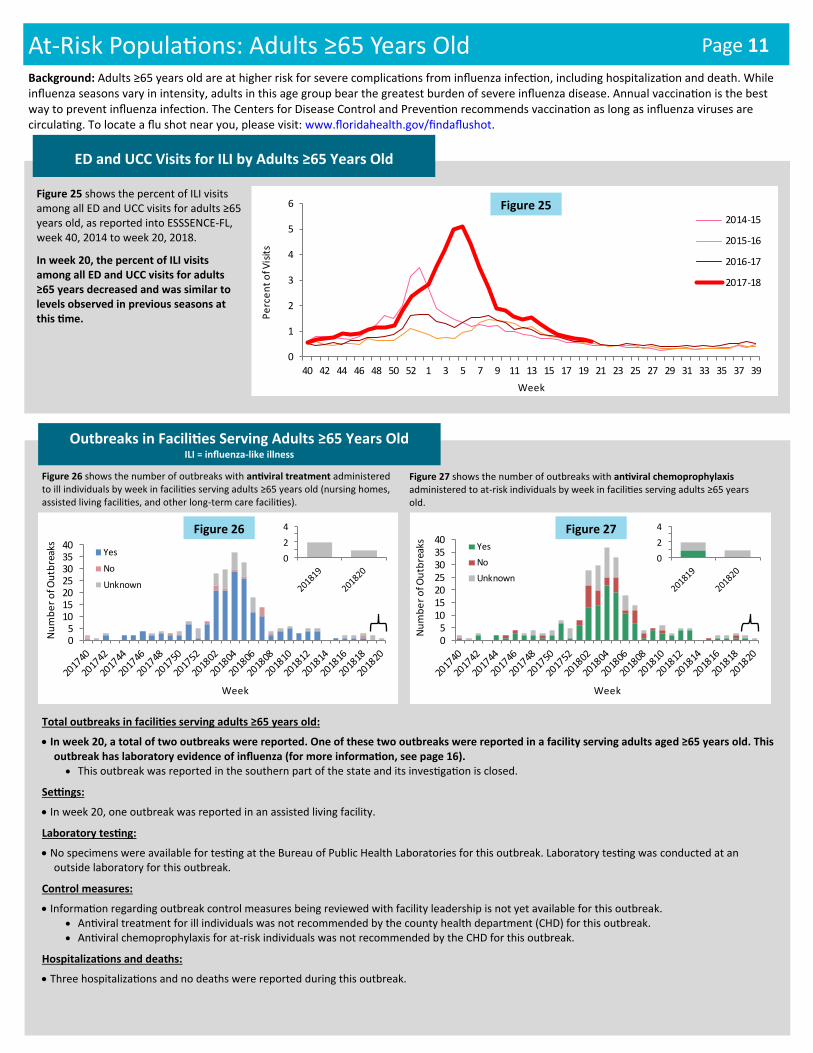
Page 11 At-Risk Populations: Adults ≥65 Years Old
Figure 25 shows the percent of ILI visits among all ED and UCC visits for adults ≥65 years old, as reported into ESSSENCE-FL, week 40, 2014 to week 20, 2018.
In week 20, the percent of ILI visits among all ED and UCC visits for adults ≥65 years decreased and was similar to levels observed in previous seasons at this time.
ED and UCC Visits for ILI by Adults ≥65 Years Old
0
1
2
3
4
5
6
40 42 44 46 48 50 52 1 3 5 7 9 11 13 15 17 19 21 23 25 27 29 31 33 35 37 39
Pe
rce
nt
of V
isit
s
Week
2014-15
2015-16
2016-17
2017-18
Figure 25
Background: Adults ≥65 years old are at higher risk for severe complications from influenza infection, including hospitalization and death. While influenza seasons vary in intensity, adults in this age group bear the greatest burden of severe influenza disease. Annual vaccination is the best way to prevent influenza infection. The Centers for Disease Control and Prevention recommends vaccination as long as influenza viruses are circulating. To locate a flu shot near you, please visit: www.floridahealth.gov/findaflushot.
Outbreaks in Facilities Serving Adults ≥65 Years Old ILI = influenza-like illness
Total outbreaks in facilities serving adults ≥65 years old:
• In week 20, a total of two outbreaks were reported. One of these two outbreaks were reported in a facility serving adults aged ≥65 years old. This outbreak has laboratory evidence of influenza (for more information, see page 16).
• This outbreak was reported in the southern part of the state and its investigation is closed.
Settings:
• In week 20, one outbreak was reported in an assisted living facility.
Laboratory testing:
• No specimens were available for testing at the Bureau of Public Health Laboratories for this outbreak. Laboratory testing was conducted at an outside laboratory for this outbreak.
Control measures:
• Information regarding outbreak control measures being reviewed with facility leadership is not yet available for this outbreak. • Antiviral treatment for ill individuals was not recommended by the county health department (CHD) for this outbreak. • Antiviral chemoprophylaxis for at-risk individuals was not recommended by the CHD for this outbreak.
Hospitalizations and deaths:
• Three hospitalizations and no deaths were reported during this outbreak.
Figure 26 shows the number of outbreaks with antiviral treatment administered to ill individuals by week in facilities serving adults ≥65 years old (nursing homes, assisted living facilities, and other long-term care facilities).
05
10152025303540
Nu
mb
er
of O
utb
reak
s
Week
Yes
No
Unknown
Figure 26
05
10152025303540
Nu
mb
er
of O
utb
reak
s
Week
Yes
No
Unknown
Figure 27
Figure 27 shows the number of outbreaks with antiviral chemoprophylaxis administered to at-risk individuals by week in facilities serving adults ≥65 years old.
0
2
4
0
2
4

Page 12 Respiratory Syncytial Virus Surveillance
Respiratory syncytial virus (RSV) activity:
• In week 20, the percent of children <5 years old diagnosed with RSV at emergency departments and urgent care centers increased and remained above levels observed during previous seasons at this time.
• Florida’s southeast region is currently in RSV season.
• No new RSV-associated pediatric deaths were identified in week 20. One RSV-associated pediatric death has been identified so far this year. Premature infants and children <2 years with underlying medical conditions are at higher risk for severe complications from RSV infection. Prophylaxis is available for children who qualify. For more information, contact your physician.
• To learn more about RSV in Florida, please visit: www.floridahealth.gov/rsv.
RSV seasonality:
• RSV activity in Florida typically peaks in November through January, though activity can vary dramatically by region. According to CDC, the start of RSV season is marked by the first two consecutive weeks during which the average percentage of specimens testing positive for RSV is ≥10%.
• Florida has established regular RSV seasons based on these thresholds. Despite circulation at lower levels in different regions at different times of year, RSV is detected in all regions throughout the year.
• Florida’s RSV season is longer than the rest of the nation and has distinct regional seasonality. For more information on RSV seasonality in Florida, see the American Academy of Pediatrics’ (AAP) 2015 Red Book.
0
1
2
3
4
5
30 32 34 36 38 40 42 44 46 48 50 52 1 3 5 7 9 11 13 15 17 19 21 23 25 27 29
Pe
rce
nt
of V
isit
s
Week
ED and UCC Visits for RSV by Children <5 Years Old ED = emergency department, UCC = urgent care center, RSV = respiratory syncytial virus
Figure 28 shows the percent of visits to EDs and UCCs with discharge diagnoses that include RSV or RSV-associated illness, as reported by participating ESSSENCE-FL facilities (n=323), week 30, 2014 to week 20, 2018.
In week 20, the percent of children presenting to participating EDs and UCCs for care with RSV increased and remained above levels observed during previous seasons at this time.
2017-18
2016-17
2015-16
2014-15
Figure 28
Florida Respiratory Syncytial Virus (RSV) Regional Season Breakdown Map 5
RSV surveillance goals:
• A statewide RSV surveillance system was implemented in Florida to support clinical decision-making for prophylaxis of premature infants. The determination of unique seasonal and geographic trends of RSV activity has important implications for prescribing patterns for initiating prophylaxis to children at high risk for RSV infection. The AAP currently recommends that preapproval for prophylactic treatment be made based on state surveillance data.
• See the back page of this report for more information on RSV surveillance systems used in Florida: page 17
Laboratory RSV Surveillance RSV = respiratory syncytial virus
2017-18
2016-17
2015-16
2014-15
0
5
10
15
20
25
30 32 34 36 38 40 42 44 46 48 50 52 1 3 5 7 9 11 13 15 17 19 21 23 25 27 29
Perc
ent P
ositi
ve
Week
Figure 29 Figure 29 shows the percent of specimens testing positive for RSV, as reported by hospital laboratories (n=10), week 30, 2014 to week 20, 2018.
In week 20, the percent of specimens testing positive for RSV decreased.
*This overall trend has been validated through review of hospital discharge data collected by the Agency for Health Care Administration.
* *
Summary Week 20: May 13-19, 2018
2018 surveillance data are under evaluation to determine if these regions are still in RSV season despite reaching the end of the pre-determined season

Page 13 Other Respiratory Virus Surveillance
RSV
Parainfluenza 1-3
Adenovirus
MPV
Rhinovirus
Influenza
Figure 30 shows the percent of laboratory results testing positive for eight common respiratory viruses, as reported by hospital laboratories (n=10), week 40, 2014 to week 20, 2018.
In week 20, the percent of specimens testing positive for rhinovirus decreased, but was higher than other respiratory viruses under surveillance.
0
5
10
15
20
25
30
35
40 48 3 11 19 27 35 43 51 7 15 23 31 39 47 3 11 19 27 35 43 51 7 15
Pe
rce
nt
Po
siti
ve
Week
Figure 30
Non-Influenza ARIES Laboratory Outpatient Surveillance* ARIES = Acute Respiratory Infection Epidemiology and Surveillance Program
BPHL = Bureau of Public Health Laboratories
2014-15 2015-16 2016-17 2017-18
0
5
10
15
20
25
40 44 48 1 5 9 13 17 21 25 29 33 37 41 45 49 1 5 9 13 17
Nu
mb
er
Po
siti
ve
Week
Figure 31
Figure 31 shows the number of specimens testing positive for 12 common respiratory viruses, as reported by BPHL and ARIES outpatient providers statewide (n=6), week 40, 2016 to week 19, 2018.
In week 19 (ending May 12, 2018), none of the specimens submitted by ARIES providers to BPHL tested positive by extended respiratory panel testing.
*Data presented here are counts, not proportions. The most recent data available are displayed here. ARIES laboratory data are currently considered to be complete through week 19, 2018. Laboratory results for specimens that have not yet been tested in full will be included in future reports.
Laboratory Viral Respiratory Surveillance
Other Respiratory Virus Surveillance
Statewide activity:
• In week 20, the percent of specimens testing positive for rhinovirus decreased, but remained higher than all other respiratory viruses under surveillance.
Enterovirus D68 (EV-D68) activity:
• In week 20, no new people tested positive for EV-D68 in Florida.
• No people have tested positive for EV-D68 by PCR so far in 2018. In 2017, three people tested positive for EV-D68 by PCR in Florida. One person was identified in August 2017 during the investigation of an ILI outbreak. Two people were identified in October 2017 as part of routine outpatient surveillance as a result of Florida participating in the Acute Respiratory Infection Epidemiology and Surveillance (ARIES) Program.
• To learn more about EV-D68, please visit: http://www.floridahealth.gov/diseases-and-conditions/d68.
Outbreaks:
• In week 20, one outbreak of influenza B and parainfluenza unspecified was reported. No outbreaks of respiratory syncytial virus (RSV), adenovirus, human metapneumovirus (MPV), or rhinovirus were reported in week 20.
RSV Coronavirus 229E
Parainfluenza 1 Coronavirus NL63
Parainfluenza 2 Coronavirus OC43
Parainfluenza 3 Coronavirus HKU1
Adenovirus Enterovirus
MPV EV-D68
Rhinovirus

Page 14 Outbreak Summaries Table 2: Week 20 Outbreaks: Summary of Florida Influenza and ILI Outbreaks by Setting
Setting Number of outbreaks (percent of outbreaks)
Implicated viruses
Schools/camps 1 (50%) • 1 outbreak of unknown etiology
Child daycares 0 (0%) • No outbreaks
Adult daycares 0 (0%) • No outbreaks
Correctional facilities and juvenile detention centers
0 (0%) • No outbreaks
Nursing facilities 0 (0%) • No outbreaks
Assisted living facilities 1 (50%) • 1 outbreak of influenza B unspecified & parainfluenza unspecified
Other long-term care facilities 0 (0%) • No outbreaks
Hospitals 0 (0%) • No outbreaks
Shelters 0 (0%) • No outbreaks
Other 0 (0%) • No outbreaks
Total 2 (100%) • 1 outbreak of influenza B unspecified & parainfluenza unspecified • 1 outbreak of unknown etiology
Table 3: Season Total: Summary of Florida Influenza and ILI Outbreaks by Setting
Setting Number of outbreaks (percent of outbreaks)
Implicated viruses
Schools/camps 132 (26%)
• 1 outbreak of influenza A (H3) • 1 outbreak of influenza A (H3) & influenza B Yamagata lineage • 1 outbreak of influenza A (H3) & influenza B unspecified • 1 outbreak of influenza A 2009 (H1N1) • 23 outbreaks of influenza A unspecified • 13 outbreaks of influenza A unspecified & influenza B unspecified • 1 outbreak of influenza A unspecified, influenza B unspecified, & human
metapneumovirus (MPV) • 2 outbreaks of influenza B Yamagata lineage • 7 outbreaks of influenza B unspecified • 1 outbreak of influenza B unspecified & Streptococcal pharyngitis • 16 outbreaks of influenza unspecified • 1 outbreak of influenza unspecified & respiratory syncytial virus (RSV) • 1 outbreak of RSV • 63 outbreaks of unknown etiology
Child daycares 85 (17%)
• 1 outbreak of influenza A (H3) • 18 outbreaks of influenza A unspecified • 7 outbreaks of influenza A unspecified & influenza B unspecified • 1 outbreak of influenza A unspecified, influenza B unspecified, & RSV • 1 outbreak of influenza A unspecified & RSV • 2 outbreaks of influenza B unspecified • 18 outbreaks of influenza unspecified • 8 outbreaks of RSV • 1 outbreak of rhinovirus • 28 outbreaks of unknown etiology
Adult daycares 2 (0.4%) • 1 outbreak of influenza A (H3) & influenza B unspecified • 1 outbreak of influenza B unspecified
Correctional facilities and juvenile detention centers
18 (4%)
• 7 outbreaks of influenza A (H3) • 2 outbreaks of influenza A (H3) & influenza A 2009 (H1N1) • 2 outbreaks of influenza A (H3) & influenza B Yamagata lineage • 1 outbreak of influenza A (H3) & RSV • 1 outbreak of influenza A unspecified • 4 outbreaks of influenza B Yamagata lineage • 1 outbreak of adenovirus
Nursing facilities 86 (17%)
• 22 outbreaks of influenza A (H3) • 1 outbreak of influenza A (H3) & influenza A 2009 (H1N1) • 1 outbreak of influenza A (H3), influenza B unspecified, & RSV • 1 outbreak of influenza A (H3) & parainfluenza 1 • 1 outbreak of influenza A 2009 (H1N1) • 20 outbreaks of influenza A unspecified • 7 outbreaks of influenza A unspecified & influenza B unspecified • 3 outbreaks of influenza B Yamagata lineage • 1 outbreak of influenza B Yamagata lineage & coronavirus HKU1 • 1 outbreak of influenza B Yamagata lineage & MPV • 1 outbreak of influenza B Yamagata lineage & RSV • 1 outbreak of influenza B Yamagata lineage, rhinovirus, adenovirus, & enterovirus • 10 outbreaks of influenza B unspecified • 2 outbreaks of influenza unspecified • 1 outbreak of RSV & rhinovirus • 13 outbreaks of unknown etiology
Table 3 continued on page 15.

Page 15 Table 3: Season Total: Summary of Florida Influenza and ILI Outbreaks by Setting, Continued
Setting Number of outbreaks (percent of outbreaks)
Implicated viruses
Assisted living facilities 64 (12%)
• 8 outbreaks of influenza A (H3) • 2 outbreaks of influenza A (H3) & influenza A 2009 (H1N1) • 1 outbreak of influenza A (H3), influenza B unspecified, parainfluenza 1, & MPV • 1 outbreak of influenza A 2009 (H1N1) • 26 outbreaks of influenza A unspecified • 4 outbreaks of influenza A unspecified & influenza B unspecified • 4 outbreaks of influenza B unspecified • 1 outbreak of influenza B unspecified & parainfluenza unspecified • 5 outbreaks of influenza unspecified • 2 outbreaks of RSV • 10 outbreaks of unknown etiology
Other long-term care facilities 98 (19%)
• 16 outbreaks of influenza A (H3) • 1 outbreak of influenza A (H3), influenza A 2009 (H1N1), & influenza B Yamagata lineage • 2 outbreaks of influenza A (H3) & influenza B unspecified • 1 outbreak of influenza A (H3) & adenovirus • 1 outbreak of influenza A (H3) & coronavirus HKU1 • 1 outbreak of influenza A (H3) & coronavirus NL63 • 1 outbreak of influenza A (H3) & rhinovirus • 1 outbreak of influenza A (H3), rhinovirus, & enterovirus • 1 outbreak of influenza A 2009 (H1N1) • 26 outbreaks of influenza A unspecified • 16 outbreaks of influenza A unspecified & influenza B unspecified • 2 outbreaks of influenza B Yamagata lineage • 1 outbreak of influenza B Yamagata lineage, influenza A unspecified, & RSV • 1 outbreak of influenza B Yamagata lineage & MPV • 6 outbreaks of influenza B unspecified • 3 outbreaks of influenza unspecified • 1 outbreak of rhinovirus • 17 outbreaks of unknown etiology
Hospitals 6 (1%)
• 1 outbreak of influenza A (H3) & influenza B Yamagata lineage • 1 outbreak of influenza A 2009 (H1N1) • 2 outbreaks of influenza A unspecified • 1 outbreak of influenza B unspecified • 1 outbreak of RSV
Shelters 2 (0.4%) • 1 outbreak of influenza A (H3) • 1 outbreak of influenza A (H3) & rhinovirus
Other 14 (3%)
• 3 outbreaks of influenza A (H3) • 5 outbreaks of influenza A unspecified • 1 outbreak of influenza A unspecified & influenza B unspecified • 1 outbreak of influenza unspecified • 4 outbreaks of unknown etiology
Total 507 (100%)
• 59 outbreaks of influenza A (H3) • 5 outbreaks of influenza A (H3) & influenza A 2009 (H1N1) • 1 outbreak of influenza A (H3), influenza A 2009 (H1N1), & influenza B Yamagata lineage • 4 outbreaks of influenza A (H3) & influenza B Yamagata lineage • 4 outbreaks of influenza A (H3) & influenza B unspecified • 1 outbreak of influenza A (H3), influenza B unspecified, parainfluenza 1, & MPV • 1 outbreak of influenza A (H3), influenza B unspecified, & RSV • 1 outbreak of influenza A (H3) & adenovirus • 1 outbreak of influenza A (H3) & coronavirus HKU1 • 1 outbreak of influenza A (H3) & coronavirus NL63 • 1 outbreak of influenza A (H3) & parainfluenza 1 • 1 outbreak of influenza A (H3) & RSV • 2 outbreaks of influenza A (H3) & rhinovirus • 1 outbreak of influenza A (H3), rhinovirus, & enterovirus • 5 outbreaks of influenza A 2009 (H1N1) • 121 outbreaks of influenza A unspecified • 48 outbreaks of influenza A unspecified & influenza B unspecified • 1 outbreak of influenza A unspecified, influenza B unspecified, & MPV • 1 outbreak of influenza A unspecified, influenza B unspecified, & RSV • 1 outbreak of influenza A unspecified & RSV • 11 outbreaks of influenza B Yamagata lineage • 1 outbreak of influenza B Yamagata lineage & coronavirus HKU1 • 2 outbreaks of influenza B Yamagata lineage & MPV • 1 outbreak of influenza B Yamagata lineage & RSV • 1 outbreak of influenza B Yamagata lineage, rhinovirus, adenovirus, & enterovirus • 1 outbreak of influenza B Yamagata lineage, influenza A unspecified, & RSV • 31 outbreaks of influenza B unspecified • 1 outbreak of influenza B unspecified & parainfluenza unspecified • 1 outbreak of influenza B unspecified & Streptococcal pharyngitis • 45 outbreaks of influenza unspecified • 1 outbreak of influenza unspecified & RSV • 12 outbreaks of RSV • 1 outbreak of RSV & rhinovirus • 2 outbreaks of rhinovirus • 1 outbreak of adenovirus • 135 outbreaks of unknown etiology

Page 16
Reported Influenza and ILI Outbreaks ILI = influenza-like illness
BPHL = Bureau of Public Health Laboratories
In week 20, two outbreaks were reported in Merlin: one with laboratory confirmation of influenza and one ILI. One select outbreak is summarized below.
Lee County
• An assisted living facility reported 17 residents and one staff member with ILI. Three individuals sought treatment at local emergency departments and three individuals were hospitalized. None of the ill individuals died. Seven specimens were collected from ill individuals for testing at an outside laboratory. Of the seven specimens that were tested, five specimens tested positive for parainfluenza unspecified (test type unknown) and one specimen tested positive for influenza B unspecified (test type unknown). No specimens were available for testing at BPHL. Influenza vaccination status for the 2017-18 season for residents and staff is currently unknown. Information regarding control measures is not yet available. This investigation is closed.
In week 19 (ending May 12, 2018), three outbreaks were reported into Merlin. None of these outbreaks were selected for summarization.

Page 17 Florida ILI Surveillance System Summary Florida ILINet Data source for figures 2 and 16 • ILINet is a nationwide surveillance system composed of sentinel providers, predominately outpatient health care providers.
Florida has 118 sentinel providers enrolled in ILINet who submit weekly influenza-like illness (ILI) and total visit counts, as well as submit ILI specimens to the Bureau of Public Health Laboratories (BPHL) for confirmatory testing.
ESSENCE-FL Syndromic Surveillance and Vital Statistics Portal Data source for figures 1, 3-4, 8-15, 17-18, 24-25, 28; map 4 • Electronic Surveillance System for the Early Notification of Community-based Epidemics (ESSENCE-FL) measures trends in ILI
visits from emergency departments (ED) and urgent care clinics (UCC) and influenza mortality by using death certificates from the Bureau of Vital Statistics. Participating EDs and UCCs (n=323) electronically transmit visit data into ESSENCE-FL daily or hourly.
• For statewide and regional data on ILI, visits are counted as ED or UCC visits to participating facilities that include the words “influenza” or “flu” in patient chief complaints. Chief complaints with the words “fever” and “cough,” or “fever” and “sore throat” are also counted as ILI.
• For pneumonia and influenza (P&I) mortality surveillance, death record literals are queried using a free-text query that searches for references to P&I on death certificates. Any mention of P&I in the death certificate literals, with certain exceptions, is counted as a P&I death. Deaths counts are aggregated and presented by date of death.
• For respiratory syncytial virus (RSV) surveillance, visits are counted as ED or UCC visits to participating facilities for which RSV or RSV-associated illness is included in the discharge diagnosis. Death record literals are also queried using a free-text query that searches for references to RSV on death certificates for children <18 years old. Any mention of RSV in the death certificate literals, with certain exceptions, is counted as an RSV-associated pediatric death.
• For RSV mortality surveillance, death record literals are queried using a free-text query that searches for references to RSV on death certificates. Any mention of RSV, syncytial, and bronchiolitis in the death certificate literals, with certain exceptions, is counted as a RSV death.
County Influenza Activity in EpiGateway Data source for figure 5, and maps 1 and 2 • County health department (CHD) epidemiologists report their county’s influenza and ILI surveillance data weekly into the
EpiGateway website. Influenza activity is classified as: no activity, mild, moderate, or elevated. Setting-specific influenza activity and influenza trend information is also reported. EpiGateway data provided by CHDs creates a county-by-county breakdown of influenza and ILI activity around the state.
Outbreak Reporting in Merlin Data source for figures 6, 19-20, 26-27, map 3, and tables 2 and 3 • Merlin tracks influenza and ILI outbreak investigations by CHDs. Reports by CHDs include the type of respiratory disease
causing the outbreak and settings where outbreaks are occurring. CHD epidemiologists report outbreaks of influenza or ILI into Merlin, Florida’s reportable disease surveillance system.
• Outbreaks are defined as two or more cases of influenza or ILI in a specific setting.
Bureau of Public Health Laboratories (BPHL) Data source for figure 7 and table 1 • BPHL performs confirmatory testing and subtyping on surveillance specimens from sentinel providers, outbreak
investigations, patients with severe or unusual influenza presentations, and medical examiners. • For county-specific laboratory data, please refer to the Flu Lab Report in Merlin. For instructions on how to use the Flu Lab
Report, please see the Guide to Flu Lab Report on the Bureau of Epidemiology website at www.floridahealth.gov/diseases-and-conditions/influenza/_documents/flulabreportguide.pdf.
Laboratory Viral Respiratory Surveillance Data sources for figures 29-30 • The National Respiratory and Enteric Virus Surveillance System (NREVSS) and Electronic Laboratory Reporting (ELR) collect
data from laboratories in Florida on a weekly basis and monitor temporal and geographic patterns of eight commonly circulating respiratory viruses. NREVSS data is collected by the Centers for Disease Control and Prevention (CDC) and ELR data is collected by the Florida Department of Health (DOH).
Acute Respiratory Infection Epidemiology and Surveillance (ARIES) Program Data source for figure 31 • Acute Respiratory Infection Epidemiology and Surveillance Program (ARIES) is a nationwide surveillance system composed of
nine participating jurisdictions. Florida has seven sentinel providers enrolled in ARIES who submit weekly ILI counts, as well as submit ILI specimens to BPHL for testing.
Case-Based Influenza Surveillance • Death in a child whose laboratory-confirmed influenza infection has been identified as a contributing to the child’s death is
reportable in Florida. Influenza-associated pediatric deaths are documented by CHDs in Merlin. • In addition, an individual of any age infected with novel or pandemic influenza strain(s) is reportable in Florida. Pandemic
strain influenza cases are documented by CHDs in Merlin. • For more information about reportable diseases, please visit www.Floridahealth.gov/diseasereporting.