fluid mechanics applied to the study of atmospheric circulations
TRANSCRIPT

PAPERS IN PHYSICAL OCEANOGRAPHY AND METEOROLOGYPUBLISHED BY
MASSACHUSETTS INSTITUTE OF TECHNOLOGYAND
WOODS HOLE OCEANOGRAPHIC INSTITUTION
VOL. VII, NO. i
FLUID MECHANICS APPLIED TO THE STUDYOF ATMOSPHERIC CIRCULATIONS
(Research conducted in cooperation with U. S. Department of Agricultureunder Bankhead-Jones Special Research Fund)
PART I
A STUDY OF FLOW PATTERNS WITH THE AID OFISENTROPIC ANALYSIS
A. On the Maintenance of the Westerlies South of the Polar FrontBY
CARL-GUSTAF ROSSBY
B. Technique and Examples of Isentropic AnalysisBY
JEROME NAMIAS
C. Isentropic Analysis of a Case of Anticyclogenesis
BY
RITCHIE G. SIMMERS
CAMBRIDGE AND WOODS HOLE, MASSACHUSETTS
December, 1938

CONTENTS
PREFACE AND ACKNOWLEDGMENTS 3INTRODUCTION . 5A. ON THE MAINTENANCE OFTHE WESTERLIES SOUTH OF THE POLAR FRONT-Car/-Gus/a! Rossby 9B. TECHNIQUE AND EXAMPLES OF ISENTROPIC ANALYSis-Jerome Namias 18i. Technique 18
i. Plotting routine
a. Values chosen for representationb. An alternate method of representing data2. Analysis .a. Preliminary construction of contour linesb. Isentropic flow patterns
c. Non-adiabatic effectsd. Weight of air contained between isentropic surfaces
II. Isentropic Analysis for the Period June 21-30, 1937 38I. The surface weather
2. General character of isentropic flow patterns3. On the relation between shower activity and isentropic flow patterns4. Detailed day by day analysisIII. Summary 49IV. Plates 51
C. ISENTROPIC ANALYSIS OF A CASE OF ANTlCYCLOGENESls-Ri/chie G. Simmers 72i. Introduction. 72II. The Synoptic Situation 74i. General features
2. Data available
3. Detailed descriptionIII. The 305° Isentropic Charts 83i. Day by day discussion
2. General featuresIV. Vertical Structure of the Flow Patterns 92
i. The 300°, 310° and 315° isentropic charts
2. Circulation above the 315° surface
3. Circulation below the 300° surfaceV. Relationship between Flow Patterns and the Distribution of Thunder-storms 96
VI. Anticyclogenesis and the Transition of the Anticyclone from Cold toWarm Type . 97i. Transi tion
2. AnticyclogenesisVII. Summary 102VIII. Plates 103REFERENCES 122
PREFACE AND ACKNOWLEDGMENTS
This paper constitutes Part I of a report on certain investigations which have been inprogress at the Massachusetts Institute of Technology during the past few years andwhich have been supported in part with funds provided by the Weather Bureau of theU. S. Department of Agriculture under the Bankhead-Jones Special Research Fund. Theultimate purpose of these investigations is to develop a sound physical model of the gen-eral circulation of the atmosphere, in the hope that an improved understanding of thisprocess eventually may furnish valuable clues as to how the time range of our
presentdaily weather forecasts may be extended and their quality be improved.
In the past, the interpretation of the large-scale circulations of the atmosphere withthe aid of the tools of classical hydrodynamics has suffered from the fact that these toolswere designed for the study of thermodynamically inactive fluids, in which, furthermore,viscous or eddy stresses could be neglected. Through the work of V. Bjerknes and hisstudents a good start has now been made towards the development of a science of hydro-dynamics applicable also to thermodynamically active fluids, in which density changesare taking place as a result of non-adiabatic temperature changes. The removal of thesecond restriction-i.e., the development of hydrodynamic tools adapted to the study offluids in which eddy stresses playa dominant role-has been accomplished mainlythrough the investigations of the Göttingen school of fluid mechanics.
As yet, no synthesis of these two modern developments has been accomplished, al-though it is becoming increasingly clear that such a synthesis is needed before any head-way can be made with the interpretation of the behaviour of the atmosphere. There hasbeen a tendency on the part of meteorologists to assume that the effects of eddy stressesare restricted to a layer near the ground, and that the atmosphere above this layer be-haves approximately as an ideal fluid. Even fairly elementary considerations show thata real understanding of atmospheric circulations becomes absolutely impossible on thebasis of this assumption.
A modest first attempt towards such a synthesis of the Norwegian and German de-velopments wil be attempted in these reports. It wil be shown that the movements inthe free atmosphere above the ground friction layer are affected by large-scale lateralmixing processes which produce shearing stresses acting across vertical planes, and oneor two examples will be given to demonstrate that reasonable steady state solutions forthe atmosphere can be obtained by taking this internal stress distribution into account.
It will be shown, moreover, that the distribution of cold sources and heat sources inthe free atmosphere is at least in part controlled by the stress distribution, which regú-lates the location of ascending and descending movements.
The investigations here reported have been directed by the undersigned, and con-ducted as a collaborative undertaking by a number of persons. In addition to the authorsappearing on the title page of this part of the report, Dr. C. L. Pekeris of the MassachusettsInstitute of Technology, Messrs. H. Wexler, G. Grimminger and V. Starr of the WeatherBureau, Prof. A. F. Spilhaus of New York University, and Dr. Hans Ertel of the Uni-versity of Berlin have made valuable contributions, mainly of a theoretical nature. Re-lated investigations, also under the Bankhead-Jones Special Research Fund, have been inprogress in the Meteorological Research Division of the Weather Bureau at Washington,
3

4 PAPERS IN PHYSICAL OCEANOGRAPHY AND METEOROLOGY
and wil be reported in later publications elsewhere; the contributions of those mentionedabove will be coordinated and presented in the form of a theoretical discussion of atmos-pheric circulations, to be published as Part II of the report.
To a very large extent the results presented below are based on studies of the upperair data analyzed as a matter of daily routine in the Meteorological Division of the
Massachusetts Institute of Technology. Dr. H. C. Willett, Professor J. Holmboe andMr. G. Lukes have carried a large portion of this work and made valuable contributionsin the many discussions preceding the preparation of our report.
All of us wish to take this opportunity to publicly acknowledge our appreciation ofthe wholehearted support this investigation has received from the late Chief of the U. S.Weather Bureau, Dr. Willis R. Gregg, in whom our division had a sincere friend andsupporter.
Dr. C. F. SarIe, principal economist of the Bureau of Agricultural Economics, tookthe initiative toward a coordination of governmental an¿ university facilities for thepurpose of getting under way a broad research program in basic meterological problems.We are greatly appreciative of his initiative, broàd vision and unfailing support.
c.-G. ROSSBY
.

INTRODUCTION
In summer the principal extra-tropical front in North America is normally foundsomewhere in the vicinity of the Great Lakes. During this season, and apart from occa-sional inundations with rapidly warming polar air, the United States is covered with ablanket of tropical air and its weather is consequently to a large extent controlled byprocesses occurring within this air mass.
The prevailing movement in the tropical air consists in a slow drift eastward. A studyof various aerological mean cross sections through the United States for the summermonths reveals that during this season the temperature in the lower half of the tropo-sphere is fairly constant throughout the greater portion of the country. Thus there areno solenoids available to generate kinetic energy, and it follows that the movements ob-served must derive their energy from other regions and then most likely from the north,where there is a marked concentration of solenoids around the polar front. (Figs. la and b.)
August 1936 January 1937
SAULT STE MARIE DETROIT DAYTON NASHVILLE MONTGOMERY PENSACOLA SAULT STE MARIE DETROIT DAVTON NASHVILLE MONTGOMERY PENSACOLA320
311( 315" "" " ".., " _ __ ~2C
305 --""" D
2 D 300 .... , ,315 __..320
, ,"- "" 4 ,'-'- 295.. ,, ,,
310 -_ , ""'-
4 --..- - 290 -- , - ,,,305 --
, "285 -- -,,280 -_
,,10
300 '-_275 -_12--_. 305--
295 -- --- 14 270 --8 I.
290 -- _- 30 265 -_- -M
FIGS. lA AND lB.-Vertical cross sections Sault Ste. Marie-Pensacola, showing the distribution of potential tempera-ture (broken lines) and specific humidity (full lines). Note the practically horizontal isentropic lines in the August sectionsouth of Dayton, indicating absence of solenoids in this region. The fairly uniform slope of the isentropic lines in theJanuary section suggests a uniform distribution of solenoids over the major portion of the country.
The absence of solenoids over the greater portion of the country further suggests thatthis is a region where the kinetic energy of the atmosphere is undergoing incessant decayand dissipation. Such a decay must be associated with a breaking up of the individualcurrent systems into eddies of varying diameters. The summer time movements withinthe tropical air over the United States are no exception to this rule. By means of a tech-nique to be described further down in this report, it will be shown that the flow patternsin the lower half of the troposphere are characterized by the frequent formation of vor-tices, mostly anticyclonic, which tend to remain stagnant or drift very slowly eastwardacross the con tinen t.
These slow-moving vortices are capable of bringing about frequent and thorough re-distributions of the moisture in the troposphere and may thus have a profound influenceon the occurrence and the distribution of summer time precipitation in the United States.For this reason and because of the light they shed on the dynamics of the westerliessouth of the polar front, they have been subjected to a detailed synoptic study, the prin-cipal results of which are set forth in the first part of our report.
As a framework for the study of these vortex patterns, a brief theoretical discussionof the dynamics of the westerlies south of the polar front precedes the synoptic analysis.It is suggested that the west winds in the tropical air south of the polar front most
5

6 PAPERS IN PHYSICAL OCEANOGRAPHY AND METEOROLOGY
readily can be explained as the result of lateral frictional drag from the strong westwinds observed above the polar front and maintained there by direct solenoidal circula-tion. It is also suggested that the formation of large anticyclonic vortices is the result ofthe dynamic instability associated with the strong lateral shear within the westerlies.This dynamic instability has been discussed by Pekeris (1938).
The flow patterns discussed below were established with the aid of a new techniquewhich, for the sake of brevity, has been named "isentropic analysis." In view of the new-ness and fruitfulness of this technique a brief summary of its development and basicprinciples is included in this introduction. (see also Rossby and colI. 1937 a,b; Rossby1938 c; Namias 1938 a and b.)l
Isentropic analysis may be defined as a method for determining free air trajectorieswhich makes essential use orthe fact that the currents in the free atmosphere, withincertain fairly well-defined restrictions and over not too long periods of time, are con-strained to move within and with their proper isentropic surfaces rather than in hori-zontal planes. This fundamental fact suggests that synoptic charts for the free atmos-phere be drawn for surfaces of constant entropy rather than for constant geopotential,since charts of the first-mentioned type would enable one to follow approximately thesame sheet of air from one day to the next.
The suggestion that free air weather maps be drawn for isentropic surfaces was firstmade by Sir Napier Shaw several years ago (Shaw 1933). Using mean summer valuesfrom various aerological stations in the Northern Hemisphere, he constructed a chartgiving the distribution of isotherms on a prescribed isentropic surface. Shaw pointed outthat on such a surface, isotherms, isobars and lines of constant density coincide. Usingsurface, observations of pressure and temperature and adopting a uniform increase ofentropy with elevation he also constructed a synoptic isentropic chart for the British Isles.
Shaw's suggestion never received the attention it deserved. In part this may havebeen due to the poor development of the aerological networks in Europe and Americaat that time, but it is probable that other factors contributed to retard the introductionof isentropic charts. The polar front theory had then just been accepted and there wasstill a general tendency to believe that the structure of the free atmosphere could befairly well extrapolated from the observed distribution of fronts and air masses at theground. Thus the few upper air soundings available were considered mainly as means forverifying the interpretations of the surface maps.
During the last few years the aerological network of the United States has reached astate of development which far surpasses that of any other part of the world. Daily
analysis of the rich aerological material thus made available has brought out the factthat the relation between surface fronts and upper air structure is far more complex thanmight have been anticipated on the basis of the polar front theory. There is indeed, onmany sides, an impression that the development, movement and destruction of frontsoften merely reflect large-scale developments in the middle portion of the troposphere.If this point of view is correct, a method must be found to utilize the daily upper airdata in such a fashion that they tell something new and essential about the free air flowpatterns, not merely verify the results of our surface analyses; but, in the absence of
aiiy acceptable working hypothesis for the movements in mid-troposphere, no clue hasbeen available as to how this additional information could be extracted from the upperair data.
Some time ago Richardson and Proctor (1925) directed the attention of meteorolo-gists to the existence of large-scale lateral mixing processes in the free atmosphere. Froma study of the lateral diffusion of volcanic dust and from the scattering of toy balloonsthey arrived at kinematic coeffcients for the lateral diffusion varying from 2'106 to
i References are listed alphabetically at the end of this volume.

VOL. VII, NO. 1. FLUID MECHANICS APPLIED TO THE STUDY OF ATMOSPHERIC CIRCULATIONS 7
1.3' 109 cm2 per sec. These values refer to diffusion over distances ranging from 3 to 86
km. It is reasonable to assume that the turbulent mechanism responsible for this scatter-ing must produce an equally intensive lateral diffusion of momentum. If the above co-effcients are converted into eddy viscosity, the resulting coeffcients will fall between2.5.103 and 1.6. 106 grams per cm per sec.
As a result of the strong gravitational stability of the atmosphere, the eddy move-ments responsible for lateral diffusion must take place along isentropic surfaces ratherthan in strictly horizontal planes. The shearing stresses that develop from this eddy mo-tion would naturally tend to scatter the momentum of any limited current sideways. Itthus appears that one should find in the free atmosphere, when properly represented, acounterpart to the jet stream or "Freistrahl", which has been investigated both theoret-ically and experimentally in the Göttingen laboratories, particularly by Tollmien (1926).
In order to study the effects of this lateral mixing, we decided to investigate the airmovements in individual isentropic surfaces, as suggested by Shaw, but with the impor-tant modification that we now had a dynamic model before us, namely the jet stream. Todetermine the intensity of the mixing in the isentropic surfaces and thus the intensityof the lateral shearing stresses, the observed distribution of water vapor content in theisentropic surface was followed from day to day. With the aid of this identifying elementit was possible to establish trajectories on the isentropic surface and to make an estimateof the degree of mixing. Preliminary calculations by Grimminger (1938) have givenvalues for the eddy diffusion coeffcient between 4' 105 and 5' 107 grams per cm per sec.
These values fall below the value of about 108 obtained by Defant (1921) for the at-mosphere as a whole, considering the general circulation between high and low latitudesas a turbulent process. The difference is to be expected, since in Defants scheme wholecyclones and anticyclones serve as turbulent elements, whereas we are concerned withthe large-scale mixing between one individual current and its environment. On the otherhand, the values found by Grimminger exceed those obtained by Richardson and Proctor,which likewise is to be expected, since Grimminger's values refer to diffusion over muchlarger distances than those considered by Richardson and Proctor.
After a few attempts during the winter of 1936-1937 (Osmun 1937), isentropic chartshave been constructed daily since May 1937 and very little diffculty has been experi-enced in the attempt to maintain continuity from day to day. From a dynamic point ofview, the most significant result of this work has been the discovery of the fact that, atleast during the warmer season, the current systems observed on our charts show amarked tendency to break up in anticyclonic vortices of diameters varying between per-haps a few hundred and fifteen hundred miles (Rossby and colI. 1937 a and b, Wexler andNamias 1938). It is important to keep in mind that the isentropic surfaces analyzed by usnormally are characterized by fairly strong westerly winds to the north. It is our beliefthat these anticyclonic eddies represent a mechanism for the dissipation of the kineticenergy of the west winds. A detailed discussion of this problem will be given later in thetheoretical report.
The anticyclonic eddies normally occur in air masses which, on the basis of the sur-face map analyses, must be classified as fairly homogeneous tropical air. The discovery~f these eddies, a discovery which could not easily have been made without the aid ofisentropic analysis, furnishes ample evidence that the number of principal troposphericmodels is not limited to air masses and fronts, as sometimes stated (Bergeron 1937).
It has been found that these eddies normally consist of one dry and one moist tonguewhich converge and wind up anticyclonically around each other, the converging air beingremoved by sinking near the center, as shown by the persistent dryness of the innermostportion of the eddy.
The existence of a summer time high level anticyclone at fixed levels in the free

8 PAPERS IN PHYSICAL OCEANOGRAPHY AND METEOROLOGY
atmosphere over the interior of the United States was established in a valuable paper byReed already in 1933 (Reed 1933). However, Reed's technique, which was based on theuse of wind readings at fixed levels, could not disclose the complex structure of these anti-cyclones and did not bring out the fact that these vortices move and that several mayexist simultaneously over the continent and adjacent oceans. For these and other reasons,the thermal explanation offered by Reed has been discarded in favor of a dynamictheory, which interprets these vortices as frictionally driven by the stronger westerlywinds to the north.
If the two principles of isentropic motion and of intense, isentropic mixing are
accepted, we must necessarily revise our conception of fronts and air mass boundaries.No reasonably permanent air mass boundary or front can intersect an isentropic surfacein which intense mixing occurs. Daily vertical cross sections through the atmosphereare now drawn for potential temperature and specific humidity. The analysis of thesecross sections has shown that a consistent acceptance of the above logical conclusionpermi ts a better understanding of the distribution of water vapor in these sections, where-as cross sections of the older type, in which fronts were drawn on the basis of horizontaland vertical variations in actual temperature, sometimes have led to irreconcilable con-flicts between consecutive sections.
In consequence of the arguments set forth above no fronts are entered on the isen-tropic charts presented below. This does not mean that sharp wind shift lines do notoccur. It wil be shown in the theoretical report that the mixing process itself, in con-junction with the deflecting force of the earth's rotation, must lead to the development ofcounter currents on both sides of a spreading current, but the wind shift lines thus createdmove relative to the air and cannot be classified as true air mass boundaries.
The kinetic energy of the atmosphere must be generated through solenoidal circula-tion and thus requires the existence of currents crossing the isentropic surfaces. In manycases the regions of such non-adiabatic sinking and rising areeasiIy established from astudy of the water vapor distribution and its interdiurnal change in a prescribed isen-tropic surface. It appears that regions of strong non-adiabatic ascent (warming) areconcentrated to fairly narrowly confined regions in anyone prescribed isentropic surfacewell above the ground friction layer. The cooling is probably slow and fairly widespread.If consecutive isentropic surfaces are charted for 50 intervals of potential temperatureit is unlikely that radiational cooling in one day could displace an individual air particlefrom its original surface to the one next below. It will be shown that the location ofthese regions of non-adiabatic vertical motion to a large extent is controlled by the lateralfrictional stresses, which cause departures from gradient flow and thus horizontal con-vergence and divergence. However, at present we are concerned primarily with the
essentially isentropic movements associated with the development and eventual break-down of the strong current systems observed in the free atmospheric, and for this purposethe assumption of isentropic motion is adequate.
The daily work with isentropic charts has led to the establishment of a practicallyimportant correlation between convective rainfall and the advance of moist and drytongues in isentropic surfaces well removed from the ground. This application wil bediscussed below by Mr. N amias and a preliminary report on this subject has already been,published (Namias 1938a).
The drifting anticyclonic eddies appear to have a definite cycle of growth and decay.The amalgamation of such a high level anticyclone with a migratory low level cold anti-cyclone appears to be responsible for the anticyclogenesis not infrequently observed inthe eastern part of the country after inundations with rapidly subsiding polar air.A detailed discussion of this problem is presented by Dr. Simmers in the last section ofthis part of the report.
c.-G. ROSSBY

A. ON THE MAINTENANCE OF THE WESTERLIESSOUTH OF THE POLAR FRONT
BY C.-G. ROSSBY
The maintenance of the broad belt of westerly winds between the polar front and thesubtropical high pressure area has never been adequately explained. There is a steady lossof momentum within this westerly current due to ground friction, and this loss must beoffset through an influx of momentum from the environment. In an attempt to deter-mine the source of this supply Jeffreys (1926) computed the gain of momentum throughthe northward flow within the frictional layer next to the ground. He found that on theaverage the momentum thus supplied to each vertical column represents a very smallfraction of the loss within the same column due to the action of ground friction, and con-cluded that a steady west wind belt symmetrically distributed around the northernhemisphere cannot be maintained but that the west winds are reestablished from time totime through west-east pressure gradients.
In the present paper an attempt will be made to show that the required momentummost likely is supplied through lateral diffusion from the strong belt of westerlies nor-mally found farther to the north and above the principal polar front. The maintenance ofthese winds above the polar front is taken care of by a transversal circulation in the samedirection as the circulation acceleration caused by the solenoid distribution in the polarfront itself. This maintenance has been analyzed in a preliminary study published else-where (Rossby 1938 b and c) and wil be discussed in detail in Part II of this report. Forthe present it is suffcient to assume that at the latitude where the polar front reachesthe ground a strong westerly wind of vertically constant velocity Uo prevails throughoutthe entire atmosphere. Through lateral friction this strong west wind drags along a beltof air further to the south.
In the following analysis the y-axis points south with its origin at the point where thepolar front intersects the ground. The x-axis points eastward. On the assumption that theconvective acceleration term may be neglected, the equation of motion for the x-axisthen takes the form
(i)a ( au)
o = - pjv + - pii - ,ay ay
v being the southward component of motion, p the density,! the Coriolis' parameter andII the kinematic eddy viscosity due to lateral mixing. It will be assumed that the westwind velocity u and the kinematic viscosity II both are independent of elevation. Underthese conditions the mass distribution is barotropic and the horizontal density varia-tions are so small that equation (i) may be simplified and written
a ( au)o = - jv + - II - .
ay ay(2)
(3)
It wil now be assumed that the kinematic viscosity II is given by the expression
au11= -/2_,
ay
9
10 PAPERS IN PHYSICAL OCEANOGRAPHY AND METEOROLOGY
/ being the mixing length of the lateral turbulence, assumed to be independent of y. Theminus sign is needed since u decreases with increasingy. Thus
fv = - f2 ~r(8U)2J.8y L 8)'
This equation applies above the layer of ground friction influence. Within the latterlayer there is a flow northward, the total mass transport northward per centimeter oflatitude being given by the equation
(4)
(5)Tx
M_y = -,¡
T x represen ting the x-component of the total stress (To) exerted by the wind per uni t hori-
zontal area at the ground. This frictional transport of air across the isobars takes placewithin a layer of depth K next to the ground.
The transversal motion caused by the lateral shearing stress gives rise to a masstransport southward which may be computed from (4) and has the value
(6) f 00 P 8 r(8U)2J*My' = 0 pvdz = - ¡; l2 ßy L ßy .
The net flow across any latitude circle must vanish. Thus
(7)
and consequently
M_y = My'
Tx = - po l2 ~ r(8U)2J.g 8y L 8y
The ground stress To depends upon the wind velocity (wa) at anemometer level (30 mabove the ground/upon the air density next to the ground, Po. Thus .
t",,-t
(8)
(9) TO = pOKi2Wa 2,
the non-dimensional constant Ki2 having a value of about 25 '10-4. (Taylor 1916) Fromthis equation one obtains
(10) TO = pOKi2(:a)2u2
and finally, since the stress To has the same direction as the wind at anemometer level,
(ii) Tx = TO cas CPo = pOKi2 (:a) 2 COS CPO' U2.
The ratio of anemometer wind speed to gradient wind speed ha:s a value of about 0.6(Taylor 1916) The angle CPo between surface wind direction and gradient wind direction
* The integration is extended all the way to the ground, it being assumed that lateral stresses are at work also in theground-friction layer.
VOL. VII, NO. I. FLUID MECHANICS APPLIED TO THE STUDY OF ATMOSPHERIC CIRCULATIONS I I
varies between a minimum of perhaps 100 at sea to a maximum of about 300 on land.For rough estimates it is suffcient to write
(12) T;¡ = POK2U2,Substitution in (8) gives
K2 = 9' 10-4.
(13)po a L(aU)2J
poK2U2 + -/2- - = 0g ay ay
or
(14) ;:12 u2 + ; L G:YJ = o.
Ho being the height of the homogeneous atmosphere and defined by the equation
(IS) Ho = ~ = RTo . (R=gas constant)pog mg mIn the last equation To represents the air temperature at the ground.
We seek a solution of (14) which vanishes for y= 00 and has the value u=uo for y=o.It is easily seen that
(16)
the length L being given by
U = uoe-y/L,
(17) 1!2Ho/2L= _.
K2i~
The distribution of ujuo as a function ofyjL is given by the full line in Fig.j.
The southward component above the ground friction layer is obtained by substituting(16) in (4)' The result is
(18)2/2 2l2uo2
V = - u2 = - e-2y/L == voe-2y/LjD jDand, with the aid of (17),
V UoK2(19) - = - e-2y/L.Uo lIßThe distribution of vjuo is given by the broken line in Fig. 2.
The southward flow indicated by (19) is characterized by horizontal convergence,while the northward flow in the ground friction layer is divergent. Thus a vertical flow isestablished, the intensity of which may be computed with the aid of the continuity re-quirement. One finds '
a pv a pw-+-=0ay az(20)

12 PAPERS IN PHYSICAL OCEANOGRAPHY AND METEOROLOGY
\\\\
or, after integration,
3: x/OUo\u.O=20m/s£c\
\\.. \u.o
a f'"pw = - pvdz.
ay z
and finally, since v is independent of z,
1.0
0.8
0.6
,,"0.4 ,
0.2
(21)
(22) pw = ~ (pvJ.ay g
The pressure varies only slightly ina horizontal direction and thus
p av RT avW=--=--.pg ay mg ay
It is possible to introduce a streamfunction if for the transversal circula-tion. The equation of continuity is
.2 .4 .6 .8 1.0 12 "I satisfied ifL
f'" pvFIG. 2.-DistributIon of axial and horizontal transversal (24) ý; = pvdz = -,,velocI ties wi thin the westerlies. z g
.. .. .. .. ..(23)
and
(25)aý;
pw =-,ay
pv =aý;
az
This transversal circulation cannot be maintained without an appropriate distribu-tion of cold sources. Their intensÜy per unit mass and time, dqjd/, is easily calculated.One has
(26) p dq = pCp T dO = Cp T (pv ao + pw ao).dt 0 dt 0 ay azin which expression e is the potential temperature and Cp the specific heat.
This equation may be written
(27)dq T ao
p - = Cp - - (pw - pv tan a Jdt 0 az
ao
aytan a = - --
ao
az
= Cp r- ao (aý; + aý; tan aJo az ay az
= cPr- ao.aý;(i _ tan aJ.o az ay tan ß
In this expression a represents the angle between the isentropic lines and the horizontal,positive when the isentropic lines ascend towards the south, and ß the angle between the

VOL. VII, NO. i. FLUID MECHANICS APPLIED TO THE STUDY OF ATMOSPHERIC CIRCULATIONS 13
transversal stream lines and the horizontaL. Under the assumed condition of constantgradient wind with elevation a is very small compared with ß and (27) reduces to
· (28)dq T ao ai/
p - = Cp- --dt 0 az ay
ordq T ao- = Cp- -w = cp('Yo - 'Y)w,dt 0 az
'Yo and 'Y being the adiabatic and actual temperature lapse-rates.For purposes of numerical evaluation of the last equation, it is suffcient to evaluate
(23), which gives
(29)
(30)RT av RT vW=--=-2--mg ay mg L
and consequently
(31)dq RT 'Yo - 'Y-=-2Cp--'V.dt mg L
It is interesting to note that
I~I
I a2u Iay2
and thus, if one accepts the similarity hypothesis (von Kármán 1930) the mixing lengthL would be constant as assumed above. On the other hand, von Kármán defines the mix-ing length L with the aid of the equation
(32) =L
(33)i~i
I a2u Iay2
which in this case would lead to very large mixing lengths. Through a combination of(17) and (33) one finds, for H = 8 km,
2k03Ho(34) 1=- = 975.5 kmK2
1= ko = koL, ko = 0.38
,~
g
(35)2k02Ho
L = ~ = 2567 kmK2
and for the eddy viscosity
(36)
17 = pk02V! :; I = pk02Lu
2pkéHou= pkolu =
K2

14 PAPERS IN PHYSICAL OCEANOGRAPHY AND METEOROLOGY
For y =0 and uo= 10 mps. this last equation would give a maximum value of about4.9.107 c.g.s. units for 1/. We shall accept the expressions (34), (35) and (36), whilekeeping the numerical value of ko open. f
Returning now to the rate of cooling, it follows from (23) and (29) that
dq av(37) dt = cpho - 'Y)HT ay'
HT being the height nf the homogeneous atmosphere at temperature T. One obtains from(18)
au 4f2u2(38) --
ay jDand, with the aid of (34) and (35),
au u20(39) --.
ay jk02H02
Substitution in (37) gives
dq , K4U2(40) - = - c ('Yo - 'Y) -.HTdtP jk02H02A clearer picture of the heat loss is obtained by expressing it in terms of the tempera-
ture drop that it would cause in one day, if no sinking occurred. This temperature dropt: T is given by
(41)i dq
/:T = - - -.24"3600cp dt
or
24.3600. K4
(42) /:T = ('Yo - 'Y)HTu2.ko2jH02
The maximum cooling occurs next to the polar front, just at the top of the frictionallayer, where HT is very nearly equal to Ho and where the west wind has its maximumspeed Uo. The cooling at this point is given by
24.3600' K4
(43) /:Tmax = ('Yo - 'Y)u02ko2jHo
and the relative value at any other point may be computed from
/:T = HT(~)2= HT e-2y/L = !e-2Y/L./:Tmax Ho Uo Ho To(44)
This result is based on the additional assumption that the temperature lapse rate 'Y iseverywhere constant.
It is evident that there must be agreement between the dynamically prescribed and thethermodynamically possible distribution oj cold sources. At first sight the theory here pre-

VOL. VII, NO.!. FLUID MECHANICS APPLIED TO THE STUDY OF ATMOSPHERIC CIRCULATIONS 15
sented appears to violate completely this requirement since the rate of cooling accordingto (44) decreases rapidly to the south, in spite of the fact that the temperature distribu-tion is practically uniform horizontally. In view of our present deplorable lack of knowl-edge concerning the radiation balance in the free atmosphere, it is not possible to discussthis phase of the problem quantitatively, and thus the following qualitative commentsmust suffce.
There must be a tendency towards a decrease southward in the net loss of heat fromthe free atmosphere, due to the increased absorption of radiation from the ground and ofshort wave solar radiation. In the northern part of the westerlies, where the transversalstream lines emanate from moderate heights, the air must contain much more moisturethan further south where the transversal circulation brings down very dry air from ex-tremely high levels, and this again would seem to further a greater heat loss to the norththan to the south.
The necessary agreement between the dynamically prescribed and thermodynamically pos-sible distribution oj cold sources may, however, in part be brought about by dynamic means.If the lower isentropic surfaces just south of the polar front intersect the ground, the
lateral stresses exerted along the northern edge of some of the isentropic sheets will, tosome extent, be balanced by ground stresses, and these layers are then subjected to amuch less intense transversal circulation than the one here computed. In this case thegradient wind distribution within the westerlies would no longer be barotropic and thesolution presented above would have to be considerably modified.
It would be tempting to develop a theory for the westerlies from a prescribed dis-tribution of cold sources. It is doubtful, however, if such a procedure would bring us verymuch closer to the true solution, since there can be no doubt that the actual distributionof cold sources is very largely determined by the moisture distribution, which, at least inpart, must be dynamically controlled.
On the basis of von Kármán's value of ko=0.38 the theory leads to values for themixing length of about 1000 km and values for the lateral eddy viscosity of the order ofmagnitude which approach those obtained by Defant (1921) in his interpretation of thegeneral circulation as a turbulent process. These values are definitely much greater thanthe values obtained by Grimminger (1938) for the lateral eddy diffusion coeffcient inindividual homogeneous currents, which vary between 4 '105 and 5 '107 c.g.s. units, cor-responding to much smaller mixing lengths. Such a reduction can be accomplished by areduction in the numerical value for ko. If ko is reduced, the width of the westward belt,as measured by L, decreases. The sinking will then be concentrated to a fairly narrowzone and this again requires a much stronger rate of cooling. Assuming a value of 10 mpsfor Uo and a lapse rate 0.5°C per hundred meters, the values of i, L,tiTmax and 1'max fordifferent values of ko are given in Table i a.
TABLE ia Uo= 10 m/sec
ko 0.38 0.3 0.2 0.1lkm 1032 508 151 19Lkm 2717 1693 752 188LlTmax 0.286°C 0.46 1.03 4.13'7= 4.9Xio7 1.9Xio7 3.8Xio6 2.4Xio5
This table has been recomputed for Uo = 20 mps. The change does not affect the valuesof i and L, but the rate of cooling is quadrupled and the eddy viscosity is doubled.

16 PAPERS IN PHYSICAL OCEANOGRAPHY AND METEOROLOGY
ko¡kmLkmLi T ma
'lma
TABLE ib Uo=20 m/sec0.38 0.3 0.2 0.11032 508 151 192717 1693 752 1881. 145°C 1.84 4.13 16.539. 8X ro7 3.8Xro7 7. 5X ro" 4.7Xro6
It is quite evident from these tables that Grimminger's values for the lateral exchangecoeffcient correspond to values of ko ranging from 0.1 to 0.3, with a reasonable meanvalue of about 0.2. The rate of cooling then required to maintain a steady state is of thesame order of magnitude as the values computed by Möller (1935) for the rate of coolingin middle latitudes, but since their calculations are based on absorption coeffcients whichappear doubtful in the light of recent research, this agreement may not be of great sig-nificance. Sverdrup's (1917) values for the rate of cooling in the Azores High are freefrom this objection, since they are computed from the vertical temperature distributionand the distribution of vertical velocities, the latter having been computed with the aidof the equation of continuity from the observed horizontal wind distribution at differentheights above sea leveL. Sverdrup's values fall within the range of values given in Tablesi a and i b above, but the distribution of the cold sources established by Sverdrup doesnot agree with the one obtained through our simplified analysis, indicating that con-siderable refinement of the, theory is needed. .
The building up of an equilibrium state must take place gradually and coincident
with the development of larger and larger anticyclonic eddies. Assuming that a strongwest wind has been created above the polar front through direct solenoidal circulationand that the air south of the polar front is very nearly stagnant, it follows that the firsteffect of the lateral drag from the north on the air further south will be to set it in motioneastward and to throw it southward in such a fashion as to produce a dynamic (warm)high further to the south (Rossby 1937b, 1938a). The establishment of the high follows
from the inability of the radiative mechanism of the atmosphere to close the transversalcirculation in such a fashion as to permit the return of some of the accumulated airnorthward in the ground friction layer. The west wind belt must grow in size until finallya thermodynamically possible equilibrium state is reached, and the transversal circuitsare completely closed. However, because of the dynamic instability of the shearing mo-tion in the westerlies large anticyclonic eddies must form which distribute the sinkingmotion over a very broad area. The dynamically required rate of cooling then becomes
less than the thermodynamically prescribed and more air will now be carried off north-ward within the ground friction layer than is accumulated at somewhat higher levelsthrough horizontal convergence. During this entire development the speed of the westwinds above the polar front wil decrease as a result of the diffusion process. With thedevelopment of a strong northward movement of the moist surface air, the stage is setfor a new cycle.
Figure 3 contains the stream lines (full lines) in a diagram with a log-pressure verticalscale andyjL as horizontal coordinate. It is evident from (24) and (19) that the streamlines above the frictional layer then must be straight lines. The top of the turbulent layerhas been placed arbitrarily at a pressure of 850 mb and the sea level at 1000 mb, thesmall horizontal variation in sea level pressure being of no consequence in this connection.The stream lines in the ground friction laytr are arbitrarily drawn and serve merely toindicate the return flow northward. The broken lines give the distribution of the coldsources in relative measure ti T / ti T max'

VOL. VII, NO. i. FLUID MECHANICS APPLIED TO THE STUDY OF ATMOSPHERIC CIRCULATIONS 17
I t is evident from the slow transversal velocity values indicated in Fig. 2 that a parcelof air may complete several closed anticyclonic circuits while completing only a fractionof its transversal path. This is particularly true in summer when the polar front circula-tion is weaker and thus Uo and v both reach their lowest value.
0.1200
f2 \\ \\ \
\30
\AO
500
60
---- --- -- -
0 .1 .2 .3 .4 .5 .6 .7 .8 .9 1.0 1.1
FIG. 3.-Transversal circulation in region of the westerlies, plotted against log pressure as ordinate and distancesouthward from polar front as abscissa. Stream lines (full lines) are drawn for intervals of 0.1 in the ratio of the streamfunction f to its value fma at the point p= 1000 mb,y=o (polar front position at the ground). The broken lines give theheat loss in the same relative measure.
The low speed of the west winds, the further decrease in the speed of the transversalcirculation relative to the west winds and the decrease in the intensity of the cold sourcescombine to make the summer season particularly well suited for the determination offlow patterns from isentropic charts.
B. TECHNIQUE AND EXAMPLES OF ISENTROPIC ANALYSISBY JEROME NAMIAS
i. TECHNIQUE
i. Plotting Routine
a. Values chosen jor representation. The principal tools of isentropic analysis arecharacteristic curves, isentropic cross sections and isentropic charts. The first of thesetools consists of plots of specific humidity against potential temperature, one for eachaerological sounding. It is used primarily for identification of vertical air columns andhas been thoroughly discussed elsewhere (Rossby 1932). It is with the second and thirdof the tools listed above that this paper is concerned.
The fundamental assumption underlying isentropic analysis is that airlayers well re-moved from the ground tend to conserve their potential temperature. The validity ofthis assumption was clearly recognized by Shaw (1933) and led him to suggest thatsynoptic charts be constructed on surfaces of constant potential temperature, thusenabling one to follow a given sheet of air from chart to chart.
The fundamental difference between the isentropic charts suggested by Shaw and theones now drawn as a daily routine at the Massachusetts Institute of Technology lies inthe introduction of a second conservative element, specific humidity, to trace the move-ments of individual air parcels within the isentropic surfaces.
Evidence in support of the basic assumption of adiabatic motion is furnished by theremarkably conservative nature of some of the charcateristic curves obtained from ouraerological soundings. The author (N amias 1934) has shown that subsidence inversionsnormally are characterized by fairly unchanging values of potential temperature at theirbases and at their tops, a fact which implies adiabatic displacements. While there is muchevidence of isentropic motion in an unsaturated atmosphere, it is equally well establishedthat saturated air is capable of crossing the isentropic surfaces. Through condensationlatent heat is realized and leads to an increase in the potential temperature. Thus, as iswell known, displacements of saturated air are characterized by constancy of equivalentpotential temperature. Indeed, inspection of characteristic curves from stations pene-trating well defined warm fronts along which condensation is occurring shows that thepoints of maximum moisture content frequently lie along a line of constant equivalent po-tential temperature. Thus the assumption of isentropic motion is not strictly justified inthe case of saturation.
It is unfortunate that there are but two conservative elements at our disposal for thetracing of air movements. These two elements in combination define the equivalent po-tential temperature. Thus the chart which might logically suggest itself for regions ofsaturation, that is, one drawn upon a surface of constant equivalent potential temperatureis of little value in tracing air movements since we can plot upon it no conservativequantities which do not enter into the definition of the equivalent potential temperature.Moreover, above active warm fronts convection frequently leads to the establishment ofsaturation adiabatic lapse rates, and in these cases surfaces of constant equivalent po-
tential temperature are transformed into layers of finite thickness. In a later section weshall discuss how such non-adiabatic motions may be recognized and taken into consider-ation.
18

VOL. VII, NO. i. FLUID MECHANICS APPLIED TO THE STUDY OF ATMOSPHERIC CIRCULATIONS 19
In the routine of plotting isentropic charts the values of specific humidity and poten-tial temperature at each station must be available. They may be determined graphicallyfrom the directly observed elements of the aerological soundings with the help of thermo-dynamic diagrams. In the United States, specific humidities at significant levels are com-puted at the individual aerological stations and then transmitted by code. It would be ofconsiderable aid to isentropic analysis if this method were employed for potential tem-peraturesas well, thereby doing away with the time-consuming process of extractingthese values from each ascent. '
The question arises as to which isentropic sheet should be used for the analysis. Theprincipal guiding factor is the elevation of the sheet, which in turn depends upon thegeneral temperature distribution. Thus the isentropic surface () = 290°1 which has been
found useful during the winter months is far too low during the warm summer months." In general, the isentropic sheet finally chosen should be high enough to be above the
layer of surface effects over most of the area concerned, and at the same time low enoughto show a pronounced range of specific humidity values. It is obvious that over a largearea of diverse topographical and climatic features these two criteria cannot be com-pletely satisfied. However, it has generally been possible for us to find an isentropic sur-face that has satisfied these conditions well enough for a reasonably sound analysis.
Suitable values of potential temperature for the individual seasons are:Season Potential TemperatureWinter 2900-29SoASpring 29So-3oooASummer 3loo-3lSoAFall 3000-30SoA
The abrupt increase from spring to summer values is due to the normally rapid increaseof free air temperatures as summer convection sets in.
During periods of unusual weather it is sometimes necessary to change to a differentsurface for a few days, and then to return to the normal for the season. It should bepointed out, however, that such changes carry with them a certain loss of continuity-and it cannot be emphasized too strongly that continuity is the primary requirement ofisentropic analysis. For this reason it is most advantageous to follow from day to day theflow patterns in a given isentropic surface, and when an abnormal period suggestschange in surface, to construct an additional set of charts for a more representative sur-face for this particular period.
Once the proper surface has been selected it remains to obtain the values of the vari-ous meteorological elements, particularly specific humidity, on the surface. The simplestmethod of accomplishing this is to make use of a pseudo-adiabatic diagram. If the ob-served values of pressure, temperature, and relative humidity are known, a curve oftemperature versus pressure may be plotted and the relative humidities indicated nu-merically beside the sounding. The chosen value of potential temperature may then bemarked by a heavy line along the proper dry adiabat. Through interpolation betweensignificant points of the sounding one obtains values of relative humidity at the particu-lar isentropic surface, and from these data the specific humidity is easily determined withthe help of the lines of constant (saturated) specific humidity. The height of the selectedisentropic surface may be similarly determined by finding through interpolation the
1 That is, charactenzed by the potential temperature '29°0 A.

20 PAPERS IN PHYSICAL OCEANOGRAPHY AND METEOROLOGY
height corresponding to the pressure at which the chosen dry adiabat cuts the observedtemperature pressure curve. In the United States where the specific humidities of sound-ings are transmitted by code, it is a simple matter to interpolate directly.
There has also been some use made of the weight of the vertical column of air containedbetween two isentropic sheets, the interdiurnal changes in this value being an indicationof the convergence and divergence of air. This weight is easily determined by markingin the graph another dry adiabat, differing by, say, SO of potential temperature from theadiabat originally chosen. The weight of a vertical column of air between the correspond-ing surfaces is then simply the difference in pressure between the two intersections madeby the dry adiabats with the temperature-pressure curve in the diagram.
We now have at hand specific humidity, height, and relative humidity at one surfaceof constant potential temperature, and also the weight of the air between this surface andanother, let us say SO below it. These values are then plotted at the appropriate stationson a geographical chart; the most convenient order is specific humidity, height, andrelative humidity to the right of the station (from top to bottom), and to the left and be-low the station, the weight of air between surfaces.
With these data alone it is possible to construct lines along which the specific humid-ity remains constant, and also lines of constant elevation. Such a mechanical interpreta-
tion oj the data does not constitute an analysis, for nowhere is the network of aerological
stations suffciently dense to permit a unique determination of the flow patterns on theisentropic chart. It is the purpose of the first portion of this report to suggest variousimportant tools used in the analysis of the data from a comparatively open network ofaerological stations. The more important of these tools are vertical cross sections throughthe atmosphere, analyzed surface weather maps, isallobaric charts, cloud and precipita-tion data, and upper air winds. But before proceeding with the discussion of the analyti-cal use of these, we shall make a few remarks concerning the plotting of some additionalhelpful data on the isentropic chart.
Let us suppose that the isentropic surface is found above the top of the sounding. Inthis case it is frequently possible to obtain approximate values by extrapolation. Thismay be done only if the surface is not far above the top of the ascent. Furthermore, ex-trapolation is not permissible when there is a very steep temperature lapse rate in theuppermost layer of the ascent, since the lapse rate then very nearly follows a dry adiabat,and the desired point of intersection is diffcult to dytermine accurately. Whenever thereare indications of discontinuities just above the sounding, it is also best not to attemptan extrapolation. In normal cases, however, when the top point of the ascent is not toofar removed from the fixed potential temperature surface, extrapolated values of specifichumidity and elevation will be suffciently accurate for the analysis. Some special nota-tion (such as parentheses) should be used to show that the values so marked are extrap-olated, and it is helpful to indicate the potential temperature at the uppermost level ofthe sounding.
When extrapolation is not indicated, there still is some helpful information in theuppermost readings of the sounding, and it is desirable to enter on the chart the specifichumidity and elevation at the highest level together with the value of potential tempera-ture of this point. For identification, these numbers may be plotted on the isentropicsurface in red ink. A similar procedure may be used for certain high mountain observa-tions, for these often throw some light on conditions in the free air when airplane observa-tions are not available.

VOL. VII, NO. 1. FLUID MECHANICS APPLIED TO THE STUDY OF ATMOSPHERIC CIRCULATIONS 21
Clouds and precipitation forms should be entered on the chart, for they show the re-
gions of saturation, and frequently offer clues to the direction of air flow when pilot-balloon winds are missing. We are chiefly concerned with three possibilities: (i) the cloudsare above the charted isentropic surface, (2) they are below it, and (3) they penetrate theisentropi,c surface. It will be shown later that (i) and (3) may be attended by significantchanges in the character of the surface,
brought about by condensation and precipitation.When the clouds are below the sheet, their effect upon the chosen surface is generally oflittle significance, although even in this case valuable hints may be gained by enteringthe clouds in the customary international symbols.
The direction of movement of the clouds is best shown by an arrow appended to thesymbol, and the amount of sky covered may be indicated by a number placed as a sub-script. If the cloud is below the isentropic sheet with which we are concerned, this factmay be indicated by adding the letter "b" to the cloud symboL. If it is above the sheet,nothing need be appended. If clouds penetrate the isentropic surface, it is advantageousto enter beside the cloud symbol the elevations of base and top. When a cloud is reportedas being somewhere within the range of the aerological sounding, yet not placed specifi-cally, we have found it convenient to place an asterisk after the cloud symboL.
Precipitation is an important element to consider in carrying on an isentropic analy-sis. Precipitation forms should be entered on the isentropic chart together with the levelsin which they are present. Also for this purpose international symbols are convenient.
Since the analysis of isentropic charts has for its purpose a thorough description of theair movement, it is essential that upper air winds be used to the fullest extent. At thosestations where both soundings and pilot-balloon data are available the wind in the isen-tropic surface may be readily extracted, since the elevation of the surface is one of ourcomputed quantities. But there are many more pilot-balloon stations than airplane orradio-sonde stations. In order to use all the available upper wind data it is first necessaryto construct lines of constant elevation for the isentropic surface. This is really part ofthe technique of isentropic analysis, and will be discussed in Bl2a.
The term "isentropic analysis" applies not only to the study of upper air charts forprescribed isentropic surfaces, but also to the interpretation of atmospheric cross sec-
tions, without which the analysis would be incomplete. Isentropic analysis is in realitya method whereby the meteorologist attempts to discover the major flow patterns of theatmosphere through successive approximations, and in these successive stages it is help-ful to be able to compare the flow picture obtained from a selected surface with the pic-ture suggested by a few cross sections.
In order to take full advantage of the cross sections it is necessary to make use of themost conservative air mass properties, potential temperature and specific humidity. Theolder type cross sections, in which temperature and relative humidity were used, havebeen found inadequate and at times actually misleading. Frequently, the level for levelcomparisons used in analyzing such cross sections led to confusing and inconsistentpictures of frontal structure. The chief objection to the older form of representation liesin the fact that large scale vertical motions bring about adiabatic changes which renderineffective the comparison of elements at fixed levels. A much sounder form of crosssection representation is that obtained by studying the distribution of potential tempera-ture and specific humidity. In this manner one has a method of representation similar tothat suggested by Rossby in his treatment of the equivalent potential temperature dia-gram. The chief advantage of this type of cross section is that it presents some informa-

22 PAPERS IN PHYSICAL OCEANOGRAPHY AND METEOROLOGY
tion concerning the moisture distribution in several isentropic surfaces, one of which cor-responds to the particular isentropic surface for which a complete chart may be available.
Upper air winds may be entered along the station verticals in the cross sections. Inøworking with sections which run east-west, a north wind has its shaft directed down-
ward; an east wind has its shaft directed toward the left; and so on. In a north-southsection (north to the left of the section) a north wind is represented so that the shaftpoints to the right; in an east wind, downward.
Clouds and precipitation forms should be entered in the cross sections in the same wayas in the isentropic charts, at the proper levels.
b. An alternate method oj representing data. In a recent paper Byers (1938) has sug-gested that the isentropic chart becomes more useful when lines of constant pressure(isobars) and lines of constant isentropic condensation pressure are entered on the isen-tropic chart instead of the constant specific humidity lines and contour lines suggested inthe preceding section. The use of isobars rather than height lines has distinct advantages,since thermodynamic changes in the atmosphere are the result of changes in pressure, notelevation. In accordance with Byers' suggestion the isentropic charts now made at theMassachusetts Institute of Technology contain isobars rather than height lines. For thesake of consistency the cross sections are also plotted with pressure (on a logarithmicscale) as the vertical coördinate.
On a prescribed isentropic surface the isentropic condensation level pressure is afunction of specific humidity alone. Since furthermore, for low specific humidity, smallvariations in the moisture content bring about large variations in the condensation levelpressure, it is evident that the moisture distribution and thus the flow patterns may beadequately represented through lines of constant condensation level pressure and thismethod would appear to have the further advantage of permitting a more detailedanalysis of dry tongues (high portions of the surface). However, this gain is to some ex-tent fictitious, since the observed values of relative humidity often are inaccurate in coldregions.
The use of isentropic condensation pressures instead of specific humidities, has certainadditional disadvantages. In the first place, as Byers points out, lateral mixing dependsupon the gradient of specific humidity, not upon the gradient of the condensation pres-sure. A more serious objection is that the combined use of cross sections and isentropiccharts, so important in defining the axes of moist and dry tongues, and the establishmentof flow patterns is hampered when the quantities represented on the cross sections differfrom those on the isentropic chart. In his report Byers describes a method, originally
suggested by C. H. Pierce, of using condensation isotherms of potential temperature onthe cross sections, but this substitution does not eliminate the criticism made above,since isentropic condensation level temperatures depend not only upon the specifichumidity but also upon the potential temperature.
One of the points brought out by Byers in favour of the use of isobars and isentropiccondensation isobars is that nearness to condensation may be estimated from the close-ness of these two sets of lines. Thus, where an isobar intersects the isentropic condensa-tion isobar of the same value, saturation occurs. A series of such intersections bound thearea in which condensation is occurring. However, an equally suitable form of representa-tion may be obtained where isobars and specific humidities are used. One merely affxesto each isobar in the isentropic chart the value of the saturation specific humidity (whichis a function of pressure alone in a given isentropic surface) and the intersection of these

VOL. VII, NO. i. FLUID MECHANICS APPLIED TO THE STUDY OF ATMOSPHERIC CIRCULATIONS 23
maximum specific humidity lines with the observed lines of observed specific humiditydefines the area of saturation. Within this area the assumption of isentropic motion doesnot hold.
The use of isobars rather than lines of elevation should cause little confusion. Theprocedure described below for the construction of height lines may equally well be appliedto isobars.
2. Analysis
a. Preliminary construction oj contour lines. In the preceding chapter it was statedthat in order to obtain winds at all pilot-balloon stations it is necessary to construct onthe isentropic chart lines along which the elevation of the isentropic surface is constant(contour lines). The purpose of these lines is, however, not solely to permit the incorpora-tion of additional upper air winds, but they also serve a useful thermodynamic and hy-drodynamical function. The number of upper air soundings available is generallyinsuffcient to permit construction of contour lines in a purely mechanical fashion. It isoften possible to construct several different patterns of such lines from the data in a singlechart, and the detailed drawing of the contour lines is therefore a matter of judgment(analysis). Fortunately, however, for purposes of obtaining the wind distribution in anisentropic surface, different solutions of the pattern of contour lines wil generally leadto similar results as far as the wind distribution is concerned. The reason is that currentsin the free air are for the most part fairly constant in direction over vertical intervals ofone to two kilometers, and that the uncertainty in the contour lines in regions where
there is a reasonably close network of sounding stations falls within these limits. But thiscircumstance does not justify a mechanical construction of height lines, for while thewind patterns may be similar to the true pattern, there are frequently small variationsin wind flow which offer important clues to the complete analysis. Moreover, the con-tour lines serve to indicate the slope of the isentropic surface, a most important factorin the weather processes. It is the purpose of this section to point out some of the moreimportant aids one may use in making a first approximation to the solution of the patternof the contour lines. First among these are the surface isallobaric charts.
It is well known that pressure changes to a large extent are the result of advectionin the free air which brings about substitution of warm air for cold and vice versa. Thelarge contributions of shallow layers of extremely cold polar air to the surface pressurechanges have been emphasized by Wilett (1933) and Emmons (1935). For many yearsforecasters have used isallobaric charts as one of their most important aids. However, itis also well known that the total pressure changes observed at the ground are in partdynamically produced, and that at times the dynamic effects may outweigh the advec-tionaI.
In the analysis of isentropic charts it soon becomes evident that there is in most casesan association between the pattern of the height lines and the surface pressure changes.Where the surface pressure rapidly rises the isentropic surface is high, where the surfacepressure falls the surface is low. In order to show this general relationship more clearlyfor an individual station (Fargo, North Dakota) Fig. i was constructed, wherein theheight of the isentropic surface () = 3 100 is plotted against the preceding twenty-four hoursea level pressure change for the available soundings of June and July 1937. The curvedrawn by inspection through the observed points shows that in most cases rising pressureat Fargo is associated with an increase in the level of the isentropic surface. This sug-

~-4 PAPERS IN PHYSICAL OCEANOGRAPHY AND METEOROLOGY
gests that the pressure changes observed at the surface at Fargo are in large part advec-tive in origin, so that when a mass of cold air moves in, raising the isentropic surface, thestatic effect of the colder air produces a pressure rise at the ground. This relationshipoffers a key to the location of height lines and frequently gives indications of isentropicdomes and troughs which may be beyond the geographical boundaries of the aerologicalnetwork. It is equally helpful in regions where data are missing. But it must be empha-sized that this relationship is not infallible-a fact which is readily seen from the greatscattering of the points in Fig. i. Moreover, it appears that this relationship, at least insummer in the United States, is confined to the northern portions of the country. Toillustrate this point Fig. 2 for Nashvile has been constructed. Here the coordinates arethe same as those used in Fig. i and the period is the same, but it is obvious that nosignificant correlation exists. It would thus appear that in summer the contribution to
~OF
6=31005
F'ARGO
4
3
2
o-;30 -;20 -:10 0 .10 .20 .30 .40
~r (24 HOURS) IN I NCHf.S
FIG, i.-Height of the isentropic surface 0= 310° as afunction of the preceding twenty-four hour surface pressurechange at Fargo, North Dakota, during June and July 1937.
~OF
e = 31005
NASHVILLE
4. .
. .. . . . .. . . . ... e.. . . i.. . ..
.I
3
2
o-;30 -;20 ..10 0 .10 .20 .3 .40~t (24 HOURS) IN INCHE&
FIG, 2.-Height of the isentropic surface 0=310° andpreceding twenty-four hour surface pressure changes atNashvile, Tenn. during June and July 1937.
sea level pressure changes over Nashville brought about by advection of various airmasses within the lower atmosphere is no more significant than the effect of advection athigher levels or purely dynamic pressure changes. Thus the relationship between contourlines and pressure changes cannot be used in the southern section of the United States insummer. This restriction, however, is not very serious since the network of aerologicalstations in this area is suffciently dense so that the contour lines there may be reasonablywell defined by observations.
There is reason to believe that in winter the relationship between isentropic topog-
raphy and sea level pressure change holds also in the southern sections of the UnitedStates, although only a limited amount of data have been examined. In winter the polarfront is normally located much farther south than it is in summer, and the air masschanges are more pronounced and frequent in winter than they are in summer. These airmass changes are generally reflected in the surface pressure changes. In winter it is ad-vantageous to use twelve rather than twenty-four hour pressure changes, owing to the

VOL. VII, NO. 1. FLUID MECHANICS APPLIED TO THE STUDY OF ATMOSPHERIC CIRCULATIONS 25
greater rapidity of air mass movement. In summer the twelve hour pressure changescontain a large diurnal term, which does not occur in the twenty-four hour changes;thus the latter are more useful in summer. The three hour pressure changes are cor-respondingly helpful as an indication of the instantaneous direction of movement ofthe contour lines.
Fronts on the surface weather map also offer a great deal of information about thestructure and pattern of the contour lines. Regions in the vicinity of well marked frontsare characterized by a "packing" of the con tour lines. Since cold fronts are generallymuch sharper and steeper than warm fronts, this steep gradient of contour lines on theisentropic chart is usually at its maximum just behind cold fronts. Moreover, as oneshould expect, the contour lines usually run parallel to the surface fronts. Indeed, itappears that many well-defined fronts are characterized by constant potential tempera-ture, and therefore the isentropic surface may be the frontal surface, or may lie nearlyparallel to it in space.
The warmest air is normally found just ahead of the surface cold front. Thus thetrough in the height lines is to be found in this locality, and from this line backwardthrough the cold air the gradient of contour lines is steep.
The parallelism of contour lines with well marked cold fronts many times enablesone to construct height lines in regions where there are few data. The application of thisprinciple to frontal non-occluded wave disturbances is apparent, for here there must bea wavelike pattern in the contour lines roughly parallel to the frontal waves in thesynoptic surface chart.
Sharp warm fronts show up in the height line pattern in much the same manner ascold fronts, the gradient of the lines increasing abruptly at the front while the lines remainfairly parallel to the front. There are, however, many warm fronts on the surface mapswhich are not associated with this simple contour line pattern above. Moreover, thesurface maps frequently indicate homogeneous open warm sectors which in the isentropiccharts are far from homogeneous, but rather characterized by troughs in the contourlines suggestive of fronts. Some time after their appearance in the contour line pattern,these troughs may appear in surface charts as regions of frontogenesis, suggesting thatsuch newly formed fronts are a result rather than a cause of upper air activity. It thusappears that many fronts on the surface weather map are "induced" by action takingplace first in the upper air and later showing up at the ground.
We may express some of the above ideas in diagrammatic form. In Fig. 3 the heavyline represen ts the polar fron tat the ground; the solid portions are cold fron ts; the dottedportions, warm fronts. The light broken lines labelled z, Z+I, etc., are contour lines ofthe isentropic surface. H indicates regions where the isentropic sheet is high, and Lregions where it is low. Fig. 3a represents the ideal topography to be expected on thebasis of the Norwegian frontal theory, while Fig. 3b shows a topography frequentlyobserved and associated with frontogenesis within the originally apparently homogeneoustropical air mass subsequent to the appearance of the trough in the contour lines. Thislatter case is that of the frictionally driven anticyclonic eddy which we shall treat fromthe observational standpoint later on.
It is to be stressed that cross sections should be used in constructing the contourlines. It is always helpful to mark the intersection with the chosen surface of constantpotential temperature in the cross sections, as this enables one to define the high andlow points of the isentropic surface for these sections.

26 PAPERS IN PHYSICAL OCEANOGRAPHY AND METEOROLOGY
The purpose of the preliminary construction of the contour lines is to enable one toextract all the available information from the pilot-balloon wind data. It wil be recalledthat in our present stage of the analysis only those upper air winds are available whichare made at airplane or radio-sonde stations. These winds, as well as pressure changesand fronts; help in determining the topography of the isentropic surface. Under steadystate conditions the upper air winds must very nearly follow the contour lines but inindividual cases the winds may flow in any direction relative to the contour lines, eventhough the air be constrained to remain in an isentropic surface. Indeed, it is this very
H/""-------I ----__-i+3" 1,.;:----:::-:---___-,,Z+2i / ".-------:--__I i I i ............. -_ ..Hi i i l .......~I i I I , JI i 1 ;' // / I ' "I-"" I I ;'," / "I L " /"//" ,...".;;..;// iI /I/'.. .. ,I' /I / /' ,.".... / /./ / / 1''' .... / I,./ / I I .... I i2+3--- I " i ''" I I I \"." / / i Z+IZ+2.~"" ,," / 12+1/-:/ \2'- (êl) z
H/';:~~:_- --
I / ....-;::":~:;':'-..i i i ii ..~.~"t........1,1,' ',.., 'Z+3i \ ..,
H / I1 \ 'Z+2.I / I \/ I1 \;' / I.. ,," h \Z+3-------'"..,,~/. I.. /,'/ I2+2.----:,.-/ /..-------",1'"" ". I
Z+ 1-..:;../ (z.~"" \\
Z+I
(b)
H
FIG. 3.-Relation of contour line pattern to surface fronts.
component of motion of the air across the height lines which is largely responsible forthe weather during the winter season. Empirically it has been found that in the majorityof cases the winds on individual isentropic charts are approximately parallel to theheight lines. Since this condition frequently is approximated also in areas where frontalprecipitation is occurring, it would appear that the upslope components associated withconvergence are quite small, and thus itis not always advisable to attempt to determinethe component of upslope motion from the relative orientation of wind direction andcontour lines on the isentropic charts, particularly in view of the fact that the contourlines themselves may be displaced with practically the speed of the wind. It has beenfound empirically that whenever there is a reasonably steep gradient of contour lines the,wind is directed mainly along these lines. Since the con tour lines fairly nearly coincidewith the isotherms in horizontal planes this result is in good agreement with that ob-tained by Clayton (1923) that high level clouds generally move parallel to the surfaceisotherms. This relationship, then, may be used in constructing the preliminary set ofheight lines, for we have on hand certain winds at the aerological stations. The senseof rotation of these winds is normally so that the domes and ridges of contour lines areto the left of the current flow. It should be emphasized that this rule is by no meansalways applicable, for the pressure distribution at any level depends not only upon thethermal distribution aloft but also upon the pressure distribution at the surface. More-over, there is good evidence in support of the contention that there are at times sizeablecomponents oftnotion across the isobars (Bjerknes and Palmén 1938).
b. Isentropic flow patterns. After the preliminary contour lines have been con-structed and all available upper level winds entered on the isentropic chart, the stageis set for the determination of flow patterns with the aid of the lines of constant specific

VOL. VII, NO.!. FLUID MECHANICS APPLIED TO THE STUDY OF ATMOSPHERIC CIRCULATIONS 27
humidity. In order to avoid the confusion of different sets of lines, it is necessary to com-pletely erase the preliminary contour lines. The general character of contour lines issuffciently well remembered by the analyst to assist in 'the study of the moisture pattern,and the clean map encourages the careful sketching of smooth curves. The word "sketch-ing" should be emphasized, for we are not dealing with a problem as simple as drawingsea level isobars. Because of the limited supply of aerological data, it is not possible toconstruct moisture lines in a mechanical fashion. The eraser will be found to be a mostuseful tool.
In sketching. tentatively the first approximation to the flow pattern, the first principleto bear in mind is continuity of analysis. Moist or dry tongues of the preceding maps maybe assumed to be carried by the general wind flow along the isentropic surface. One mustconsider various non-adiabatic influences in order to explain satisfactorily certainchanges in the character of these tongues which are not compatible with simple advectivetransport. We shall treat some of the most commonly observed flow patterns shortly,but first it is advisable to mention the use of cross sections in this first approximation.
Suppose that we have sketched a moist tongue in the isentropic surface, and thatthe axis of this tongue runs in an east-west direction. Since the axis of this moist currentmay lie in the gap between aerological stations, it is impossible to establish the greatestamount of moisture (the maximum line of specific humidity) in the center of the streamfrom the data in a single isentropic surface. The cross sections, however, satisfy just thisneed, for if we choose a section which runs cross stream (in this case north-south) wecan sketch in the moisture lines as they intersect not only the chosen but also the sur-rounding isentropic surfaces, and thus more readily interpolate the most probable mois-ture maximum of the current. A schematic picture of such a cross section is shown inFig. 4, where the lines of specific humidity are drawn solidly and the surfaces of potentialtemperature are broken. Let us say that we are analyzing the 310° surface (the heaviest
o o G) o ~320
305
305
4300
8
2956
FIG. 4.-Schematic cross section through a convective area.
broken line). Then the axis of the moist curren t on the isentropic chart lies 1/4 the dis-tance between stations 2 and 3, near station 2. Moreover, this cross section suggests thatthe 10 gram line most likely intersects the 3100 surface.

28 PAPERS IN PHYSICAL OCEANOGRAPHY AND METEOROLOGY
In choosing cross sections it is most helpful to make use of those sections which runcross-stream. Since prevailing wind directions in the free air and in middle latitudes havea good westerly component, the north-south sections are most frequently helpful, but insummer time a section from EI Paso, Texas, to Montgomery, Alabama is often foundvery usefuL.
On occasions the first appro~imation to the flow pattern may indicate a moist tonguebetween aerological stations but the analysis of the cross section cannot be strained to fitthis pattern. In this case, the trial solution must be abandoned and some more consistentpattern sketched. In this manner one finally arrives at the probable solution.
The moisture lines in general tend to follow the wind directions. If this were rigidlytrue, however, the moisture lines would also be stream lines. But it is probable that asteady state is seldom approximated in the atmosphere, so that the parallelism of mois-ture lines and stream lines is only roughly true. Generally the axis of a moist or dry cur-rent coincides with the region of strongest winds, so that from this axis laterally outwardthere is found a diminution of both moisture and wind velocity. Advective transport fromthe source of moisture is undoubtedly the determining factor in this moisture pattern,although appreciable modifications are brought about through isentropic mixing. .
The Norwegian meteorological school stresses the fact that no current of uniformdirection can exist completely around the earth, and that the atmosphere must break upinto a number of cells (V. Bjerknes and coli. 1933). Similarly, in the case of isentropiccharts, it has been found that currents do not move in straight paths, but there is a pro-nounced tendency of the current systems to break up into large anticyclonic eddies(Rossby and colI. 1937a and b). The curvatures of large scale current systems are in themain the result of the struggle for balance between Coriolis' forces and dynamically
created pressure gradients. Since the moisture distribution in the atmosphere is controlledmainly by advection, it follows that the patterns of moisture must follow closely the gen-eral patterns of the large current systems. It is evident, then, that in carrying out theanalysis one must try to arrive at a moisture pattern, and consequently a flow pattern,which is compatible with the behaviour of a real fluid. Analogies between air currents andstreams of water are becoming mutually helpful, and some of the flow patterns of theatmosphere have been found in the ocean (Montgomery 1938, Parr 1938). Spilhaus(1937) has made photographs of flow patterns produced by a jet of liquid flowing into arotating tank of water which bear a striking resemblance to the patterns of the moisturelines on the isentropic chart. '
The observed patterns naturally divide themselves into the two classifications, cy-clonic and anticyclonic. It is generally one current that dominates the motion over alarge area, and this current will be referred to as the "wake stream." Normally it is thecurrent with the highest velocity that dominates-it may be composed of dry or moistair, and may curve cyclonically or anticyclonically. The wake stream, through lateralshearing stresses, drags along other currents in its neighborhood and sucks in air alongits boundaries. Moreover, it may build up an anticyclone to its right and a counter-cur-rent to its left, as suggested by Rossby (1936). It is therefore desirable to define the wakestream on each isentropic chart, so that a consistent flow pattern can be constructed us-ing this dominating stream as a frame.
In the daily isentropic analyses it has been found that wake streams moving south-ward from polar and sub-polar regions are predominantly cyclonic in their flow, whilethose of tropical and sub-tropical origin moving rapidly northward are anticyclonic. This
VOL. VII, NO. i. FLUID MECHANICS APPLIED TO THE STUDY OF ATMOSPHERIC CIRCULATIONS 29
applies only to fast moving currents, which appear to govern the major flow patterns.Prof. Rossby suggests that this phenomenon may be explained on the basis of the prin-ciple of conservation of absolute circulation. Thus the total absolute circulation of anyisentropic fluid chain consists of a circulation relative to the earth plus the circulation of
the earth itself about this chain. If there are no frictional forces and if the motion is
strictly adiabatic this sum must remain constant. Thus, if an originally stationary isen-tropic fluid chain is displaoed from equatorial to polar regions it must develop an anti-cyclonic sense of circulation relative to an observer on the earth in order to counterbal-ance the increased circulation of the earth itself around the chain as it moves northward.Similarly, a southward moving system tends to develop a cyclonic circulation.
Rossby's conclusion that the current systems observed on the isentropic charts overthe United States have a pronounced tendency to break up into large anticyclonic eddieswas based essentially on a study of two situations, each one involving about a week'sweather. One of these (Osmun 1937) was an exceptionally steady one, there being littlechange in the general upper air flow patterns for several days. More recent studies in-dicate that such extremely steady conditions aloft are rare, yet it is surprising to notethat this fundamental isentropic flow pattern, the large anticyclonic eddy, is the onemost frequently observed on the daily isentropic charts. Moreover, there often are im-portant anticyclonic eddies of a. much smaller size than the one analyzed by Osmun. Thisis especially true in summer.
It is probable that these anticyclonic eddies are at least in part caused by lateral eddystresses. Through such stresses super-gradient wind velocities may be produced in theenvironment of a current and a banking of air to the right of the motivating stream re-sults. This banking, or piling up of air finally produces an anticyclonic eddy-a friction-ally driven eddy. It is natural that these eddies should form in regions where there is the
greatest anticyclonic wind shear. Parr (1936) has suggested that isentropic mixing shouldbe most pronounced where the vertical stability is greatest. Thus it is in the layers ofgreatest stability that one should expect to find embryonic anticyclonic eddies. In afollowing section, where a detailed analysis of the synoptic si tuation for the period June21-30, 1937 is presented, a pronounced anticyclonic eddy may be followed for severaldays. This eddy forms in the region of wind shear between a broad northerly current ofdry air and, to the west, a southerly flow of moist air. The anticyclonic vortex set up inthe region of wind shear creates a new distribution of moist and dry air, which, as weshall see, is of great importance for subsequent weather developments. In order to obtaina more complete picture of the character of the zone in which this particular anticycloniceddy forms a vertical cross-section running west-east through the center of the eddy hasbeen constructed. This is shown in Fig. 5, where for purposes of clarity the lines of con-stant specific humidity (given numerically to the left of the station verticals) are omitted,and dashed lines represent isotherms of potential temperature. The center of the anti-cyclonic eddy on the isentropic surface (0=3100, the heavy dashed line) lies betweenOmaha and St. Louis.
The lateral wind shear responsible for the development of this eddy appears to bemore pronounced along the isentropic surfaces of the cross section than it is along anyconstant leveL. Moreover, fixed level charts on which pilot-balloon winds are plotted (not
here reproduced) do not bring out the anticyclonic circulation nearly as well as the isen-tropic chart for 0=310°. A chart constructed for the higher isentropic surface 0=3200for this day likewise shows little evidence of the circulation. Apparently, the eddy is just

3° PAPERS IN PHYSICAL OCEANOGRAPHY AND METEOROLOGY
forming and is confined to the lower layers of air in the region of 8 = 3100. Comparing thelapse rate in the air layer between 8=3000 and 8=3100 with that of the layer extendingfrom 31So to 32So one finds that the lower layer is everywhere more stable than the upper.The fact that the incipient anticyclonic eddy is found best developed in the more stablelayer, would seem to lend some support to Parr's (1936) suggestion that lateral mixingis most pronounced in regions of strong vertical stability.
The heavy slanting lines in Fig. S bound a layer in which there is a relatively steeplapse rate. This zone becomes thicker and its lapse rate steeper as it reaches higher levelsuntil at Cheyenne its lapse rate becomes slightly super-adiabatic. The pilot-balloon wind
CHEYENNE OMAHA ST LOUIS DAYTON
,325___---
/i330,
I/"33032lõ ""32.5.. .. .. .. .. _1.9;JV ", /
2.1 ~23 .... __ _ __ /í 2.5 3zi-
.; -------- - - - -- ~
F
r
F~
PT
FIG. 5.-East-west cross section through an anticyclonic eddy on June 23, 1937.
observations at St. Louis suggest that this zone coincides with the layer in which thewinds turn from southerly to northerly as one penetrates it from below. The zone of anti-cyclonic wind shift is generally considered as a ridge of high pressure, which, because ofthe thermal structure surrounding it, is displaced westward with increasing elevation.However, in entering the northerly current over St. Louis there is a sharp drop in mois-ture, and a similar decrease is found in the transi tion zone over Omaha. It is diffçul t toexplain these discontinuities in moisture and lapse rate on the basis of a ridge of highpressure in which the northerly stream has curved anticyclonically around the ridge. Itseems more likely that the cool and dry air at the top of the transition zone is a part of anindependent northerly flow which is dragged over the warm and moist southerly streamthrough lateral shearing stresses exerted by the broad northerly current further to theeast.
¡,,(

VOL. VII, NO. i. FLUID MECHANICS APPLIED TO THE STUDY OF ATMOSPHERIC CIRCULATIONS 31
This type of transition differs from a front in that it has warmer and potentially lessdense air below it, and thus it cannot be stable. Several cases of this nature have come tolight in the daily routine of upper air analysis at the Massachusetts Institute of Tech-nology.
The anticyclonic 'eddy becomes an important weather factor through its ability tobring about changes in the distribution of moisture; it is evident from the preceding dis-cussion that it is this particular characteristic which enables one to locate the eddies onthe isentropic chart. It frequently happens, however, that an eddy creates a new mois-ture distribution and later on dies out as a circulatory motion in the wind pattern on theisentropic surface. In this case the lines of constant specific humidity may suggest aneddy which is not borne out by the winds and which, therefore, is a result of previoushistory and is "fictitious" as an eddy. The important question then arises as to what arethe determining factors in the life of an anticyclonic eddy.
'V
F)
.J
~
d
t..
(,
.'~
FIG. 6.-Relation between displacement of anticyclonic eddy and the distribution of tangential velocity.
In order to obtain a clue to this problem I have plotted in Fig. 6 the wind velocitiesobserved around a well marked anticyclonic eddy which appears on the isentropic chartsfrom June 23 to 27, 1937, and is treated in detail in BII. The center of the eddy is easilydetermined on the individual isentropic charts, and these centers are represented inFig. 6 as the centers of concentric circles, the distance between two successive circles be-ing 100 miles.
On the 27th the circulation has broken up so that at this stage one can hardly talkabout an anticyclonic eddy. This disintegration can be observed setting in on the 26th

32 PAPERS IN PHYSICAL OCEANOGRAPHY AND METEOROLOGY
where the symmetry of velocity is not as pronounced as in the first three days. Indeed, itappears from these individual diagrams that the life of the eddy may be tied up with thedistribution of velocity about its center. Thus in the embryonic and developing stages ofits history, from the 23rd to the 25th, the tangential velocities show an appreciable in-crease radially outward, while in the dying stages there is a pronounced weakening of theradial gradient of velocity. Even before these eddy profiles were plotted, Mr. H. Wexlercalled my attention to the fact that such eddies should tend to remain stable as long as
they rotate as solids. If the angular velocity remains constant or increases radially out-ward, the eddy has a stronger tendency to persist than if the angular velocity decreasesoutward. In synoptic practice, this criterion has been found helpfuL.
The centers of anticyclonic eddies are not stationary but move about. There seems tobe no association of the direction of migration with any of the features of the constantlevel charts or surface weather maps. There is, however, some indication that the direc-tion of displacement may be associated with the velocity distribution about the eddy it-self. In the figure, arrows indicate the movement of the center of the eddy with respect toits own center in the succeeding 24 hours. From the 23rd to 24th, for example, the centerhas moved from 0 to 0'. In three of the four cases of displacement studied, it appearsthat the direction of movement of the center of the anticyclonic eddy is towards the re-gion of lightest tangential winds or smallest radial gradient of tangential velocity. In thefourth case, from the 24th to the 25th the displacement is small and poorly defined. Thepreceding rule has been applied to other eddies and appears to be of some assistance.There is also some indication that the displacement of the eddy center is greater thegreater the assymmetry of the tangential velocity.
The explanation of this rule of migration is probably to be found in the theory thatthese anticyclonic eddies are frictionally driven by the currents of higher velocity. It isreasonable to suppose that the strong winds along certain portions of the periphery ofthe eddy are in excess of the gradient velocity and thus subjected to an unbalancedCoriolis force directed to their right, that is, inward toward the center of the eddy. Thisresultant force is probably much weaker in the regions of light wind and thus the entiresystem is subject to a resultant force from high towards low tangential velocity andshould be displaced in this direction. In fact, when marked outward wind componentsare observed in eddies of this type, it is usually found that these components are mostmarked in the region of smallest tangential velocity.
These anticyclonic eddies, then, possess both rotation and translation. Because of thelack of symmetry in their moisture distribution both elements become important ,whenone wishes to predict the displacement of the associated moist or dry tongues.
To the north of the prevailing westerlies it is believed that there may be a series ofcyclonic vortices. On occasions the westerlies are displaced far enough to the south overthe United States so that cyclonic eddies. are observed. The eddies are generally associa-
ted with occluded systems, most of which have reached a deep stage of development.
These cyclonic vortices are only infrequently observed within the confines of our aero-logical network, and when they are well within the field of observation the bad weatheraround them makes soundings by airplane dangerous. Thus it is not surprising that weare comparatively ignorant of the characteristics of cyclonic flow patterns on the isen-tropic chart. It appears fairly definite, however, that in such cases the dominating cur-rent is polar air and the tropical air is cyclonically curved merely in response to theshearing stresses of the cyclonic polar current.
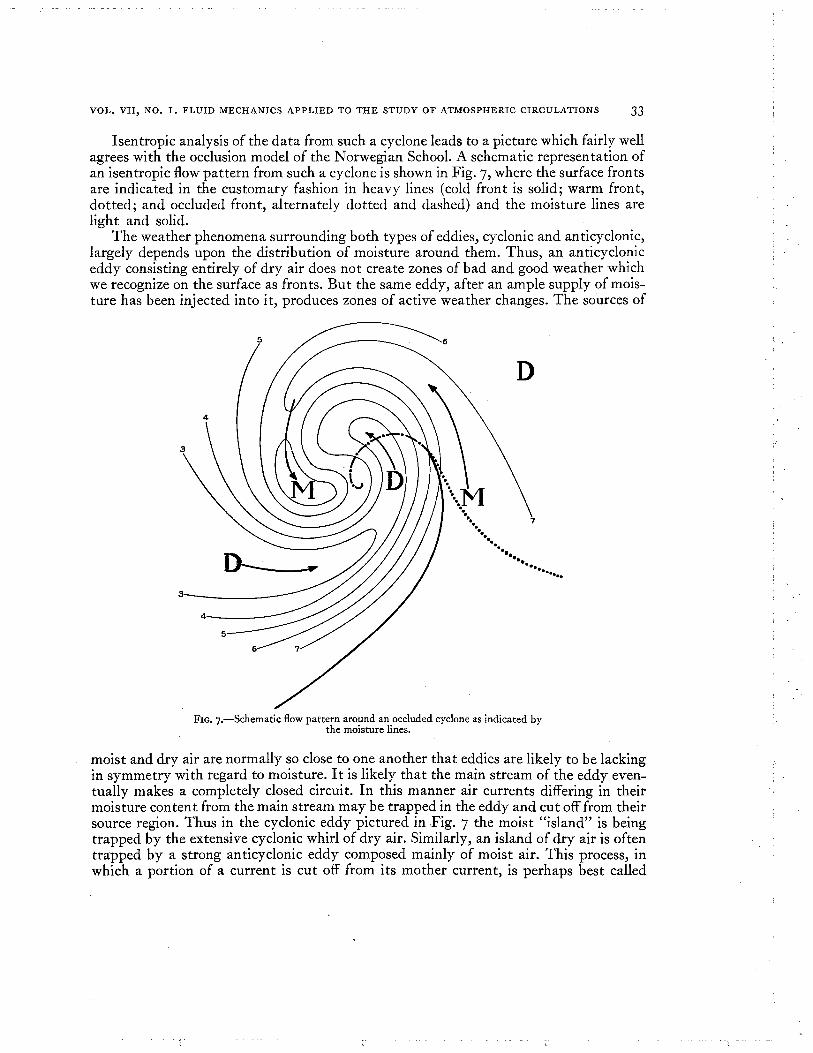
VOL. VII, NO. i. FLUID MECHANICS APPLIED TO THE STUDY OF ATMOSPHERIC CIRCULATIONS 33
Isentropic analysis of the data from such a cyclone leads to a picture which fairly wellagrees with the occlusion model of the Norwegian SchooL. A schematic representation ofan isentropic flow pattern from such a cyclone is shown in Fig. 7, where the surface frontsare indicated in the customary fashion in heavy lines (cold front is solid; warm front,dotted; and occluded front, alternately dotted and dashed) and the moisture lines areligh t and solid.
The weather phenomena surrounding both types of eddies, cyclonic and anticyclonic,largely depends upon the distribution of moisture around them. Thus, an anticycloniceddy consisting entirely of dry air does not create zones of bad and good weather whichwe recognize on the surface as fronts. But the same eddy, after an ample supply of mois-ture has been injected into it, produces zones of active weather changes. The sources of
:3
FIG. 7.-Schematic flow pattern around an occluded cyclone as indicated bythe moisture lines.
moist and dry air are normally so close to one another that eddies are likely to be lackingin symmetry with regard to moisture. It is likely that the main stream of the eddy even-tually makes a completely closed circuit. In this manner air currents differing in theirmoisture content from the main stream may be trapped in the eddy and cut off from theirsource region. Thus in the cyclonic eddy pictured in .Fig. 7 the moist "island" is beingtrapped by the extensive cyclonic whirl of dry air. Similarly, an island of dry air is oftentrapped by a strong anticyclonic eddy composed mainly of moist air. This process, inwhich a portion of a current is cut off from its mother current, is perhaps best called

34 PAPERS IN PHYSICAL OCEANOGRAPHY AND METEOROLOGY
"seclusion," a term originally applied by the Norwegians to the surrounding of the warmsector of a cyclone by polar air. But the seclusion with which we are dealing may be dueto the interaction of warm and cold air or moist and dry air and moreover, may occurequally well in anticyclonic as in cyclonic eddies.
When a body of air has been trapped and appears as an island of moist or dry air onthe isentropic chart, it is subjected to lateral mixing with its environment. Thus, if it is amoist island, it must gradually give up moisture to the surrounding dry air; if it is dry,it must gradually acquire more and more moisture at the expense of the moist air sur-rounding it. When, as sometimes happens, such a dry island in an anticyclonic eddy be-comes drier, there must be non-adiabatic descent of dry air.
c. Non-adiabatic efects. It has been pointed out that while the movements in thefree atmosphere are very nearly adiabatic over short periods of time, there are disturbinginfluences which tend to destroy the conservatism of potential temperature as well as ofspecific humidity. These non-adiabatic influences are generally of such a magnitude thatthey do not invalidate the flow patterns obtained from the isentropic charts but excep-
tions to this rule are not uncommon. There are three fundamental processes of this naturewhich should be considered:
i. Radiation
2. Convection
3. Condensation and evaporation.We shall briefly discuss these processes in terms of their effect upon the elevation of a
prescribed isentropic surface and upon its specific humidity distribution. In the main theeffect of all three of these processes is to alter the vertical distribution of temperature sothat the level of a given isentropic surface is changed. When this occurs consecutive isen-tropic charts no longer represent identical air particles from one day to the next. The caseof radiational cooling is effectively illustrated by a diagram (Fig. 8) reproduced from astudy of radiational cooling over polar regions (Wexler 1936). As the cooling proceeds
the lapse rates of temperature change from a to b to c. The height of a given isentropicsurface, represented by the dotted dry-adiabat in the figure, therefore increases from dayto day as the cooling progresses. Since the moisture distribution normally decreases withelevation, the specific humidity observed in the isentropic surface decreases as the coolinggoes on. Similar reasoning may be applied to the radiational cooling taking place at thetop of a cloud. Fortunately, the rate of radiational cooling is probably small compared toother effects, so that it does not destroy the essential character of the flow pattern. Thisslow rate of free air cooling is indicated by the cooling curves computed by Möller (1935),which suggest that the maximum temperature change resulting from the radiative un-balance in the atmosphere hardly exceeds 1.5°C per day, corresponding under normal
conditions to a maximum displacement of the isentropic surface upward of 300 m in oneday. Nevertheless, it is at times necessary to introduce this factor to explain changes in
moisture content or height of the isentropic surface which cannot satisfactorily be ex-plained by advection or other causes.
The opposite effects are observed when there is radiational heating. Then the isen-tropic surface is lowered, and since the specific humidity at lower levels is greater thanabove, there appears to be an increase in moisture over the affected area of the isen tropicchart. This type of non-adiabatic modification is significant near the ground, during thesummer season, in continental areas.

VOL. VII, NO. 1. FLUID MECHANICS APPLIED TO THE STUDY OF ATMOSPHERIC CIRCULATIONS 35
A good example of the modifications introduced by radiative factors is afforded by astudy of subsidence made by the author (Namias 1934)' It was found that the potentialtemperature at the bases and at the tops of subsidence inversions remained fairly con-stant from day to day, but that there was a well marked tendency toward decreasing
values of potential temperature as the inver-sions subsided to lower elevation. The ap- ¡.proximate constancy of the potential temper-ature along the surface of subsidence lends 9strength to the fundamental principle of isen-tropic analysis. The slight lowering of the 8
values of poten tial temperature as the surface ......of subsidence sinks must be explained by slow 7radiational cooling. In dealing with such situ-ations, one may find that the specific humid- 6ity in a dry region of the isentropic surface
decreases from day to day, although one ~should expect a slow increase as a result of ~5
lateral mixing with adjacent moist air within c;the same surface. 4
The second of the processes which mustbe considered in maintaining continuity in the :5
analysis of the isentropic chart is convection.The fundamental importance of this mecha- 2nism is that it serves to transport heat and
moisture through the atmosphere. When the /convection is brought about by thermalmeans, for instance through heating from be-low, there is a transport of moisture across theisentropic surfaces, and there is similarly atransfer of heat upward so that the isentropicsurfaces are lowered. Both transfer processes
lead to an increase in the moisture content ofthe isentropic surfaces at intermediate levels. Convection may occur at any time of theyear, but is most pronounced in summer when surface heating is a maximum. It islargely for this reason that in summer the moisture supply of the isentropic chart fre-quently appears to be replenished over central United States.
There are many direct and indirect evidences of convection in the surface and upperair data. For example, lapse rates that approximate the dry adiabat indicate convectiveactivity. Then again vertical convection tends to create a fairly homogeneous distribu-tion of water vapor. A constant value of specific humidity with elevation is seldom
established throughout the atmosphere, since condensation and precipitation are likelyto occur before this stage is reached and thus remove some of the vapor. Moreover, acertain amount of water vapor is all the time supplied from the surface through evapora-tion. However, if active convection is taking place through the lowest four or five kilo-meters of the atmosphere, there can exist no sharp horizontal moisture discontinuities,but there must be a gradual decrease of moisture with height.
The fact that convection due to heating from below lowers the isentropic surfaces but
-6 -so -4 -30 -20 -107cmpcranlrt roC)
FIG. 8.-Soundings at (a) ÅS, Norway, February 2,1933, 15.II h, (b) Fairbanks, Alaska, December 28,1932,9.34 h, (c) Ellendale, North Dakota, Feb. 8, 1933,13.23 h, local time (after Wexler 1936).
36 PAPERS IN PHYSICAL OCEANO,GRAPHY AND METEOROLOGY
raises the specific humidity at any fixed level makes the isentropic cross sections espe-cially helpful in locating regions of significant convective activity. In these regions themoisture lines of the cross section bulge upward while the lines of constant potentialtemperature dip downward. This criterion for convective activity is not infallible, for asomewhat similar pattern of lines in the cross section prevails with the advection normalto the section of a warm and moist current between two colder air masses (a warm sec-tor). It is usually possible, however, to differentiate between these two causes, convectionon the one hand and advective transport on the other, with the aid of the upper air windsand the sea level map analysis. Moreover, in summer time convection in moist air gen-erally leads to showers and thunderstorms, from which regions of active convective trans-port across the isentropic surface may be established. Indeed, if moderate thundershow-ers occur over an area, it is fairly certain that the convection is stirring at least 3 to 4kilometers of air. Willett (193S) found that during all but the summer months tropicalmaritime air over the United States must be at least 3s00 m deep in order for thunder-storms to form. This empirical finding may be an expression for the same thing, for attimes it is diffcult to say whether the moist air is deep because of the stirring caused bythunderstorm activity or whether the thunderstorms are formed after convergence pro-
duces a deep moist layer. At any rate there can be no doubt that thunderstorms of
moderate intensity are always associated with a fairly thick layer of moist air. The re-gions in which such activity is taking place may therefore safely be assumed to be re-gions of high moisture content on the isentropic chart.
If convection takes place in a region where calm prevails both at the surface and aloft,the bulging of the moisture lines becomes a symmetrical pattern in the cross section.However, there is generally an appreciable degree of wind shear with elevation so thatthe moisture pumped aloft by convection may be carried far from its source by currentsin the free air. Thunderstorm clouds in themselves offer a small scale picture of just thisphenomenon. The high cirrus and cirro-stratus that appear in advance of the storm arecarried over from the region of violent convection by the fast moving upper level windstreams. The moisture lines of the atmospheric cross sections frequently display a pat-tern strikingly similar to the well known "anvil" structure of the cumulo-nimbus. Thescales of the two phenomena are of course greatly different; the horizontal spread of thethunderstòrm anvil is generally of the order of 10 to 20 miles, while the horizontal spreadof the moist air layers in the cross sections may be from soo to 1000 miles. In individualsoundings these advective moist currents show up as marked inversions of specific hu-midity. The "axes" of these tongues of high moisture content in the cross section (theaxis being defined as a line connecting the maxima of specific humidity) frequently liealong a line of potential temperature-a fact which suggests isentropic flow. A schematicpicture of the type of cross section discussed above, and frequently observed in the EIPaso, Texas, to Montgomery, Alabama, cross section, is shown in Fig. 4.
If it were not for the replenishment of moisture by convective transport upward, themoist tongues of the isentropic charts would soon be robbed of their vapor through lateralmixing with the dry air flanking them on both sides. In summer time thunderstorms maytruly be considered as the life blood of the moist currents.
Since we must look upon convection as one of the most important mechanisms where-by upper level sources of moisture are produced, it is of interest to note the influences ofcontinental and maritime areas. In winter the land areas are much colder than the watersurfaces, and for this reason continental air masses moving out over the sea are usually

VOL. VII, NO. i. FLUID MECHANICS APPLIED TO THE STUDY OF ATMOSPHERIC CIRCULATIONS 37
subjected to rapid heating from below. In this manner thermal convection is producedand a high level source of moisture is established. An excellent ilustration of this type
of convection is found in the thunderstorms formed in the Gulf of Mexico following a coldpolar outbreak. In summer, however, water areas are cooler than land surfaces, so thatair masses leaving the heated land are subjected to a stabilizing influence. On the otherhand, maritime air currents which enter the continental areas in summer, are heatedfrom below and the resulting convection produces upper air sources of moisture. Thesesimple considerations may be summarized in the following manner:
The true source regions oj deep moist air currents are found over maritime regions inwinter, and over continental areas in summer. The analyses of daily isentropic charts at theMassachusetts Institute of Technology bear out this conclusion, and the isentropic chartsconstructed from seasonal means (Wexler and Namias 1938) lend further support.
We must finally consider the non-adiabatic effects of evaporation and condensation.In the case of condensation latent heat is set free, while with evaporation heat is con-sumed. I t becomes clear, then, that in order to estimate the effects of these processes onany given isentropic surface it is necessary to know whether the condensation and pre-cipitation is taking place above, within, or below the surface.
If the chosen isentropic surface lies above the active region, its characteristics wil notbe materially affected. An example is afforded by the instability snow flurries of polarcontinental air masses of winter. These flurries are generally formed in a shallow layerof air next to the earth's surface-a layer which is far below the representative isentropicsurfaces chosen so as not to intersect the ground even in the tropical air.
Let us suppose now that condensation and precipitation set in over some region at thelevel of the chosen isentropic surface. Latent heat is set free and this brings about a low-ering of the surface. Since the specific humidity normally increases downward it is evi-dent that the realization of latent heat leads to increases of water vapor content in themoist tongues which cannot logically be ascribed to advective transport.
When precipitation falls from above the isentropic surface modifications in the upperair structure result from the evaporation of some or possibly all of the precipitation.Evaporation cools the air, and in this manner isentropic surfaces are brought to higherlevels. If the moisture content decreases with elevation the specific humidity at thechosen isentropic surface decreases. But where precipitation is purely convective innature, the specific humidity distribution with elevation is likely to be fairly constant,and besides, in the case of active fron ts there is likely to be an increase of specific humid-ity through the transition zone. Thus in such cases, which appear to be in the majority,a lifting of the isentropic surface produces. little change in the pattern of moisture. Itappears, therefore, that the non-adiabatic effects which produce changes in the moisturedistribution on an isentropic surface are chiefly convective activity and radiation. Sinceit appears reasonably certain that the radiational processes of the atmosphere are rela-
tively slow, we must consider convection as the chief disturbing element in isentropicanalysis.
d. Weight oj air contained between isentropic surfaces. In the first portion of this chapter
a method of representing the weight of the vertical air column between two successiveisentropic surfaces was outlined. On the isentropic charts reproduced in this paper thesevalues are shown below and to the left of the aerological stations. They represent weightof air, in millibars, between the 3100 and the 30So surfaces of potential temperature. Ifthe day to day changes of these values are plotted, and the corresponding isallobars
38 PAPERS IN PHYSICAL OCEANOGRAPHY AND METEOROLOGY
drawn we have some indication of the regions of convergence and divergence. One shouldexpect to find convergence to the right of fast moving currents, and divergence to theleft (Rossby 1937b and 1938a). While there is some indication of this effect in our charts,it seems that the values of the weight of air between isentropic surfaces are subject to anumber of disturbing effects which at times affect the temperature lapse rate much morethan divergence or convergence do. For example, a cloud at the top of such a layer losesheat through radiation to space; this in turn makes the lapse rate below steeper, and theweight of air between two isentropic surfaces appears to increase. Because of these non-diabatic effects it has not yet been possible to develop a practical method of making fulluse of the isentropic isallobars.
Examples of such charts are reproduced in Fig. 9. The twenty-four hour isallobars areshown to the right thereof. There appears to be little relation between the two sets ofcharts.
II. ISENTROPIC ANALYSIS FOR THE PERIOD JUNE 21-30, 1937
An attempt will now be made to ilustrate, by means of synoptic data, some of theprinciples set forth in the first part of this report. In this synoptic discussion detailed
descriptions have been avoided, and an effort has been made to present a birds eye viewof the principal developments during the period under consideration. The particularperiod selected for analysis extends from June 21 to June 30, 1937, inclusive.
i. The Surface Weather
The weather over the United States during the period June 21-30, 1937, is fairlycharacteristic (Plates I to X) of the summer season. The frontal systems observed dur-ing this period move very slowly across the map, the horizontal pressure gradients areweak, and most precipitation appears to be of convective nature; only on the east coastand to the far north do broad frontal rain areas occasionally appear.
During this period two outbreaks of polar air occur over the eastern part of the coun-try, and both empty into the trade winds. The first outbreak has, on the morning of
June 22, reached Alabama and South Carolina. The second outbreak makes its appear-ance over the mountain states on the morning of the 23rd but does not reach the GulfCoast until the 29th. These outbreaks consist originally of polar Pacific air masses, butare soon reinforced by currents from the continental region of Canada. Since the dis-tinction between maritime and continental polar air masses over the United States insummer becomes insignificant after a short continental trajectory (Willett 1933), eachone of these two polar outbreaks appears as a single, broad homogeneous current.
While waves form on the fronts of both these polar outbreaks, in the first instancethey develop and occlude, while in the second they move as non-occluding waves, or theyocclude but in the process do not deepen appreciably. Thus, during the first part of theperiod the polar air mass moves rapidly to the south behind a deepening wave and theanticyclone of polar air thus brought in remains over the eastern part of the country forseveral days. The second outbreak of polar air has diffculty in making southward prog-ress against this anticyclone without the help of deepening wave disturbances. More-
over, the first polar outbreak is accompanied by appreciable frontal convective precipita-tion while the second, at least in the first stages of its history, produces very little rainfall,in spite of the fact that it is preceded by the sharper front, at least in the pressure field.

VOL. VII, NO. 1. FLUID MECHANICS APPLIED TO THE STUDY OF ATMOSPHERIC CIRCULATIONS 39
a. Surface isallobars, June 22-23, 1937.
b. Surface isallobars, June 23-24, 1937.
20 °ß
d. Isentropic isallobars (0= 3050 to 0= 3100) June 22-23, 1937.,
e. Isentropic Isallobars (0= 3050 to 0= 3100), June 23-24, 1937.
)-'..... ---
'0t!
c. Surface isallobars, June 24-25, 1937. f. Isentropic isal10bars (0= 3050 to 0= 3100), June 24-25, 1937.
FIG. 9.-Isentropic and surface isallobars, June 22-24, 1937.

4° PAPERS IN PHYSICAL OCEANOGRAPHY AND METEOROLOGY
2. General Character oj Isentropic Flow Patterns
In order to obtain a general picture of the free air structure during the period investi-gated we shall first describe the principal current patterns observed on the isentropiccharts (Plates I to X). The first of the two outbreaks of polar air mentioned previously
shows up on the isentropic charts for the first three days as an extensive area of dry airover the northern and eastern part of the country. This dry area is associated with an
elevated portion of the isentropic surface and moves southeastward. The trajectory ofthe main body of this dry current has a cyclonic curvature. Along the southern and West-ern boundary of this governing dry current is a narrow belt of moist air which is beingdragged around the dry air in a cyclonic sense. Meanwhile, a fresh supply of moist airflows in from the northwest and coalesces with the northward-moving moist air over themiddle west. Thus on the 23rd we have the simple structure pictured in Plate III, wherethe southern moist tongue is moving cyclonically around the dominating dry polar air,and the moist portion from the northwest and south have amalgamated into an ex-tensive moist current that is moving northeastward, apparently up the isentropic slope.To the far west a new mass of cool and dry air is displacing the moist air and marking theadvance of the second polar outbreak.
On the isentropic chart for this day there appears in the central portion of the coun-try, a zone of pronounced wind shear and this zone extends roughly north-south. To theeast thereof winds have considerable northerly components, to the west strong southerlycomponents. The lateral shearing stresses acting along this zone produce an anticycloniceddy which, by means of the wind and moisture distribution in the isentropic surfacecan be followed for several days. The circulation around the eddy tends to redistributethe moisture, so that moist air from the middle west is injected into areas previously occu-pied by dry air, and dry air from the east is injected into the region over which moist airlay. For a fewdays following the 23rd the eddy remains as a stable anticyclonic flow pat-tern, the dry air gradually being cut off from its eastern source and trapped by the moistair circulating around it. Meanwhile isentropic mixing reduces the gradient of specifichumidity so that the dry island tends to be destroyed.
In the next section it wil be shown that the anticyclonic flow of moist air aloft is re-sponsible for the development of what appears as "local" showers on the surface maps.An attempt will furthermore be made to show that the dry air of the eddy was primarilyresponsible for the lack of appreciable frontal precipitation in connection with the secondpolar outbreak.
During the last three days of the period the isentropic charts show the formation ofanother anticyclonic eddy just east of the Rockies, the development of a strong cyclonicflow pattern over the North Atlantic states.
3. On the Relation Between Shower Activity and Isentropic Flow Patterns
A specific application for isentropic analysis has been found in the forecasting of sum-mer thunderstorms. The principal results of this phase of our research has been discussedin a-separate report (Namias 1938a) and was based on a study of the same synopticsituation as the one here treated. A brief summary of the principal conclusions follows:
Convective showers and thunderstorms are likely to form when there is a deep layerof moist air in the lower troposphere or when moist air is transported at intermediatelevels. The presence of extensive dry air above a shallow moist layer effectively prevents
VOL. VII, NO. i. FLUID MECHANICS APPLIED TO THE STUDY OF ATMOSPHERIC CIRCULATIONS 41
thunderstorm activity. In the latter case there is established within the transition zonebetween the dry and moist air a region of very stable temperature lapse rate or even aninversion, possibly as a result of a radiative-turbulent mechanism suggested by the au-thor (Namias 1936). The stability of this layer hinders penetrative convection from be-low; cumulus clouds forming in the moist air near the surface have diffculty entering thestable layer. However, lateral mixing is probably even more inimical towards convectiveaction in this stratum than is the stability. If, as Parr (1936) has suggested, this type ofmixing is most pronounced where the vertical stability is greatest, we should expect thetransition zone to be most favorable for lateral diffusion. Any current of moist air thatpenetrates it from below as a result of convective inertia, suffers intense horizontal mix-ing. Because of the dryness of the admixed air the moisture of the convective current israpidly dissipated. Presumably summer cumulus clouds are often entirely disintegratedby this process. A similar example of horizontal mixing within stabk layers can be ob-served in the distribution of haze and smoke through inversions; thus Willett (1928)noted that haze and smoke spread within the inversions rather than at their bases. Thelateral dissipation of moisture out of the rising current discourages further convectiveactivity, for it is presumably through liberation of latent heat of condensation that cu-mulus clouds grow to thunderstorm proportions. Furthermore, lateral mixing raises thecondensation level to elevations which the rising current has insuffcient momentum toreach. Clearly then, the stratification of dry air above moist air is particularly unfavor-able to thunderstorm activity. Willett's empirical conclusion (1935) that over the UnitedStates tropical maritime air, from October through May at least, must be at least 3500 mdeep for thunderstorms to form, lends support to the above reasoning.
When a fairly thick moist current enters at intermediate levels, any inversions exist-ing at lower levels are destroyed and the layer from which radiation proceeds to space israised to the top of the moist layer. This facilitates convection from below, particularlyat intermediate levels where the lapse rate is steepened by cooling at the upper emissionlayer. Currents of moist air rising from the surface are not easily robbed of their moistureand the condensation levels are not raised to impossible heights. In this manner the la-tent heat of condensation may supply considerable energy to the cloud systems, and
eventually this convection may reach thunderstorm proportions.The preceding conclusions are supported by movements during the investigated peri-
od of a band of apparently local thunderstorms, the trajectory of which has been plotted
ih Fig. 10. The individual day by day positions on this' trajectory were obtained from thetwelve hourly amounts of rainfall and from the thunderstorm reports. It is fairly evidentthat the surface front pattern and sea level pressure distribution are incapable of sug-
gesting an explanation for this complex but orderly trajectory. However, a rational ex-planation appears to be available in the slow advance at intermediate levels of a moistcurrent which gradually curls around into an anticyclonic eddy. The trajectory of thismoist current and the path of the shower activity show good agreement.
4. Detailed Day by Day Analysis
June 21, 1937. (Plate I)The surface weather map shows a large warm sector of Tg air in which there have been
no showers in the preceding twelve hours except in the area close to the Npp-Tg front.The temperatures and dew points within this warm sector suggest that it consists of a

42 PAPERS IN PHYSICAL OCEANOGRAPHY AND METEOROLOGY
fairly homogeneous tropical maritime air mass. The isentropic chart reveals, however,that the structure of this warm sector aloft is far from homogeneous. A narrow stream ofmoist air originally from the EI Paso region is rapidly flowing eastward, and is flanked oneither side by extensive dry and relatively cool bodies of air. Both dry currents originallycame from Canada. The nature of this distribution is shown by the two north-south crosssections. The eastern section extending from Sault Ste. Marie to Pensacola indicates thatalong the 8=3100 line representing the intersection with the charted isentropic surface
------.SEATTLE ......
.SPOK~~'--'__.
112 AM
eBIWNGS
.""
) iTOF'd-'---
. SALT LAE CITY
eCHEYENNE
FIG. 10.- Trajectory of the center of thundershower activity associated with the anticyclonic advance of moist airaloft, June 22 to 3°,1937.
there are two moisture maxima and two minima. The dry tongues show up best at 4400m over Sault Ste. Marie and above 2000 mover Nashvile, while the moisture appearsto be concentrated to the south of Pensacola and somewhere between Sault Ste. Marieand Dayton. The northern moist tongue is associated with the polar front, and the south-ern source appears to be essentially the result of local convection, for thunderstorms werereported during the preceding 24 hours at New Orleans. The western cross section, fromFargo to San Antonio, shows that the concentration of moisture of the main stream overthis area is confined mainly to low levels. The upward bulging of moisture lines is muchless pronounced than in the eastern section, and the wind distribution indicates that thefrontal discontinuity is shallow, as the winds in the warm air soon shift from southerlycomponents to northerly.
Wind velocities in the axis of the moist stream are extremely high (force I I at KansasCity, force 9 at St. Louis). It is probable that these velocities are super-gradient and for

VOL. VII, NO. 1. FLUID MECHANICS APPLIED TO THE STUDY OF ATMOSPHERIC CIRCULATIONS 43
this reason the moist tongue in this region is taking an anticyclonic trajectory. Whilethere are few upper level wind observations in the dry and cool air to the north, it wouldseem that there are appreciable northerly components here. Sault Ste. Marie reports Acuclouds above the top of the sounding which are moving from the NNE. Moreover, thewinds over Fargo at three km are NNW-force 12. These observations indicate a rapiddisplacement of the moist stream to the southward and probable domination by the cooldry tongue.
The isentropic chart also indicates that an island of moist air has been cut off from itssource through inflow of dry air into the stream from both sides. The result of this proc-ess is to produce a gradual desiccation in the region where the influx of dry air is goingon, and along with it a decrease of condensation and precipitation as the system movessouthward.
In the Northwest we have another source of moisture, and where this moist air isforced to rise over the isentropic surface in the extreme northwest, rain is falling. Thisupglide process is shown by the comparison of soundings at Spokane, Salt Lake City andBilings. Though the specific humidities in the 3100 surface at all three stations are notappreciably different, the relative humidities, because of the ascentional cooling, increasefrom 44 % and 48% to 100% over Spokane.
June 22nd (Plate II)In the east cool and dry polar air has now broken through to the south and we see
from the isentropic chart that this dry air has become the dominating flow in the Atlanticstates. It has a cyclonic curvature characteristic of cool polar currents moving rapidlysouthward. The shearing effect of this current on its environment is strikingly shown bythe moisture and height lines to the south. The moist current of the 21st has apparentlybeen severed and the moist island which on that day was located southeast of the GreatLakes is now found in the extreme north-east. A branch of the midwestern source ofmoisture, formerly moving anticyclonically, is now dragged around the dry and coolpolar mass in a cyclonic manner. To the south the front is now producing practically noprecipitation because the dry currents have cut off the supply of moisture.
The north-south cross sections offer an illuminating picture of the character of themoist and dry streams. The eastern section shows a sharp contrast from the correspond-ing section of the 21st. Strong northerly winds and dry air have displaced the moisturemaximum of the westerlies of the 21st. The narrowness of the moist tongue resultingfrom the influx and mixing of adjacent dry currents is beautifully illustrated over Mont-gomery, where the moisture contents at levels of 3 km and above are many times thosea short distance to the north and south. This cross section suggests the nature of the
mechanism by which the moist tongue is cut off from its source. The cutting off processappears to be taking place chiefly at about 3IOo-3ISo. It is just in this stratum that thevertical stability is greatest. At Pensacola, for example, there is a layer from 2430 m to2600 m where the potential temperature increases from 3100 to 314°-an inversion oftemperature. Similarly at Nashville the layer from 3100 to 3160 is isothermal, and at
Montgomery from 3070 to 3120 the lapse rate is only 0.30/100 m.On the basis of Parr's hypothesis one should expect to observe, in this very stable
zone, the maximum depletion of moisture from the moist tongue-just the phenomenontaking place in the Sault Ste. Marie-Pensacola cross section. It is probable that a similarprocess is responsible for the frequently observed early evening destruction of tall

44 PAPERS IN PHYSICAL OCEANOGRAPHY AND METEOROLOGY
cumulus clouds. These clouds generally dissipate in such a manner that their tops breakoff from the main body presúmably through lateral mixing with drier air at an intermedi-ate leveL. .
The Fargo-San Antonio Cross section does not show a great deal of change since thepreceding day, although the moisture at 3 km over Omaha has increased appreciablybecause of the advection of moist air from the northwest, where scattered showers andthunderstorms have occurred. The second outbreak of polar air during the period in-vestigated has crossed the Northern Rocky Mountains and this front must be fairlysteep, as indicated by the fact that the isentropic surface 0=3100 rises from 2830 matSpokane to 4920 m at Seattle. The moisture content decreases from 9.5 gjkg to 1.3 gjkgover the same distance.
June 23rd (Plate III)Dry polar air still dominates the eastern part of the country but along its southwest-
ern boundary it is dragging a narrow stream of moist air eastward in a wide cyclonic arc.Along the axis of this moist tongue there have been thundershowers, and its morningposition corresponds with the surface cold front.
The two moist areas located in the Middle West and Pacific Northwest on the 22ndhave now merged into an extensive moist tongue whose axis runs roughly north andsouth. This moist tongue is beginning to show an anticyclonic curvature. The moist airresponsible for the thundershowers in the northwest on the 22nd is now producing simi-lar conditions over the area to the west of the lakes. In this case:, however, the thunder-storms are caused mainly by the motion of moist air up the steep isentropic slope. The linealong which the gradient of height lines begin to steepen marks the position of the warmfront on the surface map-for here the temperature begins to drop sharply along a hori-zontal plane.
In the west, moist air is being displaced by a colder Pp air mass as indicated by thedrop in specific humidity and inl:rease in height at most of the aerological stations in thisarea.
Perhaps the most important thing to note in the isentropic chart for the 23rd is thezone of wind shear extending in a north-south direction and marking the boundary be-tween the old polar air to the east and the moist and warm air to the west. This shearzone may in fact be found already on the isentropic chart for the 22nd.1t is in this regionwe should expect the formation of frictionally driven anticyclonic eddies. Indeed, it ispossible to locate an anticyclonic circulation on the isentropic chart for the 23rd with itscenter at the point indicated by a large asterisk. This eddy has been treated in some de-tail in Bl2b.
The Sault Ste. Marie-Pensacola cross section brings to light the nature of the mois-ture and temperature distribution in a plane almost parallel to the dominating motion.The moisture forced aloft by convection west of the Great Lakes has begun to appear atupper levels over Sault Ste. Marie. Here the specific humidity rises from a minimum of4.2 gjkg at 2360 m to a maximum of 6.8 gjkg at 3660 m. Strong northerly currents aloftare carrying this moist air rapidly southward. At Detroit, for example, alto-stratus andcirrus clouds above the top of the sounding are reported moving from the north, and at4200 m the winds are NNW, force 9. Moreover, the influence of the moist current isalready indicated at high levels over Detroit where the moisture rises from 1.4 gjkg at3480 m to 1.8 gjkg at 5500 m, the top of the ascent.

VOL. VII, NO. i. FLUÍD MECHANICS APPLIED TO THE STUDY OF ATMOSPHERIC CIRCULATIONS 45
It may be seen from the isentropic chart for this day that the specific humidity re-corded at Nashville for this particular level was considered one gram too high and con-sequently disregarded in the construction of the moisture lines. This ascent, shown inthe eastern cross section, indicates that in the region of the 3100 isotherm of potential
temperature there is a sharp discontinuity in moisture. It is probable that in penetratingthis dry-type discontinuity the hair hygrograph did not have suffcient time to recordthe correct relative humidity. This type of inaccuracy of the hair hygrograph due to lagis well-known, and Spilhaus (1935) has suggested a method by which corrections may beapplied in the evaluation of aerological ascents.
The Fargo-San Antonio cross section agrees with the isentropic chart, but has fewnoteworthy features.
June 24th (Plate IV)The most important feature of the isentropic chart is the redistribution of moisture
brought about by the anticyclonic eddy which was first noted on the chart for the daybefore. At Dayton, for example, the moisture content has risen from 2.0 gjkg to 9.3 gjkgsince the 23rd, while dry air, injected by the anticyclonic eddy westward over the GulfStates, has caused the specific humidity at Shreveport to drop from 9.7 gjkg to 5.2 gjkg.The importance of this redistribution becomes evident if one keeps in mind the fact thatadvection of moist air aloft favors shower formation, dry air at upper levels preventsshowers.
The eastern cross section happens to be in a favorable location since it is still verynearly parallel to the prevailing motion. It is therefore permissible to compare this sectionwith the corresponding one for the 23rd. Currents at high levels have carried moisturefar to the south so that inversions of moisture now occur at all stations in the sectionexcept Pensacola, which has not yet been reached by the moist curren t.
The west-east cross section extending from EI Paso to Montgomery, often helpful insummer, shows the character of the dry tongue over Shreveport and the moist tongueover Montgomery. Had we chosen the 3200 surface of potential temperature, it is clearthat the moist tongue in the eastern part of the section would have appeared more ex-tensive. Nevertheless, it is evident that the 3100 surface gives a fairly representative flowpattern.
The polar outbreak in the northwest is associated with a steep slope of the isentropicsurface, but there is very little precipitation along the sharp front. In the first place thewarm air is flowing nearly parallel to the height lines of the isentropic surface and thevertical wind component must therefore be negligibly smalL. However, equally importantis the fact that the area of high moisture indicated in the 3100 chart becomes much lessextensive in higher isentropic surfaces, since the southern dry tongue at these upperlevels is spread out over the moist air. Therefore the condensation levels in the warm airare high and the front is not moving rapidly enough to thrust the air to these levels.
June 25th (Plate V)The anticyclonic eddy has now carried the moist tongue far to the south, so that
specific humidities at Montgomery and Pensacola have risen appreciably since the 24th.There is a tendency for this moist tongue to be cut off through the influx of dry air fromthe east and from the region southwest of N ashvile, where the dry air of the anticycloniceddy remains since the day before. This cutting off is illustrated by the Dayton sounding,

46 PAPERS IN PHYSICAL OCEANOGRAPHY AND METEOROLOGY
which shows that the specific humidity has decreased 2 grams since the precèding day,evidently as the result of the sucking in of dry air from the east.
The surface weather map shows that there have been thundershowers during the pre-ceding 24 hours along a north-south line extending from Lake Erie to a point just east ofN ashville. These showers, normally considered as "local" thundershowers of the warmsector, are really associated with the moist tongue of the anticyclonic eddy. The band ofactivity coincides with the axis of the moist tongue in the isentropic chart for the 24th.
Strong northerly winds prevail in the easternmost dry tongue which farther southcurves anticyclonically into the eddy. The dry air thus brought down over Florida pre-vents the formation of thundershowers over the peninsula for the next few days-arather unusual condition in view of the fact that this region has more thundershowersthan any other region in the United States (Simmers Fig. 6.).
The dry and cool air of the western polar outbreak remains in about the same positionas it was on the 24th. Although thunderstorms are reported in connection with a smallwave centered over Omaha, the amounts of precipitation are nowhere mòre than .01 inch,a fact suggesting that they are high level thunderstorms. This conclusion agrees with thestatement made regarding the high condensation level of the air in the warm sector on theprevious day. Most of the precipitation from these thundershowers must evaporate inlayers ofIow relative humidity before it reaches the earth. The sounding made at Omahaon the morning of the 25th, shown in Fig. II, illustrates this condition. The uniform steeplapse rate above the ground inversion, the gradual rise of relative humidity to saturationat the top, and the slow decrease of specific humidity upward-all these phenomena arecharacteristic of convection in a relatively dry current. The rain observed falling fromthe clouds at the top of the ascent is rapidly evaporating into the dry air through whichit must falL. The cooling produced by evaporation of this precipitation helps to maintaina steep lapse rate.
The Sault Ste. Marie-Pensacola cross section does not offer as clear a picture of themotion as it did on the two preceding days because it is no longer parallel to the motion.A comparison with the isentropic chart indicates that the section alternatingly cutsthrough fringes of moist and dry tongues. By comparing the soundings over Montgomeryand Pensacola with those of the 24th, one clearly sees the inflow of moist air aloft. Thedrier air at Dayton between 3 to 4 km comes from the eastern celL. The deep layer ofmoist air at Sault Ste. Marie and Detroit is largely the result of convective stirring, andfavors heavy shower activity.
The EIPaso-Montgomery cross section is similar to the corresponding section for the24th except that the two moist tongues over Montgomery and EI Paso have become morepronounced. The air above Shreveport at 3060 m has a relative humidity of only 16%.It is of interest to note that both Acu and Ast clouds reported in the Montgomery sound-ing are moving from the NNE, agreeing with the motion suggested by the anticycloniceddy on the isentropic chart.
/'
June 26th (Plate VI)The general features of the isentropic chart are much the same as on the 25th, with
the anticyclonic eddy dominating the flow pattern in the south. A dry portion of the eddyhas now been completely cut off from the eastern dry cell where it originated. The dryand cool air over the northwest is now showing signs of activity, and its uplifting actionhas been strong enough to produce thunderstorms of moderate intensity behind the
.
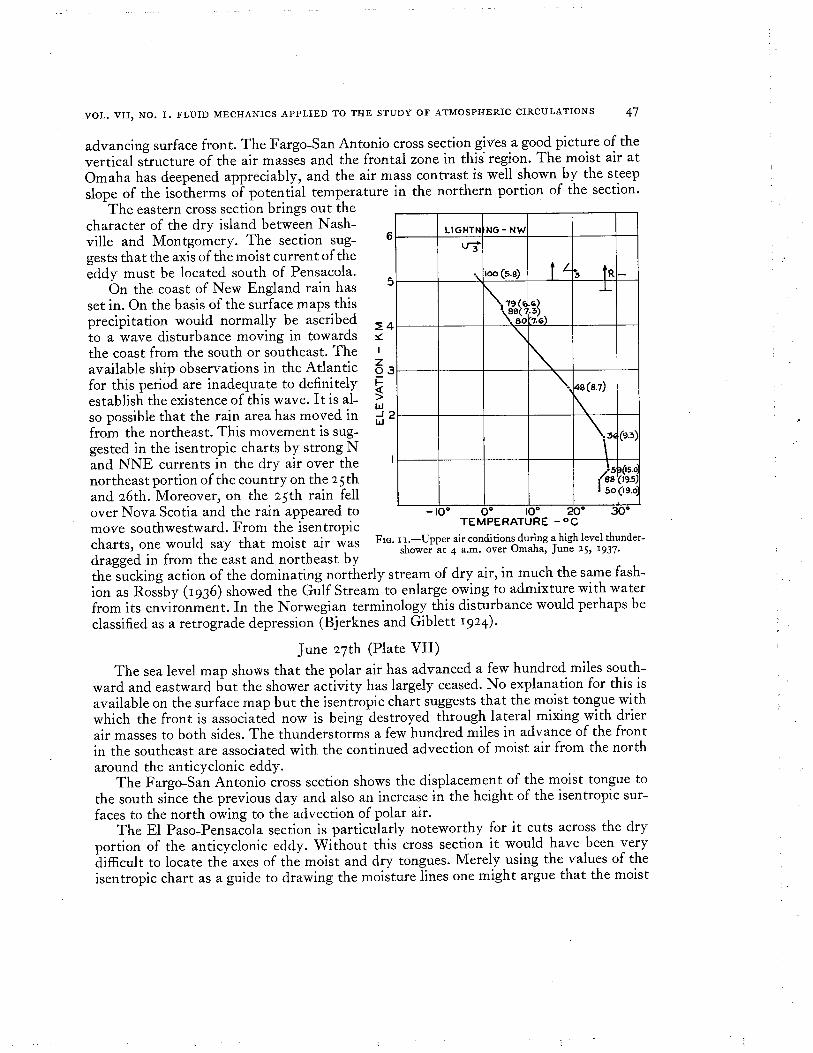
VOL. VII, NO. i. FLUID MECHANICS APPLIED TO THE STUDY OF ATMOSPHERIC CIRCULATIONS 47
advancing surface front. The Fargo-San Antonio cross section gives a good picture of thevertical structure of the air masses and the frontal zone in this' region. The moist air atOmaha has deepened appreciably, and the air mass contrast is well shown by the steepslope of the isotherms of potential temperature in the northern portion of the section.
The eastern cross section brings out thecharacter of the dry island between N ash-
ville and Montgomery. The section sug-gests that the axis of the moist curren t of theeddy must be located south of Pensacola.
On the coast of New England rain hasset in. On the basis of the surface maps thisprecipitation would normally be ascribedto a wave disturbance moving in towards
the coast from the south or southeast. Theavailable ship observations in the Atlanticfor this period are inadequate to definitelyestablish the existence of this wave. It is al-so possible that the rain area has moved infrom the northeast. This movement is sug-gested in the isentropic charts by strong Nand NNE currents in the dry air over thenortheast portion of the coun tryon the 25thand 26th. Moreover, on the 25th rain fellover Nova Scotia and the rain appeared tomove southwestward. From the isentropiccharts, one would say that moist air wasdragged in from the east and northeast bythe sucking action of the dominating northerly stream of dry air, in much the same fash-ion as Rossby (1936) showed the Gulf Stream to enlarge owing to admixture with waterfrom its environment. In the Norwegian terminology this disturbance would perhaps beclassified as a retrograde depression (Bjerknes and Giblett 1924).
6 LI GHTN NG - NWi.5
~4~I
z03~~W.. 2w
~5 Q5.0
I" 88 19.5)50 19.0
_10. D. 10. 20"TEMPERATURE _oC
3D.
FIG. n.-Upper air conditions during a high level thunder-shower at 4 a.m. over Omaha, June 25, 1937.
June 27th (Plate VII)The sea level map shows that the polar air has advanced a few hundred miles south-
ward and eastward but the shower activity has largely ceased. No explanation for this isavailable on the surface map but the isentropic chart suggests that the moist tongue withwhich the front is associated now is being destroyed through lateral mixing with drierair masses to both sides. The thunderstorms a few hundred miles in advance of the frontin the southeast are associated with the continued advection of moist air from the northaround the anticyclonic eddy.
The Fargo-San Antonio cross section shows the displacement of the moist tongue tothe south since the previous day and also an increase in the height of the isentropic sur-faces to the north owing to the advection of polar air.
The EI Paso-Pensacola section is particularly noteworthy for it cuts across the dryportion of the anticyclonic eddy. Without this cross section it would have been verydiffcult to locate the axes of the moist and dry tongues. Merely using the values of theisentropic chart as a guide to drawing the moisture lines one might argue that the moist

48 PAPERS IN PHYSICAL OCEANOGRAPHY AND METEOROLOGY
tongue'lies between San Antonio and EI Paso rather than in the position indicated. How-ever, it is not possible to. analyze the EI Paso-Pensacola cross section so as to be reason-ably consistent with this interpretation. Moreover, the sounding made on the morningof the 27th at San Diego shows an increase of specific humidity from 3,4 to 3.9 gjkg from4030 to 4900 m, showing the westward advance of the moist tongue. On the evening ofthe 27th San Diego reports Acu clouds moving from the SE, and at 2 o'clock in the morn-ing a thunderstorm occurred-a comparatively rare phenomenon for southern California.Even stations in the desert, for example Yuma, Arizona, reported showers following theinflux of the moist tongue. These observed facts could not readily be explained if the axisof the moist tongue had been placed between San Antonio and EI Paso.
June 28th (Plate VIII)The isentropic chart shows that the second polar air outbreak now has reached the
Atlantic Seacoast, and, like the first outbreak, has a cyclonic curvature. Indeed, the en-tire flow over eastern United States is governed by this cyclonic flow pattern.
The anticyclonic eddy is now breaking down but the moisture distribution it hascreated still persists in the southern part of the country although contrasts are diminish-ing as a result of strong lateral mixing. The moist tongue far to the south continues tomove eastward and is invading Texas. The influence of this tongue during the following24 hours is manifested by severe thundershowers over Texas, inland from the Gulf coast.
Returning to the dominating polar air current, it appears to have caused the moistcurrent to move around cyclonically and into the area south and west of New England.Thus at New York the specific humidity is 10.2 gjkg at the 3100 surface, while at Bostonit is only 3.2 gjkg and at Washington, 5.1 gjkg. The forced ascent of this moist air alongthe isentropic surface produces a continuous band of rain throughout New York Stateand southward to Virginia. The surface maps indicate that this belt of rain later moves ina NNE direction, which agrees with the circulation suggested by the isentropic chart.
The eastern cross section bears out the isentropic analysis by showing the dry andcool tongues to the north and south of Montgomery. From this section it is obvious thatany isentropic surface above the surface layers would show the same general flow pattern:
The Fargo-San Antonio cross section also agrees with the isentropic chart. The glob-ule of moist air between Omaha and Oklahoma is probably best explained as the advanceportion of the moist current to the west. '
In the area between Fargo, Omaha, Salt Lake City, and Billngs an anticyclonic eddyis forming in the shear zone between the northerlies of the polar flow and the moist south-erly current. The moist globule at about 4 km between Omaha and Oklahoma also sug-ges ts this eddy.
June 29th (Plate IX)The cyclonically flowing polar air has carried the moist tongue far to the south and
east, and the remaining dry air from the first polar outbreak has completely lost itsidentity through mixing with moister air currents. The moist tongue far to the south isnicely verified by the Sault Ste. Marie-Pensacola cross section. Otherwise, we have in thissection an extensive mass of cool, dry polar air.
In the west the anticyclonic eddy between the northerly dry current and the southerlymoist stream appears more well-defined in the wind circulation than it did on the preced-ing day. On the isentropic chart an island of moist air is indicated as having broken off

VOL. VII, NO. i. FLUID MECHANICS APPLIED TO THE STUDY OF ATMOSPHERIC CIRCULATIONS 49
from its supply of moisture to the west. The upper wind indications seem to point to thisconclusion, and the surface maps show that an area of precipitation and thundershowershas moved southward over Iowa during the night of the 28th. While the mechanism ofthis shedding of a moist island is not clear, it is possible that it is associated with con-vective activity that serves to pump to upper levels the moisture from lower layers. Thisconvection may be set off by radiational cooling from layers of moisture at high levels.Already in the Fargo-San Antonio cross section for the 28th we saw the moist current atthe level of about 4 km entering from the west between Oklahoma and Omaha. It ispossible that the outgoing radiation from this high level source of moisture may be re-sponsible for initiating the convection resulting in nocturnal thundershowers over Iowa.The island of moisture, once established, moves on with the dominating flow in which itfinds itself entrapped. Unfortunately there are no upper air winds in the region of thismoist island, but a few cloud observations show Acu moving from the NW and W. Ap-parently the moisture has been carried into the cyclonic circulation around the polaroutbreak. This contention is further substantiated by the fact that from the 29th to the30th showers and a number of thundershowers break out in a band extending roughly ina SW-NE region from western Tennessee to southern New England. It is interesting tonote that a front is entered on the surface maps in the region in which showers occur onthe night of the 29th, although there is no evidence for this front on the morning map.It would appear from the isentropic analysis that convection in the moist air preceded theformation of the front at the surface.
In the far west it is raining. This precipitation is undoubtedly associated with themoist tongue first observed entering the region between EI Paso and San Diego on the27th. Cases of rain of a similar nature have been described by Reed (1933).
June 30th (Plate X)The moist island from the middle west has been caught in the fast moving cyclonic
circulation around the dome of the height lines and carried far to the northeast, so thatit appears to be centered south of New England. The western anticyclonic eddy is welldeveloped in the wind .circulation and also the pattern of moisture lines. This pattern issubstantiated by the Fargo-San Antonio cross section in which a moist tongue appearsjust north of Omaha at about 3 km. Penetrating this level we note that the winds shiftfrom N at 2400 m to NNW at 3000 m, then back to N at 3600 m. There can be no doubtthat the moist air comes from the western source. The well marked dry tongue overOklahoma is now rapidly circulating around the eddy. Tangential components of thewinds are strongest on the east side and weakest on the SW side of the eddy. This dis-symmetry indicates that the center of rotation wil move in a southwesterly direction.There is evidence in the isentropic chart for July 1st (not reproduced) that this directionwas followed. Another anticyclonic eddy is indicated as forming over the Gulf of Mexico.
It is significant that these eddies are not even remotely suggested by the surfaceweather map.
III. SUMMARY
The free atmosphere may be considered to consist of an infinite number of superim-posed isentropic sheets of infinitesimal thickness and constant potential temperature.As long as the movements of the air take place adiabatically, each such layer retains itsidentity from one day to the next.

50 PAPERS IN PHYSICAL OCEANOGRAPHY AND METEOROLOGY
The use of upper air data in synoptic analysis becomes particularly effective when thefree air structure is described with reference to these infinitesimal isentropic sheets or
surfaces. Upper air analysis based on this method of representation has been named isen-tropic analysis. With a network of aerological stations as dense as over the United Statesit is'possible to carryon an uninterrupted day to day isentropic analysis, but the processwould be greatly facilitated and the results would gain in reliability if the number ofaerological stations were appreciably increased and if soundings were made every twelveinstead of every twenty-four hours.
The method of isen tropic analysis described in this report has been developed chieflythrough the daily study of upper air data at the Massachusetts Institute of Technology.It has been found that isentropic charts cannot be constructed in a purely mechanical
fashion but that the best results are obtained when coordinated use is made of isentropiccharts, cross sections and surface weather data. By a process of successive approxima-tions it is then normally possible to obtain a satisfactory solution of the free air flow pat-tern. The individual steps in this process are:
i. For each airplane or radio-sonde station, the values of the various meteorological
elements (including the wind) at one or several representative isentropic levels are com-puted and plotted on ordinary weather base maps.
2. A first approximation to the pattern of contour lines for these isentropic surfacesis sketched, taking into consideration the indications furnished by the sea level weatherand isallobaric charts.
3. Upper air winds from all other stations are entered on the isentropic charts withthe aid of the elevations obtained from the preliminary contour lines.
4- The preliminary con tour lines are erased.5. Lines of constant specific humidity on the isentropic charts and on the cross sec-
tions are sketched so that by mutual adjustment a flow pattern is obtained which main-tains reasonable continuity with the isentropic analysis for the preceding day.
6. The final flow pattern of moisture and contour lines is constructed.The flow patterns studied thus 'fr appear to be established and governed by fast-
moving air currents. For the most part these patterns have consisted of anticyclonic ed-dies of widely varying dimensions, although cases of cyclonic eddies are by no means rare.The eddies are generally asymmetrical in their distribution of moisture. Thus moist ordry bodies of air are frequently trapped near the center but are likely to lose theiridentity through isentropic mixing with the environment. There is some evidence thatthis type of mixing is most pronounced in regions of greatest (vertical) stability. The lifehistory of an eddy appears to be determined largely by the distribution of wind velocityaround it.
There are important non-adiabatic effects which tend to obscure the continuity ofisentropic analysis, and of these convection is the most disturbing. However, it is general-ly possible to locate and to evaluate qualitatively the effects of convection as well as the
less disrupting effects of radiation, condensation and evaporation.The isentropic analysis for the period June 21-30, 1937, has been presented to illus-
trate the practical use of the method in daily routine, and to bring to light examples ofphenomena discussed in the first portion of the report.

VOL. VII, NO. I~ FLUID MECHANICS APPLIED TO THE STUDY OF ATMOSPHERIC CIRCULATIONS 51
iv. PLATES
Surface weather maps. Cold fronts are indicated by heavy solid lines, warm fronts bydotted lines, and occluded fronts by alternately dashed and dotted lines. The hatchingindicates areas where precipitation is falling at the time of observation. Air mass symbolsare those customarily in use in the United States. Surface observations at or near
aerological stations (circles) are entered in the customary manner. To the right of thecircles from top to bottom: temperature and dew poin t (OF), pressure, and precipi tation.Winds are indicated by arrows, the numbers of half barbs corresponding to Beaufortnumbers of force. To the left of the station are the clouds in international symbols, andthe pressure characteristic and change in the preceding three hours. Thunderstormsoccurring in the preceding 24 hours are indicated by the international symbol, and asubscript shows the time of occurrence. Those enclosed in parentheses took place in thefirst twelve hours of the preceding 24 hour period, those not enclosed within the lasttwelve hours.
Isentropic charts. Solid lines are lines of specific humidity while dotted lines are linesof elevation (in meters) of the chosen surface above sea leveL. "M" signifies the centerof a moist tongue, "D" the center of a dry tongue. "H" and "L" are entered at the crestsand troughs of the isentropic sheet. The numbers to the right of the aerological stationsare, in the order listed, the specific humidity, the elevation, and the relative humidity atthe given isentropic sheet. To the left of the station is entered the weight, in milibars,of the layer bounded by the 30So and 3100 surfaces of potential temperature. The changefrom day to day in these values offers indications of convergence and divergence. Windsat the isentropic surface are shown by arrows, the number of half-barbs being roughlyequivalent to Beaufort numbers of the scale of wind force. Clouds are indicated by theinternational cloud symbols. Subscripts give the amount of cloud and arrows the direc-tion of movement. If the letter "b" appears following the symbol the clouds are below
the isentropic sheet, if elevations are given the clouds penetrate the sheet, and if nothingis appended they are above it. An asterisk (*) indicates that the clouds are within therange of the sounding, yet no height was recorded.
Vertical cross sections. The evenly spaced horizontal lines represent full kilometers ofheight. Solid lines are drawn for specific humidity, dashed lines for potential temperature.The humidities in the individual soundings are entered to the left and the potentialteinperat,ures to the right of the vertical. The method of indicating wind direction isdescribed on page 22. Clouds are indicated by the international symbols; those abovethe soundings are either above the top of the ascent, or, if accompanied by an asterisk,within the levels penetrated by the sounding but not placed specifically. Here again"M" stands for moist, "D" for dry.

,..00/
H
e. 3100
2.1.1937 A.M.JUNE.
~~
99 J%:y / L-"" 'i ''." L .,-:"alsG--.
'iv" ''),,1'''rpP
. 9,9
\.
, -- --- ---
00
-".G2
9,9 ~y~~
. '\21 1937. Ba.m..JUNE. .
L- 1./n ( )02 ~
'~~\ \'/74~G
Q,I
CD
N AMIAS

FARGO OMAHA OK LAHOM A 'SAN ANTONIO
320 -_Iu...., i 2'- " .. 320
"-
4
315/'/'6
310
305 8
,,~ \D .. "v D..~.." \'\ \ /'"~ , \6 305
\0300 -_ .. 300
12295 -_ 14290 --
SAULT STE MARIE DETROIT DAYTON NASHVILLE MONTGOMERY PENSACOLA
õ
1
320\\
0,4 320 0,9 323320315310
2310
4 l(
305
300 ....
8
PLATE I

e-310.JUNE. 2.2,1937
8 9;/,.,Ci /0 II
D/ /..,§J 0/ /.,0 ".. 10
9 DA.M.
......... .
JUNE 22. 1937. 8 Q.m. ('0,1
NAMIAS
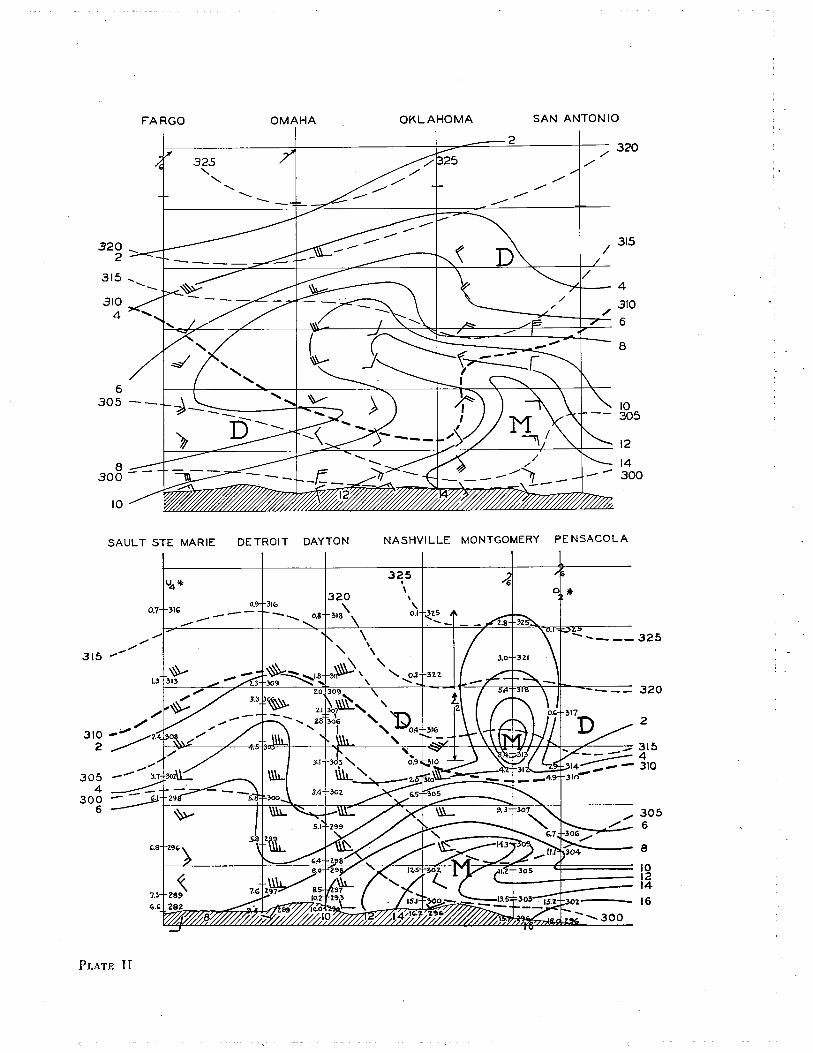
FARGO OMAHA OKLAHOMA SAN ANTON 10
320 -.2
315
3104
2./ 320/'325
"-'" "- --
-"/".,- ..
4310/6
8
6305 -- 10
305
8 _300 -
12
14300
10
SAULT STE MARIE DETROIT DAYTON NASHVILLE MONTGOMERY PENSACOLA
3102
325.\\,0.1 ~Z5, ..-
u4*
0.7 31'0.9 3Hò---- --- 0.8-
./-"315 .--".-
~1.3 313
-..._ __ 325
-- -- 320
2
3054
3006
',8
". 305./ 6
e
101214
16
PLATE II

-.,-"-,U-..b...
7'.iO.4 --'-... )'5080Z6
e = 3100JUNE 2.3,1937 A.M.
JUNE 23, 1937. 8Q.ßl.
N AMIAS
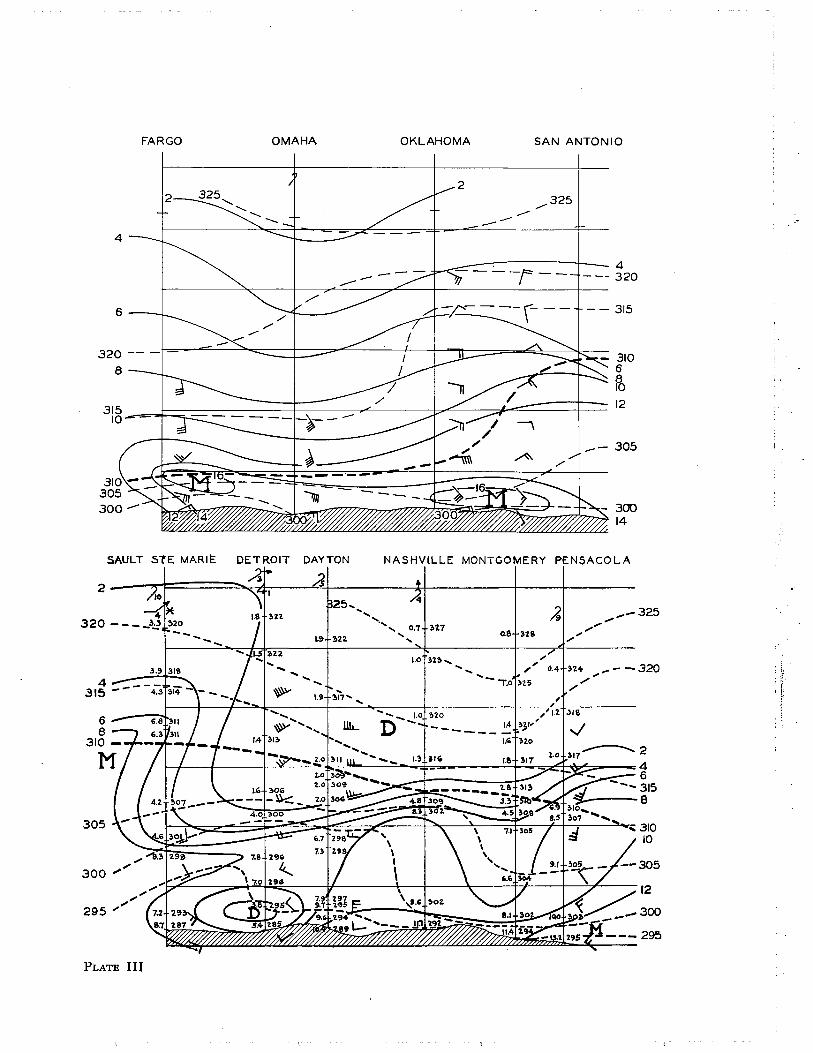
FARGO OMAHA OKLAHOMA SAN ANTONIO
22
./ 325..- ..
4- -- 320
-- 315
3106810
12\__ - 305~
320 --8
6/'
4
-- --
31510
- 30014
SAULT S"lE MARIE DETROIT DAYTON NASHVILLE MONTGOMERY PENSACOLA
300
'4
2
A ,_ 325.."..;"0.7 )17
a8 ~Z8L9 ~22
..1.03n, .. ..
'".;"'.; 0.4 ~24 ;.. - - 320
..- 1.0 ~is ",./ i Î:,¡
4315
.. ,~ ..1.9 ~17"'.. ,
/1,2 .316
___ ~ ~3'.. ..i.' Ho
1,8)17 -- 2
46
--"'3158
305
295
PLATE III

6=310.2.4, 1937 A.M.JUNE
9,8 9,9 0,0
4 1937' 8Q.m.JUNE 2 .
N AMIAS

EL PASO SAN ANTONIO SHREVEPORT MONTGOMERY
6
22-
44
325"-"
"- ,"-
"-"-
A --
B
320B
315
310
)....')
10
12
- _.: 305- :: 300
295300 295
SAULT 5TE MARIE DETROIT DAYTON NASHVILLE MONTGOMERY PENSACOLA
3*
i
...., 2
"320
12
14
16
300M---- 300IX
PLATE iv

"$0 ~,0, () 1.5:: __'
'95 4600" .. ~'43 03~ -- l-4000_ "'.5;00 308' - ---- 1"-- " 15, ---:"" .. ..:;¡ ....
.... ~ ....i.-.. -. 5...., ..Wli7ìõ-- _ _ _ _ __- __ __ ~IB 66-__ _ _--- "'------
°°000~8~8~\t,i~ rF0
;i
0°.f!
\\
/ir?C.,
9-310.JUNE 25,19:57 A.M.
'HICZH"' '--
"'~ 1:/43
0,0
0.0
JUN~ 25. 1937 ..... NAM'AS

EL PASO SAN ANTONIO SHREVEPORT MONTGOMERY2
6
4
8320 310
1012
6
8
315
310 30510
300
SAULT STE MARIE DETROIT DAYTON NASHVILLE MONTGOMERY PENSACOLA~
4
*
I *"
2..1 321
------ 3206
320'-9 317
8
4315
315
10
310
305300295
PLATE V
6831010
__----- 305
303
95-
3001214
-----

7,0
~~go\ L
/'7,07 ~ Ilcl0
e-:310.26, 19~7 A.M.
01
Jì~ "-~:-.~_~_"" a-/t.l48 __ --
9,8 9,0
G9.9 ,/
.........
.......26 1937. 8 a.",.JUNE.9,9 ..........9.
N AMIAS

PLATE VI

e-310.27,1937JUNE. A.M.
- -- --;.,
- 011$202
I
I
i
~" 9,9
L
\\
9,9
0.0
7 1937' 8 a.m.JUNE 2. .0.0
N AMIAS

EL PASO SAN ANTONIO SHREVEPORT PENSACOLAB. moving In
2
6320
320
4 6
8B
315
10
12
FARGO OMAHA OKLAHOMA SAN ANTONIO315
310 2
315 "
305
4310
26
8
10
4
6
8
PLATE VII

e-310.J UN E. 2.8.1937 A.M.
9,9
JUNE. '28. 1937' 8 a.m. E.0
N AMIAS

FARGO OMAHA OKLAHOMA SAN ANTONIC
3102
305
15,,,,0,8 314 " ,
315i
320i320,, \
\
,,"
Z.98.0 311~ 8
4
300 - - - --4.ii
6295290
8
SAULT STE MARtE DETROIT DAYTON
~
~swNASHVILLE MONTGOMERY PENSACOLAI..
315 -- 4.. .. " .."2
-- "-...... D......
""- .. --- 320---
315305 --
4 310
300 --
6
6810
30512141618295 --
290 -
PLATE VIII
2
32046315
310
30510
12
4

D
e-310.JUNE. 2.9, 19~7 A.M.
/I
/i
\\'2500 10
9.8
JUNE. 29, 1937' 60.1\.
N AMIAS

FARGO OMAHA OKLAHOMA SAN ANTO N 10
300,. "4 ..
2320..
2
314', 4.. --- 0.8 316
D 0.9 31331&
1.3 310.. .. .. ...... _ -!5 310
"..,,
'.. 315
68
2.9 310
10
295 -_.._..5.8
fi - 305
12- 300
14
8.' 2-". --..'.2
290 -
SAULT STE MARIE DETROIT DAYTON NASHVILLE MONTGOMERY PENSACOLA
310 -- - .. ......
.2 Te4 L.~ 320
..- 6305 - _
84
10
6
290 -- 12
14
16-- 30
PLATE ix

e~310.JUNE. 30,1937 A.M,
i~!
937 8 a.m.JUNE. 30, I !OJ'
NAMIAS

EL PASO SAN ANTONIO SHREVEPORT PENSACOLA
320 --
2
J,Oil---
6.." , "-
, 320-D..',"', 315
2
4~IO830510
295
12
-- 300
295
----FARGO OMAHA OKLAHOMA SAN ANTONIO
320315
3154
3106
8
3052
10300
4 1214
6
305
PLATE X

C. ISENTROPIC ANALYSIS OF A CASE OF ANTICYCLOGENESISBY RITCHIE G. SIMMERS
i. INTRODUCTION
Anticyclones are usually broadly classified into two groups, "cold" and "warm,"distinguished by relatively low or relatively high temperatures respectively in the aircomprising their lower layers. The extremes of the two types are represented by the coldanticyclones formed over snow covered regions in high latitudes and the warm anticy-clones of the sub tropics. In a true cold anticyclone, on the one hand, the dense surfaceair causes the pressure to decrease rapidly with height and within a relatively short dis-tance above the ground the area of high pressure is replaced by one of low pressure-i.e.,
a cold anticyclone is confined to the lower layers and has a cyclone located above it. Ina warm anticyclone, on the other hand, the decrease of pressure with height is moregradual and the area of high pressure may continue even into the stratosphere; Whenapplied to anticyclones, then, "cold" and "warm" are synonomous with "low level" and"high leveL."
The anticyclones occurring most frequently in the United States are those which formover northern Canada, subsequently migrate south and southeastward in the rear of coldwaves, and finally disappear in the vicinity of Bermuda. In their initial stages these anti-cyclones most definitely belong to the cold category, but as they travel southward thepool of cold surface air which is responsible for the high pressure spreads out horizontallyand, in the absence of new supplies from the north, the layer which it occupies must
necessarily become thinner. The contribution of this cold air to the grqund pressure mustthen become progressively smaller, and a cold anticyclone might therefore well be ex-pected to decrease in intensity as it migrates. It is found, however, that many increase inintensity during a portion of their travel southwards, this phenomenon being termed"an ticyclogenesis."
Obviously the seat of the processes leading to the anticyclogenesis must be in levelsabove the surface layer. Increased ground pressure implies an increase of mass of theoverlying air and this can be brought about in only two ways, viz: (a) by replacementwith air of a higher density, and (b) by convergence, with consequent piling up of air overthe area. But this is about as far as our knowledge goes. In what combination the twofactors occur, at what levels, at what times and at what intensity they act is still un-known, and without the knowledge which can be obtained only by actual observationsany theoretical treatment must remain rather in the nature of guesswork. The primaryaim of this investigation, then, has been to provide some such observational data bymeans of a detailed study of upper air conditions in one individual case of anticyclogene-sis and to provide a structural picture which may serve as a guide in the formulation ofthe corresponding dynamic problem.
The particular anticyclone chosen for study took nine days to move from northernCanada to Bermuda, marked anticyclogenesis occurring on two of the days. During thisperiod the anticyclone also changed from a cold to a warm type and, since knowledge ofthis transition is as meagre as that of anticyclogenesis, the investigation has been extend-ed to cover all nine days.
72

VOL. VII, NO. i. FLUID MECHANICS APPLIED TO THE STUDY OF ATMOSPHERIC CIRCULATIONS 73
Such an investigation demands a great number of upper air observations, and it isonly in recent years that there has been a really close network of meteorograph and pilotballoon stations. Dearth of adequate data, however, is not necessarily the sole reason forour paucity of knowledge of anticyclones. Failure to analyze to the best advantage whatinformation there has been available has quite possibly retarded advance. For manyyears the standard practice in representation of conditions¡ in the free atmosphere hasbeen by means of maps at fixed horizontal levels, but for the study of day to day develop-ments such maps are not really appropriate. Except during condensation or evaporationthe processes in the free atmosphere are approximately adiabatic so that air movementswil take place along surfaces of equal entropy rather than along those of equal geopo-
tentiaI. The natural method of representation of such movements, then, is by mtans ofmaps constructed in isentropic and not horizontal surfaces. This conception was firstintroduced by Shaw (1933), was revived and improved by, Rossby (Rossby and coil.i 937 a and b) and has been applied for over a year to the routine daily analysis of weathermaps at M. i. T. The experience gained thereby has already demonstrated the effective-ness of isentropic charts in throwing into sharp relief the flow patterns in the atmosphereand the very definite advantages they possess over the usual combinations of verticalcross sections and horizontal upper level maps. They have, then, been chosen for use inthe present investigations. As this is one of the first attempts to apply the newly evolvedtechnique of isentropic analysis in the detailed study of one definite weather situation-as distinct from the necessarily more hurried application in routine daily analyses-itconstitutes, quite apart from the study of anticyclogenesis, a more or less rigorous testboth of the usefulness 'of the method and of the validity of the underlying assumptionsof isentropic flow. It can be said immediately that the method has stood up well to thetest, it having been possible to carry through by means of isentropic charts a systematicand consistent analysis with good continuity through the entire period of nine days.
It was stated earlier that anticyclogenesis is due either to an increase in density or to
convergence. Density increases can be quite adequately accounted for by radiationalcooling in situ or by the advection of cold air, though in cases of rapid anticyclogenesis
the former effect is probably insignificant, but until recently there have been no reallyconvincing explanations of the mechanism of convergence. Recently, however, ProfessorRossby has been able to analyze, in particularly simple cases, the mechanics of the ad-justment of the pressure distribution to a changing velocity distribution (Rossby, 1937 band 1938 a). The analysis shows that the inflow of momentum into a previously stagnantportion of the atmosphere produces a banking of the atmosphere to the right (on thenorthern hemisphere) and the magnitude of the resulting anticyclogenesis is, for certainsimple cases, predictable. In addition it has been possible to show that even dynamicallybalanced currents under the influence of large scale lateral mixing develop cross-isobarwind components such that there is convergence (pressure rise) along the right handside of the current. There should, then, be a tendency towards a dynamic piling up of airto the right of all currents, and one of the purposes of the present study has been to seeif there is observational evidence of such banking and to provide a guide for the develop-ment of an adequate dynamic model of anticyclogenesis.
Excellent reviews of the known facts about anticyclones and unsolved problems con-nected with them are given by Brooks (1932) and Brunt (1934), while some of the more
recent contributions in this field are those of Palmén (1933, 1935), Douglas (1935),Wexler (1936, 1937), J. Bjerknes (1937), Stüve (1937), and Haurwitz and Turnbull

74 PAPERS IN PHYSICAL OCEANOGRAPHY AND METEOROLOGY
(1938). The dynamically produced temperature changes in the stratosphere above cy-clones and anticyclones have been treated by Rossby in a recent article (1937 a).
II. THE SYNOPTIC SITUATION
i. General Features.
The meteorological sitwition chosen for detailed examination is that for the periodMay 18-26th, 1936, during which an extensive and fairly intense anticyclone of the"Alberta" type (Bowie and Weightman 1917) moved southeastwards across the UnitedStates. This anticyclone first appeared within the station network on the 16th p. m., thesuccessive positions of the centre until the 27th, together with the values of highest
pressure, being given in Fig. i. Owing to the sparseness of observing points in the farnorth and over the ocean the positions and values of the highest pressure at the beginningand towards the end of the period are necessarily only approximate.
From the point of view of being nearer to the' centre of the network of aerologicalstations, an anticyclone with a path some distance to the west of that chosen wouldhave been preferable. As the period from which a choice could be made was limited toonly a few months there were, however, few cases of anticyclogenesis available. In thefirst place, it is only since the middle of 1934 that there has been a suffciently largenumber of aerological stations to permit an adequate isentropic analysis, while the periodavailable was further limited by leaving out of consideration cases occurring in eithersummer or winter-the former season because the surface pressure systems are thenusually ill defined, and the latter because the specific humidities in polar continental airare then so low that their variations, on which isentropic analysis is based, are likely tobe too small to be used with confidence. In the winter, too, the winds, are in general, verystrong and consequently, in the 24 hour interval between aerological observations the
situations alter so much that it is diffcult to obtain continuity in analyses.Returning to the consideration of Fig. I, it appears that between the 17th and 18th
the anticyclone increased considerably in area, while during the 18th a second centredeveloped and subsequently moved roughly parallel to and slightly east of the originalcentre until it lost its separate identity on the 23rd. With the exception of the evening ofthe 19th, when there was a temporary decrease of intensity in the original centre, thepressures in both remained about equal. The track of this second center is also shown inFig. I.
From the pressures given in Fig. I it is seen that in general the morning maxima aregreater than those of the evening, their diurnal variation being particularly marked onthe 19th and 21st when there is a large diurnal variation of temperature. In Fig. 2 isshown the variation of the highest pressure at 8 a.m. each day, the afternoon values beingomitted to avoid complicating the curve with the diurnal variations. After a sharp risebetween the 16th and 17th, the pressure remains fairly constant for three days and then,from the 20th to 21st, when the system is centered over the Great Lakes region, thereis very rapid and marked anticyclogenesis, the maximum pressure increasing more thantwo tenths inch (6 mb) in the 24 hours. This intensification is maintained for a day andthe maximum pressure then decreases fairly rapidly for two days and later more gradu-ally. Despite this decrease in intensity the anticyclone remains stable and can still beidentified on the 28th, i.e., twelve days after its formation and eight days after the peakof its developmen t.

VOL. VII, NO. i. FLUID MECHANICS APPLIED TO THE STUDY OF ATMOSPHERIC CIRCULATIONS 75
,\~*~~~~~~~~,\ 't X'~~~~"\x \~ 'X, ~~x"~& ~~(\' ~x(~~M :X.0 X" XtSyx\0 ~ "
'2 W~~:x :x,q,: i' ~ ). :x:'~~)o' :~ ~~ ,.¿~ "'?t~ 4~'
'.~t0\ ~0--- ~Y\ ~Quckc K~ t ~ 5 bl -I 0\'2 A .70. !\,~~ V ~ ~\
00.-0 .- '): ..;; f\
~~~
+t-L;; eS -i-i-\
ib, ¡,: ','- .. -- --"','i l-H~ ----._ ~ l-I- ----"..C~~ ~ J' O..J:--
¡:-' 1- d~~."" -.:._ ll i-----
M- I-$~,,-,"'i- h',c: i - ~~.II i \ \ \ \ J--
ii
~V
/ ?'''Y' j(:I )(j(
-lÃ,,' " 'I 'I'-Ý- Ý- ..".. 'j"",
,
,; "-.I
~x ~r\ (V t"J ,.\- \ eo'7~~ :'l' '1 ~ 'mU.,° ~lèPt15' lOA. T' ~ '1 ~~
~ -( Chsllt:k:lriktlQ Nottinqtlm '"Y' ..._~''''~~. (1 I'~~-o~ A i .16P~' ,\ i
i:'¡ Cbun:bJI19P~. fiT-~...~
,i
M è
,'si .\~-J- -'!-,...~,¡. ~O~.R~H (5 _.' r" _T A )u 0)\I f"arqo + II Dol... Sc..it St. Meie.
';tt"~ISC~~, ;;ff'~\:, Of. 0....., ~-'9 i "."6h\t ç i.~lt 'K A i W A Cblcaqø4 -'_n_ _._ . ..~h~ "'ì;- r "Cc! ' .p
_h_. -rF-"'~'QI 1'E ¡ "i~o¡~ I.
° 1ìi-l~ 0 \~~'~ ;g' 0 .P)'
SAS ) -J ~Sl-0ui~ ..,,__h~h_h LO~1'L'" ~~,,~\l~~~ "'-..-:1,
! j Qsbwllke 0 T~~~ .OklahomaClly TE.W.NE.S? E; "','
¡ ''- ' 0 "i WRlz\lS')' ii 1°-, ',~' S~':k!: .~~' ~..,.. \ o.tõ AR"~--,.. .....00 j. :""'hhi, :: ! OJ 0 -p J c~ar~uton
( S.""pe..' o! ."'" l'0mc'~G' ~ -rA S 0 ~ ! t .."9 JI. ) ~ ' h! !. C:'l'u 0, ..:,d l0.. ('" ,_," c: la
""\ ...;" ~ .- '\:'.A_._'.: 't á~ ."~'~ '\9~ ~_
..J.. ti.~
L' -"1~...~:W-
Son Dl
','"
,d......
'¿5" f-
ff¡;~itif - ..,- -- k I- 0
"'8:~, °L::;~'r-":.::::::::::g -- -- l-""". mmg -' J i i I T
"~.:~.'::...". :8 -l STATIO'l _ __ _ _ ____. .n _ ::::... 8 ~ OALE . .. .. TIME m115 110' 105
l, -
~I _..1°--
~
\.'I!,"t"""'.:~-w'",,~ -¡,¡
\-
,,'""II)' ..' SO' BO'
FIG. l.-Paths of centres of highest pressure during the period May 16-27, 1936.
-u,::'
i
~A \
!.. ,.foD3~
í\
J!i~rmudQ
"OJ
o'
301.5-
~o
20' ,,'

76 PAPERS IN PHYSICAL OCEANOGRAPHY AND METEOROLOGY
As a forerunner of the anticyclone there is a cold front which on the 18th runs roughlyWSW-ENE some 200 miles south of a line joining Churchil to Edmonton and whichadvances southeastwards at about 600 miles a day til the 20th, when it becomes more orless stationary between Nashvile and Pensacola. Behind this rapidly moving cold frontthere is typical dry and cold polar continental air. Between the 20th and 21st, i.e., coin-cident with the anticyclogenesis, this air mass type commences to lose its Pc character-istics over the Detroit-Dayton area, becoming both warmer and more moist. This in-crease of temperature and specific humidity continues progressivèIy from day to day for
(/30.70~ 30.60U~ 3Q50i
w30.40a:~3Q30
i:3Q20a:0. 30.10
./.\/ ../.-../. \.I. '..... ...17 18 19 20 21 22 23 24 25 26 27
DATE
FIG. 2.-Maximum 8 a.m. sea level pressure during theperiod May 16-27, 1936.
most of the remainder of the period. Further to the south, however, the increase does nottake place, Nashvile remaining dry and not increasing much in temperature. TheDetroit-Pensacola cross sections for thi: 21st-26th show this reversal of the normal N-Smoisture gradient very clearly. The persistence of this kernel or island of subsiding dryair at Nashville, fed spasmocMcally by new supplies from the north and east, is one ofthe principal features of the situation and seems to be one of the contributory causes ofthe stability of the anticyclone.
2. Data Available
There was a wealth of meteorological information available during the period, thatused comprising the following:
(i) Daily surface synoptic maps for 8 a.m. and 8 p.m. (Times throughout are EasternStandard-i.e., 7Sth meridian west.) These maps are those prepared during the period
at Massachusetts Institute of Technology supplemented by numerous observations ob-tained subsequently from various sources. Copies of the analyses together with a limitednumber of the individual station reports are given in Plates Ia-IXa.
(2) Records of Pilot Balloon ascensions for about i 10 stations. Of these about 90 arefrom stations in continental U. S. A. and the remainder from ships, and neighboring sta-tions in Canada, Bermuda, Mexico and the West Indies. For the majority of the U. S. A.stations two ascents a day (S a.m. and S p.m.) were made, those in the morning beinglimited to a height of 4270 m (14,000 ft) while those in the afterioon were continued ineach case until the balloon was lost from view.
(3) Records of the daily airplane meteorograph flights from Toronto, Canada, andtwenty-two stations in the United States. With the aid of these data four vertical crosssections for each day showing the distribution of potential temperature and specifichumidity have been constructed. These cross sections were for the profiles Fargo-San
VOL. VII, NO. i. FLUID MECHANICS APPLIED TO THE STUDY OF ATMOSPHERIC CIRCULATIONS 77
Antonio, Detroit-Pensacola, Seattle-Washington, D. c., and EI Paso-Boston, the moreimportant ones being included in Plates I b,c,d-IX b,c,d.
I t should be noted that the airplane, pilot balloon and surface observations are notsynchronous but are for 4 a.m., S a.m. and 8 a.m. E.S.T. respectively. As, for variousreasons, the airplane observations are in a number of cases made later than the standardhour of 4 a.m., the actual times for each ascent are given on the cross sections.
A most gratifying aspect of this investigation is the completeness of the data through-out the entire period. Thanks to the normally clear skies accompanying anticyclonic con-ditions there are relatively few gaps in the pilot balloon ascents, while of the twenty-threeairplane stations the fewest reporting on anyone day is nineteen, if we exclude the 24thwhich is a Sunday, and the average for the period twenty-one. As a result it has beenpossible to follow very satisfactorily almost everything occurring in the lower troposphereand much in the upper. This is in marked contrast to studies of depressions, in which theextensive areas of cloud and precipitation preclude pilot balloon and airplane ascents andperforce leave to conjecture much that goes on in the free atmosphere.
3. Detailed Description
In this section the individual surface charts are discussed, the greatest attention beingpaid to the eastern portion of the United States where the anticyclone was located mostof the period. The maps referred to are given in Plates I-IX and XXIV. The Fargo rela-tive humidities from the 23rd-26th and the Lakehurst temperatures on the 24th aredefinitely incorrect. On almost every day the Mitchell Field (New York) temperaturesand relative humidities seem too high when compared with neighboring stations, whilethe same elements appear doubtful also at Toronto where they are based on readings
made from wet and dry bulb thermometers. The Norfolk temperatures seem to be sus-piciously low at times but have been accepted as correct.
It will be seen that no fronts have been entered on the cross sections. This does notmean any disbelief on the part of the author in the existence of such discontinuities.When the investigation was commenced one of the aims was to emphasize any relation-ship that may exist between the distribution of potential temperature and specific hu-midity, and it was thought that the inclusion of fronts on the cross sections, by increasingthe number of lines thereon, might tend to obscure any such relationship. The presentopinion of the author is, however, that fronts could be included with advantage but therehas been no time available to make the requisite alterations.
May i8th. For from two to three weeks prior to the formation of the anticyclone whichwe are to discuss, there had been located over central Canada a semi-permanent area ofhigh pressure, along the western and southern borders of which a series of disturbancesfrom the Aleutians had passed southeastwards towards the Great Lakes. Connected withthese disturbances there had been intermittent outbreaks of polar continental air ap-parently originating somewhere in the vicinity or to the north of Coppermine. The anti-cyclone centered over Bermuda on the 18th is the remains of one of these outbreaks,which started from the far north on the 12th, and the southern boundary of
which passedDetroit as a cold front on the isth. On its western side the air now has characteristics
approaching those of Tg. In this area the structure has been discussed by Holzman (1936),the interesting feature of the situation being that the upper front marks the advance ofTg as a cold fron t.
Of the other two main anticyclones, that over the Rockies is comprised of air of mari-

78 PAPERS IN PHYSICAL OCEANOGRAPHY AND METEOROLOGY
time origin which advanced over the western Canadian coast about latitude 4So duringthe ISth, while that in northwestern Canada is the one which later undergoes the anti-cyclogenesis. The history of this latter anticyclone can be traced back to the 16th, be-tween the evening of which and the following morning the pressure at Coppermine rosefrom 30.04" to 30.30". The weather conditions at Coppermine on the evening of the 16th,wind north force 4 and temperature 14 of indicate that this pressure increase is associat-ed with an outbreak of Arctic air from the north, but this outbreak is almost immediate-ly reinforced by a strong easterly current round an occluded centre which on the 16thp.m. is over Churchill and on the 18th is north of Quebec. The forward edge of these com-bined currents, which are being taken as of Pc air, is indicated on the i 8th by the fastmoving cold front lying about two hundred miles south of Edmonton and Churchill.Though not apparent on the a.m. map there are winds of force 6 and 7 behind this front.
May I9th. The front separating Pp and Tg has moved east and south since yesterday.Part of the Pp air mass over the Gulf has been very greatly modified and the front has allbut lost its significance. At Pensacola the only evidence of its passage is the direction ofthe surface wind and a very slight decrease of moisture in the lowest layer. The precipi-tation recorded at Pensacola and Montgomery is the result of thunderstorms on the aft-ernoon of the 18th. At both these stations (the Montgomery ascent is at noon instead of4 a.m.) the air from the ground up is indistinguishable from Tg, the Npp classification onthe surface map being retained purely for historical reasons. Otherwise, however, thestations to the rear of this Npp-Tg front, Nashville, Shreveport, Oklahoma, Omaha, St.Louis, Dayton and Detroit, all have typically dry Pp air except in the surface layers. At4 km the specific humidity at Nashville, which is representative of the other stations inthe Pp area, is about i.s gjkg contrasted with about 6 gjkg at the same level at Mont-gomery.
Since yesterday the main Pc anticyclone has advanced southwards, the cold frontaccompanying it having maintained its rapid movement and caught up with a rather ill-defined cold front farther to the south. Over Lake Huron a wave, either induced by thedisturbance farther to the east on the Pp-Tg front or the remains of the occlusion whichyesterday was near Winnipeg, is developing on this combined front. At least on its south-ern edge, if not farther north, this Pc outbreak is still very shallow, at Fargo probablyextending up to only 1700 m. Above this level the potential temperatures-have remainedsensibly constant since yesterday, while below there has been a decrease of about 4°A.The steep lapse rates as indicated by the wide spacing of the isentropes in the air aboveISOO m at Fargo suggest that this air is Pp and this conclusion is supported by the winddirections. At Bismark, North Dakota, the easterly winds of the first ISOO m change by
2S00 m to almost due west. Though the Pc cold front continues its southward movementduring the day there seems to be little increase in the depth' of the Pc at Fargo, the pilotballoon ascent there at S p.m. showing a change in wind direction from northeast to west-northwest between 1200 m and 1800 m. As the depth of the Pc at Fargo would have beenexpected to increase there has probably been considerable spreading out of the Pc air inthe lower layers, and this will account for the fact mentioned earlier that on the eveningof the 19th there is a decrease in intensity of the more southern of the two centres of themain anticyclone.
The wind changes just discussed indicate that over North Dakota and also probablyover a much wider area to the northeast there is a reversal of pressure gradient betweenthe ground and 2000 m, so, in the absence ofaerological observations north of Fargo, we

VOL. VII, NO. 1. FLUID MECHANICS APPLIED TO THE STUDY OF ATMOSPHERIC CIRCULATIONS 79
can use this evidence for the conclusion that the anticyclone north of Winnipeg is of thetrue "cold" type, the high pressure area at the surface rapidly giving way to a low pres-
sure area aloft. The distribution of surface temperatures~up to 40°F colder on the eastthan on the west side of the anticyclone-indicates that in all probability the centre ofthis upper level low pressure area is displaced to the east of the centre of the underlyinganticyclone.
May 20th. Commencing first with the frontal and air mass distributions to the southof the main Pc front, it is seen that the western portion of the front separating the Nppand Tg air has now been entirely dissipated while the portion which was represented as avery weak cold front over the eastern Gulf has returned northwards as a warm front nowextending from eastern Texas to Georgia. Oklahoma, and to a lesser extent Shreveport,are still in the Npp air but farther to the west this air mass has been modified by an ad-vance from the south of moist tropical air which may be either Tg or Tp but which hasbeen designated as Tg. The vertical cross-sections for Fargo-San Antonio and Seattle-Washington show the presence of this Tg current and from them it can be seen how thePp is being modified from below by ground influences and from above by the Tg current.Simultaneously with this advance of the Tg air the Pc cold front in the region betweenOmaha and Billings has been checked and it is now returning northwards as a warmfron t.
Over the ocean to the east of Florida there has been placed on today's map a warmfront separating Ta from Tg air. Except for the winds there is little to justify the intro-duction of this front, the main purpose of including it in the analysis being to emphasizethe presence in the vicinity of Haiti of a weak but extensive tropical disturbance which isgiving strong easterly winds and rain over a wide area south and southwest of Bermuda.This disturbance persists in about the same position and at about the same intensity forfour days and is the spring prototype of the summer hurricanes of the West Indies. On the21st there are indications of a second but not so important disturbance just south ofCuba and the two combine to give very strong easterly winds over Florida until the 24th,the strength of the winds progressively increasing through the steepening of the pressuregradient brought about by the approach of the Pc anticyclone.
Though the presence of the tropical disturbance is not apparent until the 20th, it hasundoubtedly been developing for some days and probably its presence accounts for suchan abnormal depth of the moist current at Pensacola and Montgomery. Between the i 8thand 21st the specific humidity at these stations ranges around 4 gjkg at the S km leveL.
In layers below S km the specific humidity is not unusually high, the feature of thevertical structure being the apparent upward spread of moisture. If we accept the hypoth-esis that the moisture richness at high levels is associated with the presence of the
tropical disturbance we see what an important role one of these can play in the weatherof the southern United States even when its centre is far distant. Tropical disturbancesare usually considered as of relatively small horizontal dimensions, yet in this case Mont-gomery, which is almost ISOO miles from the centre, is experiencing the effects. Howeverit is brought about, through convection consequent on condensation or by dynamic proc-esses, the effect of the tropical cyclone is that of a pump which raises the moist surface
, air to high levels where it spreads ou t over a wide area.Coming now to the discussion of the anticyclone, we see that the cold front associated
with it has continued its rapid advance and that Pc or Npc covers the greater part ofeastern and central United States. Even well behind the cold front, however, the Pc is

80 PAPERS IN PHYSICAL OCEANOGRAPHY AND METEOROLOGY
still in a relatively shallow layer. At Detroit' the top is at 2.0 km. Below this level therehave been decreases since yesterday in potential temperatures of about looA while abovethere have been slight increases. The upper layer is evidently the same Pp as that aboveFargo yesterday and the same vertical structure is present, viz. stability in the lower 2km and then large lapse rates. At other stations the height, h, of the top of the Pc can beidentified, either by the means adopted for Detroit or from the temperature and moisturediscontinuities, as follows:
TABLE 1
STATION h ()b ()B ()
m °A °A °A
Nashvile 400 286 298 292Dayton 1300 288 292 290Detroit 2500 286 293 290Toronto 300* 294Washington 1400 293 298 294
Boston 1300 289 291 290
* Approximate values.
The surface map, then, gives a rather misleading impression of the atmospheric
structure to the north of the cold front. From it one would infer that there is a greatamount of Pc air covering the United States, whereas in reality there is comparativelylittle-it covers a wide horizontal area but is in only a shallow surface layer with a deep
superincumbent layer of Pp. The Seattle-Washington and EI Paso-Boston cross sectionsshow this Pp as a dry layer extending from Omaha eastwards to well out over the At-lantic Ocean, the dryness accounting for the almost entire absence of precipitation ac-companying the advance of the Pc cold front.
During the 24 hours since 8 a.m. yesterday subsidence appears to have been veryactive in the Pp air. Of the stations which are in it on both days, Toronto, Detroit andDayton have had increases of potential temperature of 2°-3°A at fixed levels, while atNashville the increase from 400 m up to sooo m averages 6°A.
In Table i are given, in addition to the heights, the poten-tial temperatures at the top, 8a, of the inversion marking theboundary between the Pc and Pp air masses (i.e., at height h)and at the next significant point below, 8b. As the points 8b t.
are at varying distances below the corresponding points 8a Hthere are given in the last column the estimated potentialtemperatures, 8, which the Pc air would have if it extendedup to the height h. 8, then, is the potential temperature thatwould prevail on the lower side of the boundary between Pcand Pp if the inversion zone between the two air masses wassharpened into a line. The relation between 8a, 8b and 8 can
be better seen from the accompanying temperature-height
diagram (Fig. 3). .dBCD represents the conditions actuallyprevailing while E is the point which would be reached ifthe lapse rate in .dB continued unchanged up to the height, h, of the top of the inver-sion. Oa, 8b, and 8 are, then, the potential temperatures correspondong to C, Band Erespectively.
There is a very small variation of the individual values of 8 from the mean value of292°, the upper boundary of the Pc air mass following very closely an isentropic surface.
1-l
T-FIG. 3.-Graphical represen-
tation of method used in esti-mating potential temperature ()at base of idealized inversion.

VOL. VII, NO. i. FLUID MECHANICS APPLIED TO THE STUDY OF ATMOSPHERIC CIRCULATIONS 81
May 2Ist. Between the 20th and 21St the development of the situation is straight-forward except for the marked anticycIogenesis which has taken place. Both the centres,one of which is now over Toronto and the other near Moosonee, experience about identi-cal intensifications, viz. slightly more than .2 inch in 24 hours. Though the anticycIogene-sis wil be discussed in more detail in a later chapter, it can be pointed out now that ad-vection of cold polar air near the ground surface is not the entire cause. The depth of thePc air mass at Detroit has decreased in the 24 hours from 2 km to 1900 m, while thepotential temperatures at fixed levels within it have increas-ed about SOA, both of which
effects decrease the contribution of the Pc layer to the surface pressure. At Toronto thechange has been similar to that at Detroit but further east just the opposite has oc-curred, e.g. at Boston there has been an increase in depth and a decrease of about 6°A inpotential temperature.
By the same procedure as that adopted in drawing up Table i above, data relative tothe upper surface of the Pc current on the 21st have been extracted and are given inTable 2.
TABLE 2
STATION h ()b ()a ()
m °A °A °ANashville 500 288 298 **Dayton 1000 292 294 292Detroit 1900 291 294 292Toronto 2200 292*Washington 1700 293 296 295Lakehurst 1800 288 294 291Boston 2300 288 292 292
* Approximate.** Too close to ground for reliable estimation.
In this table there are two features which seem worthy of comment. In the first place thetop of the Pc air still follows the same isentropic surface as yesterday, and in the second,at all the stations except Nashville and Boston there has been a decrease in the depth ofthe Pc air whereas the surface map would lead one to expect an increase.
Examination of the cross sections shows an entirely different vertical structure abovethe Pc air from that of yesterday, the deep overlying layer of dry Pp air having now giv-en place at Detroit, Dayton and Lakehurst to a more moist current from the west.
There are some further features of the situation of the 21st that warrant discussionbut there is such an essential similarity between the surface maps of the 21St and 22ndthat they wil be considered along with the corresponding features on the latter day.
May 22nd. Turning first to the frontal systems, it is seen that the main Pc cold front,which on both the 19th and 20th advanced about soo-600 miles, has made practicallyno farther southward progress in the succeeding two days. From northwest of Bermudato Mississippi it is now classed as a stationary front, its forward movement checked nodoubt by the strong circulation about the tropical disturbance near Haiti.
The Ta-Tg warm front of the 20th has been dropped from today's analysis, and thevarious fronts over the southern United States are considered as merged into one warmfront extending westward from the stationary front. To the north of this warm frontthere is a very much stronger southerly current than would be suspected from the surfaceconditions. At the ground the maximum wind force reported over the plain states is fourand this at only a few stations, yet at 2000 feet there are southerlies of forces nine and

82 PAPERS IN PHYSICAL OCEANOGRAPHY AND METEOROLOGY
ten. This belt of strong upper winds extends from the Rocky Mountain region eastwardto about Nashville and between latitudes 300 and 4SoN. On its eastern edge the air ismostly Npc but becomes progressively moister .to the west. The slope of the warm frontsurface running northward from Texas is very slight, while the Tg air ahead of the posi-tion of the warm front at the ground is gradually working downwards. Consequentlythere is no warm front rain. The location of the tropical air aloft can, however, be tracedby the distribution of the thunderstorms which have occurred in a broad belt from Texasnorthwards to as far as Sioux Lookout and Winnipeg. Over the remainder of the anticy-clone there have been negligible amounts of precipitation.
There is an important contrast between the changes which have occurred at Boston
and at stations to the west during the 24 hours from the 2Ist-22nd. Whereas at Detroitthe surface Pc air has almost lost its identity (a decrease in thickness of the Pc layer from1900 il to 1000 m and an increase in potential temperature of SOA) at Boston the Pc
layer has become more prominent (an increase in thickness from 2S00 m to 2800 m anda decrease of potential temperature at 2200 m of 7°A). The top of the Pc at Boston stillcoincides with the 292°A potential temperature surface.
Accompanying this temperature change at Boston there has been a marked upperwind change from west on the 21st to almost due north on the 22nd. In the light of theseêhanges it seems not unreasonable to infer that there has been a fresh outbreak of polarcontinental air to the east of Boston. It has not been possible to detect any secondarycold front on the surface maps but there is support given to the supposition of the occur-rence of a fresh Pc outbreak by the fact that during the 22nd the cold front to the northof Bermuda renews its southward movement after remaining almost stationary for twodays.
May 23rd. The Shreveport, Montgomery and Pensacola airplane ascents of the 23rdlend further support to the conclusion regarding the new Pc current (which as a result ofits trajectory over the sea is now represented as Pa) as at all three stations there is
on the23rd a strong invasion from the east of dry air. This invasion is much more noticeablealoft than at the surface, Pensacola having a specific humidity of only 3.8 gjkg at 2.S kmcompared with a value of 8.9 gjkg on the 22nd. At the ground this renewed activity hasbeen indicated as an advance west and south as a cold front of that portion of the sta-tionary front which yesterday layover the southern states. At higher levels, however,the drying out of the air at Pensacola has been accompanied by increases of potentialtemperature, so the surface cold front probably changes to a warm fron't aloft.
In making the vertical cross section analyses it has been very diffcult throughout thewhole period to make Pensacola, and to a lesser extent San Antonio, tie in naturally withthe other southern stations, the reason being that at both there is extremely markedstratification of moisture. As an example of this the Pensacola ascent for the 22nd canbe cited, successive values of q being:
700 m 13.S gjkg12S0 9.21300 11.21900 7.12S00 8.9
3400 4.64000 6.0

VOL. VII, NO. i. FLUID MECHANICS APPLIED TO THE STUDY OF ATMOSPHERIC CIRCULATIONS 83
While the moisture has been decreasing on the southern side of the anticyclone justthe opposite has been taking place on the northern. Boston yesterday had very low valuesof specific humidity, 1.7 gjkg at 1200 m and correspondingly dry above, whereas todaythere has been a rapid increase of moisture right up to the top of the airplane ascent. To-gether with this there have been increases in potential temperature, the maximum being13°A at 2300 m. This moist current, which comes in with a northwest wind, is obviouslyassociated with the moist current which yesterday was over the plain states and whichtoday is giving the precipitation in the region to the north of the Great Lakes.
Up until today the northern portion of the anticyclone seems to have been mainly
dry but the moisture at Boston and the extension of the rain area eastward almost toNewfoundland shoyv that any northern dry air source must by now be almost completelycut off. It was to the Pc air that the anticyclone was originally due so it is not surprisingthat it has today begun to decay, the maximum pressure at the centre having decreased0.2 inch in the last 24 hours.
May 24fh. The major axis of the anticyclone now runs roughly east and west, havingsince the 20th made a steady clockwise rotation from its initial
orientation of NNW-SSEto that of E-W.
The invasion from the East of dry Pa (now entered as Npa) has continued and hasdisplaced the moist air over the western side of the anticyclone as far west even as Okla-homa. This invasion, together with the advance from the west of a large current of PolarPacific air, has resulted in the cutting off of the moist current up the western side of thehigh. Judging from the manner in which the rain area over Kansas remains almost con-stant in position for three days, it may in part be orographical and produced by the forcedascent nf moist air from the Gulf.
The structure of the anticyclone can best be seen today by reference to the Detroit-Pensacola cross section which shows the presence of a large area of dry air over Nashvillewith higher moisture both to north and south.
May 25th and 26th. Despite the facts that the anticyclone has been moving to theeastward and that the supply of dry air from the north has been cut off since the 23rd thevertical structure in the Detroit-Pensacola section has remained substantially the same ason the 23rd and 24th. The dry central core of the high seems to resist remarkably ef-fectively the influences of the moist currents to the north and south.
rIII. THE 30So ISENTROPIC CHARTS
I. Day by Day Discussion
The detailed isentropic charts for the 30SoA surface are given in Plates X-XVIU.Plotting and analysing procedure conforms in the main with that described elsewhere in
this report (vide BI). In cases where the airplane ascents have been commenced morethan three hours after the scheduled time of 4 a.m. 7 sth meridian time the actual timesof take off are given alongside the stations. Changes in wind direction at or near the 30Sosurface are indicated by the inclusion of the wind directions for the areas on each side ofthe surface with a small curved arrow indicating the direction of change with increasing
height-e.g., ~ represents a change from SW 4 below the isentropic surface to NW 4
above.

84 PAPERS IN PHYSICAL OCEANOGRAPHY AND METEOROLOGY
In areas where there are no aerological ascents the height of the isentropic sheet hashad to be estimated. At Hermosilo, Mexico, the height has been taken as approximatelythe mean of those of San Diego and EI Paso, while at Bermuda a constant height of 2440m (8000 ft.) has been assumed throughout and at all the West Indian stations one of1830 m (6000 ft.).
Except over the Rocky Mountain area the 30So surface is throughout the whole peri-od high enough to be considered as lying above the layer of surface turbulence. It is forthis reason plus the fact that for the most of the time it lies below the maximum elevationof the airplane ascents that the 30So surface has been chosen for the main analysis. Isen-
tropic charts both above and below (at 29So, 3000, 3100 and 3ISOA) have also been madebut not in the detail of the 30So. These will be discussed in the next chapter.
May i8th. The flow pattern for the first day is comparatively complicated but seemswell substantiated by the observations. Except near EI Paso the surface is everywhereabove the turbulent layer. The main features consist of a broad dry cold current, i, andtwo anticyclonic eddies, one over Texas and the other off the Atlantic seaboard. In theformer eddy the dry tongue, 2, cuts the ground but its presence appears to be definitelyestablished by the fact that the air column above EI Paso is dry all the way up, the maxi-mum specific humidity of 6.S gjkg at 1400 m (200 m above ground) being lower than inany portion of the first 2000 m at Oklahoma and 3000 m at San Antonio. The easterly(and at 8 a.m. northwesterly) surface wind at EI Paso is only local, the true direction asgiven by the pilot balloons being southwest. The separation of the moist current in thiseddy into two portions, 3a and 3b, seems at first sight to be rather artificial but has beenmade in order to account for a moist tongue over Cheyenne on the 19th. 3bis only shal-low today, the layer of southerly winds at Cheyenne being only i km deep, but by to-morrow it has doubled its depth. For similar reasons of continuity the dry tongue, 4, isrepresented as hav~ng specific humidities of less than 3 gjkg, such low values being prob-able in view of the fact that, despite a strong moist current close by to the left, q at Nor-folk on the 19th is only +6 gjkg.
Although the axis of the moist current in the eastern eddy is shown as being cut off inthe vicinity of Nashville, this is ofIittle significance since the Detroit-Pensacola cross sec-tion shows the dry current causing the division to be quite thin. Both above and belowthe 30So level the moist current, S, is continuous from the Gulf of Mexico to New York.
At the ground the current over New England has a cyclonic curvature continuingnorthward towards the low pressure centre associated with the occlusion over Labrador,yet at the 30So surface the corresponding current, S, has been given anticyclonic curva-
ture. There are various indications to support this analysis: the upper wind at Bermudais north; S has anticyclonic curvature further upstream and there is little reason for thiscurvature to change; if S has cyclonic curvature rain would be expected in the New-foundland area whereas only one station reports precipitation; and, finally, we knowfrom experience that in the temperate latitudes of North America currents have a pro-nounced tendency towards anticyclonic rotation.
May I9th. There has been a relatively straightforward development since yesterday,the same general pattern of a broad dry current and two anticyclonic eddies having per-
sisted. In the western eddy tongue 2 is considered as having been wiped out while 3a and3b have combined to give 3. This eddy has drawn into its sphere of influence a portion ofthe cold current to the North, a branch, ib, of which now constitutes the dry tongue ofthe eddy. There has been marked downslope motion in ib which does not occur in the

VOL. VII, NO. i. FLUID MECHANICS APPLIED TO THE STUDY OF ATMOSPHERIC CIRCULATIONS 8S
companion branch, ia. la has been carried well toward the southeast to account for thenorth to northwest upper winds which cover all Georgia and part of Florida by S p.m.Judging from its greater coldness, as indicated by the height of the 30So surface at De-troit, branch iC has probably come much more directly from the north than either ia orib. It does not appear, however, to be directly connected with the surface cold front
which at 8 a.m. is stil northwest of Detroit.In the eastern eddy the locations of the tongues are almost identical with those of
yesterday. On the eastern edge of the eddy, however, there has been a definite change,the winds at Bermuda having changed from north to southeast. Sb is now in about thesame position as was occupied by the forward part of S yesterday, but has decreased inanticyclonic curvature, in fact it could possibly be given a cyclonic curvature. The rainand cloud areas associated with the occluded centre over Maine suggest that the moistcurrent, if not at the 30So level, at least in lower levels has cyclonic curvature.
At Seattle the airplane ascent was not made until midday, by which time a cold fronthad passed. The analysis, however, has been made to simulate the conditions at 4 a.m.with the cold front still to the west. Unlike the majority of the moist tongues, 6 is givenon the 18th, 19th and 20th with cyclonic rotation. There is a difference, however, be-tween this tongue and the others. It is quite close to the ground whereas the others arecomparatively high. The fact that above warm front surfaces there is a progressive in-crease in anticyclonic vorticity with increasing height is well known (J, Bjerknes 1932,p. 28), so at higher levels 6 probably has not such strong cyclonic rotation.
May 20th. The eastern eddy has now disappeared completely. During the day yester-day la reached as far south as northern Florida but since then has been pushed back bythe moist current 9 associated with the tropical disturbance over Haiti. As yet9 has madeonly small headway, the specific humidity at Pensacola stil being low. From the winddistribution the axis of 9 should be entered some distance north of its present position buthas been placed where it is because the height of the 30So surface over Georgia and Ten-nessee seems to have been lowered by non-adiabatic processes-either condensation or
insolation-into a layer of stronger easterly winds than prevail at the level (2400 mapprox.) at which the 30So surface would be if there were no such non-conservative dis-turbing influences.
Now larger than before bnt with weaker circulation, the western eddy has preservedits identity. Tongue ib has divided into two branches, one extending down over Browns-ville and the other remaining as an inert island of dry warm air over the Arkansas region.A further thrust to the south of the main cold current is being made by id.
Moist tongue 3 is now indicated as divided into two portions, 3C and 3d, the latterbeing introduced to account for the moist current at Fargo on the 21st. It is interestingto note that through subsidence, i b is now warmer level for level than the tropical air of3C. This is best seen at Omaha in the Fargo-San Antonio cross section, there being super-adiabatic lapse rates at the moisture inversion between 2000 m and 2S00 m. From thecontours of the isentropic surface it is seen that 3C is ascending fairly rapidly and this isevidenced by the deep layer of Acu between 2900-4400 m at Omaha. Severe turbulenceis reported as occurring in the cloud layer in which the lapse rate follows the saturatedadiabatic. As a result there is a spread upwards of moisture and the tongue is becomingthicker.
On the isentropic chart there is not much direct evidence for the existence of 3C in theposition indicated, an existence which would hardly be suspected from the surface map.
86 PAPERS IN PHYSICAL OCEANOGRAPHY AND METEOROLOGY
There are, however, other indications which warrant giving the tongue a curve to theeastward instead of running it north or northwest towards the low pressure area north ofBillings. In the first place, if the strong moist southerly current over Kansas continuednorthward, rain would be expected tò be falling in the Fargo-Winnipeg area, whereasthese stations report clear skies. More positive evidence are the reports of Ast, Acu, andStcu moving from the west at a number of stations in Minnesota, Wisconsin and Michi-gan. Subsequent developments confirm the presence of 3C as placed; Detroit on the 21sthas increasing moisture in a westerly current while during the day on the 20th there islight precipitation in a triangular area bounded by Fargo, Omaha and Detroit-i.e.,directly under the moist tongue in question.
May 2Ist. Though it follows on fairly well from yesterday's chart, today's analysis hasbeen the most diffcult of the whole period and as given has one obvious weakness-viz.the criss-cross of dry and moist currents in the Great Lakes Region. What is consideredas having liappened is that 3C has temporarily cut through id which in turn has dividedthe moist current into 3C and 3e. It is rather diffcult to conceive how one current can cutthrough another somewhat in the manner of a projectile, but experience shows that some-thing of the sort occurs rather frequently and without assuming some such process in thisinstance it is very diffcult to account for the presence of the moist area over New Jerseyand the dry area over Virginia and Maryland.
In a number of other features the development from the 20th-21st seems rather
forced, but what are considered adequate explanations can be given in each case. Tongue9 has made a much more rapid advance than the winds justify, but it is not intended to beinferred that the air which yesterday was over Florida has already reached Kansas. To-day's 9 is a combination of yesterday's and a moist current originating over the Gulf ofMexico. The dry current 7 over Arizona, despite moderate winds, has made no apprecia-ble advance. In this case the 30So surface cuts the ground at a number of places and itappears that the current is continuously being broken up. The final feature is the lowlevel of the isentropic surface and the high value of specific humidity over Fargo. In itsadvance northward 3d appears to have gained instead of lost moisture by lateral mixing~The cause of the increase is that there has been addition of heat to the tongue, therebyresulting in a displacement downwards of the 30So surface into a stratum of higher spe-cific humidity. The non-adiabatic heating of the layer can. probably be explained as theresult of insolation during the previous day when the tong~e was over the eastern slopesof the Rocky Mountains and fairly close to the land surface.
An interesting point is that despite the great increase in moisture at Fargo, Omahais stil comparatively dry. This is due to the continued presence of the island of dry airwhich yesterday was indicated as ib. Such islands, as is demonstrated later in the case ofa much larger one over Nashville, seem in some manner to remain stable and to be lessaffected by lateral mixing thah moist currents.! In order to keep the flow pattern assimple as possible, ib has been dropped out in today's analysis, but it is still present andcan be considered as the forward position of id.
On the 20th tongue ib seems to be quite separated from id, yet today the two haveamalgamated in the eddy over Indiana and Ohio. The presence of the eddy of i b seemsto have exerted an influence on id and sucked it into its circulation. As has already beenmentioned, just the same occurred between the 18th and 19th when ib itself was drawn
1 This persistence may also to some extent be the result of radiational cooling in the centre of the dry island.

VOL. VII, NO. i. FLUID MECHANICS APPLIED TO THE STUDY OF ATMOSPHERIC CIRCULATIONS 87
into the vortex over Texas. This process is reminiscent of the theory of Fújiwhara (1923,1931, 1937) in which he stÚes that there exists a tendency for two vortices of the samesense of rotation to amalgamate and increase in intensity. As evidence in support of histheory, which is in direct contradiction to the teachings of ordinary hydrodynamics, he
, cites the results of experiments on liquid vortices and examples of the amalgamation andintensification of cyclones. In the two cases occurring in the present investigation thesituation is not quite analogous to Fujiwhara's in that we do not have two fully developedvortices but one anticyclonic eddy and one approaching current, which, though not in theform of an eddy, has at least anticyclonic vorticity. If this effect is real and can be con-firmed in other situations, it has an obvious value in forecasting from isentropic charts.
May 22nd. Today the complicating but not really important moist tongues over theGreat Lakes and New York have all but disappeared and the flow pattern is now in theform of a single large anticyclonic eddy. In this eddy there appear to be two distinct drytongues. That nearer the center, id, is considered to be formed of Pp air from the west,while the other, 10, as pointed out in the discussion of the surface map for the 22nd, isfresh Pc air from over the Labrador area. In between the two are the remains of 3e.
In constructing the contour lines the height of 2800 m at Dayton has been consideredas too low, the increase of 1000 m in the height of the 30So surface at St. Louis in 24 hours
being taken as justification for running a crest of the isentropic surface along the path ofid. Between Toronto and St. Louis, then, this tongue exhibits very little subsidence-much less than in the other dry tongues from the north. With the arrival of 10 there is avery marked change in the wind at Bermuda, the southeasterlies of the past three daysgiving place to northerlies which continue until the 2sth.
In the lower levels over Florida there are exceptionally strong easterly winds (force
9 at Tampa at 1000 m) and the S p.m. winds suggest that the current continues up tothe level of the 30So surface. Moist tongue 9 is therefore considered to extend at least asfar east as Florida and then to continue in a wide arc to beyond Sault Ste. Marie. Judg-ing, however, by the light variable winds over Cuba the current is very sharply limitedalong its southern edge. Throughout almost the entire period the wind conditions overthe West Indies are unrelated to the main anticyclonic circulations over the continent.Whereas over the southern United States there is in general a deep easterly current, fur-thet' to the south the layer of easterly winds is relatively shallow giving way to westerliesusually by 3000 m and on occasions before 2000 m. At this time of the year the easterliesover Cuba would normally be expected to extend to great heights, but in this case thepresence of the tropical disturbance has upset the usual wind regime.
9 is now a very broad and powerful current and is so dominant over the northernmountain states that it is dragging along with it the dry tongue 8 which yesterday hadnorthwest winds but now, except in the remnant over Utah, has southwest. (Denver andCheyenne have southwest winds a short distance above the 30So surface.) Although beingdragged along by its more vigorous neighbour, 8 has caused a rise in the 30So surface atFargo from ISOO m to 3090 m.
The numbering of the various tongues has been stopped at 10 and started again from2, the first of the new series being a dry current over western Canada.
A not very prominent but none the less a very important feature of today's 30So chartis that near the centre of the main eddy the circulation, as shown by the winds at Pitts-burgh, Cleveland, Detroit, and Columbus, is definitely cyclonic instead of being anticy-clonic as one might have expected. Now this very area of cyclonic winds is quite close to

88 PAPERS IN PHYSICAL OCEANOGRAPHY AND METEOROLOGY
the centre of the anticyclone and we have the apparently anomalous situation of an anti-cyclonic pressure distribution giving cyclonic circulation. The same reverse motion isdiscernible in the surface winds in the 8 a.m. map but in that case it might be argued thatthe effect is caused by Lake Ontario. The 30So isentropic surface, however, is over 3000m above the ground which seems much too high a level for any land-water effect to ,.reach.
Professor Rossby has pointed out that this cyclonic circulation is in accord with thetheory for dynamic anticyclogenesis. His argument is substantially as follows, being aqualitative extension to the case of circular flow of his recent discussion of the mutualadjustment of the pressure and velocity distributions in a linear current (Rossby 1937c).Assume that the horizontal ring of air represented schematically in Fig. 4 has acquired
an anticyclonic rotation as a result of lateral frictional drivefrom a strong current somewhere along its periphery. In theabsence of a completely balancing pressure gradient therIng thus set in motion will converge as a result of theCoriolis' forces associated with the frictionally acquired ro-tation. The centre of the eddy, unaffected by frictionalforces, will likewise be forced to converge, and in so doing itacquires a cyclonic rotation. Whether or not this cycloniccirculation shows up on the maps depends on whether it issuffcient to cancel out the already existing anticyclonic ro-
tation or the anticyclonic rotation transferred inward bylateral mixing. The important result, however, is that inextreme cases it is theoretically possible to have an anti-cyclone with cyclonic rotation near the centre and the wind
distribution of May 22nd appears to supply an example of such a situation. It is admittedthat the cyclonic eddy does not show up at other isentropic surfaces, but in them thereis at least a weakening of the anticyclonic rotation. The period from the 20th to the22nd is one of rapid anticyclogenesis (see Fig. 2), which would seem to make the sug-gested explanation more plausible.
In an investigation, the results of which are not yet published, Spilhaus has detectedevidence of a similar nature. In his work, however, he did not have winds to indicate thepresence of the cyclonic rotation but based his conclusions solely on the distribution ofthe stream function for an isentropic surface (Montgomery, 1937) on a day when therewas a well marked anticyclonic eddy. The importance of the present case lies in the factthat, by corroborating the discovery by Spilhaus, it increases considerably the probabili-ty that the effect is real and not merely chance, and gives very satisfactory confirmationof the correctness of theoretical expectation.
It may be wondered why a similar structure is not found in the anticyclonic eddies onother days in the period from May i 8 to 26th. Such could, however, hardly be expected.Lateral friction from the surrounding air with anticyclonic rotation should all the timebe tending to destroy any cyclonic circulation which may develop in the large eddy, sothere is very remote probability of a reverse circulation enjoying anything but a verybrief existence.
May 23rd. In tongue 10 there must have been a great deal of downward motion. Whenit was over the Canadian Maritime Provinces it probably was at an elevation of sooo myet its average height about two days later over southern United States is in the vicinity
FIG. 4.-Sketch of dynamic anti-cyclogenesis and the genération of
cyclonic core. See text.
'"._-.-

VOL. VII, NO.1. FLUID MECHANICS APPLIED TO THE STUDY OF ATMOSPHERIC CIRCULATIONS 89
of 2000 m. All the decrease may not be due to subsidence, some probably being due to theaddition of heat through convection and condensation along its path over the ocean.That there has been considerable convection is suggested by the distribution of moistureacross the tongue. In the presence of lateral mixing alone there should be in any trans-verse section of the current an increase of moisture outward from the axis, yet St. Louis,Nashville, Montgomery and Pensacola show the moisture distribution to be uniform,suggesting that the effects of lateral mixing have been offset by additions of moisturethrough vertical mixing.
The anticyclonic eddy has now become an almost symmetrical vortex of truly tre-mendous dimensions, the horizontal diameter being between 2S00 and 3000 miles.Though on the 30So chart there are no wind reports along the axes of the main currents9 and 10, there is evidence that in both the winds reach a force of at least nine or tenBeaufort. At Omaha the top of the pilot balloon ascent is at 2000 m with wind SW force10, while at S p.m. Chicago and Detroit have SW 9 and WSW 9 respectively at 2S00 m.In Florida the Tampa S a.m. pilot balloon ascent reached only 1400 m, at which level,the wind was E 9, but the S p.m. ascent went to 3000 m with easterly winds of force 8and 9 all the way up. Thus in addition to being very strong the currents in both maintongues are quite deep so they must possess very large amounts of kinetic energy.
If we accept the fact that the winds along the axes of the main tongues are aboutforce 10, it is seen that there is slightly less than a linear increase of velocity with increaseof distance from the centre of the vortex-i.e., the whole system is rotating almost as a
solid. It follows that this eddy should be fairly stable (see page 32), and this is borne outby its subsequent history.
However the apparent persistence of the eddy is not solely due to its kinematicstability. It has been seen how on the 19th-21st the subsiding mass of dry air of tongueib was able to withstand the effects of lateral mixing from the strong moist currents onits sides, and now a similar process on a much larger scale is going on in id. An island ofsubsiding dry air has formed east of Nashville and remains as the centre of the eddy atleast until the 26th and perhaps longer. From these two cases it seems that a subsidingdry core favours the prolongation of the life of an eddy. At least two distinct processesappear to contribute to this persistence of the dry core.
(a) In the central portion of the eddy the winds are light and, as this reduces thelateral mixing, the rate of diffusion of moisture inwards from the periphery is decreased.However, even though the lateral mixing may be reduced, it always acts in the onedirection, that of increasing the moisture in the dry core. If there is no replenishment ofdry air, there should be a gradual increase of specific humidity in the central portion ofthe eddy. The charts of the 23rd and 24th both indicate that the supply of dry air is cutoff by moist tongue 9, so between these two days, increases in moisture in the dry kernelshould be expected. There are, however, definite decreases in specific humidity over theentire area to the south of St. Louis and Boston-i.e., over the dry core-and this trendcontinues also on the 2Sth. These decreases show more clearly on the 3100 and 31So
charts than on those of 30So.
(b) To explain these moisture decreases in the isentropic surfaces radiation must betaken into account. Over the central portion of the eddy the air is dry and the skiespractically cloudless, so there should be a loss of heat from the air itself by radiation.This is a non-adiabatic process and is equivalent to a sinking of the air downward throughthe isentropic surfaces. As the specific humidity normally decreases upwards this ap-

9° PAPERS IN PHYSICAL OCEANOGRAPHY AND METEOROLOGY
parent sinking will tend to reduce the moisture at any fixed isentropic surface and maythus account for the changes taking place from the 23rd-2Sth. Radiational heat lossesshould cause an increase in elevation in the constant potential temperature surfaces, butinspection shows that there has been a steady decrease in height of both 3100 and 31So
surfaces over the dry portion of the eddy. This can be readily explained as due to subsi-dence, the effects of which have been great enough to more than offset those of the radia-tional cooling.
May 241h. With the moisture distribution so symmetrical round the centre of theeddy, it is impossible today to dintinguish any definite axis of motion of the dry tongue'.iod has, then, been entered rather arbitrarily merely to indicate the previous history of
the mass of relatively dry air west of the vortex centre. This tongue and 2a (Pp air asso-ciated with a cold front which crossed British Columbia on the 19th) have now cut off9 and 9a from their moist source to the south, and the easterly current 3 over the Gulf ofMexico is being deflected westward instead of following its normal path to the northeast.
Conditions over the northwestern states call for some comment. Since yesterday Bill-ings and Spokane have had increases in moisture and decreases of the height of the 30Sosurface, suggesting an invasion of a moist current. The winds over the whole area, how-ever, have been quite light and variable and rule out the possibility of such an invasion.What appears to have happened is that the surfaces have been lowered through radia-tional warming, the moisture changes being accounted for by the normal increase down-wards of specific humidity. Similar stagnant conditions continue to the 26th, by whichtime the 30So isentropic surface is quite close to the ground. The upper air has evidentlybeen heated directly by radiation in situ and not indirectly through surface heating andconvection. If the latter had been the case one would expect progressive spreading up-wards of heat and moisture, but from day to day the specific humidity distributions atBilings and Spokane remain remarkably constant, the only changes being the steadyincrease in temperature. This addi tion of heat by radiation is in direct con trast to the losswhich has been shown to take place over the eastern eddy, the difference in effect in thetwo cases being due partly to the presence of the mountains in the west and partly todifferent vertical distributions of moisture in the two air masses.
May 25th. The decrease of height and increase in moisture of the 30So surface atCheyenne, immediately east of the mountains appears to be due to advection of the warmmoist tongue 4. Since the 30So surface is close to the ground the winds are rather irregu-lar, but at somewhat higher levels there have been south and southeasterly winds duringthe last 24 hours along the track of 4. This current appears insignificant on the chart, butis really of some importance as its presence helps to account for the active wave dis-turbance which develops during the 2Sth and 26th on the front formed over Montana onthe 24th.
From the surface synoptic map for 8 a.m. a rather natural forecast would be for anextension northwards of the rain area which covers southeastern Texas; the isentropicchart, however, shows that such a forecast would be likely to fail as the moist tongue 3
, is very definitely curving cyclonically instead of anticyclonically. On the 26th we see thevalue of the isentropic analysis: the rain area over Texas is still small while to the west EIPaso has had rain and Phoenix, Arizona, a station with a normal May rainfall of only 0.1inch, reports a thunderstorm.
In the main eddy the development since yesterday has been quite straightforward andcalls for little discussion. Boston has had a decrease both in specific humidity and in

VOL. VII, NO. i. FLUID MECHANICS APPLIED TO THE STUDY OF ATMOSPHERIC CIRCULATIONS 91
height of the 3050 surface, and must therefore be at the edge of a polar current in whichthere has been a great deal of downflow. By tomorrow it is within the body of the dry air,the height of the isentropic surface having increased from 2580 m to 3970 m with littledecrease in specific humidity. At Dayton the moist current is being underrun by a coldfront, this resulting in forced ascent of the moist air and the formation of a deep turbu-lent layer of Ast in which the lapse rate is the saturation adiabatic. Both the general flowpatterns and the surface situation today bear a strong resemblance to those of the 18th,and it will be seen that the developments in the succeeding twenty-four hours in each case,though not proceeding at the same speed, are on the whole very similar.
May 26th. Considering the flat pressure distribution at sea level the eddy is still sur-prisingly well developed, and judging by the anticyclonic curvature of 2C it is still ableto attract new currents into its circulation. On the 27th the system is too far to the eastfor us to tell if the addition of 2d has intensified the vortex, but even if not, the amalgam-ation has probably at least lengthened its life.
Over the southeastern part of the country there is today a distinct change in the aircurrents. For the past few days the currents over Florida have almost all been from di-rections close to east and have been considered as having recently come from the north.Now, however, the Florida winds are more southerly and the air, instead of having itsorigin in the north, is coming from the sub tropics. Pensacola is already showing theeffects of this change and by the 27th Montgomery also is affected. Nashville on the 27this still dry at the 3050 level, but this is caused by a new invasion of dry air from the westand is probably not a portion of the dry island which has prevailed during the last few
days.
2. General Features
Viewing the situation now as a whole instead of by the individual days the principalfeatures appear to be:
(i) It has been possible to carryon a systematic analysis by means of the isentropiccharts.
(2) Good continuity from day to day has been maintained without resort to eitherimprobable current velocities or undue modifications of air mass properties.
(3) The most outstanding feature of the flow patterns has been the persistence of asingle slowly moving anticyclonic eddy composed of two distinct currents, one moist andone dry.
(4) The central portion of the eddy remains dry, being maintained partly by threesuccessive injections of polar air and partly by radiational cooling. Two of the drytongues, ib and id, are off-shoots from the right hand side of a strong westerly currentto the north, while the third, 10, appears to be a main parent current from the northwhich curves anticyclonically over the eastern Atlantic and enters the eddy from theeast.
(5) The eddy follows a cycle of growth and decay, increasing in both size and in-tensity to a maximum on the 22nd and 23rd and then slowly decreasing. As far as can betold, the degree of development is approximately unchanged from the 22nd to the 23rd,whereas the sea level pressure in the centre of the anticyclone has a well marked maxi-mum on the former day.
(6) The eddy moves with fairly constant velocity along a curved path, the successivepositions of the centre of the eddy being indicated by crosses in Fig. 5. Included in the

92 PAPERS IN PHYSICAL OCEANOGRAPHY AND METEOROLOGY
same figure for comparison are the corresponding positions (dots) of the centre of thesea level anticyclone. Discussion of the relation between the two paths will be given ina later chapter.
~..-- -- -
FIG. 5.-Paths of centre of eddy on 30SoA surface C+)and of surface anticyclone C.), May 18th-26th, 1936.
(7) The dry currents of polar origin all exhibit marked subsidence, whereas the moistcurrents in travelling to higher latitudes have a tendency to move horizontally.
iv. VERTICAL STRUCTURE OF THE FLOW PATTERNS
In order to study the vertical structure of the circulation, isentropic charts have beenprepared for potential temperatures 28So, 29So, 3000, 3100 and 3ISoA. Space does not per-
mit the reproduction of them all and, in fact, there is little need to do so as they bear amarked similarity to the 30So charts. In Plate xix are given those for 3100. In order tobe able to obtain a birds eye view of the development during the period all nine 310°maps have been included on one page. With the consequent reduction in size of the in-dividual charts it has not been possible to include complete analyses such as those madefor 30So. The relative humidities, clouds, heights, and isopleths of specific humidity haveall been omitted while the moist and dry tongues are indicated by full and open line ar-rows respectively.
For the 31So surface some idea of the circulation can be obtained from Plate xxii in
which arrows indicating the axes of the various currents have been superimposed oncharts of the isallobars at sooo m. The flow pattern on these charts are for the end ofeach 24 hour isallobaric period viz. for the eight days May 19th-26th.
i. The 300°, 3IOo and 3I5° Isentropic Charts
These are the most important series of charts as surfaces with lower values of poten-tial temperature intersect the ground while those with higher values are frequently abovethe top of the airplane and pilot balloon ascents.
VOL. VII, NO. i. FLUID MECHANICS APPLIED TO THE STUDY OF ATMOSPHERIC CIRCULATIONS 93
The outstanding feature of these and the 30So charts is the fact that the flow patternsat all four levels are essentially similar. Except in a few cases, discussed later, any currentappearing on one chart can be identified in much the same position on each of the otherthree. Both in size and in shape the main eddy is repeated in the successively higher isen-tropic surfaces with a slight tilt of the axis to the westward.
Rough overall averages for the heights of the lowest surface, 300°, and the highest,31So, are ISOO m and sooo m respectively, the mean pressure difference between the twobeing around 300 mb. As the similarity of flow pattern probably continues above and be-low the two extreme surfaces analyzed, we are safe in assuming that throughout the ninedays investigated at least half the atmospheric mass above the United States followed thesame general flow pattern. This conservatism with height is of great importance forroutine daily analyses as it means that, in order to give a fairly representative flow pat-tern, one map, provided a suitable value of potential temperature is chosen, shouldnormally be quite suffcient, although exceptions to this rule are known to occur.
May i8th. Mention has already been made in Chapter II of the discussion by Holz-man (1936) orthe vertical structure over the Appalachian area, and on the surface mapfor the 18th an upper level cold front has been included to conform with his analysis.According to Holzman the upper front marks the forward edge of a Ta air mass advanc-ing northeastward as a cold front on to Ts. Under both the Ts and Ta are shallow sur-face layers of modified polar air. The isentropic charts, however, show that there is littleevidence to warrant the inclusion of this cold front. Instead of having Ts aloft to' the eastof the front there is most decidedly a moist current, S, which appears to be practicallycontinuous right back to the Gulf of Mexico. The advance of a line of high level thunder-storms which Holzman associates with the upper air cold front may in part be the resultof the gradual dissipation through mixing of the narrow dry stratum (tongue 4) whichthe Detroit-Pensacola cross section shows to be present at about 30So between Mont-gomery and Nashvile and which prior to its dissipation, has been able to suppress thedevelopment of thunderstorms.
The above comment has been given not so much for the purpose of pointing out dis-agreement with Holzman's interpretation, as for the purpose of providing a convenientillustration of how misleading horizontal maps can be in representing atmospheric struc-ture and movements. Level for level comparisons show that at the latitude of Dayton theair to the west of the Appalachians is moister than that to the east, and it was presumablyon this evidence that the distinction between Ts to the east and Ta to the west was drawnyet the isentropic surfaces, sloping as they do downward to the east, indicate just theopposite to be the case, Lakehurst having higher specific humidity than Dayton for allvalues of potential temperature.
May I9th. The upper wind maps today show a very broad and deep south to south-west current over almost the entire western half of the country, and at first sight onewould perhaps expect this to be uniform in structure. It consists, however, of three dis-tinct tongues-two (3 and 6) moist and one (7) dry. It is 7 which is of most interest, as itis the only dry tongue discussed so far with a definite source region to the south, all theothers having been of polar origin. Being of tropical origin 7 can, therefore, be consideredas belonging to the true Ts classification, as distinct from the very much more numerouswarm dry currents which it has been the practice to call Ts but which Namias (1938 ap. 6) states are in reality currents of subsided polar air, and therefore could be more ra-tionally designated by the abbreviation Ps.

94 PAPERS IN PHYSICAL OCEANOGRAPHY AND METEOROLOGY
Subsequent to the 19th, 7 has a different history at different levels. On the evidenceafforded by the afternoon high level pilot balloon ascents which show a continuation ofsouthwesterly winds across Minnesota on the 21st, it has been retained as a main currenton the 31So map for the 22nd. At the 30So and 3100 levels, however, 7 never progresses
much beyond Cheyenne, where it is cut off by a second dry tongue, 8, ánd by 3, the latterof which is more dorrinan t in the lower levels than higher up.
May 20th. As there are no airplane stations between Spokane and San Diego there isno direct evidence to justify the introduction of a moist current, 8a, distinct from 8, thelatter of which is most definitely dry. Along the path of 8a there is admittedly very littlecloud, but nevertheless it has been classed as a moist tongue on the strength of its highspecific humidity at the 31So level when it reaches EI Paso on the 23rd and 24th. On boththese days the lapse rates below the 31So level at EI Paso are too stable to permit the
moisture to have been carried up by convection.May 2ISt. Tongue 9 at the 31So surface is placed north of Miami, but, must then be
very narrow, as the Miami wind is from west of north. This small width is scarcely con-sistent with the relatively large size which the current supposedly possesses on the 22nd,so in all probability it is supplemented by another southerly current over the Gulf ofMexico and to the west of Miami.
May 23rd. 2a marks the commencement of a new thrust of dry air southeastward andis considered as being associated with the short surface cold front running through Win-nipeg, Fargo and Cheyenne. The isentropic charts put 2a some distance ahead of thesurface cold front but this may be due to incorrect placing of the latter. The surface in-dications are so indefinite that the surface front could perhaps be made coincident withthe old cold front separating Npp from Tg, but it has been kept to the rear to give areasonable advance from its position on the 22nd.
Over the Middle Atlantic coast the arrows id today are not meant to indicate airtrajectories but merely the source of the dry air. This dry air which is attributed to theid of the 22nd extends well to the southwest, Shreveport having lower specific humiditiesthan can be accounted for by 10.
May 24fh. On both the 24th and 2Sth the flow patterns over Mexico, New Mexico andColorado change radically with elevation, the moist tongues of the 3000, 30So, and 3100
charts not being present at the31So surface. The difference shows up more clearly in theS p.m. upper air maps, on which the analysis has in this case been partly based, EI Pasohaving a change in wind direction from southeast to northwest between 2S00 and 3500m on both the 23rd and 24th.
May 25th. Over North Dakota today we have an apparent case of a warm currentundercutting a colder one. In the past 24 hours the 3000 surface at Fargo has decreased inheight from 3220 m to 800 m and the strong southwest winds today in this isentropicsheet indicate that the warm and moist tongue S has advanced into the region. At higherlevels there has been no corresponding change-the 30So surface at Fargo has droppedonly from 3820 m to 3S20 m while the wind at St. Paul is from the north. Over Fargothe cold current 2a still prevails at the 30So surface and we have the phenomenon of awarm curren t cutting in underneath a cold.
2. Circulatiçn Above the 3I5° Surface
So far it has been shown that the circulation is essentially the same everywhere be-tween the 3000 and 31So levels, i.e., in the layer lying between approximately the ISOO m

VOL. VII, NO. i. FLUID MECHANICS APPLIED TO THE STUDY OF ATMOSPHERIC CIRCULATIONS 95
and sooo m levels.- There still remains to be described the circulation above and belowthese levels. The airplane ascents, as a rule, do not reach much above the 31So surface,so it is impossible to construct isentropic charts for higher values of potential tempera-ture. If, however, as a first approximation we assume the high e-surfaces to be horizontal,a fair idea of the circulation in the upper atmosphere can be obtained from the upperwinds alone. It is well known that with increasing elevation there is a pronounced tend-ency for winds to become more westerly so it is not to be expected that the flow patternsin the upper levels should be as complex as those found in the lower. Small eddies, then,should become less distinct and less frequent with increasing height.
Too few of the S a.m. pilot balloon ascents attain suffcient height to indicate ade-quately the character of the circulation above the 31So level, so for the following discus-sion the more numerous high level ascents made at S p.m. have been used. On most daysthese suffce to give a fair indication of the general flow up to about 10 km.
The first result arising from an examination of the upper air maps is that the majorcurrents of the 31So surface continue up to the 10,000 m level, i.e., the circulation of theupper half of the troposphere is essentially the same as that of most of the lower half.(By "most of the lower half" is meant the layer between the 3000 and 31So surfaces-thechanges below the 3000 surface will be discussed in the next section.)
The second feature of the upper level circulation is the gradual growth upwards of themain anticyclonic eddy. On the 18th it is more pronounced in the 30So than in the 3100isentropic surface and is very much weakened in the 31So, which lies below SOOO m. Onthe 19th the anticyclonic eddy can be faintly detected over Arkansas at 6 km, and on the20th is still in about the same position. By the 21st there is a well developed anticycloniccirculation at 6 km with a weaker one probably reaching one or two kilometers higher.On the 22nd the eddy, now over Tennessee, exists up to 10 km but, as indicated by awind change at Nashville from northeast to northwest between 10 and II km, does notreach the latter leveL. Throughout almost the entire troposphere we now have a wellmarked closed circulation with strong easterly winds along its southern edge. On the23rd the eddy over the middle Atlantic States reaches at least to 12 km (SE wind atGreensboro at this level) and can even be detected from the directions of motion of thecirrus clouds. After the 23rd the high level observations are rather scanty over the areawhere the eddy would be expected to be present, but what observations there are suggestthat there is a progressive decrease in the elevation to which the anticyclonic circulationextends. It no longer reaches the cirrus level and by the 26th has probably lowered toabout 6 or 7 km.
3. Circulation Below the 3000 SurfaceFor much of the period and over most of the country the circulation pattern of the
30So surface extends to quite close to the ground. In the northeast part of the UnitedStates, however~ from the 19th to the 22nd, i.e., following the invasion of cold air in therear of the main cold front, this is not the case. It has been pointed out earlier that thetop of the Pc air mass coincides with the 2920 surface, and it is at this surface that thechange in flow pattern occurs. On the 20th at 28 SO there are strong northeast winds in
the surface Pc air over the Ohio area, whereas in the overlying Pp air at 29So, where the
flow is similar to that at 30So, the winds are northwest. Though not so marked as on the20th, there is still a distinct difference between the 28So and 29So circulations on the 21st,Boston having a northwest wind of force sin thePc air and west,force 10, in thePp air; while

96 PAPERS IN PHYSICAL OCEANOGRAPHY AND METEOROLOGY
at Detroit there is a change from east to west with increasing elevation.Summarizing the main results of this chapter we have:(i) Over most of the country the flow patterns are conservative from the gróund up
to high levels.
Examination of the maps of distributionof cloud and precipitation (not reproduced)shows that the connection between the flowpatterns and the areas of continuous precipi-tation is only slight. Most of the rain occurs.on the northern side of the moist tongues,
but so many factors other than the merepresence of moisture enter into determiningwhether there wil or will not be continuousprecipitation that the flow patterns bythemselves do not provide a very usefulguide.
The distribution of thunderstorms, how-ever, follow the flow patterns much more
closely than does that of continuous precipitation. If what occurs in this nine day periodcan be accepted as representative, the mere presence of a moist tongue, irrespective ofwhether or not it is flowing up-slope, is suffcient to give thunderstorms, while in dry
THUNDERSTORMS 2 lcim-23p,m, MAY 1936
THUNDERSTORMS 24a,m.-26 p,m, MAY 1936
AVERAGE NUMBER OF DAYS WITH THUNDERSTORMSMAY-JUNE 1904-1933
FIG. 6a.-Thunderstorms 21 a.m.-23 p.m. May 1936.FIG. 6b.-Thunderstorms 24 a.m.-26 p.m. May 1936.
FIG. 6c.-Average number of days with thunderstormsMay-June 19°4-1933. .
(2) This conservatism does not hold inthe northeastern states on the 20th and 21stwhen the fresh Pc air covers this area. In thiscase the flow patterns, and also the features
of the pressure field, change within the firsttwo kilometers, the anticyclonic circulationof the lower levels being replaced by a broadnorthwesterly current.
(3) The principal eddy has a well markedvariation in vertical extent. On the 18th ithas a depth of about 5 km, increasing to atleast 12 km by the 23rd and then apparentlygradually dying away. On the days of itsmaximum depth it has also its greatest hori-zontal dimensions and greatest intensity.
(4) In the free atmosphere currents tendto assume anticyclonic curvature. In moistcurrents in particular, however, this curva-ture becomes weaker with decreasing eleva-tion and, on approaching the ground, mayeven change to cyclonic.
V. RELATIONSHIP BETWEEN FLOW PATTERNSAND THE DISTRIBUTION OF
THUNDERSTORMS

VOL. VII, NO. i. FLUID MECHANICS APPLIED TO THE STUDY OF ATMOSPHERIC CIRCULATIONS 97
tongues they are entirely suppressed. How well these relationships hold is brought out inFig. 6a and 6b. From a scrutiny of the 8 a.m. and 8 p.m. synoptic maps each report of"thunderstorm in the past i 2 hours" has been noted and indicated by a dot. Fig. 6acovers the six synoptic maps May 21 a.m.-May 23 p.m., and Fig. 6b refers to the suc-ceeding six maps. The full and dashed lines Mand D represent the mean positions of themoist and dry tongues respectively of the 30So isentropic sheet for each of the three dayperiods. As the change in flow pattern from day to day is very gradual the variationsfrom the mean are quite small, and the positions of the moist and dry tongues can betaken as practically constant during each three day interval. There is, however, someoverlapping in the patterns in the case of the dry tongue running south-southwest fromMinnesota on Fig. 6b, the thunderstorms along its path being, in consequence, not dueto it but to moist tongues which are not permanent enough to show up in the mean.
Namias (1938 a) has already brought out bymeans of isentropic analysis the impor-tance of moist air for the development of thunderstorms, and the manner in which drytongues are able to suppress them. Namias' conclusions are strikingly brought out byFigs. 6a and 6b. In all six days not a single thunderstorm is reported over the southeast-ern portion of the country, an area which, as can be seen from Fig. 6c (adapted fromAlexander 1935) is normally the centre of maximum thunderstorm activity at this timeof the year. The three reports north of the Great Lakes in Fig. 6b apparently provide anexception to the rule of no thunderstorms along dry tongues. All three, however, are offron tal origin.
The high correlation found between the flow patterns and the distribution of thunder-storms suggests that the isentropic chart should be a useful tool in the forecasting of sum-mer precipitation.
VI. ANTICYCLOGENESIS AND THE TRANSITION OF THE ANTI-
CYCLONE FROM COLD TO WARM TYPE
I. Transition
In this particular instance there has been no such thing as a "transition" from onetype to the other. The anticyclone of the last half of the period is not a direct develop-ment from the cold polar anticyclone of the 18th, but is the result of the amalgamationof this with the initially quite unrelated warm type anticyclone which on the 18th waslocated over Texas. As shown by the tracks in Fig. S (p. 91) the two systems approachone another on the 18th, i 9th and 20th and then merge. The cold Canadian anticyclonecontinues at its original low level merely cutting in underneath its Texas companion.From the 21st onwards, then, the surface high pressure is the resultant of the contribu-tions of the two systems, and its centre does not necessarily coincide with that of either
component. With increasing age the shallow surface layer of air constituting the coldanticyclone spreads horizontally and so gives a steadily decreasing contribution to thesurface pressure.
Thus we see that the final warm anticyclone is directly descended from the Texasanticyclone and not from the Canadian. In the latter there has been no transition fromcold to warm type-all it has done has been to move southwards, temporarily intensify
the anticyclone from Texas, and then decay.The process in four successive stages is indicated in a schematic form in Fig. 7. Cis
the Canadian surface system and T that from Texas. The latter is arbitrarily assumed toremain constant in size and intensity, while the former increases in area, the relative con-
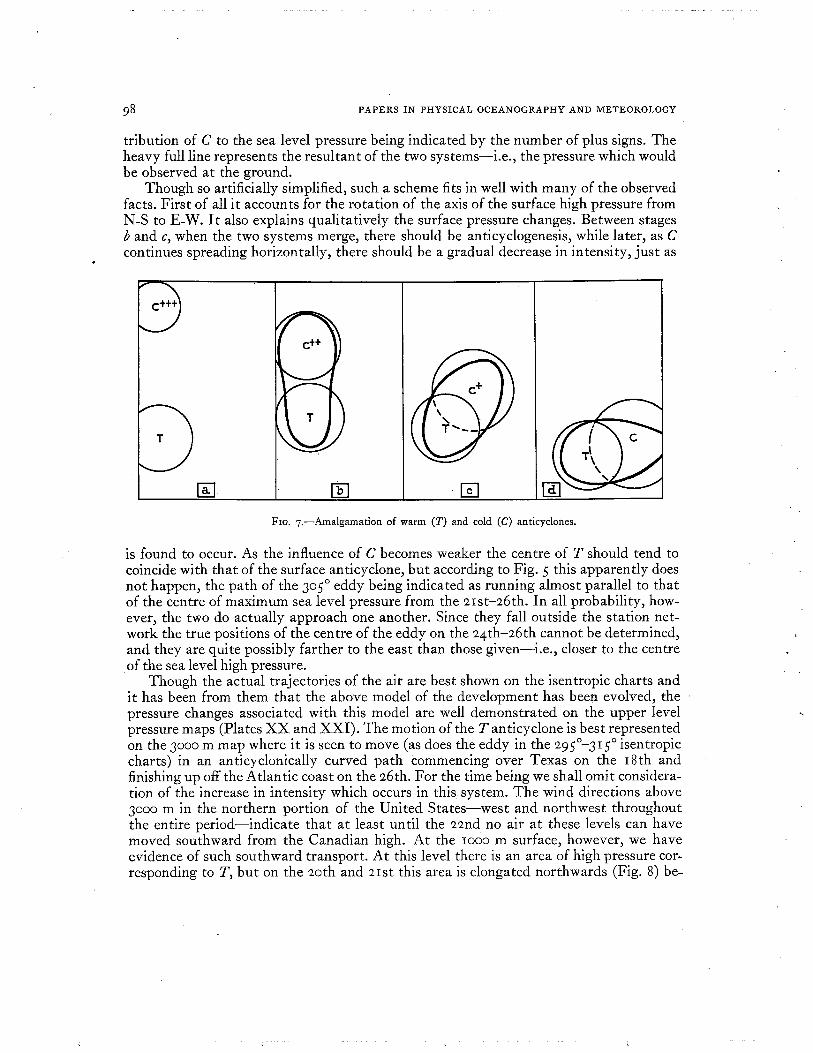
98 PAPERS IN PHYSICAL OCEANOGRAPHY AND METEOROLOGY
tribution of C to the sea level pressure being indicated by the number of plus signs. Theheavy full line represents the resultant of the two systems-i.e., the pressure which wouldbe observed at the ground.
Though so artificially simplified, such a scheme fits in well with many of the observedfacts. First of all it accounts for the rotation of the axis of the surface high pressure fromN-S to E-W. It also explains qualitatively the surface pressure changes. Between stagesband c, when the two systems merge, there should be anticyclogenesis, while later, as Ccontinues spreading horizontally, there should be a gradual decrease in intensity, just as
T
~, æ oFIG. 7.-Amalgamation of warm (T) and cold (C) anticyclones.
is found to occur. As the influence of C becomes weaker the centre of T should tend tocoincide with that of the surface anticyclone, but according to Fig. S this apparently doesnot happen, the path of the 30So eddy being indicated as running almost parallel to thatof the centre of maximum sea level pressure from the 21st-26th. In all probability, how-ever, the two do actually approach one another. Since they fall outside the station net-work the true positions of the centre of the eddy on the 24th-26th cannot be determined,and they are quite possibly farther to the east than those given-i.e., closer to the centreof the sea level high pressure.
Though the actual trajectories of the air are best shown on the isentropic charts andit has been from them that the above model of the development has been evolved, the
pressure changes associated with this model are well demonstrated on the upper levelpressure maps (Plates XX and XXI). The motion of the T anticyclone is best representedon the 3000 m map where it is seen to move (as does the eddy in the 29So-31So isentropiccharts) in an anticyclonically curved path commencing over Texas on the 18th andfinishing up off the Atlantic coast on the 26th. For the time being we shall omit considera-tion of the increase in intensity which occurs in this system. The wind directions above3000 m in the northern portion of the United States-west and northwest throughoutthe entire period-indicate that at least until the 22nd no air at these levels can have
moved southward from the Canadian high. At the 1000 m surface, however, we haveevidence of such southward transport. At this level there is an area of high pressure cor-responding to T, but on the 20th and 21st this area is elongated northwards (Fig. 8) be-

VOL. VII, NO.!. FLUID MECHANICS APPLIED TO THE STUDY OF ATMOSPHERIC CIRCULATIONS 99
cause of the top of the high pressure of the cold anticyclone. There is no such elongationat 3000 m. For the 1000 m level this corresponds to stage B of Fig. 7. At the ground thesame stage is represented, but not so well, by the highs over Kansas and just north ofWinnipeg on the 19th.
On page 78 it was shown how on the 19th the changes in wind at Bismarck fromeasterly in the surface layers to westerly above i soo m indicated that the main anti-cyclone was then of the true cold type with an area of low pressure above it. This systemdoes not move southwards en bloc; the cold surface layer separates from the upper airand, as indicated by the Pc cold front,moves rapidly southwards in a shallow
stratum only about 2 km. deep. The uppersystem, however, makes relatively littlesoutherly progress, the southern boundaryof the region of strong westerly winds above2000 m remaining in approximately thesame position on the 19th, 20th, and 2lst-
viz., roughly along a line running fromChicago to New York. It is this evidencethat has led to the conclusion that the
process is not that of a transition from coldlow level into a warm high level anticy-clone, but is a double process: the gradualdissipation of the low cold anticyclone, andits amalgamation with an already existingwarm anticyclone.
Up till the 21st, then, there have beenthree main currents associated with the twoanticyclones. These are: (i) The varioussoutherly warm currents from low lati-tudes, (2) The strong westerlies to thenorth, and (3) The shallow northerly cur-rent of Pc air. The T anticyclone has beenmaintained by currents in the first groupplus offshoots (tongues ib and id) from thesouthern side of the westerlies, these off-shoots having been characterized by marked subsidence. The northerly current hasbrought high pressure with it but is rapidly becoming of less importance.
In stating that the Canadian anticyclone remains a low level system throughout its
whole history, it seems that no account is being taken of the important polar current,which is represented by tongue 10 on the isentropic charts, and which by the time itenters into the anticyclonic eddy is most decidedly not confined to a shallow layer. Theair in 10, however, is not considered to be a part of that which originally comprised theCanadian anticyclone and so does not enter into the question of the transition. Thoughthere are no upper air observations to prove it, this current probably is of maritime ori-gin, traveling from the northern Atlantic round the deep low pressure centre, which onthe 21st is located over Labrador. When 10 enters the eddy over the southeastern portionof the United States any subsidence which may have been taking place in it earlier has
¡,
~'~'-.n~,s,ø.___~_ 900~ . ,. -
'lq
FIG. 8.-1000 m isobars (millbars) + indicates positionof the center of the surface anticyclone.

100 PAPERS IN PHYSICAL OCEANOGRAPHY AND METEOROLOGY
ceased, and from the 23rd to the 26th the potential temperature surfaces remain almostunchanged in height. This is in marked contrast to the rapid subsidence in tongues iband J d.
2. Anticyclogenesis
The anticyclogenesis occurs when the two anticyclones, the high level one from thesouth and the low level one from the north, meet. To a large extent, then, it is the resultof the advection of air masses of different temperatures. Pure thermal.cadvective proces-ses, however, do not appear suffcient to explain all the pressure changes which occur.Consider, for instance, the pressure changes at the sooo m level in the twenty-four hourperiod from the 20th-21st, the first of the two days on which the most marked anticyclo-genesis occurred at the ground. These changes are shown in Plate XXII. The heavy linesare the flow patterns of the 31So isentropic surface at the close of each 24 hour interval.
Over the Great Lakes area there have been pressure rises at sooo m of about 8 mb. Sincethe pressure at this level (S so mb) is roughly half of the sea level pressure, the change inweight of the layer originally above the sooo m level amounts to almost 16 mb. The up-per winds indicate that a southwesterly current at least 9-10 km in depth, of subtropicalorigin, has invaded the area, replacing the original polar air from the northwest. Palménhas shown that the maximum temperature difference between maritime polar and sub-tropical currents over Europe in winter occurs between 4-7 km, so it is reasonable toassume that in the present instance the southwesterly current is the warmer. This meansthat the layer S-IO km gives a negative contribution to the change of mass above thesooo m level, necessitating an increase above the 10 km level of at least 20 mb. It isputting too great a burden on advection above 10 km to ask it to account for this entireincrease. If only advection acts, and no piling up of air, the increase of 20 mb requires atemperature decrease of about ISoA throughout the stratosphere. This in turn, for anormal temperature distribution, requires a transport of air from south to north throughfifteen degrees of latitude at the very least. The cirrus observations, however, precludethe possibility of such a large latitudinal displacement, so all the pressure change cannotbe attributed to advection. A similar situation holds also on the 2lst-22nd over thenortheastern portion of the country.
Some process or processes other than advection must in these two cases have been
operating to bring about the piling up of air. That on the 20th-21st may be due to thebodily lifting of the whole upper layers by the Pc wedge. As, however, the Pc does not in-crease in depth after the 21st this cannot account for the large area of positive pressuretendencies at sooo m in the eastern United States on the 22nd. So even after taking intoaccount advection and bodily uplift, there is still a residual increase of mass. There must,then, have been very appreciable convergence of air into this area. This can have takenplace either above or below the sooo m level, the effect of the latter being to push up theoverlying air and so to increase the pressure at a fixed leveL.
In the past most emphasis has been placed on advection as the source of pressurechanges in the free atmosphere, the reason being that there has been no established mech-anism to cause convergence or divergence. These two phenomena require non-gradientwinds and until recently there was no force known which could bring about departurefrom gradient flow in the layers above those affected by ground friction. Rossby, howeverhas demonstrated that there is such a force present, viz: the shearing stress resultingfrom large scale horizontal mixing, and that it causes a banking to the right hand side of

VOL. VII, NO. 1. FLUID MECHANICS APPLIED TO THE STUDY OF ATMOSPHERIC CIRCULATIONS 101
all northern hemisphere currents. In the case in question such banking very nicely ex-plains the residual mass increase above sooo m. As shown by the flow patterns and winds,the area of large positive isallobars, in which advection and lifting by Pc cannot accountfor all the pressure rise, is located between and to the right of two broad and deep cur-rents-the southwesterly to the west and the northwesterly to the east.
The anticyclogenesis at the ground is thus the net result of two quite separate proc-esses. These are: (i) Advection, causing the amalgamation of the Canadian and Texasan ticyclones.
(2) The banking along the right hand side of the currents taking part in the circula-tion.
Banking is a continuous process, so anticyclogenesis (and cyclogenesis, its converseon the left side of all currents) must be taking place at all times in the atmosphere. On theother hand, the amalgamation of the two anticyclones may largely be a random effectresulting from the intersection of their trajectories.
Without more extensive aerological data-e.g., meteorograph and pilot balloon obser-vations from higher levels than those available-it is impossible to tell how great is eacheffect, but the indications are that the banking is by no means negligible.
If the sooo m isallobaric maps for the whole period are examined it is seen that in themajority of cases the currents have areas of rising pressure to their right and of fallingto their left. This association is doubtless partly due to advection but, if that were theonly factor, the axes of the currents would tend to coincide with the axes of maximumpressure change, whereas there is a pronounced tendency for the current axes to coincidewi th the isopleths of zero pressure change.
Though considered to be fairly conclusive the above evidence for banking due tolateral mixing is very indirect. There is, however, a direct method of detecting conver-gence by means of isentropic surfaces. If all motion between any two isentropic sheets isadiabatic the total mass of air between the two should remain constant. Lateral mixingcauses a redistribution of this mass, the areas of convergence being areas of increasedmass, or bulging apart of the isentropic sheets. From an examination of the time andspace variations of the mass between two surfaces, then, it should be possible to detectthe presence or absence of convergence. ,
In Plate XXIII are given the pressure-differences in millibars between the 29So and
3100 surfaces on the 19th, 20th, and 21st, and between the 3ooo-3lSo surfaces on theremaining days, the change in layer being necessary to avoid getting above the top of theairplane ascents in the former set, and getting too close to the ground in the latter. Ininterpreting these charts two things need to be kept in mind: (a) Non-adiabatic proc-esses can disturb the relative position of the upper and lower surfaces. (b) In most of thetroposphere the pressure difference for any particular layer decreases to the north. This
is a result of the relative constancy of lapse rates throughout the atmosphere which tendsto make the distance between layers constant, and, as the layers slope upwards to thenorth, the pressure-difference there must be less.
On each day the mean position of the centre of the anticyclonic eddy on the 30So and3100 isentropic charts is marked by a cross. Throughout the whole period the eddycentre is associated with an area of maximum pressure-difference-a very important re-sult indicating that convergence takes place in the middle layers of an anticyclone. Theeddy centre and the maximum pressure-difference should not necessarily coincide, thelatter being probably displaced towards the currents of subtropical origin. If the proc-

102 PAPERS IN PHYSICAL OCEANOGRAPHY AND METEOROLOGY
esses were truly adiabatic, the convergence should cause a progressive increase in thepressure-difference in the centre of the anticyclone, but no such increase is apparent.
This does not imply that convergence i1, not occurring, but results from the maskinginfluence of divergence caused by ground friction in the lowest portion of the isentropicstratum. By choosing a higher-valued potential temperature surface for the lower bound-ary of the stratum this diffculty could be overcome. This was tried but the layer wasthereby reduced from a potential temperature interval of ISo to one of 10°, and it wasfound that non-adiabatic effects then destroyed the simplicity of the picture.
As there is no reason to suppose that in going from the 3000-31 SO layer to higher layers
there should be any change of effect, it is considered very probable that convergenceoccurs right to the top of an anticyclone-with, of course, a shallow layer of divergence
close to the ground. In layers well removed from surface turbulence we should expectthen to get a steady increase with time in the pressure-difference in an area with anticy-
clonic circulation. The result of this should be the growth upwards of such a circulation,just as was found to occur in the situation investigated and is shown by the anticyclo-genesis which occurs in the centres of high pressure on the 3000 m and sooo m maps, andwhich cannot be attributed to advection of cold polar air.
This conception of convergence and divergence resulting from isentropic mixing isof the greatest significance as it affords the possibility of transferring to the tropospheresome of the control of the atmospheric processes usually attributed to motion in thestratosphere. It is generally accepted that the pressure distribution at the tropopausedetermines to a large extent that at the ground. According to the older thermal-advectivetheories, the pressure at the tropopause is determined in turn by the advection in thestratosphere. This advection then has been considered by many to be the "primary"controlling factor for circulation in the troposphere, the resultant circulation in whichhas been termed "secondary." It is obvious, however, that the effects of convergence anddivergence in the troposphere must be reflected in the overlying atmosphere, and suchconvergence and divergence must therefore exercise a measure of control over the pres-sure at the tropopause. In this respect the motion of the air in the troposphere, which
causes the convergence and divergence, is the "primary" controlling factor. Thoughadvection in the stratosphere admittedly is of importance, it seems only natural to expectthat the troposphere, which contains most of the mass of the atmsophere should be ofgreater importance in determining the atmospheric motion.
VII. SUMMARY
This investigation has been a practical study of the conditions existing in the freeair during a case of marked intensification of an anticyclone, the data used being theextremely extensive pilot balloon and airplane meteorograph records available over theUnited States of America. The study covers a period of nine days, May 18th-26th, 1936,during which an anticyclone moved from Northern Canada in a southeasterly directionto south of Bermuda. On two of the days there was rapid anticyclogenesis. At the be-ginning of the period the Canadian anticyclone was definitely of the "cold" type whilethat over Bermuda at the end of the period was of the "warm" type.
The chief conclusions are:(I) It has been demonstrated that over a period of nine days it has been possible to
carry out a systematic and consistent analysis of upper air conditions by means of isen-tropic charts.

VOL. VII, NO. 1. FLUID MECHANICS APPLIED TO THE STUDY OF ATMOSPHERIC CIRCULATIONS 103
(2) The flow patterns on the isentropic charts for a series of values of potential tem-perature indicate that in the area considered the circulation was substantially the sameat all levels throughout the lower half of the atmosphere.
(3) The major feature of the flow patterns is a large slowly moving anticyclonic eddywhich
(a) consisted of two main currents, one moist and one dry.(b) moved during the period in an anticyclonically curved path from Texas over
Ohio to east of Florida.(c) and passed through a definite cycle of growth and decay both in horizontal and
in vertical extent.(4) Though the sea level pressure changes suggested a gradual transition from the
cold anticyclone of the initial stages to the warm anticyclone of the final stages thiswas found not to have occurred, the final warm system being directly descended froman older high level anticyclone which was present over Texas at the beginning of theperiod. The cold Canadian anticyclone which began on the 18th as a low level surfacesystem remained as such merely progressively spreading out laterally and dissipating asit moved southwards. There is no observational evidence to support the view that it grewupwards to form the final warm anticyclone and it seems probable that the frequentlyreferred to "transition from cold to warm type anticyclone" is a very rare meteorologicalphenomenon.
(s) The anticyclogenesis was the outcome of two distinct causes:-(a) The coinci-dence and amalgamation of two separate migratory anticyclones, the one a cold lowlevel system from Northern Canada and the other a warm high level system originatingover Texas. (b) Convergence of air into and piling up of air over the area covered by theanticyclone.
(6) It has been shown that the convergence of "dynamic anticyclogenesis" can beadequately explained on the basis of Rossby's theory of the banking of air on the righthand side of all northern hemisphere air currents having wind velocities in excess ofthe gradient wind value.
(7) A relationship has been found between the flow patterns of the isentropic chartsand the distribution of non-frontal thunderstorms the latter being quite suppressed
along the dry tongues.
VIII. PLATES
For an explanation of the symbols used in the Plates, see B iV, page sl.

0 0 ~
~ ¡; ~ ¡; - N 0 ..~
trl" o; it ~iä
Eo
,~
o:
'"'"
..,0 ~
p.
~zz
0~
, '"0.~5 ;z~~~~
~
~'"~
N ~~
0 '"gq
~ ~'" ~ N
Z
l-
g
i
i
i0z
~z~
g~~ I"'i,~¡;
eli:~:E
:§r:

SIM
ME
RS
DE
TR
OIT
DA
YT
ON
3051 31g
\
NA
SHV
ILL
E t'
NT
GO
ME
RY
PE
NSA
CO
LA
lI,a G,o
31ti 1 32.0
4- 32.0
5 3'5
310
7 B')
~~ 305
,,) 02 ,~- i'.r
I5J
,. J . '"
PLA
TE
II

~
,I'iJJJ","-F,
!~i~
w~~
~0~
~'"
z /~/t ;;~ /0r / /Õ /~ / /w0 / I
0 ";; g
o
~¡;
- .~ I..
---~,E-0(,.p.
rli:~:s:s
00

SIM
ME
RS
o. ~ 0,4
V OE
TFl
lí
315~
.:!ll-
¥
",31
0
PLATE iv

FARGO315 ~L~OKLAHOMA SAN ANTONIO
~a., '-
OMAHA
.A~'o
AAAAA
13:~_ 14 ".
15
/'
EL PASO SAN ANTNIO9 4.
SHREVEPORT
3I!i_L-_
r~l.(.
)~
310 --~-
305 ..~
-_/
SIMMERS
DETROIT DAvmN5 d,
NASHVILLE MONTGOMERV C,ENSACOLA
I 2--
r
310
4
____;15
665
Dgio783058
iio~10II
-l1°l'3
-~"ol'Æ: 15
¡c~if
2305
3
NASHVILLE WASHINGTON LAKEHURST NEW'rRK BOSTONG 4. 5 (i. 31.5 310
,A// ///
I 305I/~--------- ~l.
300
260
PLATE V

\ 487,28-; e 1;
'--
--,0
~9CHEYENNE
315 -OMAHA ST LOUIS DAYTON
3300..
DETROIT DAYTN NASHVILLE MONTGOMERY PE NSACOLA
'"2
3- 315
4
5~ 310
54
D4
J305'~O"12P13295
M FrEL PASO SAN ANTONIO SHREVEPORT NASHVILLE WASHINGTON LAKEHURST NEW YORK BOS1ONCD 0.. 5 3153
13102
30534
4""
-- 295
----_II 290285
5
SIMMERS PLATE VI
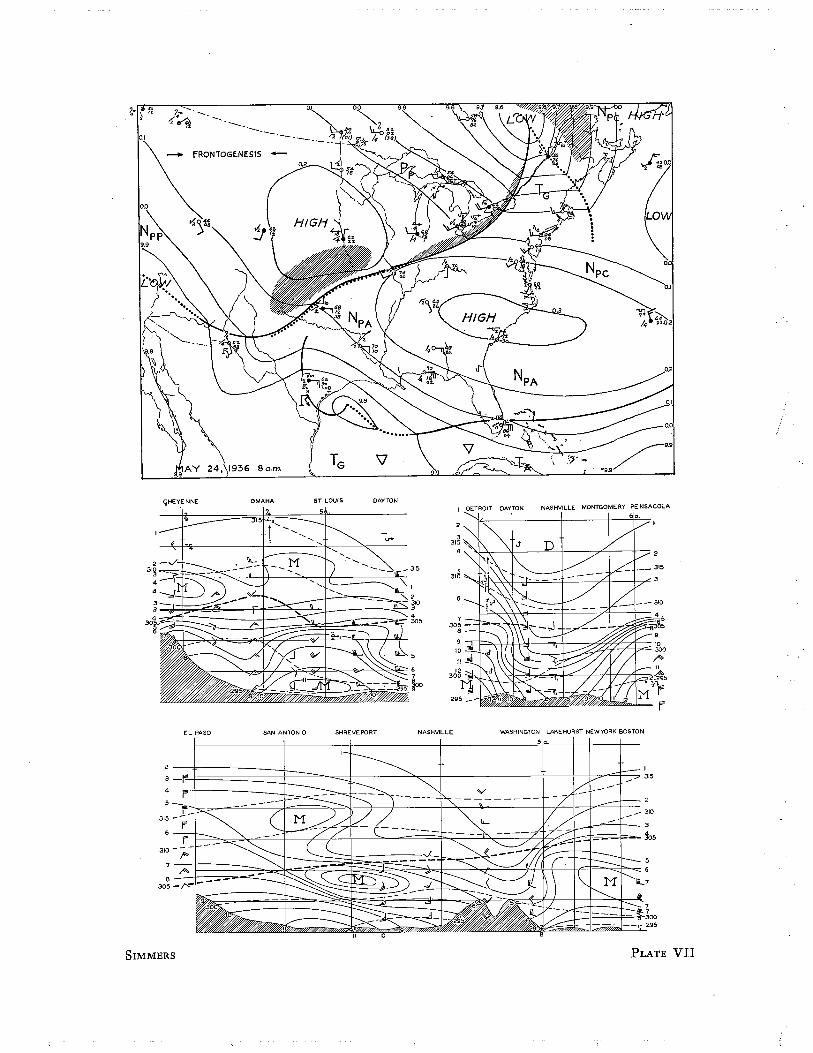
q.l¡~ b ~-...1'~ --__ ---
"' ~/4 1..02
TG \7
ÇHEYE NNE OMAHA ST LOUIS
50.,
DAYTONI DETROIT DAYTON NASHVILLE MONTGOMERY PE NSACOLA
6.,
II l'5
310 ..
315 Li
1..-..-. ,. ,7
305 -8
910
EL PASO SAN ANTONIO SHREVEPORT NASHVILLE WASHINGTON LAKEHURST NEW YORK BOSTON
5 a.,
,.
I__.. 3153 f'
4-l5l315 --
F
r310 --¡-
7
__ 310
3
j05
30~ -/" ----
56
Il 7
7
i-~OO_ 295
SIMMERS PLATE VII

0.0
)0.1
MAY
CHEYENNE OMAHA ST LOUIS
So.,DAYTON
I
3
315..I "
--c;///~-- ----
431S
EL PASO SAN ANTONIO SHREVEPORT NASHVILLE WASHINGTON LAKEHURST NEW'lRK BOSTONI
23
315
322
3153 -I'4
I'5
31~6 E
6 A
---
.A
-i
.. 305300i
SIMMERS PLATE vrn

:? S4~ C;~.7
0,0
0.,\\ 7Z/, 04--,,
0,1
MAY
OMAHA DAYTON
DETROIT DAYTON
2
3
EL PASO SAN ANTONIO
80.,SHREVEPORT
80.. I3
/ 310//4
3155
10
2295
3-
4
.-... 290
~- f 5__ 265
PLATE ixSIMMERS

oo
ll"00
-i0/'/'/'
e = 305018, 1936 A.M.MAY
e = 305019, 1936 A.M.MAY
SIMMERS XIPLATES X AND

4
&
CO
.9 M
e ,. 3050"0, 1936 A. M.MAY Co
5, G7
89
e = 305036 A.M.MAY' 2.1. 19
SIMMERS XII AND XIIIPLATES

e - 305022. 1936 A MMAY
e = 305023. 1936 A. M.MAY
SIMMERSxiv AND xvPLATES
"
iI;'"ï

e = 3050MAY 24. 1936 A.M.
g 0o Sf"I ., ooo..
e = 3050MAY 25,1936 A.M
SIMMERS PLATES XVI AND XVII

e = 3050MAY 26,1936 A.M.
SIMMERSPLATE XVIII

~-~~b~..
0-
¡o!ii
00i:~::::..rr

++
+
SIMMERS PLATES XX AND XXI

.~--.~-._-
250
SIMMERS PLATES"'XXII AND XXIII

SIMMERS PLATE xxiv

REFERENCESALEXANDER, W. H.
1935 The Distribution of Thunderstorms in the United States, 1904-1933. MonthlyWeather Review, VoL. 63, No.5.
BERGERON, T.1937 On the Physics of Fronts. Bulletin of the American Meteorological Society, Vol.
18, NO.9.BJERKNES, J.
1932 Exploration de quelques perturbations atmosphériques à I'aide de sondagesrapprochés dans Ie temps. Geojysiske Publikasjoner, Vol. ix, NO.9.
1937 Theorie der aussertropischen Zyklonenbildung. Meteorologische Zeitschrift, Heft12, 462-466.
BJERKNES, J. and GIBLETT, M.A.
1924 An Analysis of a Retrograde Depression in the Eastern United States of Amer-ica. Monthly Weather Review, Vol. 25, No. i i.
BJERKNES, J. and PALMÉN, E.
1938 Investigations of Selected European Cyclones by Means of Serial Ascents.Geojysiske Publikasjoner, Vol. xii, No.2.
BJERKNES, V. and COLLABORATORS1933 Physikalische Hydrodynamik. J. Springer, Berlin.
BOWIÉ, E. H. and WEIGHTMAN, R. H.1917 Types of Anticyclones of the United States and their Movements. Monthly
Weather Review, Supplement 4.BROOKS, C. E. P.
1932 The Origin of Anticyclones. ß¿uarterly Journal of the Royal Meteorological So-ciety, Vol. 58, No. 247.
BRUNT, D.1934 Physical and Dynamical Meteorology. Cambridge University Press, London.
BYERS, H. R.
1938 On the Thermodynamic Interpretation of Isentropic Charts. Monthly WeatherReview, Vol. 66, NO.3.
CLAYTON, H. H.1923 World Weather. MacMillan, New York. (p. 132).
DEFANT, A.1921 Die Zirkulation der Atmosphäre in den gemässigten Breiten. Geografiska An-
naler, Årgång ill, p. 209. '
DOUGLAS, C. K. M.1935 Some Facts and Theories about the Upper Atmosphere. ß¿uarterly Journal oj
the Royal Meteorological Society, Vol. 61, p. 53-70.
EMMONS, G.1935 Atmospheric Structure over the Southern United States, December 30-31,
1927, Determined with the Aid of Sounding Balloon Observations. Massachu-setts Institute of Technology Meteorological Course, Professional Notes, NO.9.
FUJIWHARA, S.1925 On the Growth and Decay of Vortical Systems. ß¿uarterly Journal oj the Royal
Meteorological S?ciety, Vol. 49, p. 75-118.
122

VOL. VII, NO. i. FLUID MECHANICS APPLIED TO THE STUDY OF ATMOSPHERIC CIRCULATIONS 123
Fu jIWHARA, S.1931 Short Note on the Behavior of Two Vortices. Proceedings oj the Physico-Mathe-
matical Society oj Japan, Series 3, Vol. 13, NO.3.1937 On the Quick Development of Cyclones by Amalgamation. Geophysical Maga-
zine, Tokyo, Vol. XI, No. i.GRIMMINGER, G.
1938 The Intensity of Lateral Mixing in the Atmosphere as Determined from Isen-tropic Charts. Transactions oj the American Geophysiçal Union, NinettenthAnnual Meeting.
HAURWITZ, B. and TURNBULL, W. E.1938 Relations between Interdiurnal Pressure and Temperature Variations in Tro-
posphere and Stratosphere over North America. Canadian Meteorological Mem-oirs, Vol. I, NO.3. -
HOLZMAN, B.1936 Synoptic Determination and Forecasting Significance of Cold Fronts Aloft.
Monthly Weather Review, Vol. 64, No. 12.JEFFREYS, H.
1926 On the Dynamics of Geostrophic Winds. !Juarterly Journal oj the Royal Meteoro-logical Society, Vol. 52, p. 85.VON KÁRMÁN, TH. .
1930 Mechanische Ähnlichkeit und Turbulenz. Nachrichten von der Gesellschajt derWissenschajten zu Göttingen, Mathematisch-Physikalische Klasse, Heft i, p. 58.
M ÖLLER, F.1935 Die Wärmequellen in der freien Atmosphäre. Meteorologische Zeitschrift, Vol.
52, p. 408.MONTGOMERY, R. B.
1937 A Suggested Method for Representing Gradient Flow in Isentropic Surfaces.Bulletin oj the American Meteorological Society, Vol. 18, Nos. 6-7.
1938 Circulation in Upper Layers of Southern North Atlantic Deduced with Use ofIsentropic Analysis. Papers in Physical Oceanography and Meteorology, Vol.
VI, No. i.NAMIAS, J.
1934 Subsidence within the Atmosphere. Harvard Meteorological Studies, No.2.1936 Structure and Maintenance of Dry-type Moisture Discontinuities not Devel-
oped by Subsidence. Monthly Weather Review, Vol. 64, No. i i.1938a Thunderstorm Forecasting with the Aid of Isentropic Charts. Bulletin oj the
American Meteorological Society, Vol. 19, No. i.1938b Forecasting Significance of Anticyclonic Eddies on Isentropic Surfaces. Trans-
actions oj the American Geophysical Union, Nineteenth Annual Meeting.OSMUN, J. W. W.
1937 Flow Patterns in Selected Synoptic Situations. Meteorological Course, Master'sThesis, Massachusetts Institute of Technology. (not published)
PALMÉN, E.1933 Aerologisçhe Untersuchungen der atmosphärischen Störungen. Societas Scien-
tiarum Fennica Commentationes Physico-Mathematicae, VII, 6. Mitteilungendes meteorologischeri Instituts der Universität Helsingfors no. 25.

124 PAPERS IN PHYSICAL OCEANOGRAPHY AND METEOROLOGY
1935 Registrierballonaufstiege in einer tiefen Zyklone. Societas Scientiarum Fennica,Commentationes Physico-Mathematicae VIII, 3. Mitteilungen des Meteoro-logischen Instituts der Universitat Helsingfors. No. 26.
PARR, A. E.
1936 On the Probable Relationship between the Vertical Stability and Lateral Mix-ing Processes. Journal du Conseil, Vol. XI, NO.3.
1938 Isopycnic Analysis of Current Flow by Means of Identifying Properties.Sears Foundation Journal of Marine Research, Vol. I, NO.2.
PEKERIS, C. L.1938 Wave-Perturbations in a Homogeneous Current. Transactions of the American
Geophysical Union, Nineteenth Annual Meeting.REED, T. R.
1933 The North American High-level Anticyclone. Monthly Weather Review, Vol.61, No. II.
RICHARDSON, L. F. and PROCTOR, D.
1925 Diffusion over Distances Ranging from 3 km to 86 km. Memoirs oj the RoyalMeteorological Society, Vol. I, No. I.
ROSSBY, c.-G.
1932 Thermodynamics Applied to Air Mass Analysis. Massachusetts Institute ojTechnology Meteorological Papers, Vol. I, NO.3.
1936 Dynamics of Steady Ocean Currents in the Light of Experimental Fluid Me-chanics. Papers in Physical Oceanography and Meteorology, Massachusetts Insti-
tute of Technology and Woods Hole Oceanographic Institution, Vol. V, No. I.1937a Temperature Changes in the Stratosphere Resulting from Shrinking and
Stretching. Beitrage zur Physik der jreien Atmosphäre, Vol. 24, pp. 53-59.1937b On the Mutual Adjustment of Pressure and Velocity Distributions in Certainand Simple Current Systems, I and II. Sears Foundarion Journal of Marine Re-
1938a search, Vol. I, Nos. I and 3.1938b Solenoidal Circulations Resulting from Lateral Mixing. Transactions oj the
American Geophysical Union, Nineteenth Annual Meeting.
1938c On the Role of Isentropic Mixing in the General Circulation of the Atmosphere.Proceedings oj the Fifth International Congress oj Applied Mechanics. (in press)
ROSSBY, c.-G. and COLLABORATORS1937a Aerological Evidence of Large Scale Mixing in the Atmosphere. Transactions
oj the American Geophysical Union, 18th Annual Meeting, Pt. I, pp. 130-136.1937b Isentropic Analysis. Bulletin oj the American Meteorological Society, June-July,
Vol. 18, pp. 201-209.SHAW, SIR NAPIER
1933 Manual oj Mèteorology. Vol. 3, The Physical Processes of Weather, CambridgeUniversity Press.
SPILHAUS, A. F.
1935 The Transient Condition of the Human Hair Hygrometric Element. Massa-chusetts Institute oj Technology Meteorological Course, Projessional Notes No.8.
1937 Note on the Flow of Streams in a Rotating System. Sears Foundation Journalof Marine Research, Vol. I, No. I.
STÜVE, G.1937 Handbuch der Geophysik. Band 9, Lief. 2,141, pp. 506-515, Borntraeger, Berlin.

VOL. VII, NO. i. FLUID MECHANICS APPLIED TO THE STUDY OF ATMOSPHERIC CIRCULATIONS 125
SVERDRUP, H. U.
1917 Der nordatlantische Pass at, Verö.entlichen des Geophysikalischen Instituts derUniversitat Leipzig, Zweite Serie, Band 2, No. i.
TAYLOR, G. i.1916 Skin Friction of the Wind on the Earth's Surface. Proceedings oj the Royal
Society, Series A, Vol. 92, No. A637.TOLLMIEN, W.
1926 Berechnung turbulenter Ausbreitungsvorgänge. Zeitschrift jür angewandteMathematik und Mechanik, Band 6, p. 468.
WEXLER, H.1936 Cooling in the Lower Atmosphere and the Structure of Polar Continental Air.
Monthly Weather Review, Vol. 64, NO.4.1937 Formation of Polar Anticyclones. Monthly Weather Review, Vol. 65, No.6.
WEXLER, H. and NAMIAS, J.1938 Mean Monthly Isentropic Charts and their Relation to Departures of Summer
RainfalL. Transactions oj the American Geophysical Union, 19th Annual Meet-mg.
WILLETT, H. C.
1928 Fog and Haze, their Causes, Distribution, and Forecasting. Monthly WeatherReview, Vol. 56, No. I i.
1933 American Air Mass Properties. Papers in Physical Oceanography and Meteorol-ogy, Massachusetts Institute of Technology and Woods Hole OceanographicInstitution, Vol. 2, No.2.
1935 Discussion and IIustration of Problems Suggested by the Analysis of Atmos-pheric Cross-Sections. Papers in Physical Oceanography and Meteorology, Mas-sachusetts Institute of Technology and Woods Hole Oceanographic Institution,Vol. IV, No.2.